
Estimate e-Golf Battery State Using Diagnostic Data and a Digital Twin


Institute of Automotive Technology, Technical University of Munich, 85748 Garching, Germany
*
Author to whom correspondence should be addressed.
Batteries 2021, 7(1), 15; https://0-doi-org.brum.beds.ac.uk/10.3390/batteries7010015
Submission received: 11 January 2021
/
Revised: 28 January 2021
/
Accepted: 29 January 2021
/
Published: 24 February 2021
Abstract
:Li-ion battery packs are the heart of modern electric vehicles. Due to their perishable nature, it is crucial to supervise them closely. In addition to on-board supervision over safety and range, insights into the battery’s degradation are also becoming increasingly important, not only for the vehicle manufacturers but also for vehicle users. The concept of digital twins has already emerged on the field of automotive technology, and can also help to digitalize the vehicle’s battery. In this work, we set up a data pipeline and digital battery twin to track the battery state, including State of charge (SOC) and State of Health (SOH). To achieve this goal, we reverse-engineer the diagnostics interface of a 2014 e-Golf to query for UDS messages containing both battery pack and cell-individual data. An OBD logger records the data with edge-processing capability. Pushing this data into the cloud twin system using IoT-technology, we can fit battery models to the data and infer for example, cell individual internal resistance from them. We find that the resistances of the cells differ by a magnitude of two. Furthermore, we propose an architecture for the battery twin in which the twin fleet shares resources like models by encapsulating them in Docker containers run on a cloud stack. By using web technology, we present the analyzed results on a web interface.
1. Introduction
Currently, the automotive industry is undergoing what may be the greatest change since its inception. More and more manufacturers nowadays offer electrically powered vehicles. One reason for this is the increased requirements regarding CO2 emissions. A regulation by the European Parliament and Council in 2019 reduced the limit for CO2 emissions by a vehicle fleet to 95 g/km [1], and this trend will go on. To comply with legislation, it is even more important for original equipment manufacturers (OEM) to produce emission-free or low-emission vehicles, such as battery electric vehicle (BEV) or hybrid electric vehicle (HEV).
The high-voltage battery is one of the most important components in electric vehicles [2], but also the most expensive one, making up approximately 35% of total costs of the vehicle. Therefore, a long battery life is desirable, which depends, among other aspects, on the operating strategy selected [3]. The use of an optimal strategy requires knowledge of the current battery state, which is determined depending on numerous different factors. Battery state estimation is therefore an important research subject today. This is important in order to preserve the battery for as long as possible, but also for vehicle safety, residual value, second life use of the battery in for example, energy storage and for early fault detection.
This work deals with the investigation of battery state estimation in electric vehicles.
Various methods can already be found in the literature with certain advantages and disadvantages depending on the application. The following literature overview of state estimation aims to find a suitable method for determining the battery state that can be applied during the real use of the vehicle. Certain limitations regarding the data quality coming from the on-board diagnosis (OBD) interface have to be taken into account.
2. Technical Background
This section gives an overview of methods to determine states of battery systems. A brief explanation is also given of the setup of the e-Golf test vehicle and technical concepts used in this work as the OBD interface and digital twins.
2.1. Methods of Battery State Estimation
This chapter presents different methods and approaches to determine the state of lithium-ion batteries. Therefore, the common methods for state of charge (SOC) and state of health (SOH) are categorized and their procedures described.
2.1.1. State of Charge
Li et al. [4] divide the methods commonly used to determine the SOC into three basic subcategories. The methods include circuit principle, filter methods and data-driven methods. The open circuit voltage (OCV) method uses the relationship between the open circuit voltage and the SOC [4,5]. To determination the current SOC, stationary behavior must be given, which is why this method is not suitable for real-time applications in vehicles [4].
The internal resistance method establishes a correlation between the SOC and the measurement of the internal resistance of the battery [4]. Highly accurate measuring instruments are needed for the SOC estimation of the lithium-ion battery because the alternating current (AC) internal resistance changes considerably with temperature and the method is highly susceptible to failure. Therefore, this method is not suitable for online estimations of the SOC [4].
The ampere-counting method integrates current over time [6]. A precise knowledge of the initial SOC and an accurate measurement of the current is important to prevent errors from accumulating. Online measurements can achieve high accuracy and good adaptability, but eventually drift over time.
Filtering methods, such as the Kalman filtering method and the particle filtering method, are used in their application with corresponding battery models [7]. Their accuracy depends largely on how well the model maps the system [4]. While Kalman filtering methods are only suitable for linear systems, extended Kalman filters and particle filtering methods can also be applied additionally for non-linear and non-Gaussian systems. However, the disadvantages of the particle filtering methods are the loss of accuracy and the lack of real-time capability [4]. Piller et al. [8] note that filter methods are suitable in highly dynamic applications.
Data-driven methods are applied according to the black box principle [4]. External parameters of the battery and the corresponding battery state are black box input variables for training a model. The training aims to determine the non-linear relationship between battery parameters and the state of charge on which a future state of charge (SOC) can be identified. Artificial Neural Networks (ANN), Relevance Vector Machines (RVM) and Support Vector Machines (SVM) are part of the data-driven methods.
ANN imitate natural neural networks to generate mathematical models suitable for the system under investigation. RVM use a Bayesian approach to map high-dimensional spaces qualified for non-linear systems [9]. They are characterized by long training and short test phases, whereas SVM have short training and long test phases. The accuracy of the methods depends mainly on how closely the training data set matches the test data set.
Disadvantageously, the results are generated by purely statistical assumptions with no consideration of the background of electrochemical processes, which increases the uncertainties and reduces the adaptability to other cell chemicals. When training and test data are similar and the variance within the training data is small, data-driven methods can achieve high accuracy in determining SOC [4].
2.1.2. State of Health
Brill [10] divides the methods for estimating SOH into direct measurement procedures and model-based procedures. This categorization is extended to include experimental methods, for adaptive estimation and measurement of the intracellular pressure [11,12].
Using direct measuring methods, the system is excited with previously defined test signals. The resulting system response provides information about the battery state. The discharge test, based on the constant current constant voltage (CCCV) principle, determines the discharged load starting from a fully charged battery until the final discharge voltage is reached. This parameter is independent of the temperature and open-circuit voltage, but not of its aging and by that, the resulting capacity is used for estimating the state of Health (SOH) of the battery. Other approaches that are similar to the described one include the 1-C method by Brill [10] and the charge test by Farmann et al. [13].
Another method of determining the aging of a battery is based on the quiescent voltage characteristic [14]. The comparison of the voltage curves of new and aged cells allows a conclusion on the SOH.
To determine of the SOH using the internal resistance, it is not only the change in pure ohmic resistance that is important, but also the spreading of the resistances of the individual cells in the entire battery system [11]. As a result, the internal resistance is influenced significantly by the breakthrough overvoltage, double layer capacity as well as diffusion. The comparison of internal resistances therefore requires a defined time in which the internal resistance is measured [10]. In the automotive industry, periods of ten seconds are preferred for the measurement [15]. Exact knowledge of temperature during the internal resistance measurement is necessary, since this is an essential influencing parameter [12].
Impedance spectroscopy can be used to parameterize electrical equivalent circuit diagrams [16]. Therefore, the system is stimulated with sinusoidal signals before the phase and amplitude of the system’s response are measured at different frequencies. With suitable evaluation, aging effects of the battery can be detected, such as the growth of the solid electrolyte interphase (SEI), which in turn affects the SOH [10]. If this method is to be used on-board, expensive hardware must be acquired [17]. Besides, determining the impedance using signals supplied by the vehicle is often inefficient because the sampling rate is too low [10].
Lastly, Brill mentions methods that can be used to determine aging by chemical analysis. If no reference electrodes were installed during production, the cell has to be destroyed to examine the electrodes and electrolyte. Brill mentions, however, that cells with integrated reference electrodes can exhibit falsified properties.
Model-based methods evaluating the battery during vehicle operation can be fundamentally divided into detecting and load-based procedures [10]. Depending on certain parameters, detecting procedures describe the change of measured variables. This leads to an optimization of the model parameters, which can be used to determine the aging of the battery. Detecting procedures are able to discover spontaneous errors. Model adjustments are possible due to feedback, but the possibilities for prognosis are limited. Therefore, they are well suited for determining the current battery state, but they are not recommended for long-term prognoses.
In the case of load-based models, the focus is on observing the effects of measurable or reconstructable loads [10]. The occurring effects allow to draw conclusions about the condition of the battery. The determination of the influencing factors is complex using this approach because the damage impacts are only partially known. If the main damage characteristics and load profiles are given, it is possible to make good predictions about the remaining battery life.
Roscher mentions the possibility of determining aging by the internal cell pressure [11]. This effect uses chemical decomposition processes to show that progress with increasing aging of the cell inside. The reactions produce gases that increase the pressure of closed cells without a pressure relief valve. With the help of sensors on the outside of the cell, the smallest deformations caused by the increased pressure can be detected. Taking into account other effects that can also cause distortion, such as thermal expansion, aging over long periods can be determined.
2.1.3. Assess Methods for This Work
To achieve state estimation in this work, we choose to estimate capacities of the cells during charging phases. A reverse discharge test can be done if the car is sufficiently depleted and starts charging with low power, for example, using kW. We use the open circuit voltage (OCV) method to determine the SOC during charging and within an equivalent circuit model (ECM).
We estimate internal resistances during driving using an ECM. Table 1 summarizes the suitability of the aforementioned methods with respect to available data in this work. The decision was mainly based on requirements such as low data complexity and practical relevance.
2.2. OBD-II Interface
The OBD-II standard defines a unified interface initially designed for evaluating exhaust gas-relevant systems but also used for vehicle diagnostics [18]. Communication on bus systems is organized in layers as the open systems interconnection (OSI) model proposes, where lower layers are close to hardware and abstract certain functions in favor of the higher application-specific layers. In the application layer of car diagnostics, the old KWP2000 protocol (Key Word Protocol) is replaced by unified diagnostic services (uds) for general vehicle diagnostics and programming [18]. Most parts are backward-compatible to the old protocol. In the vehicle, the gateway takes a central role in vehicle communication. It is connected to all control units and serves as a contact point for all bus systems [19]. To communicate with the vehicle control units, a diagnostic tool known as an OBD-II tester is required [19,20].
2.3. Digital Twin System
Originating from aerospace engineering [21], digital twins emerge in all fields of application. A digital twin mirrors its physical counterpart and runs multi-physics simulations. Therefore, data need to be synchronized between the physical and the virtual world [22]. Because digital twins might live during the entire live cycle of products, they have to be run in cloud environments.
Aim of a digital twin is to generate knowledge that is not directly observable and measurable in the real-world system. One example of this is the SOH of a battery pack, as stated in [23]. Models have to be evaluated in order to estimate this hidden state. In other use cases, digital twins play a role in virtual assessments of the system, for example, testing or the virtual launch of a production line.
Common to all digital twins is the internet of things (iot)-connection of the real world with a virtual world. Digital twins update themselves and allow incoming data to be processed automatically. This foundation builds the digital shadow, a data-based copy of the real-world system. On this basis, simulations and models can be built and evaluated. A management system automates the process of controlling the models and simulations. On the output side, services take the results from these models and distribute them to the end user, for example, via a web-based front end.
2.4. Battery System of the VW e-Golf
The 2014 e-Golf consists of a total of 264 lithium-ion cells, which are connected in a 3p88s pattern [24]. A series connection of cells causes an increase in the total voltage of the battery, whereas parallel connections increase the capacity [25]. This cell setup results in a nominal battery voltage of 320 V, a rated pack energy of 24 kWh and a capacity of 75 Ah [26]. In the following, the three parallel cells are considered a single cell, due to the lack of individual sensors.
The individual cell modules are installed in the underbody of the vehicle and are protected by their housing from mechanical forces and electromagnetic radiation [27]. A passive air-cooled thermo management is implemented. The battery management system (bms) monitors cell voltages, module temperatures and the current flowing through the battery [3]. Moreover, it exhibits monitoring and safety features and is responsible for the data exchange with the gateway, and is therefore accessible by the OBD-Socket.
3. Goal and Innovation of This Work
The goal of this work is separated into three layers:
- Digital battery twin: Working towards a digital battery twin, the use case of automotive battery pack online parameter estimation is of crucial importance. Therefore, we want to build on the digital twin paradigm in this work and define an architecture that shapes a modular, cloud-based digital twin. To date, no detailed reference architecture for a digital battery twin in this use case can be found in literature, however, online estimation methods have already been developed, for example, in Karger et al. [28] or Baumann et al. [23].
- State estimation using OBD data: Using battery state estimation as a use case, we want to achieve a cell-individual assessment of the battery system. Being able to apply this method to electric vehicles in use, we want to rely on diagnostic data, which come with certain limitations concerning sample rate and availability. Only limited edge processing can be done in the vehicle, such as decoding the diagnostic data. The novel approach presented here utilizes only standard uds-diagnostic queries to gather data from the whole battery system. Coping with the limited data quality, the most suitable state estimation methods are chosen to be implemented and tested.
- Holistic implementation: Using real driving cycles, we implement and test the chosen methods integrated into the twin system. We develop a pipeline from the car to the cloud, and finally to the user display.
4. Method
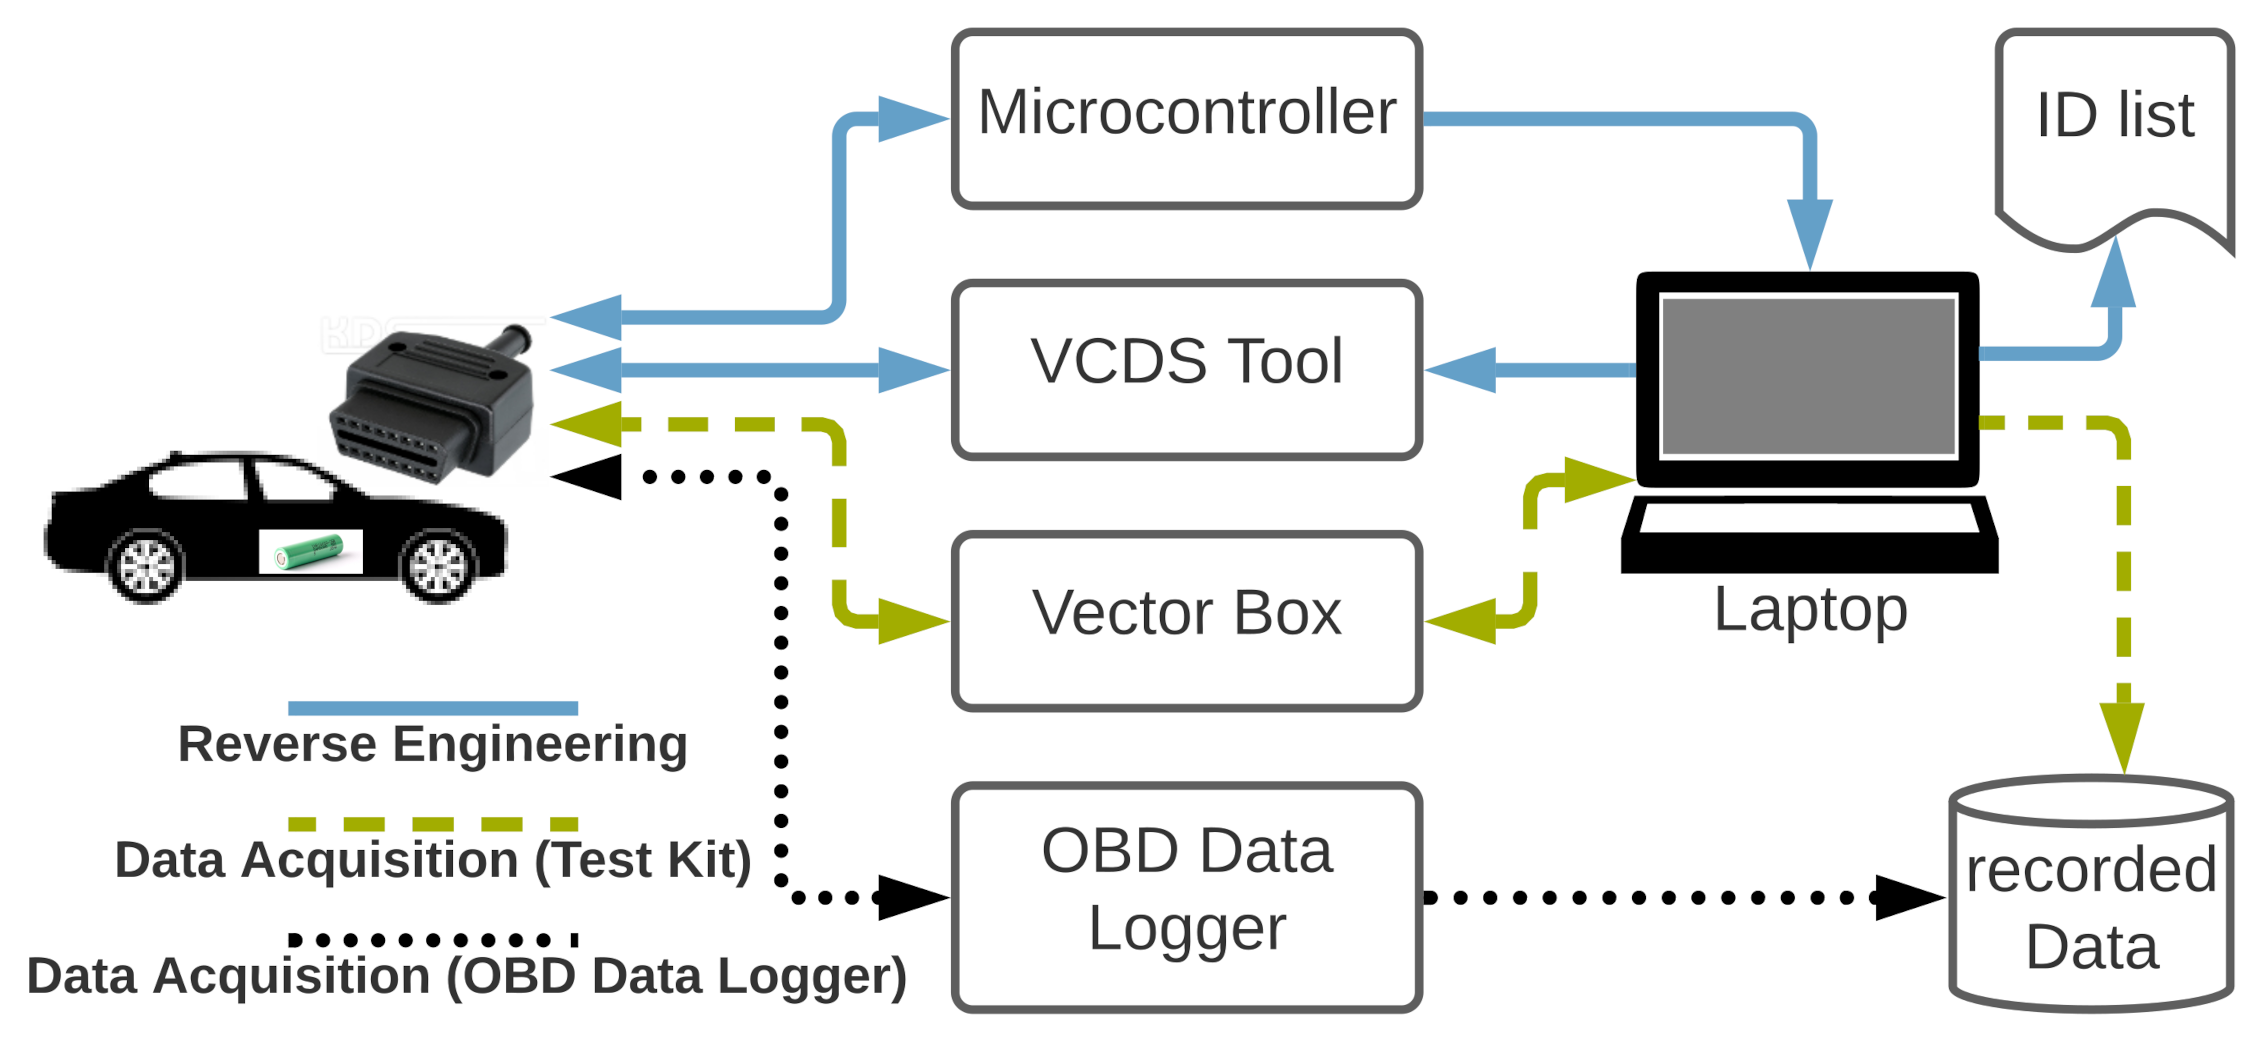
The method is made up of three parts. First, we need reverse engineering, to get access to the vehicle’s data via the diagnostic interface. Next, the data is acquired under the limitations of the data rate, using either a test kit or an OBD data logger. Figure 1 shows the respective setups. In the third step, we use a cloud-based digital twin to analyze the recorded data. In the following chapters, we outline the three steps in detail.
4.1. Diagnostic Interface: Reverse Engineering
For the reverse engineering of the diagnostics requests, we use the workshop tool VCDS by Ross-Tech. It is designed to work with vehicles of the VW group [29]. Modern vehicle diagnostics use unified diagnostic services (uds) in the application layer and ISO 15765-2 Ttransport protocol for automotive bus systems (isotp) in the transport layer. The transport layer is an intermediate layer in bus communication. For some functions to be accessible, special operating sessions are required, for which a corresponding diagnostic-session-control request is sent [19].
VCDS includes an internal list of IDs for querying specific sensor data from the vehicle. This list, however, is not visible to the user. To overcome this, we sniff the controller area network (CAN) traffic while querying the vehicle data using VCDS. By comparing them one by one, we relate the CAN messages to the VCDS query. In this manner, it is possible to identify the IDs and recalculate the conversation function from the raw byte values to the physical sensor value. Before the bms is queried using Read Data By Identifier requests, the CAN traffic shows a Diagnostic Session Control request, enabling an Extended Diagnostic Session. The identifiers and conversion values extracted in this way are stored in an ID list and can be used in a custom application to gather the diagnostic data later on.
4.2. Diagnostic Interface: Data Acquisition
To allow the battery states to be analyzed, we need to log the two vehicle states driving and charging. From the driving states, we can obtain dynamic battery data, which allows us to estimate the internal resistance. The charging phases allow the cells’ and pack’s capacity to be estimated. In the following sections, we describe the data acquisition pipeline that works for both vehicle states.
4.2.1. Test Kit
To record the data in the developing phase using the test kit, the laptop is connected to the vehicle’s OBD interface via the Vector box VN1610 as Figure 1 shows. A python program based on python-can, udsoncan and can-isotp continuously queries the relevant vehicle data using the ID list from the previous reverse engineering. Using the knowledge and the IDs from the reverse engineering step, the program constructs valid requests and stores the read-out data in files. It is converted into physical units by means of custom decode patterns.
4.2.2. Rotation System
Due to the limited recording rate for two requests in parallel, not all battery cells can be measured simultaneously at a high frequency. Therefore, cell rotation management is implemented. With this, the system jumps to the next cell once the first cell has been measured. Each cell runs through the schedule shown in Figure 2. First, a header is recorded including one-shot measurements of the current SOC, the pack temperature and voltage, and the cell ID. After that, the time series recording of the chosen cell voltage takes place, together with the current going through the pack. Finally, we record the SOC, pack voltage and temperature once more. The action to jump to the next cell can be triggered after a predefined time, or as soon as sufficient data are available to determine the desired battery characteristic. Depending on the application, it may be advantageous to keep cells in the query in the same order, or to randomly rearrange the query order at the beginning of a period.
The amount of time spent measuring one cell needs to be evaluated. Different road settings and driving styles might induce different optimal lengths of measurement windows. Time windows may be static or dynamic. For dynamic windows, feedback to the data logger needs to be implemented in order to report whether a sufficient amount of data is gathered to fit the internal resistance. The time to measure the pre and post data set is ca. s.
4.2.3. Data Logger
To automate the data collection for a larger-scale fleet, it is useful to utilize a vehicle-data logging device. In this case, this is a small, low cost, embedded system, designed to capture vehicle data including global navigation satellite system (gnss) position, acceleration forces, rotation rates and diagnostic data over the OBD-II interface. When the same uds queries are used as with the test kit, the same data can be gathered, at the same frequency. The rotation system is applicable as well. One advantage of a small data-logging device is the ability to buffer data and submit it to the cloud as soon as a connection is accessible.
4.2.4. Transfer to Cloud
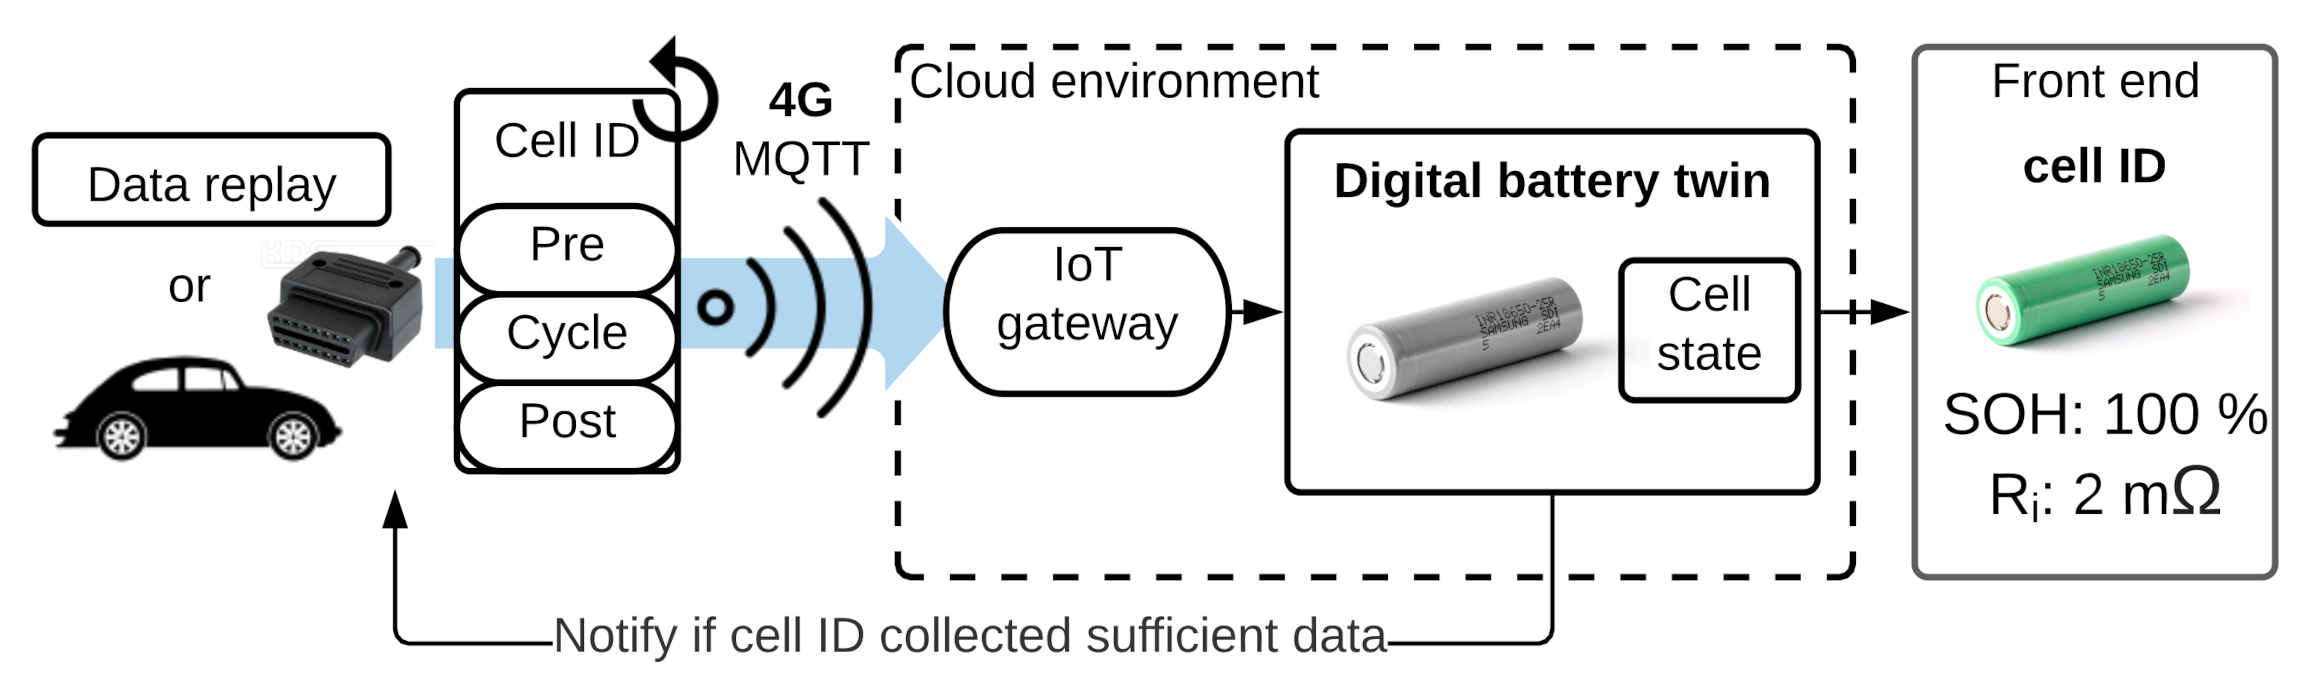
For processing purposes, the data are uploaded to a cloud, where the battery twin lives. Figure 3 shows the process of transferring and processing the data in the cloud. As described in Figure 2, the data packets are sent via 4G cell network and message queuing telemetry transport (MQTT) to an IoT broker. From there, the digital twin manages the incoming data, hence saving it to the database and triggering the estimation of the internal resistance, capacities and other battery states. If dynamic cell measurement is chosen, the digital twin notifies the data logger in the car through a MQTT channel to proceed to the next cell, when possible.
To allow for more flexibility during cloud development, we implement a data set replayer, uploading the data in real time through MQTT from a workstation. From the point of view of the cloud-based digital twin, the origin of the data does not make any difference.
For visualization, an angular-based web front end gives a cell-individual overview over the SOH.
4.3. Analysis
For the state estimation of the vehicles battery, we want to quantify the SOC, the cell’s capacity and the internal resistance of the individual cells. In the following, the algorithms for determining the capacity and the internal resistance are described. From this, we derive the SOH for both resistance and capacity.
4.3.1. Estimating Capacity
We use the reverse discharge test to determine the capacity. For this purpose, the battery should be as deeply discharged as possible, because Farmann et al. [13] recommend a change in SOC of at least 60% along with a moderate increase in temperature in order to obtain precise results. Integrating the current over time, we receive the total capacity charged during the event. Together with the change in SOC, Equation (1) shows the metric for calculating the total capacity of the battery, where represents the Coulomb efficiency. For lithium-ion batteries, can be assumed to be 1.
Since the SOC levels of the cells are not equal to those of the entire battery, and it is not possible to read out SOC values for the cells, we use a SOC estimator with an underlying OCV characteristic curve, which estimates the SOC at and of the cells. Overvoltages are subtracted from the voltage value by the amount of . The OCV characteristic originates from another cell that is similar in electric properties and battery chemistry. With the current flow during the defined time window and the corresponding SOC states, the capacities of the cells are calculated using Equation (1).
Using the up-to-date capacity of the battery and cells and the nominal capacity, the capacity-based state of health (Capacity) (SOHc) can be determined as Shen et al. [30] proposes in Equation (3).
4.3.2. Estimating Resistance
To determine the state of health (Resistance) (SOHr), we use a three-step method. First, we estimate the up-to-date internal resistance at specific environmental conditions. Second, from a set of internal resistances at varying environmental conditions, we generate one model for the per cell. Third, we evaluate this model and use the result to determine the SOHr using Equation (4).
Equation (4) shows that we need to know the up-to-date internal resistance , the internal resistance at begin of life (BOL) and a reference resistance for the end of life (EOL) . We take the initial value of internal resistance for a new battery system from studies performed by the Idaho National Laboratory (INL) [26,31]. There, five 2014 e-Golf were tested in various driving cycles and the degradation of the battery pack was observed for roughly the first 20000 km.
To scale the reference resistance at the cell level, we consider a contact resistance due to mechanical steel-to-steel connection of the prismatic cells of m, as indicated by [32].
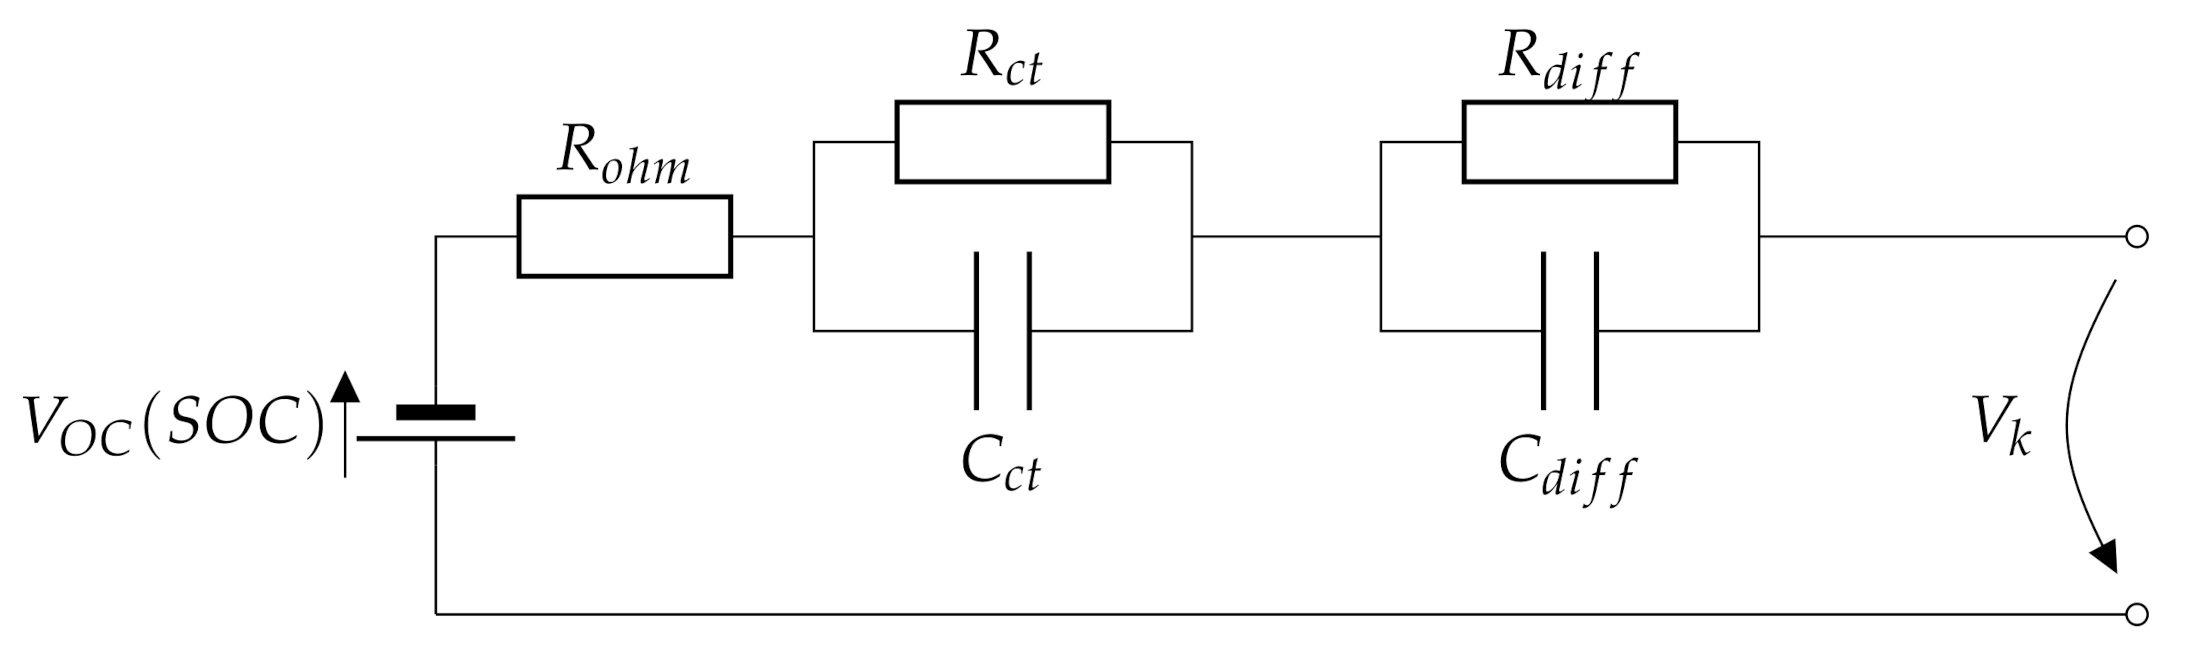
The is defined as a 60% increase in resistance. The current resistance is determined by a model-based method. An ECM containing two RC elements is used to model the battery’s dynamics. The model parameters are fitted using the scipy [33] least-squares algorithm on the trust region reflective method (trf) to handle bounds. Figure 4 shows the ECM circuit and all parameters that are fitted by the least-squares method. The pack current and the terminal voltage serve as input to the fitting algorithm. Empirically specified bounds are set for all variables. After the optimization process, the initial environmental conditions such as temperature, current and SOC are saved together with identified model parameters.
Now, the parameterized ECM is evaluated using a defined current impulse of 50 A. The 10 s voltage answer of the model is recorded and used to determine a resistance. By using the 10 s voltage answer, also the dynamic resistance parts from the model are incorporated in the resistance estimate. The inferred internal resistance is plausibility-checked and saved to a database, together with the environmental parameters from the original measurement. Results are declared plausible if the root mean squared error (RMSE) of the fitting process is below 10 mV and the resulting resistance value is in a reasonable region. We choose the limit of 10 mV in an empirical approach to allow for enough data points in the downstream processes. The quality of downstream appliances could rise if the threshold is set lower. However, more raw data are needed to sustain the same amount of filtered data points. As an additional filter, we take the dynamic of the current into account. A minimum of 10 A current change during the measurement cycle is needed to keep the data. The code of the ECM can be found here: https://github.com/TUMFTM/2RC_ECM.
Based on this database, a classification over the environmental parameters is performed to be able to compare only values across cells with matching environmental conditions. A 2D curve fit of an exponential polynomial of fourth rank over the SOC range and an exponential relationship for the temperature range as shown in Equation (2), classifies the data, where x denominates to the SOC and y to the temperature.
For the fit, we use the Levenberg-Marquardt algorithm provided through scipy.optimize. curve_fit, unbounded using empirically tuned start parameters. From this 2D plane, a reference resistance can be drawn at a defined tuple of temperature and SOC. Using this approach, the individual cells are comparable, both against other cells and against the same cell at a different point in time. For the confidence interval, we use the covariances returned from the curve fitting.
5. Results
The aim of this paper is to show a battery state estimation based on diagnostic data from an OBD-interface. To allow data to be collected more quickly, we selected two cells (7744 and 7750) that seem to behave differently on basis of a first assessment to compare them in more detail. The cell number results from the UDS ID. Furthermore, the data are transferred and processed in a cloud-based digital battery twin, which is why we present the architecture of the digital twin here.
5.1. Data Collected
For the purpose of this work, a test trail was used, with the goal of approximating the usage behavior of an average driver living in Germany, known as Kreibich’s trail [34]. A total of 2707 measurements are taken within 20 h of driving at a battery temperature between 1 and 38 over the last year. This results in a recording rate of approximately 135 measurements per hour. In a subsequent charging cycle, 9079 measurements of the individual cells were taken within approximately seven hours. For the charging measurement, the cycle time is 5 s. For the driving measurements, the cycle time varies between 20 s and 30 s.
After filtering processes, only a part of the recorded measurement cycles are usable. For the internal resistance algorithm, 30 s cycles produce a share of 92% usable data. Measurements using a 20 s cycle obtain 87.9% usable cycles. This seems plausible, because during the longer cycle time, it is more likely that sufficient current variability will be recorded. For the total mixed data set of both cycle times, we reach a share of 88% usable cycles (2394 out of 2707).
Combining the ratio and cycle time and normalize it to an hour of recording, we can get cells/h using the 20 s cycle time and cells/h using the 30 s cycle time.
For a vehicle that is driven for one hour on a daily basis, it would take days to record each cell once.
The file size for one 30 s uncompressed, text file-based cycle is kB on average. Given the total number of measurement cycles and the total driving time, we get MB of data per hour driving.
The collected data can be found in the Supplementary Material.
5.2. Reverse Engineering and Data Logging
The connection to the car via the vector adapter is established using a bitrate of 500,000 B/s. The isotp address of the controller we want to query is 0x7ED (Battery Management System). UDS session has to be set into an extended diagnosis session. Table 2 shows a subset of the identified UDS IDs. For the voltage ID of cell 2, increment the UDS ID of the first cell by one and so on.
The performance of the UDS interface over OBD-II is dependent on the amount of parallel queries. For the approach presented here, at least two queries need to be executed in parallel. The first query is a voltage, either of the whole pack or of one cell, and the second is the current going through the pack. It is crucial to have both sensor values recorded as synchronously as possible. We find that we can go up to 9 Hz querying any tuple. Going faster, the interface refuses to answer and the connection may be interrupted.
5.3. On the Capacity
To estimate the capacity of the single cells, we measure the charging cycle from a SOC of 12.8% to 96%, indicated by the vehicle’s SOC data. Additionally, the SOC is estimated via the OCV property. This approach leads to a start SOC of 17.1% and an end SOC of 96.5%. The temperature of the pack increases from to during the charging process. The conditions that Farmann et al. [13] deem necessary, a 60% change in SOC combined with only a small change in pack temperature, are met. In our case, the change in SOC of the battery pack during charging is more than 70% with a rise in battery temperature of . For slow charging at kW, the battery pack does not heat up.
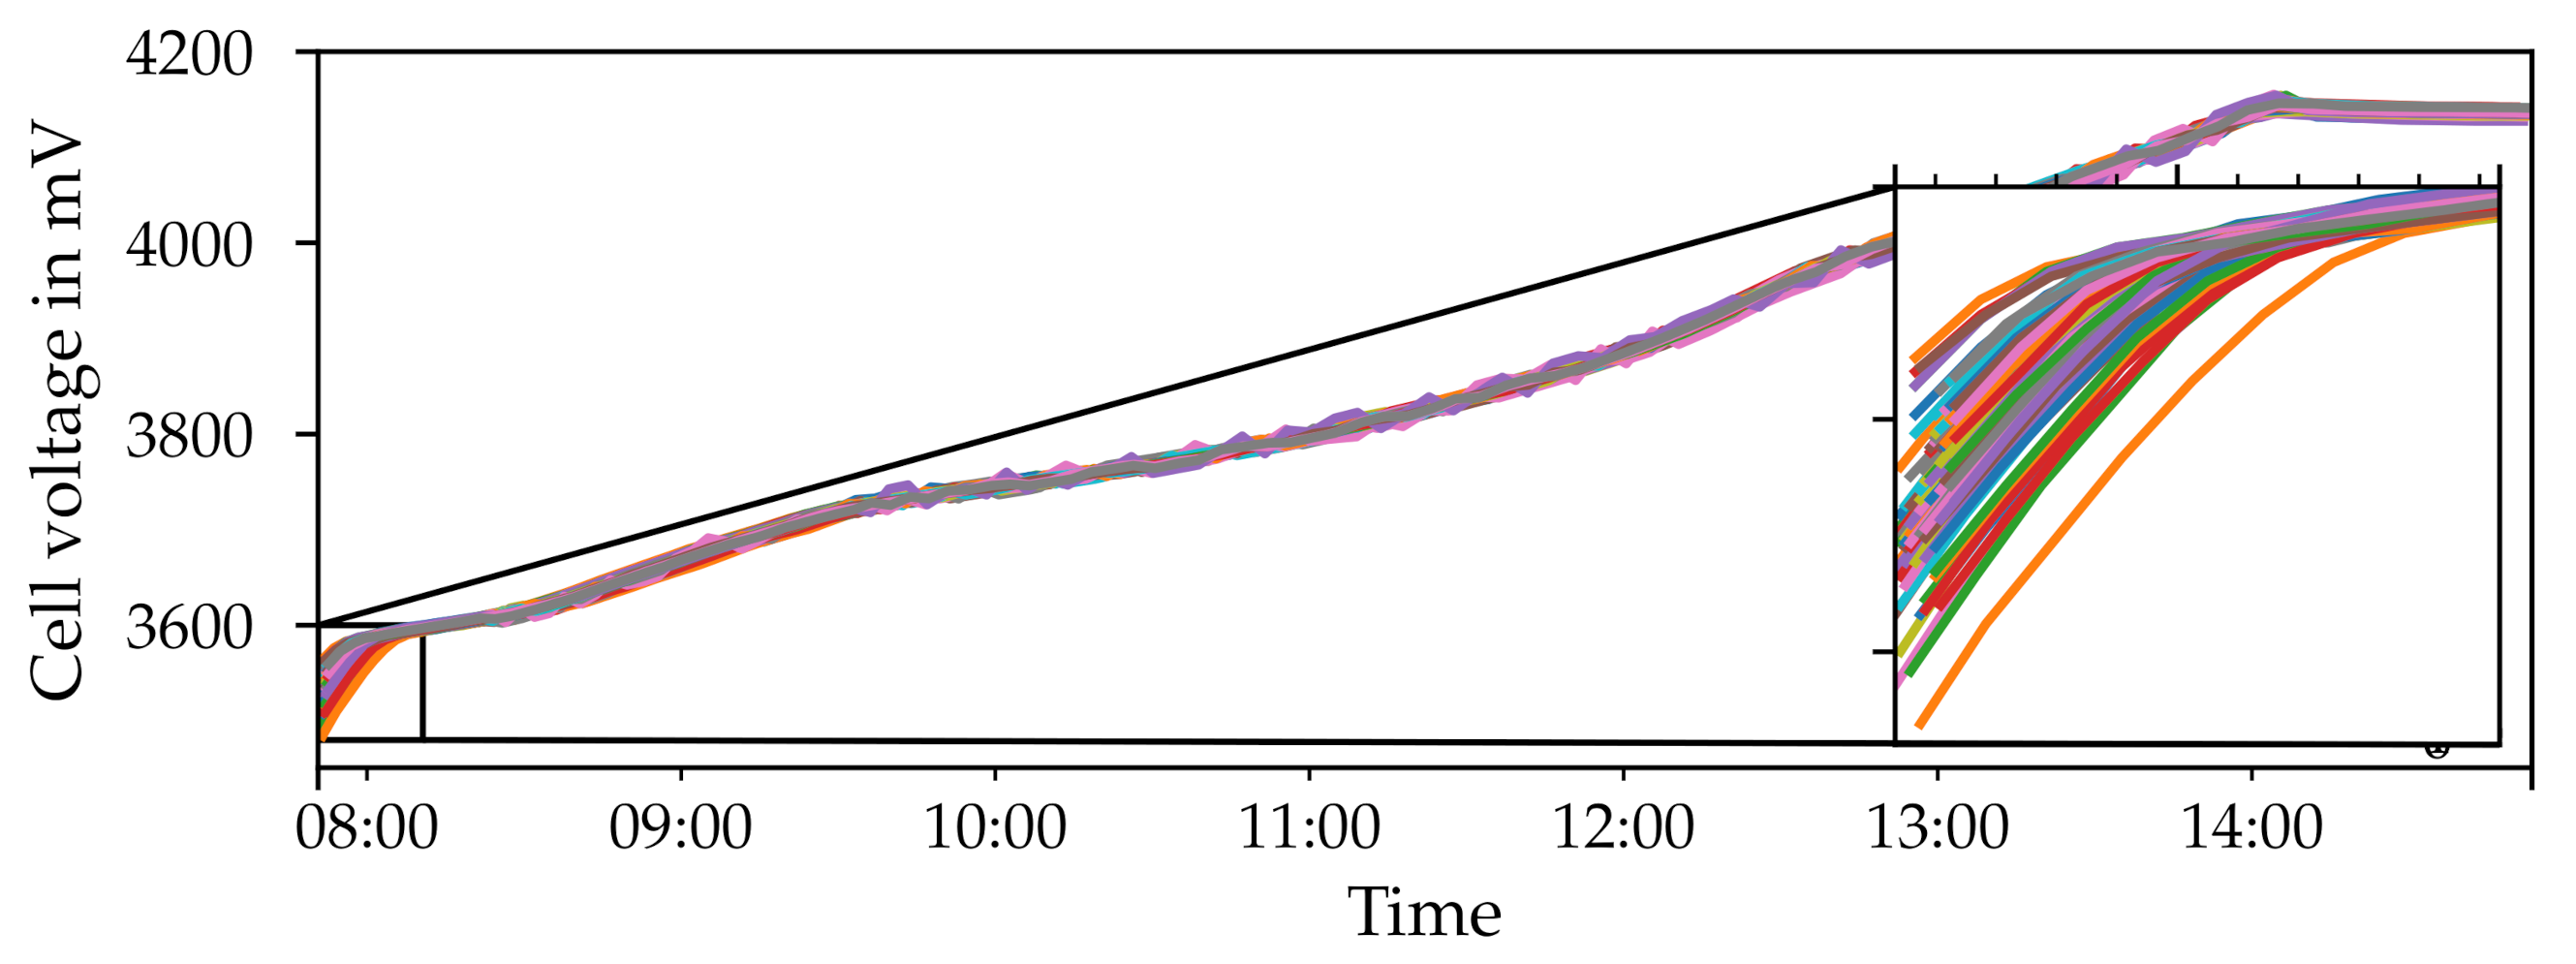
Figure 5 shows the charging process of all cells. To achieve this measure, the cell recording cycle was set to one, which means one record is taken per cell and then the recorder hops to the next cell. Following this approach, one cell can be measured every 250 s. It is clear that the cells deviate, especially in the lower SOC region.
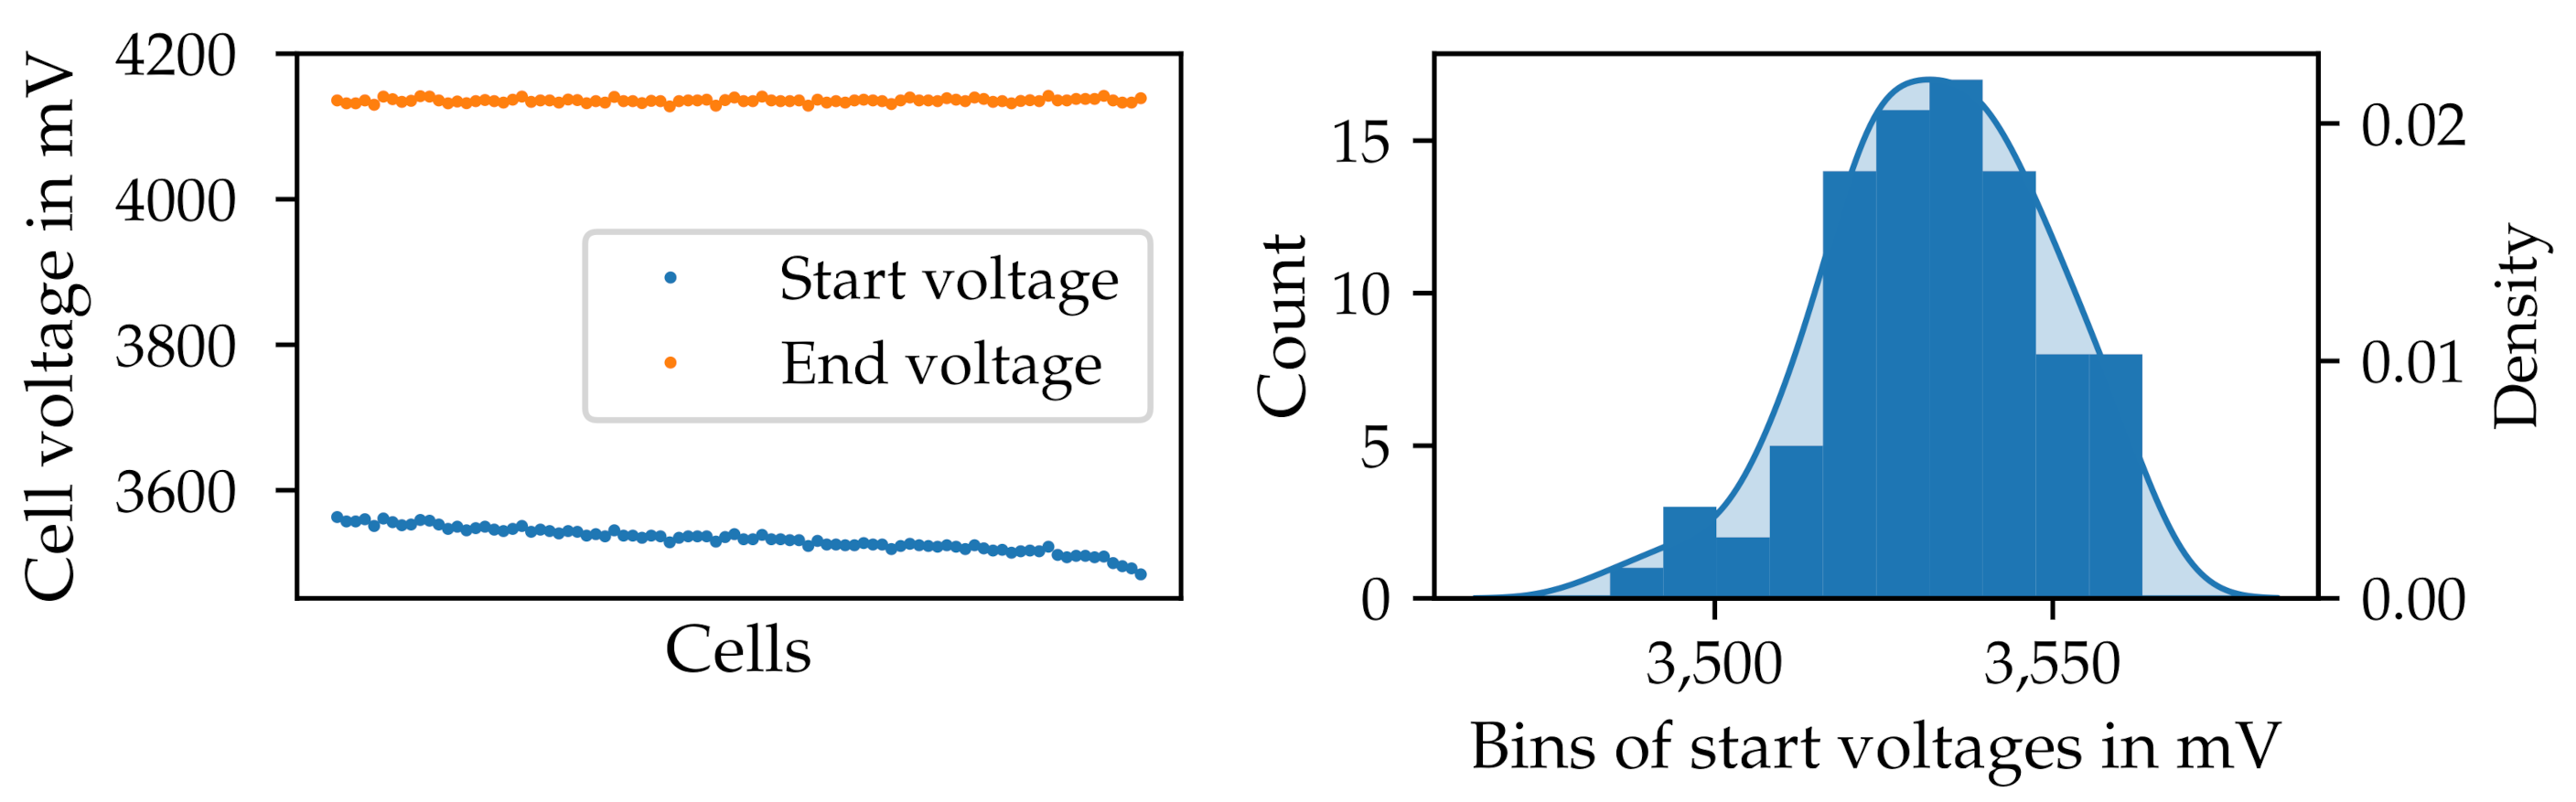
To investigate the cells further, Figure 6 shows the start and end voltages of the charging process of the individual cells on the left side. We can see that some cells tend to discharge more deeply than others, hence having a higher dod. The more a cell is discharged, the less remaining capacity is available. On the right, a histogram shows the distribution of the start voltages. The distribution is skewed to the lower dod region, resulting in a tendency towards a greater number of good cells than poor ones.
Using the method by Park et al. [35], one can calculate the capacity by integrating the current and relate the charged capacity to the increase of the SOC. For the battery pack, we can derive a total remaining capacity of Ah. Comparing this to the initial 75 Ah, we estimate an SOHc of 93.7%. This method is also applicable to the individual cells. To estimate the SOC of the cells, their OCV characteristics need to be known. For this work, we use a lithium nickel manganese cobald oxid (NMC) OCV characteristic of similar-sized cells because we do not have access to the actual characteristics of the built-in cells.
Figure 7 shows the capacities of all cells. On average, we get Ah at a standard deviation of Ah. We show the distribution of the capacities on the right side of the plot. It follows the distribution of the start voltages and their distribution in Figure 6. This result seems plausible because cells with a lower start voltage are attributed to a lower capacity. For cell 7744, we get a capacity of Ah (SOHc of 96.4%) and for cell 7750 we get 70 Ah (SOHc of 93.3%).
5.4. On the Internal Resistance
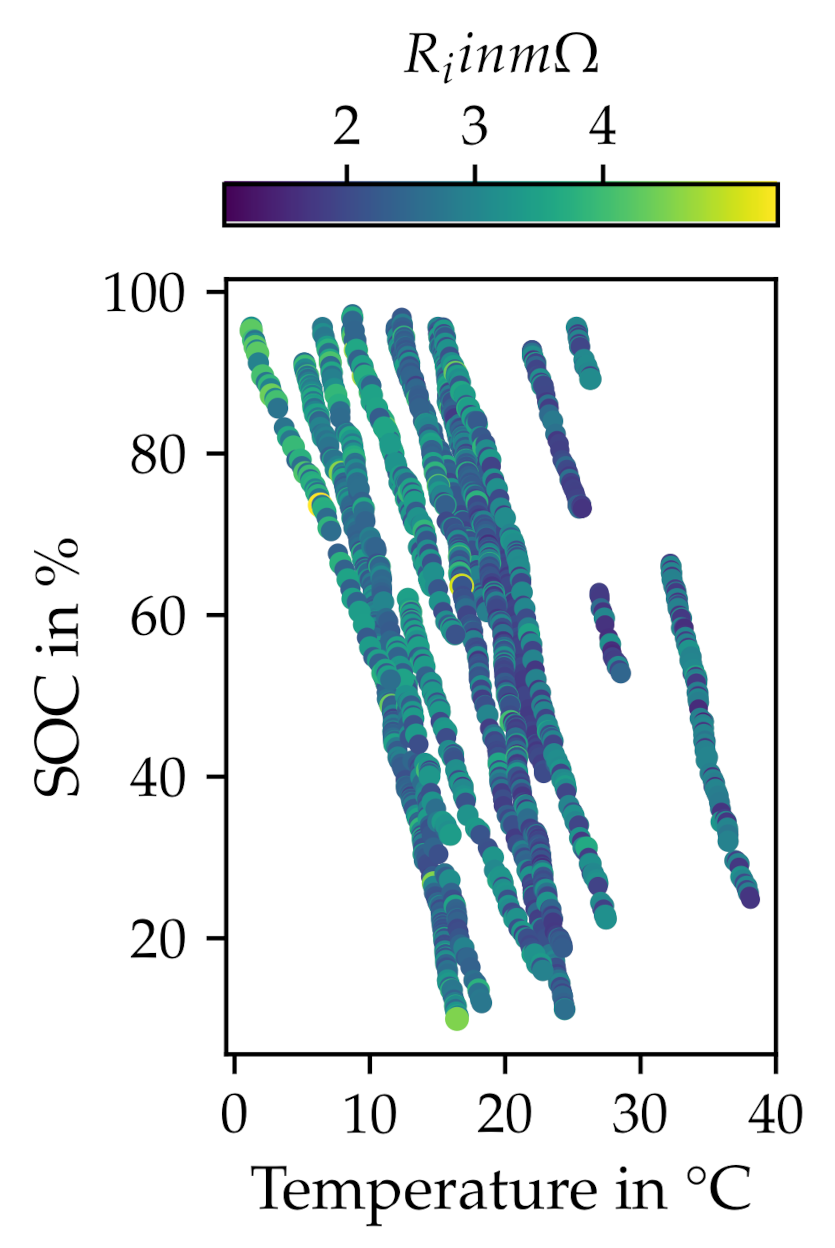
In Figure 8, the estimated resistances for all cells from all test drives are plotted over the temperature and the SOC. Every point represents one cell to the given state in temperature and SOC. The colorbar indicates that the resistances reach from m to m. The line-like structure of the data points originates from the fact that during a test run in middle European climate, the temperature of the battery rises and the SOC drops throughout the test run. Therefore, one test run results in a skewed line from low temperatures and high SOCs to lower temperatures and lower SOCs.
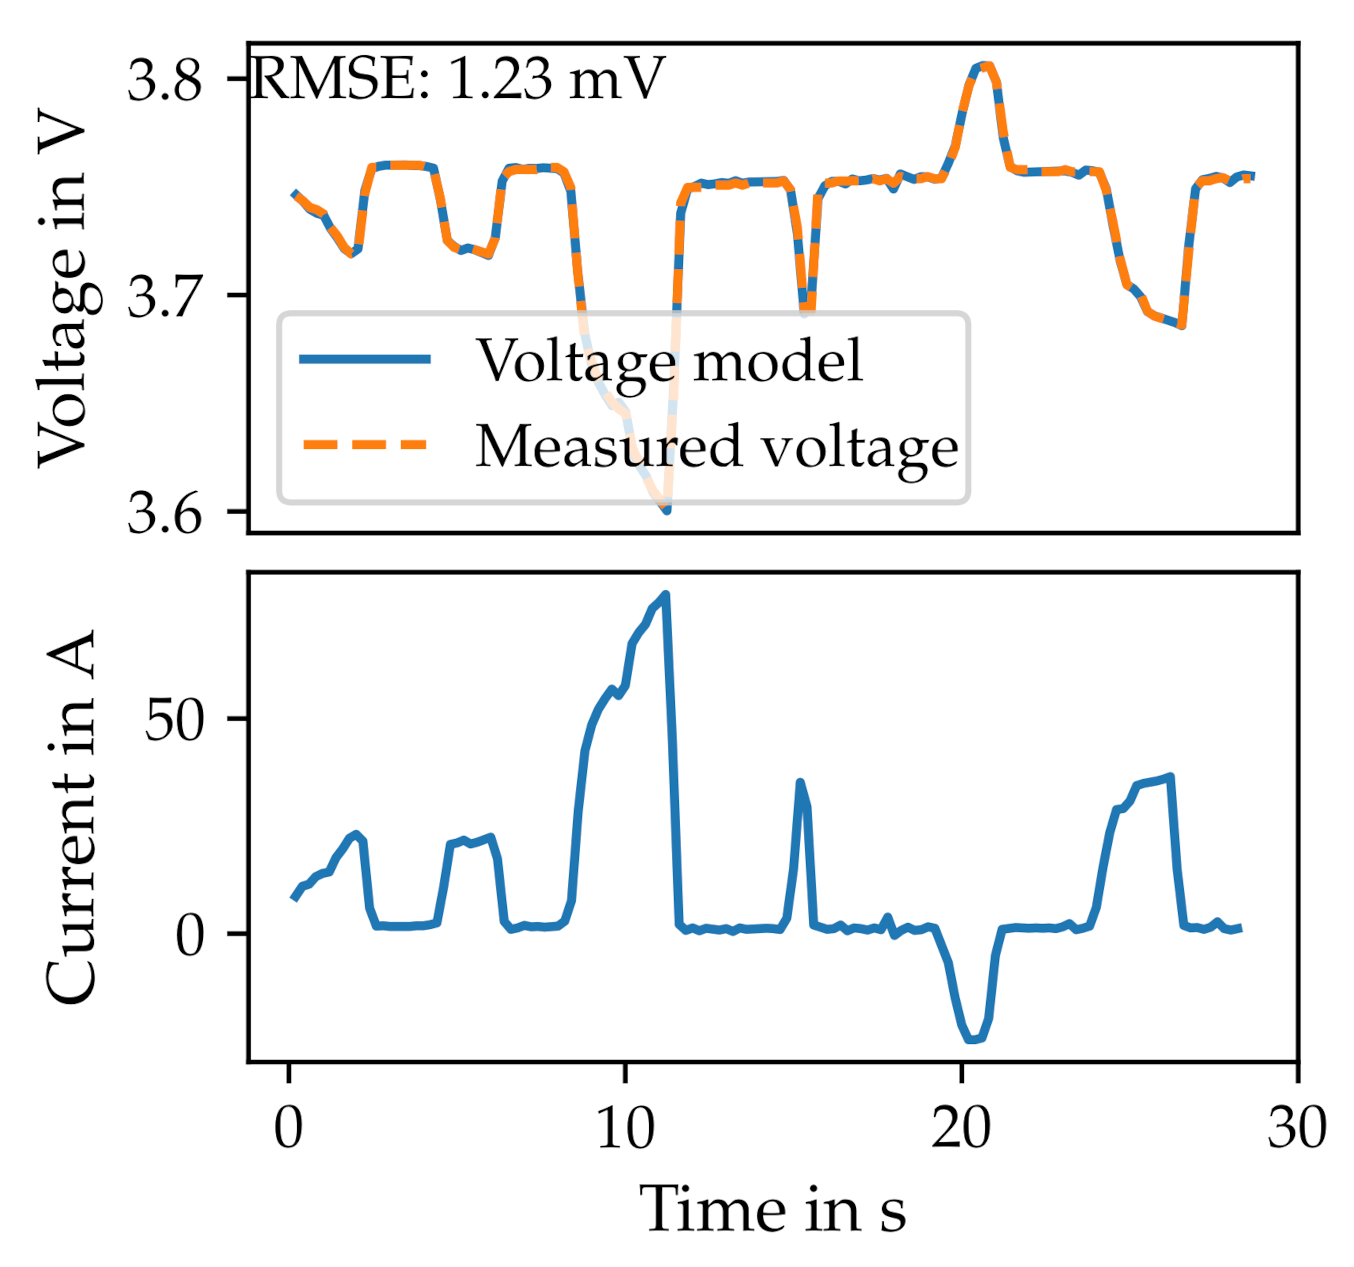
Figure 9 shows one exemplary result of the least-squares fitting process. The sample of this measurement cycle is 30 s in time with a peak of 60 A current delivered by the battery. Positive currents correspond with a discharge of the battery. The RMSE of the modeled voltage versus the measured voltage is mV which is in the range of other publications [36]. Therefore, a good fitting result can be noted.
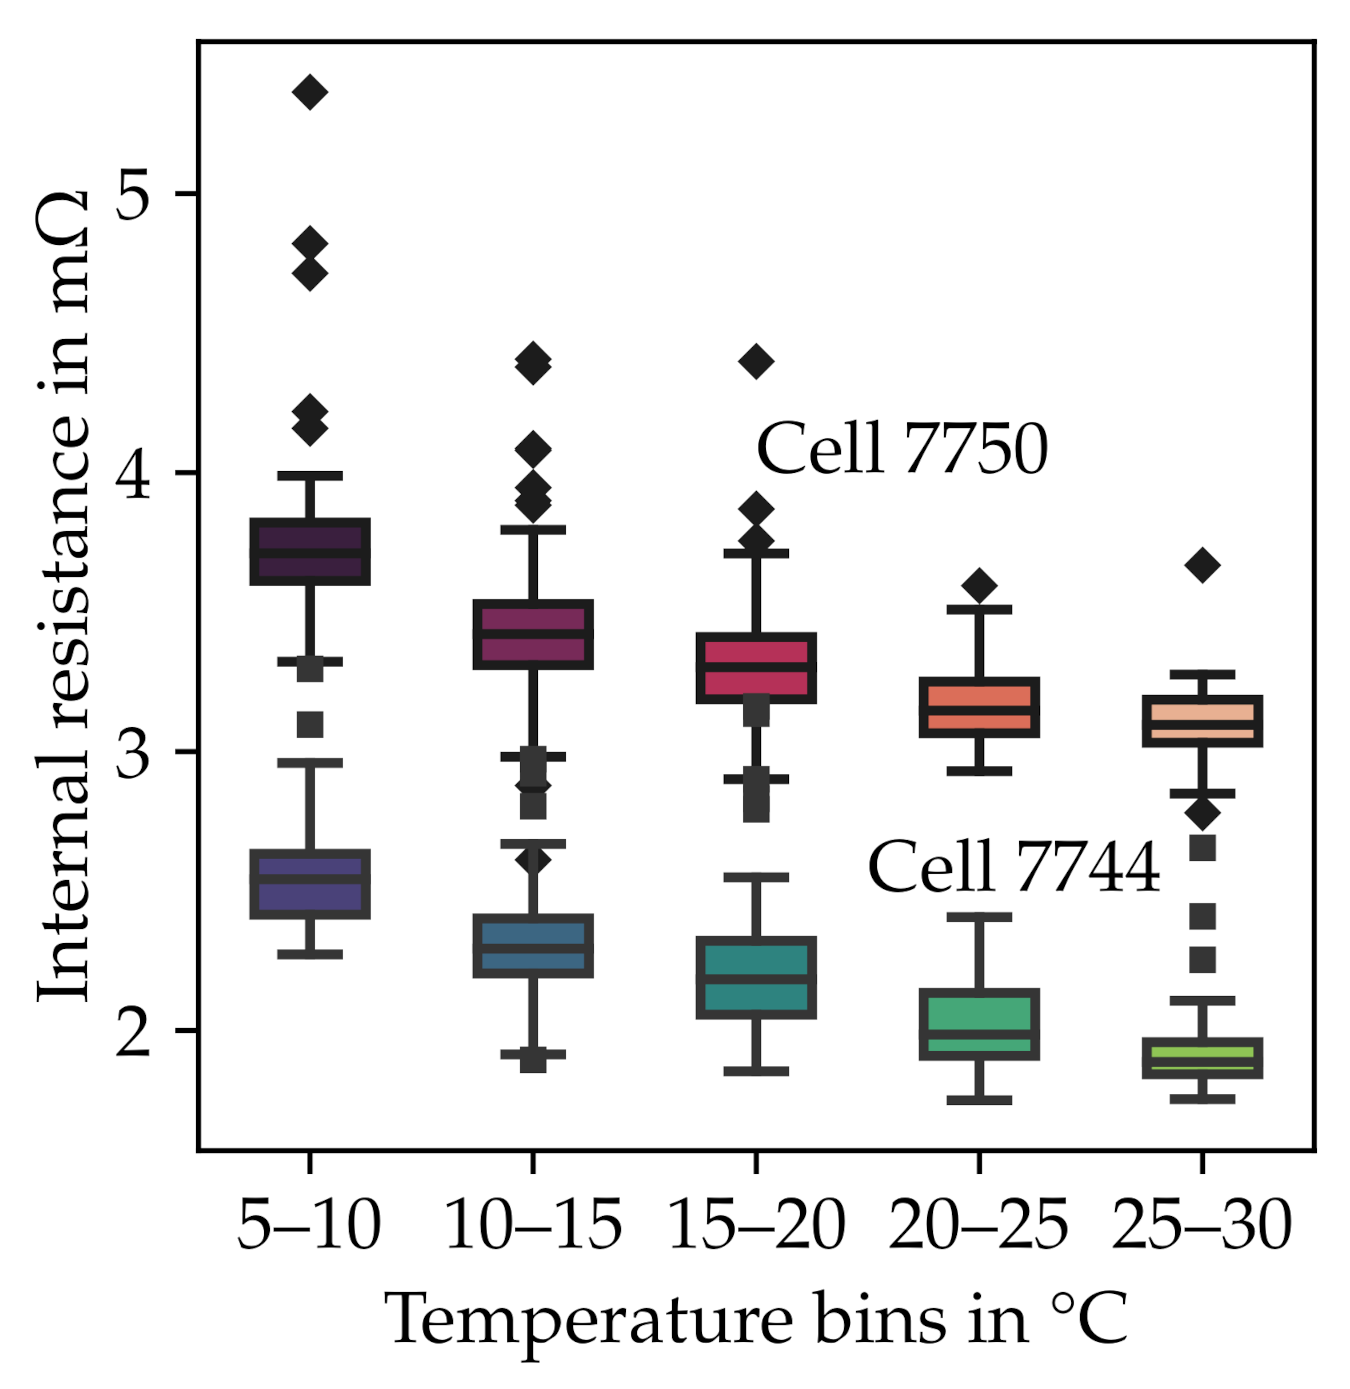
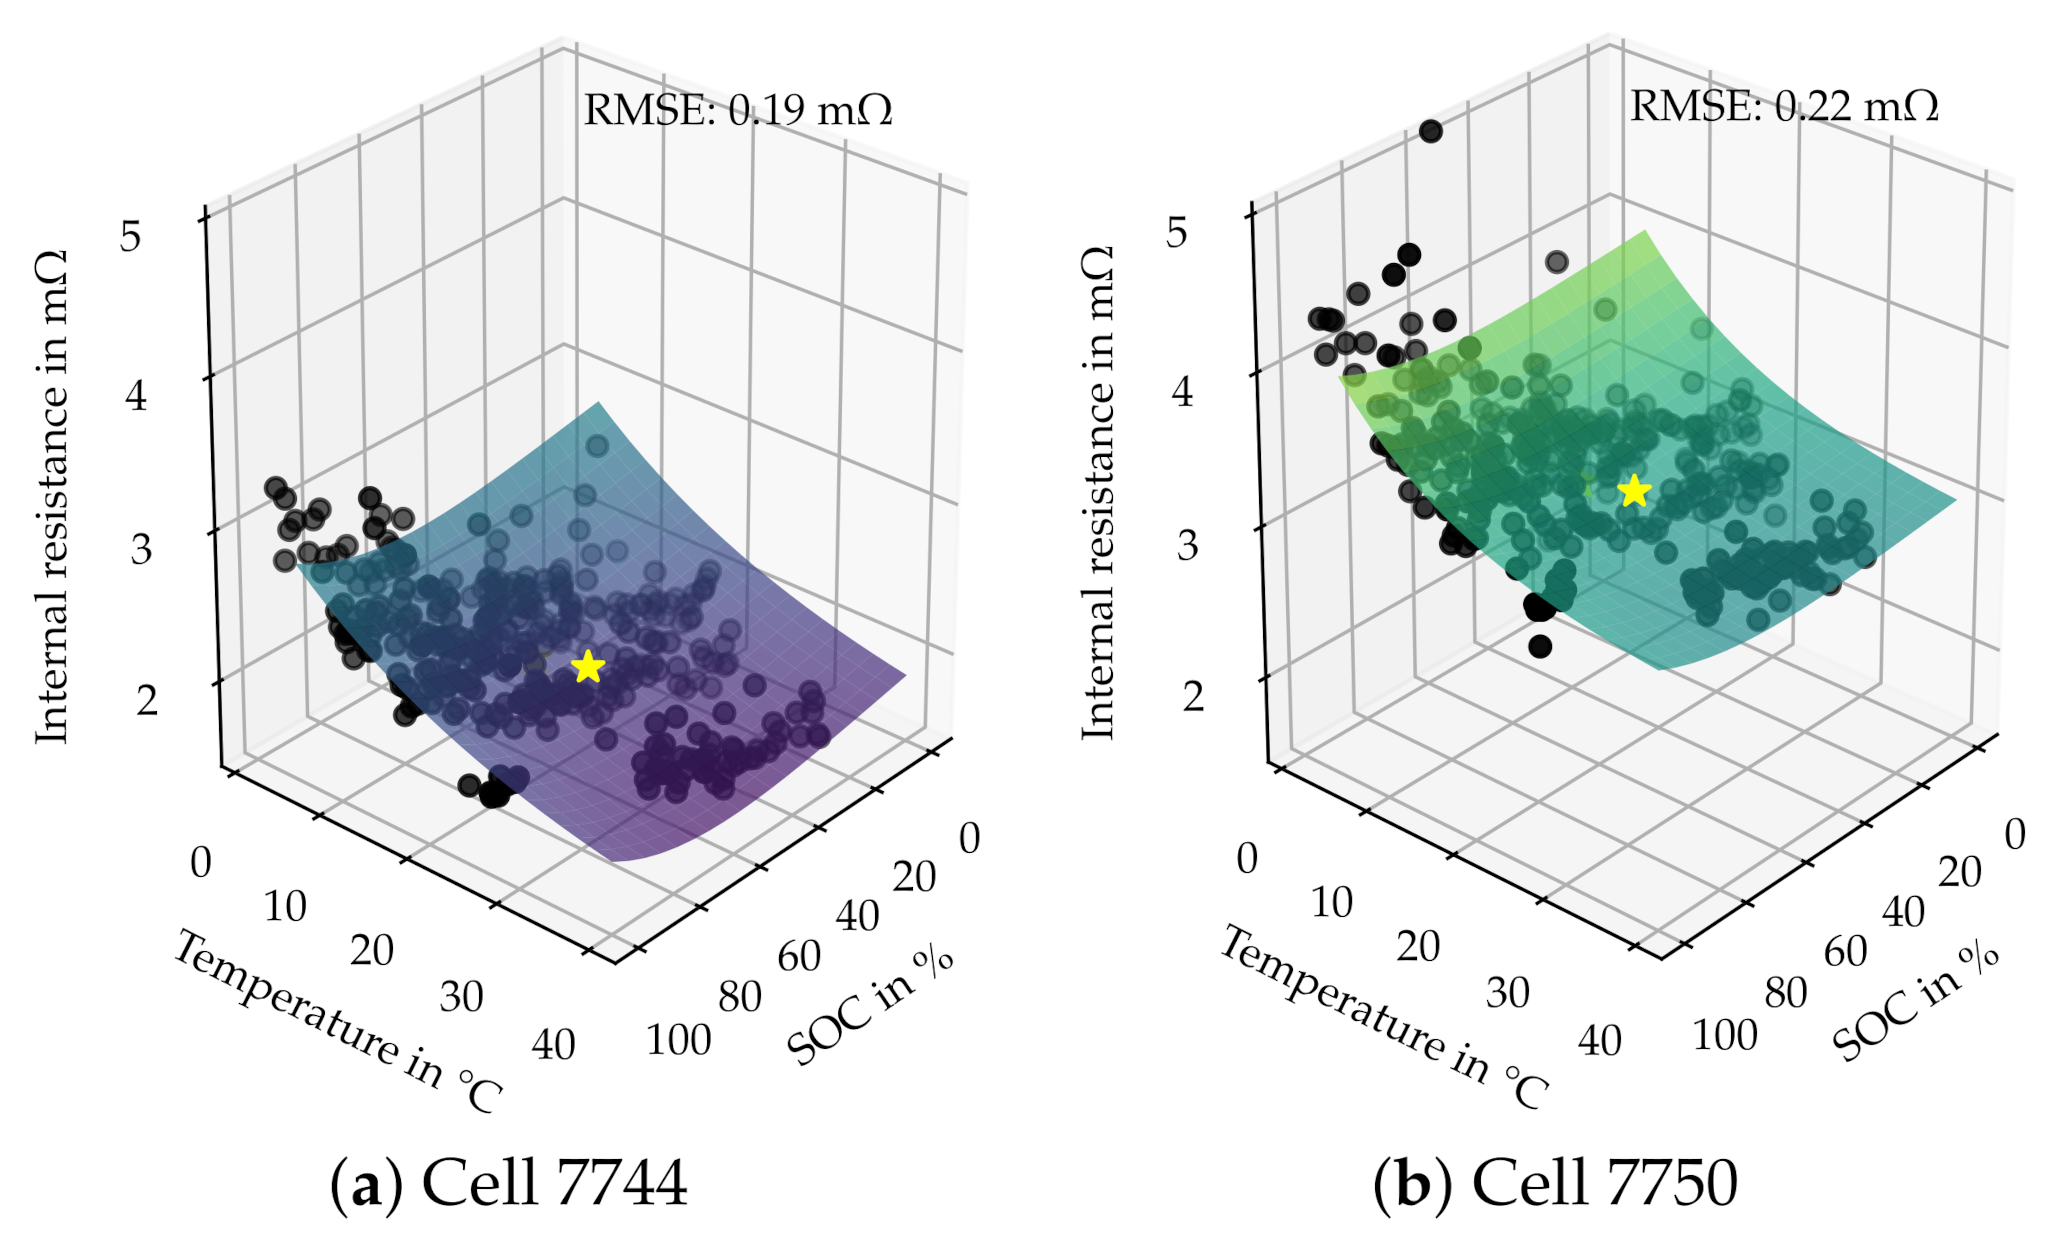
Figure 10 shows the inferred internal resistance of two exemplary cells. On average, the resistance is m with a standard deviation of m. The dependence of the resistance on the temperature is clearly visible, meaning that lower temperatures induce higher resistances. Cell 7744 represented by the lower box plots has a median resistance of m in the temperature range of 5 –10 . However, cell 7750 shows a significantly higher resistance of m in the same temperature window. These two cells were picked and measured more frequently than the others in order to get more data quickly. For the estimation of the resistance, cell 7744 has a total of 357 data points and cell 7750 has 364. The other cells in the pack are measured about 20 to 40 times. The upper part of Figure 11 shows the raw average resistance for all cells. To overcome missing data points in the temperature-SOC grid and with respect to calculate a comparable SOHr from the resistances, the samples for each cell are fitted again over the temperature and SOC range of their instant of recording. Figure 12 shows fits for cell 7744 and 7750, scoring a RMSE of m and m respectively. The at the reference point of cell 7744 is m with a confidence bandwidth of 2.0m–2.2m. Cell 7750 exhibits a of m with a confidence band of 3.1m–3.4m. The orange, x-shaped data points in the upper part of Figure 11 refer to the evaluation of this curve fit at the reference point of 18 and an SOC of 60 %. This reference point was chosen because most data points were recorded in this area, which gives the highest validity. Figure 13 shows the distribution of data points of cell 7744. We can see that most data are available around the chosen reference point.
The SOHr based on the internal resistance can now be calculated. The lower part of Figure 11 shows the SOHr for all cells. Negative values or values close to zero SOHr occur because we set the at 60% increase of . Other sources allow for a 200% increase [37], which would increase all SOHr. The average SOHr calculated from the cells is 64.3%. This result cannot be compared to the SOHc value, since there is no relationship between the chosen boundary resistances , and the capacity. The right side of Figure 11 shows the kde of both the resistance and the SOHr. Because SOHr results from the resistances, the densities follow the same shape. The average SOHr is 60.7% at a standard deviation of 29.8%.
5.5. Architecture of the Digital Twin Used
Working towards a digital battery twin, all the methods listed above were integrated into a modular cloud-based digital twin. This twin is modular in that one distinctive twin exists for each cell. All cell twins are assigned to an overall pack twin. In our approach, individual twins are specified by a database file of a certain type. Resources like models and aggregations react to the type of twin and are therefore shared among all twins.
Figure 14 shows the architecture of this system. To allow for scalability and connectivity, we are using the Amazon Web Services (AWS) cloud platform and a combination of infrastructure as a service (IAAS) and software as a service (SAAS). Using the AWS IoT Gateway as an SAAS to receive the incoming MQTT data, the raw messages are interpreted and saved to a MongoDB instance for further processing. We use an NoSQL database here because every digital twin is represented by a json-data structure. By using a file-based NoSQL database like MongoDB, these files can be stored directly in the database. Furthermore, this type of database is flexible in terms of changes to the database schema, compared to relational databases. During the life of a digital twin, unforeseeable changes might be necessary, hence this is a way to handle them.
A digital twin manager running in a docker environment (virtualization technique to create virtual machines) is in charge of directing the data sets into the respective digital twins and triggering the models and simulations by HTTP requests. All master data (static for the digital twins, for example, cell type) and all transaction data (e.g., measurements) are saved to the MongoDB with respect to their physical counterparts. Also model-generated state data (e.g., estimated ) is stored here.
The ECM and the charge analyzer are placed into docker containers interfaced by REST-application programming interfaces (APIs) and access the database directly.
An additional docker container calculates states from the values generated by the models. In this case, the state container takes the internal resistance and the capacity for each cell and calculates SOHr and SOHc and places these characteristics back in the twins database.
Through an access API, values of interest can be drawn from the twin system and continue to be used in further applications. The upper part of Figure 14 shows a usage in which the characteristics of one battery pack are presented in at a front end that communicates with the digital twin via the REST-API. The front end was developed in angular 8. In the upper part of the front end, general characteristics such as the topology of the battery pack or the cell chemistry are shown. A map helps to locate the pack, hence showing the last position of the vehicle. For the general state, the SOHc and SOHr are listed as well as capacity and the current temperature. The lower half of the front end shows the cell-individual SOHc and SOHr. By grouping all the cells into modules, and coloring them according to their SOH, the status can be evaluated and interpreted by humans at first glance.
This presentation may be the starting point for developing predictive maintenance applications or an interface for the workshop personal and the vehicle user, for example. Of course, it is not only possible to output the data at a front end but it can also be used in any other application that interfaces with the digital twin’s API.
6. Discussion
6.1. State Estimation Using Diagnostic Data
The state estimation of the battery in this work relies on the fact that cars make it possible to read the aforementioned data. For our test case, the VW e-Golf allows this approach in a way that makes the required data available and allows the diagnostics interface to be queried during driving. It has to be said, that with other brands, this approach might encounter obstacles and suffer from a lack of data. Also, the increasing tendency of OEMs to prohibit access to the car’s interfaces weakens this approach. However, in the future, there will be official ways to connect to these data and applications such as this might be developed in cooperation with OEMs.
If we rely solely on the data available from this distinctive diagnostic interface, no cell-individual temperature reading is available. All available temperatures behave similarly and seem to represent the general pack temperature. Since the internal resistance is highly dependent on the temperature, it is possible that those differences are induced by unequal distribution of heat in the battery pack. Nevertheless, the differences in between cell 7744 and 7750 are maintained over the whole tested temperature range, including when the car is started cold, when all cells exhibit the same temperature. Also, the measurement of the current is affected by the diagnostic interface. It is discretized into steps of A, which can yield significant errors when the signal is integrated. Calculations of the capacity and internal resistance are struck by this deficiency. Further problems originate from the diagnostic data with regard to timing. When a selected signal is queried, the answering controller has to receive, process and return the value to the sender. This process takes time and, unfortunately, there is no time stamp available from the moment when the measurement was recorded. Timing issues can be a problem for timing-critical methods like the fitting of the ECM.
Because there are only sensors fit to the parallel circuit of three cells, the true cell level cannot be in focus but only the intermediate parallely connected level.
For the calculation of a meaningful -based SOHr, an initial has to be known. For the test case given, we do not have this kind of for every cell, since we only started observing the car in the middle of its life. This makes it hard to calculate a meaningful SOHr for the individual cells. Still, one could estimate a relative change in SOHr from this point on. Using the average values of the battery packs from the INL tests and scaling them to cell level, we neglect the cell-individual . In the future, when digital twins of battery systems are widely established, one could use end-of-line tests of manufacturing lines to estimate a meaningful initial state of the battery system and its cells. Also, a complete state estimation from the first moment on could close this gap.
The method of estimating the internal resistance results in a high variance. Therefore, large sample amounts must be collected in order to achieve precise results. For this work, only two cells (7744 and 7750) were recorded at a high frequency, hence being recorded 30 times or more in the reference area. For them, the results seem plausible. Comparing the SOHr and SOHc for both, cell 7750 appears worse than cell 7744 in both metrics. Other cells show non-coherent behavior; one explanation for this may be the lack of data, especially when it comes to different environmental conditions or load profiles. When only one third the number of data points is used, the confidence interval width rises from m to m for cell 7744 and from m to m for cell 7750.
Because the estimation of the internal resistance is still lacking data for most cells, we use a constant internal resistance to subtract overvoltages in the capacity estimation. Thereby we neglect the influences of the internal resistance at this point, but also eliminate a source of variance which we cannot control yet due to missing data.
The lack of the exact OCV characteristic of the e-Golf cell leads to problems calculating the capacity of the cells. By using the original one, further sources of uncertainty could be ruled out.
Another source of uncertainty comes from the cell contacting. Our method neglects the inhomogenities in cell contact resistance as we have no way to quantify it. Still, a higher contact resistance would lead to higher temperatures, accelerated aging and, in turn, higher internal resistance.
Since we cannot measure the estimated states directly, the data generated cannot be validated. However, the identified capacities are in accordance with literature. We determine the remaining capacity at approximately 35,000 km to be Ah. From five e-Golfs, the INL finds an average remaining capacity of Ah after approx. 20,000 km [31,38,39,40]. The lower capacity even after less mileage can be explained by the measurement method. The INL tracks the battery during chassis dynamometer measurements. The measurement ends if the car battery is depleted. Safety margins, however, are not included. With our method using the battery’s voltage and current, we are not limited to the vehicle’s implemented safety threshold, therefore the unbounded remaining capacity remains. In addition, climate and driving profiles might differ.
Because we have no link between the cell ID and the physical position in the battery pack, we cannot virtually aggregate cells in modules. The assumption that the cells in one module share a specific temperature and are therefore similar in characteristics cannot be tested. For future work, a physical reverse engineering and disassembling of the pack would be desirable.
6.2. Digital Twin Architecture
The approach to setting up a digital battery twin presented here serves as a proof of concept that an online cloud-based state estimation from vehicle data and IoT-connection is possible. Furthermore, it indicates that the required elements are the database, interfaces and models for estimating resistances and capacities. To maintain a fleet of digital twins, that is, several cars and all individual cells in the respective battery packs, a digital twin management system is needed. However, even if the presented architecture has already been set up with scalability in mind, it can be optimized. By accepting a certain degree of vendor lock-in, existing cloud vendor services might be used in a production-ready system. Also, the choice of using python to run the computationally intensive optimization models is not the most efficient approach. In the research setting, however, this approach yields flexible development processes and timely results.
If the data logger is dependant on feedback from the cloud, for example, to know when to move on to the next cell, it is elementary, that the logger is online at all times. We think that future connectivity with 5G in mind will allow permanent online ability.
Further research must be undertaken towards the long-lasting recording of for example, internal resistances and their normalization, for example, due to seasonal variations and their presentation to the end user.
7. Conclusions
In this work, we show a holistic data pipeline from the raw vehicle data to a cloud-based digital twin estimating the vehicle’s battery state, and present the information to stakeholders. To allow for a general approach, we use diagnostic data as an input for our algorithms. With the help of reverse engineering, we identify protocols and IDs of the vehicle’s interface. This process needs to be carried out again for a further vehicle but the downstream processes are then decoupled and take place in the cloud environment. We find that the data logging has certain limitations, for example, a maximum sample rate of 9 Hz for two quasi-parallel requests. However, by rotating recording, we still manage to observe all cell blocks. An OBD data logger developed at the institute is capable of recording the presented types of data and interfacing to remote servers.
Working towards a digital battery twin, we can conclude that certain knowledge about the built-in cell characteristics, for example, the OCV relationship, cell contacting and topology, are of crucial importance. Digital twins will have to provide this information in the future in order to allow for digital twin-based state estimation. Furthermore, it is necessary to divide the digital twin, and with it the data sets, into pack, module and cell level because scaling between these levels always comes with trade offs in terms of accuracy.
In conclusion, the results of internal resistances and capacities of the case study seem coherent and comparable to other findings in literature. A further learning from this work is that lengthy data collection is needed to give statistically sound predictions for the internal resistance within a certain level of significance. Reducing the data points by a third, the confidence intervals rise by 50%. The sheer volume of data, however, is manageable.
Supplementary Materials
The following are available online at https://0-www-mdpi-com.brum.beds.ac.uk/2313-0105/7/1/15/s1.
Author Contributions
Conceptualization, L.M.; methodology, L.M. and M.P.; software, L.M., F.S. and M.P.; formal analysis, L.M., M.P.; investigation, L.M., M.P.; data curation, L.M., M.P.; writing—original draft preparation, L.M., M.P., F.S.; writing—review and editing, L.M.; visualization, L.M.; supervision, L.M.; All authors have read and agreed to the published version of the manuscript.
Funding
The research of L.M. was funded by DRÄXLMAIER and the Technical University of Munich.
Institutional Review Board Statement
Not applicable.
Informed Consent Statement
Not applicable.
Data Availability Statement
The source code of the equivalent circuit model is publicly available under this repository: https://github.com/TUMFTM/2RC_ECM. The raw data presented in this study are openly available [INSERT-LINK-TO-MDPI-SUPPL.MATERIAL].
Conflicts of Interest
The authors declare no conflict of interest.
Abbreviations
The following abbreviations are used in this manuscript:
| SOHr | State of health (Resistance) |
| SOHc | State of health (Capacity) |
| SOH | State of Health |
| SAAS | Software as a service |
| IAAS | Infrastructure as a service |
| paas | Platform as a service |
| API | Application programming interface |
| API | Application programming interfaces |
| dod | Depth of discharge |
| INL | Idaho National Laboratory |
| uds | Unified diagnostic services |
| OCV | Open circuit voltage |
| ECM | Equivalent circuit model |
| AWS | Amazon Web Services |
| OBD | On-board diagnosis |
| SOC | State of charge |
| EOL | End of life |
| BOL | Begin of life |
| RMSE | Root mean squared error |
| isotp | ISO 15765-2 Transport protocol for automotive bus systems |
| gnss | Global navigation satellite system |
| MQTT | Message queuing telemetry transport |
| iot | Internet of things |
| kde | Kernel density estimation |
| OEM | Original equipment manufacturers |
| BEV | Battery electric vehicle |
| HEV | Hybrid electric vehicle |
| bms | Battery management system |
References
- Europäische Union. Verordnung (EU) 2019/631 des Europäischen Parlaments und des Rates vom 17. April 2019 zur Festsetzung von CO2-Emissionsnormen für neue Personenkraftwagen und für neue Leichte Nutzfahrzeuge und zur Aufhebung der Verordnungen (EG) Nr. 443/2009 und (EU) Nr. 510/2011: (EU) 2019/631. Available online: https://eur-lex.europa.eu/legal-content/DE/TXT/PDF/?uri=CELEX:32019R0631&from=ES (accessed on 5 December 2020).
- Küpper, D.; Kuhlmann, K.; Wolf, S.; Pieper, C.; Xu, G.; Ahmad, J. The Future of Battery Production in Electric Vehicles. Available online: https://www.bcg.com/publications/2018/future-battery-production-electric-vehicles (accessed on 5 December 2020).
- Korthauer, R. (Ed.) Handbuch Lithium-Ionen-Batterien; Springer: Berlin/Heidelberg, Germany, 2013. [Google Scholar] [CrossRef]
- Li, B.; Bei, S. Estimation algorithm research for lithium battery SOC in electric vehicles based on adaptive unscented Kalman filter. Neural Comput. Appl. 2019, 31, 8171–8183. [Google Scholar] [CrossRef]
- Pattipati, B.; Balasingam, B.; Avvari, G.V.; Pattipati, K.R.; Bar-Shalom, Y. Open circuit voltage characterization of lithium-ion batteries. J. Power Sources 2014, 269, 317–333. [Google Scholar] [CrossRef]
- Jeon, S.; Yun, J.J.; Bae, S. Comparative study on the battery state-of-charge estimation method. Indian J. Sci. Technol. 2015, 8, 1–6. [Google Scholar] [CrossRef]
- Windarko, N.A.; Choi, J. LiPB battery soc estimation using extended Kalman filter improved with variation of single dominant parameter. J. Power Electron. 2012, 12, 40–48. [Google Scholar] [CrossRef] [Green Version]
- Piller, S.; Perrin, M.; Jossen, A. Methods for state-of-charge determination and their applications. J. Power Sources 2001, 96, 113–120. [Google Scholar] [CrossRef]
- Tipping, M.E. Sparse Bayesian Learning and the Relevance Vector Machine. J. Mach. Learn. Res. 2001, 1, 211–244. [Google Scholar] [CrossRef] [Green Version]
- Brill, M. Entwicklung und Implementierung einer neuen Onboard-Diagnosemethode für Lithium-Ionen-Fahrzeugbatterien: Dissertation; Verkehrstechnik/Fahrzeugtechnik; VDI Verlag GmbH: Düsseldorf, Germany, 2012; Volume 755. [Google Scholar]
- Roscher, M. Zustandserkennung von LiFePO4-Batterien für Hybrid- und Elektrofahrzeuge: Dissertation; Aachener Beiträge des ISEA; Shaker Verlag: Aachen, Germany, 2011; Volume 54. [Google Scholar]
- Shah, F.A.; Shahzad Sheikh, S.; Mir, U.I.; Owais Athar, S. Battery Health Monitoring for Commercialized Electric Vehicle Batteries: Lithium-Ion. In Proceedings of the 5th International Conference on Power Generation Systems and Renewable Energy Technologies, Istanbul, Turkey, 26–27 August 2019. [Google Scholar] [CrossRef]
- Farmann, A.; Waag, W.; Marongiu, A.; Sauer, D.U. Critical review of on-board capacity estimation techniques for lithium-ion batteries in electric and hybrid electric vehicles. J. Power Sources 2015, 281, 114–130. [Google Scholar] [CrossRef]
- Xiong, R.; Zhang, Y.; Wang, J.; He, H.; Peng, S.; Pecht, M. Lithium-Ion Battery Health Prognosis Based on a Real Battery Management System Used in Electric Vehicles. IEEE Trans. Veh. Technol. 2019, 68, 4110–4121. [Google Scholar] [CrossRef]
- Klass, V. Battery Health Estimation in Electric Vehicles. Ph.D. Thesis, KTH, Stockholm, Sweden, 2015. Available online: https://www.diva-portal.org/smash/get/diva2:853550/FULLTEXT01.pdf (accessed on 5 December 2020).
- Bohlen, O.; Hammouche, A.; Sauer, D. Impedanzbasierte Zustandsdiagnose fur Energiespeicher in Automobilen. Tech. Mitteilungen 2006, 99, 88–95. Available online: https://www.researchgate.net/publication/260020125_Impedanzbasierte_Zustandsdiagnose_fur_Energiespeicher_in_Automobilen (accessed on 5 December 2020).
- Balagopal, B.; Chow, M.Y. The State of the Art Approaches to Estimate the State of Health (SOH) and State of Function (SOF) of Lithium Ion Batteries. In Proceedings of the 2015 IEEE 13th International Conference on Industrial Informatics (INDIN), Cambridge, UK, 22–24 July 2015; pp. 1302–1307. [Google Scholar] [CrossRef]
- Zimmermann, W.; Schmidgall, R. Bussysteme in der Fahrzeugtechnik: Protokolle, Standards und Softwarearchitektur, 5., aktual. und erw. aufl. ed.; ATZ/MTZ-Fachbuch; Springer Vieweg: Wiesbaden, Germany, 2014. [Google Scholar] [CrossRef]
- Supke, J.; Zimmermann, W. Diagnosesysteme im Automobil: Transport- & Diagnoseprotokolle. Available online: http://www.emotive.de/documents/WebcastsProtected/Transport-Diagnoseprotokolle.pdf (accessed on 5 December 2020).
- Kunze, S. On-Board Fahrzeugdiagnose. Available online: https://tu-dresden.de/ing/informatik/ti/vlsi/ressourcen/dateien/dateien_studium/dateien_lehstuhlseminar/vortraege_lehrstuhlseminar/hs_ss05_pdf/steffen_kunze.pdf?lang=de (accessed on 5 December 2020).
- Grieves, M. Digital Twin: Manufacturing Excellence through Virtual Factory Replication This Paper Introduces the Concept of a A Whitepaper by Dr. Michael Grieves. White Paper. 2014. Available online: https://www.researchgate.net/publication/275211047_Digital_Twin_Manufacturing_Excellence_through_Virtual_Factory_Replication (accessed on 5 December 2020).
- Jones, D.; Snider, C.; Nassehi, A.; Yon, J.; Hicks, B. Characterising the Digital Twin: A systematic literature review. CIRP J. Manuf. Sci. Technol. 2020. [Google Scholar] [CrossRef]
- Baumann, M.; Rohr, S.; Lienkamp, M. Cloud-connected battery management for decision making on second-life of electric vehicle batteries. In Proceedings of the 2018 Thirteenth International Conference on Ecological Vehicles and Renewable Energies (EVER), Monte Carlo, Monaco, 10–12 April 2018; pp. 1–6. [Google Scholar] [CrossRef]
- Self-Study Programme 530: The e-Golf. Available online: https://vwgpaintandbody.co.uk/wp-content/uploads/Volkswagen-e-golf.pdf (accessed on 5 December 2020).
- Rahimzei, E.; Sann, K.; Vogel, M. Kompendium: Li-Ionen-Batterien: Grundlagen, Bewertungskriterien, Gesetze und Normen. 2015. Available online: https://www.dke.de/resource/blob/933404/3d80f2d93602ef58c6e28ade9be093cf/kompendium-li-ionen-batterien-data.pdf (accessed on 5 December 2020).
- Idaho National Laboratory. 2015 Volkswagen e-Golf Advanced Vehicle Testing—Baseline Vehicle Testing Results. 2016; pp. 1–5. Available online: https://avt.inl.gov/sites/default/files/pdf/fsev/fact2140egolf2015.pdf (accessed on 5 December 2020).
- Hochvoltbatteriesystem im e-Golf. 2014. Available online: https://www.volkswagen-newsroom.com/de/batterie-3634 (accessed on 25 April 2020).
- Karger, A.; Wildfeuer, L.; Maheshwari, A.; Wassiliadis, N.; Lienkamp, M. Novel method for the on-line estimation of low-frequency impedance of lithium-ion batteries. J. Energy Storag. 2020, 32, 101818. [Google Scholar] [CrossRef]
- Auto-Intern GmbH. Was Ist VCDS? Available online: https://www.vcds.de/ueber-vcds/ueber-vcds (accessed on 4 February 2020).
- Shen, P.; Ouyang, M.; Lu, L.; Li, J. State of Charge, State of Health and State of Funktion Co-estimation of Lithium-ion Batteries for Electric Vehicles. In Proceedings of the 2016 IEEE Vehicle Power and Propulsion Conference (VPPC), Hangzhou, China, 17–20 October 2016. [Google Scholar] [CrossRef]
- Volkswagen E-Golf—VIN 2012. 2017. Available online: https://avt.inl.gov/sites/default/files/pdf/fsev/batteryEGolf2012.pdf (accessed on 26 November 2020).
- Brand, M.J.; Berg, P.; Kolp, E.I.; Bach, T.; Schmidt, P.; Jossen, A. Detachable electrical connection of battery cells by press contacts. J. Energy Storage 2016, 8, 69–77. [Google Scholar] [CrossRef]
- Virtanen, P.; Gommers, R.; Oliphant, T.E.; Haberland, M.; Reddy, T.; Cournapeau, D.; Burovski, E.; Peterson, P.; Weckesser, W.; Bright, J.; et al. SciPy 1.0: Fundamental Algorithms for Scientific Computing in Python. Nat. Methods 2020, 17, 261–272. [Google Scholar] [CrossRef] [Green Version]
- Adermann, J.; Kreibich, J.; Lienkamp, M. Experimental Study of Energy Consumption Variation in Recurring Driving Trips. J. Electr. Eng. 2017, 5. [Google Scholar] [CrossRef] [Green Version]
- Park, S.; Savvides, A.; Srivastava, M. Battery capacity measurement and analysis using lithium coin cell battery. In Proceedings of the 2001 International Symposium on Low Power Electronics and Design—ISLPED ’01, Huntington Beach, CA, USA, 6–7 August 2001; ACM Press: New York, NY, USA, 2001; pp. 382–387. [Google Scholar] [CrossRef] [Green Version]
- Zhang, L.; Peng, H.; Ning, Z.; Mu, Z.; Sun, C. Comparative research on RC equivalent circuit models for lithium-ion batteries of electric vehicles. Appl. Sci. 2017, 7, 2. [Google Scholar] [CrossRef] [Green Version]
- Zenati, A.; Desprez, P.; Razik, H.; Rael, S. A methodology to assess the state of health of lithium-ion batteries based on the battery’s parameters and a fuzzy logic system. In Proceedings of the 2012 IEEE International Electric Vehicle Conference—IEVC, Greenville, SC, USA, 4–8 March 2012. [Google Scholar] [CrossRef]
- Volkswagen E-Golf—VIN 6525. 2017. Available online: https://avt.inl.gov/sites/default/files/pdf/fsev/batteryEGolf6525.pdf (accessed on 26 November 2020).
- Volkswagen E-Golf—VIN 5818. 2017. Available online: https://avt.inl.gov/sites/default/files/pdf/fsev/batteryEGolf5818.pdf (accessed on 26 November 2020).
- Volkswagen E-Golf—VIN 2140. 2017. Available online: https://avt.inl.gov/sites/default/files/pdf/fsev/batteryEGolf2140.pdf (accessed on 26 November 2020).
Figure 1.
Setup for data acquisition (green: test kit, black OBD logger) and reverse engineering wiring (blue).
Figure 1.
Setup for data acquisition (green: test kit, black OBD logger) and reverse engineering wiring (blue).

Figure 2.
The measurement cycle for one cell is made up of three phases. One-shot measurements enclose the time series of one specific cell voltage and current measurement.
Figure 2.
The measurement cycle for one cell is made up of three phases. One-shot measurements enclose the time series of one specific cell voltage and current measurement.

Figure 3.
Toolchain to acquire and process the OBD data in a cloud-based digital twin and display on a web front end.
Figure 3.
Toolchain to acquire and process the OBD data in a cloud-based digital twin and display on a web front end.

Figure 4.
Used ECM containing two RC elements and a SOC-dependant OCV. All parameters in the schema are estimated using least-squares method. and the current serve as reference for the fit.
Figure 4.
Used ECM containing two RC elements and a SOC-dependant OCV. All parameters in the schema are estimated using least-squares method. and the current serve as reference for the fit.

Figure 5.
Charging measurement of all cells in the vehicle. Due to cell rotation, we record each cell once every 250 s. We can see that in the lower SOC region deviations are highest.
Figure 5.
Charging measurement of all cells in the vehicle. Due to cell rotation, we record each cell once every 250 s. We can see that in the lower SOC region deviations are highest.

Figure 6.
(Left side): All e-Golf cells with their start and end voltage of the charging process, sorted by the start voltage. (Right side): Histogram of the start voltages. The distribution is skewed to the right, indicating a surplus of cells with lower depth of discharge (dod).
Figure 6.
(Left side): All e-Golf cells with their start and end voltage of the charging process, sorted by the start voltage. (Right side): Histogram of the start voltages. The distribution is skewed to the right, indicating a surplus of cells with lower depth of discharge (dod).

Figure 7.
All cells and their capacities derived from one charging record.

Figure 8.
The inferred resistances of all cells as indicated by the color, plotted over the environmental variables SOC and temperature.
Figure 8.
The inferred resistances of all cells as indicated by the color, plotted over the environmental variables SOC and temperature.

Figure 9.
Example fitting result of one 30 s cycle measurement. A RMSE of mV indicates a good model fit with the original data. Positive currents correspond to a discharge of the battery.
Figure 9.
Example fitting result of one 30 s cycle measurement. A RMSE of mV indicates a good model fit with the original data. Positive currents correspond to a discharge of the battery.

Figure 10.
Internal resistance for cell 7744 and 7750 over the temperature. As expected, lower temperatures yield to higher impedance.
Figure 10.
Internal resistance for cell 7744 and 7750 over the temperature. As expected, lower temperatures yield to higher impedance.

Figure 11.
(Top): Internal resistance of all cells. The raw values are the average values of all samples passed through the ECM. The model data are the results of the ECM fitted over SOC and temperature, and evaluated at 18 and a SOC of 60%. (Bottom): SOHr of the cells. The SOHr cannot be compared to the SOHc. Reference for SOHr: at 60% increase of . On the right side, we show the kernel density estimation (kde) of the internal resistance and the resulting SOHr.

Figure 12.
Curve fit of all samples of cell 7744 and 7750 over temperature and SOC. The SOC-axis is modeled by a polynomial and the temperature axis is modeled by an exponential relationship as Equation (2) shows. The reference point is marked in yellow.
Figure 12.
Curve fit of all samples of cell 7744 and 7750 over temperature and SOC. The SOC-axis is modeled by a polynomial and the temperature axis is modeled by an exponential relationship as Equation (2) shows. The reference point is marked in yellow.

Figure 13.
Distribution of all data points in the temperature-SOC plane.

Figure 14.
Architecture of the digital twin system. For this work, the system was hosted in the AWS cloud. Individual twins share the same resources as models, aggregators and APIs. In the upper part, the front end shows the results to the user. In total, 88 cell-blocks consisting of three parallelly connected cells can be observed.


Table 1.
Suitability of the methods for determining the state of health via the on board diagnosis (OBD) interface during real operation.
Table 1.
Suitability of the methods for determining the state of health via the on board diagnosis (OBD) interface during real operation.
| Method | Used | Comment |
|---|---|---|
| State of charge | ||
| Circuit principle methods | Yes | Using OCV in reverse discharge test |
| Filter methods | Yes | No parametrized model. Fit-model-corrected OCV-method used |
| Data-driven methods | No | Not enough data for learning |
| State of health | ||
| Discharge test | Yes | Ampere counting used for capacity estimation |
| Measurement of quiescent voltage characteristic | No | No measurement of quiescent charac. possible |
| Internal resistance method | Yes | Estimate using ECM fit |
| Impedance spectroscopy | No | No online suitability |
| Chemical analysis | No | Can’t destroy cells |
| Model-based methods | No | Neither model of stress factors nor data available |
| Measurement of intracellular pressure | No | No online suitability |
Table 2.
UDS IDs for the used labels and factors to convert raw measurements ot physically meaningful values. These IDs can be queried from the battery management controller.
Table 2.
UDS IDs for the used labels and factors to convert raw measurements ot physically meaningful values. These IDs can be queried from the battery management controller.
| Signal | UDS ID | Calculation | Description |
|---|---|---|---|
| HV current | 0x1E3D | value | Current through the battery pack |
| HV voltage | 0x1E3B | value | Voltage of the battery pack |
| HV temperature | 0x2A0B | value | Temperature of the battery pack |
| SOC | 0x028C | value | SOC of the battery pack |
| Voltage cell 1 | 0x1E40 | value | This is the base address for the cell voltages. Increment for following cells. |
| Any tuple can be recorded at an approx. 5 Hz to 9 Hz rate. | |||
Publisher’s Note: MDPI stays neutral with regard to jurisdictional claims in published maps and institutional affiliations. |
© 2021 by the authors. Licensee MDPI, Basel, Switzerland. This article is an open access article distributed under the terms and conditions of the Creative Commons Attribution (CC BY) license (http://creativecommons.org/licenses/by/4.0/).
Share and Cite
MDPI and ACS Style
Merkle, L.; Pöthig, M.; Schmid, F. Estimate e-Golf Battery State Using Diagnostic Data and a Digital Twin. Batteries 2021, 7, 15. https://0-doi-org.brum.beds.ac.uk/10.3390/batteries7010015
AMA Style
Merkle L, Pöthig M, Schmid F. Estimate e-Golf Battery State Using Diagnostic Data and a Digital Twin. Batteries. 2021; 7(1):15. https://0-doi-org.brum.beds.ac.uk/10.3390/batteries7010015
Chicago/Turabian StyleMerkle, Lukas, Michael Pöthig, and Florian Schmid. 2021. "Estimate e-Golf Battery State Using Diagnostic Data and a Digital Twin" Batteries 7, no. 1: 15. https://0-doi-org.brum.beds.ac.uk/10.3390/batteries7010015
Note that from the first issue of 2016, this journal uses article numbers instead of page numbers. See further details here.