Article

Thermophysical Characterization of a Layered P2 Type Structure Na0.53MnO2 Cathode Material for Sodium Ion Batteries

Karlsruhe Institute of Technology, Institute for Applied Materials-Applied Materials Physics, Hermann-von-Helmholtz-Platz 1, 76344 Eggenstein-Leopoldshafen, Germany
*
Author to whom correspondence should be addressed.
Submission received: 28 January 2021 / Revised: 17 February 2021 / Accepted: 18 February 2021 / Published: 1 March 2021

Abstract

:
Over the last decade, the demand for safer batteries with excellent performance and lower costs has been intensively increasing. The abundantly available precursors and environmental friendliness are generating more and more interest in sodium ion batteries (SIBs), especially because of the lower material costs compared to Li-ion batteries. Therefore, significant efforts are being dedicated to investigating new cathode materials for SIBs. Since the thermal characterization of cathode materials is one of the key factors for designing safe batteries, the thermophysical properties of a commercial layered P2 type structure Na0.53MnO2 cathode material in powder form were measured in the temperature range between −20 and 1200 °C by differential scanning calorimetry (DSC), laser flash analysis (LFA), and thermogravimetry (TG). The thermogravimetry (TG) was combined with mass spectrometry (MS) to study the thermal decomposition of the cathode material with respect to the evolved gas analysis (EGA) and was performed from room temperature up to 1200 °C. The specific heat (Cp) and the thermal diffusivity (α) were measured up to 400 °C because beyond this temperature, the cathode material starts to decompose. The thermal conductivity (λ) as a function of temperature was calculated from the thermal diffusivity, the specific heat capacity, and the density. Such thermophysical data are highly relevant and important for thermal simulation studies, thermal management, and the mitigation of thermal runaway.

1. Introduction

In recent decades, sodium ion batteries (SIBs) have attracted interest as energy storage for large-scale grids at ambient temperature, because of the cost effectiveness and the abundance of sodium minerals in the earth’s crust. Among the different electrode materials, the layered sodium transition metal oxides materials have drawn significant attention as promising cathode materials for SIBs [1,2,3]. Compared to other energy storage devices, the cathode component plays an essential role in determining the electrochemical characteristics, safety, and of course costs of SIBs. The P2 and O3-type layered structure cathode materials are classified as one of the potential grade for SIBs due to their considerable specific capacities, their broad range of working voltage, and their easy synthesis processes [4]. In contrast to O3-type materials, P2-type cathodes have prismatic path slides advantages, which expedite fast sodium-ion diffusion by indicating high-rate capabilities [5]. Nevertheless, they usually suffer from phase transition from P2 to O2 owing to the slipping of metal oxide to the octahedral phase when Na-ions are extracted. This phenomenon leads to remarkable changes in the crystal volume, which cause a reduction of the reversible capacity [6].
Thermal stability of the cathode materials is the major concern in terms of upscaling and energy storage applications. Considering the high activity of sodium metal, sodium ion batteries are suspected to be less safe [7] than Li-ion batteries because of the earlier melting point of the pure metal. Several studies [8,9,10,11,12,13] have been executed to measure the thermophysical properties of the lithium-based cathode materials as a function of the temperatures that usually are used in lithium-ion batteries production. Lim et al. [14], Jin et al. [15], and Zhang et al. [16] have investigated the thermal stability of a sodium-based cathode material (NASICON) along with electrochemical performance, but detailed thermal characterizations are still missing. Zhao et al. [17] investigated the thermal properties of an α-NaFeO2 cathode for SIBs in combination with a liquid electrolyte and showed the reaction kinetics with different amounts of liquid electrolyte. Kobayashi et al. [18] recently determined the temperature-dependent lattice constant, thermal expansion, and z-coordinates of P2- and O3-type NaxMO2 cathode material. Bak et al. [19] studied the thermal stability of charged Na1-xMO2 cathode materials, which allows simultaneous observation of the structural changes and gas species, especially O2 gas, that are evolved during the thermal decomposition of charged cathode materials. Detailed thermal characterization of the layered structure sodium cathode material is still of interest.
The importance of the thermal properties of materials in case of heat removal has become a crucial issue for continuing progress in the electronic industry owing to increased levels of dissipated power. Therefore, the investigation of thermal properties of Na-based cathode materials is important for the development and practical application of SIBs. Hence, in this work, the thermal stability of a commercial P2 type structure Na0.53MnO2 cathode material was investigated over a large temperature range, and thermal properties such as specific heat capacity and thermal conductivity were determined by various thermo-analytical techniques. The thermophysical data, which were generated by this research, will be highly relevant and important in terms of thermal simulation and thermal runaway experiments. Based on these input, reaction mechanisms during thermal runaway can be predicted in a more accurate and detailed manner.

2. Results and Discussion

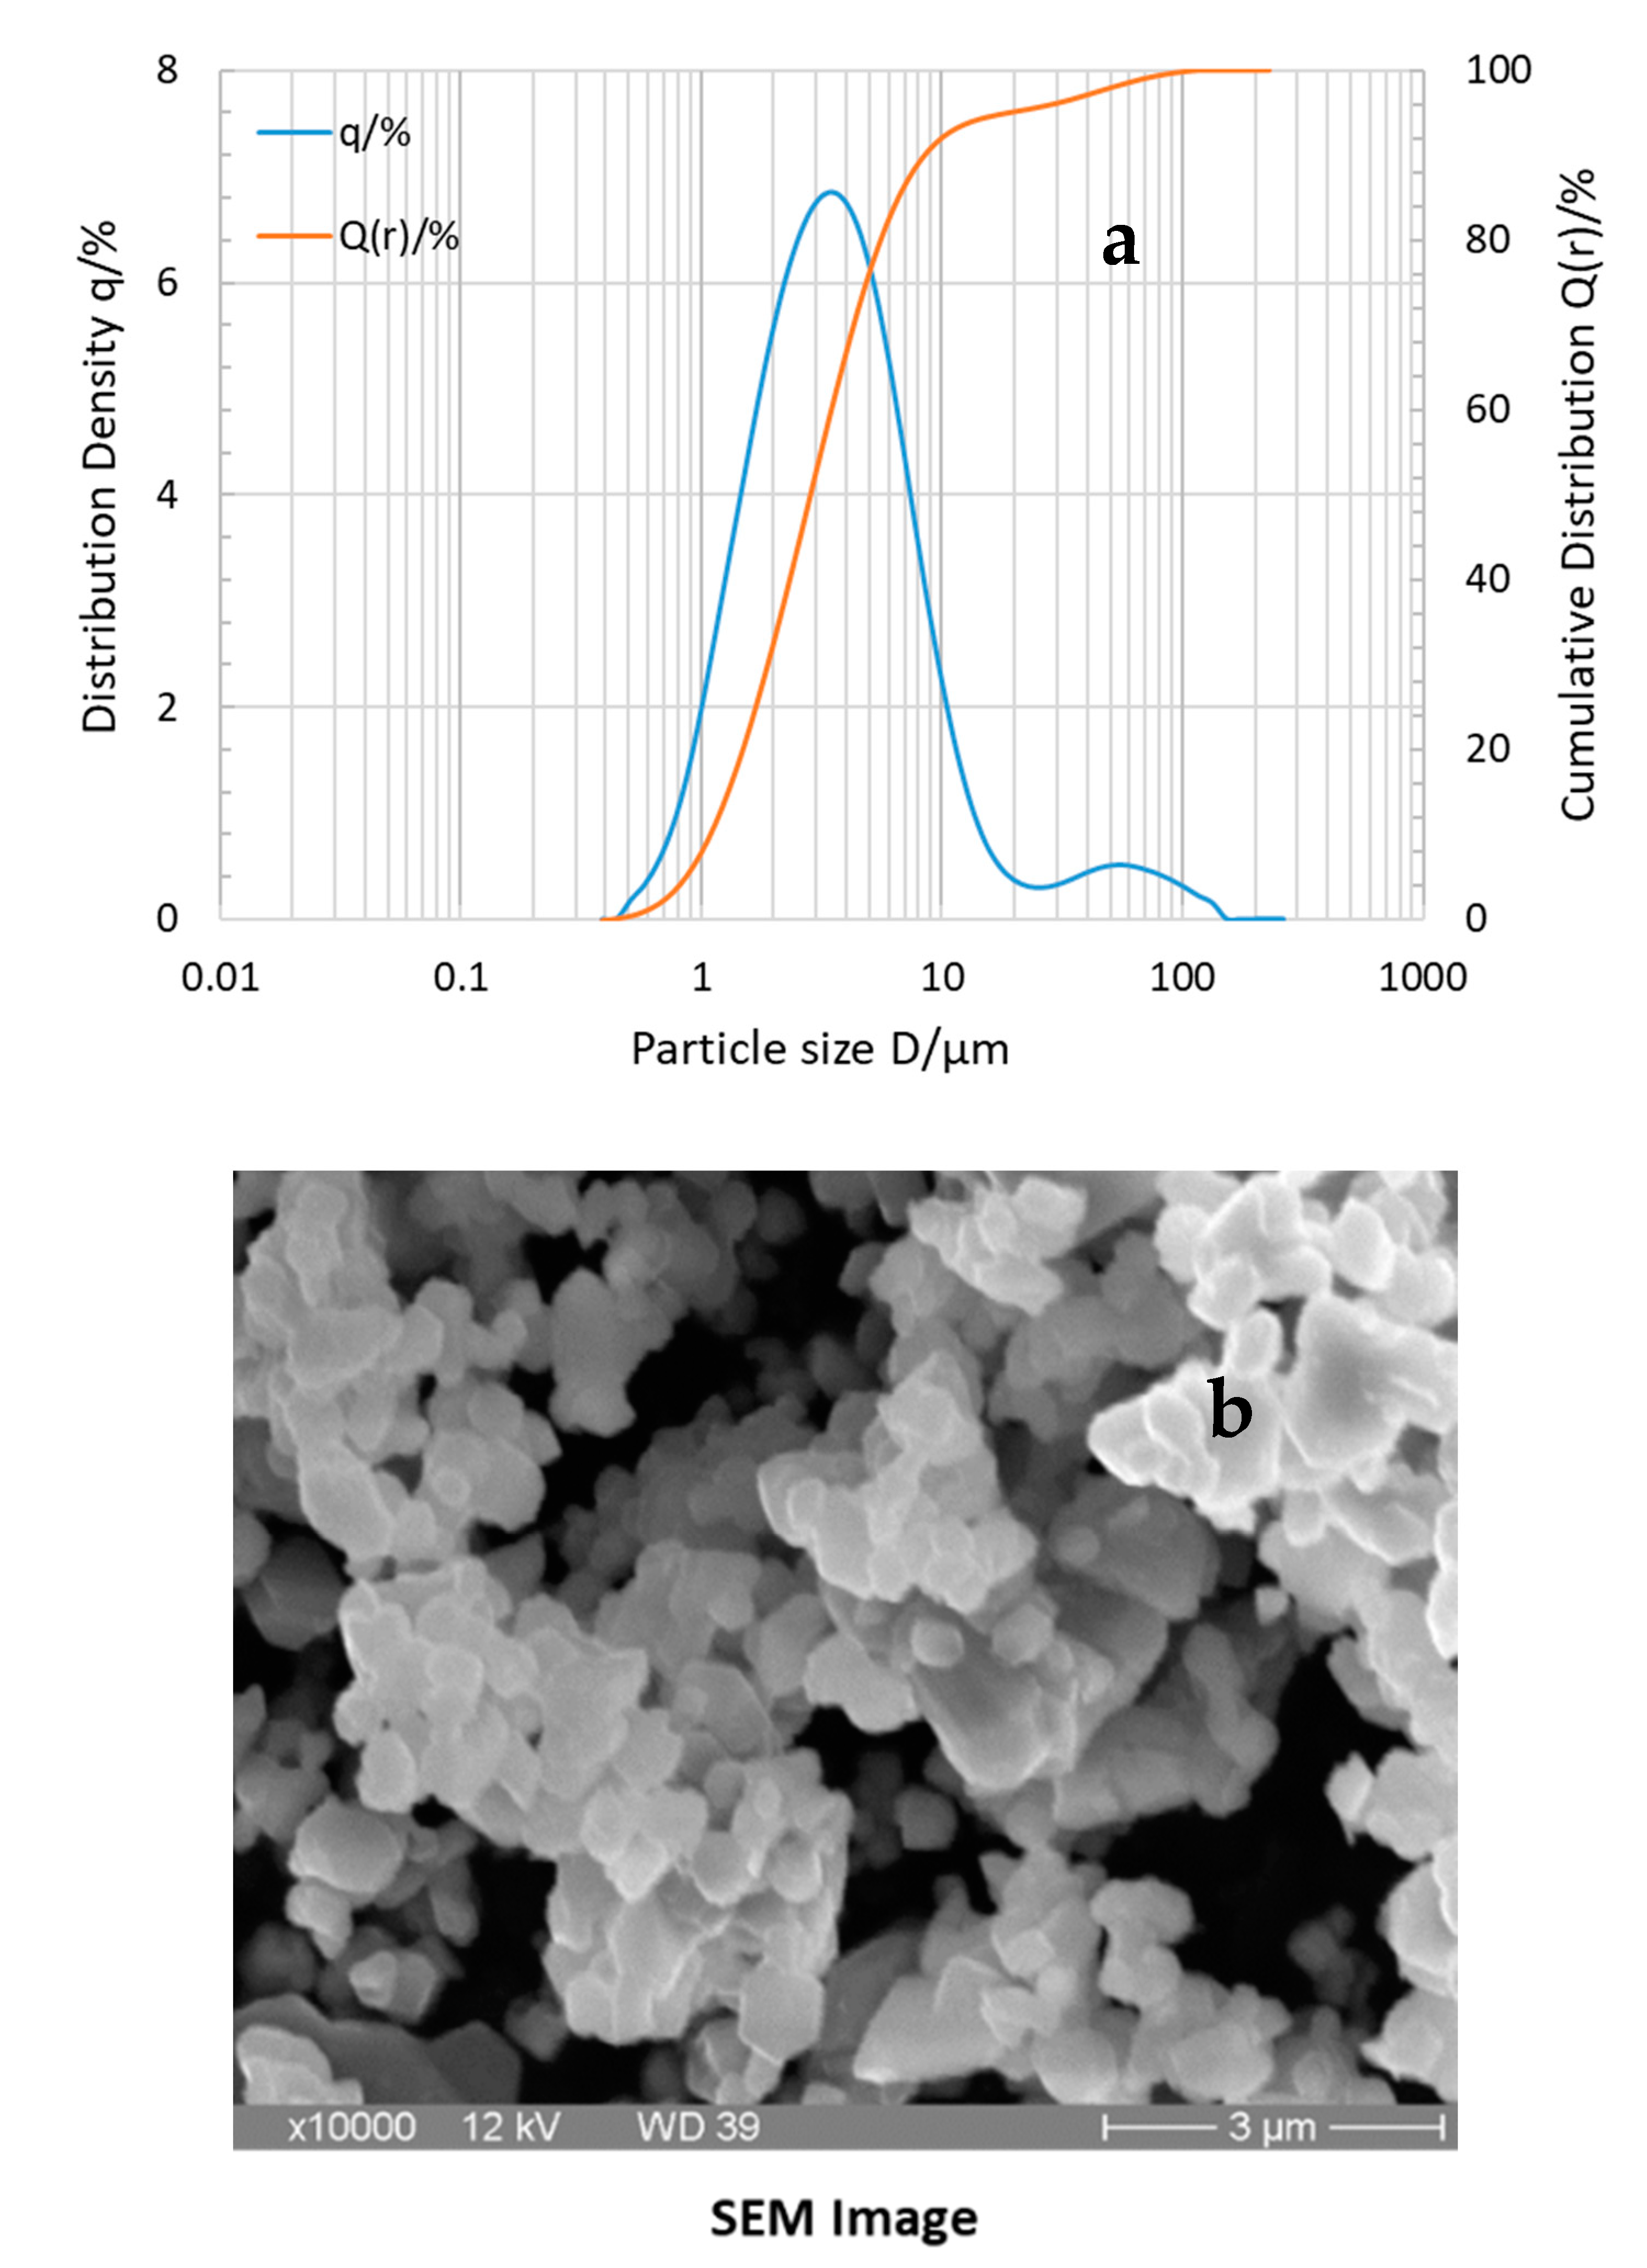
2.1. Elemental Analysis, Morphology, and Particle Size Distribution

The commercial sodium manganese oxide cathode powder was analyzed by inductive coupled plasma optical emission spectroscopy (ICP-OES) and the elemental concentration of each element is presented in Table 1 below. The given carbon and oxygen contents were measured by hot gas extraction methods.
Based on these elemental analyses, the chemical composition of the material was found to be Na0.53MnO2 in terms of elemental atomic concentration. Laser scattering gave a medium value for the D50 particle size of 3.25 µm, as shown in Figure 1a. The scanning electron microscopy revealed that the morphology of this oxide cathode material exhibits an irregular cubical shape (Figure 1b).

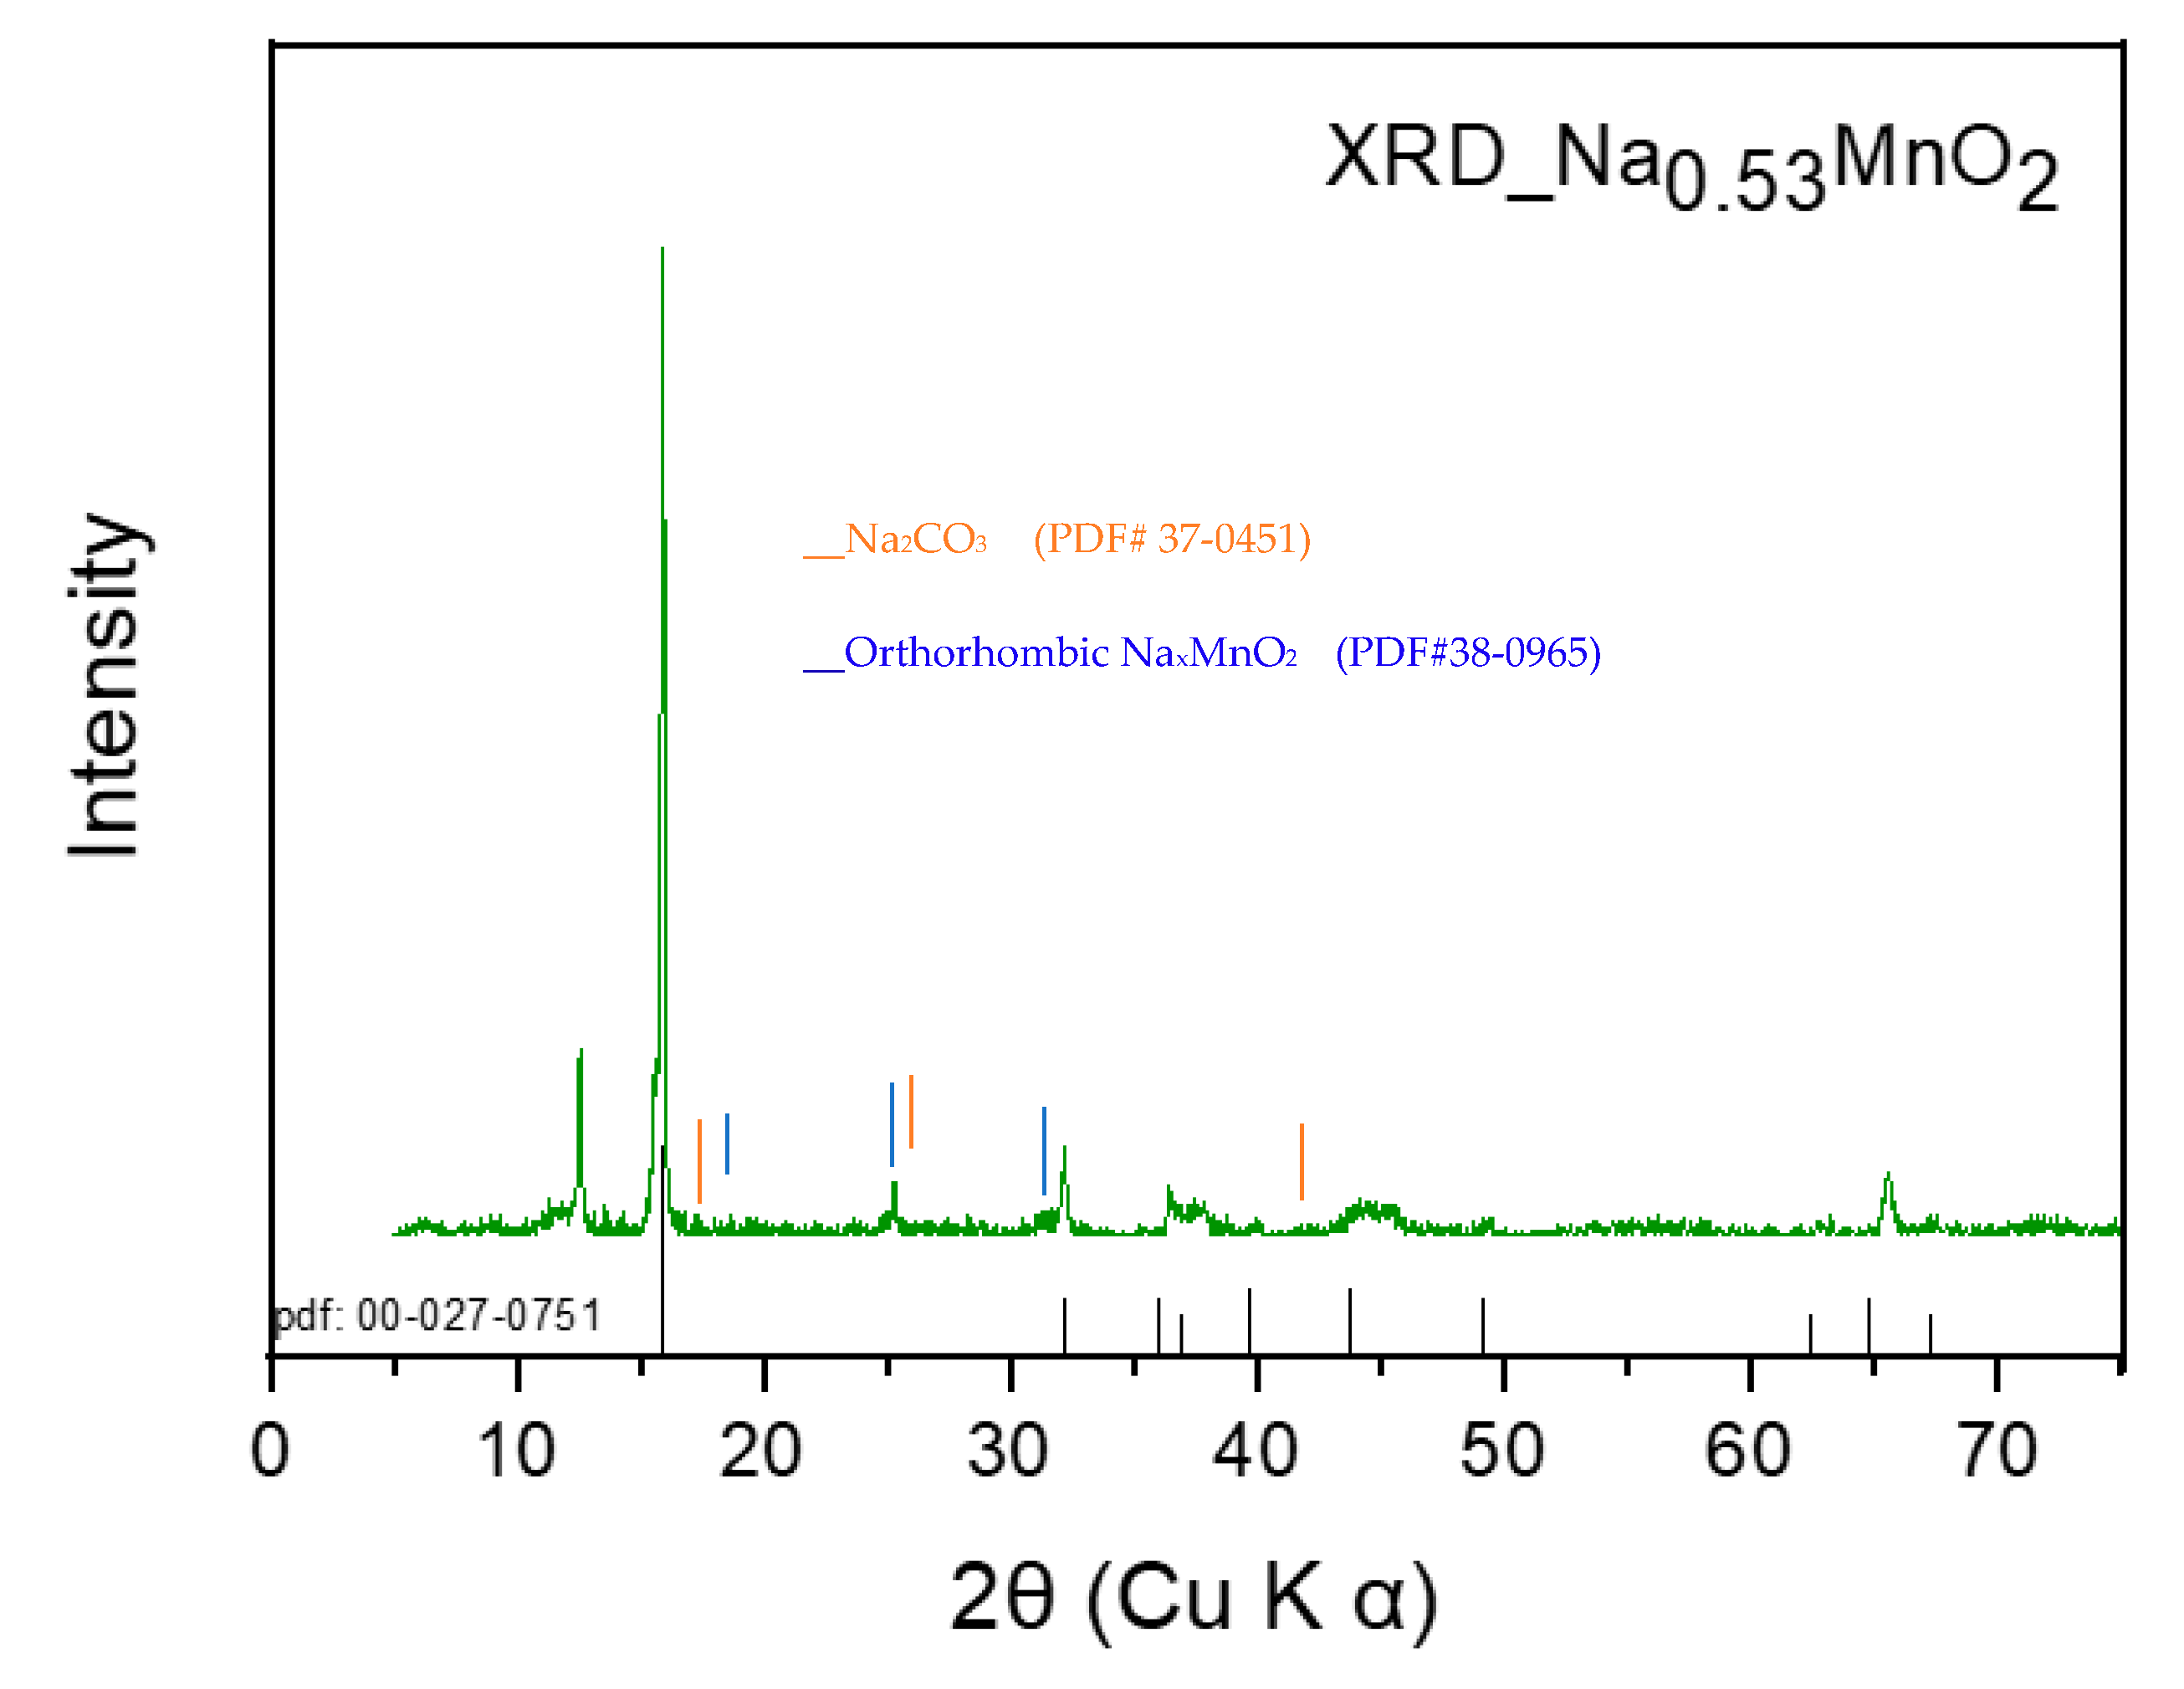
2.2. X-Ray Diffraction (XRD)

The data refinement and profile matching of the powder diffraction data of the as-prepared Na0.53MnO2 were performed as presented in Figure 2. The main peaks can be clearly assigned to the layered P2 type phase (PDF# 27-0751). Some impurities have also been found in the XRD spectrum as noticed in the elemental analysis as well because the sodium element contents differ from the expected composition as given by the manufacturer, which is Na0.7MnO2. The relatively small peaks at 2θ ≈ 17°, 26°, and 43° are attributed to a small amount of Na2CO3 (PDF#37-0451) impurity phase, and the peaks at 2θ ≈ 18°, 25°, and 32° are assigned to an orthorhombic NaxMnO2 (PDF# 38-0965) phase.

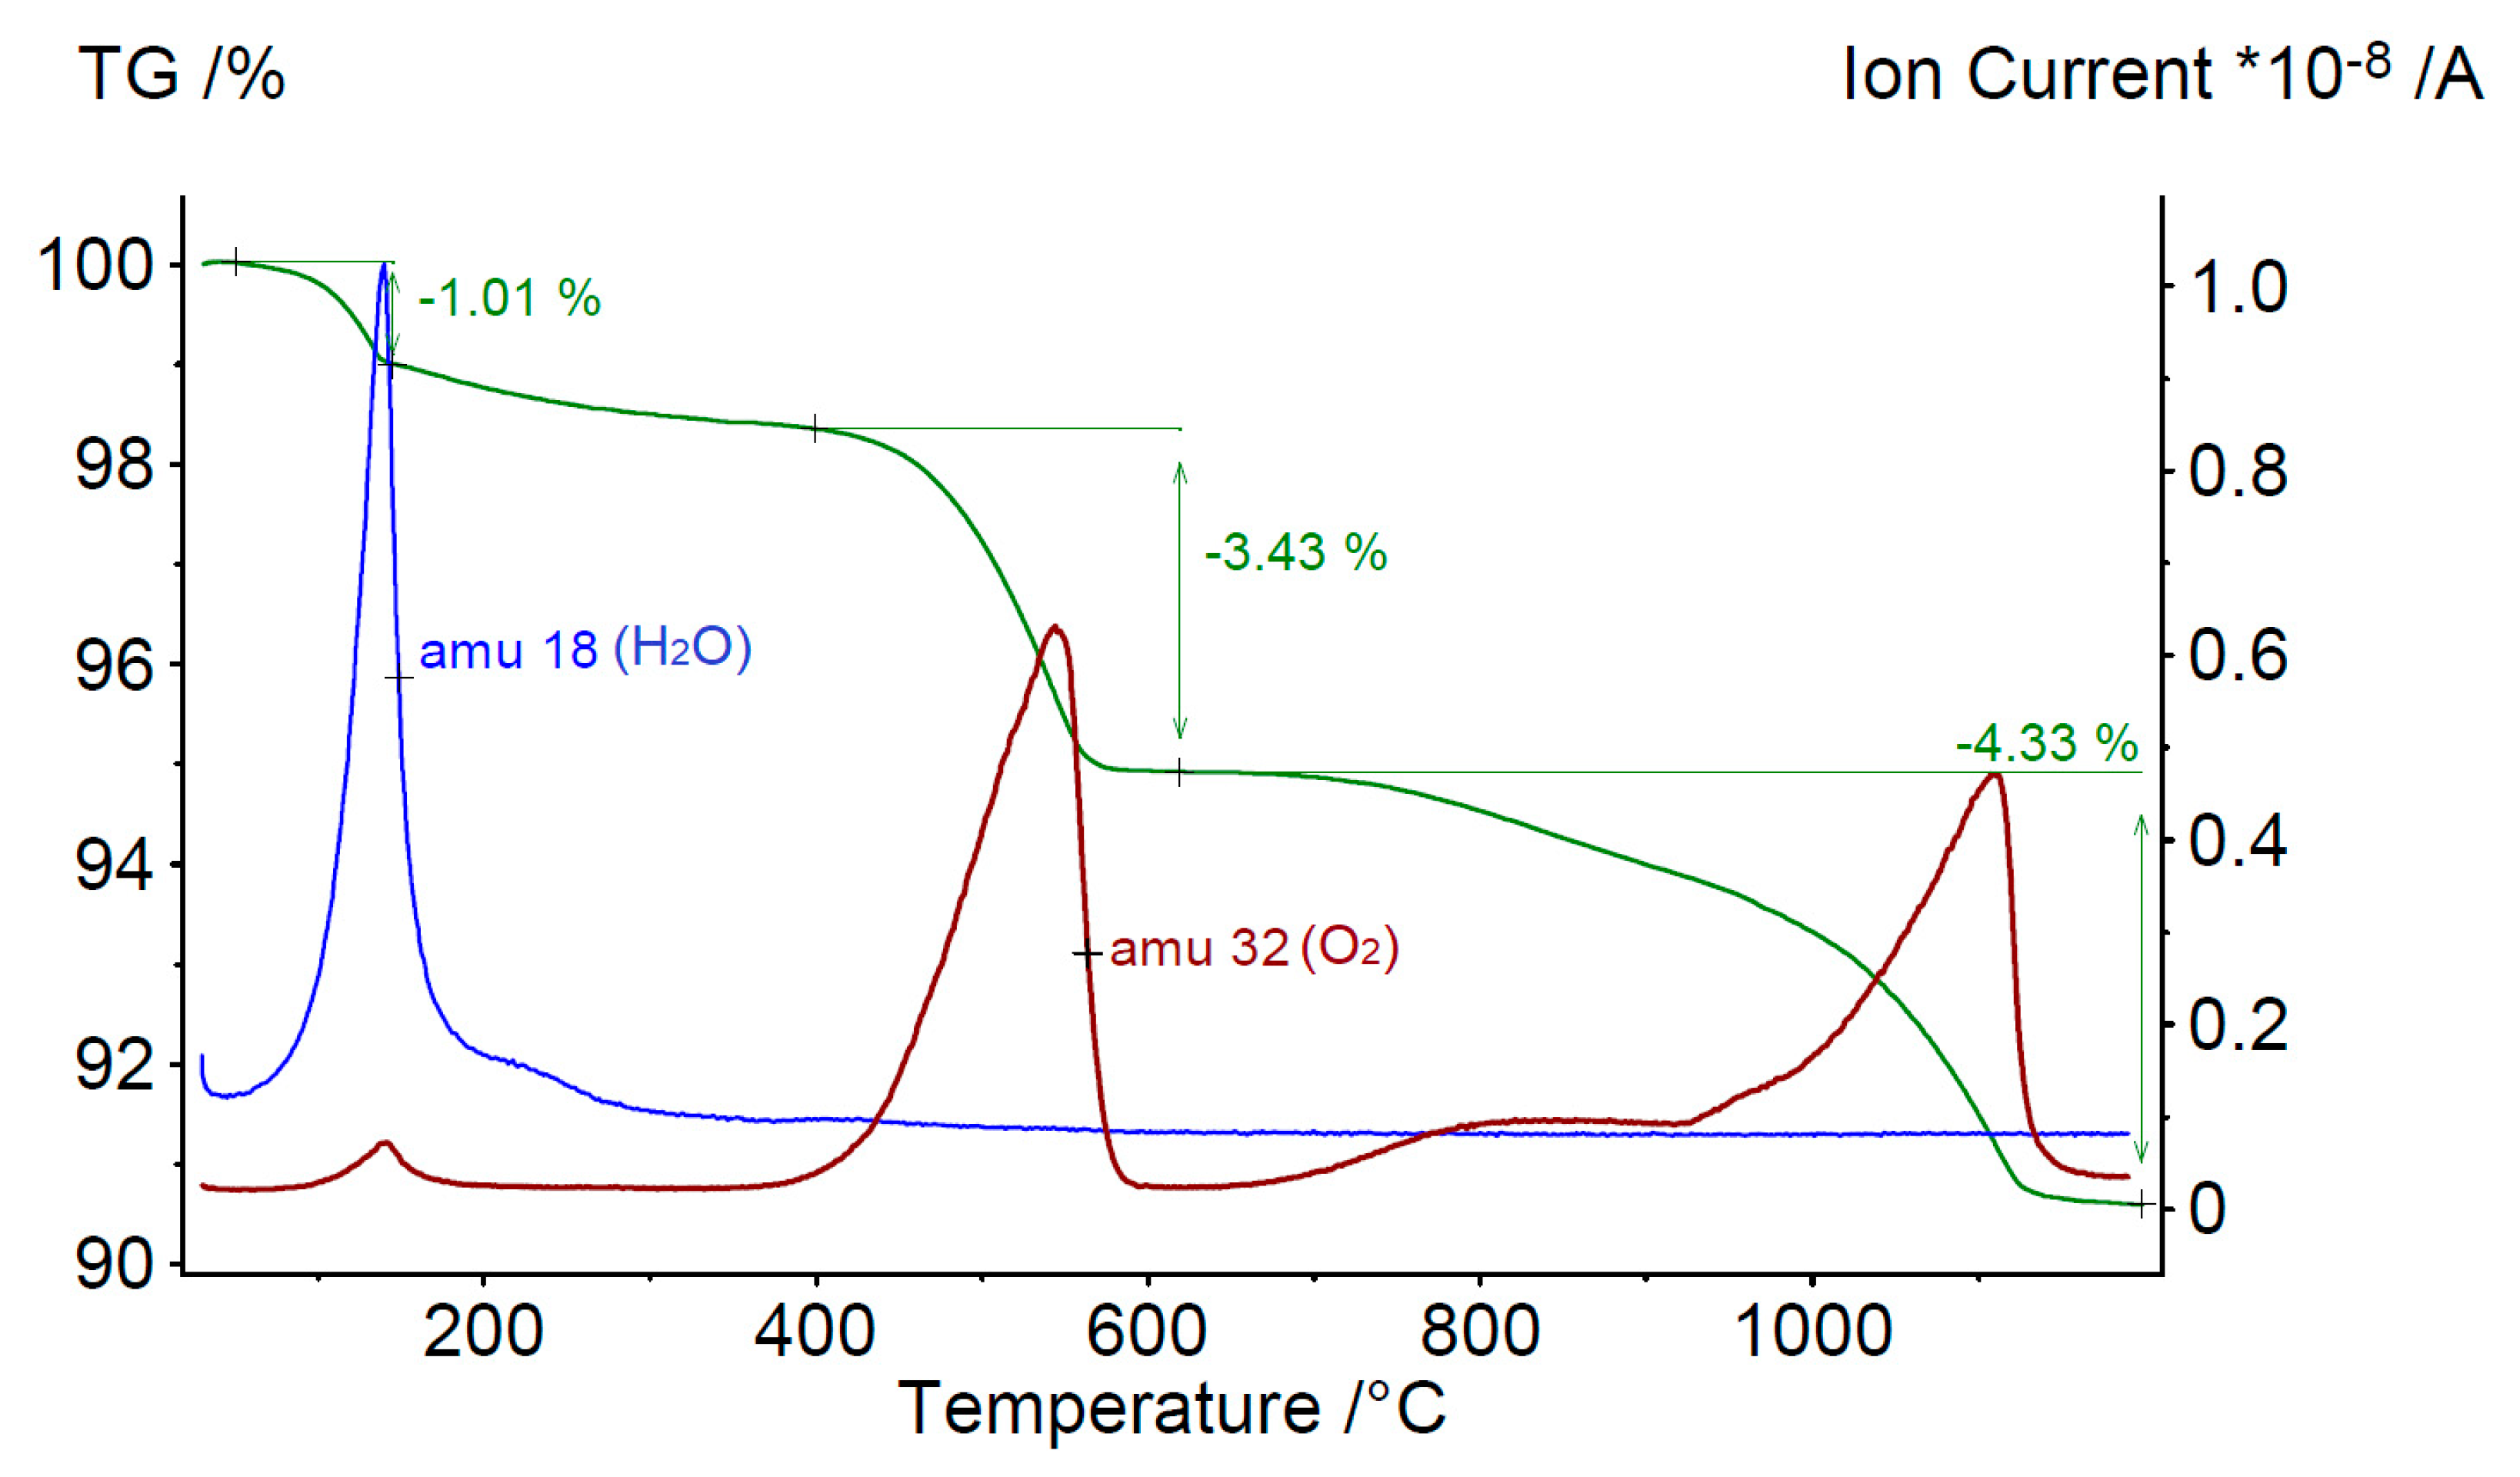
2.3. Thermal Stability and Evolved Gas Analysis

Thermogravimetry coupled with mass spectrometry (TGA-MS) results show (Figure 3) different mass loss peaks with increasing temperature; these mass losses were identified with respect to the evolved species.
The first mass loss represents the presence of water/moisture in the powder material, and a sharp H2O peak was observed at 100 °C. The second mass loss at an onset temperature of 400 °C shows the thermal decomposition of the compound evolving O2 and followed by further evolving of O2 at higher temperatures. This means that manganese oxide decomposes into Na0.53Mn2O3 and Na0.53Mn3O4 species, creating the possibility to form another stable MnxOx phase at a certain temperature, as shown by the stability window between 580 and 680 °C and further reduced at elevated temperature as reported in the literature [20]. Yabuuchi et al. [21] reported the thermal stability of P3-type NaxCrO2 cathode material, and they observed oxygen loss above 500 °C with the formation of Cr2O3 and NaxCrO2 as stable phases, making it a potentially safe positive electrode material for SIBs [21]. A similar trend was found in NaxCoO2 (NCO) cathode materials with a temperature range of room temperature to 400 °C. At higher temperatures, NCO cathode materials thermally decomposed into Co3O4, CoO, and Co with Co reduction [22]. Zhao et al. studied the thermal stability of α-NaFeO2 and found the thermal decomposition of Na0.58FeO2 powder at a temperature higher than 300 °C [17]. Hence, our cathode material under current studies is thermally stable until 400 °C. Therefore, further thermal data were measured within this thermal stability range. It is essential to find substitutable electrode materials with thermally stable bulk structure because the intrinsic thermal property of layered oxides still raises the safety concern [23]. Manganese-based P2 layer structure thermal stability data are unfortunately missing in the research community; therefore, no direct reference was found, but it was compared with the other competitive sodium-based cathode materials as cited above and found to be one of the suitable cathode materials in terms of thermal stability. In addition to the thermal stability, the cost of SIBs can be further reduced by the use of Co/Ni free cathode materials [24].

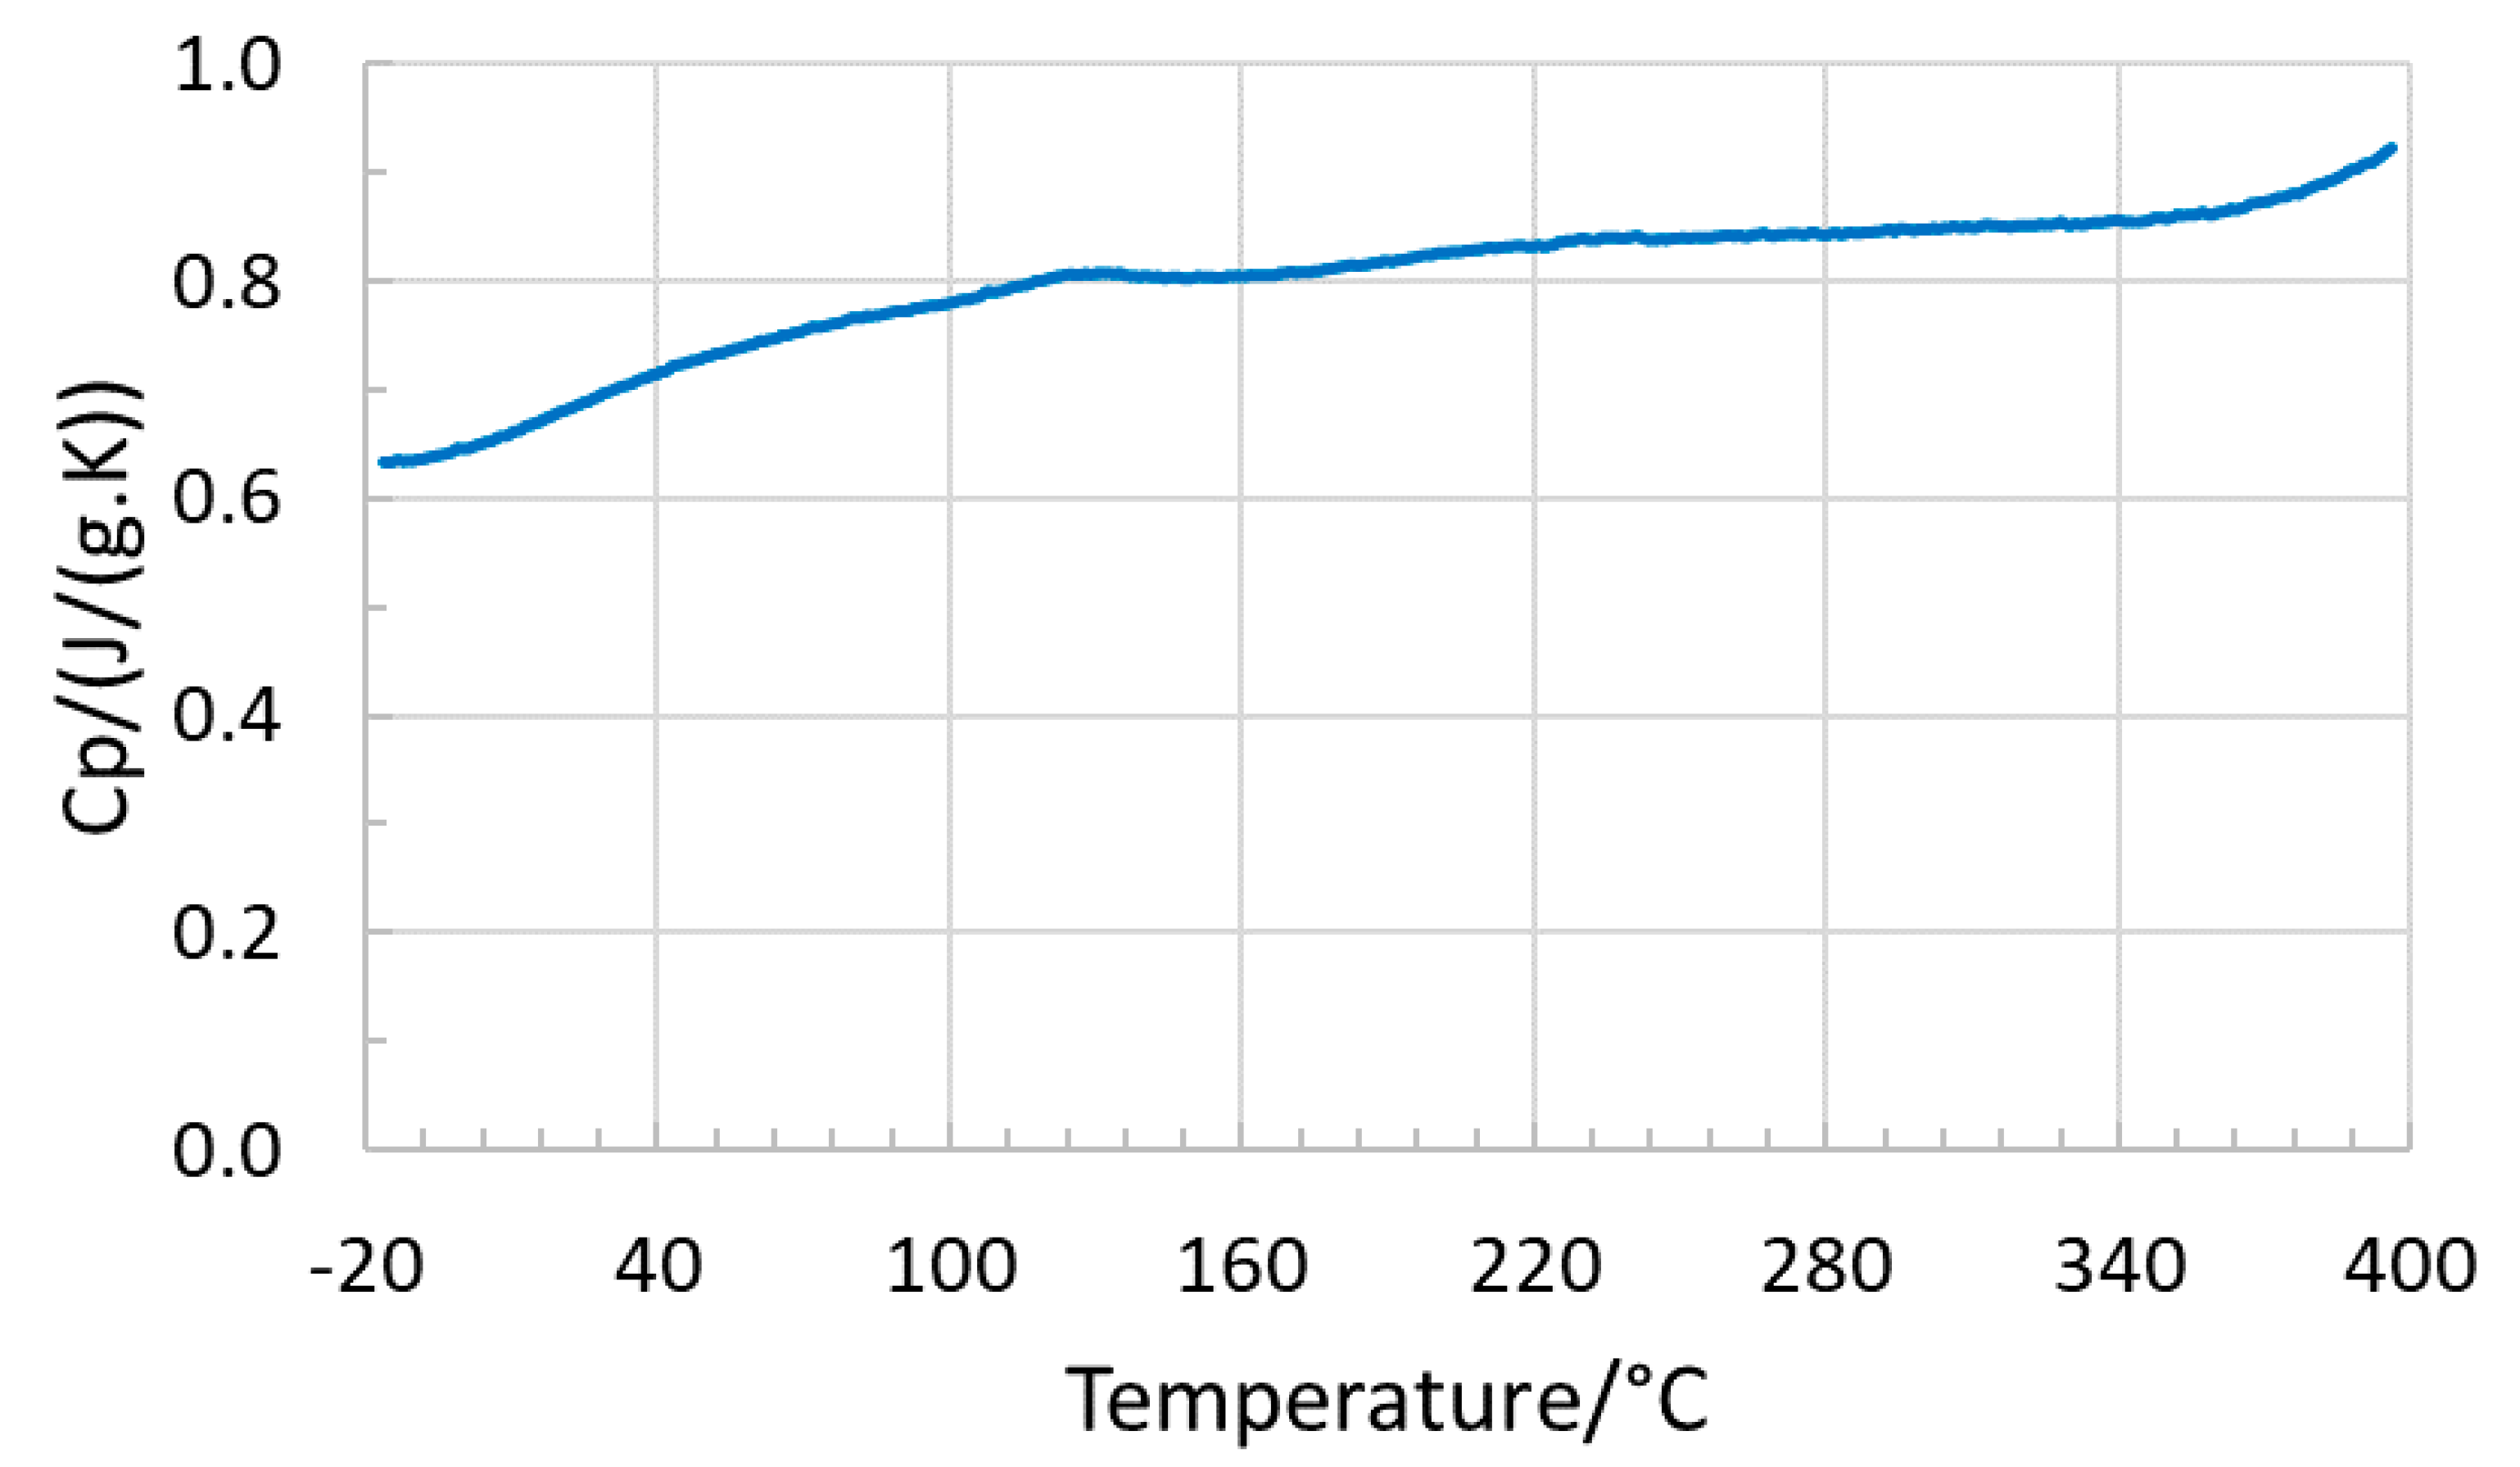
2.4. Specific Heat Capacity (Cp)

The results of the specific heat capacity measurements for the Na0.53MnO2 powder are shown in Figure 4.
The specific heat capacity Cp of Na0.53MnO2 powder was about 0.62–0.92 J/g⋅K, and the curve showed a monotonic trend over the measured temperature range. The specific heat capacity at 25 °C is around 0.69 J/g⋅K, which is comparable with the layered lithium cobalt oxide (LCO) cathode material, which is reported to be 0.73 J/g⋅K [8] and 0.70 J/g⋅K [25] at 25 °C. In this temperature range, the reported lithium-based layered oxide cathode Cp values are in good agreement with our measured Cp data.

2.5. Dimensional Change (Dilatometry)

Figure 5 shows the dimensional change and the results of the density measurement of the Na0.53MnO2 cathode material from the dilatometer. To investigate the effect of the pushrod force (20 centinewton) on the measurement result, another green specimen was sintered under the same conditions without the pushrod. The dimensional change without the pushrod force is −1.35% and with the pushrod force is −1.55% (Figure 5), so the difference is not so significant. This means that the specimens flew only slightly while being under the pressure of the pushrod. The density increases until 150 °C, which is the result of water evaporation. After water evaporation, the density was more or less constant, and from 300 °C, the specimen started to expand by evolving with little O2; subsequently, a slight decrease in density can be seen. The accurate density calculation as a function of temperature is very important in thermal conductivity calculation.

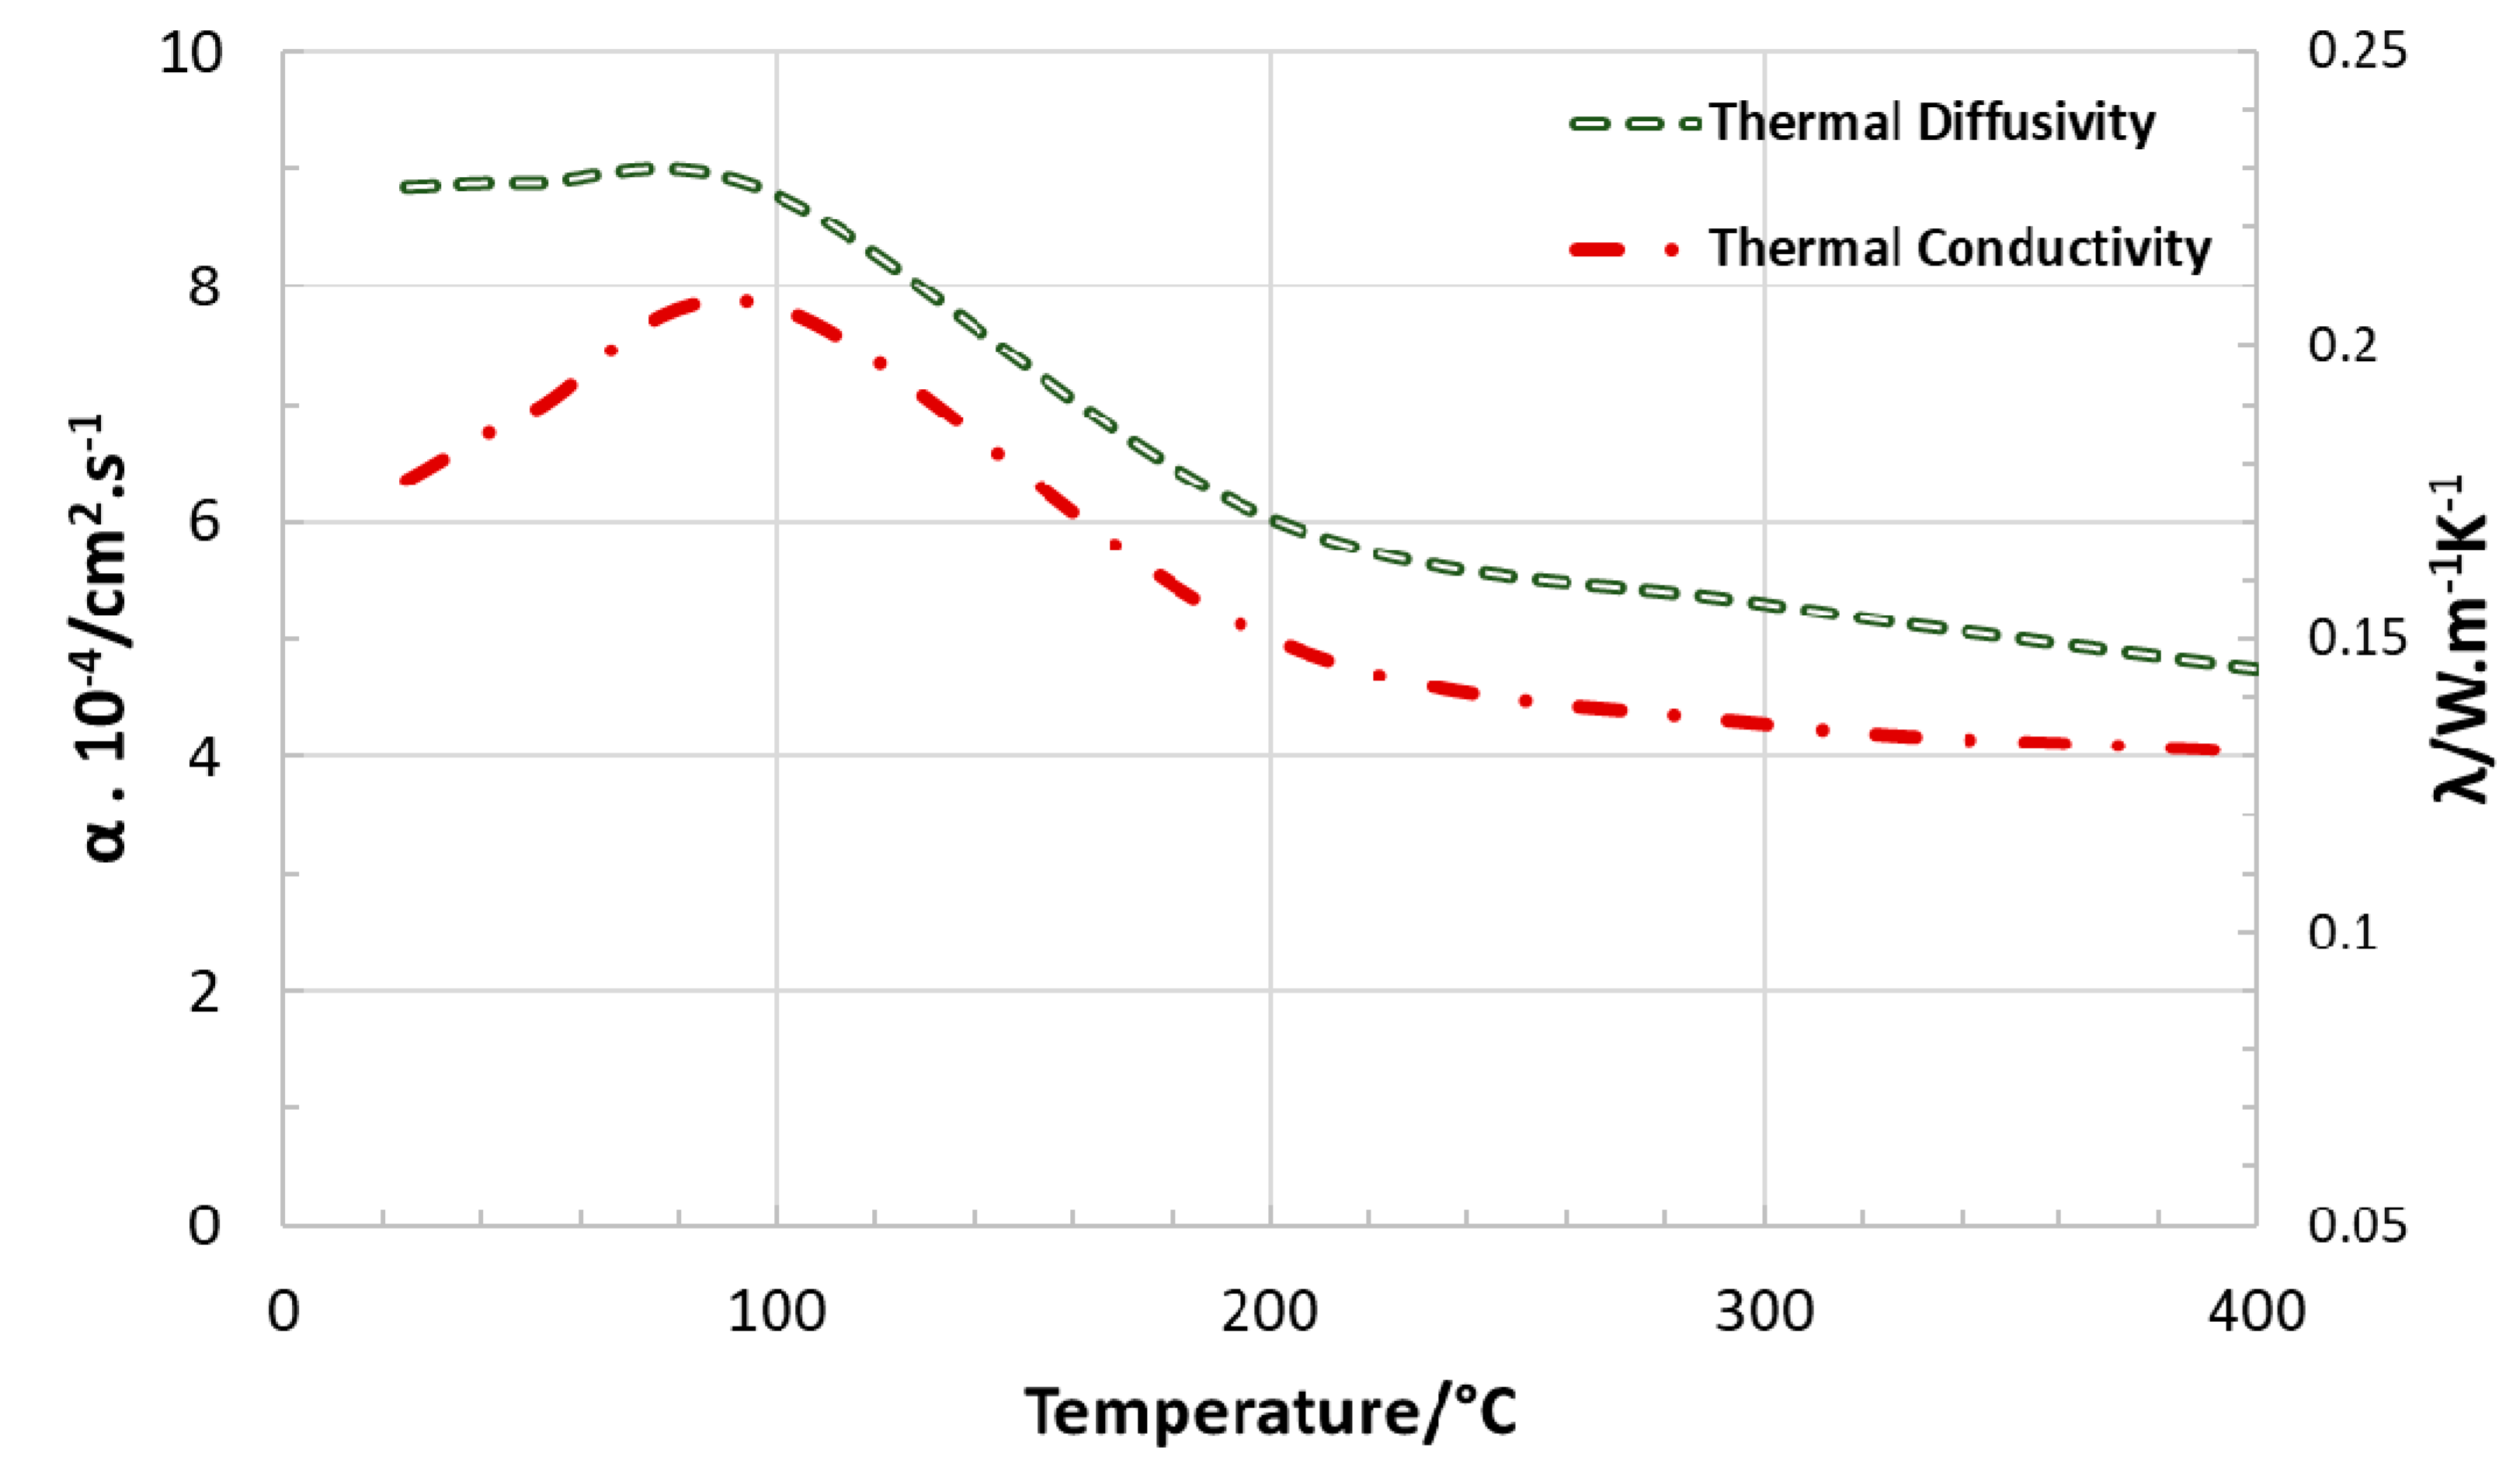
2.6. Thermal Diffusivity and Conductivity

The thermal conductivity λ values shown in Figure 6 were derived from thermal diffusivity measurements using Equation (4) as described in Section 3 “Materials and Methods”. Densities and specific heat capacity values at the corresponding temperatures were obtained from the measurements described above.
The thermal conductivity reaches a maximum of 0.2 Wm−1K−1 at 90 °C and then decreases to 0.13 Wm−1K−1 until 400 °C. On other hand, the thermal diffusivity reaches a maximum of 8.79 × 10⁻⁴ cm2/s at 90 °C and declines to 4.75 × 10⁻⁴ cm2/s at 400 °C. According to references [8,25], the thermal diffusivity of the layered LCO material is 2.16 × 10⁻³ cm2/s and 2.10 × 10⁻³ cm2/s, respectively. These values are 10 times higher than our measured values, although the chemistry and the density of these samples were different. The thermal conductivity value of layered LCO and lithium nickel manganese oxide (LNMC) materials are 0.38 and 0.44 W/mK, respectively, which are also relatively higher. That could be due to the difference in material density, because in this study, the pressed cathode material pellet is approximately 53% dense. Although the heat capacity and thermal diffusivity were found to vary with temperature, the calculated thermal conductivity of Na0.53MnO2 shows no significant thermal variation beyond 200 °C, as the density varies nominally. From 200 to 300 °C, the thermal conductivity decreased by about 10% and was further reduced by 4% at 400 °C. Hence, the total reduction in thermal conductivity from 200 to 400 °C is almost 14%. Thermal conductivity is another important property in the design of nanodevices [26,27], and a high thermal conductivity is favorable to avoid overheating issues in thermal management systems.
The summary of the measured thermophysical properties of the investigated cathode material (Na0.53MnO2) is given in Table 2.

3. Materials and Methods

In this work, sodium manganese oxide (Na0.7MnO2) cathode powder from NEI Corporation was investigated. In order to analyze the elements in this material, ICP-OES (OPTIMA 4300 DV Perkin Elmer) and carbon-sulfur (LECO-CS) and oxygen-nitrogen (LECO-ON) analyzers were employed. Inductive coupled plasma optical emission spectroscopy (ICP-OES) is a very sensitive elemental analysis method; even trace elements in solutions in the concentration ranges mg/L to µg/L can be detected. The carbon content was analyzed with the CS600 (LECO) device. The sample with the mass of 100–200 mg was weighed in a ceramic crucible, and about 1 g of accelerator material (W or Fe) was added. The material was combusted in oxygen at about 2000 °C and was oxidized and converted into CO2. The CO2 gas was measured quantitatively with infrared adsorption. In similar manner, the oxygen content was measured with the ON600 (LECO) device. The weighted specimen (100–200 mg) was placed in a high-purity graphite crucible and was fused under a flowing helium gas at 2200 °C (sufficient to release oxygen). The oxygen in the sample material combined with carbon from the crucible, forming CO2 gas. The gaseous products were detected by an infrared detector, and the oxygen contents were measured quantitatively.
Scanning electron microscope (SEM, Jeol 6100) and the laser scattering (Horiba Partica LA-950) method were used to characterize the powder morphology and determine the particle size distribution.
X-ray diffraction (XRD) pattern of the material was collected on an SEIFERT X-ray diffractometer equipped with Cu Kα radiation with a wavelength of 1.54056 Å in the 2θ range of 5–90° with a step size increment of 0.01°, and the data were collected at 300 s/step. The raw data of the X-ray measurement were corrected or processed by deduction of the background signal (a linear interpolation function was chosen to fit the background with a polynomial) followed by the elimination of the Kα2 contribution (“mathematical monochromatization”). Then, XRD peaks were smoothened with ANALYZE-software. The peaks identification was done by using the same software with reference to the related powder diffraction files.
Thermogravimetry (TG) as an analytical technique that measures the weight loss or weight gain of a material as a function of temperature, and it was used and combined with mass spectrometry (MS) to study the decomposition of the Na0.53MnO2 cathode material. This approach allowed the simultaneous evaluation of bond breaking and gaseous product formation during decomposition. A Netzsch TG 449 F1 Jupiter Thermo-nanobalance coupled with mass spectrometer Netzsch QMS 403C was used. The TG system was equipped with a rhodium furnace, allowing measurements between room temperature and 1650 °C. The quartz glass transfer lines (75 µm diameter) leading to the MS were heated to 200 °C to ensure that the entire sample entered the MS in gaseous form, i.e., to avoid condensation losses. An alumina sample holder was employed for the measurements, and all experimental runs were performed in a protective argon atmosphere (grade 5.0) with a gas flow of 50 mL/min. Measurements were carried out from room temperature to 1200 °C with a heating rate of 10 K/min. The MS multiple ion detection (MID) scans method was utilized, which monitors pre-defined m/e ratios resulting from the decomposition of the cathode material. A mass spectrometer operating in the electron impact mode at 100 eV was used in order to have sufficiently intense signals and to obtain fragmentation information. To correct the influences of the measurement system, the reference spectra of MS and empty runs or correction runs were carried out under the same conditions as used for the samples [28].
A NETZSCH DSC 204 was applied to measure the specific heat of the cathode material. For the DSC method, the Na0.53MnO2 powder was pressed into a cylinder shape with a diameter of about 10 mm. Samples should be plane parallel; for that reason, powder material was pressed in a crucible for better thermal conductivity before executing the test run. The sample was measured from −20 to 400 °C at a heating rate of 10 K/min in argon (grade 5.0) atmosphere with a gas flow of 50 mL/min. cp measurements up to 400 °C at a heating rate of 10 K/min with an error <3% were possible. The measuring process is done in three steps (DIN 51007) starting with the determination of the behavior of the empty calorimeter (base line: BL), the measurement of a sapphire reference (sapphire measurement: Sa), and the measurement of the sample (sample measurement: P). From statistical reasons all types of measurements were carried out 3 times. Based on the measured DSC signals, the specific heat of the sample was calculated by Equation (1) [29].
c p ( P ) ( T ) = D S C ( P ) ( T ) D S C ( B L ) ( T ) D S C ( S a ) ( T ) D S C ( B L ) ( T ) · m ( S a ) m ( P ) · c p ( S a ) ( T )
where m(Sa) is the mass of the reference material Sapphire and m(P) is the mass of the sample material.
To obtain the density changes during processing, a pushrod dilatometer NETZSCH DIL 402-SU was used to measure dimensional effects, e.g., shrinkage, during the heating process. A dilatometer measures the length changes of the sample when the sample follows a temperature program. The change in length of the sample was detected by an inductive displacement transducer connected to the specimen by a pushrod with exertion of a small force (e.g., 20 cN adjustable). In order to calculate the density over the whole temperature range, the actual volume was calculated from Equation (2).
V 1 = V 0 ( 1 + Δ L L 0 ) 3
where V1 is change in volume, V0 is original volume, ΔL is change in length, and L0 is original length, assuming that the dimensional change is the same in all directions. A pellet with a diameter of 6 mm was pressed uniaxially to study the density up to 400 °C. The measurement was carried out in inert atmosphere helium gas (grade 5.0) with a gas flow of about 50 mL/min up to 400 °C with a heating rate of 2.5 K/min. The density of the pressed pellet was also measured geometrically prior to the experiment. The average green density of the green compacts was calculated geometrically, and it was 2.30 g/cm3.
The thermal conductivity was calculated from the thermal diffusivity, which was measured by using a Laser flash analysis (LFA) NETZSCH LFA 427 from the specific heat capacity as measured by the DSC and from the density taken from the dilatometer.
During the LFA, the laser shoots a pulse at the sample’s front surface, and the infrared detector measures the temperature rise of the sample’s back surface. The software uses DIN 821-2 routines to match a theoretical curve to the experimental temperature rise curve [30,31]. The thermal diffusivity value is the diffusivity value associated with the selected theoretical curve [32]. The measuring process is done in one step and is based on the detection of the time-dependent temperature curve at the rear side of the specimen (averted from the laser heated top side of the specimen) after a laser pulse, as shown in Figure 7 [30]. The data relevant to determine the thermal diffusivity are the maximum temperature increase at the rear side Tmax and the time until half of this temperature increase is reached, t1/2.
The solution of the thermal conductivity Equation (3) for one-dimensional problems and adiabatic boundaries leads to an expression of the thermal diffusivity a as a function of the thickness of a plane parallel sample h and the half time of the temperature increase t1/2. It is assumed that the specimen is in thermal equilibrium (adiabatic at any time during the measurement). Secondly, thin and plane parallel specimens as well as infinitely short laser pulses are assumed. Under these ideal conditions, Equation (3) is valid [30].
a ( T ) = ln ( 1 / 4 ) π 2 · h 2 ( T ) t 1 / 2 ( T )
Then, thermal conductivity λ values are derived from the diffusivity measurements using Equation (4).
λ ( T ) = ρ ( T ) · c p ( T ) · a ( T )
where λ(T) is the thermal conductivity, cp(T) is the specific heat, a(T) is the thermal diffusivity, and ρ(T) is the density. The thermal diffusivity was measured here from 20 to 400 °C with a heating rate of 10 K/min under vacuum (10−5 mbar) in increments of 100 °C and holding the system for a few minutes to stabilize. A specimen of dimensions 10 mm in diameter and 0.680 mm in height was used. The specimen was sprayed with graphite in order to absorb laser energy. A heat pulse (provided by an Nd-YAG laser) was applied to one face of the specimen, and the transient temperature rise was measured on the opposite face using an infrared detector. From statistical reasons, at a given temperature, 4–6 measurements were done.

4. Conclusions and Outlook

The promising cathode material Na0.53MnO2 was characterized using inductive-coupled plasma-optical emission spectroscopy (ICP-OES), XRD, SEM, and laser scattering for particle size distribution. The thermophysical properties of the commercial cathode material Na0.53MnO2 have been determined, and thermophysical data were measured such as specific heat, density as a function of temperature, and thermal diffusivity followed by thermal conductivity. The cathode material is thermally stable up to 400 °C; beyond this temperature, the material decomposed and released O2, which could be a hazardous threat in terms of thermal runaway in SIBs. By comparison with available thermophysical data of lithium layered structure battery materials, this material shows good suitability for SIBs. Such data are highly relevant and important for thermal simulation studies of thermal management and thermal runaway in all types of batteries, because it allows the determination of the released heat of the materials both under normal use and abuse conditions. Layered cathode materials show excellent electrochemical properties in favor of fast sodium ion diffusion and easy synthesis processes. Secondly, the cost of SIBs can be reduced by use of cheap transition metals instead of Co and Ni, which are expensive. As the focus of most electric vehicle (EV)-related industries is to reduce the manufacturing costs, the investigated cathode material could be one of the promising materials in case of future SIBs if it also provides a good thermal stability, which has been proven in this work.
Of course, in SIBs application, the thermal stability of the cathode material in different de-sodiation states shall be of high interest in follow-up research. Especially in case of abuse tests where thermal runaway strongly depends on the state of the charge (SOC), which is associated with the sodium content in the pristine cathode material. At the charged state, the Na0.53-xMnO2 (x > 0) cathode material crystal structure is in the deficiency of sodium contents and the manganese metal is in the oxidation state (Mn4+), which is comparatively thermally instable and releases O2 at an earlier onset temperature. That shall be confirmed by our experimental studies, which are currently still ongoing. The results will be published as soon as they become available. Moreover, after several charge–discharge cycles, irreversible sodium ion migration on extraction (fully discharged) from the anode side might negatively affect the thermal stability as well as the stability of the crystal structural due to the transformation from P2 to the O2 phase. That will lead toward a reduction of the intrinsic cathode material-specific capacity. In addition, the thermophysical properties of the electrode materials where the state of health (SOH) of the batteries is below 80% would also be of interest, especially if the cells later apply in second-life applications.

Author Contributions

Conceptualization, H.J.S. and C.Z.; methodology, I.U.M.; validation, I.U.M.; formal analysis, I.U.M.; investigation, I.U.M.; writing—original draft preparation, I.U.M.; writing—review and editing, M.R., C.Z., and H.J.S.; visualization, I.U.M.; supervision, C.Z., M.R. and H.J.S.; project administration, C.Z., M.R. and H.J.S.; funding acquisition, C.Z. and H.J.S. All authors have read and agreed to the published version of the manuscript.

Funding

This work was funded by the German Research Foundation (DFG) under Project ID 390874152 (POLiS Cluster of Excellence).

Institutional Review Board Statement

Not applicable.

Informed Consent Statement

Not applicable.

Data Availability Statement

The data that support the findings of this study are available from the corresponding author upon request.

Acknowledgments

The authors thankfully acknowledge the support of J. Jung for the DSC measurements and T. Bergfeldt for elemental analysis. This work contributes to the research performed at CELEST (Center for Electrochemical Energy Storage Ulm-Karlsruhe).

Conflicts of Interest

The authors declare no conflict of interest.

References

  1. Berthelot, R.; Carlier, D.; Delmas, C. Electrochemical investigation of the P2–NaxCoO2 phase diagram. Nat. Mater. 2011, 10, 74–80. [Google Scholar] [CrossRef] [PubMed]
  2. Yoshida, H.; Yabuuchi, N.; Komaba, S. NaFe0.5Co0.5O2 as high energy and power positive electrode for Na-ion batteries. Electrochemistry 2012, 80, 716–719. [Google Scholar] [CrossRef]
  3. Ma, X.; Chen, H.; Ceder, G. Electrochemical Properties of Monoclinic NaMnO2. J. Electrochem. Soc. 2011, 158, A1307–A1312. [Google Scholar] [CrossRef]
  4. Li, Z.-Y.; Gao, R.; Zhang, J.; Zhang, X.; Hu, Z.; Liu, X. New insights into designing high-rate performance cathode materials for sodium ion batteries by enlarging the slab-spacing of the Na-ion diffusion layer. J. Mater. Chem. A 2016, 4, 3453–3461. [Google Scholar] [CrossRef]
  5. Li, F.; Zhou, Z. Micro/nanostructured materials for sodium ion batteries and capacitors. Small 2018, 14, 1702961. [Google Scholar] [CrossRef]
  6. Terayama, K.; Ikeda, M. Study on Thermal Decomposition of MnO2 and Mn2O3 by Thermal Analysis. Trans. Jpn. Inst. Met. 1983, 24, 754–758. [Google Scholar] [CrossRef] [Green Version]
  7. Braconnier, J.-J.; Delmas, C.; Fouassier, C.; Hagenmuller, P. Comportement electrochimique des phases NaxCoO2. Mater. Res. Bull. 1980, 15, 1797. [Google Scholar] [CrossRef]
  8. Gotcu, P.; Pfleging, W.; Smyrek, P.; Seifert, H.J. Thermal behaviour of LixMeO2 (Me = Co or Ni + Mn + Co) cathode materials. Phys. Chem. Chem. Phys. 2017, 19, 11920–11930. [Google Scholar] [CrossRef]
  9. Gotcu, P.; Seifert, H.J. Thermophysical properties of LiCoO2–LiMn2O4 blended electrode materials for Li-ion batteries. Phys. Chem. Chem. Phys. 2016, 18, 10550–10562. [Google Scholar] [CrossRef]
  10. Williford, R.E.; Viswanathan, V.V.; Zhang, J.G. Effects of entropy changes in anodes and cathodes on the thermal behavior of lithium ion batteries. J. Power Sources 2009, 189, 101–107. [Google Scholar] [CrossRef]
  11. Chen, S.C.; Wan, C.C.; Wang, Y.Y. Thermal analysis of lithium-ion batteries. J. Power Sources 2005, 140, 111–124. [Google Scholar] [CrossRef]
  12. Mathewson, S. Experimental Measurements of LiFePO4 Battery Thermal Characteristics. Master’s Thesis, University of Waterloo, Waterloo, ON, Canada, 2014. [Google Scholar]
  13. Hautier, G.; Jain, A.; Ong, S.P.; Kang, B.; Moore, C.; Doe, R.; Ceder, G. Phosphates as Lithium-Ion Battery Cathodes: An Evaluation Based on High-Throughput ab Initio Calculations. Chem. Mater. 2011, 12, 3495–3508. [Google Scholar] [CrossRef]
  14. Lim, S.Y.; Kim, H.; Shakoor, R.A.; Jung, Y.; Choi, J.W. Electrochemical and thermal properties of NASICON structured Na3V2(PO4)3 as a sodium rechargeable battery cathode: A combined experimental and theoretical study. J. Electrochem. Soc. 2012, 159, A1393–A1397. [Google Scholar] [CrossRef]
  15. Jin, T.; Li, H.; Zhu, K.; Wang, P.-F.; Liu, P.; Jiao, L. Polyanion-type cathode materials for sodium-ion batteries. Chem. Soc. Rev. 2020, 49, 2342–2377. [Google Scholar] [CrossRef] [PubMed]
  16. Zang, H. Polyanionic Cathode Materials for Sodium-Ion Batteries. Ph.D. Thesis, Karlsruhe Institute of Technology (KIT), Karlsruhe, Germany, 2018. Available online: https://publikationen.bibliothek.kit.edu/1000091096/23082781 (accessed on 1 March 2018).
  17. Zhao, J.; Zhao, L.; Dimov, N.; Okada, S.; Nishida, T. Electrochemical and Thermal Properties of α-NaFeO2 Cathode for Na-Ion Batteries. J. Electrochem. Soc. 2013, 160, A3077–A3081. [Google Scholar] [CrossRef]
  18. Kobayashi, W.; Yanagita, A.; Akaba, T.; Shimono, T.; Tanabe, D.; Moritomo, Y. Thermal Expansion in Layered NaxMO2. Sci. Rep. 2018, 8, 3988–3997. [Google Scholar] [CrossRef] [Green Version]
  19. Bak, S.; Zhou, Y.; Hu, E.; Yu, X.; Yang, X. Thermal Stability Studies in Charged Layered Sodium Transition Metal Oxide Cathode Materials for Na-Ion Batteries. ECS Meet. Abstr. A04-Battery Saf. 2015, MA2015-02, 338. [Google Scholar]
  20. Sun, Y.; Guo, S.; Zhou, H. Adverse effects of interlayer-gliding in layered transition-metal oxides on electrochemical sodium-ion storage. Energy Environ. Sci. 2019, 12, 825–840. [Google Scholar] [CrossRef]
  21. Yabuuchi, N.; Ikeuchi, I.; Kubota, K.; Komaba, S. Thermal Stability of NaxCrO2 for Rechargeable Sodium Batteries; Studies by High-Temperature Synchrotron X-ray Diffraction. ACS Appl. Mater. Interfaces 2016, 47, 32292–32299. [Google Scholar] [CrossRef] [PubMed]
  22. Hwang, S.; Lee, Y.; Jo, E.; Chung, Y.; Choi, W.; Kim, S.M.; Chang, W. Investigation of Thermal Stability of P2-NaxCoO2 Cathode Materials for Sodium Ion Batteries Using Real-Time Electron Microscopy. ACS Appl. Mater. Interfaces 2017, 9, 18883–18888. [Google Scholar] [CrossRef]
  23. Yang, C.; Xin, S.; Mai, L.; You, Y. Materials Design for High-Safety Sodium-Ion Battery. Adv. Energy Mater. 2021, 11, 2000974. [Google Scholar] [CrossRef]
  24. Vaalma, C.; Buchholz, D.; Weil, M.; Passerini, S. A cost and resource analysis of sodium-ion batteries. Nat. Rev. Mater. 2018, 3, 18013. [Google Scholar] [CrossRef]
  25. Peng, P.; Sun, Y.; Jiang, F. Thermal analyses of LiCoO2 lithium-ion battery during oven tests. Int. J. Heat Mass Transf. 2014, 50, 1405–1416. [Google Scholar] [CrossRef]
  26. Balandin, A. Thermal properties of graphene and nanostructured carbon materials. Nat. Mater. 2011, 10, 569–581. [Google Scholar] [CrossRef] [PubMed] [Green Version]
  27. Shahil, K.; Balandin, A. Thermal properties of graphene and multilayer graphene: Applications in thermal interface materials. Solid State Commun. 2012, 152, 1331–1340. [Google Scholar] [CrossRef]
  28. Mohsin, I.U.; Lager, D.; Gierl, C.; Hohenauer, W.; Danninger, H. Thermo-kinetics study of MIM thermal de-binding using TGA coupled with FTIR and mass spectrometry. Thermochim. Acta 2010, 503, 40–45. [Google Scholar] [CrossRef]
  29. Della Gatta, G.; Richardson, M.J.; Sarge, S.M.; Stolen, S. Standards, Calibration, and Guidelines in Microcalorimetry Part 2. Calibration Standards For Differential Scanning IUPAC Technical Report. Pure Appl. Chem. 2006, 78, 1455–1476. [Google Scholar] [CrossRef] [Green Version]
  30. Dusza, L. Heat transport models for determining the thermal diffusivity of substances with the transient laser flash method. High Temp. High Press. 1995, 27, 467–473. [Google Scholar] [CrossRef]
  31. Blumm, J.; Opferman, J. Improvement of the mathematical modeling of flash measurements. High Temp. High Press. 2002, 34, 515–521. [Google Scholar] [CrossRef]
  32. Mohsin, I.U.; Lager, D.; Hohenauer, W.; Gierl, C.; Danninger, H. Finite element sintering analysis of metal injection molded copper brown body using thermo-physical data and kinetics. Comput. Mater. Sci. 2012, 53, 6–11. [Google Scholar] [CrossRef]
Figure 1. Na0.53MnO2 powder material: particle size distribution (a), SEM image (b).
Batteries 07 00016 g001
Figure 2. XRD pattern of Na0.53MnO2 cathode powder material.
Batteries 07 00016 g002
Figure 3. Thermogravimetric analysis coupled with mass spectroscopy of the Na0.53MnO2 cathode powder material.
Batteries 07 00016 g003
Figure 4. Specific heat capacity of Na0.53MnO2 cathode powder material.
Batteries 07 00016 g004
Figure 5. Dimensional change and density measurement of Na0.53MnO2 cathode material.
Batteries 07 00016 g005
Figure 6. Measured thermal diffusivity and calculated thermal conductivity of Na0.53MnO2 specimen during a heating run.
Batteries 07 00016 g006
Figure 7. Time-dependent temperature curve at the rear side of the specimen after a laser pulse.
Batteries 07 00016 g007
Table 1. Elemental concentration in sodium manganese oxide cathode material.
ElementCathode Material
(Sodium Manganese Oxide)
Mean Value (wt %)SD
C0.080.00
O33.50.2
Na12.20.1
Mn52.20.2
Table 2. Thermophysical properties of the studied Na0.53MnO2 material.
Temperature
°C
Specific Heat Capacity (Cp)
(J/(g.K))
Thermal Diffusivity
α × 10−4 cm2 s−1
Thermal Conductivity
W/mK
250.689348.850.177079
500.731448.890.188572
1000.780228.790.206430
2000.826306.030.150026
3000.848215.300.135520
4000.922624.750.130734
Publisher’s Note: MDPI stays neutral with regard to jurisdictional claims in published maps and institutional affiliations.

