
Inline Monitoring of Battery Electrode Lamination Processes Based on Acoustic Measurements

 ,
,
Abstract
:1. Introduction
2. Materials and Methods
2.1. Materials
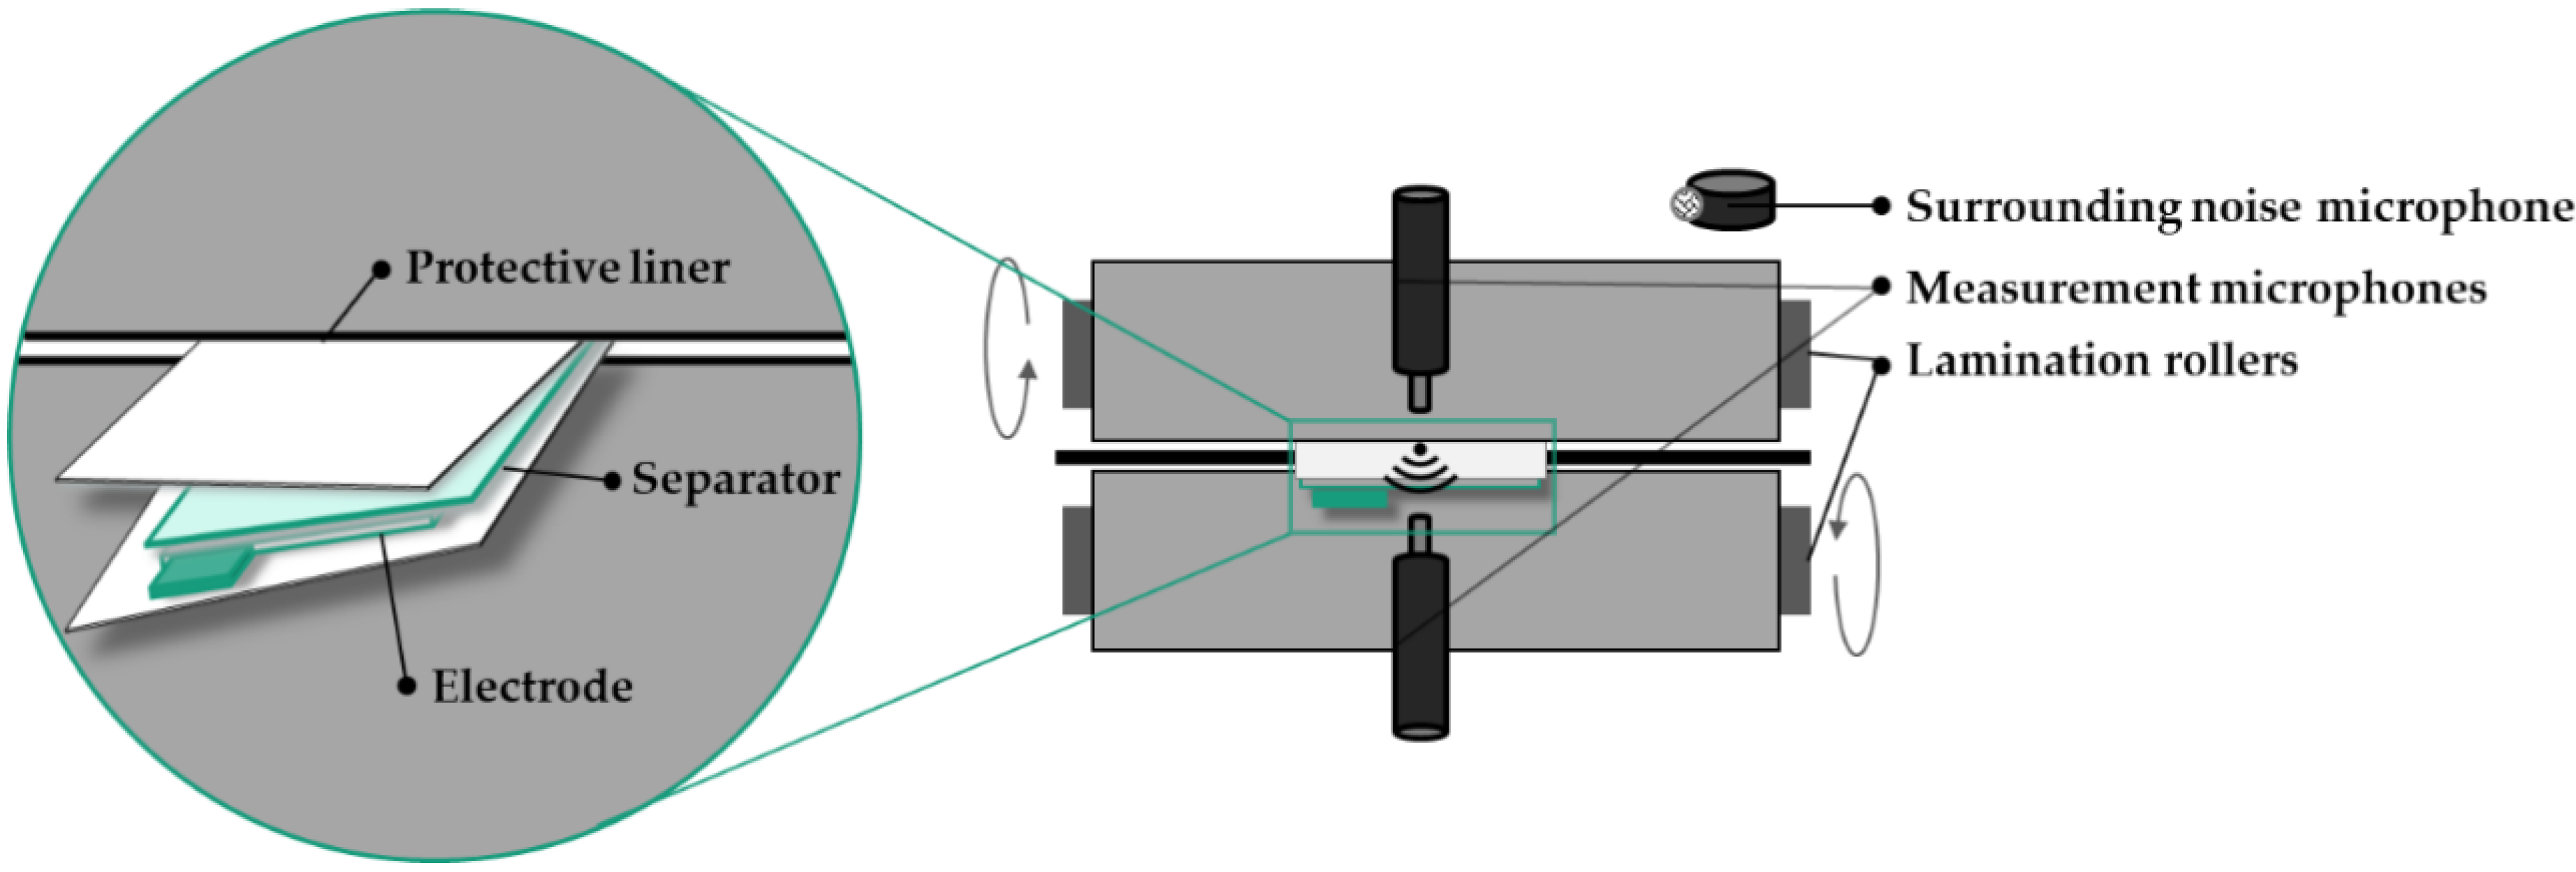
2.2. Test Setup and Recording Conditions
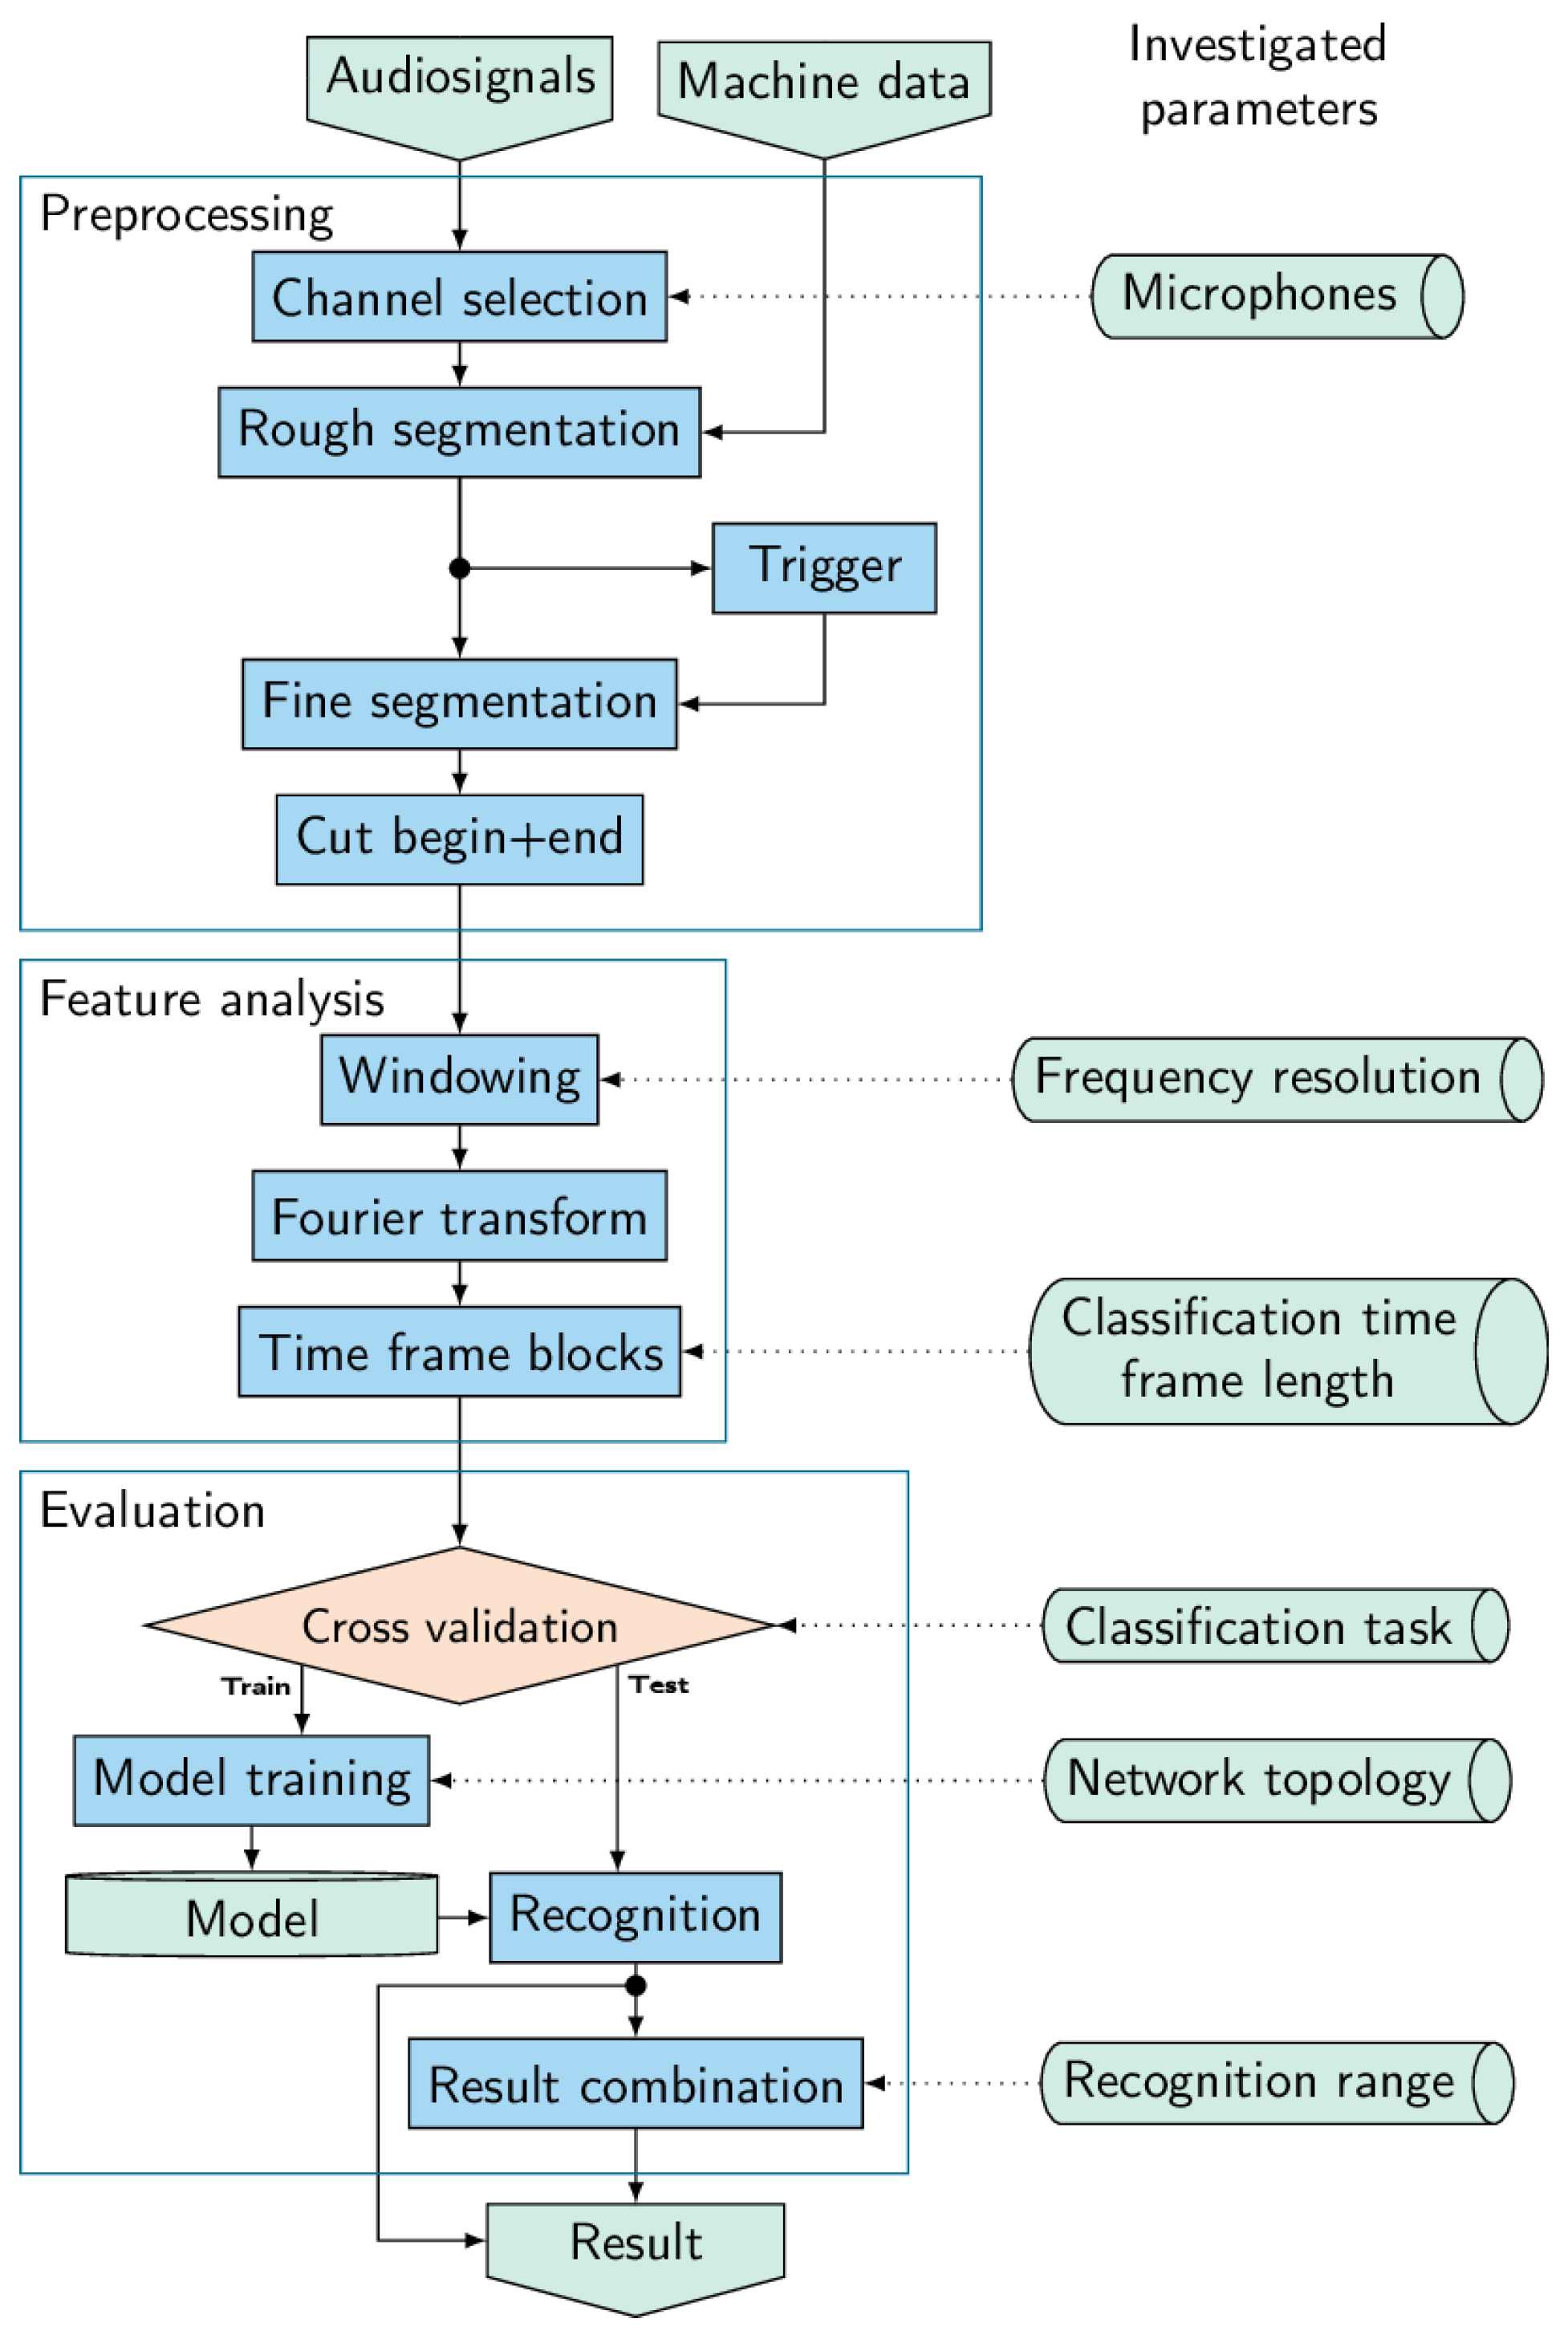
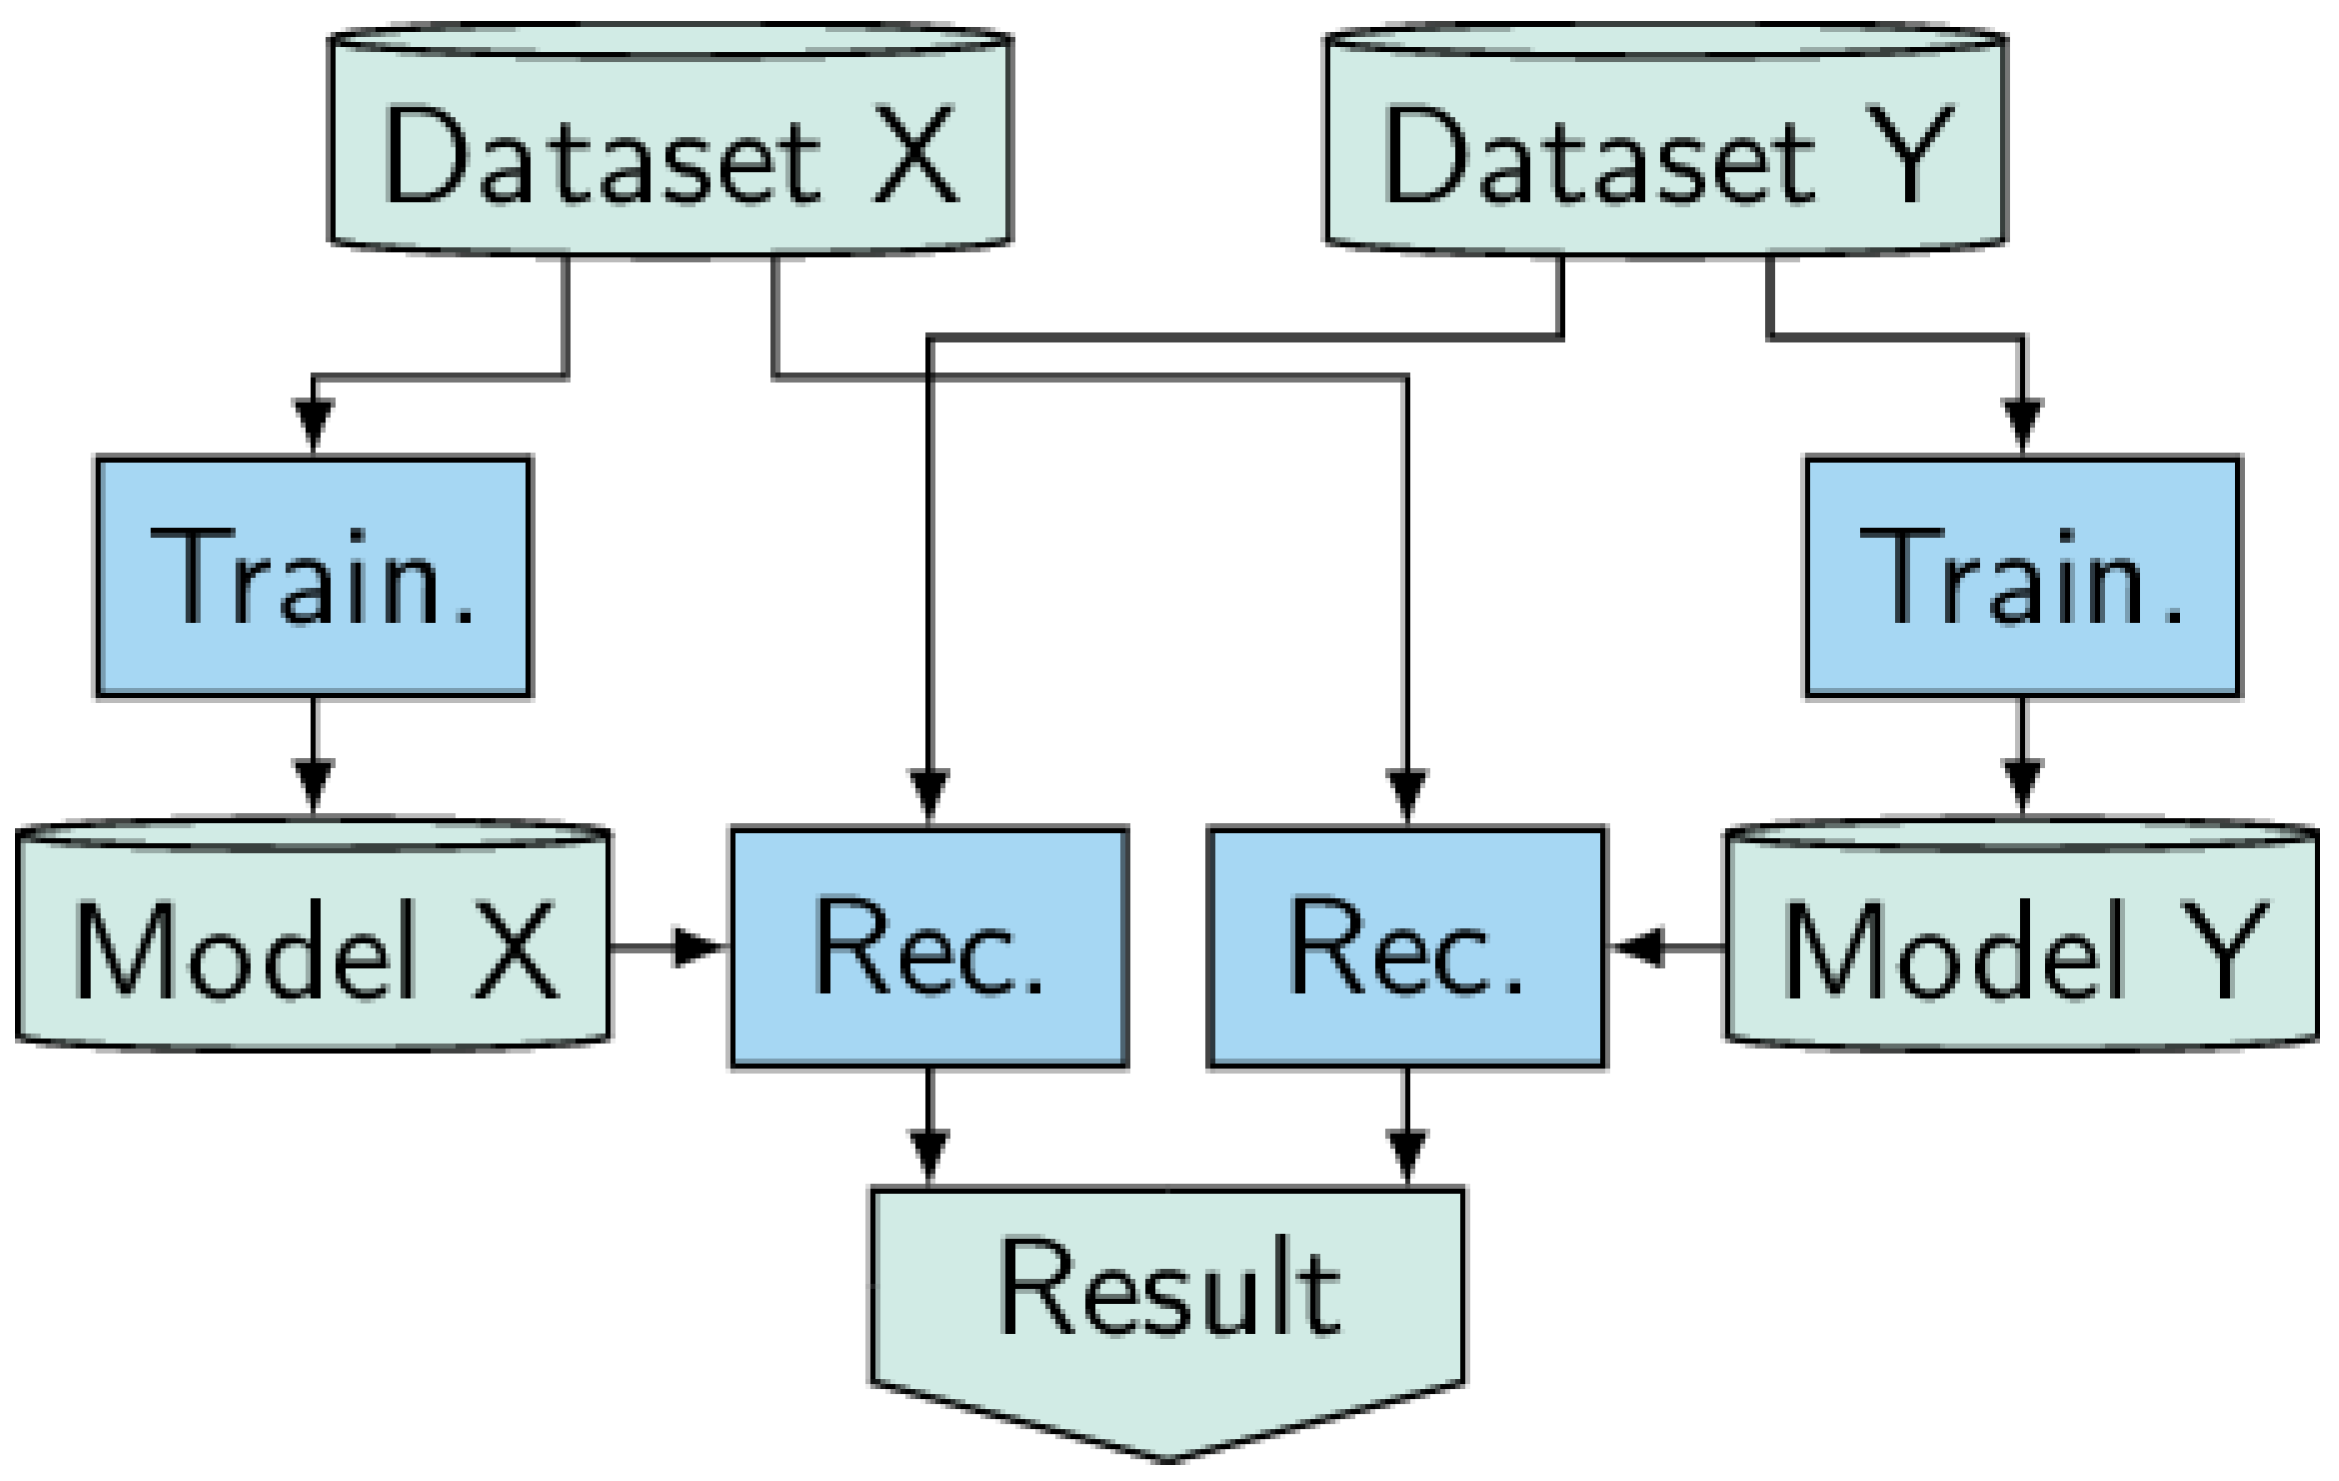
2.3. Signal Processing and Classification Algorithms
- MLP-S with three full connected layers using 300, 20 and 4 or 6 neurons
- MLP-L with three full connected layers using 1000, 50 and 4 or 6 neurons
- CNN-S with one convolutional layer using 8 filters as well as three full connected layers with 300, 20 and 4 or 6 neurons
- CNN-L with two convolutional layers using 8 and 16 filters as well as three full connected layers with 300, 20 and 4 or 6 neurons
3. Results
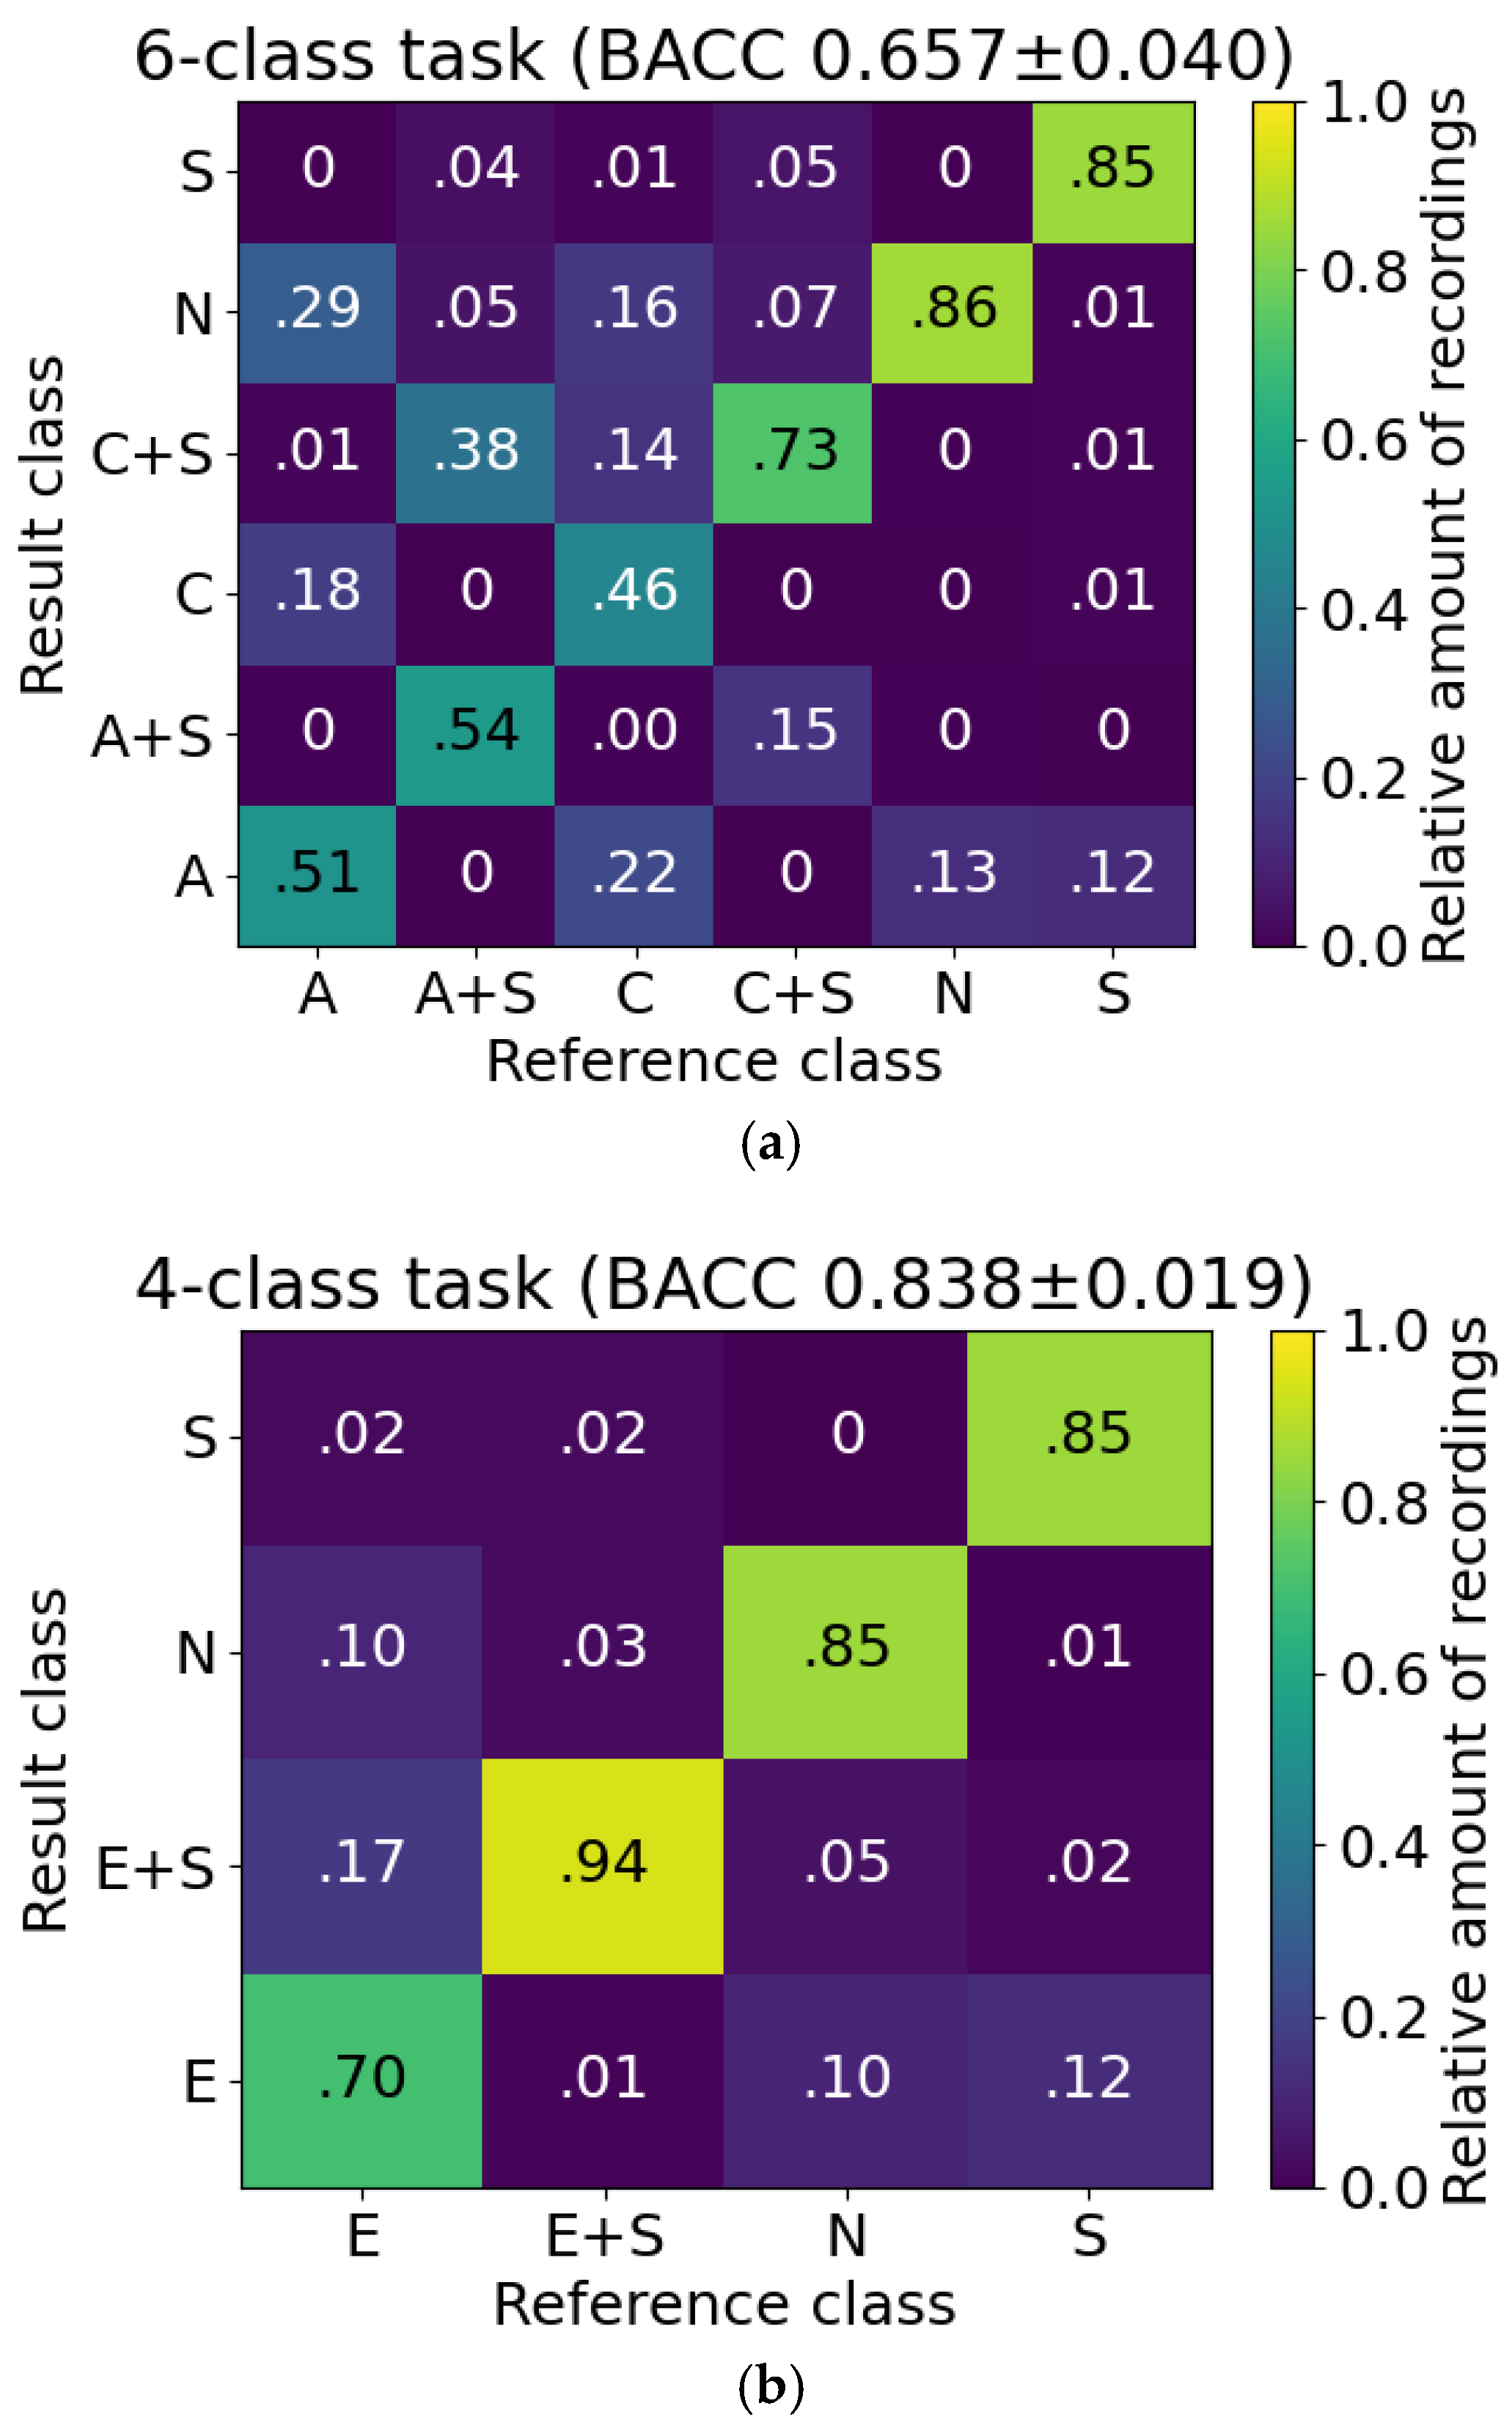
3.1. Achieved Accuracies for Classification
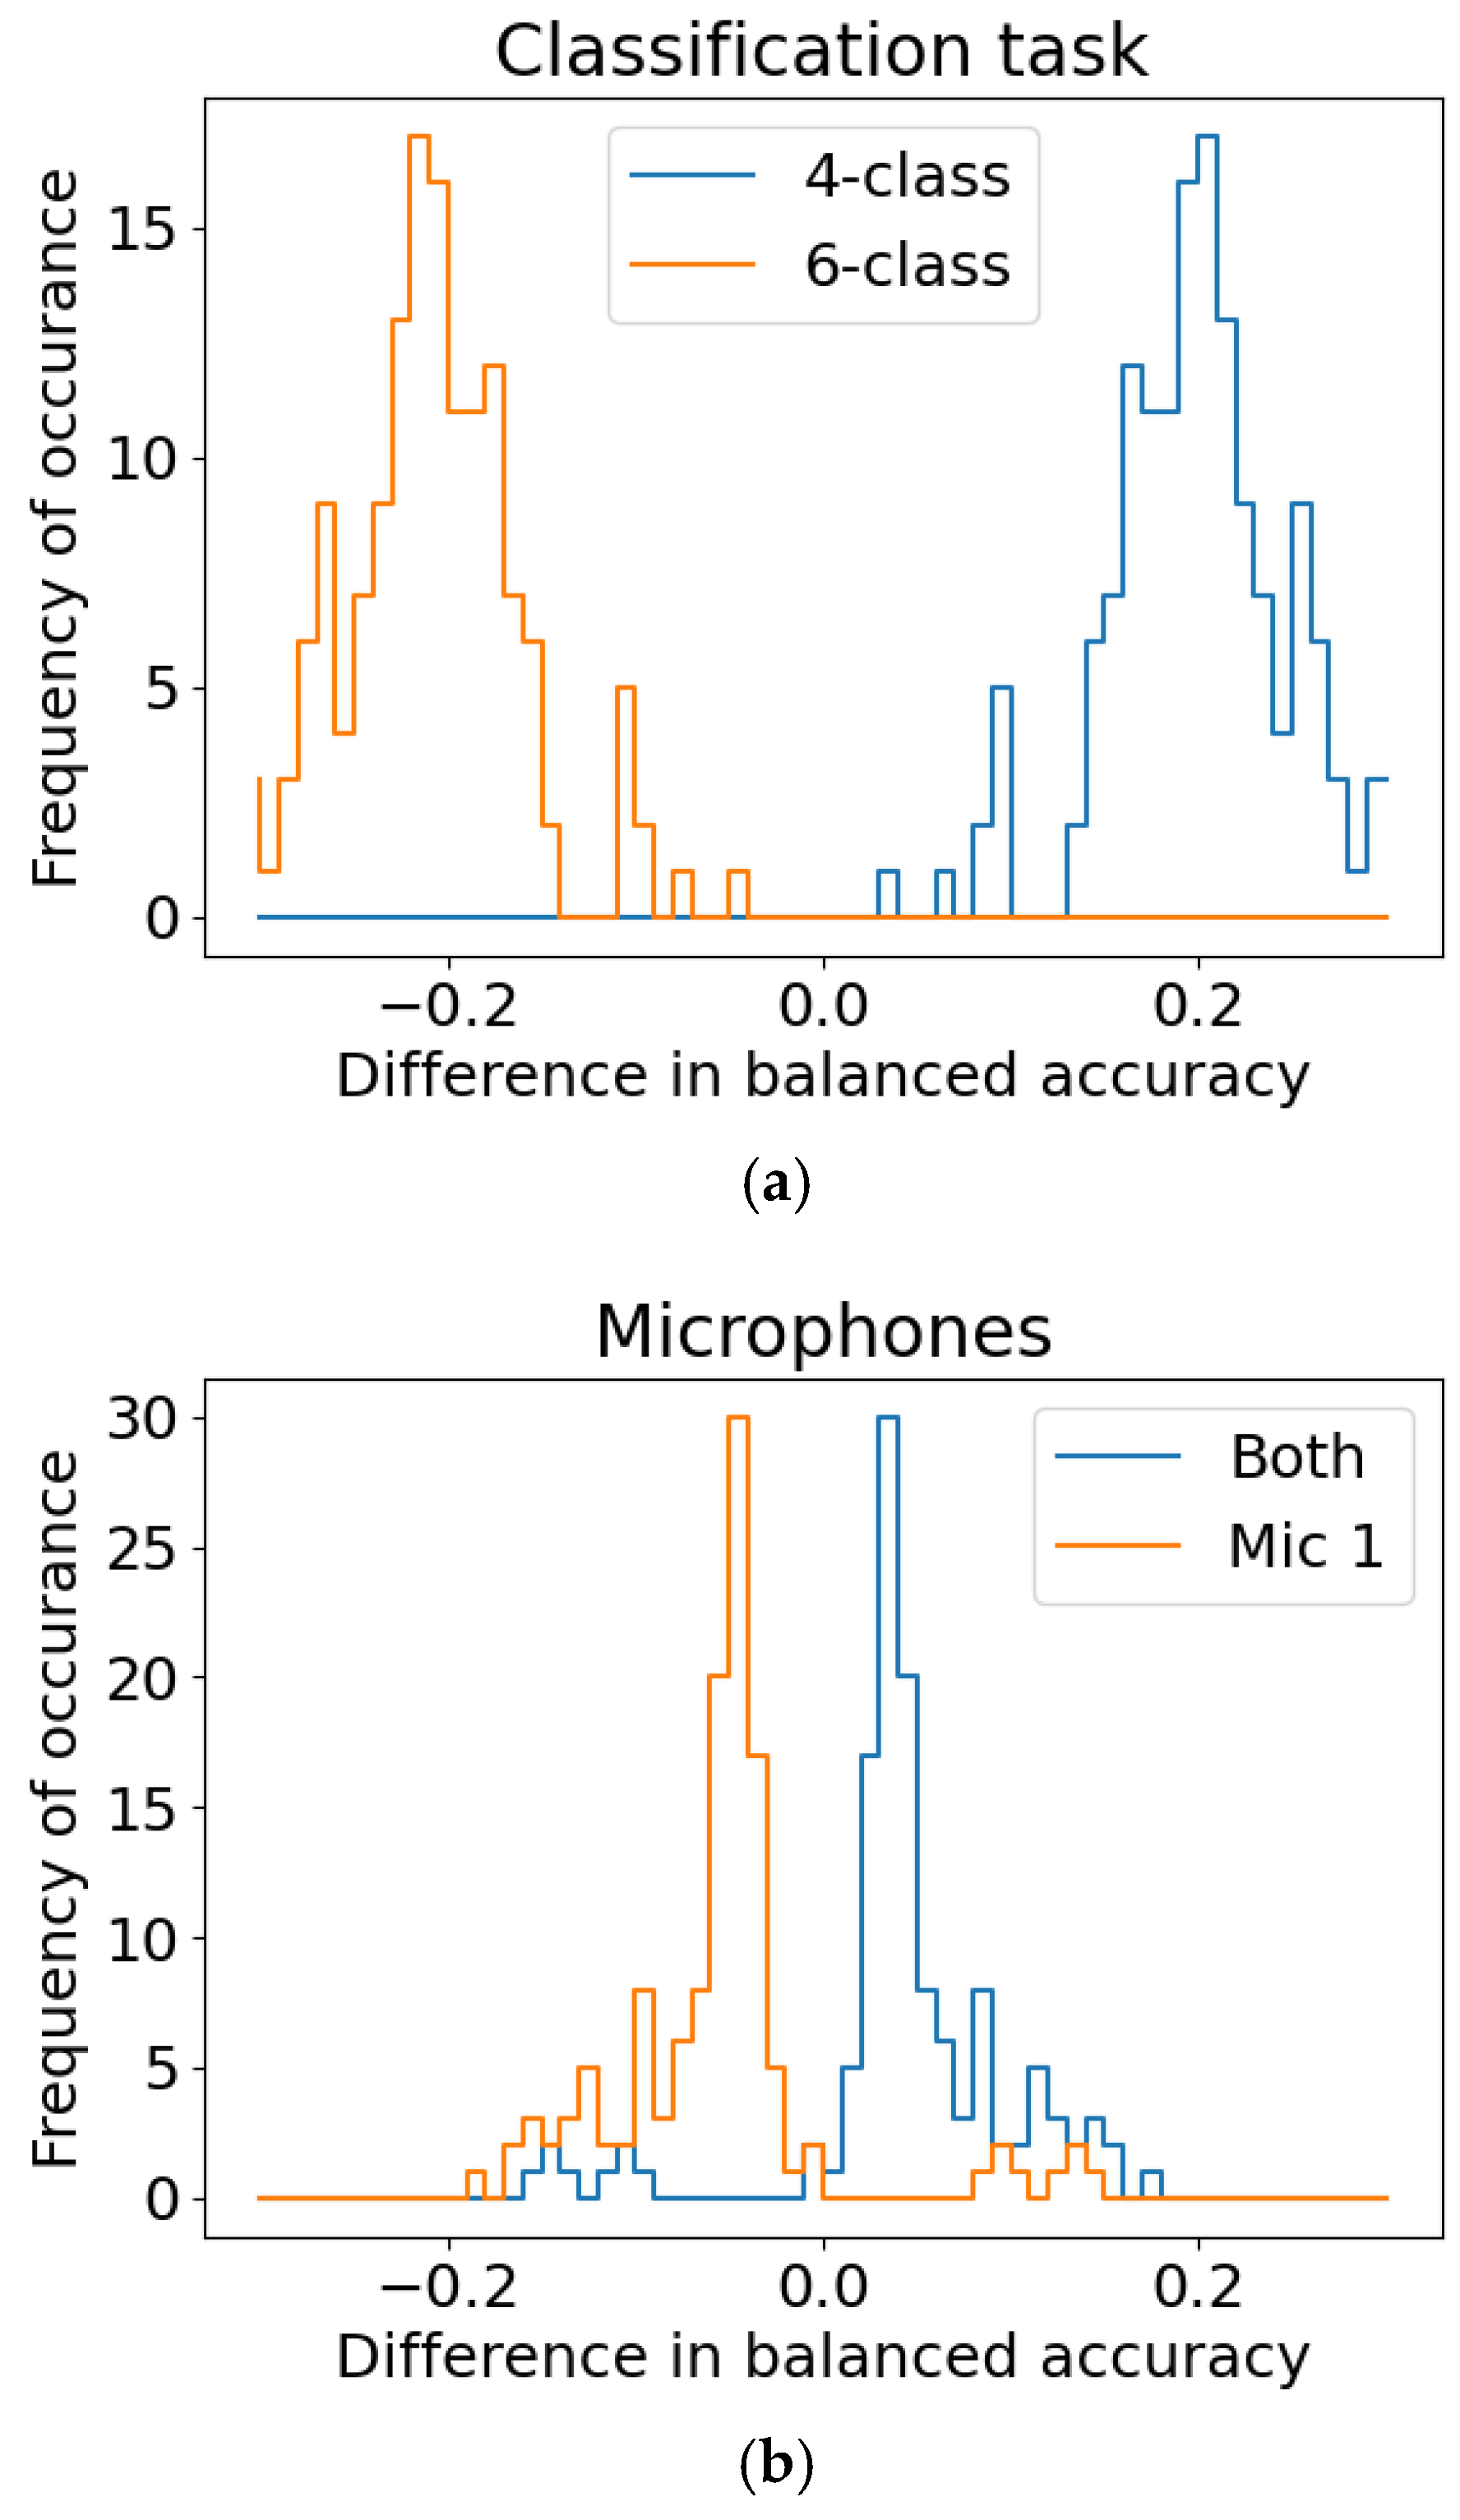
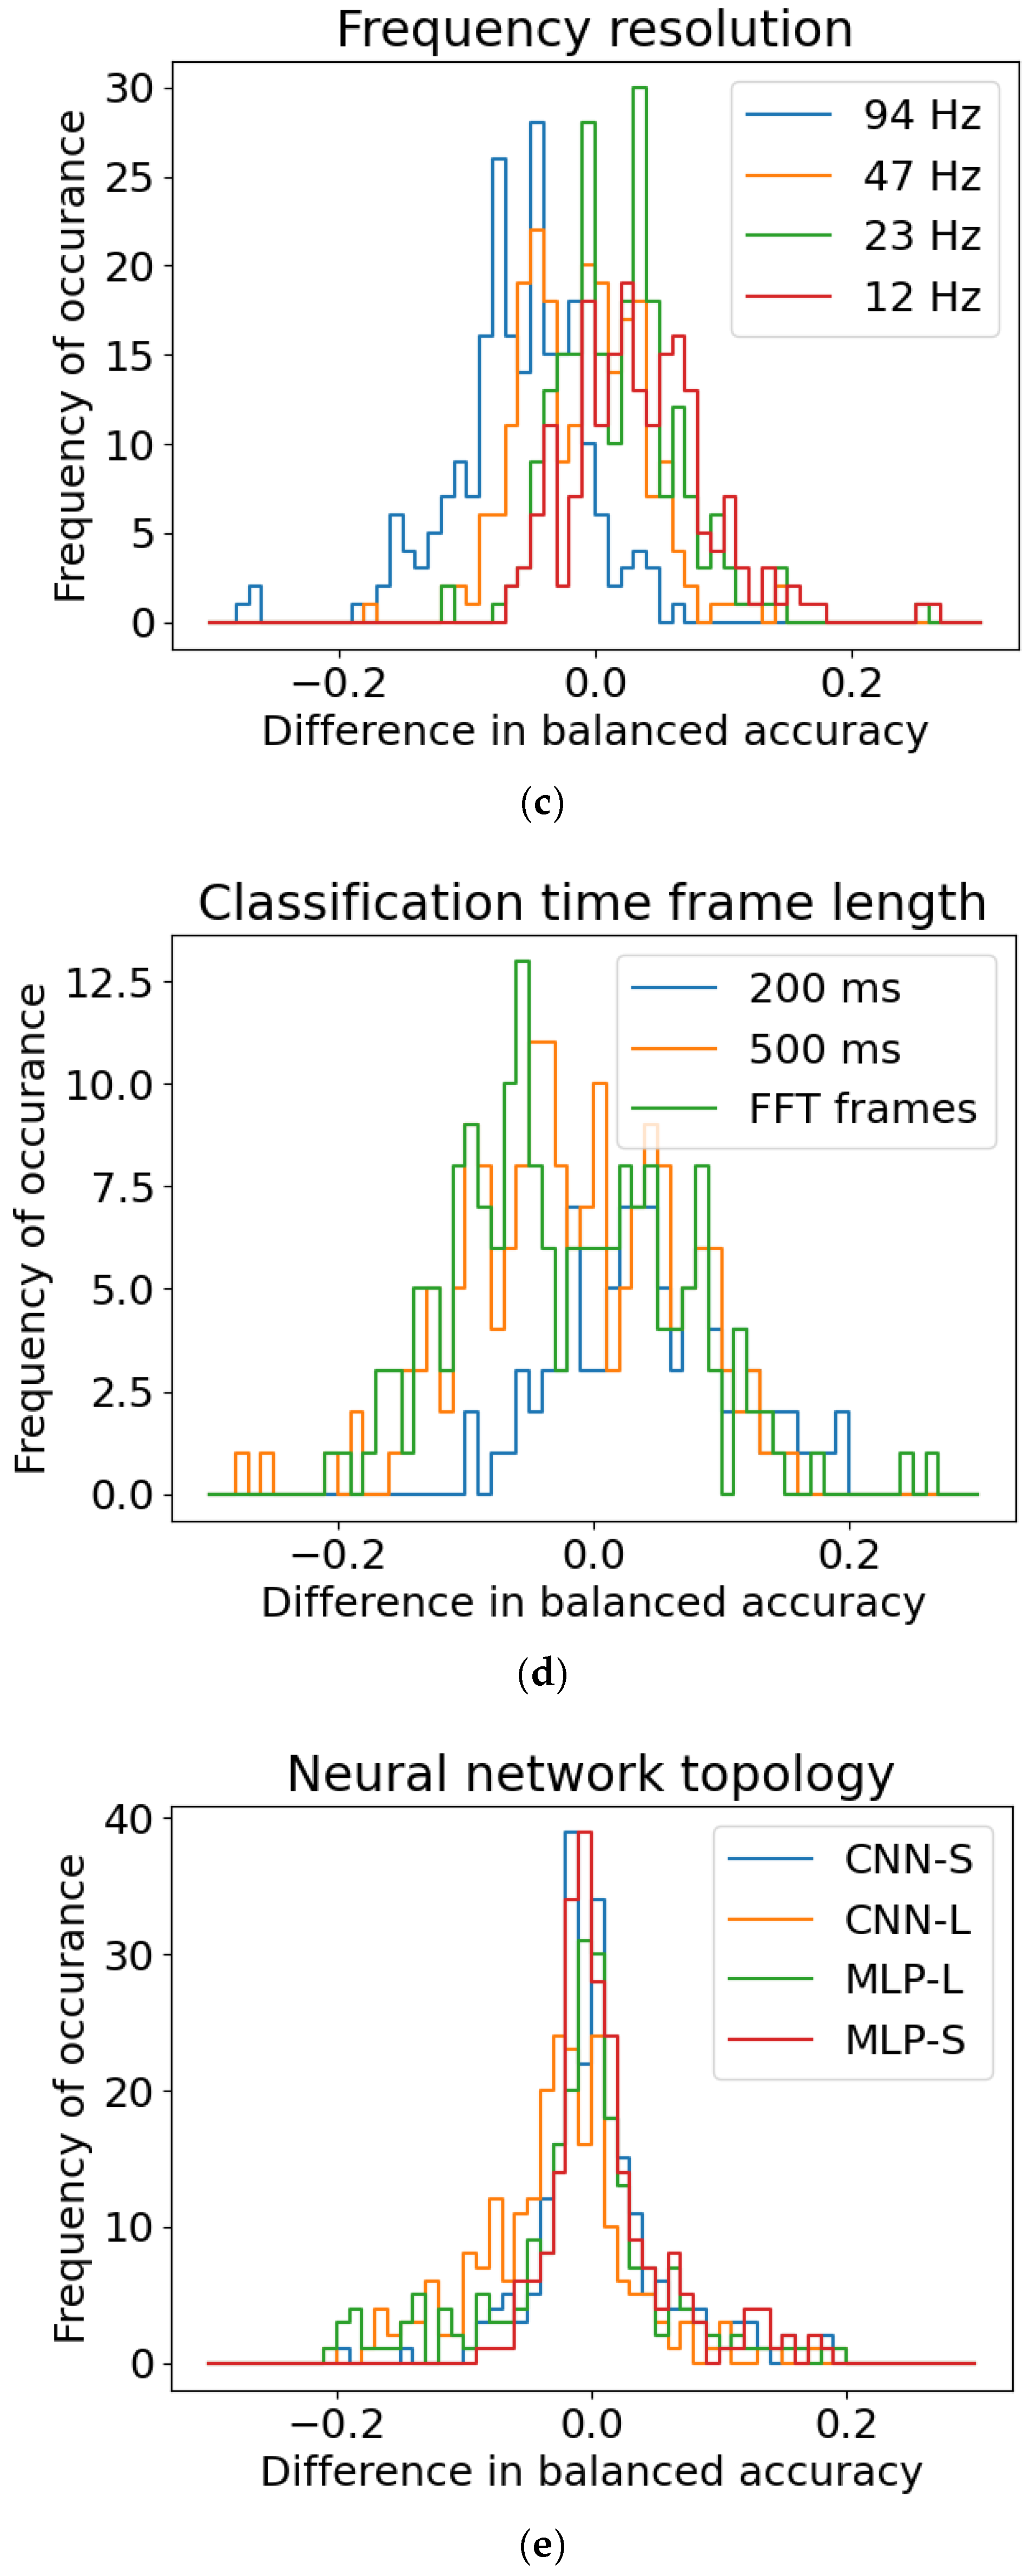
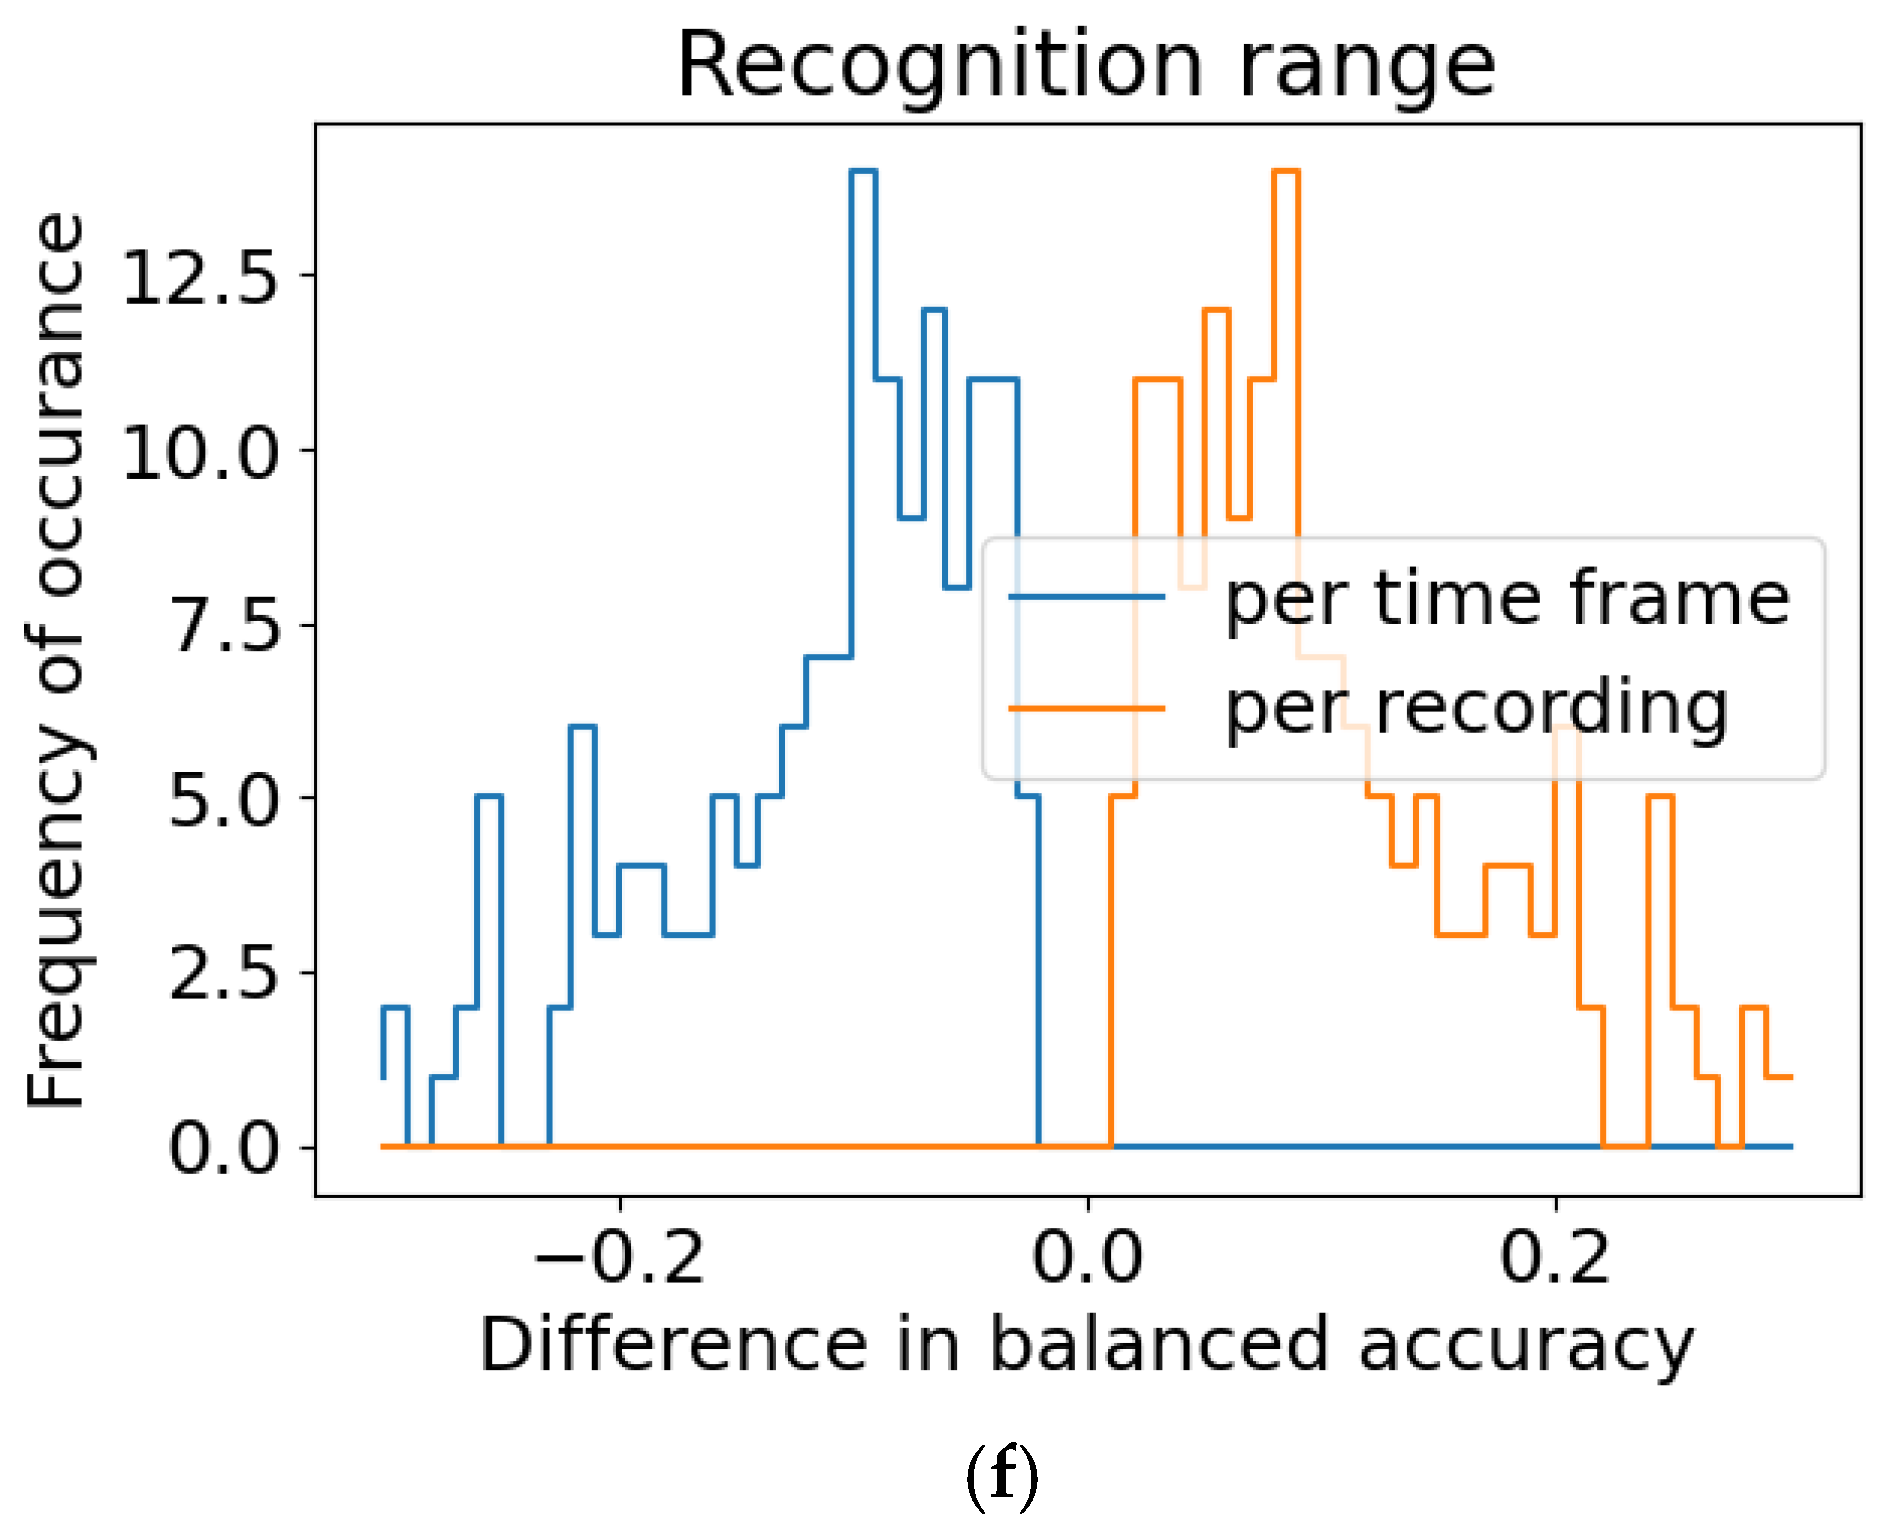
3.2. Comparison of Different Analysis and Classification Methods
4. Discussion and Conclusions
Author Contributions
Funding
Institutional Review Board Statement
Informed Consent Statement
Data Availability Statement
Conflicts of Interest
Appendix A

| Measurement | Electrode | Separator | Protective Liner | Time From | Time Until | Comment |
|---|---|---|---|---|---|---|
| 1 | Without | Without | 1 | 13:57:00 | 13:57:07 | |
| 2 | Without | Without | 1 | 13:57:20 | 13:57:28 | |
| 3 | Without | Without | 1 | 13:57:45 | 13:57:53 | |
| 4 | Without | Separator | 2 | 13:58:30 | 13:58:34 | |
| 5 | Without | Separator | 2 | 13:59:00 | 13:59:04 | |
| 6 | Without | Separator | 2 | 13:59:15 | 13:59:19 | |
| 7 | Anode 1 | Without | 3 | 14:00:00 | 14:00:04 | |
| 8 | Anode 1 | Without | 3 | 14:00:15 | 14:00:19 | |
| 9 | Anode 1 | Without | 3 | 14:00:40 | 14:00:44 | |
| 10 | Anode 2 | Without | 4 | 14:01:05 | 14:01:19 | |
| 11 | Anode 2 | Without | 4 | 14:01:30 | 14:01:34 | |
| 12 | Anode 2 | Without | 4 | 14:01:45 | 14:01:49 | |
| 13 | Cathode 1 | Without | 7 | 14:02:20 | 14:02:24 | |
| 14 | Cathode 1 | Without | 7 | 14:02:35 | 14:02:39 | |
| 15 | Cathode 1 | Without | 7 | 14:02:55 | 14:02:59 | |
| 16 | Cathode 2 | Without | 8 | 14:05:35 | 14:05:39 | |
| 17 | Cathode 2 | Without | 8 | 14:05:50 | 14:05:54 | Background noise |
| 18 | Cathode 2 | Without | 8 | 14:06:15 | 14:06:19 | |
| 19 | Anode 2 | Without | 4 | 14:06:55 | 14:06:59 | |
| 20 | Anode 2 | Without | 4 | 14:07:10 | 14:07:14 | |
| 21 | Anode 2 | Without | 4 | 14:07:25 | 14:07:29 | |
| 22 | Without | Separator | 2 | 14:11:15 | 14:11:19 | Background noise |
| 23 | Without | Separator | 2 | 14:12:05 | 14:12:09 | |
| 24 | Without | Separator | 2 | 14:12:30 | 14:12:34 | |
| 25 | Without | Without | 1 | 14:14:10 | 14:14:17 | |
| 26 | Without | Without | 1 | 14:14:25 | 14:14:33 | |
| 27 | Without | Without | 1 | 14:14:40 | 14:14:48 | |
| 28 | Cathode 2 | Without | 8 | 14:15:10 | 14:15:14 | Background noise |
| 29 | Cathode 2 | Without | 8 | 14:15:25 | 14:15:29 | |
| 30 | Cathode 2 | Without | 8 | 14:16:00 | 14:16:04 | Background noise |
| 31 | Anode 1 | Without | 3 | 14:17:40 | 14:17:44 | |
| 32 | Anode 1 | Without | 3 | 14:17:50 | 14:17:54 | |
| 33 | Anode 1 | Without | 3 | 14:18:00 | 14:18:04 | |
| 34 | Without | Without | 1 | 14:19:50 | 14:19:56 | |
| 35 | Without | Without | 1 | 14:20:05 | 14:20:12 | Background noise |
| 36 | Without | Without | 1 | 14:20:20 | 14:20:27 | |
| 37 | Cathode 1 | Without | 7 | 14:20:45 | 14:20:48 | |
| 38 | Cathode 1 | Without | 7 | 14:20:55 | 14:20:58 | |
| 39 | Cathode 1 | Without | 7 | 14:21:05 | 14:21:08 | |
| 40 | Anode 1 | With | 3 | 14:32:00 | 14:32:04 | |
| 41 | Anode 1 | With | 3 | 14:32:15 | 14:32:20 | |
| 42 | Anode 1 | With | 3 | 14:32:25 | 14:32:30 | |
| 43 | Cathode 2 | With | 8 | 14:32:55 | 14:32:59 | |
| 44 | Cathode 2 | With | 8 | 14:33:05 | 14:33:09 | |
| 45 | Cathode 2 | With | 8 | 14:33:15 | 14:33:19 | |
| 46 | Without | Separator | 2 | 14:33:56 | 14:34:00 | |
| 47 | Without | Separator | 2 | 14:34:10 | 14:34:14 | |
| 48 | Without | Separator | 2 | 14:34:25 | 14:34:30 | |
| 49 | Anode 2 | With | 4 | 14:35:08 | 14:35:10 | Aborted |
| 50 | Anode 2 | With | 4 | 14:35:35 | 14:35:40 | |
| 51 | Anode 2 | With | 4 | 14:35:50 | 14:35:54 | |
| 52 | Anode 2 | With | 4 | 14:36:05 | 14:36:09 | |
| 53 | Cathode 2 | With | 8 | 14:36:55 | 14:36:59 | |
| 54 | Cathode 2 | With | 8 | 14:37:05 | 14:37:09 | |
| 55 | Cathode 2 | With | 8 | 14:37:15 | 14:37:19 | Background noise |
| 56 | Cathode 1 | With | 7 | 14:38:15 | 14:38:19 | |
| 57 | Cathode 1 | With | 7 | 14:38:25 | 14:38:29 | |
| 58 | Cathode 1 | With | 7 | 14:38:35 | 14:38:39 | |
| 59 | Anode 1 | With | 3 | 14:39:15 | 14:39:19 | |
| 60 | Anode 1 | With | 3 | 14:39:25 | 14:39:29 | |
| 61 | Anode 1 | With | 3 | 14:39:35 | 14:39:39 | |
| 62 | Without | Without | 1 | 14:40:15 | 14:40:22 | |
| 63 | Without | Without | 1 | 14:40:30 | 14:40:37 | |
| 64 | Without | Without | 1 | 14:40:45 | 14:40:52 | |
| 65 | Anode 2 | With | 4 | 14:41:15 | 14:41:19 | |
| 66 | Anode 2 | With | 4 | 14:41:25 | 14:41:29 | |
| 67 | Anode 2 | With | 4 | 14:41:35 | 14:41:39 | |
| 68 | Cathode 1 | With | 7 | 14:42:15 | 14:42:19 | |
| 69 | Cathode 1 | With | 7 | 14:42:25 | 14:42:29 | |
| 70 | Cathode 1 | With | 7 | 14:42:35 | 14:42:39 | |
| 71 | Without | Without | 1 | 14:43:15 | 14:43:22 | |
| 72 | Without | Without | 1 | 14:43:30 | 14:43:37 | |
| 73 | Without | Without | 1 | 14:43:45 | 14:43:52 | |
| 74 | Without | Separator | 2 | 14:44:15 | 14:44:19 | |
| 75 | Without | Separator | 2 | 14:44:25 | 14:44:29 | |
| 76 | Without | Separator | 2 | 14:44:35 | 14:44:39 | |
| 77 | Without | Without | 1 | 14:46:15 | 14:46:22 | |
| 78 | Without | Without | 1 | 14:46:30 | 14:46:37 | Background noise |
| 79 | Without | Without | 1 | 14:46:45 | 14:46:53 | |
| 80 | Without | Separator | 2 | 14:47:15 | 14:47:19 | |
| 81 | Without | Separator | 2 | 14:47:25 | 14:47:29 | |
| 82 | Without | Separator | 2 | 14:47:35 | 14:47:39 | |
| 83 | Anode 1 | With | 3 | 14:48:15 | 14:48:19 | |
| 84 | Anode 1 | With | 3 | 14:48:25 | 14:48:29 | |
| 85 | Anode 1 | With | 3 | 14:48:35 | 14:48:39 | |
| 86 | Anode 2 | With | 4 | 14:49:15 | 14:49:19 | |
| 87 | Anode 2 | With | 4 | 14:49:25 | 14:49:29 | |
| 88 | Anode 2 | With | 4 | 14:49:35 | 14:49:39 | Background noise |
| 89 | Cathode 1 | With | 7 | 14:50:15 | 14:50:19 | Background noise |
| 90 | Cathode 1 | With | 7 | 14:50:27 | 14:50:31 | |
| 91 | Cathode1 | With | 7 | 14:50:35 | 14:50:39 | |
| 92 | Cathode 2 | With | 8 | 14:51:15 | 14:51:19 | |
| 93 | Cathode 2 | With | 8 | 14:51:27 | 14:51:31 | |
| 94 | Cathode 2 | With | 8 | 14:51:35 | 14:51:39 | |
| 95 | Anode 2 | With | 4 | 14:52:15 | 14:52:19 | |
| 96 | Anode 2 | With | 4 | 14:52:25 | 14:52:29 | |
| 97 | Anode 2 | With | 4 | 14:52:35 | 14:52:39 | |
| 98 | Anode 1 | With | 3 | 14:53:15 | 14:53:19 | |
| 99 | Anode 1 | With | 3 | 14:53:25 | 14:53:29 | |
| 100 | Anode 1 | With | 3 | 14:53:35 | 14:52:39 | |
| 101 | Without | Separator | 2 | 14:54:15 | 14:54:19 | |
| 102 | Without | Separator | 2 | 14:54:25 | 14:54:28 | |
| 103 | Without | Separator | 2 | 14:54:35 | 14:54:39 | |
| 104 | Cathode 2 | With | 8 | 14:55:15 | 14:55:19 | |
| 105 | Cathode 2 | With | 8 | 14:55:25 | 14:55:28 | |
| 106 | Cathode 2 | With | 8 | 14:55:35 | 14:55:39 | |
| 107 | Without | Without | 1 | 14:56:15 | 14:56:22 | |
| 108 | Without | Without | 1 | 14:56:30 | 14:56:37 | |
| 109 | Without | Without | 1 | 14:56:45 | 14:56:53 | Background noise |
| 110 | Cathode 2 | With | 8 | 14:57:15 | 14:57:19 | Background noise |
| 111 | Cathode 2 | With | 8 | 14:57:25 | 14:57:29 | |
| 112 | Cathode 2 | With | 8 | 14:57:35 | 14:57:39 | |
| 113 | Without | Without | 1 | 14:58:15 | 14:58:22 | Background noise |
| 114 | Without | Without | 1 | 14:58:30 | 14:58:37 | |
| 115 | Without | Without | 1 | 14:58:45 | 14:58:53 | |
| 116 | Cathode 1 | With | 7 | 14:59:15 | 14:59:19 | Background noise |
| 117 | Cathode 1 | With | 7 | 14:59:25 | 14:59:29 | Background noise |
| 118 | Cathode 1 | With | 7 | 14:59:35 | 14:59:39 | |
| 119 | Anode 1 | Without | 3 | 15:02:15 | 15:02:19 | |
| 120 | Anode 1 | Without | 3 | 15:02:25 | 15:02:29 | Background noise |
| 121 | Anode 1 | Without | 3 | 15:02:35 | 15:02:39 | |
| 122 | Cathode 1 | Without | 7 | 15:03:15 | 15:03:19 | |
| 123 | Cathode 1 | Without | 7 | 15:03:25 | 15:03:29 | |
| 124 | Cathode | Without | 7 | 15:03:35 | 15:03:39 | |
| 125 | Anode 2 | Without | 4 | 15:04:15 | 15:04:19 | |
| 126 | Anode 2 | Without | 4 | 15:04:25 | 15:04:29 | |
| 127 | Anode 2 | Without | 4 | 15:04:35 | 15:04:39 | |
| 128 | Without | Separator | 2 | 15:11:15 | 15:11:19 | |
| 129 | Without | Separator | 2 | 15:11:25 | 15:11:29 | |
| 130 | Without | Separator | 2 | 15:11:35 | 15:11:39 | |
| 131 | Cathode 2 | Without | 8 | 15:12:15 | 15:12:19 | |
| 132 | Cathode 2 | Without | 8 | 15:12:25 | 15:12:29 | |
| 133 | Cathode 2 | Without | 8 | 15:12:35 | 15:12:39 | |
| 134 | Cathode 1 | Without | 7 | 15:13:15 | 15:13:19 | |
| 135 | Cathode 1 | Without | 7 | 15:13:25 | 15:13:29 | |
| 136 | Cathode 1 | Without | 7 | 15:13:35 | 15:13:39 | |
| 137 | Anode 1 | Without | 3 | 15:14:15 | 15:14:19 | Background noise |
| 138 | Anode 1 | Without | 3 | 15:14:25 | 15:14:29 | Background noise |
| 139 | Anode 1 | Without | 3 | 15:14:35 | 15:14:39 | |
| 140 | Cathode 2 | Without | 8 | 15:15:15 | 15:15:19 | |
| 141 | Cathode 2 | Without | 8 | 15:15:25 | 15:15:29 | |
| 142 | Cathode 2 | Without | 8 | 15:15:35 | 15:15:39 | |
| 143 | Without | Separator | 2 | 15:16:15 | 15:16:19 | |
| 144 | Without | Separator | 2 | 15:16:25 | 15:16:29 | Background noise |
| 145 | Without | Separator | 2 | 15:16:35 | 15:16:39 | Background noise |
| 146 | Anode 2 | Without | 4 | 15:17:15 | 15:17:19 | Background noise |
| 147 | Anode 2 | Without | 4 | 15:17:25 | 15:17:29 | Background noise |
| 148 | Anode 2 | Without | 4 | 15:17:35 | 15:17:39 | Background noise |
| Class. Task | Mics. | Freq. Res. | Frame Len. | Top. | Rec. Range | BACC | CONF |
|---|---|---|---|---|---|---|---|
| 4-class | Mic 1 | 94 Hz | 500 ms | CNN-S | per frame | 0.59 | ±0.014 |
| 4-class | Mic 1 | 94 Hz | 500 ms | CNN-S | per rec. | 0.68 | ±0.023 |
| 4-class | Mic 1 | 94 Hz | 500 ms | CNN-L | per frame | 0.57 | ±0.021 |
| 4-class | Mic 1 | 94 Hz | 500 ms | CNN-L | per rec. | 0.63 | ±0.031 |
| 4-class | Mic 1 | 94 Hz | 500 ms | MLP-L | per frame | 0.62 | ±0.009 |
| 4-class | Mic 1 | 94 Hz | 500 ms | MLP-L | per rec. | 0.69 | ±0.015 |
| 4-class | Mic 1 | 94 Hz | 500 ms | MLP-S | per frame | 0.60 | ±0.010 |
| 4-class | Mic 1 | 94 Hz | 500 ms | MLP-S | per rec. | 0.66 | ±0.018 |
| 4-class | Mic 1 | 94 Hz | FFT | CNN-S | per frame | 0.46 | ±0.008 |
| 4-class | Mic 1 | 94 Hz | FFT | CNN-S | per rec. | 0.67 | ±0.021 |
| 4-class | Mic 1 | 94 Hz | FFT | CNN-L | per frame | 0.45 | ±0.009 |
| 4-class | Mic 1 | 94 Hz | FFT | CNN-L | per rec. | 0.64 | ±0.026 |
| 4-class | Mic 1 | 94 Hz | FFT | MLP-L | per frame | 0.47 | ±0.004 |
| 4-class | Mic 1 | 94 Hz | FFT | MLP-L | per rec. | 0.73 | ±0.018 |
| 4-class | Mic 1 | 94 Hz | FFT | MLP-S | per frame | 0.46 | ±0.005 |
| 4-class | Mic 1 | 94 Hz | FFT | MLP-S | per rec. | 0.73 | ±0.020 |
| 4-class | Both | 94 Hz | 200 ms | CNN-S | per frame | 0.67 | ±0.009 |
| 4-class | Both | 94 Hz | 200 ms | CNN-S | per rec. | 0.81 | ±0.020 |
| 4-class | Both | 94 Hz | 200 ms | CNN-L | per frame | 0.69 | ±0.014 |
| 4-class | Both | 94 Hz | 200 ms | CNN-L | per rec. | 0.82 | ±0.022 |
| 4-class | Both | 94 Hz | 200 ms | MLP-L | per frame | 0.62 | ±0.016 |
| 4-class | Both | 94 Hz | 200 ms | MLP-L | per rec. | 0.71 | ±0.030 |
| 4-class | Both | 94 Hz | 200 ms | MLP-S | per frame | 0.66 | ±0.011 |
| 4-class | Both | 94 Hz | 200 ms | MLP-S | per rec. | 0.78 | ±0.023 |
| 4-class | Both | 94 Hz | 500 ms | CNN-S | per frame | 0.63 | ±0.011 |
| 4-class | Both | 94 Hz | 500 ms | CNN-S | per rec. | 0.72 | ±0.019 |
| 4-class | Both | 94 Hz | 500 ms | CNN-L | per frame | 0.65 | ±0.015 |
| 4-class | Both | 94 Hz | 500 ms | CNN-L | per rec. | 0.74 | ±0.025 |
| 4-class | Both | 94 Hz | 500 ms | MLP-L | per frame | 0.51 | ±0.023 |
| 4-class | Both | 94 Hz | 500 ms | MLP-L | per rec. | 0.54 | ±0.033 |
| 4-class | Both | 94 Hz | 500 ms | MLP-S | per frame | 0.65 | ±0.010 |
| 4-class | Both | 94 Hz | 500 ms | MLP-S | per rec. | 0.73 | ±0.018 |
| 4-class | Both | 94 Hz | FFT | CNN-S | per frame | 0.50 | ±0.008 |
| 4-class | Both | 94 Hz | FFT | CNN-S | per rec. | 0.81 | ±0.023 |
| 4-class | Both | 94 Hz | FFT | CNN-L | per frame | 0.49 | ±0.008 |
| 4-class | Both | 94 Hz | FFT | CNN-L | per rec. | 0.78 | ±0.018 |
| 4-class | Both | 94 Hz | FFT | MLP-L | per frame | 0.52 | ±0.006 |
| 4-class | Both | 94 Hz | FFT | MLP-L | per rec. | 0.81 | ±0.027 |
| 4-class | Both | 94 Hz | FFT | MLP-S | per frame | 0.51 | ±0.006 |
| 4-class | Both | 94 Hz | FFT | MLP-S | per rec. | 0.81 | ±0.024 |
| 4-class | Both | 47 Hz | 200 ms | CNN-S | per frame | 0.70 | ±0.009 |
| 4-class | Both | 47 Hz | 200 ms | CNN-S | per rec. | 0.84 | ±0.019 |
| 4-class | Both | 47 Hz | 200 ms | CNN-L | per frame | 0.68 | ±0.016 |
| 4-class | Both | 47 Hz | 200 ms | CNN-L | per rec. | 0.81 | ±0.023 |
| 4-class | Both | 47 Hz | 200 ms | MLP-L | per frame | 0.66 | ±0.015 |
| 4-class | Both | 47 Hz | 200 ms | MLP-L | per rec. | 0.76 | ±0.026 |
| 4-class | Both | 47 Hz | 200 ms | MLP-S | per frame | 0.68 | ±0.012 |
| 4-class | Both | 47 Hz | 200 ms | MLP-S | per rec. | 0.77 | ±0.024 |
| 4-class | Both | 47 Hz | 500 ms | CNN-S | per frame | 0.67 | ±0.012 |
| 4-class | Both | 47 Hz | 500 ms | CNN-S | per rec. | 0.76 | ±0.014 |
| 4-class | Both | 47 Hz | 500 ms | CNN-L | per frame | 0.65 | ±0.013 |
| 4-class | Both | 47 Hz | 500 ms | CNN-L | per rec. | 0.74 | ±0.021 |
| 4-class | Both | 47 Hz | 500 ms | MLP-L | per frame | 0.53 | ±0.020 |
| 4-class | Both | 47 Hz | 500 ms | MLP-L | per rec. | 0.56 | ±0.030 |
| 4-class | Both | 47 Hz | 500 ms | MLP-S | per frame | 0.66 | ±0.009 |
| 4-class | Both | 47 Hz | 500 ms | MLP-S | per rec. | 0.75 | ±0.015 |
| 4-class | Both | 47 Hz | FFT | CNN-S | per frame | 0.58 | ±0.009 |
| 4-class | Both | 47 Hz | FFT | CNN-S | per rec. | 0.82 | ±0.028 |
| 4-class | Both | 47 Hz | FFT | CNN-L | per frame | 0.56 | ±0.010 |
| 4-class | Both | 47 Hz | FFT | CNN-L | per rec. | 0.82 | ±0.026 |
| 4-class | Both | 47 Hz | FFT | MLP-L | per frame | 0.56 | ±0.009 |
| 4-class | Both | 47 Hz | FFT | MLP-L | per rec. | 0.81 | ±0.032 |
| 4-class | Both | 47 Hz | FFT | MLP-S | per frame | 0.56 | ±0.009 |
| 4-class | Both | 47 Hz | FFT | MLP-S | per rec. | 0.82 | ±0.034 |
| 4-class | Both | 23 Hz | 200 ms | CNN-S | per frame | 0.70 | ±0.015 |
| 4-class | Both | 23 Hz | 200 ms | CNN-S | per rec. | 0.83 | ±0.029 |
| 4-class | Both | 23 Hz | 200 ms | CNN-L | per frame | 0.64 | ±0.018 |
| 4-class | Both | 23 Hz | 200 ms | CNN-L | per rec. | 0.77 | ±0.029 |
| 4-class | Both | 23 Hz | 200 ms | MLP-L | per frame | 0.66 | ±0.018 |
| 4-class | Both | 23 Hz | 200 ms | MLP-L | per rec. | 0.75 | ±0.034 |
| 4-class | Both | 23 Hz | 200 ms | MLP-S | per frame | 0.68 | ±0.018 |
| 4-class | Both | 23 Hz | 200 ms | MLP-S | per rec. | 0.78 | ±0.029 |
| 4-class | Both | 23 Hz | 500 ms | CNN-S | per frame | 0.70 | ±0.014 |
| 4-class | Both | 23 Hz | 500 ms | CNN-S | per rec. | 0.80 | ±0.021 |
| 4-class | Both | 23 Hz | 500 ms | CNN-L | per frame | 0.66 | ±0.024 |
| 4-class | Both | 23 Hz | 500 ms | CNN-L | per rec. | 0.74 | ±0.036 |
| 4-class | Both | 23 Hz | 500 ms | MLP-L | per frame | 0.58 | ±0.026 |
| 4-class | Both | 23 Hz | 500 ms | MLP-L | per rec. | 0.63 | ±0.040 |
| 4-class | Both | 23 Hz | 500 ms | MLP-S | per frame | 0.69 | ±0.012 |
| 4-class | Both | 23 Hz | 500 ms | MLP-S | per rec. | 0.79 | ±0.017 |
| 4-class | Both | 23 Hz | FFT | CNN-S | per frame | 0.62 | ±0.014 |
| 4-class | Both | 23 Hz | FFT | CNN-S | per rec. | 0.80 | ±0.035 |
| 4-class | Both | 23 Hz | FFT | CNN-L | per frame | 0.59 | ±0.012 |
| 4-class | Both | 23 Hz | FFT | CNN-L | per rec. | 0.79 | ±0.035 |
| 4-class | Both | 23 Hz | FFT | MLP-L | per frame | 0.61 | ±0.009 |
| 4-class | Both | 23 Hz | FFT | MLP-L | per rec. | 0.81 | ±0.027 |
| 4-class | Both | 23 Hz | FFT | MLP-S | per frame | 0.60 | ±0.010 |
| 4-class | Both | 23 Hz | FFT | MLP-S | per rec. | 0.83 | ±0.029 |
| 4-class | Both | 12 Hz | 500 ms | CNN-S | per frame | 0.71 | ±0.013 |
| 4-class | Both | 12 Hz | 500 ms | CNN-S | per rec. | 0.80 | ±0.022 |
| 4-class | Both | 12 Hz | 500 ms | CNN-L | per frame | 0.67 | ±0.019 |
| 4-class | Both | 12 Hz | 500 ms | CNN-L | per rec. | 0.77 | ±0.027 |
| 4-class | Both | 12 Hz | 500 ms | MLP-L | per frame | 0.57 | ±0.020 |
| 4-class | Both | 12 Hz | 500 ms | MLP-L | per rec. | 0.62 | ±0.029 |
| 4-class | Both | 12 Hz | 500 ms | MLP-S | per frame | 0.71 | ±0.015 |
| 4-class | Both | 12 Hz | 500 ms | MLP-S | per rec. | 0.80 | ±0.023 |
| 4-class | Both | 12 Hz | FFT | CNN-S | per frame | 0.64 | ±0.019 |
| 4-class | Both | 12 Hz | FFT | CNN-S | per rec. | 0.76 | ±0.040 |
| 4-class | Both | 12 Hz | FFT | CNN-L | per frame | 0.63 | ±0.023 |
| 4-class | Both | 12 Hz | FFT | CNN-L | per rec. | 0.79 | ±0.039 |
| 4-class | Both | 12 Hz | FFT | MLP-L | per frame | 0.63 | ±0.017 |
| 4-class | Both | 12 Hz | FFT | MLP-L | per rec. | 0.76 | ±0.038 |
| 4-class | Both | 12 Hz | FFT | MLP-S | per frame | 0.64 | ±0.015 |
| 4-class | Both | 12 Hz | FFT | MLP-S | per rec. | 0.78 | ±0.032 |
| 4-class | Mic 1 | 47 Hz | 500 ms | CNN-S | per frame | 0.63 | ±0.013 |
| 4-class | Mic 1 | 47 Hz | 500 ms | CNN-S | per rec. | 0.70 | ±0.020 |
| 4-class | Mic 1 | 47 Hz | 500 ms | CNN-L | per frame | 0.56 | ±0.019 |
| 4-class | Mic 1 | 47 Hz | 500 ms | CNN-L | per rec. | 0.61 | ±0.028 |
| 4-class | Mic 1 | 47 Hz | 500 ms | MLP-L | per frame | 0.63 | ±0.007 |
| 4-class | Mic 1 | 47 Hz | 500 ms | MLP-L | per rec. | 0.71 | ±0.009 |
| 4-class | Mic 1 | 47 Hz | 500 ms | MLP-S | per frame | 0.63 | ±0.009 |
| 4-class | Mic 1 | 47 Hz | 500 ms | MLP-S | per rec. | 0.68 | ±0.016 |
| 4-class | Mic 1 | 47 Hz | FFT | CNN-S | per frame | 0.53 | ±0.012 |
| 4-class | Mic 1 | 47 Hz | FFT | CNN-S | per rec. | 0.73 | ±0.031 |
| 4-class | Mic 1 | 47 Hz | FFT | CNN-L | per frame | 0.53 | ±0.012 |
| 4-class | Mic 1 | 47 Hz | FFT | CNN-L | per rec. | 0.70 | ±0.034 |
| 4-class | Mic 1 | 47 Hz | FFT | MLP-L | per frame | 0.52 | ±0.007 |
| 4-class | Mic 1 | 47 Hz | FFT | MLP-L | per rec. | 0.77 | ±0.026 |
| 4-class | Mic 1 | 47 Hz | FFT | MLP-S | per frame | 0.52 | ±0.006 |
| 4-class | Mic 1 | 47 Hz | FFT | MLP-S | per rec. | 0.77 | ±0.021 |
| 4-class | Mic 1 | 23 Hz | 500 ms | CNN-S | per frame | 0.67 | ±0.017 |
| 4-class | Mic 1 | 23 Hz | 500 ms | CNN-S | per rec. | 0.75 | ±0.019 |
| 4-class | Mic 1 | 23 Hz | 500 ms | CNN-L | per frame | 0.55 | ±0.027 |
| 4-class | Mic 1 | 23 Hz | 500 ms | CNN-L | per rec. | 0.59 | ±0.034 |
| 4-class | Mic 1 | 23 Hz | 500 ms | MLP-L | per frame | 0.67 | ±0.015 |
| 4-class | Mic 1 | 23 Hz | 500 ms | MLP-L | per rec. | 0.76 | ±0.022 |
| 4-class | Mic 1 | 23 Hz | 500 ms | MLP-S | per frame | 0.66 | ±0.015 |
| 4-class | Mic 1 | 23 Hz | 500 ms | MLP-S | per rec. | 0.74 | ±0.020 |
| 4-class | Mic 1 | 23 Hz | FFT | CNN-S | per frame | 0.56 | ±0.010 |
| 4-class | Mic 1 | 23 Hz | FFT | CNN-S | per rec. | 0.70 | ±0.028 |
| 4-class | Mic 1 | 23 Hz | FFT | CNN-L | per frame | 0.56 | ±0.009 |
| 4-class | Mic 1 | 23 Hz | FFT | CNN-L | per rec. | 0.71 | ±0.022 |
| 4-class | Mic 1 | 23 Hz | FFT | MLP-L | per frame | 0.57 | ±0.008 |
| 4-class | Mic 1 | 23 Hz | FFT | MLP-L | per rec. | 0.79 | ±0.023 |
| 4-class | Mic 1 | 23 Hz | FFT | MLP-S | per frame | 0.57 | ±0.008 |
| 4-class | Mic 1 | 23 Hz | FFT | MLP-S | per rec. | 0.77 | ±0.026 |
| 4-class | Mic 1 | 12 Hz | 500 ms | CNN-S | per frame | 0.66 | ±0.017 |
| 4-class | Mic 1 | 12 Hz | 500 ms | CNN-S | per rec. | 0.75 | ±0.025 |
| 4-class | Mic 1 | 12 Hz | 500 ms | CNN-L | per frame | 0.55 | ±0.023 |
| 4-class | Mic 1 | 12 Hz | 500 ms | CNN-L | per rec. | 0.59 | ±0.030 |
| 4-class | Mic 1 | 12 Hz | 500 ms | MLP-L | per frame | 0.68 | ±0.014 |
| 4-class | Mic 1 | 12 Hz | 500 ms | MLP-L | per rec. | 0.76 | ±0.020 |
| 4-class | Mic 1 | 12 Hz | 500 ms | MLP-S | per frame | 0.68 | ±0.018 |
| 4-class | Mic 1 | 12 Hz | 500 ms | MLP-S | per rec. | 0.75 | ±0.026 |
| 4-class | Mic 1 | 12 Hz | FFT | CNN-S | per frame | 0.57 | ±0.011 |
| 4-class | Mic 1 | 12 Hz | FFT | CNN-S | per rec. | 0.70 | ±0.027 |
| 4-class | Mic 1 | 12 Hz | FFT | CNN-L | per frame | 0.57 | ±0.020 |
| 4-class | Mic 1 | 12 Hz | FFT | CNN-L | per rec. | 0.69 | ±0.036 |
| 4-class | Mic 1 | 12 Hz | FFT | MLP-L | per frame | 0.58 | ±0.011 |
| 4-class | Mic 1 | 12 Hz | FFT | MLP-L | per rec. | 0.73 | ±0.033 |
| 4-class | Mic 1 | 12 Hz | FFT | MLP-S | per frame | 0.58 | ±0.010 |
| 4-class | Mic 1 | 12 Hz | FFT | MLP-S | per rec. | 0.74 | ±0.028 |
| 6-class | Mic 1 | 94 Hz | 500 ms | CNN-S | per frame | 0.38 | ±0.011 |
| 6-class | Mic 1 | 94 Hz | 500 ms | CNN-S | per rec. | 0.41 | ±0.017 |
| 6-class | Mic 1 | 94 Hz | 500 ms | CNN-L | per frame | 0.36 | ±0.016 |
| 6-class | Mic 1 | 94 Hz | 500 ms | CNN-L | per rec. | 0.38 | ±0.023 |
| 6-class | Mic 1 | 94 Hz | 500 ms | MLP-L | per frame | 0.41 | ±0.009 |
| 6-class | Mic 1 | 94 Hz | 500 ms | MLP-L | per rec. | 0.45 | ±0.015 |
| 6-class | Mic 1 | 94 Hz | 500 ms | MLP-S | per frame | 0.40 | ±0.010 |
| 6-class | Mic 1 | 94 Hz | 500 ms | MLP-S | per rec. | 0.42 | ±0.017 |
| 6-class | Mic 1 | 94 Hz | FFT | CNN-S | per frame | 0.31 | ±0.006 |
| 6-class | Mic 1 | 94 Hz | FFT | CNN-S | per rec. | 0.35 | ±0.011 |
| 6-class | Mic 1 | 94 Hz | FFT | CNN-L | per frame | 0.30 | ±0.005 |
| 6-class | Mic 1 | 94 Hz | FFT | CNN-L | per rec. | 0.34 | ±0.009 |
| 6-class | Mic 1 | 94 Hz | FFT | MLP-L | per frame | 0.32 | ±0.005 |
| 6-class | Mic 1 | 94 Hz | FFT | MLP-L | per rec. | 0.42 | ±0.020 |
| 6-class | Mic 1 | 94 Hz | FFT | MLP-S | per frame | 0.32 | ±0.005 |
| 6-class | Mic 1 | 94 Hz | FFT | MLP-S | per rec. | 0.41 | ±0.014 |
| 6-class | Both | 94 Hz | 200 ms | CNN-S | per frame | 0.47 | ±0.008 |
| 6-class | Both | 94 Hz | 200 ms | CNN-S | per rec. | 0.56 | ±0.019 |
| 6-class | Both | 94 Hz | 200 ms | CNN-L | per frame | 0.48 | ±0.014 |
| 6-class | Both | 94 Hz | 200 ms | CNN-L | per rec. | 0.57 | ±0.026 |
| 6-class | Both | 94 Hz | 200 ms | MLP-L | per frame | 0.43 | ±0.010 |
| 6-class | Both | 94 Hz | 200 ms | MLP-L | per rec. | 0.49 | ±0.022 |
| 6-class | Both | 94 Hz | 200 ms | MLP-S | per frame | 0.45 | ±0.012 |
| 6-class | Both | 94 Hz | 200 ms | MLP-S | per rec. | 0.52 | ±0.026 |
| 6-class | Both | 94 Hz | 500 ms | CNN-S | per frame | 0.42 | ±0.014 |
| 6-class | Both | 94 Hz | 500 ms | CNN-S | per rec. | 0.46 | ±0.021 |
| 6-class | Both | 94 Hz | 500 ms | CNN-L | per frame | 0.43 | ±0.011 |
| 6-class | Both | 94 Hz | 500 ms | CNN-L | per rec. | 0.47 | ±0.018 |
| 6-class | Both | 94 Hz | 500 ms | MLP-L | per frame | 0.41 | ±0.021 |
| 6-class | Both | 94 Hz | 500 ms | MLP-L | per rec. | 0.45 | ±0.029 |
| 6-class | Both | 94 Hz | 500 ms | MLP-S | per frame | 0.44 | ±0.012 |
| 6-class | Both | 94 Hz | 500 ms | MLP-S | per rec. | 0.47 | ±0.018 |
| 6-class | Both | 94 Hz | FFT | CNN-S | per frame | 0.34 | ±0.007 |
| 6-class | Both | 94 Hz | FFT | CNN-S | per rec. | 0.39 | ±0.019 |
| 6-class | Both | 94 Hz | FFT | CNN-L | per frame | 0.32 | ±0.005 |
| 6-class | Both | 94 Hz | FFT | CNN-L | per rec. | 0.38 | ±0.014 |
| 6-class | Both | 94 Hz | FFT | MLP-L | per frame | 0.36 | ±0.005 |
| 6-class | Both | 94 Hz | FFT | MLP-L | per rec. | 0.58 | ±0.035 |
| 6-class | Both | 94 Hz | FFT | MLP-S | per frame | 0.36 | ±0.006 |
| 6-class | Both | 94 Hz | FFT | MLP-S | per rec. | 0.53 | ±0.031 |
| 6-class | Both | 47 Hz | 200 ms | CNN-S | per frame | 0.49 | ±0.009 |
| 6-class | Both | 47 Hz | 200 ms | CNN-S | per rec. | 0.60 | ±0.025 |
| 6-class | Both | 47 Hz | 200 ms | CNN-L | per frame | 0.50 | ±0.010 |
| 6-class | Both | 47 Hz | 200 ms | CNN-L | per rec. | 0.61 | ±0.021 |
| 6-class | Both | 47 Hz | 200 ms | MLP-L | per frame | 0.46 | ±0.012 |
| 6-class | Both | 47 Hz | 200 ms | MLP-L | per rec. | 0.54 | ±0.023 |
| 6-class | Both | 47 Hz | 200 ms | MLP-S | per frame | 0.48 | ±0.013 |
| 6-class | Both | 47 Hz | 200 ms | MLP-S | per rec. | 0.56 | ±0.028 |
| 6-class | Both | 47 Hz | 500 ms | CNN-S | per frame | 0.43 | ±0.010 |
| 6-class | Both | 47 Hz | 500 ms | CNN-S | per rec. | 0.46 | ±0.021 |
| 6-class | Both | 47 Hz | 500 ms | CNN-L | per frame | 0.45 | ±0.013 |
| 6-class | Both | 47 Hz | 500 ms | CNN-L | per rec. | 0.52 | ±0.017 |
| 6-class | Both | 47 Hz | 500 ms | MLP-L | per frame | 0.43 | ±0.022 |
| 6-class | Both | 47 Hz | 500 ms | MLP-L | per rec. | 0.47 | ±0.031 |
| 6-class | Both | 47 Hz | 500 ms | MLP-S | per frame | 0.44 | ±0.011 |
| 6-class | Both | 47 Hz | 500 ms | MLP-S | per rec. | 0.47 | ±0.016 |
| 6-class | Both | 47 Hz | FFT | CNN-S | per frame | 0.41 | ±0.009 |
| 6-class | Both | 47 Hz | FFT | CNN-S | per rec. | 0.54 | ±0.034 |
| 6-class | Both | 47 Hz | FFT | CNN-L | per frame | 0.38 | ±0.010 |
| 6-class | Both | 47 Hz | FFT | CNN-L | per rec. | 0.46 | ±0.020 |
| 6-class | Both | 47 Hz | FFT | MLP-L | per frame | 0.40 | ±0.007 |
| 6-class | Both | 47 Hz | FFT | MLP-L | per rec. | 0.61 | ±0.030 |
| 6-class | Both | 47 Hz | FFT | MLP-S | per frame | 0.39 | ±0.005 |
| 6-class | Both | 47 Hz | FFT | MLP-S | per rec. | 0.60 | ±0.028 |
| 6-class | Both | 23 Hz | 200 ms | CNN-S | per frame | 0.50 | ±0.013 |
| 6-class | Both | 23 Hz | 200 ms | CNN-S | per rec. | 0.62 | ±0.031 |
| 6-class | Both | 23 Hz | 200 ms | CNN-L | per frame | 0.44 | ±0.016 |
| 6-class | Both | 23 Hz | 200 ms | CNN-L | per rec. | 0.51 | ±0.033 |
| 6-class | Both | 23 Hz | 200 ms | MLP-L | per frame | 0.47 | ±0.015 |
| 6-class | Both | 23 Hz | 200 ms | MLP-L | per rec. | 0.55 | ±0.029 |
| 6-class | Both | 23 Hz | 200 ms | MLP-S | per frame | 0.49 | ±0.013 |
| 6-class | Both | 23 Hz | 200 ms | MLP-S | per rec. | 0.58 | ±0.026 |
| 6-class | Both | 23 Hz | 500 ms | CNN-S | per frame | 0.47 | ±0.013 |
| 6-class | Both | 23 Hz | 500 ms | CNN-S | per rec. | 0.50 | ±0.021 |
| 6-class | Both | 23 Hz | 500 ms | CNN-L | per frame | 0.45 | ±0.016 |
| 6-class | Both | 23 Hz | 500 ms | CNN-L | per rec. | 0.51 | ±0.021 |
| 6-class | Both | 23 Hz | 500 ms | MLP-L | per frame | 0.48 | ±0.022 |
| 6-class | Both | 23 Hz | 500 ms | MLP-L | per rec. | 0.53 | ±0.030 |
| 6-class | Both | 23 Hz | 500 ms | MLP-S | per frame | 0.49 | ±0.016 |
| 6-class | Both | 23 Hz | 500 ms | MLP-S | per rec. | 0.55 | ±0.027 |
| 6-class | Both | 23 Hz | FFT | CNN-S | per frame | 0.46 | ±0.010 |
| 6-class | Both | 23 Hz | FFT | CNN-S | per rec. | 0.65 | ±0.034 |
| 6-class | Both | 23 Hz | FFT | CNN-L | per frame | 0.42 | ±0.010 |
| 6-class | Both | 23 Hz | FFT | CNN-L | per rec. | 0.53 | ±0.022 |
| 6-class | Both | 23 Hz | FFT | MLP-L | per frame | 0.42 | ±0.007 |
| 6-class | Both | 23 Hz | FFT | MLP-L | per rec. | 0.61 | ±0.025 |
| 6-class | Both | 23 Hz | FFT | MLP-S | per frame | 0.42 | ±0.010 |
| 6-class | Both | 23 Hz | FFT | MLP-S | per rec. | 0.60 | ±0.033 |
| 6-class | Both | 12 Hz | 500 ms | CNN-S | per frame | 0.49 | ±0.014 |
| 6-class | Both | 12 Hz | 500 ms | CNN-S | per rec. | 0.54 | ±0.025 |
| 6-class | Both | 12 Hz | 500 ms | CNN-L | per frame | 0.49 | ±0.014 |
| 6-class | Both | 12 Hz | 500 ms | CNN-L | per rec. | 0.55 | ±0.020 |
| 6-class | Both | 12 Hz | 500 ms | MLP-L | per frame | 0.51 | ±0.021 |
| 6-class | Both | 12 Hz | 500 ms | MLP-L | per rec. | 0.58 | ±0.031 |
| 6-class | Both | 12 Hz | 500 ms | MLP-S | per frame | 0.51 | ±0.014 |
| 6-class | Both | 12 Hz | 500 ms | MLP-S | per rec. | 0.57 | ±0.019 |
| 6-class | Both | 12 Hz | FFT | CNN-S | per frame | 0.48 | ±0.014 |
| 6-class | Both | 12 Hz | FFT | CNN-S | per rec. | 0.66 | ±0.040 |
| 6-class | Both | 12 Hz | FFT | CNN-L | per frame | 0.48 | ±0.014 |
| 6-class | Both | 12 Hz | FFT | CNN-L | per rec. | 0.64 | ±0.028 |
| 6-class | Both | 12 Hz | FFT | MLP-L | per frame | 0.45 | ±0.012 |
| 6-class | Both | 12 Hz | FFT | MLP-L | per rec. | 0.57 | ±0.033 |
| 6-class | Both | 12 Hz | FFT | MLP-S | per frame | 0.45 | ±0.011 |
| 6-class | Both | 12 Hz | FFT | MLP-S | per rec. | 0.57 | ±0.030 |
| 6-class | Mic 1 | 47 Hz | 500 ms | CNN-S | per frame | 0.40 | ±0.012 |
| 6-class | Mic 1 | 47 Hz | 500 ms | CNN-S | per rec. | 0.42 | ±0.020 |
| 6-class | Mic 1 | 47 Hz | 500 ms | CNN-L | per frame | 0.37 | ±0.014 |
| 6-class | Mic 1 | 47 Hz | 500 ms | CNN-L | per rec. | 0.39 | ±0.019 |
| 6-class | Mic 1 | 47 Hz | 500 ms | MLP-L | per frame | 0.41 | ±0.008 |
| 6-class | Mic 1 | 47 Hz | 500 ms | MLP-L | per rec. | 0.45 | ±0.012 |
| 6-class | Mic 1 | 47 Hz | 500 ms | MLP-S | per frame | 0.40 | ±0.008 |
| 6-class | Mic 1 | 47 Hz | 500 ms | MLP-S | per rec. | 0.44 | ±0.013 |
| 6-class | Mic 1 | 47 Hz | FFT | CNN-S | per frame | 0.37 | ±0.009 |
| 6-class | Mic 1 | 47 Hz | FFT | CNN-S | per rec. | 0.48 | ±0.024 |
| 6-class | Mic 1 | 47 Hz | FFT | CNN-L | per frame | 0.36 | ±0.014 |
| 6-class | Mic 1 | 47 Hz | FFT | CNN-L | per rec. | 0.44 | ±0.029 |
| 6-class | Mic 1 | 47 Hz | FFT | MLP-L | per frame | 0.36 | ±0.005 |
| 6-class | Mic 1 | 47 Hz | FFT | MLP-L | per rec. | 0.55 | ±0.029 |
| 6-class | Mic 1 | 47 Hz | FFT | MLP-S | per frame | 0.36 | ±0.005 |
| 6-class | Mic 1 | 47 Hz | FFT | MLP-S | per rec. | 0.56 | ±0.025 |
| 6-class | Mic 1 | 23 Hz | 500 ms | CNN-S | per frame | 0.43 | ±0.011 |
| 6-class | Mic 1 | 23 Hz | 500 ms | CNN-S | per rec. | 0.45 | ±0.015 |
| 6-class | Mic 1 | 23 Hz | 500 ms | CNN-L | per frame | 0.36 | ±0.018 |
| 6-class | Mic 1 | 23 Hz | 500 ms | CNN-L | per rec. | 0.40 | ±0.024 |
| 6-class | Mic 1 | 23 Hz | 500 ms | MLP-L | per frame | 0.45 | ±0.009 |
| 6-class | Mic 1 | 23 Hz | 500 ms | MLP-L | per rec. | 0.49 | ±0.015 |
| 6-class | Mic 1 | 23 Hz | 500 ms | MLP-S | per frame | 0.44 | ±0.012 |
| 6-class | Mic 1 | 23 Hz | 500 ms | MLP-S | per rec. | 0.48 | ±0.017 |
| 6-class | Mic 1 | 23 Hz | FFT | CNN-S | per frame | 0.38 | ±0.013 |
| 6-class | Mic 1 | 23 Hz | FFT | CNN-S | per rec. | 0.49 | ±0.028 |
| 6-class | Mic 1 | 23 Hz | FFT | CNN-L | per frame | 0.40 | ±0.008 |
| 6-class | Mic 1 | 23 Hz | FFT | CNN-L | per rec. | 0.49 | ±0.019 |
| 6-class | Mic 1 | 23 Hz | FFT | MLP-L | per frame | 0.39 | ±0.006 |
| 6-class | Mic 1 | 23 Hz | FFT | MLP-L | per rec. | 0.57 | ±0.017 |
| 6-class | Mic 1 | 23 Hz | FFT | MLP-S | per frame | 0.39 | ±0.006 |
| 6-class | Mic 1 | 23 Hz | FFT | MLP-S | per rec. | 0.56 | ±0.018 |
| 6-class | Mic 1 | 12 Hz | 500 ms | CNN-S | per frame | 0.45 | ±0.014 |
| 6-class | Mic 1 | 12 Hz | 500 ms | CNN-S | per rec. | 0.48 | ±0.022 |
| 6-class | Mic 1 | 12 Hz | 500 ms | CNN-L | per frame | 0.36 | ±0.016 |
| 6-class | Mic 1 | 12 Hz | 500 ms | CNN-L | per rec. | 0.39 | ±0.020 |
| 6-class | Mic 1 | 12 Hz | 500 ms | MLP-L | per frame | 0.48 | ±0.010 |
| 6-class | Mic 1 | 12 Hz | 500 ms | MLP-L | per rec. | 0.53 | ±0.017 |
| 6-class | Mic 1 | 12 Hz | 500 ms | MLP-S | per frame | 0.45 | ±0.011 |
| 6-class | Mic 1 | 12 Hz | 500 ms | MLP-S | per rec. | 0.48 | ±0.017 |
| 6-class | Mic 1 | 12 Hz | FFT | CNN-S | per frame | 0.40 | ±0.007 |
| 6-class | Mic 1 | 12 Hz | FFT | CNN-S | per rec. | 0.51 | ±0.020 |
| 6-class | Mic 1 | 12 Hz | FFT | CNN-L | per frame | 0.40 | ±0.007 |
| 6-class | Mic 1 | 12 Hz | FFT | CNN-L | per rec. | 0.52 | ±0.020 |
| 6-class | Mic 1 | 12 Hz | FFT | MLP-L | per frame | 0.41 | ±0.005 |
| 6-class | Mic 1 | 12 Hz | FFT | MLP-L | per rec. | 0.54 | ±0.019 |
| 6-class | Mic 1 | 12 Hz | FFT | MLP-S | per frame | 0.41 | ±0.005 |
| 6-class | Mic 1 | 12 Hz | FFT | MLP-S | per rec. | 0.57 | ±0.017 |
References
- Cano, Z.P.; Banham, D.; Ye, S.; Hintennach, A.; Lu, J.; Fowler, M.; Chen, Z. Batteries and fuel cells for emerging electric vehicle markets. Nat. Energy 2018, 3, 279. [Google Scholar] [CrossRef]
- Zhu, G.; Zhao, C.; Huang, J.; He, C.; Zhang, J.; Chen, S.; Xu, L.; Yuan, H.; Zhang, Q. Fast Charging Lithium Batteries: Recent Progress and Future Prospects. Small 2019, 15, e1805389. [Google Scholar] [CrossRef]
- Tomaszewska, A.; Chu, Z.; Feng, X.; O’Kane, S.; Liu, X.; Chen, J.; Ji, C.; Endler, E.; Li, R.; Liu, L.; et al. Lithium-ion battery fast charging: A review. eTransportation 2019, 1, 100011. [Google Scholar] [CrossRef]
- Liu, Y.; Zhu, Y.; Cui, Y. Challenges and opportunities towards fast-charging battery materials. Nat. Energy 2019, 4, 540–550. [Google Scholar] [CrossRef]
- Wei, Z.; Zhao, J.; He, H.; Ding, G.; Cui, H.; Liu, L. Future smart battery and management: Advanced sensing from external to embedded multi-dimensional measurement. J. Power Sources 2021, 489, 229462. [Google Scholar] [CrossRef]
- Wei, Z.; Zhao, J.; Ji, D.; Tseng, K.J. A multi-timescale estimator for battery state of charge and capacity dual estimation based on an online identified model. Appl. Energy 2017, 204, 1264–1274. [Google Scholar] [CrossRef]
- Adams, R.A.; Mistry, A.N.; Mukherjee, P.P.; Pol, V.G. Materials by Design: Tailored Morphology and Structures of Carbon Anodes for Enhanced Battery Safety. ACS Appl. Mater. Interfaces 2019, 11, 13334–13342. [Google Scholar] [CrossRef]
- Wang, L.; Wang, Z.; Sun, Y.; Liang, X.; Xiang, H. Sb2O3 modified PVDF-CTFE electrospun fibrous membrane as a safe lithium-ion battery separator. J. Membr. Sci. 2019, 572, 512–519. [Google Scholar] [CrossRef]
- Kwade, A.; Haselrieder, W.; Leithoff, R.; Modlinger, A.; Dietrich, F.; Droeder, K. Current status and challenges for automotive battery production technologies. Nat. Energy 2018, 3, 290–300. [Google Scholar] [CrossRef]
- Schröder, R.; Glodde, A.; Aydemir, M.; Seliger, G. Increasing Productivity in Grasping Electrodes in Lithium-ion Battery Manufacturing. Procedia CIRP 2016, 57, 775–780. [Google Scholar] [CrossRef]
- Li, J.; Du, Z.; Ruther, R.E.; An, S.J.; David, L.A.; Hays, K.; Wood, M.; Phillip, N.D.; Sheng, Y.; Mao, C.; et al. Toward Low-Cost, High-Energy Density, and High-Power Density Lithium-Ion Batteries. JOM 2017, 69, 1484–1496. [Google Scholar] [CrossRef] [Green Version]
- Leithoff, R.; Fröhlich, A.; Dröder, K. Investigation of the Influence of Deposition Accuracy of Electrodes on the Electrochemical Properties of Lithium-Ion Batteries. Energy Technol. 2020, 8, 1900129. [Google Scholar] [CrossRef]
- Weydanz, W.; Reisenweber, H.; Gottschalk, A.; Schulz, M.; Knoche, T.; Reinhart, G.; Masuch, M.; Franke, J.; Gilles, R. Visualization of electrolyte filling process and influence of vacuum during filling for hard case prismatic lithium ion cells by neutron imaging to optimize the production process. J. Power Sources 2018, 380, 126–134. [Google Scholar] [CrossRef]
- Schilling, A.; Gümbel, P.; Möller, M.; Kalkan, F.; Dietrich, F.; Dröder, K. X-ray Based Visualization of the Electrolyte Filling Process of Lithium Ion Batteries. J. Electrochem. Soc. 2018, 166, A5163–A5167. [Google Scholar] [CrossRef]
- Frankenberger, M.; Trunk, M.; Seidlmayer, S.; Dinter, A.; Dittloff, J.; Werner, L.; Gernhäuser, R.; Revay, Z.; Märkisch, B.; Gilles, R.; et al. SEI Growth Impacts of Lamination, Formation and Cycling in Lithium Ion Batteries. Batteries 2020, 6, 21. [Google Scholar] [CrossRef] [Green Version]
- Tönshoff, H.K.; Jung, M.; Männel, S.; Rietz, W. Using acoustic emission signals for monitoring of production processes. Ultrasonics 2000, 37, 681–686. [Google Scholar] [CrossRef]
- Lee, D.E.; Hwang, I.; Valente, C.M.O.; Oliveira, J.F.G.; Dornfeld, D.A. Precision Manufacturing Process Monitoring with Acoustic Emission. In Advances in Design; Springer: Berlin/Heidelberg, Germany, 2006; Volume 21, pp. 33–54. [Google Scholar]
- Wu, H.; Yu, Z.; Wang, Y. A New Approach for Online Monitoring of Additive Manufacturing Based on Acoustic Emission. In Proceedings of the 11th International Manufacturing Science and Engineering Conference, Blacksburg, VA, USA, 27 June–1 July 2016. Volume 3: Joint MSEC-NAMRC Symposia, 06272016. [Google Scholar]
- Gaja, H.; Liou, F. Defects monitoring of laser metal deposition using acoustic emission sensor. Int. J. Adv. Manuf. Technol. 2016, 90, 561–574. [Google Scholar] [CrossRef]
- Koester, L.W.; Taheri, H.; Bigelow, T.A.; Bond, L.J.; Faierson, E.J. In-situ acoustic signature monitoring in additive manufacturing processes. AIP Conf. Proc. 2018, 1949, 020006. [Google Scholar]
- Shevchik, S.A.; Masinelli, G.; Kenel, C.; Leinenbach, C.; Wasmer, K. Deep Learning for In Situ and Real-Time Quality Monitoring in Additive Manufacturing Using Acoustic Emission. IEEE Trans. Ind. Inf. 2019, 15, 5194–5203. [Google Scholar] [CrossRef]
- Chollet, F. Deep Learning mit Python und Keras: Das Praxis-Handbuch vom Entwickler der Keras-Bibliothek; MITP: Frechen, Germany, 2018. [Google Scholar]
- Ioffe, S.; Szegedy, C. Batch Normalization: Accelerating Deep Network Training by Reducing Internal Covariate Shift. In Proceedings of the International Conference on Machine Learning, Lille, France, 6–11 July 2015; pp. 448–456. [Google Scholar]
- Srivastava, N.; Hinton, G.; Krizhevsky, A.; Sutskever, I.; Salakhutdinov, R. Dropout: A simple way to prevent neural networks from overfitting. J. Mach. Learn. Res. 2014, 15, 1929–1958. [Google Scholar]
- Brodersen, K.H.; Ong, C.S.; Stephan, K.E.; Buhmann, J.M. The Balanced Accuracy and Its Posterior Distribution. In Proceedings of the 20th International Conference on Pattern Recognition, Istanbul, Turkey, 23–26 August 2010; pp. 3121–3124. [Google Scholar]
- Mohanty, D.; Hockaday, E.; Li, J.; Hensley, D.; Daniel, C.; Wood, D. Effect of electrode manufacturing defects on electrochemical performance of lithium-ion batteries: Cognizance of the battery failure sources. J. Power Sources 2016, 312, 70–79. [Google Scholar] [CrossRef] [Green Version]


| Electrode | Separator | Protective Liner ID | Recordings Total | Recordings Used | Size (MB) |
|---|---|---|---|---|---|
| Without | With | 1 | 24 | 23 | 245 |
| Without | 2 | 24 | 23 | 133 | |
| Anode 1 | With | 3 | 12 | 12 | 70 |
| Without | 3 | 12 | 12 | 72 | |
| Anode 2 | With | 4 | 13 | 12 | 71 |
| Without | 4 | 12 | 12 | 71 | |
| Cathode 1 | With | 7 | 12 | 12 | 65 |
| Without | 7 | 12 | 12 | 70 | |
| Cathode 2 | With | 8 | 12 | 8 | 42 |
| Without | 8 | 15 | 15 | 84 | |
| Total | 148 | 141 | 922 |
| Electrode | Separator | 6-Class Task | 4-Class Task | Dataset |
|---|---|---|---|---|
| Without | With | S | S | 50% X + 50% Y |
| Without | N | N | 50% X + 50% Y | |
| Anode 1 | With | A + S | E + S | X |
| Without | A | E | X | |
| Anode 2 | With | A + S | E + S | Y |
| Without | A | E | Y | |
| Cathode 1 | With | C + S | E + S | X |
| Without | C | E | X | |
| Cathode 2 | With | C + S | E + S | Y |
| Without | C | E | Y |
Publisher’s Note: MDPI stays neutral with regard to jurisdictional claims in published maps and institutional affiliations. |
© 2021 by the authors. Licensee MDPI, Basel, Switzerland. This article is an open access article distributed under the terms and conditions of the Creative Commons Attribution (CC BY) license (http://creativecommons.org/licenses/by/4.0/).
Share and Cite
Leithoff, R.; Dilger, N.; Duckhorn, F.; Blume, S.; Lembcke, D.; Tschöpe, C.; Herrmann, C.; Dröder, K. Inline Monitoring of Battery Electrode Lamination Processes Based on Acoustic Measurements. Batteries 2021, 7, 19. https://0-doi-org.brum.beds.ac.uk/10.3390/batteries7010019
Leithoff R, Dilger N, Duckhorn F, Blume S, Lembcke D, Tschöpe C, Herrmann C, Dröder K. Inline Monitoring of Battery Electrode Lamination Processes Based on Acoustic Measurements. Batteries. 2021; 7(1):19. https://0-doi-org.brum.beds.ac.uk/10.3390/batteries7010019
Chicago/Turabian StyleLeithoff, Ruben, Nikolas Dilger, Frank Duckhorn, Stefan Blume, Dario Lembcke, Constanze Tschöpe, Christoph Herrmann, and Klaus Dröder. 2021. "Inline Monitoring of Battery Electrode Lamination Processes Based on Acoustic Measurements" Batteries 7, no. 1: 19. https://0-doi-org.brum.beds.ac.uk/10.3390/batteries7010019