Article

Impact of Test Conditions While Screening Lithium-Ion Batteries for Capacity Degradation in Low Earth Orbit CubeSat Space Applications

1
Renewable Energy Storage Laboratory, Department of Mechanical Engineering, Dalhousie University, Halifax, NS B3J 0H6, Canada
2
Department of Mechanical Engineering, Dalhousie University, Halifax, NS B3J 0H6, Canada
*
Author to whom correspondence should be addressed.
Submission received: 20 January 2021 / Revised: 2 March 2021 / Accepted: 5 March 2021 / Published: 15 March 2021

Abstract

:
A wide variety of commercial cylindrical lithium-ion batteries are available for use in nanosatellites (CubeSats) that cycle in low Earth orbit (LEO). This space application differs greatly from the conditions used to create the manufacturer datasheets that CubeSat teams rely on to screen cell types and estimate performance lifetimes. To address this, we experimentally test three LIB cell types using a representative LEO CubeSat power profile in three progressively complex test representations of LEO. The first is “standardized” condition (101 kPa-abs, 20 °C), which uses only a power cycler; the second adds a thermal chamber for “low temperature” condition (101 kPa-abs, 10 °C); and the third adds a vacuum chamber for “LEO” condition (0.2 kPa-abs, 10 °C). Results indicate that general “standardized” and “low temperature” conditions do not yield representative results to what would occur in LEO. Coincidentally, the “LEO” condition gives similar capacity degradation results as manufacturer datasheets. This was an unexpected finding, but suggests that CubeSat teams use full experimental thermal-vacuum testing or default to the manufacturer datasheet performance estimates during the lithium-ion cell screening and selection process. The use of a partial representation of the LEO condition is not recommended.

1. Introduction

Lithium-ion battery (LIB) performance and cycle life are affected by operating characteristics such as pressure, temperature, change in state of charge (ΔSoC) per cycle, and power profile. CubeSats (repeat units of 10 × 10 × 10 cm, and typically less than 1.33 kg, for a 1U chassis) are a popular nanosatellite class that have become increasingly capable and cost-effective [1,2], in-part due to the development and quality production of commercial off the shelf LIB [3,4,5]. While conventional manufacturer testing conditions at 101 kPa-abs, 25 °C, 100% ΔSoC per cycle, constant current (CC) C/2 charge and 1C discharge, are used to create datasheets, it is expected that a LIB will yield a different performance when it is operated in the CubeSat application. This makes it difficult to estimate the potential CubeSat mission duration length without extensive life cycle testing.
Dubarry and Devie [6] show that for a given cell design (format, chemistry), cycle life is impacted in a non-linear fashion at different ambient temperatures (+25, +35, +45 °C), discharge rates (1, 2, 3C) and ΔSoC per cycle (5, 40, 70%). Each change contributes to a variety of degradation mechanisms (e.g., lithium plating, current collector corrosion, solid electrolyte interface formation, micro-cracking, gas evolution). Ma et al. [7] summarize that, as the LIB temperature decreases, the viscosity of the electrolyte increases, consequently increasing the lithium-ion concentration at the active material surface which results in lithium plating during charge. As the LIB temperature increases, degradation mechanisms predominantly take the form of electrolyte decomposition, positive active material (PAM) breakdown in crystallographic structure, binder migration to the negative active material (NAM) surface and solid electrolyte interface growth, all of which irreversibly reduce capacity and impede lithium-ion transfer due to an increased internal resistance [7,8,9].
Due to the non-linearity of LIB degradation, data-driven models that use end of discharge voltage to estimate spacecraft end of life (EoL) have been proposed by Song et al. [10]. By utilizing end of discharge voltage, the spacecraft does not need to undergo 100% ΔSoC capacity reference cycles in order to estimate EoL failure. This technique allows continual mission operation while giving insights to EoL beyond that of generic reference cycling. The non-linearity of LIB degradation inspired Fermín-Cueto et al. [11] to integrate machine learning in order to quantify EoL conditions. Utilizing machine learning, Fermín-Cueto et al. [11] can predict the point at which non-linear degradation initiates (the knee-onset) and when accelerated degradation begins (i.e., the knee-point) with a 12.0% and 9.4% error, respectively, using information from the first 50 cycles. The machine learning prediction model dataset was taken from Severson et al. [12] which utilizes 124 commercialized APR18650M1A graphite||LFP (lithium iron phosphate) cells cycled over a 100% ΔSoC range from 1C to 20C. The data reveal that in all cases, linear degradation occurs at beginning of life (BoL) until the knee-onset, after which degradation rates increase until EoL.
Lami et al. [13] identify power management methods to maximize cycle life. This power management process provides LEO satellite teams a method to improve the lifetime of their satellite in LEO. However, prior to implementing power management techniques, engineers must screen through available battery technologies for a design that meets their desired cycle life and performance specifications, all while minimizing on-board volume and mass.
Krause et al. [14] completed performance testing of the NCR18650B cells for the MarCO A & B CubeSat missions at 0, 20 and 30 °C. Cells were cycled at C/5 (0.58 A) CC rates, in 8S groupings, over the full 100% ΔSoC range, with a taper current terminating at 60 mA constant voltage (CV) charge. Cycle life testing showed that initial discharge capacity was reduced by 16%, and the capacity degradation rate was more than doubled at 0 °C relative to 30 °C. Internal resistance measurements were completed at 20% SoC increments on cells at 0 and 20 °C, revealing that cells cycled at 0 °C had a 70% higher initial internal resistance, achieving three times the internal resistance growth rates compared to cells in the 20 °C condition. Cells were also assembled into 3S4P groups, to represent the 6U MarCO CubeSat battery size, and cycled at various CC discharge rates (C/20, C/10, C/5, C/3, C/2, 1C) and C/10 charge rate at 0 °C. Results indicated an initial 31% reduction in total discharge energy at 1C relative to the C/20 discharge rate. Bugga et al. [15] tested five different 18–65 cells (LG M36, LG MJ1, Panasonic BJ, Samsung 35E, Sony VC7) for space applications that varied in PAM (nickel cobalt aluminum—NCA or nickel manganese cobalt—NMC) and electrode sizing. Cells were cycled over 100% ΔSoC at C/5 in 20 °C and showed that the LG MJ1 achieved the best capacity retention after 500 cycles (92%), whereas the Sony VC7 achieved the worst capacity retention (87%). The results by Krause [14] and Bugga [15] exemplify the variance in measured cell performance at various rates, temperatures and cell types. However, Krause [14] and Bugga [15] both test cells for space applications using standard CC charge techniques which are not realistic to what occurs in the application. Work by Lee et al. [16] reported cycle testing on LIB for LEO CubeSats, accounting for a 35-min eclipse and 55 min solar exposure period demonstrating the effects of larger ΔSoC per cycle and higher charging rates. Again, this work utilizes both constant current to voltage charge (CC-CV) charging and CC discharging for each LEO which is not realistic to the application.
The above literature review provides CubeSat teams with an understanding of the effect of various temperatures, cycling rates and ΔSoC range impact LIB performance in order to optimize battery cycle life [6,7]. Power management and end of discharge voltage techniques are also described which can aid existing satellites in determining satellite end of life and possibly extending the EoL horizon [10,11,12,13]; however, this does not aid in the design of a CubeSat battery system. Extensive experimental testing of high quality LIB for LEO space applications was presented [14,15,16] and provides engineers a reference for determining the best available LIB for CubeSat applications, however cycling rates and power profiles are not representative of what would occur in LEO. Although the research above is useful, they do not aid CubeSat engineers in screening and selecting a battery to meet their mission requirements. In this article we expand upon the literature and make original contributions by comparatively testing a variety of lithium-ion cells with different positive electrodes instead of only one type, and by applying a specific cycling profile that is representative of the LEO satellite application instead of standardized CC-CV cycles.
When screening and selecting a battery for a LEO CubeSat mission, the first step is to examine cell manufacturer datasheet performance (e.g., energy density, specific energy, cycle life, operating temperature, maximum charge or discharge currents, etc.). The manufacturer datasheet provides initial screening for engineers to contrast available technologies and choose a cell that meets their power requirements and mission durations, while not exceeding the mass and volume limitations of the CubeSat specification. However, the LEO conditions (pressure, temperature) and power cycling profile is different than datasheet conditions, thus performance relative to the CubeSat application is unknown. Our objective is to contrast performance of popular LIB cells in a CubeSat application (accelerated LEO cycle, 0.2 and 101 kPa-abs, 10 and 20 °C) with that of manufacturer datasheets (CC, CV, 101 kPa-abs, 25 °C) to determine performance expectation relationships. The accelerated LEO cycle completes one discharge and charge (i.e., orbit) at three times the rate of an actual LEO. Even with the expedited cycling regime, it still takes approximately 1 year to conduct performance degradation testing and requires expensive battery testing equipment with several battery cycler channels. Both the time requirement and economic cost of this testing make it impractical for many CubeSat teams.
This power profile and the chosen test conditions represent the range of available conditions a university CubeSat team would be able to replicate and will give them guidance as to which conditions are useful when testing batteries for LEO. The outcomes of this research provide novel insight to teams conducting preliminary screening and selection of battery technologies based on manufacturer specifications sheets to meet their varied CubeSat performance requirements and mission lengths.

2. Method

Three different LIB 18–65 cylindrical cell types were configured into separate groups and placed into cycling tests representing the LEO application. Three different and increasingly complex test conditions provide a range of pressure and temperature used to validate a LIB for CubeSat flight. The experimental conditions and test setup are discussed and illustrated. LEO testing and reference schedules are discussed with corresponding C-rates presented.

2.1. Lithium-Ion Battery Cells

The cells used in this study are:
  • Panasonic NCR18650B with graphitic NAM and a PAM composed of nickel cobalt aluminium (hereafter this cell type is referred to as “NCA”).
  • LG Chem ICR18650B4 with graphitic NAM and a PAM composed of nickel manganese cobalt (subsequently referred to as “NMC”).
  • A123/LithiumWerks APR18650M1B with graphitic NAM and a PAM composed of lithium iron phosphate (subsequently referred to as “LFP”).
The NCA cell type has flight heritage [14] and similar cells to the NMC cell type are being considered by NASA [3]. Recent research showed that LFP can yield much longer cycle life and total discharge energy throughput in LEO applications, making this cell type a good potential candidate for future research [17]. Each cell is of the 18–65 (18 mm diameter and 65 mm length) cylindrical format and has a unique combination of PAM, NAM and electrode sizes, resulting in a diverse range of operating voltages, cycling rates and cycle life, as specified by the manufacturer datasheets and summarized in Table 1.
In addition to the specifications found in Table 1, a detailed description and measurements of these cells, based on dissection and scanning electron microscopy, to quantify the electrode sizes, PAM stoichiometry and NAM particle size can be found in Cook et al. [17,21].
A batch of 30 cells from each type (NCA, NMC, LFP) were procured, nine of which were used as test cells from each cell type, for a total of 27 test cells. Each test cell was verified to be within 1% of initial mass, internal resistance, discharge capacity, energy efficiency and as-received open circuit voltage of its respective batch population mean, so as to ensure outliers were not utilized.

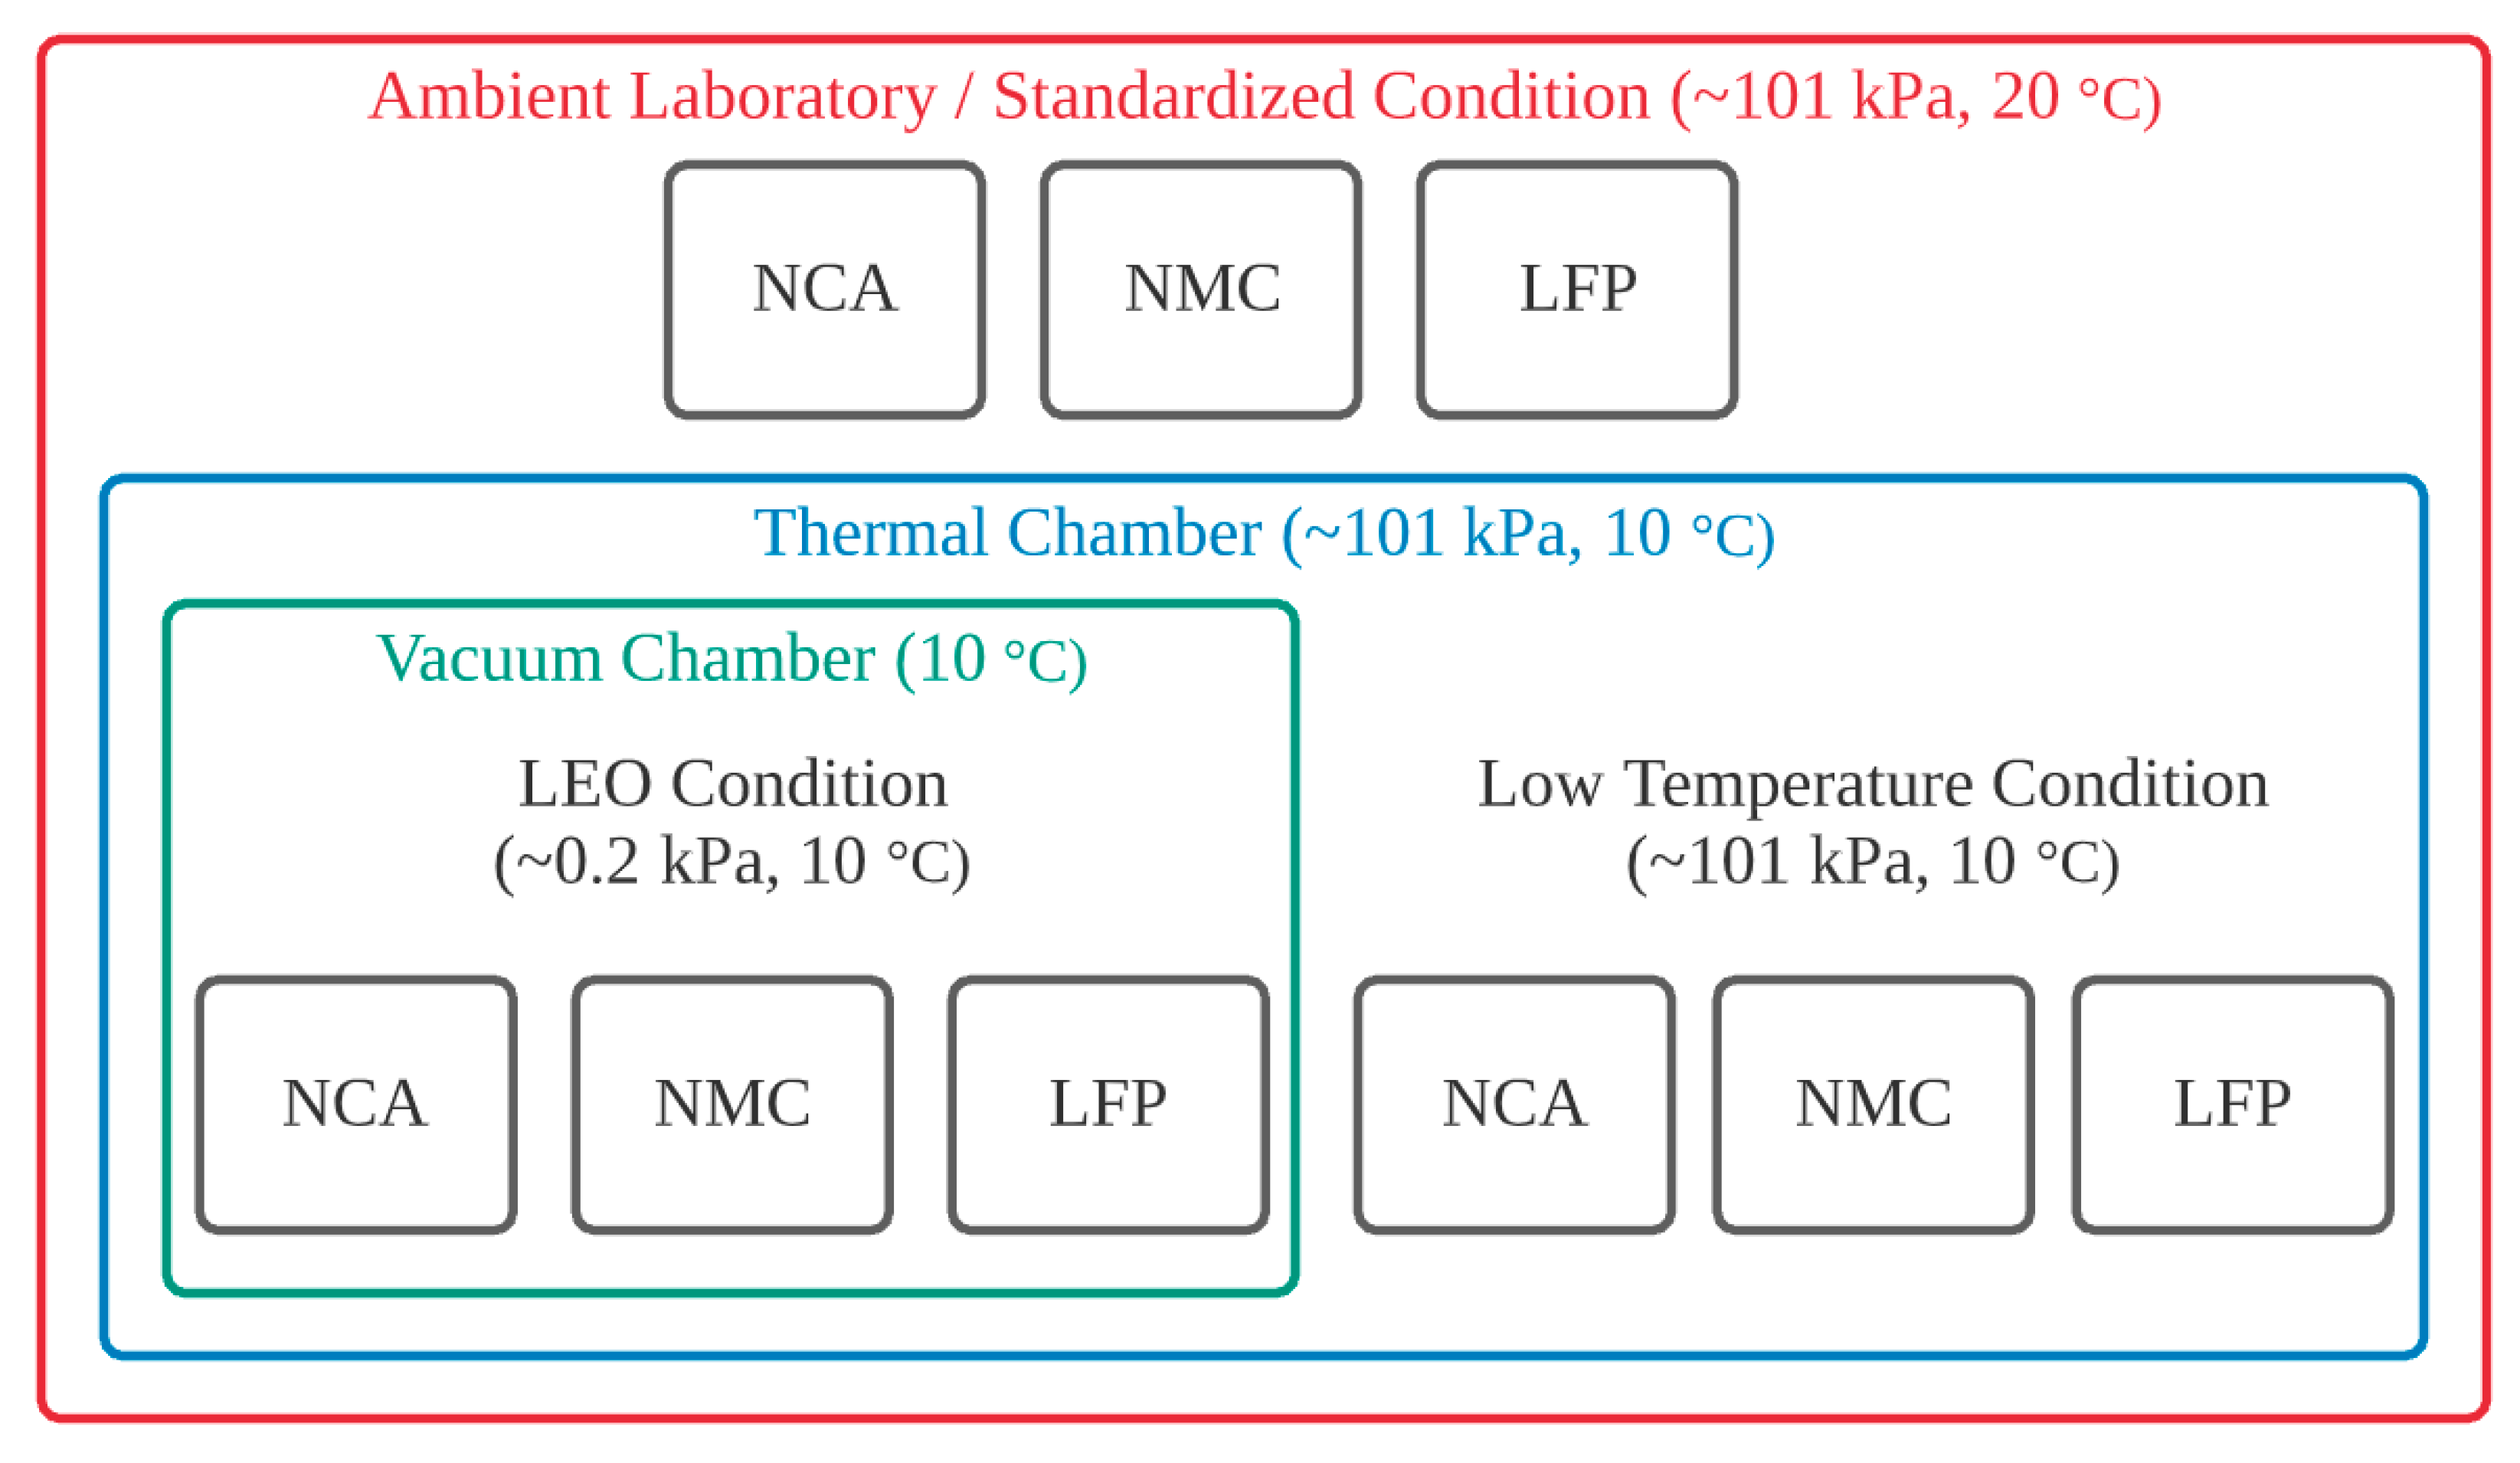
2.2. Experimental Conditions and Test Setup

The experimental setup diagram is shown in Figure 1, with a photo of the actual experimental setup presented in Figure 2. The three test conditions are progressively more complex, changing one parameter sequentially.
  • Standardized condition (101 ± 1 kPa-abs, 20 ± 1 °C). The standardized condition provides new information on LIB performance and capacity degradation while subject to a CubeSat power profile. Such testing requires only a programmable commercial battery power cycler, making it the first stage of LEO cycle testing that a CubeSat team could achieve. The laboratory is served by a dedicated tight-tolerance heating/cooling system. Cells are connected to a Neware BTS-5V50A power cycler that applies a varying power LEO cycle that discharges and charges the cell. The cycler has eight channels each rated 0–5 V and ±50 A with type T thermocouple temperature sensors. Accuracy: ± 5 mV, ± 15 mA, ±1 °C.
  • Low temperature condition (101 ± 1 kPa-abs, 10 ± 0.1 °C). A temperature of 10 °C coincides well with the observed average temperature in LEO [22]. This low temperature condition requires both a programmable thermal chamber (cooling mode) and battery power cycler to complete. The addition of a thermal chamber substantially increases the technical requirements and financial cost of the testing. The thermal chamber is a Cincinnati Sub-Zero CSZ-32 (0.9 m3) rated −73 °C to +190 °C with accuracy of ±0.1 °C.
  • LEO condition (0.2 ± 0.1 kPa-abs, 10 ± 0.1 °C). The vacuum present in LEO is approximately 10−9 kPa-abs [23]. This LEO condition at 10 °C best emulates the LEO conditions experienced by CubeSat batteries, however it is the costliest condition and is likely only achievable by professional CubeSat teams. We constructed a custom clear vacuum chamber, as shown in Figure 2. The vacuum pump achieves 0.2 kPa-abs which is 99.8% of the vacuum in LEO. Other researchers have also opted for near 0.2 kPa-abs for testing [24,25,26,27].
In LEO, a CubeSat would transfer heat between itself and the environment through radiation and internally between components through conduction. However, because a battery is concealed inside the satellite, it is insulated from the majority of radiative effects, this would suggest that heat transfer from the battery is mostly through conduction on a LEO satellite. Cook [21] evaluated the thermal characteristics of the apparatus in Figure 2. The results indicated that more than 80% of total heat transfer from the batteries in the LEO condition was through conduction, suggesting that heat transfer characteristics of the experimental setup in Figure 2 and that found in LEO are similar. We do note however that unique satellite designs will alter heat flux paths and rates and this can influence the results to some extent.
Cells of a given type were grouped three-in-parallel (3P) for LEO CubeSat cycling to represent a typical 2U sized CubeSat battery pack. Three groups of each cell type were used, one group for LEO cycling in standardized condition (101 kPa-abs, 20 °C), one group for cycling in low temperature condition (101 kPa-abs, 10 °C), and one group for cycling in LEO condition (0.2 kPa-abs, 10 °C).
Tests used independent current taps and voltage sense taps. A 24-gauge type T thermocouple was adhered to the side of each cell, with a small piece of insulating tape placed over it (5 × 5 mm), as shown in Figure 3. All cell groups remain in their respective holder throughout all tests. The cell group electrical connection was 3P for LEO cycling, and then cells were electrically reconfigured to 1P for reference capacity testing. This allowed for inter-cell deviations to be identified; if they are small compared to difference due to test conditions, then this lends confidence to the findings.

2.3. Test Schedule

The cell groups were subjected to a representative LEO cycle consisting of constant power (CP) discharge and sinusoidal power charge. Prior to the first LEO cycle the cells are fully charged individually and then 3 cells are placed electrically in parallel (3P). Only the middle cell temperature was monitored during LEO cycling due to limited temperature sensor connections on the Neware power cycler.
To emulate use in a CubeSat application, all cell groups experience the same LEO cycle discharge and charge profiles. Consequently, the lowest rated capacity cell group must be used to define the LEO cycling parameters. At BoL a maximum state of energy (SoE) of 90% was selected to extend the operating life, and a minimum SoE of 30% was selected to provide sufficient reserve to account for capacity degradation of 20% or more before a failure to complete the cycle occurs. This leads to a ΔSoE of 60%, which when using the rated energy capacity of LFP given in Table 1 in 3P configuration, is 6.53 Wh. All cell groups, regardless of chemistry, had exactly 6.53 Wh discharged on each LEO discharge, leading to unique ΔSoE and rates for each cell group given in Table 2 because of their varied rated energy capacities.
An actual LEO takes 90 min to complete, with an eclipse time of 35 min. For this experiment, a 3X accelerated LEO cycle of 30 min (1800 s) was used to expedite testing while ensuring cells were cycled within limits of manufacturer charge/discharge rates. We note that this test acceleration increases the electrical current, which will lead to greater heat loss and raise the cell temperature to some extent, but the impact on degradation is expected to be low [28]. The LEO cycle begins with a 700 s CP discharge (33.6 W; 11.2 W/cell) followed by 1100 s of sinusoidal power charge profile to imitate a fixed photovoltaic array orbiting Earth peaking at 33.6 W (11.2 W/cell). If the charge cut-off voltage is achieved prior to the full 1100 s, charge is stopped, and the cell group enters rest mode for the remainder of the 1100 s period. This test schedule differs from that recommended by the European Cooperation for Space Standardization, in that it uses CP discharge and a varying power charge [29].
Reference cycles were completed after every 480 LEO cycles in the same ambient conditions as the specification sheet (101 kPa, 25 °C) to obtain a discharge capacity measurement for direct comparison with manufacturer datasheets. During reference cycles the cells were tested individually (1P), including temperature measurement, to identify inter-cell deviations of a group, producing a minimum, median, and maximum value for each cell group. This is intended to give confidence to the findings if the inter-cell deviations are small and provides a clear ability to distinguish between inter-cell performance and the cell type in each condition. Reference cycles were carried out at 101 kPa-abs, 25 °C using CC discharge and CC to CV charge, in accordance with the voltage ranges and C-rates given in Table 1. Three reference cycles were repeated, with the first to recover from LEO cycling, the second to thermally acclimate the cells, and the third to obtain results. After reference cycles, the cell group was electrically placed in 3P, positioned at 90% SoE and then LEO cycling was reinitiated. Detailed descriptions of the entire cycle and strategy, including justification of the LEO and reference cycles are given in Cook et al. [17,21].

3. Results

The average cell operating temperature in the standardized, low temperature, and LEO condition are presented and related to degradation effects such as lithium plating and electrolyte degradation. Coulombic capacity degradation results are contrasted with expected manufacturer cycle life metrics. Due to similarities in LFP coulombic capacity degradation between each condition, end of discharge voltage analysis is performed to identify performance differences between LFP cell types in each of the three conditions.

3.1. Operating Temperature

Manufacturer specification sheets are based on cell testing conducted in thermal chambers that tightly control cell temperature to a reference of 25 °C. In contrast, test cells in the LEO cycle experience CP discharge followed by sinusoidal power charge in unique temperature and vacuum conditions. The latter greatly affects the convection rate. The average cell temperature during LEO cycle operations is presented in Table 3. In general, the LFP cell operates at a lower temperature than the NCA and NMC cells, which are very similar. This is because the LFP cell type is a higher power cell design, with lower internal resistance. In standardized condition the operating temperature of 31–37 °C is significantly higher than the reference temperature of the manufacturer specification sheets, due to the relatively high power and natural convection cooling. Higher temperature is known to reduce internal resistance and the potential for lithium plating, but increases degradation of the electrolyte and solid electrolyte interphase layer growth. In the low temperature condition, cells are placed inside a thermal chamber with circulating fans, and so experience a high convection rate. As such they experience a temperature delta of only 7–8 °C and are operating cooler than the manufacturer reference temperature. Colder temperatures increase the internal resistance and potential for lithium plating, especially at higher charge rates. In the LEO condition, the very low convection rate leads to high temperature deltas and a temperature of operation at 23–27 °C. Interestingly, this straddles the reference temperature of 25 °C used by manufacturers in conventionally rating their cells (i.e., Table 1), suggesting that LIB cells operating in LEO experience similar internal thermal conditions to manufacturer testing.

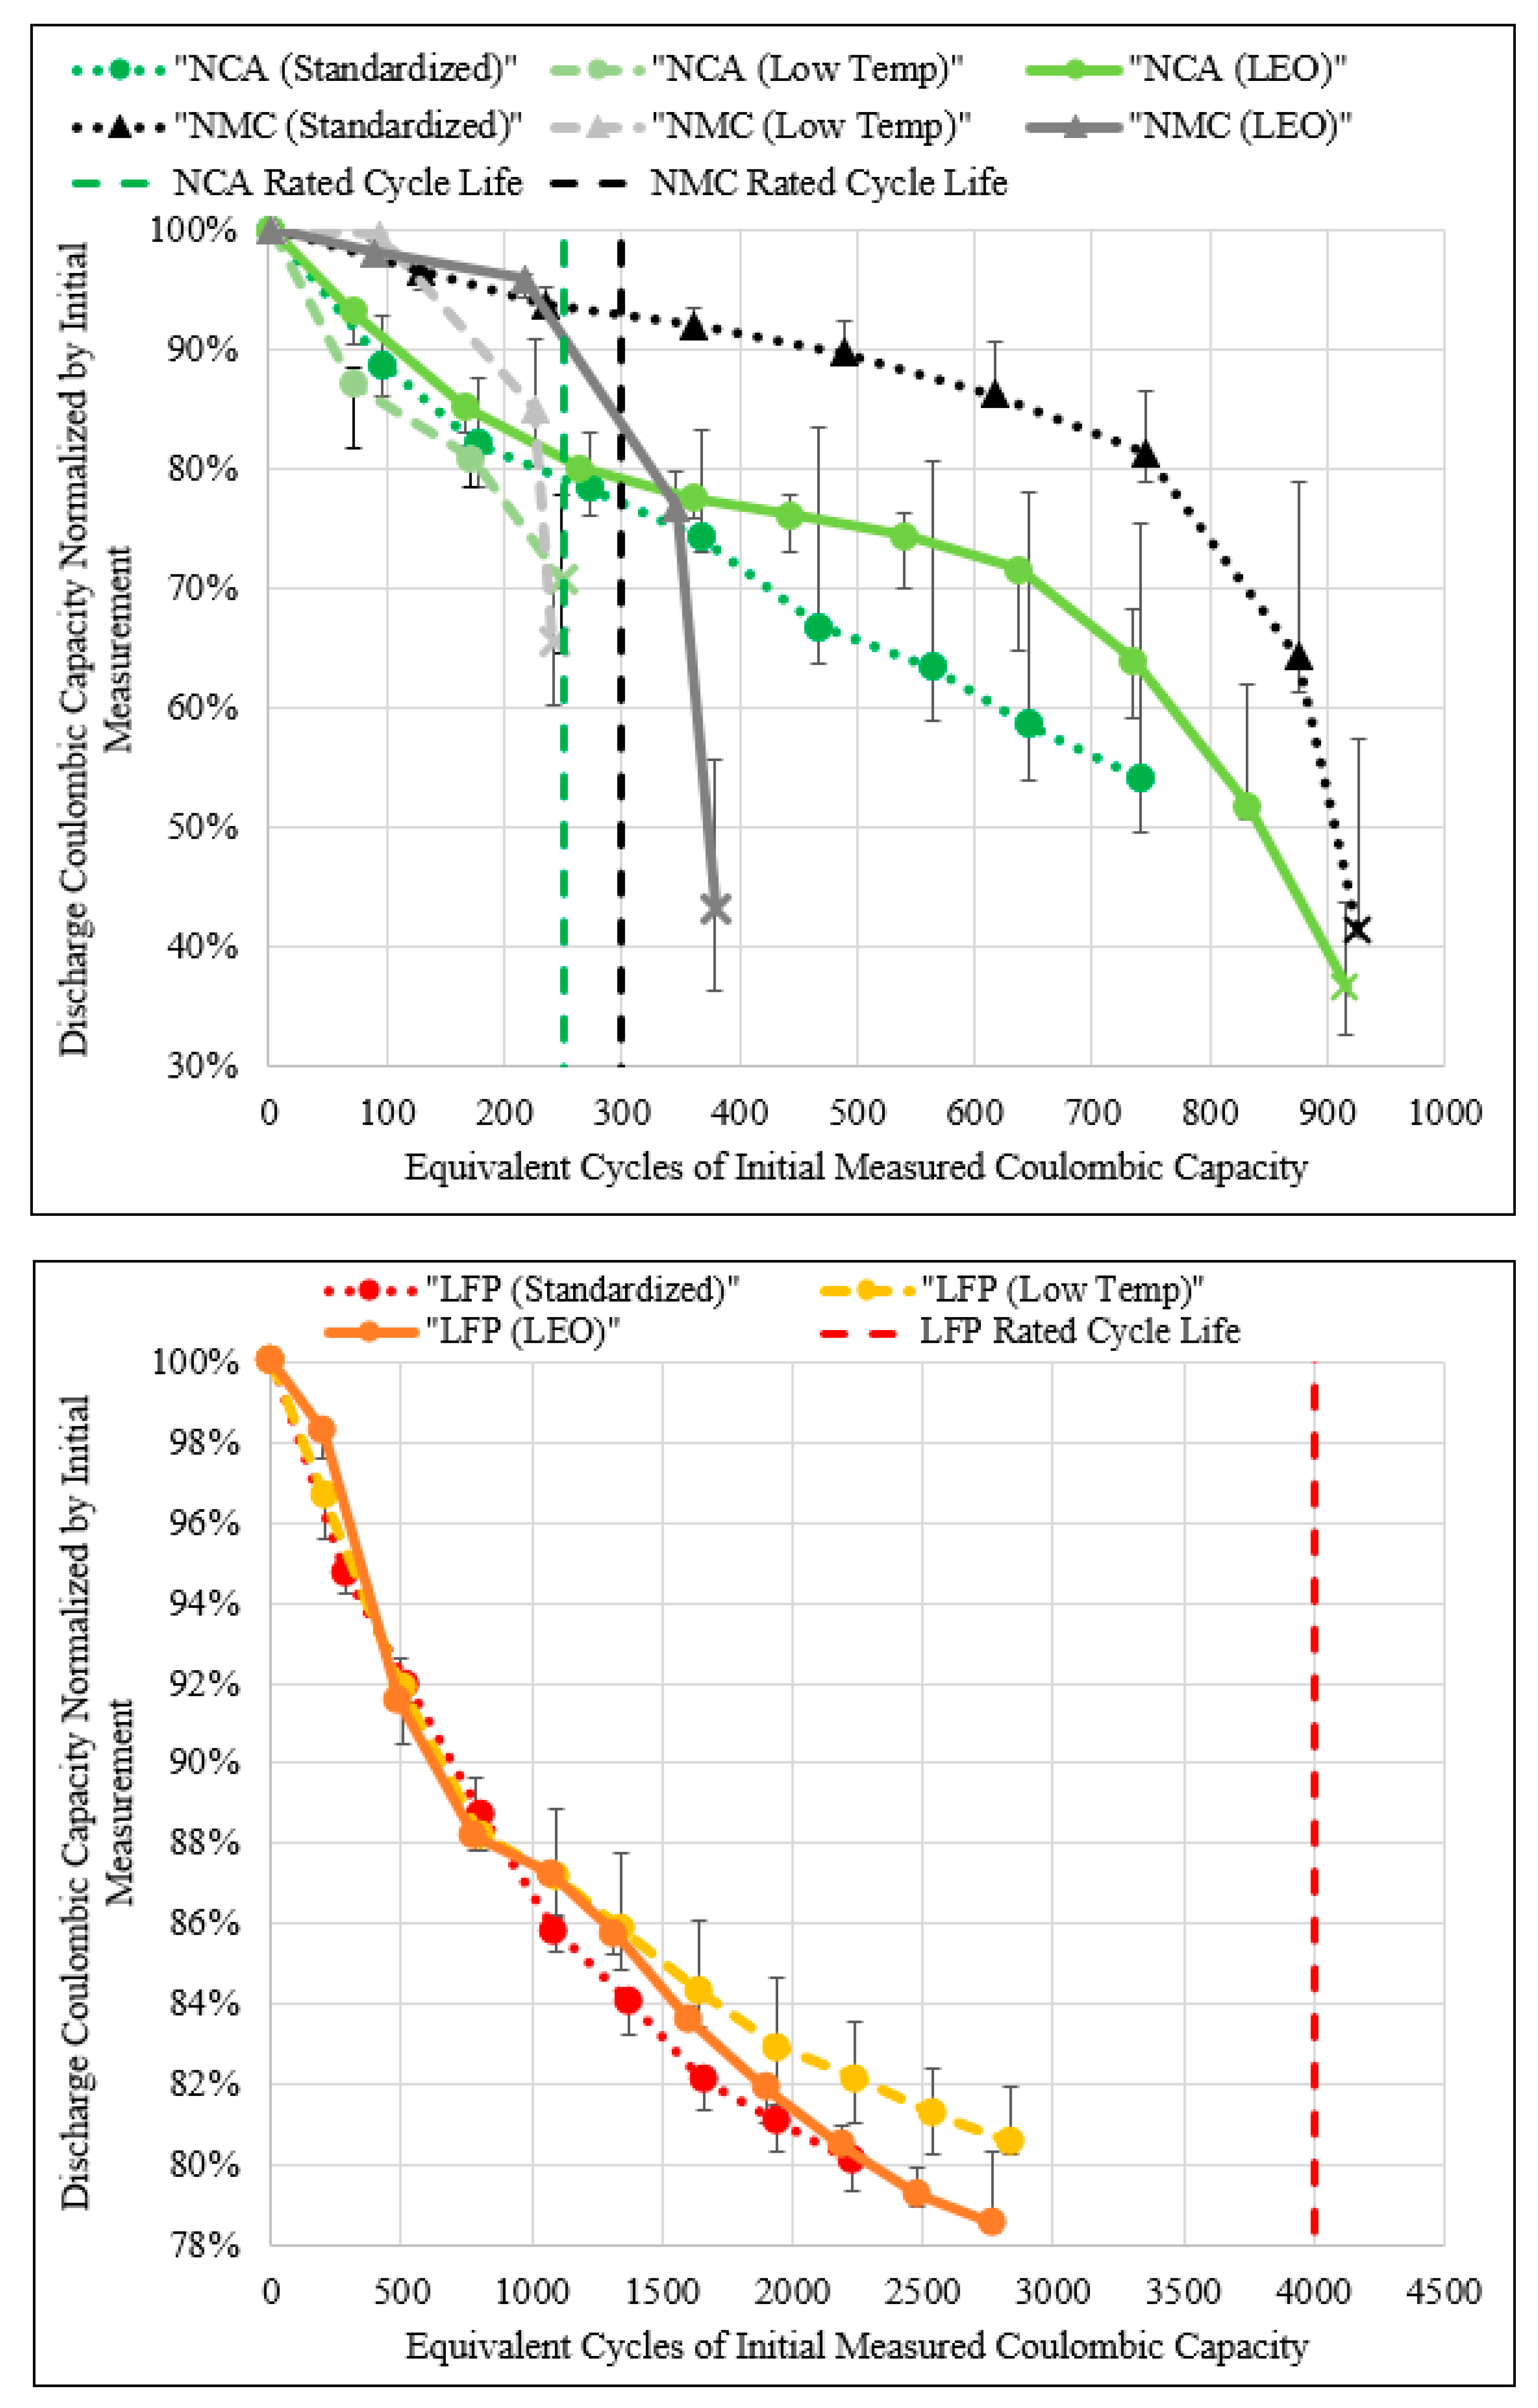
3.2. Coulombic Capacity Degradation

The coulombic capacity degradation of each cell type (NCA, NMC, LFP), in each condition (standardized, low temperature, LEO), is contrasted with the manufacturer specified cycle life. There are two main distinctions when comparing experimental results from the LEO cycling to the manufacturer specifications. The first distinction is that the LEO cycle has a CP discharge and sinusoidal charge profile, whereas the manufacturer specification cycle uses CC discharge and CC-CV for cycle life testing. The second distinction is the partial ΔSoE per LEO cycle relative to the 100% ΔSoE per manufacturer cycle. These two main cycling conditions, combined with the different ambient pressures and temperatures employed in each of the three experimental conditions, result in various cycle life performances relative to the manufacturer specified cycle life.
The experimental discharge coulombic capacity, with respect to equivalent cycles of the initial measured coulombic capacity of all three cell groups, in all three conditions, are contrasted with the manufacturer rated cycle life in Figure 4. The top plot presents the NCA and NMC cell results, and the bottom plot the LFP results, due to substantially different respective lifetimes. Note that data points marked with a ‘X’ indicate the point at which the cell group failed during LEO cycling. Absence of an ‘X’ indicates the cells are still operational at the time of this article (October 2020). Range bars are added to each data point to represent the minimum and maximum cell of each group, with respect to the coloured median cell datapoint. All capacity data were obtained from a reference cycle with the span between reference cycle data points at 480 accelerated LEO cycles.
For the NCA cell type the sinusoidal charge ranges in rates from 0.55 to 0.93C, whereas the manufacturer specified cycle life specifies a standard CC 0.5C charge. This difference in charge rates makes the LEO sinusoidal charge more aggressive at inducing cell degradation. The LEO cycle CP discharge rate and manufacturer specified CC rates are, respectively 0.93 and 1C, thus minimal change in cycle life degradation is to be expected from this difference in discharge rates. The 18% partial ΔSoE attained in the LEO cycle at BoL (see Table 2) improves cell cycle life with respect to the manufacturer specified cycle life.
Inter-cell differences in the low temperature condition are smaller than inter-group differences in the LEO condition which clearly emphasizes the difference in performance. However, there is overlap between inter-cell and group performance in the standardized and LEO conditions, hence differentiation between the two conditions is less observable by this method. Figure 4 (top) shows the standardized NCA group achieved 218 equivalent cycles with 80% capacity remaining, slightly underperforming relative to the manufacturer cycle life specification (250 cycles). The difference in cycle life is attributed to the benefit from a lower operating ΔSoE being outweighed by electrolyte degradation, and active material breakdown, due to the high average cell temperature (36 °C). The low temperature condition NCA group experienced a significantly reduced cycle life (178 equivalent cycles with 80% capacity remaining) relative to the manufacturer specified cycle life. This is attributed to the increased charge rate, combined with the lower average cell operating temperature (18 °C), causing degradation that significantly outweighs the benefit of cycling at a partial ΔSoE. As a result of the lower cell temperature, the low temperature condition NCA group ionic conductivity in both the electrolyte and active materials has decreased, consequently increasing degradation from mechanisms such as lithium plating when charging. The LEO NCA group achieved an average operating temperature of 27 °C, which is between both the standardized (36 °C) and low temperature (18 °C) condition. Consequently, it may be expected that the LEO NCA group would achieve a cycle life between the standardized and low temperature condition cycle life. However, Figure 4 (top) demonstrates the LEO NCA achieved the best performance with 264 equivalent cycles at 80% capacity remaining, performing similarly to the manufacturer specification. This finding reveals that in the LEO condition, the aggregate degradation mechanisms due to a lack of ionic conductivity during charge (e.g., lithium plating) attained at low temperatures, and side reactions from electrolyte and active material breakdown at higher temperatures, are minimized. Beyond the 80% capacity remaining dashed line, both standardized and LEO NCA groups diverge with respect to their capacity retention, emphasizing the difference in contributing degradation mechanisms.
The NMC cell type LEO cycle sinusoidal charge ranges in rates from 0.71C to 1.20C whereas the manufacturer specified cycle life highlights a standard CC 0.5C charge. This difference in charge rate makes the LEO sinusoidal charge profile more aggressive at inducing cell degradation. The LEO cycle CP discharge rate and manufacturer specified CC rates are, respectively, 1.2 and 0.2C, thus additional degradation on discharge during LEO cycling is to be expected. As the highest cell temperature occurs on discharge, increased discharge rates will increase degradation due to high temperature mechanisms such as electrolyte decomposition, SEI growth and active material breakdown. The 23% partial ΔSoE attained in the LEO cycle at BoL (see Table 2) improves cell cycle life with respect to the manufacturer specified cycle life.
The inter-cell differences in each condition are a smaller than inter-group differences which clearly emphasizes the difference in performance between each condition. Figure 4 (top) shows the standardized NMC group cycle life (755 equivalent cycles with 80% capacity remaining) achieved ~2.5 times the manufacturer specified cycle life (300 cycles). The improved cycle life is attributed to the benefit from a lower operating ΔSoE, outweighing the burden of a higher cycling rates at the average 37 °C operating temperature. The low temperature condition NMC group experienced the worse cycle life (230 equivalent cycles with 80% capacity remaining) relative to the manufacturer specifications. This is attributed to the charge and discharge rate degradation outweighing the benefit of the partial ΔSoE at the 18 °C average cell temperature. Due to the lack of convective heat transfer present in the LEO condition, the NMC group warmed to an average 27 °C, hence operating at a temperature midway between the standardized and low temperature conditions. The LEO NMC group achieved similar cycle life to that of the manufacturer specification, obtaining 324 equivalent cycles with 80% capacity remaining. This can be attributed to the aggregate burden of the higher cycling rates, with the benefit of a partial ΔSoE producing a near null effect on cycle life. As the warmest operating condition (i.e., standardized) minimizes low temperature degradation (e.g., lithium plating), without undesirably increasing degradation as a result of side reactions at warmer temperatures, the NMC cell type degradation is evidently dominated by the occurrence of cold mechanisms such as lithium plating in the low temperature and LEO testing conditions.
Both NCA and NMC cell types varied significantly between each experimental condition with respect to their coulombic capacity degradation trend and 80% coulombic capacity retention cycle life. From BoL to EoL, the range bars increase, showing that the minimum and maximum intercell group capacity is a function of degradation. NCA cell types clearly have higher linear degradation rates than NMC cell types at BoL. However, by EoL, NMC cell types experience a knee-onset and knee-point failure, exceeding the degradation rate of the NCA cells.
For the LFP cell type, the LEO cycle sinusoidal charge ranges in rates from 1.84 to 3.09C, whereas the manufacturer specified cycle life highlights a standard CC 1.0C charge. This difference in charge rate makes the LEO sinusoidal charge profile more aggressive in inducing cell degradation from lithium plating. The LEO cycle CP discharge rate and manufacturer specified CC rates are, respectively 3.09 and 1.0C, thus additional degradation on discharge is to be expected. The 60% partial ΔSoE attained in the LEO cycle at BoL (see Table 2) improves cell cycle life with respect to the manufacturer specified cycle life.
Similar to the NCA cell type, LFP inter-cell differences in the low temperature condition are smaller than inter-group differences with the LEO condition, while greater inter-cell differences occur between the standardized and LEO condition. Figure 4 (bottom) shows the LFP group in all three conditions, degraded at a similar linear rate for the first 1000 equivalent cycles with no significant differences present when considering the scale of each range bar. The standardized LFP group cycle life (2271 equivalent cycles with 80% capacity remaining) achieves approximately half that of the manufacturer specified cycle life (4000 cycles). The decreased cycle life is attributed to the benefit from a lower operating ΔSoE being outweighed by the burden of higher cycling rates achieved in the LEO cycle. By extrapolating, the low temperature LFP group experienced improved cycle life (3099 equivalent cycles with 80% capacity remaining) relative to the standardized condition, however it is still less than the manufacturer specified cycle life. The increase in cycle life from the warmest cell in the standardized condition (average 31 °C) to the coldest cell in the low temperature condition (average 17 °C) delivered significant increases in cycle life (+Δ828 equivalent cycles). This indicates that the leading source of degradation in the LFP cell type is from high temperature degradation mechanisms (e.g., active material breakdown, electrolyte decomposition, migration of binder to NAM surface), as opposed to low temperature degradation mechanism (e.g., lithium plating). As LFP degradation is mostly a function of warm temperature mechanisms, discharging rates are likely the main source of degradation as this is when the peak cell temperature is achieved during the LEO cycle, see Cook et al. [17]. The LEO LFP group warmed to an average 23 °C and achieved a marginally greater cycle life to that of the standardized condition, obtaining 2309 equivalent cycles with 80% capacity remaining. The LEO LFP group operated at an average of 6 °C warmer than the low temperature group, thus it is estimated that in order to minimize degradation due to warm operating temperatures in the LEO cycle, the average cell temperature must be kept below 20 °C for the LFP cell type. In all three conditions (standardized, low temperature, LEO), the LFP group failed to achieve manufacturer specified cycle life due to the increased cycling rates outweighing the benefit of the LEO cycle partial ΔSoE, however, their degradation is trending towards a plateau at approximately 75% which is near manufacturer specified performance. It should be noted that range bars are increasing for each LFP group, however not to the extent experienced in the NCA and NMC cell types.
In all three conditions, degradation for each LFP cell at BoL degrades at a relatively linear rate until 1000 equivalent cycles (~90% capacity remaining), and subsequently decelerates in degradation until the end of test at ~80% capacity remaining. This finding is contrary to that of Severson et al. [12], which only showed cases of accelerated degradation (i.e., knee-point) until ~88% capacity remaining. Interestingly, the graphite||LFP cells used by Severson et al. [12] (APR18650M1A) are the earlier model of the cells used in this study (APR18650M1B). This finding once again highlights the importance of testing cells in their partial ΔSoC application as opposed to a 100% ΔSoC in order to accurately quantify degradation performance that is expected in the true application. Although a knee-onset has yet to occur in the LEO cycled LFP cells, as these cells are still operational, the knee-onset and knee-point may occur with increased degradation.
In summary, each cell type achieved its best cycle life in different conditions. The corresponding equivalent cycles at 80% capacity remaining is presented in Table 4, for each cell type and condition, with the highest performing condition per cell type highlighted.

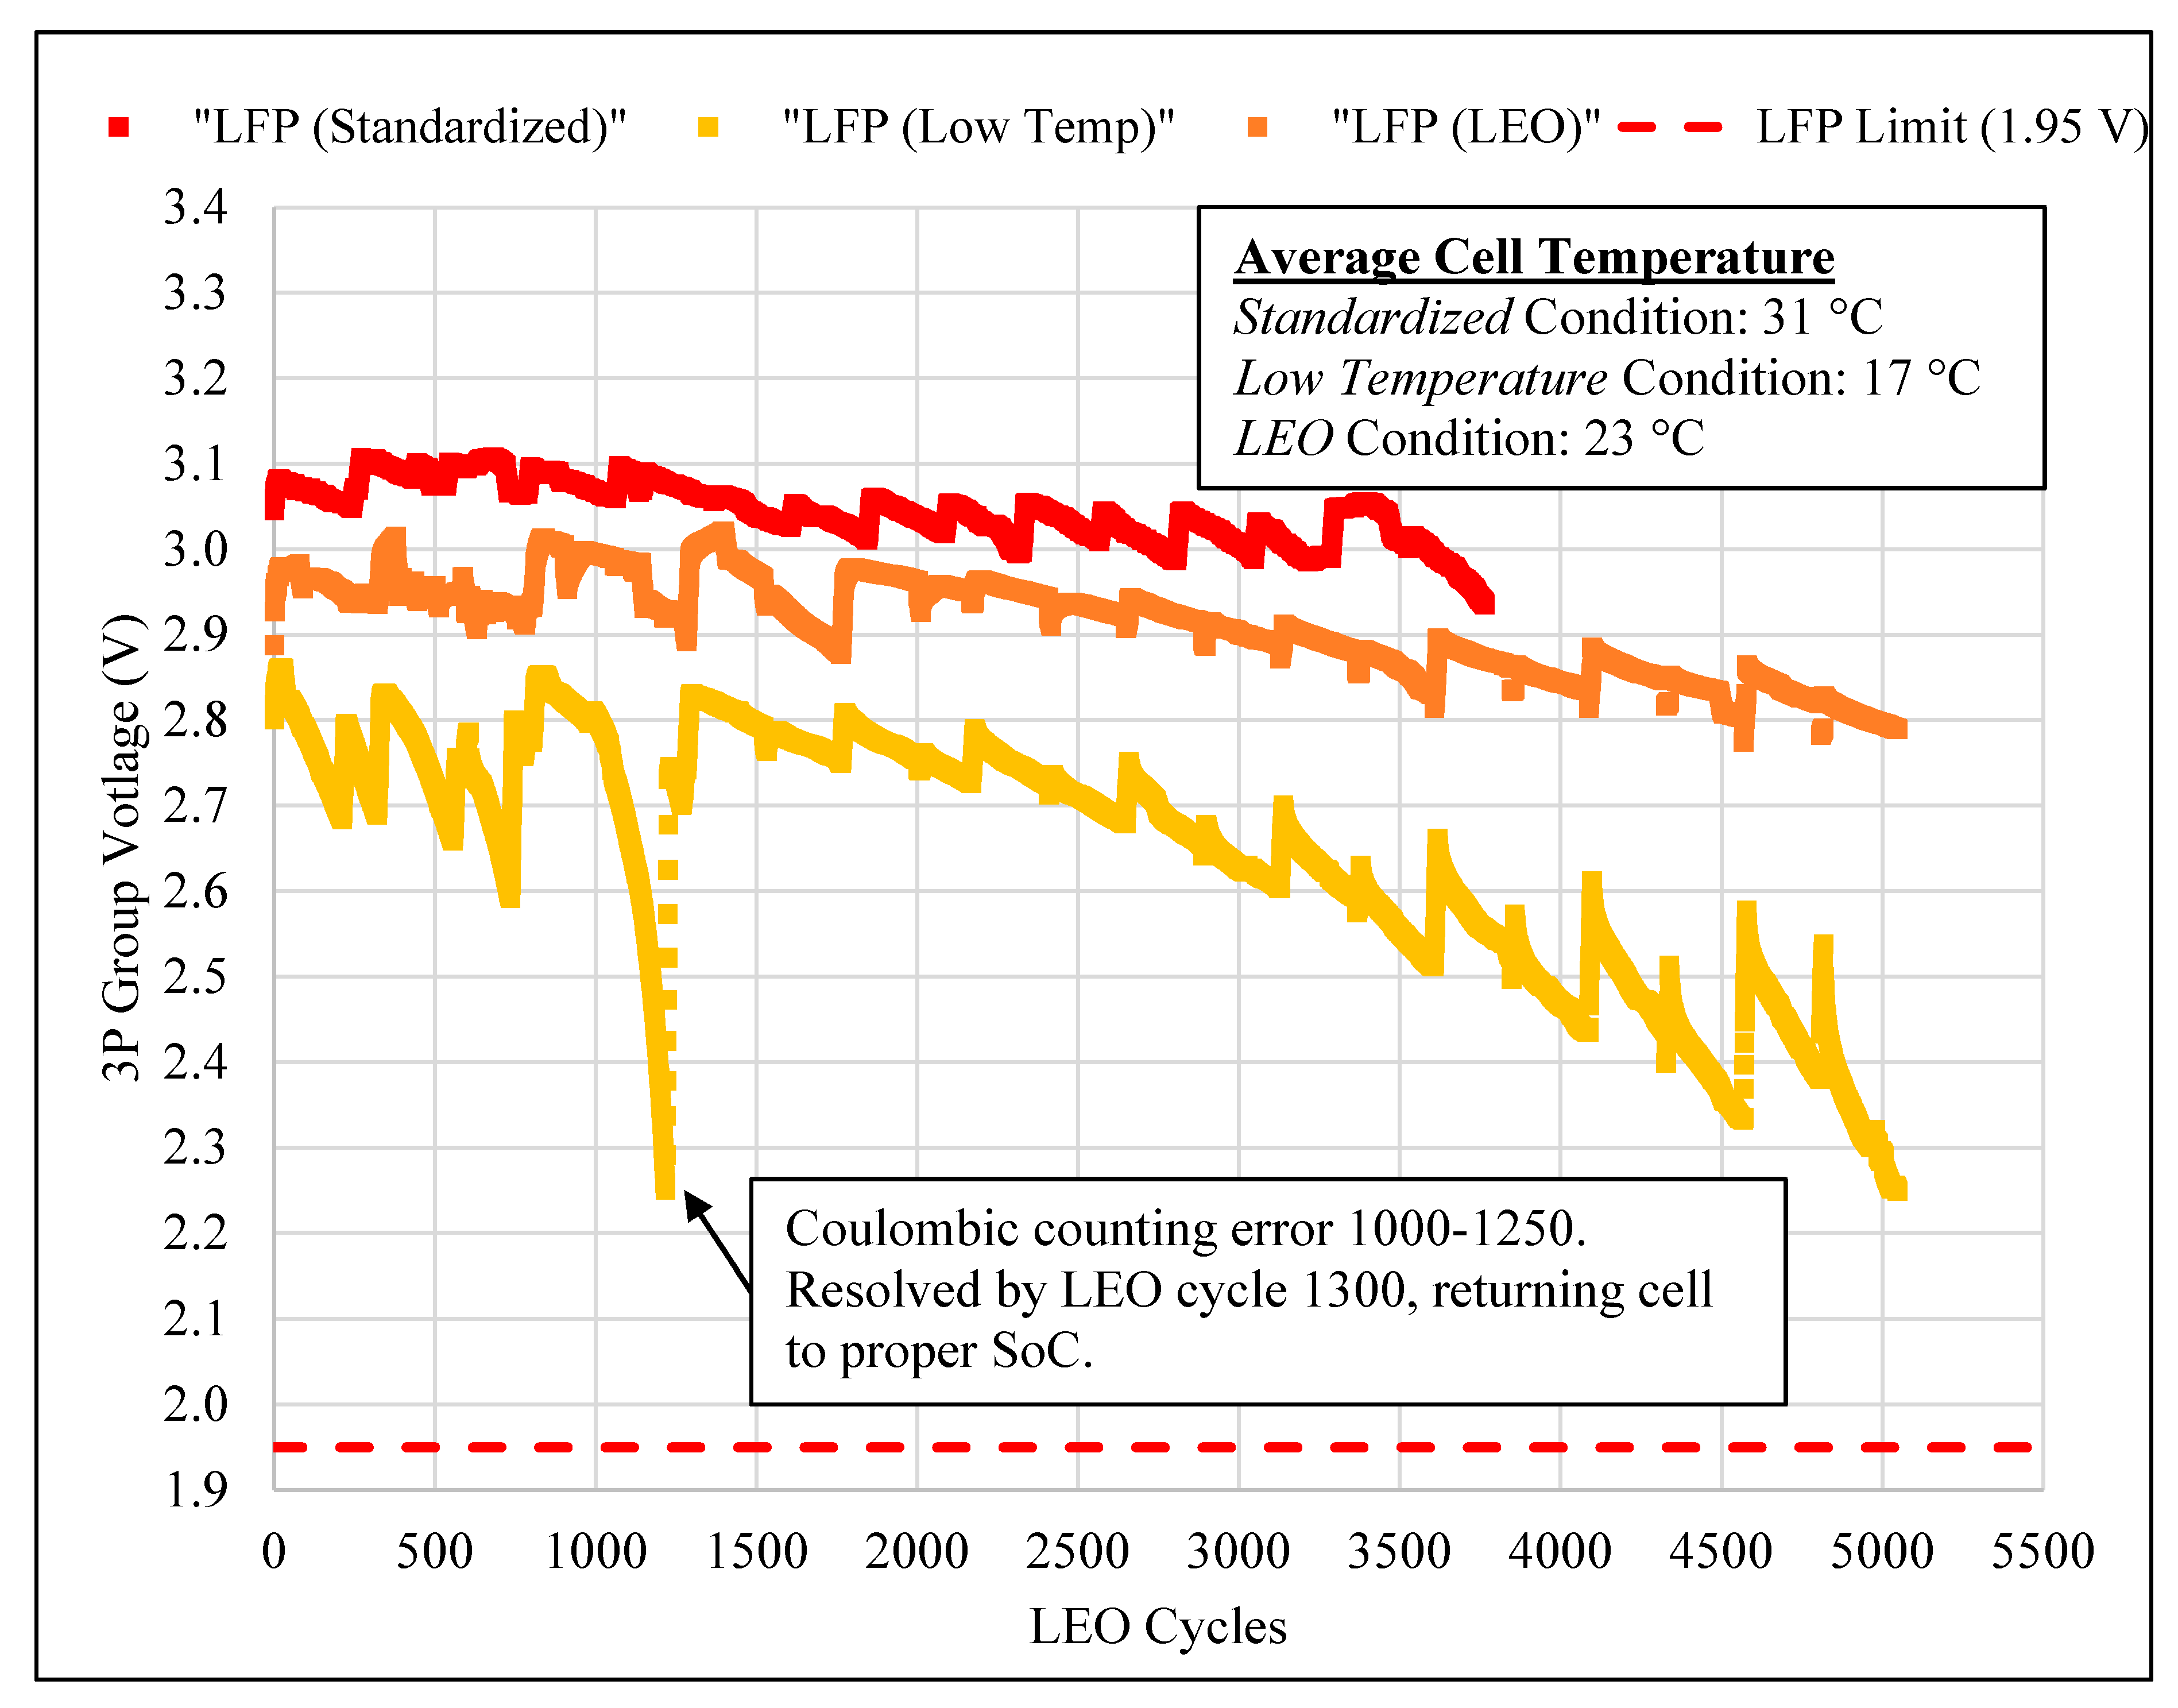
3.3. End of Discharge Voltage Analysis

LFP cells in all three conditions have similar capacity degradation (±1%), with the same total discharge energy throughput. All LFP cells are still operational at the time of writing this article. Thus, the EoL discharge throughput energy and LEO cycle count is unknown. However, the similarity in capacity degradation curves in Figure 4 (bottom) lacks resolution to ensure that testing the LFP cell type in the colder temperature condition will yield better LEO cycle count compared to the, respectively increasing warmer LEO and standardized conditions. By examining the LFP cell type cycle life, using the alternative end of discharge voltage approach proposed by Song et al. [10], further insights to EoL conditions are revealed, as shown in Figure 5.
From BoL to EoL, Figure 5 reveals that the operating temperature effects the end of discharge voltage, with the warmest condition (i.e., standardized) having the highest end of discharge voltage. The rate at which the end of discharge voltage decreases is different for each condition. Both the standardized and LEO conditions end of discharge voltage decreases linearly at different rates for the entirety of the testing, whereas the low temperature condition experiences an exponential decrease in end of discharge voltage. As a result of different starting positions and rates, the end of discharge voltage range increases between cell groups in different conditions throughout LEO cycling.
The difference in starting position and trends in the end of discharge voltage between each condition are shown in Figure 5, and leads us to infer that the standardized LFP group will achieve the greatest LEO cycle count, second will be the LEO condition, and third will be the low temperature condition.

4. Conclusions and Recommendations

Three progressively complex test conditions were created with varying equipment to test LIB in a simulated LEO cycle to analyze the impact it has on cycle life when compared to the manufacturer specifications. This differs from previous research which uses constant current testing as a proxy. The differences in performance between each condition, for both NCA and NMC cell types, was evident in the capacity degradation. Results show that the cycle equivalents of both NCA and NMC cells operating in the LEO condition align well with the manufacturer specified cycle life. Consequently, LEO cycle life can reasonably be predicted from manufacturer specification sheets for both the NCA and NMC cell types. The LFP cell type showed marginal differences in capacity degradation between each condition. Although the LFP cell groups remain operational, they only achieve approximately 66% of the cycle equivalents of their manufacturer life cycle rating, due to the higher charge and discharge rates in the accelerated LEO cycle. On further inspection, via end of discharge voltage analysis, differences between LFP cell groups were evident, showing that the warmer cell groups (LEO and standardized) will likely outlast the colder cell groups regardless of capacity degradation rates.
In all cases, the standardized (hot) and low temperature (cold) conditions result in a different thermal response of the cell compared to the LEO condition, and consequently do not provide useful information for CubeSat applications. To experimentally determine the LEO cycle life, we first recommend testing be completed in the LEO condition at the desired rates to produce accurate results. Alternatively, if a thermal-vacuum chamber is not available the manufacturer specification sheets can be used as an initial screening tool prior to cell selection.

Author Contributions

Conceptualization, R.C. and L.S.; methodology, R.C. and L.S.; software, R.C.; validation, R.C., L.S. and K.P.; formal analysis, R.C. and L.S.; investigation, R.C. and L.S.; resources, L.S. and K.P.; data curation, R.C.; writing—original draft preparation, R.C.; writing—review and editing, R.C. and L.S.; visualization, R.C.; supervision, L.S. and K.P.; project administration, L.S.; funding acquisition, K.P. All authors have read and agreed to the published version of the manuscript.

Funding

This research was funded by the Canadian CubeSat Project (CCP) grant No. 17CCPDAL06 and the APC was funded by Canadian CubeSat Project (CCP) grant No. 17CCPDAL06 and Lukas Swan’s Discovery Grant from the Natural Science and Engineering Research Council (NSERC) of Canada.

Institutional Review Board Statement

Not applicable.

Informed Consent Statement

Not applicable.

Data Availability Statement

Access to the test data will be granted on an individual request basis. Please contact [email protected].

Acknowledgments

We thank the Canadian Space Agency for funding this research project through the award of a Canadian CubeSat Project (CCP).

Conflicts of Interest

The authors declare no conflict of interest.

Abbreviations

BoLBeginning of Life
CCConstant Current
CPConstant Power
CVConstant Voltage
EoLEnd of Life
LEOLow Earth Orbit
LFPLithium Iron Phosphate
LIBLithium-Ion Battery
NAMNegative Active Material
NCANickel Cobalt Aluminum
NMCNickel Manganese Cobalt
PAMPositive Active Material
SoCState of Charge
SoEState of Energy

References

  1. Gao, S.; Clark, K.; Unwin, M.; Zackrisson, J.; Shiroma, W.A.; Akagi, J.M.; Maynard, K.; Garner, P.; Boccia, L.; Amendola, G.; et al. Antennas for modern small satellites. IEEE Antennas Propag. Mag. 2009, 51, 40–56. [Google Scholar] [CrossRef]
  2. Nanosats. NanoSatellite Database. Available online: https://www.nanosats.eu/ (accessed on 3 March 2019).
  3. Chin, K.B.; Brandon, E.J.; Bugga, R.V.; Smart, M.C.; Jones, S.C.; Krause, F.C.; West, W.C.; Bolotin, G.G. Energy Storage Technologies for Small Satellite Applications. Proc. IEEE 2018, 106, 419–428. [Google Scholar] [CrossRef]
  4. NASA. State of the Art of Small Spacecraft Technology. 2018; pp. 1–202. Available online: https://sst-soa.arc.nasa.gov/04-propulsion (accessed on 20 November 2020).
  5. Bouwmeester, J.; Guo, J. Survey of worldwide pico- and nanosatellite missions, distributions and subsystem technology. Acta Astronaut. 2010, 67, 854–862. [Google Scholar] [CrossRef]
  6. Dubarry, M.; Devie, A.; McKenzie, K. Durability and reliability of electric vehicle batteries under electric utility grid operations: Bidirectional charging impact analysis. J. Power Sources 2017, 358, 39–49. [Google Scholar] [CrossRef]
  7. Ma, S.; Jiang, M.; Tao, P.; Song, C.; Wu, J.; Wang, J.; Deng, T.; Shang, W. Temperature effect and thermal impact in lithium-ion batteries: A review. Prog. Nat. Sci. Mater. Int. 2018, 28, 653–666. [Google Scholar] [CrossRef]
  8. Xia, J.; Nie, M.; Ma, L.; Dahn, J. Variation of Coulombic Efficiency versus Upper Cutoff Potential of Li-ion Cells Tested with Aggressive Protocols. J. Power Sources 2015, 306, 233–240. [Google Scholar] [CrossRef]
  9. Keil, P.; Schuster, S.F.; Travi, J.; Hauser, A.; Karl, R.C.; Jossen, A. Calendar Aging of Lithium-Ion Batteries I. Impact of the Graphite Anode on Capacity Fade. J. Electrochem. Soc. 2016, 163, A1872–A1880. [Google Scholar] [CrossRef]
  10. Song, Y.; Liu, D.; Yang, C.; Peng, Y. Data-driven hybrid remaining useful life estimation approach for spacecraft lithium-ion battery. Microelectron. Reliab. 2017, 75, 142–153. [Google Scholar] [CrossRef]
  11. Fermín-Cueto, P.; McTurk, E.; Allerhand, M.; Medina-Lopez, E.; Anjos, M.F.; Sylvester, J.; Dos Reis, G. Identification and machine learning prediction of knee-point and knee-onset in capacity degradation curves of lithium-ion cells. Energy AI 2020, 1, 100006. [Google Scholar] [CrossRef]
  12. Severson, K.A.; Attia, P.M.; Jin, N.; Perkins, N.; Jiang, B.; Yang, Z.; Chen, M.H.; Aykol, M.; Herring, P.K.; Fraggedakis, D.; et al. Data-driven prediction of battery cycle life before capacity degradation. Nat. Energy 2019, 4, 383–391. [Google Scholar] [CrossRef] [Green Version]
  13. Lami, M.; Shamayleh, A.; Mukhopadhyay, S. Mukhopadhyay. Minimizing the state of health degradation of Li-ion batteries onboard low earth orbit satellites. Soft Comput. 2020, 24, 4131–4147. [Google Scholar] [CrossRef]
  14. Krause, F.C.; Loveland, J.A.; Smart, M.C.; Brandon, E.J.; Bugga, R.V. Implementation of commercial Li-ion cells on the MarCO deep space CubeSats. J. Power Sources 2020, 449, 1–9. [Google Scholar] [CrossRef]
  15. Bugga, R.; Krause, C.; Billings, K.; Ruiz, J.P.; Brandon, E.; Darcy, E.; Iannello, C. NASA (JPL)—Performance of Commercial High Energy and High Power Li-Ion Cells in Jovian Missions Encountering High Radiation Environments. 2019. Available online: https://www.nasa.gov/sites/default/files/atoms/files/3-nasa_battery_workshop_nov_2019_high_power_li-ion_cells_final.pdf (accessed on 20 November 2020).
  16. Lee, J.-W.; Anguchamy, Y.; Popov, B.N. Simulation of charge-discharge cycling of lithium-ion batteries under low-earth-orbit conditions. J. Power Sources 2006, 162, 1395–1400. [Google Scholar] [CrossRef]
  17. Cook, R.; Swan, L.; Plucknett, K. Failure mode analysis of lithium ion batteries operated for low Earth orbit CubeSat applications. J. Energy Storage 2020, 31, 1–10. [Google Scholar] [CrossRef]
  18. Panasonic. NCR18650B Data Sheet. Available online: https://www.batteryspace.com/prod-specs/NCR18650B.pdf (accessed on 20 November 2020).
  19. Kim, J.J.; Ahn, S.H. LG Chem ICR18650B4 Data Sheet. 2011, Volume 21. No. 1. Available online: https://www.batteryspace.com/prod-specs/5457_B4.pdf (accessed on 20 November 2020).
  20. LithiumWerks. APR18650M1B Data Sheet. pp. 1–2. Available online: https://www.batteryspace.com/prod-specs/6612-APR18650M1B.pdf (accessed on 20 November 2020).
  21. Cook, R.W. Lithium Ion Battery Performance in Low Earth Orbit Satellite Applications. Master’s Thesis, Dalhousie University, Halifax, NS, Canada, 2020. [Google Scholar]
  22. Harvey, G.A.; Kinard, W.H. NASA Langley Research Center—MISSE 1 & 2 Tray Temperature Measurements (Post-Retrieval Conference). In Proceedings of the MISSE Post-Retrieval Conference (NASA), Orlando, FL, USA, 26–30 June 2006. [Google Scholar]
  23. NASA. US Standard Atmosphere, 1976. United States, NASA Technical Reports Server, Book; 1976. Available online: https://ntrs.nasa.gov/archive/nasa/casi.ntrs.nasa.gov/19770009539.pdf (accessed on 20 November 2020).
  24. Jeevarajan, J.A.; Duffield, B.E. NASA (JSC)—Performance and Safety of Lithium-Ion Polymer Pouch Cells. J. Sp. Saf. Eng. 2014, 1, 10–16. [Google Scholar]
  25. Clark, C.S.; Simon, E. Evaluation of Lithium Polymer Technology for Small Satellite Applications. In Proceedings of the 21st Annual AIAA/USU Conference on Small Satellites, Logan, UT, USA, 13–16 August 2007; pp. 1–11. Available online: https://digitalcommons.usu.edu/smallsat/2007/all2007/66/ (accessed on 20 November 2020).
  26. Jeevarajan, J. NASA (JSC)—Tolerance of Li-Ion Pouch Cells to Varied Space Environment Pressures Lithium Power 2012. Nasa-jsc. Available online: https://ntrs.nasa.gov/archive/nasa/casi.ntrs.nasa.gov/20130000451.pdf (accessed on 20 November 2020).
  27. Jeevarajan, J.A.; Inoue, T. NASA (JSC)—A Novel Lithium-ion Laminated Pouch Cell Tested for Performance and Safety. 2000; No. 281; pp. 2–5. Available online: https://ntrs.nasa.gov/search.jsp?R=20060020764 (accessed on 20 November 2020).
  28. Buckle, R. Life Testing of COTS Cells for Optimum Battery Sizing. In Proceedings of the 2019 European Space Power Conference (ESPC 2019), Juan-Les-Pins, France, 30 September–4 October 2019. [Google Scholar]
  29. ECSS. Space Engineering Li-Ion Battery Testing Handbook; ESA Requirements and Standards Division: Noordwijk, The Netherlands, 2015; pp. 1–31. [Google Scholar]
Figure 1. Experimental test configuration showing the temperature and pressure values for each of the three test conditions.
Batteries 07 00020 g001
Figure 2. Experimental setup photograph of the interior of thermal chamber, with LEO condition test cells (0.2 kPa, 10 °C) in 3P groupings. Note that the test cells in the standardized condition (101 kPa, 20 °C) and low temperature condition (101 kPa, 10 °C) are not shown.
Batteries 07 00020 g002
Figure 3. Grouping of NCA cells in 3P configuration with type T thermocouples adhered to each cell.
Batteries 07 00020 g003
Figure 4. Normalized discharge energy capacity measured at reference cycles versus number of equivalent cycles for each cell type (top: NCA, NMC; bottom: LFP) and LEO cycling condition. Manufacturer specification sheet 80% cycle life marked by dashed vertical lines for NCA (250 cycles), NMC (300 cycles) and LFP (4000 cycles).
Batteries 07 00020 g004
Figure 5. LEO cycling end of discharge voltage versus completed LEO cycles for LFP cells in all three conditions.
Batteries 07 00020 g005
Table 1. Single 18–65 cylindrical cell manufacturer datasheet specifications.
Specification Sheet ParameterNCA [18]NMC [19]LFP [20]
Voltage range (V)2.5–4.22.75–4.22.0–3.6
Nominal voltage (V)3.63.63.3
Rated coulombic capacity (Ah)3.352.601.10
Rated energy capacity (Wh)11.99.363.63
Max recommended continuous C-rate for 100% ΔSoC cycle (discharge/charge)2.0/0.52.0/1.027.3/3.6
Rated cycle life to 80% capacity (cycles)2503004000
Cycle life test C-rate (discharge/charge)1.0/0.50.2/0.51.0/1.0
PAM Elemental CompositionLiNi0.83Co0.14Al0.03O2LiNi0.5Mn0.3Co0.2O2LiFePO4
Table 2. ΔSoE and approximate cycling rates for each cell type during accelerated LEO cycling.
CellBoL ΔSoE CP Discharge RatePeak Charge RateMinimum Charge Rate
NCA18%0.93C0.93C0.55C
NMC23%1.20C1.20C0.71C
LFP60%3.09C3.09C1.84C
Table 3. Average cell temperature during LEO cycle operating for each cell type and experimental condition.
Cell TypeStandardized Condition
(101 kPa-abs, 20 °C)
Low Temperature Condition
(101 kPa-abs, 10 °C)
LEO Condition
(0.2 kPa-abs, 10 °C)
NCA36 °C18 °C27 °C
NMC37 °C18 °C27 °C
LFP31 °C17 °C23 °C
Table 4. Equivalent cycles of initial measured coulombic capacity to degrade to 80% discharge coulombic capacity for each cell type in all three conditions, with manufacturer specified cycle life reproduced for clarity. Highest experimental equivalent cycle life is highlighted.
Cell TypeStandardizedLow TemperatureLEOManufacturer Specified
NCA218178264250
NMC755230324300
LFP2271309923094000
Publisher’s Note: MDPI stays neutral with regard to jurisdictional claims in published maps and institutional affiliations.

