Design Considerations for Fast Charging Lithium Ion Cells for NMC/MCMB Electrode Pairs


1
College of Engineering, Penn State University Hazleton Campus, Hazleton, PA 18202, USA
2
Lawrence Berkeley National Laboratory, Energy Storage and Distributed Resources Division, Berkeley, CA 94720, USA
*
Author to whom correspondence should be addressed.
Batteries 2021, 7(1), 4; https://0-doi-org.brum.beds.ac.uk/10.3390/batteries7010004
Submission received: 16 November 2020
/
Revised: 16 December 2020
/
Accepted: 30 December 2020
/
Published: 5 January 2021
Abstract
:Lithium ion cells that can be quickly charged are of critical importance for the continued and accelerated penetration of electric vehicles (EV) into the consumer market. Considering this, the U.S. Department of Energy (DOE) has set a cell recharge time goal of 10–15 min. The following study provides an investigation into the effect of cell design, specifically negative to positive matching ratio (1.2:1 vs. 1.7:1) on fast charging performance. By using specific charging procedures based on negative electrode performance, as opposed to the industrial standard constant current constant voltage procedures, we show that the cells with a higher N:P ratio can be charged to ~16% higher capacity in the ten-minute time frame. Cells with a higher N:P ratio also show similar cycle life performance to those with a conventional N:P ratio, despite the fact that these cells experience a much higher irreversible capacity loss, leading to a lower reversible specific capacity.
1. Introduction
Lithium ion cells continue to be the energy storage medium of choice for many electric vehicles (EV) currently in production [1]. For continued growth and further implementation of electric vehicles into the transportation market, it is crucial that battery “refuel” times are reduced and become comparable to the time required to fill an internal combustion engine (ICE) vehicle fuel tank [2]. Current pathways to “refuel” battery powered vehicles are either quick cell replacement through exchange or swap stations [3], electrified roads [4], or fast charging lithium ion cells [5,6,7]. Much effort is being spent throughout industry and academia to develop fast charging batteries, and in regard to today’s currently produced cells and commercially available negative electrode active materials, it is widely accepted that the graphite negative electrode is a major factor, limiting fast charge capability and affecting both cell performance and safety [8,9,10,11,12,13,14]. When attempting to quickly charge lithium ion cells containing a graphite negative electrode, polarization occurs and the negative electrode reaches voltages below 0.00 V vs. Li/Li+, allowing lithium metal plating to occur [15]. This occurs because most of the graphite capacity lies at or below 100 mV vs. Li/Li+ [16], where a small polarization results in conditions favorable to lithium metal plating. Cell designs are possible using higher voltage negative electrode materials such as Li4Ti5O12 (LTO), but there are drawbacks with these materials, namely high cost, lower specific capacity, and lower output cell voltage compared to graphite based materials [17]. Based on these considerations, graphite is still the material of choice for most lithium ion cells in production today [18]. These cells are typically charged using constant current–constant voltage (CCCV) charge procedures, where cells are charged at relatively low constant currents until the cell reaches the maximum design voltage, at which point the cell is held at constant voltage until the current tapers to a specified cutoff amount. During conventional CCCV procedures, even at rates as low as C/5, the final stage of charging to 100% state of charge (SOC) occurs during the constant voltage portion of the charging sequence. During this constant voltage portion, the charge time is greatly extended as the current tapers and cell approaches 100% SOC [17]. The general acceptance related to fast charging is that it is charging time measured to 80% SOC, reducing the time needed to charge cells at low rates to reach 100% SOC [19,20]. The US DOE has also set cell recharge goals at 10–15 min for EV batteries [2].
We have previously reported the development of an accelerated lithium ion charging procedure based on half-cell characterization [21]. This procedure was designed to produce a lithium ion full-cell, where the negative electrode is held slightly above 0.00 V vs. Li/Li+ during the accelerated charging sequence. The positive electrode loadings for this study were representative of a standard energy density loading comparable to commercial cells in production today (1.69 or 2.41 mAh cm−2, LiNi1/3Mn1/3Co1/3O2, NMC). Using this procedure, a cell was able to be charged with no change in capacity fade compared to baseline CCCV cells to 80% SOC in ~34 min, longer than the goal of a 10‒15 min recharge time, but a large improvement compared to CCCV procedures. In attempts to approach this goal and further reduce charge time, cell operating limits and design changes can be made, typically at the sacrifice of energy density. The easiest change that can be made is to limit cell duty cycle or percentage use, resulting in oversized cells operating at a reduced capacity. For example, if 50% of the cell capacity were to be used, the cell charging time would be greatly reduced, especially if utilizing the initial or lower voltage 50% of the cell capacity, where graphite potential vs. Li/Li+ is higher and negative electrode resistance is lower, allowing for higher charge currents to be used [21]. The lower voltage 50% capacity is defined as the capacity of the cell delivered from ~3.7 to 3.0 V, opposed to the higher voltage capacity delivered from 4.2 V to 3.7 V.
From a cell design perspective, increasing the cell negative to positive matching ratio may also result in a reduction in cell charge time, as less of the negative material is being lithiated to fully charge a cell. It is essentially the same outcome as a lower duty cycle, but applied only to the negative electrode, as cells with an increased negative to positive capacity ratio have a greater excess of negative active material. Along with a reduced charge time, cells with an increased negative to positive matching ratio should also experience a lower energy density, and a decrease in reversible capacity. This decrease in reversible capacity is due to the large offset in irreversible capacity loss between the as-fabricated negative and positive electrodes [22]. The following work presents a detailed analysis of the impact of cell use percentage and design matching ratio on lithium ion cell recharge time, as well as the impact and sacrifice on cell or stack volumetric energy density. A comparison is made between cells with a 1.2 and 1.7 negative to positive (N:P) reversible capacity ratio and the resulting impact on cell charge time. The results are approached and presented from both a theoretical perspective as well as through electrochemical characterization. Previous publications have investigated the impact of cell matching ratio on cycle life [23], discharge rate [24], coulombic efficiency [25], and cell aging and lithium plating [26], so this investigation provides additional insights into the impact of cell design on reducing cell recharge times for fast charging applications.
2. Materials and Methods
Electrode preparation: Negative electrodes of 89.0 wt% graphite (MCMB), 3 wt% Acetylene black, and 5 wt% PVdF (KF1100, Kureha, Tokyo, Japan) and positive electrodes with a composition of 92.8 wt% NMC, 3.8 wt% Acetylene Black (Denka, Tokyo, Japan), and 4 wt% PVdF (HSV-900, Arkema, Colombes, France) were used for half and full-cell fabrication. Electrode processing was done using N-methylpyrrolidone (NMP) solvent and doctor blade coated on 20 µm aluminum foil and 15 µm copper foil for the positive and negative electrode, respectively. Electrodes were then hot calendered (100 °C) to produce electrodes of nominal 40% porosity.
Cell preparation: Prior to cell assembly, blanked 14.29 mm (9/16″) negative electrodes and 12.70 mm (1/2″) positive electrodes were dried in a glovebox vacuum chamber overnight at 120 °C. Cells were assembled using 2325 coin cell components (Hohsen Corp., Osaka, Japan), Celgard (Concord, Hopkins, MN, USA) 2400 separator, and 1.0 M lithium hexafluorophosphate in ethylene carbonate: dimethyl carbonate (1:2) solution with 3 wt% lithium difluoro(oxalate)borate additive. All cell testing was performed at 30 °C using Maccor model 4200 cell cyclers. Half-cells were manufactured using lithium metal (Alfa Aesar, Ward Hill, MA, USA) of 11/16” diameter. Nominal negative electrode loadings were 11.0 mg cm−2 or 2.93 mAh cm−2 and two positive electrode loadings of 17.4 mg cm−2 or 2.41 mAh cm−2 and 12.4 mg cm−2 or 1.69 mAh cm−2 were used, resulting in cells with negative to positive reversible capacity ratio of 1.2 or 1.7 based on 300 and 150 mAh g−1 for MCMB and NMC, respectively. A minimum of three cells of each design were tested for each procedure. In the results section, all cell data are provided to show reproducibility of cell performance.
Half-cell evaluation: Positive half-cell characterization was performed between 4.30 and 3.00 V vs. Li/Li+, and negative half-cell characterization was performed between 1.00 and 0.010 V vs. Li/Li+. For negative half-cells, follow on characterization is outlined in our previous publication [21]. For positive half-cells, two initial cycles were performed at C/25 rate. On subsequent cycles, all cell discharges were performed at a C/10 rate with three charges to 4.30 V at each of the following rates based on NMC of 150 mAh g−1: C/10, C/5, C/2, 1C, and 2C.
Full-cell evaluation: Prior to full-cell evaluation/characterization, a formation procedure was performed as follows: C/25 Charge to 3.5 V followed by a 10 h rest, C/20 charge to 4.20 V followed by 1 h rest, five cycles at C/5 charge with C/50 taper and C/5 discharge between 4.20 and 3.00 V. Following cell formation, additional characterization was performed as outlined in the results section.
Cell design: For the volumetric data analysis presented, the designed prismatic pouch cells would theoretically be assembled with 113 µm aluminum laminate packaging, with the width and length dimension of 50 mm × 100 mm and a target thickness in the range of 5 mm. Cells of these dimensions are easily produced in industry and can then be stacked in parallel and series for an increase in capacity or voltage for battery pack assembly. For volumetric energy density calculations of cells with much smaller dimensions, cell void space and volume taken up by inert materials (packaging, tabs, seals) become the major drivers of energy density opposed to cell design changes. We would like to clarify that all electrochemical testing was performed in 2325 coin cells, and the volumetric energy density assessment represents similar performance occurring in the presented pouch cell design. A 50 × 100 mm prismatic cell will yield negative electrode of 93.5 mm and 48.0 mm and positive electrodes of 92.5 mm and 47.0 mm. Note this cell design represents a common industry practice of utilizing an oversized negative electrode to minimize the possibility of electrode misalignment during fabrication and lithium metal plating due to assembly controls. The presented cell thickness represents an approximate thickness at the beginning of life (BOL) and does not take into account cell growth or “breathing”, which may occur during formation and cell cycling. Table 1 represents a summary of the four various cell designs evaluated. Cell reversible capacity ratio represents a 300 mAh g−1 graphite and a 150 mAh g−1 NMC positive electrode, where cell capacity and energy values are representative of an approximately 5 mm thick cell. These values are given for reference to highlight the reductions in capacity and energy that result from the change in design or operation parameters. 3.70 V is chosen as the midway point because it is the average power output voltage for the cell when discharged at low rate. The cell design capacities highlighted in Table 1 do not account for the expected large irreversible capacity loss, which cells with an increased negative to positive capacity ratio should experience.
3. Results and Discussion
3.1. Accelerated Lithium Ion Charge Procedure from Half-Cell Performance
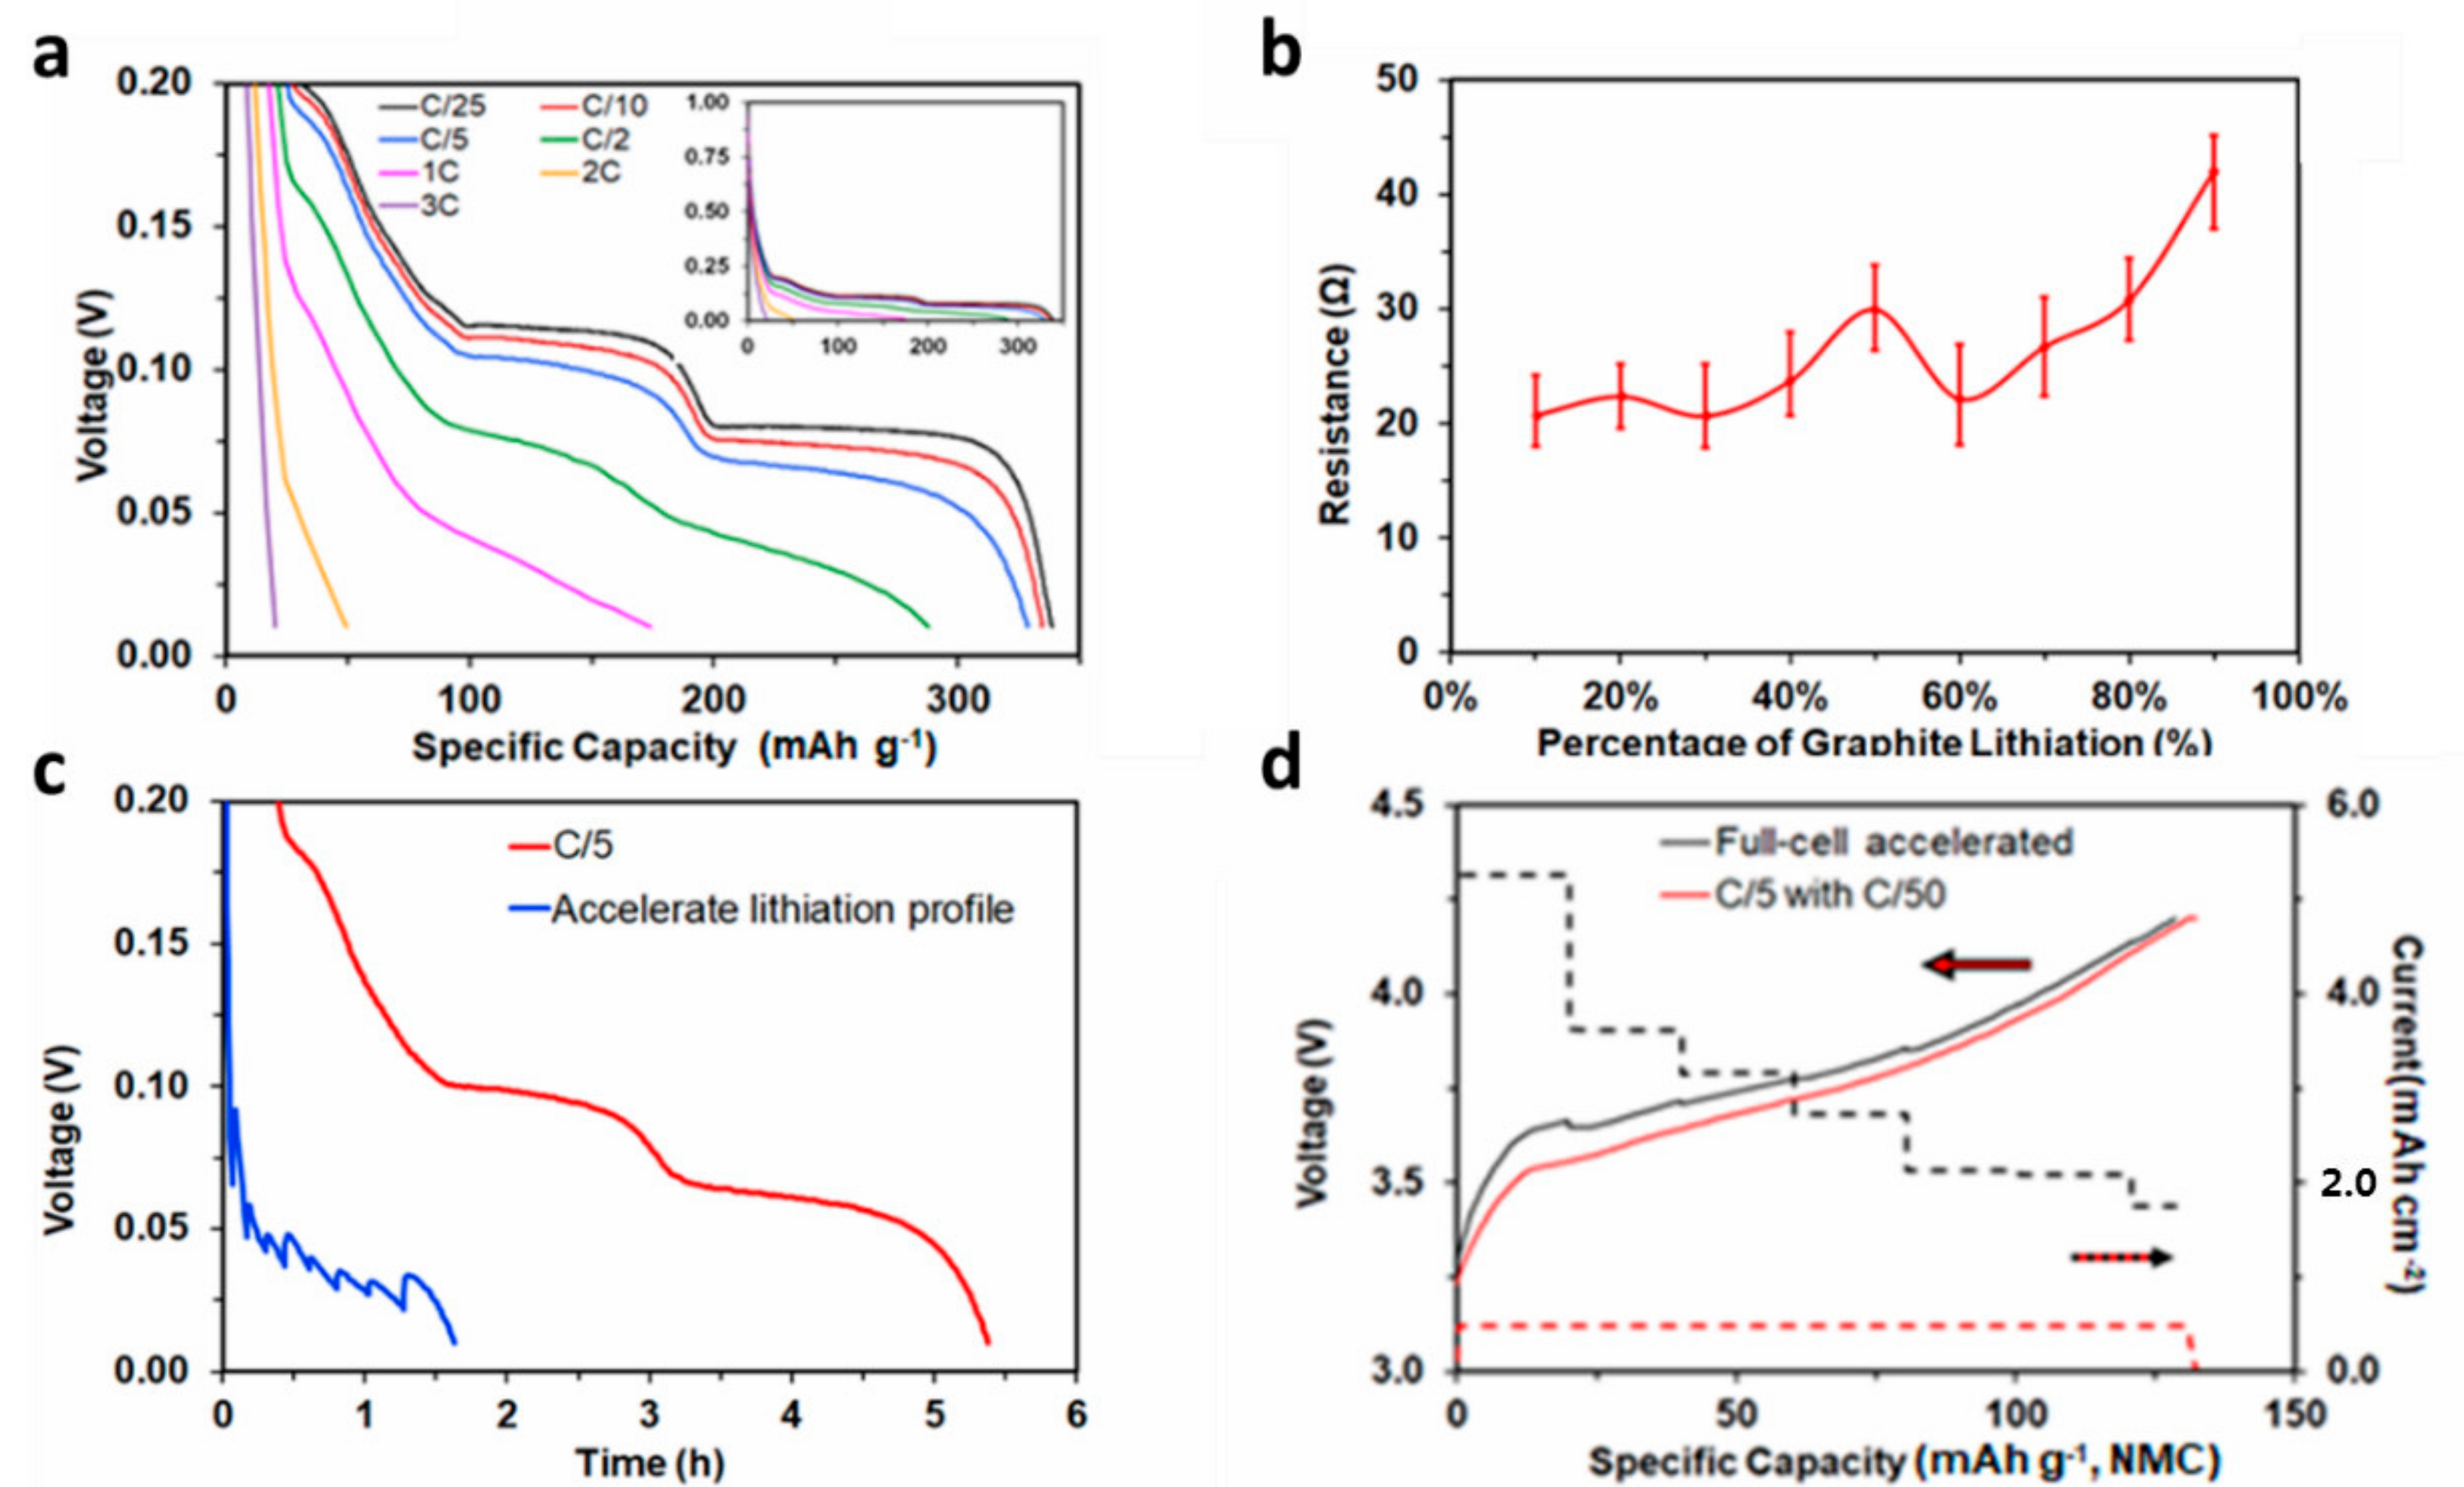
We previously outlined the procedure for determining an accelerated charge rate for a lithium ion cell by looking solely at negative electrode polarization and lithium plating on the graphite negative electrode as the cell failure mechanism (Figure 1) [21]. This fast charging procedure applies a current density, which polarizes the negative electrode to a voltage slightly above 0.00 V vs. Li/Li+. During the application of the previously reported accelerated charge procedure, the current is reduced at every 10% lithiation based solely on graphite lithiation and resistance, independent of cell state of charge, which is typically determined from the positive electrode and cell reversible capacity. Current is continually applied during the graphite lithiation shown in Figure 1c, with rest periods only present following full lithiation. The main application related to this work is that the same charge procedure can be used for multiple cell designs with varied negative to positive capacity ratios, as long as the negative electrode loading and porosity are held constant.
3.2. Theoretical Impact of Matching Ratio on Negative Electrode Utilization
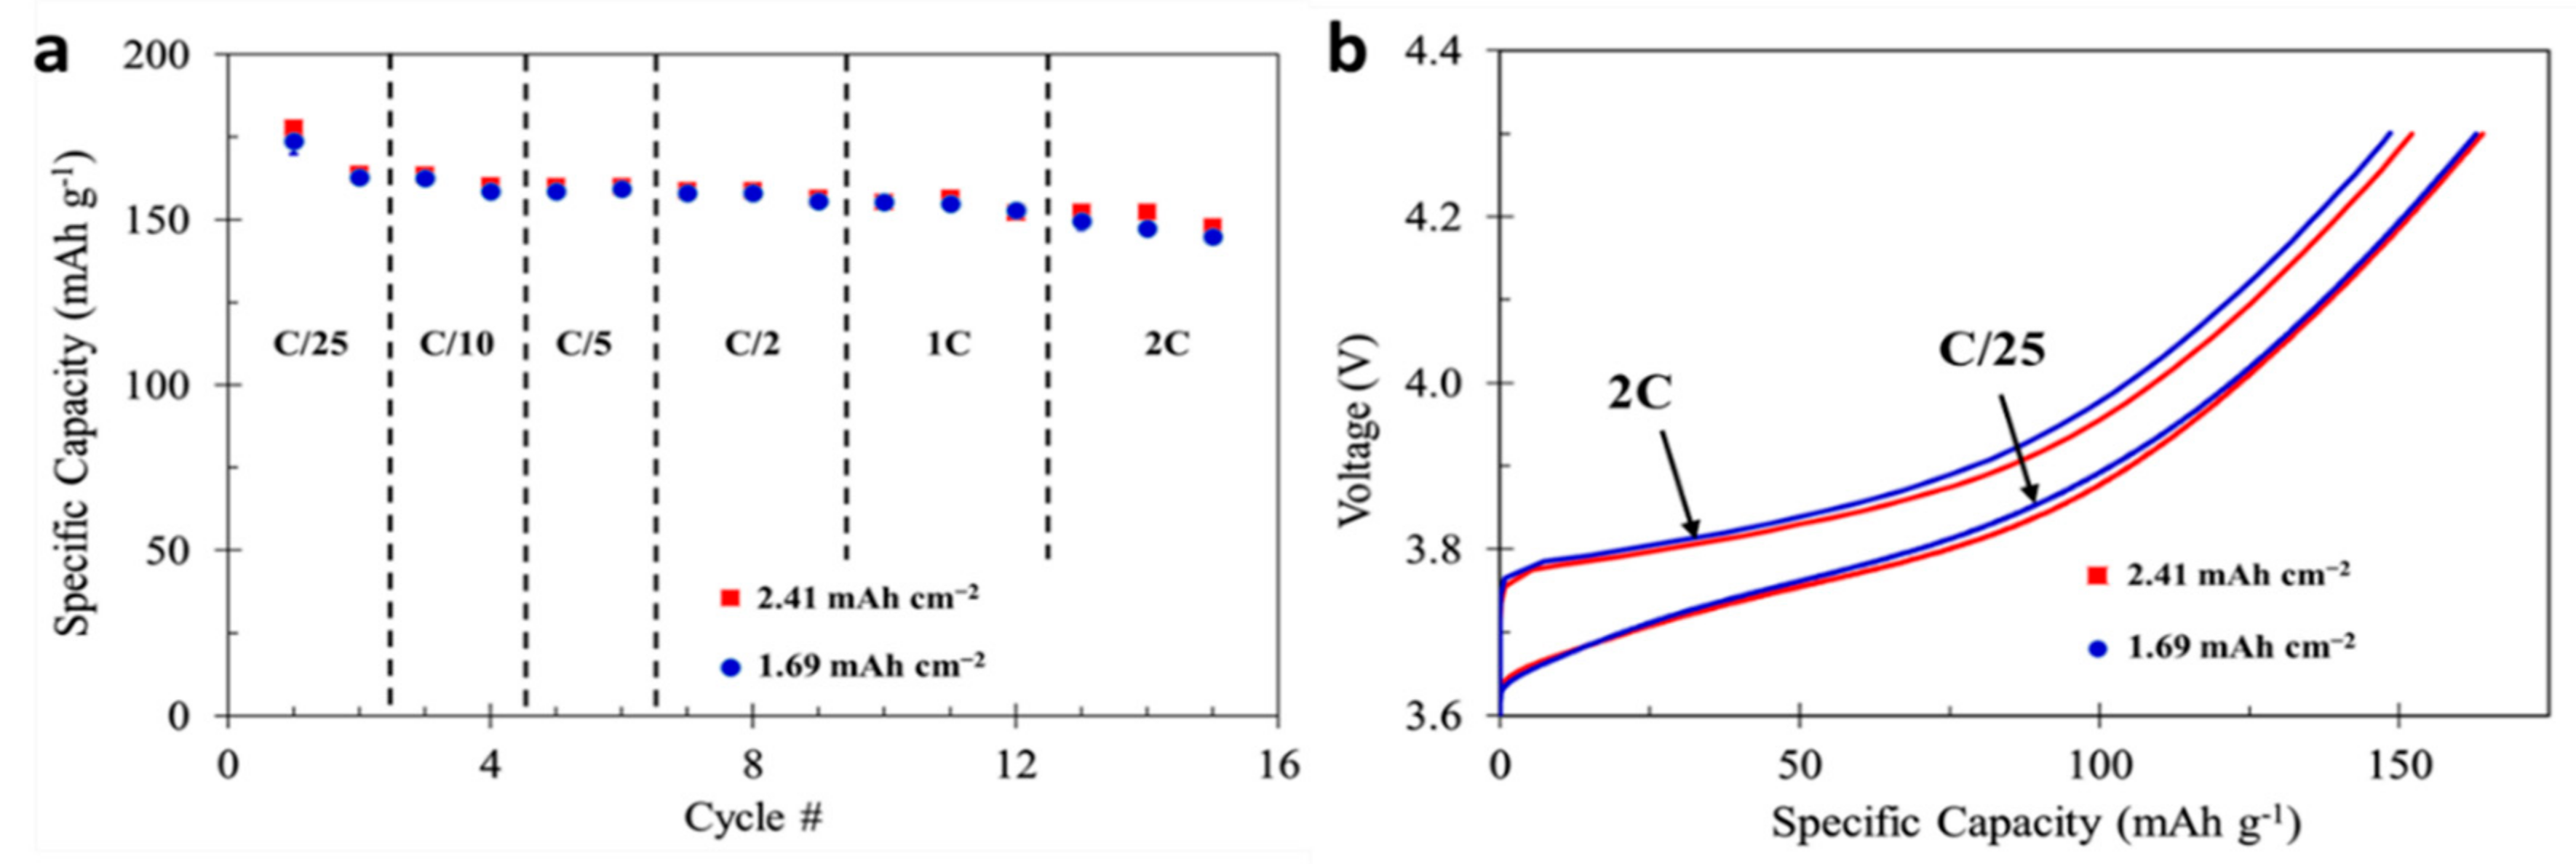
During an accelerated charging sequence, with respect to negative electrode polarization and lithium metal plating, it is essential to charge the cell at a rate where the negative electrode is close to but not below 0.00 V vs. Li/Li+. During this high rate charging, it is also essential that the cell overall voltage remains below the maximum charge limit of the cell. Contrary to standard CCCV lithium ion cell charging procedures, where cell charge rate is based off cell capacity, the developed accelerated charge procedure is based solely off negative electrode polarization and utilization. For two different cell designs (1.2:1 and 1.7:1 N:P), the same charge rate is used for cells with the same negative electrode, independent of positive electrode loading or cell capacity. Figure 2 shows that both positive electrode loadings have the same performance determined from C-rate, as shown in both de-lithiation or full-cell charge capacity (Figure 2a) and voltage profile (Figure 2b). Figure 2a represents the data for six total cells, three of each loading, displaying the performance data as a mean with range bars. Due to the repeatable performance of the cells, only cell data from one cell of each type is shown in Figure 2b to limit complicating the figure.
Table 2 shows that during full-cell charging, when graphite electrodes are lithiated at the same rate, one should expect higher polarization in the positive electrode due to the increased rate observed by this electrode resulting from the differences in matching ratio. For example, lithiating a graphite electrode at an equal area negative electrode 2C rate results in a positive electrode current density equal to a 2.4C or 3.4C for the 1.2:1 and 1.7:1 N:P reversible capacity ratio, respectively, based off 150 and 300 mAh g−1 for NMC and MBMC materials. This difference is the direct result of less positive active material opposite the negative active material in full-cells with an increased negative to positive matching ratio.
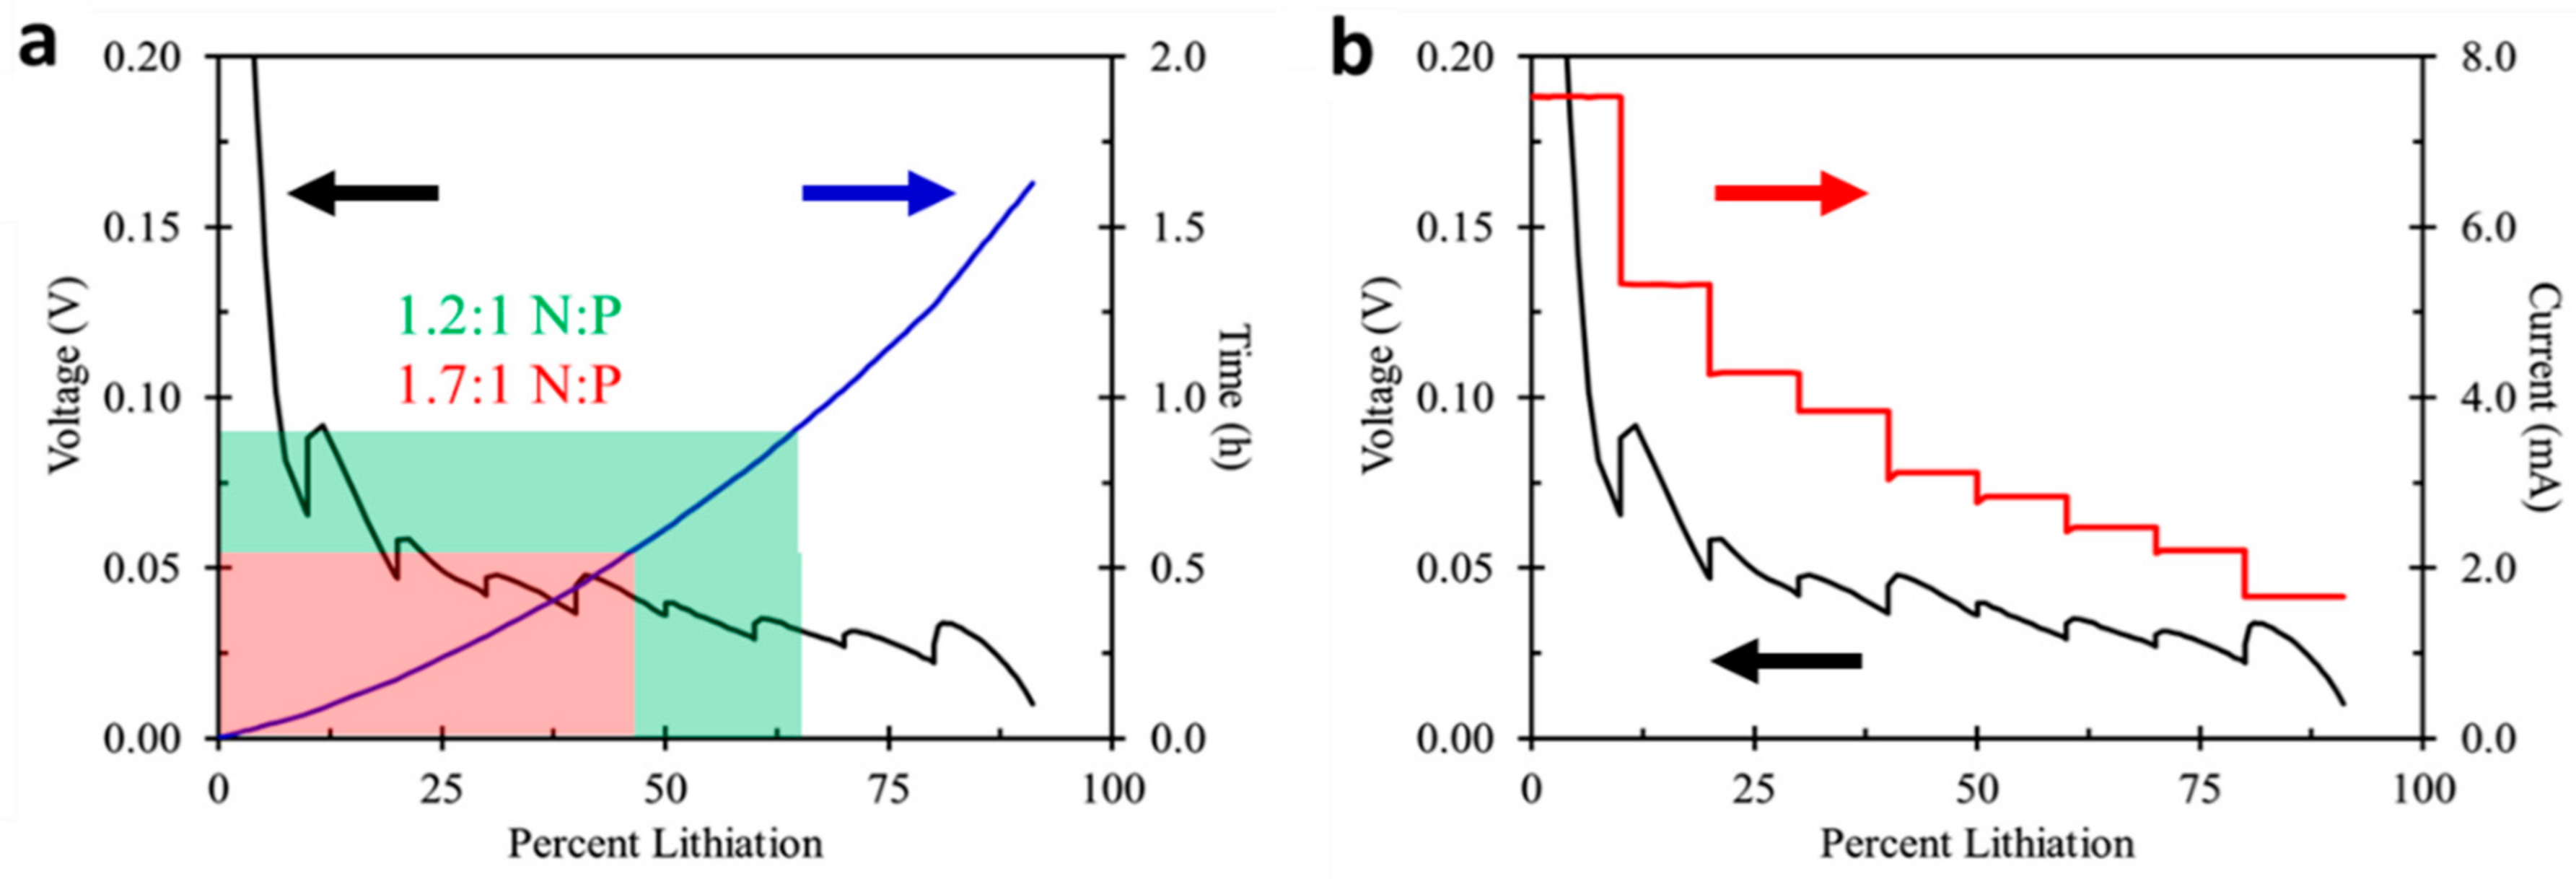
Applying an accelerated charging sequence derived from negative electrode utilization to various cell designs requires the determination of percentage of graphite utilized in a full NMC/MCMB cell. This is related to both negative to positive reversible capacity ratio and irreversible capacity loss (ICL) of each electrode. Half-cell positive and negative reversible capacity at low rate cycling, C/5, yielded 160.4 mAh g−1 and 320.9 mAh g−1 respectively. Based on equal area capacities, the resulting negative electrode utilization would be ~83% and ~59% for a 1.2:1 and 1.7:1 N:P reversible capacity ratio respectively, for cells charged to 100% SOC. Reducing charge percentage to 80% SOC results in a 67% and 47% utilization and recharge time of 58 and 34 min. A theoretical reduction in recharge time of 24 min or 41% by changing cell design matching ratio from 1.2:1 to 1.7:1, although cells with higher N:P, exhibit a lower volumetric energy density as shown in Table 1. This reduction in charging time is graphically illustrated in Figure 3a, where theoretical cell recharge times are based only on negative electrode half-cell performance. The blue line in Figure 3a shows the time to fully lithiate a graphite negative electrode. The green and red boxes demonstrate the percentage the negative electrode will be lithiated to reach 80% SOC based on 1.2:1 and 1.7:1 N:P respectively. Even for cell designs with a typical N:P of 1.2:1, is it still observed that only 67% of the graphite negative electrode is lithiated at 80% SOC. Relating these recharges to actual full-cell performance will be discussed in the following section. An important assumption related to these calculated full-cell recharge times is shown in Figure 3b. During a high-rate negative electrode lithiation, where the negative electrode is held near or below 50 mV, the stated recharge times highlighted in Figure 3a assume the total cell voltage does not go above the cell design maximum charge voltage. Again, this is more likely to occur in cells with a higher N:P ratio, as the positive electrode is exposed to a higher C-rate when negative electrodes are lithiated at the same rate independent of cell design.
Based on the presented half-cell reversible capacities, a 10-min recharge would result in ~26% negative electrode utilization for both presented cell designs. The negative electrode utilization is a direct result of cell matching ratio and percentage charge a cell can reach utilizing the procedure. This equates to cells reaching ~31% or ~44% SOC based on positive electrode half-cell performance for 1.2:1 and 1.7:1 N:P, independent of cell size or capacity. Relaying these percentages to the data presented in Table 1 shows that a 2.31 Ah (1.2:1) cell charged to 31% would deliver 716 mAh, where a 1.8 Ah cell charge to 44% would deliver 792 mAh. Based on half-cell capacities and negative electrode utilization, the cell design with the higher N:P ratio shows the promise to deliver more capacity for a thinner cell with the same footprint recharged to maximum capacity in a ten-minute period utilizing the previously developed accelerated charging profile.
3.3. Cell Design vs. Cell Performance
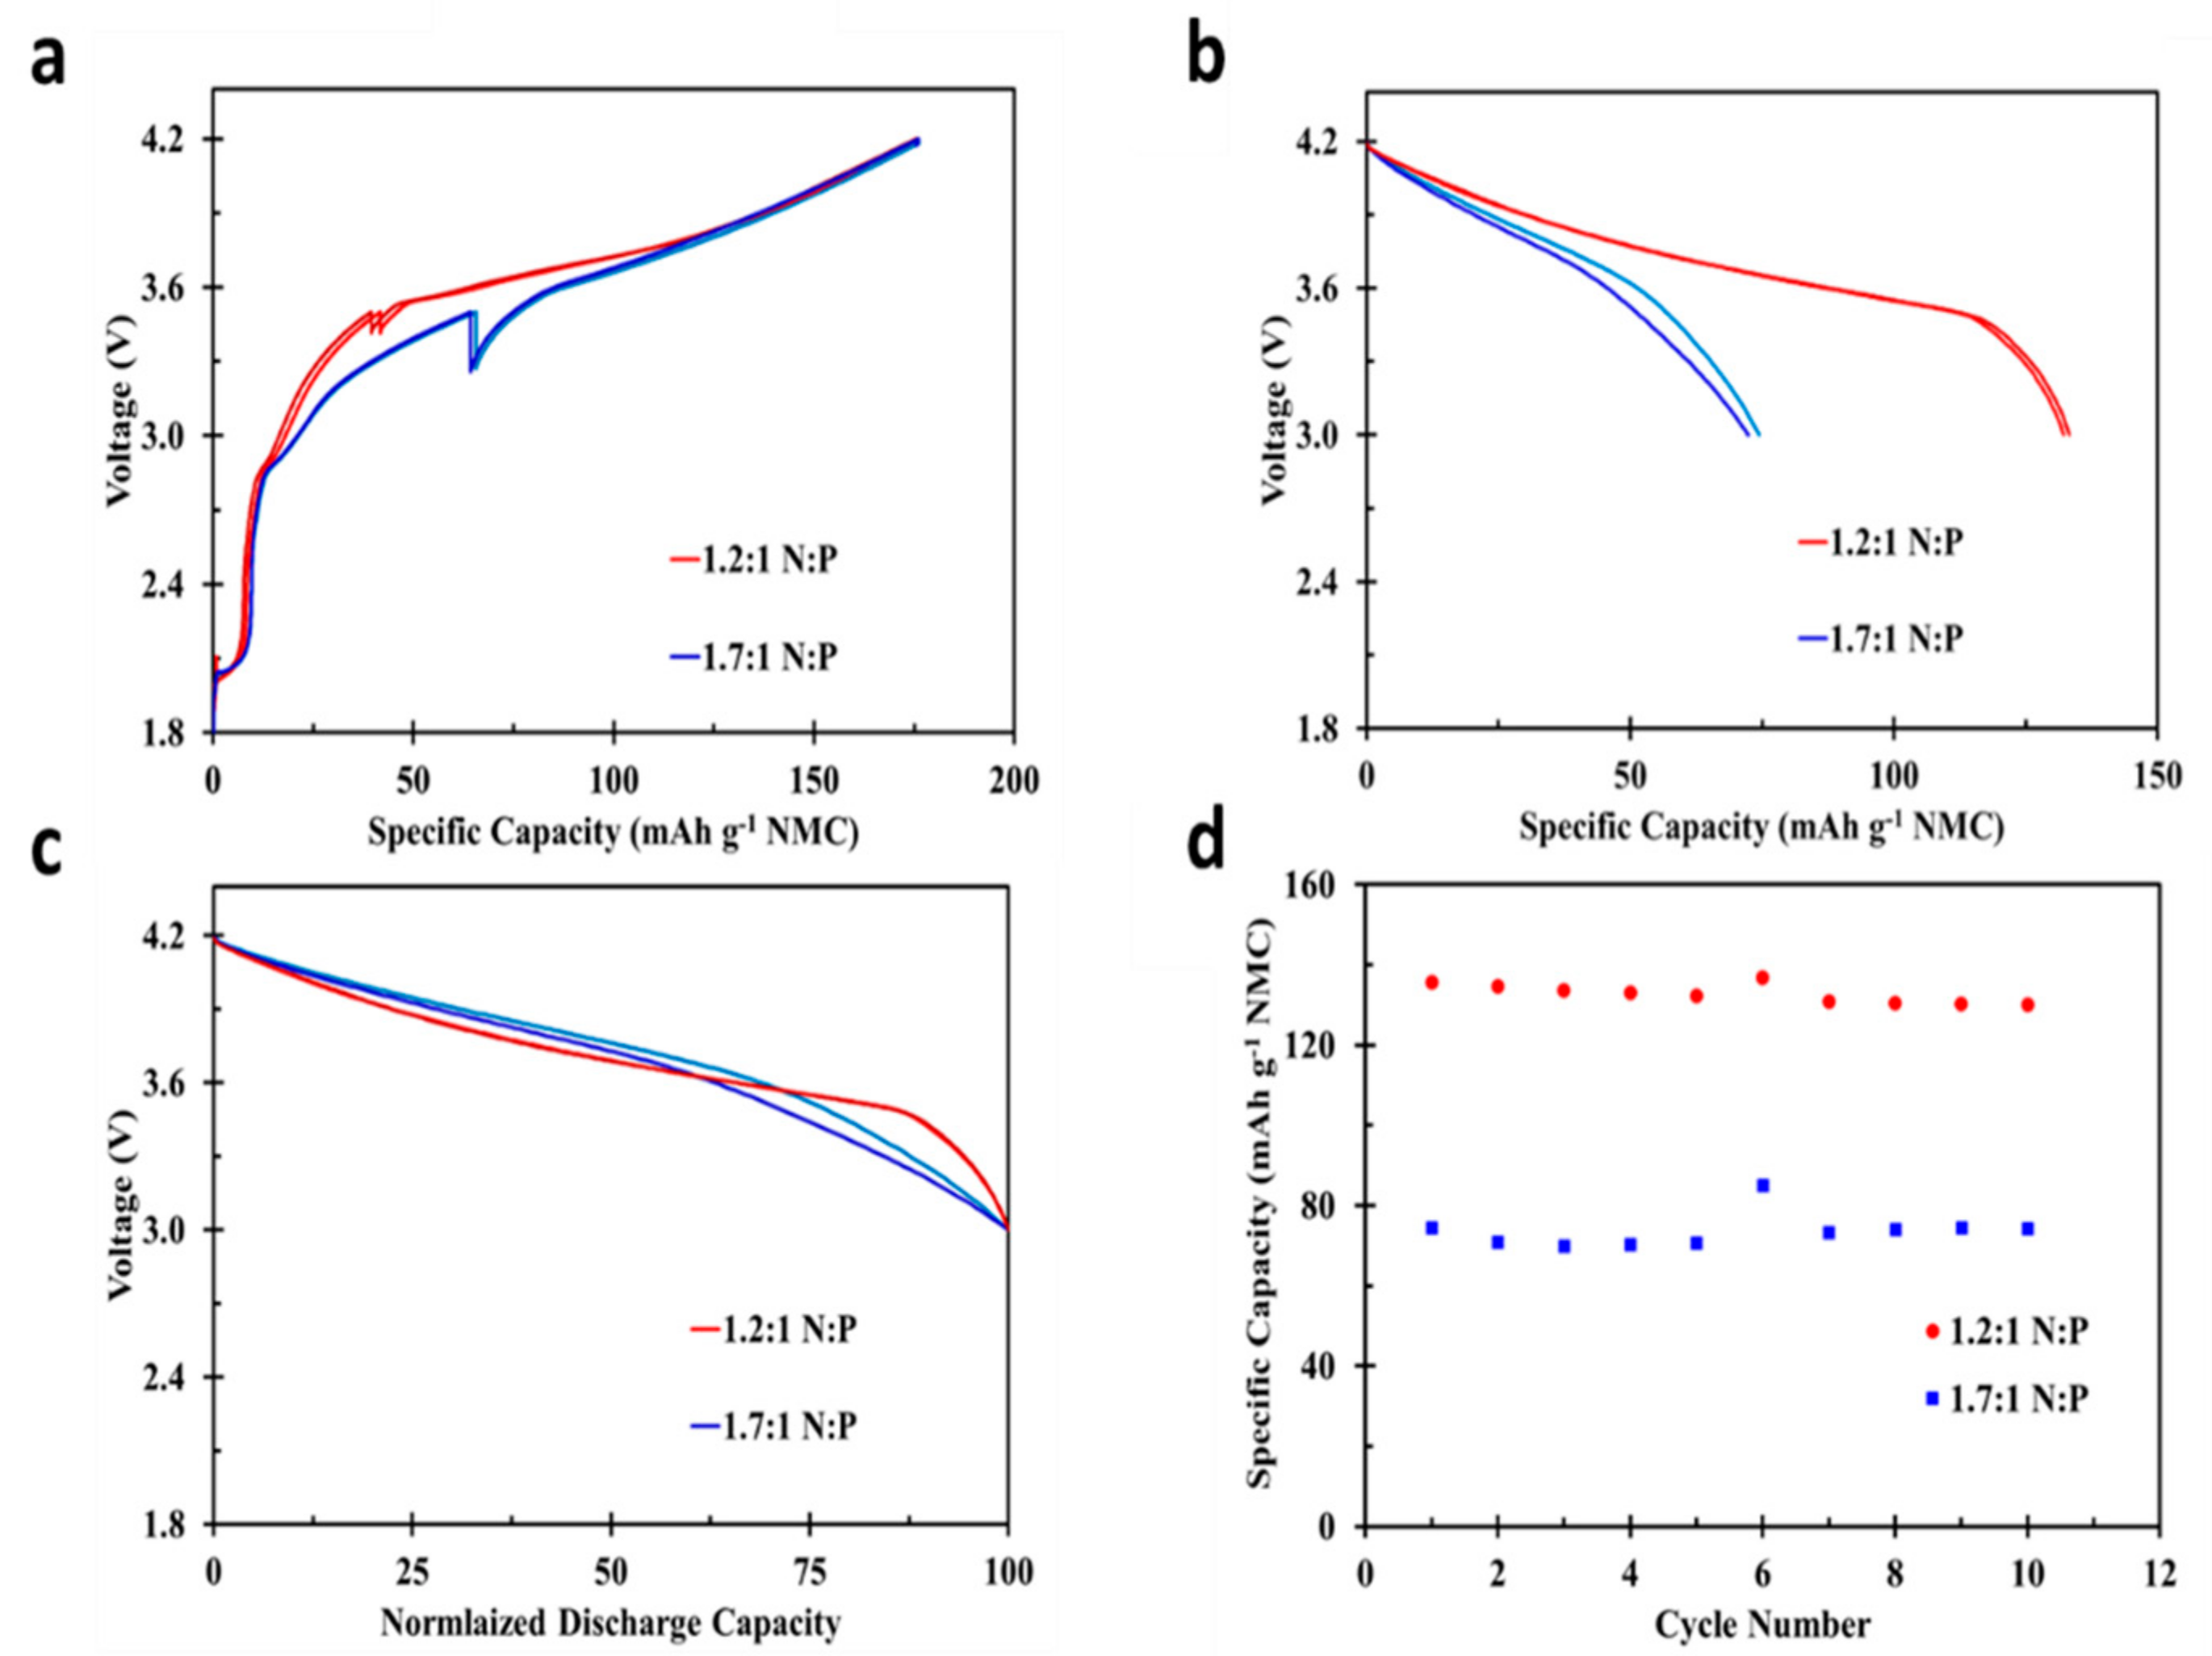
During actual full-cell performance and evaluation, cells with an increased N:P reversible capacity ratios show greatly reduced reversible capacity compared to cells with a N:P ratio closer to one. Figure 4a shows the first charge profile for duplicate cells of each 1.2:1 (red) and 1.7:1 (blue) reversible capacity ratios. Cells with a 1.2:1 N:P deliver the first charge capacity (FCC) of 175.8 mAh g−1 while cells with a 1.7:1 ratio deliver a capacity of 177.7 mAh g−1. This slight difference is expected as the cells with higher N:P ratio should deliver slightly higher first charge specific capacities. During cell charging to 4.2 V, the voltage difference between the positive and negative electrode as cells approach 100% SOC is 4.2 V. With cells containing a higher N:P ratio, the negative electrode is at a higher voltage vs. Li/Li+ for the same full-cell charge percentage, requiring the positive electrode to be at a higher voltage vs. Li/Li+ to reach a total cell voltage of 4.2 V. This results in a slightly higher NMC de-lithiation and first charge capacity [26]. The positive and negative voltage difference is also apparent from the location of the rest period during the first charge, shown in Figure 4a. The cell formation procedure involves a 10 h cell rest when a 3.5 V limit is reached, highlighted as a relaxation in cell voltage. For the cell group with the higher N:P ratio (1.7:1), this rest occurs at a higher positive electrode capacity or delithiation percentage. Again, occurring in part because at this higher N:P ratio the negative electrode is at a more positive voltage vs. Li/Li+, resulting in a higher overall positive capacity to the 3.5 V cutoff. This effect is also influenced by the increased percentage of lithium consumption contributing to solid electrolyte interphase (SEI) formation for cells with a higher N:P ratio. Figure 4b shows the first discharge capacity for cells with varying N:P ratio at a C/10 rate based on 150 mAh g−1 NMC, demonstrating 73.4 or 132.9 mAh g−1 NMC, or a 45% reduction in reversible capacity. 73.4 mAh g−1 NMC also represents a 51% reduction in cell design capacity displayed in Table 1. Although each N:P design ratio delivers similar first charge capacities (Figure 4a), the first discharge capacities are drastically different. This is due to the large offset in cell ICL between the two different cell designs. During half-cell evaluation, negative MCMB and NMC electrodes demonstrate an ICL loss of 46.1 mAh g−1 and 17.5 mAh g−1, respectively. Equating the cell design capacity ratios to 1.2:1 and 1.7:1 to active material mass ratios yields a grams of NMC to grams MCMB ratio of 1.67:1 and 1.18:1, respectively. This large variation in active materials mass results in the large difference in reversible capacity between the two cell designs. Pathways exist to greatly reduce high ICL for cell designs with an unconventionally high N:P ratio, such as pre-lithiation of negative electrode active materials. These processes would further support this research, again allowing for reduction in cell recharge times, without sacrificing cell reversible capacity. Figure 4c compares the cell voltage profiles to normalized discharge capacities between the two cell designs. The normalized discharge curves show little difference in voltage profile as a function of cell matching ratio, despite drastic reversible capacity differences. This small difference in voltage profile highlights that cells delivering the same reversible capacity would deliver nearly the same power when discharged at lower rates and become independent of matching ratio. Figure 4d shows the first ten cycles at C/5 charge and discharge rate with C/50 taper on charge. The sixth cycle shows the C/50 discharge capacity, again highlighting the impact of matching ratio on cell reversible capacity. As the cell matching ratio is a major driver in cell design and determining the offsets in irreversible capacity loss.
Following baseline cycling for the NMC/MCMB full-cells, an accelerated charging procedure was applied to the cells. Table 3 presents the procedure used during these accelerated charging cycles. Following ten cycles utilizing an accelerated charging procedure and C/5 discharge, five cycles were performed at a C/5 charge and discharge rate, for comparison to the baseline cycling. A voltage limit of 4.2 V was also set during the accelerated charging procedure to maintain safe cell operation. This means that if positive electrode polarization is too great during cell charging, the current will be reduced to the lower current of the next charging step prior to reaching the charging steps graphite lithiation target values.
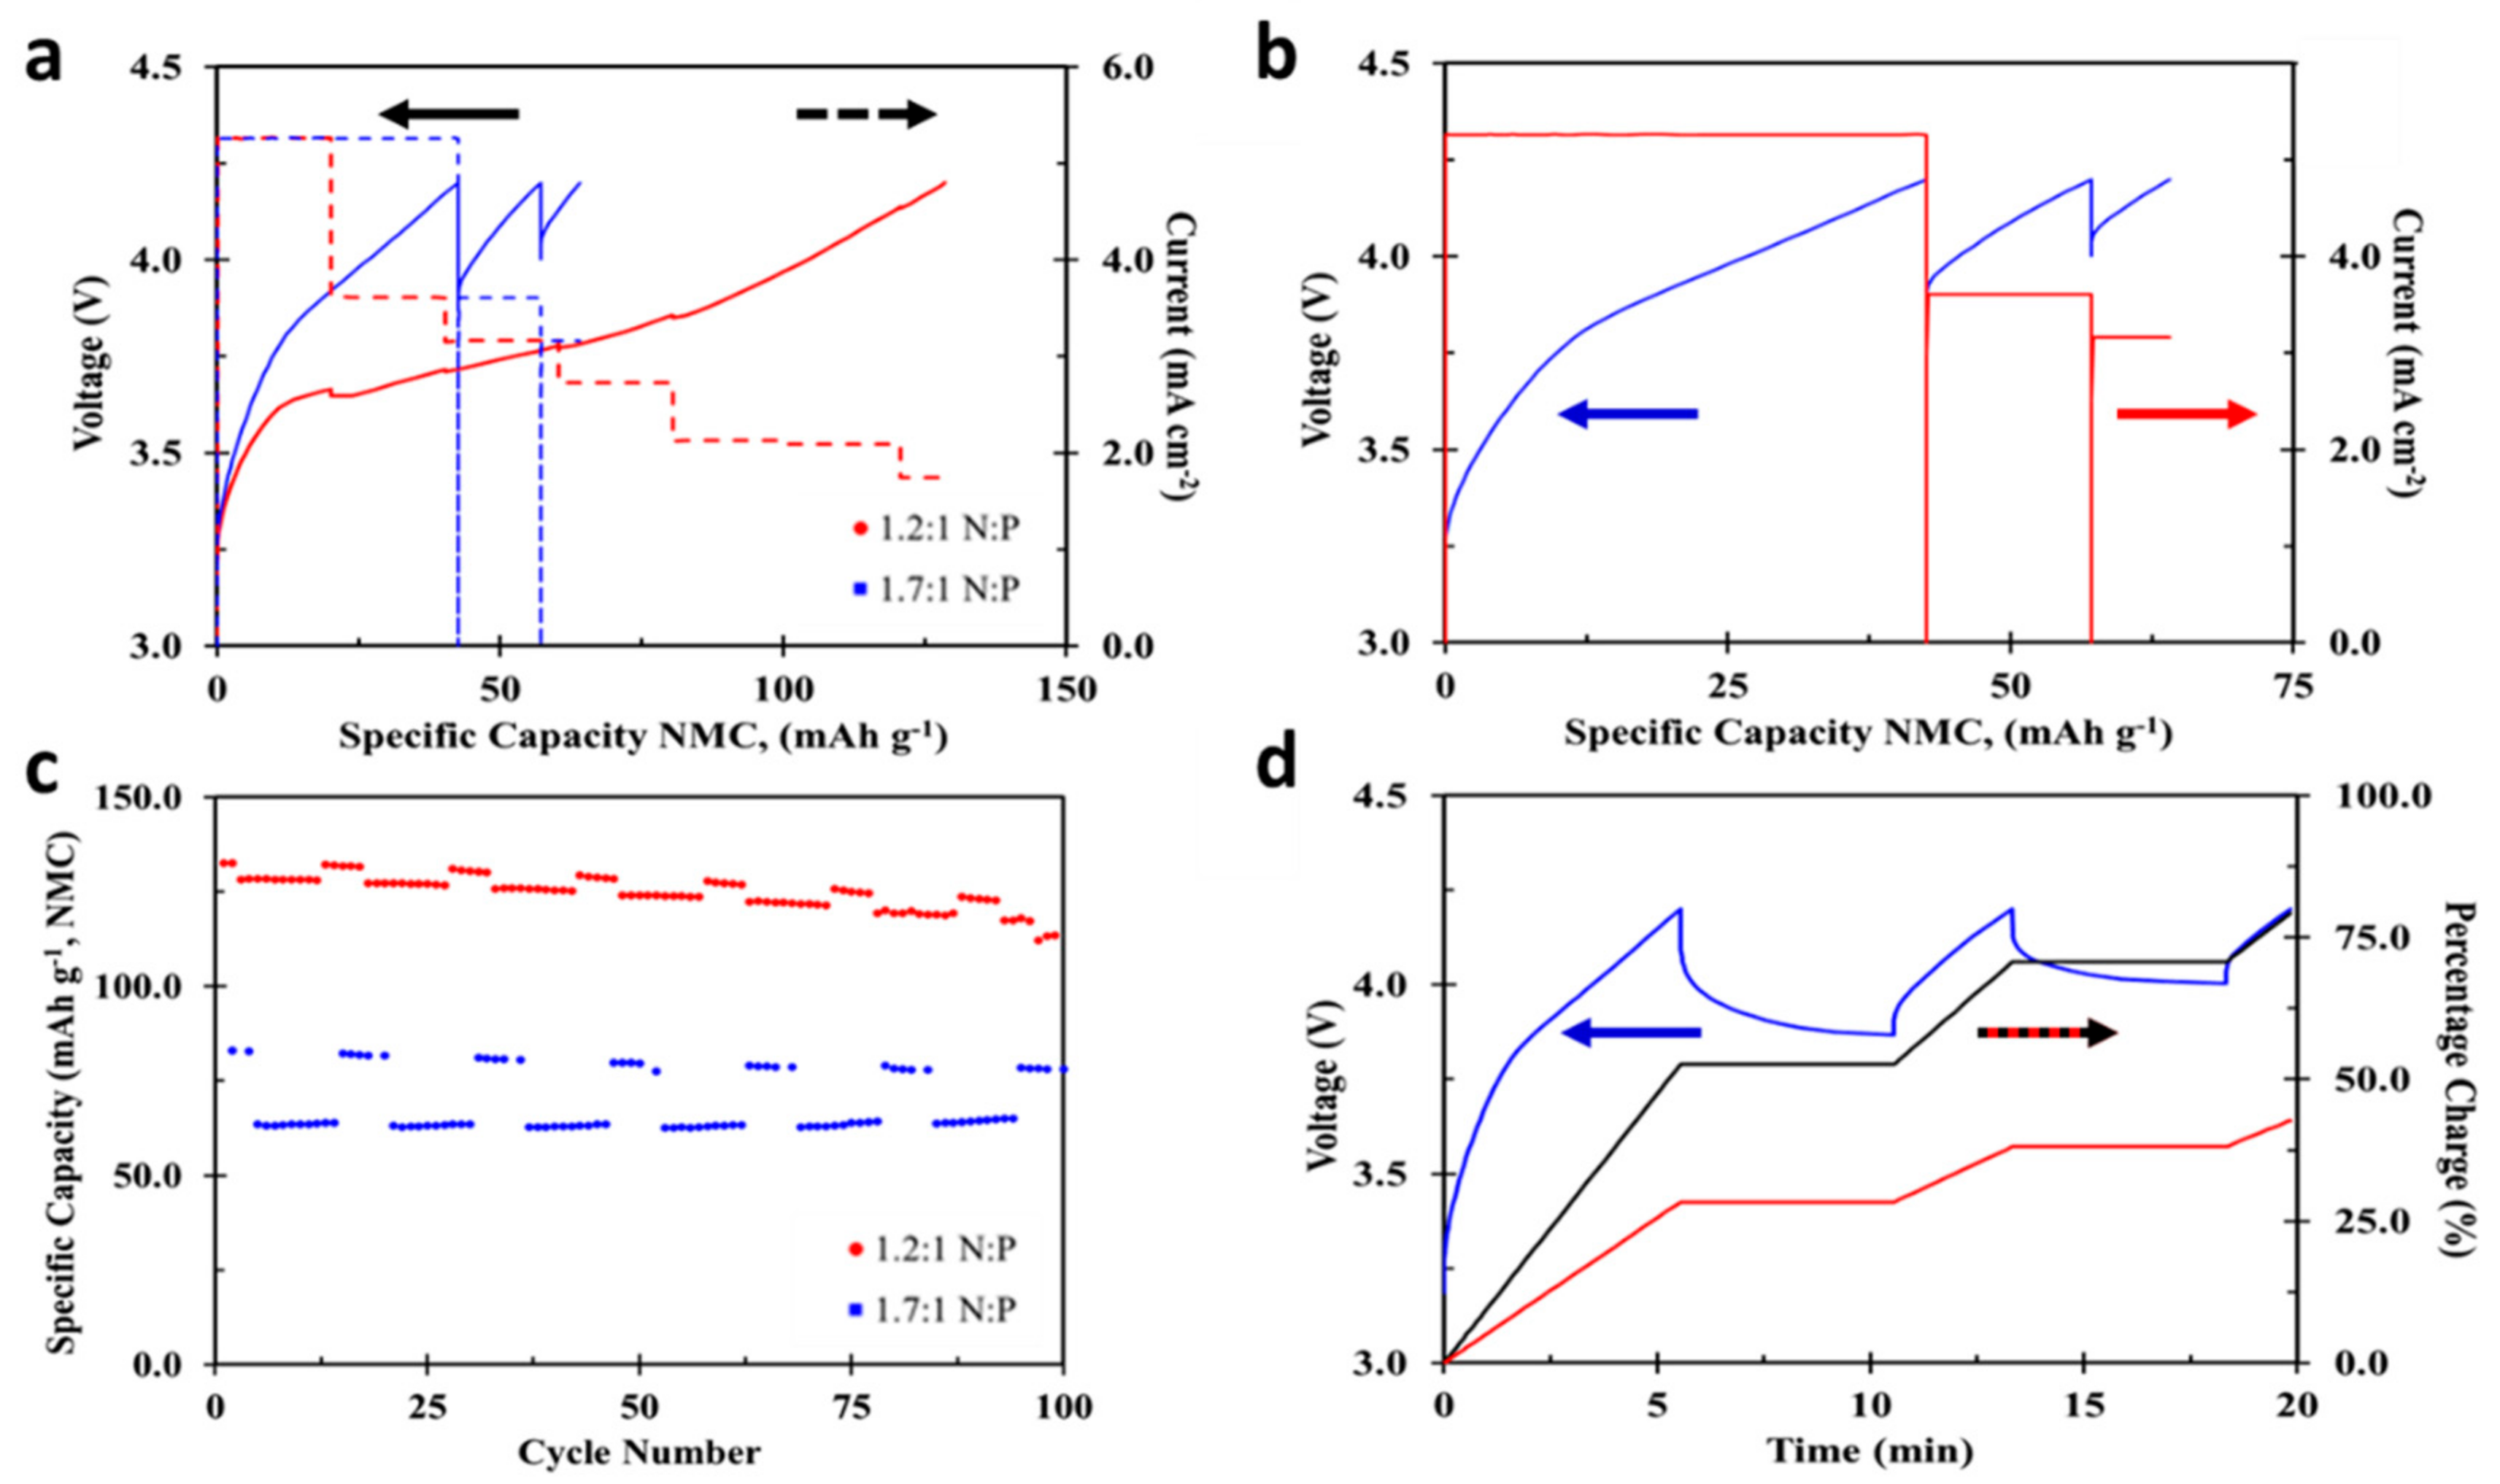
Applying the charging procedure presented in Table 3 to cells with 1.2:1 or 1.7:1 N:P ratios is shown in Figure 5a. This highlights that higher charging currents can be applied for a longer period of time when cells are constructed with a higher N:P ratio and currents are limited by negative electrode resistance (dash lines in Figure 5a). Both cycles shown in this figure have coulombic efficiency of approximately 99.9%. Similar to the findings from Table 2, Figure 5b demonstrates that although cells with a higher negative to positive ratio can be charged at a higher rate based of negative electrode lithiation rate, polarization of the positive electrode is still of concern. The charge procedure outlined in Table 3, contained five-minute rest periods if the maximum charge voltage, 4.2 V, was reached during the charging sequence, which did occur for the cell with a N:P ratio of 1.7:1. This is shown in Figure 5a,b,d, displayed as relaxation in cell voltage resulting from the large polarization which occurs in cells with a N:P of 1.7:1. The cycle life data for cells with both 1.2:1 and 1.7:1 N:P ratios are shown in Figure 5c. The lower discharge capacity cycles of each cell type correspond to the accelerated charging, while the slightly higher capacity cycles correspond to C/5 charges with C/50 taper on charge and C/5 discharge. As discussed earlier, the reversible capacity for cells with a higher N:P ratio show a lower capacity compared to cells with a more conventional N:P of 1.2:1. Taking into consideration the Coulombic efficiency and the fact that little to no capacity fade is observed over 100 cycles (Figure 5c), this observation provides further evidence of the effectiveness of this charge procedure and confidence that little to no lithium plating (or negligible negative impact) is occurring during the high rate cell charging, independent of negative to positive ratio. Figure 5d highlights the relationship between charging time and cell capacity for cells with a N:P of 1.7:1. The black and red lines in Figure 5d display the cell charge percentage based off reversible cell capacity and cell design capacity respectively. By applying the previously developed accelerated charging procedure to cells with a higher N:P ratio (1.7:1), these cells can be charged to 80% reversible capacity or 42% of design capacity in roughly twenty minutes. When accounting for the two 5-min open circuit rest periods the cells experience during charge, the total time when charging current is applied is 10 min while 5-min rests were chosen to allow adequate time for the cell voltage to relax but can be shortened. The amount of time this rest can be shortened would be a function of both cell state of charge and current change between two charging steps While cells with a more conventional N:P ratio (1.2:1) reach 80% state of charge in 34 min with no rest periods, or 32% SOC in 10 min based off cell reversible capacity [21]. Relating these charge percentages to the specific cell designs in Table 1 results in a ~16% increase in cell charge capacity when charging current is applied for ten-minutes for cells with an increased negative to positive capacity ratio.
4. Conclusions
With the goal of reducing negative electrode resistance to lithium ion intercalation, new and modified negative electrode materials continue to be developed. This work focuses on the design of cells that can be charged to higher states of charge in shorter periods of time. The presented work demonstrates the impact of cell design, particularly negative to positive matching ratio, on cell fast charge capability using conventional MCMB and NMC electrode materials, where loadings and electrode composition are comparable to those used in industry today. Using the accelerated charging procedure, we have demonstrated that cells with unconventionally high N:P ratios can be charged to higher capacities in a shorter period of time, although extremely high irreversible capacity losses are experienced, due to the increased lithium required to form the negative electrode SEI layer. Cell ICL can be minimized or possibly eliminated through the development of pre-lithiation techniques, which would allow cells with an increased N:P ratio to maintain higher reversible capacities. This study has shown that a 16% increase in charge capacity can be reached in a ten-minute charge time, by using an N:P ratio of 1.7:1 opposed to a more conventional 1.2:1 ratio, while maintaining little to no difference in cycle life performance.
Author Contributions
Conceptualization, W.Y. and W.T.; methodology, W.Y.; validation, N.L. and Y.F.; formal analysis, W.Y.; resources, V.B.; writing—original draft preparation, W.Y.; writing—review and editing, W.T. All authors have read and agreed to the published version of the manuscript.
Funding
This work has been partially funded by Penn State ETCE and Penn State Hazleton Research and Development Grants. Work at LBNL is funded by the Assistant Secretary for Energy Efficiency and Renewable Energy, Office of Vehicle Technologies of the U.S. Department of Energy under Contract No. DE-AC02-05CH11231.
Institutional Review Board Statement
Not applicable.
Informed Consent Statement
Not applicable.
Conflicts of Interest
The authors declare no conflict of interest.
References
- Lu, L.; Han, X.; Li, J.; Hua, J.; Ouyang, M. A review on the key issues for lithium-Ion battery management in electric vehicles. J. Power Sources 2013, 226, 272–288. [Google Scholar] [CrossRef]
- Ahmed, S.; Bloom, I.; Jansen, A.N.; Tanim, T.; Dufek, E.J.; Pesaran, A.; Burnham, A.; Carlson, R.B.; Dias, F.; Hardy, K.; et al. Enabling fast charging–A battery technology gap assessment. J. Power Sources 2017, 367, 250–262. [Google Scholar] [CrossRef]
- Zheng, Y.; Dong, Z.Y.; Xu, Y.; Meng, K.; Zhao, J.H.; Qiu, J. Electric Vehicle Battery Charging/Swap Stations in Distribution Systems: Comparison Study and Optimal Planning. IEEE Trans. Power Syst. 2014, 29, 221–229. [Google Scholar] [CrossRef]
- Wu, H.H.; Gilchrist, A.; Sealy, K.; Israelsen, P.; Muhs, J. A review on inductive charging for electric vehicles. In Proceedings of the 2011 IEEE International Electric Machines Drives Conference (IEMDC), Niagara Falls, ON, Canada, 15‒18 May 2011; pp. 143–147. [Google Scholar]
- Kim, N.; Chae, S.; Ma, J.; Ko, M.; Cho, J. Fast-Charging high-Energy lithium-Ion batteries via implantation of amorphous silicon nanolayer in edge-Plane activated graphite anodes. Nat. Commun. 2017, 8, 812. [Google Scholar] [CrossRef] [PubMed] [Green Version]
- Anseán, D.; Dubarry, M.; Devie, A.; Liaw, B.Y.; García, V.M.; Viera, J.C.; González, M. Fast charging technique for high power LiFePO 4 batteries: A mechanistic analysis of aging. J. Power Sources 2016, 321, 201–209. [Google Scholar] [CrossRef]
- Park, C.-K.; Zhang, Z.; Xu, Z.; Kakirde, A.; Kang, K.; Chai, C.; Au, G.; Cristo, L. Variables study for the fast charging lithium ion batteries. J. Power Sources 2007, 165, 892–896. [Google Scholar] [CrossRef]
- Buqa, H.; Goers, D.; Holzapfel, M.; Spahr, M.E.; Novák, P. High Rate Capability of Graphite Negative Electrodes for Lithium-Ion Batteries. J. Electrochem. Soc. 2005, 152, A474–A481. [Google Scholar] [CrossRef]
- Takami, N.; Satoh, A.; Hara, M.; Ohsaki, T. Rechargeable Lithium-Ion Cells Using Graphitized Mesophase-Pitch-Based Carbon Fiber Anodes. J. Electrochem. Soc. 1995, 142, 2564–2571. [Google Scholar] [CrossRef]
- Besenhard, J.O.; Winter, M.; Yang, J.; Biberacher, W. Filming mechanism of lithium-Carbon anodes in organic and inorganic electrolytes. J. Power Sources 1995, 54, 228–231. [Google Scholar] [CrossRef]
- de Jongh, P.E.; Notten, P.H.L. Effect of current pulses on lithium intercalation batteries. Solid State Ionics 2002, 148, 259–268. [Google Scholar] [CrossRef]
- Avery, N.R.; Black, K.J. Kinetic analysis of capacity fade in lithium/coke half-Cells. J. Power Sources 1997, 68, 191–194. [Google Scholar] [CrossRef]
- Arora, P.; White, R.E.; Doyle, M. Capacity fade mechanisms and side reactions in lithium-ion batteries. J. Electrochem. Soc. 1998, 145, 3647–3667. [Google Scholar] [CrossRef] [Green Version]
- Broussely, M.; Herreyre, S.; Biensan, P.; Kasztejna, P.; Nechev, K.; Staniewicz, R.J. Aging mechanism in Li ion cells and calendar life predictions. J. Power Sources 2001, 97–98, 13–21. [Google Scholar] [CrossRef]
- Bugga, R.V.; Smart, M.C. Lithium Plating Behavior in Lithium-Ion Cells. ECS Trans. 2010, 25, 241–252. [Google Scholar] [CrossRef]
- Uhlmann, C.; Illig, J.; Ender, M.; Schuster, R.; Ivers-Tiffée, E. In situ detection of lithium metal plating on graphite in experimental cells. J. Power Sources 2015, 279, 428–438. [Google Scholar] [CrossRef]
- Anseán, D.; García, V.M.G.; González, M.; Viera, J.C.; Antón, J.C.Á.; Blanco, C.D. Efficient fast-Charging strategies for Li-Ion batteries. In Proceedings of the Efficient Fast-Charging Strategies for Li-Ion Batteries, Goyang, Korea, 3‒6 May 2015. [Google Scholar]
- Libich, J.; Sedlarikova, M.; Vondrák, J.; Máca, J.; Čudek, P.; Fíbek, M.; Chekannikov, A.; Artner, W.; Fafilek, G. Performance of Graphite Negative Electrode in Lithium-Ion Battery Depending upon the Electrode Thickness. ECS Trans. 2018, 87, 3–13. [Google Scholar] [CrossRef]
- Yang, X.-G.; Zhang, G.; Ge, S.; Wang, C.-Y. Fast charging of lithium-Ion batteries at all temperatures. Proc. Natl. Acad. Sci. USA 2018, 115, 7266–7271. [Google Scholar] [CrossRef] [Green Version]
- Amietszajew, T.; McTurk, E.; Fleming, J.; Bhagat, R. Understanding the limits of rapid charging using instrumented commercial 18650 high-energy Li-Ion cells. Electrochimica Acta 2018, 263, 346–352. [Google Scholar] [CrossRef]
- Yourey, W.; Fu, Y.; Li, N.; Battaglia, V.; Tong, W. Determining Accelerated Charging Procedure from Half Cell Characterization. J. Electrochem. Soc. 2019, 166, A1432–A1438. [Google Scholar] [CrossRef]
- Xue, R.; Huang, H.; Li, G.; Chen, L. Effect of cathodeanode mass ratio in lithium-Ion secondary cells. J. Power Sources 1995, 55, 111–114. [Google Scholar] [CrossRef]
- Wu, H.M.; Belharouak, I.; Deng, H.; Abouimrane, A.; Sun, Y.-K.; Amine, K. Development of LiNi[sub 0.5]Mn[sub 1.5]O[sub 4]/Li[sub 4]Ti[sub 5]O[sub 12] System with Long Cycle Life. J. Electrochem. Soc. 2009, 156, A1047. [Google Scholar] [CrossRef]
- Srinivasan, V.; Newman, J. Design and optimization of a natural graphite/iron phosphate lithium-ion cell. J. Electrochem. Soc. 2004, 151, A1530–A1538. [Google Scholar] [CrossRef] [Green Version]
- Son, B.; Ryou, M.-H.; Choi, J.; Kim, S.-H.; Ko, J.M.; Lee, Y.M. Effect of cathode/anode area ratio on electrochemical performance of lithium-ion batteries. J. Power Sources 2013, 243, 641–647. [Google Scholar] [CrossRef]
- Kim, C.S.; Jeong, K.M.; Kim, K.; Yi, C.W. Effects of capacity ratios between anode and cathode on electrochemical properties for lithium polymer batteries. Electrochimica Acta 2015, 155, 431–436. [Google Scholar] [CrossRef]
Figure 1.
(a) Voltage profiles for MCMB half-cell at various lithiation rates from C/25 to 3C. (b) Resulting resistance calculated from polarization in (a). (c) Graphite half-cell voltage profiles of C/5 and accelerated lithiation. Shown is the reduction in graphite lithiation time compared to C/5 current resulting from applying accelerated lithiation protocol. (d) Full lithium ion cell with 1.2:1 N:P current and voltage profiles for C/5 and accelerated charge rates. Reproduced with permission from J. Electrochem. Soc., 166 (8) A1432-A1438 (2019).

Figure 2.
(a) Positive half-cell mean rate performance with range bars for NMC electrodes with 2.41 and 1.69 mAh cm−2 areal capacity loading and (b) voltage profiles for positive half-cells at C/25 and 2C rates.
Figure 2.
(a) Positive half-cell mean rate performance with range bars for NMC electrodes with 2.41 and 1.69 mAh cm−2 areal capacity loading and (b) voltage profiles for positive half-cells at C/25 and 2C rates.

Figure 3.
(a) Corresponding lithiation time (blue) to 80% SOC, or 67% and 47% graphite utilization for cells with either a 1.2:1 (green) or 1.7:1 (red) negative to positive reversible capacity ratio and (b) accelerated graphite electrode lithiation procedure, showing current (red) and associated half-cell voltage profile (black).

Figure 4.
(a) The first charge capacity and (b) discharge voltage profiles for NMC/MCMB cells with 1.2:1 and 1.7:1 N:P capacity ratio, (c) normalized discharge voltage profiles and (d) cycling results for cells with varied N:P ratios.
Figure 4.
(a) The first charge capacity and (b) discharge voltage profiles for NMC/MCMB cells with 1.2:1 and 1.7:1 N:P capacity ratio, (c) normalized discharge voltage profiles and (d) cycling results for cells with varied N:P ratios.

Figure 5.
(a) Comparison of accelerated charge profile for cells with 1.2:1 and 1.7:1 N:P, (b) enlarged accelerated charge profile shown for cell with 1.7:1 N:P, (c) cycle life comparison of the first 100 cycles utilizing charge procedure, where high currents are applied based on negative electrode lithiation percentage, and (d) charge percentage and voltage profile for cells with 1.7:1 N:P, with percentage charge shown both based on cell reversible capacity and theoretical cell capacity based on 150 mAh g−1 NMC.


Table 1.
Summary of cell designs used for fast charging evaluation. Cell thickness and electrode pair numbers were targeting a cell with a thickness of ~5 mm. Capacities based on 150 mAh g−1 NMC.
Table 1.
Summary of cell designs used for fast charging evaluation. Cell thickness and electrode pair numbers were targeting a cell with a thickness of ~5 mm. Capacities based on 150 mAh g−1 NMC.
| Positive Electrode Loading (mg cm−2) | Negative Electrode Loading (mg cm−2) | Cell (N:P) Reversible Capacity Ratio | Cell Design Capacity (Ah) | Cell Thickness (mm) | Voltage Range (V) | Cell Energy (Wh) (Nominal Voltage, V) | Electrode Pairs | |
|---|---|---|---|---|---|---|---|---|
| 1 | 17.4 | 11.0 | 1.2 | 2.31 | 5.12 | 4.20–3.00 | 8.54 (3.70) | 11 |
| 2 | 17.4 | 11.0 | 1.2 | 2.31 | 5.12 | 4.20–3.70 | 4.56 (3.95) | 11 |
| 3 | 17.4 | 11.0 | 1.2 | 2.31 | 5.12 | 3.70–3.00 | 3.86 (3.35) | 11 |
| 4 | 12.4 | 11.0 | 1.7 | 1.80 | 5.03 | 4.20–3.00 | 6.66 (3.70) | 13 |
Table 2.
Equivalent area positive electrode rate observed for charging sequence based off graphite lithiation limits. C-rates are determined based off 150 mAh g−1 and 300 mAh g−1 for NMC and MBMC, respectively.
Table 2.
Equivalent area positive electrode rate observed for charging sequence based off graphite lithiation limits. C-rates are determined based off 150 mAh g−1 and 300 mAh g−1 for NMC and MBMC, respectively.
| Negative Electrode Lithiation Rate | |||||
|---|---|---|---|---|---|
| Cell N:P | C/10 | C/5 | C/2 | 1C | 2C |
| 1.2:1 | ~C/8 | ~C/4 | ~C/1.7 | ~1.2C | ~2.4C |
| 1.7:1 | ~C/6 | ~C/3 | ~C/1.2 | ~1.7C | ~3.4C |
Table 3.
Accelerated charging procedure applied to full NMC/MCMB cells, demonstrating the relationship between the percentage MCMB lithiation and full-cell charge percentage. The data shown are based off 300 mAh g−1 and 150 mAh g−1 for MCMB and NMC, respectively. C-rates shown represent the charging rate to reach each state of charge.
| Step | Current (mAh cm−2) | Negative % Lithiation | 1.2:1 (N:P) % Charge | 1.7:1 (N:P) % Charge |
|---|---|---|---|---|
| 1 | 5.26 | 10% | 12% (2.2C) | 17% (3.1C) |
| 2 | 3.61 | 20% | 24% (1.5C) | 34% (2.1C) |
| 3 | 3.16 | 30% | 36% (1.3C) | 51% (1.9C) |
| 4 | 2.73 | 40% | 48% (1.1C) | 68% (1.6C) |
| 5 | 2.13 | 50% | 61% (0.9C) | >80% SOC (1.3C) |
| 6 | 2.09 | 60% | 73% (0.9C) | |
| 7 | 1.75 | 70% | >80% SOC (0.7C) |
Publisher’s Note: MDPI stays neutral with regard to jurisdictional claims in published maps and institutional affiliations. |
© 2021 by the authors. Licensee MDPI, Basel, Switzerland. This article is an open access article distributed under the terms and conditions of the Creative Commons Attribution (CC BY) license (http://creativecommons.org/licenses/by/4.0/).
Share and Cite
MDPI and ACS Style
Yourey, W.; Fu, Y.; Li, N.; Battaglia, V.; Tong, W. Design Considerations for Fast Charging Lithium Ion Cells for NMC/MCMB Electrode Pairs. Batteries 2021, 7, 4. https://0-doi-org.brum.beds.ac.uk/10.3390/batteries7010004
AMA Style
Yourey W, Fu Y, Li N, Battaglia V, Tong W. Design Considerations for Fast Charging Lithium Ion Cells for NMC/MCMB Electrode Pairs. Batteries. 2021; 7(1):4. https://0-doi-org.brum.beds.ac.uk/10.3390/batteries7010004
Chicago/Turabian StyleYourey, William, Yanbao Fu, Ning Li, Vincent Battaglia, and Wei Tong. 2021. "Design Considerations for Fast Charging Lithium Ion Cells for NMC/MCMB Electrode Pairs" Batteries 7, no. 1: 4. https://0-doi-org.brum.beds.ac.uk/10.3390/batteries7010004
Note that from the first issue of 2016, this journal uses article numbers instead of page numbers. See further details here.