
Influence of Aging on the Failing Behavior of Automotive Lithium-Ion Batteries


Virtual Vehicle Research GmbH, Inffeldgasse 21a, 8010 Graz, Austria
*
Author to whom correspondence should be addressed.
Batteries 2021, 7(2), 23; https://0-doi-org.brum.beds.ac.uk/10.3390/batteries7020023
Submission received: 16 February 2021
/
Revised: 9 March 2021
/
Accepted: 31 March 2021
/
Published: 7 April 2021
Abstract
:Lithium-ion batteries (LIBs) are a dominant state-of-the-art energy storage system and have importance in the automotive sector. Still, LIBs suffer from aging effects and serious hazards from failing batteries are possible. These failures can lead to exothermic chemical reactions inside the cell, ending up in thermal runaway (TR). TR has caused most electric vehicle (EV) fires. Since statistically most accidents with EVs happen after about one year of vehicle usage, in particular, the failing behavior of aged cells needs to be investigated. Little information is available in open literature about the influence of aging paths on the failing behavior and especially on the degassing behavior of large automotive LIBs. Therefore, this study investigates the influence of three different aging paths (cyclic at −10 °C and at 45 °C and calendric at 60 °C) on the thermal behavior, the vent gas emission, and the vent gas composition. The results show a clear effect of aging on the failing behavior. The aged cells showed a less violent failing reaction, reduced maximal temperatures, lower amount of produced gas, significantly lower amount of CO in the vent gas, and lower mass loss than fresh cells in the same overtemperature experiments. The results are valuable for the scientific and industrial community dealing with LIBs.
1. Introduction
Lithium-ion batteries (LIB), initially commercialized by Sony in 1991, are a dominant state-of-the-art energy storage system [1,2], and are still the most promising candidates for storing electrical energy [3,4]. LIB technology provides the best mix of key battery performance metric such as high specific energy, high energy density, high power density, long lifetime, costs, and safety [1], which currently cannot be achieved with any other available technology. Therefore, this technology is attractive for portable electronic devices, consumer electronics and the automotive industry. Especially for electric vehicles (EV) like full battery electric vehicles (BEV), hybrid electric vehicles (HEV), and plug-in hybrid vehicles (PHEV), for which, LIB technology is currently used. The market of BEVs, HEVs, and PHEVs has increased, especially in China, the U.S., and the EU [5,6]. Forecasts show a significant importance of EVs in the future transport sector. Still there are challenging requirements for LIBs in the automotive sector such as costs, fast charging, aging, increasing energy density, and safety [7].
There are serious hazards resulting from failing battery cells leading to exothermic chemical reactions inside the cell. The worst case is the uncontrollable exothermic chemical reaction—the thermal runaway (TR) [7]. TR has caused most EV fires [8] and is a self-accelerating exothermic chemical reaction inside the cell, which can be started by a hot spot produced inside the cell (e.g., particle short circuit) or by a heat source outside the cell (e.g., electrical failure) [9,10,11,12]. These possible defects inside or outside the cell causing exothermic reactions challenge the safety for LIB applications. During TR, extensive amounts of heat, toxic and flammable gas and hot particles are generated with critical consequences like fire, explosion, and toxic atmosphere [7,11,13].
Although current statistics indicate that fewer vehicle fires per one billion kilometers driven occur for EVs than for vehicles with internal combustion engines [14,15,16], safety concerns about this high energy storage system are present and fire incidents of EVs have attracted media attention [8,17]. Thus, a detailed analysis of possible failures and of TR behavior need to be investigated in detail in order to minimize the risks from failing LIB and to increase safety.
1.1. Battery Aging
LIBs suffer from degradation of the cell components, so called aging of the cells. Several researchers studied the capacity fading and consequently the aging of different LIB chemistries. The cell capacity in general is strongly influenced by the amount of mobile lithium (Li) (transferable Li between anode and cathode) and the capacity of the cathode and anode to take up this mobile Li. If parts of this mobile Li are demobilized or the active material is limited to take up Li, the capacity fades irreversibly.
- Formation and growth of the cathode electrolyte interface (CEI) on the cathode: active Li is irreversibly demobilized [20].
- Consumption and decomposition of the electrolyte (also part of SEI growth), gas formation due to electrolyte decomposition [22].
- Transition metal dissolution of the cathode [23].
- Decomposition of the binder and/or conductive agent [19].
- Limited Li absorption capacity of an electrode. Li gets lost on the other electrode (for instance unavailable Li in the anode) [19].
- Gas formation due to impurities in the cathode material [24].
This degradation mechanism leads to two main degradation modes: loss of mobile Li inventory (LLI) and loss of active material (LAM) at the anode and at the cathode [27]. Consequences of LLI and LAM are capacity fade and power fade. According to Broussely et al., the most critical part of the cell is the interface between the negative electrode (anode) and the electrolyte [24]. They stated that a good choice of materials stabilizes the negative electrode and then the reactivity of the positive electrode defines the battery aging mechanisms. Aging of current state-of-the-art LIBs during operation is inevitable, the capacity decreases and the resistance of the cell grows [28].
1.2. Battery Thermal Runaway Analysis
To understand the LIB failing behavior and to prevent failures and their consequences, different LIB safety tests, also called abuse tests, were developed. Thermal, electrical, and mechanical abuse scenarios attempt to mimic the behavior of the failing battery in real applications [29,30] and to investigate the failing behavior.
Different cell types and different chemistries were analyzed [31,32,33,34] and single hazard categories from mainly fresh small cells (<5 Ah) were studied [33,34,35,36]. The battery failing behavior is influenced by several factors [7]. In addition to the capacity and energy density [37,38,39], there is cell chemistry [9,40], electrolytes and additives [41,42], the state-of-charge (SOC) [36,43,44,45], the TR trigger [9,35], the cell type [32], and another essential factor is the state-of-health (SOH)/aging history [20,46].
The influencing factor SOH includes capacity and power fading, but also the aging history and aging mechanisms play an important role. Researchers reported that the exact aging mechanisms and degradation modes highly depend on the used materials [24,47].
The changes in TR behavior of aged cells strongly depend on aging paths and aging mechanism.
Ren et al. stated at the investigation of aging effects on the TR behavior, that the thermal stability of the anode and electrolyte exhibited obvious changes, whereas for the cathode, the thermal stability remained unchanged during cyclic and storage aging [20]. Zhang et al. observed improved thermal safety for LiMn2O4 (LMO) cells after calendric aging at 55 °C, 100% SOC: self-heating and the TR started at higher temperatures, and the exothermal rate during the TR decreased [48]. They compared characteristic temperatures at which the self-heating started and the open circuit voltage (OCV) dropped. Röder et al. investigated the correlation between calendric aging at 60 °C and the thermal safety of LIBs [49]. They found that the SEI and the cathode material influence the safety of the cells after aging. Röder et al. observed reduced onset temperature and reduced energy release of aged cells and explained the results in the following way: less intercalated Li is in the anode and therefore less Li can react with the electrolyte. Fleischhammer et al. conducted high rate cyclic aging at low temperature and investigated the influence of aged and unaged LMO/NMC blend cells using accelerated rate calorimetry (ARC) [50]. They observed a strong correlation between the aging mechanisms and battery safety. Cycling with low temperature leads to an increase in heat generation and reduced safety, whereas the cells cycled with high rates showed only a slight change in the safety behavior compared to fresh cells. The main effect was observed in the self-heating rate of high rate cycled cells.
Also, Feng et al. found a worse thermal stability of cells cycled at low temperature in comparison to fresh cells and cells treated by high temperature [28]. They observed that cells aged at high temperature showed an improved thermal stability. In contrast, if Li deposits on the surface of the anode (e.g., during low temperature cycling), the thermal stability became worse. The improvement of thermal stability after high temperature exposure can be explained by growth of the SEI and demobilized Li. For low temperature, cycling Li deposited outside the original SEI and enabled reaction between the Li and the electrolyte. The reactivity of the anode was increased and consequently the onset temperature of self-heating decreased.
Li plating was investigated by Li et al. and they stated that the reaction between the plated Li and the electrolyte was the triggering factor of TR [47]. They compared characteristic temperatures from aged cells with partial cells and observed an exothermic reaction peak at low temperatures at fast charging when the plated Li consumed electrolyte.
According to the literature, the worst case for TR of aged cells was observable if Li plating at the anode happened during aging [28,50]. Consequently, the surface at the anode plays a significant role concerning safety of LIBs.
Several researchers investigated the influence of aging paths on the thermal stability of the cells, but how do the mentioned degradation paths influence the degassing behavior in failing state? Is there an influence of the aging paths on the amount of produced gases or the gas composition?
This study analyzes the influence of three different aging paths on the failing behavior in detail and discusses the results in three main categories: thermal behavior at TR, vent gas emission at TR, and vent gas composition at TR.
Due to the high safety relevance of investigations on LIBs currently used in modern EVs, the main questions focus on currently used automotive cell chemistry, especially the NMC—graphite chemistry with a combination of linear and cyclic electrolyte solvents and LiPF6 as conducting salt are used in modern EVs. Consequently, this cell chemistry was analyzed in detail in this study.
2. Methods and Measurement Technology
Single fresh and aged pouch cells (of cell type #1, Table 1) were tested inside the custom-made TR reactor using overtemperature TR trigger.
The investigated pouch cell consists of a NMC cathode (proportion of Ni, Mn, and Co (622)) and a graphite anode. All tested cells were charged to 100% SOC before the experiments. The presented cell type was designed for EV applications and is used in currently available commercial EVs. The same cell type was used for the comparison of three different TR triggers on two different cell types [13], and consequently the same nomenclature “cell type #1” was chosen.
Cell type #1 was tested in unused fresh state and after three different aging paths (cyclic aging at −10 °C (cy−10) and at 45 °C (cy+45) and high temperature calendric aging at 60 °C (ca60)). The design of the aging experiment and the experiments itself were provided by a partner institution. The key aging parameters are described in Table 2. After the end of the aging experiment, the cells were shipped to our institution and stored at room temperature for another five months before the experiment inside the TR reactor.
During the aging experiments, the cells were under compression inside sample holders comparable to the mechanical tension inside the battery pack. The parameter SOH in Table 2 represents the SOH immediately before the TR experiment. The SOH was determined by dividing the measured capacity (calculated with coulomb counting according to the voltage limits given in the data sheets) by the nominal capacity and is expressed as a percentage.
The TR experiments were carried out inside a gastight 40-bar pressure-resistant stainless-steel reactor, which is described in [7,31,51]. The advantages of this testing method are that the tests can be carried out in a controlled manner and safety-relevant parameters such as thermal behavior, vent gas emission, and gas composition can be determined and compared from one cell to the other. The single fresh and aged cells were experimentally tested with an overtemperature trigger. The design of the TR experiment is shown in Figure 1. Each cell was charged to 100% SOC before the experiment.
For this investigation, exactly the same experimental methods for overtemperature trigger and the same analysis of safety relevant parameters were used as described in [13]. For each experiment, three hazard categories are discussed: thermal behavior, vent gas production, and vent gas composition.
3. Results and Discussion
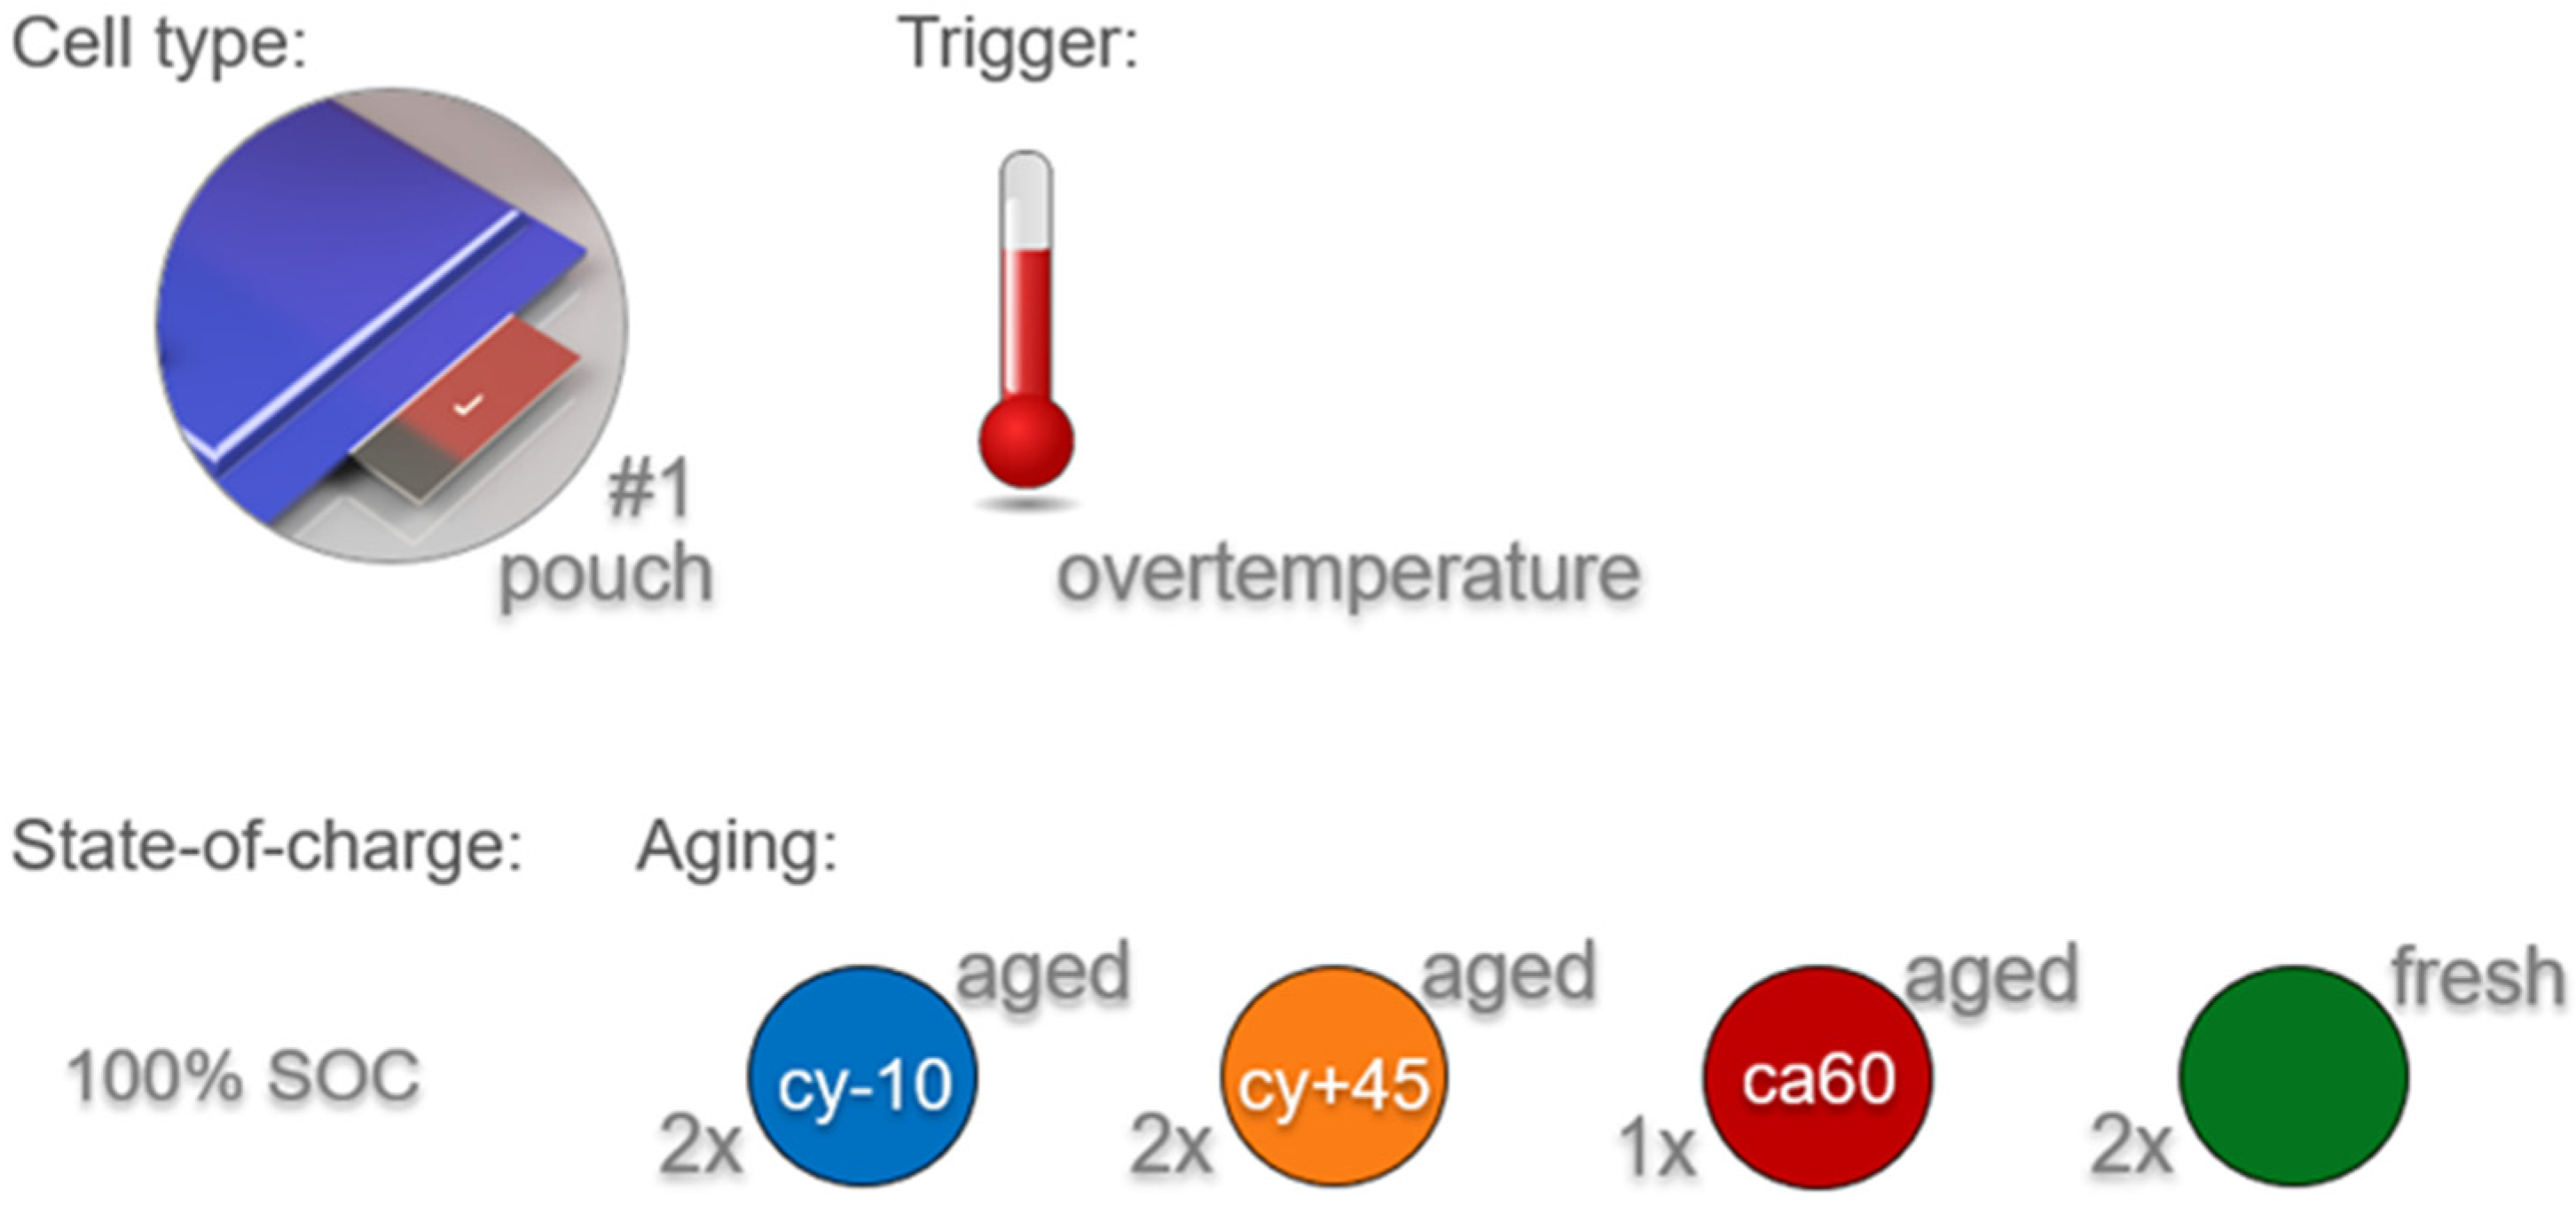
Five overtemperature experiments were conducted on single aged type #1 cells and two on single fresh type #1 cells (see Figure 2). Cells with three different aging paths (cyclic aging at −10 °C (cy−10) and at +45 °C (cy+45) and calendric aging at 60 °C (ca60)) were tested and compared with the results of fresh cells. Each experiment was repeated, except the experiment with the calendric aged cell (ca60), because there was only one cell available. All experiments were conducted using fully charged cells inside the same overtemperature test setup.
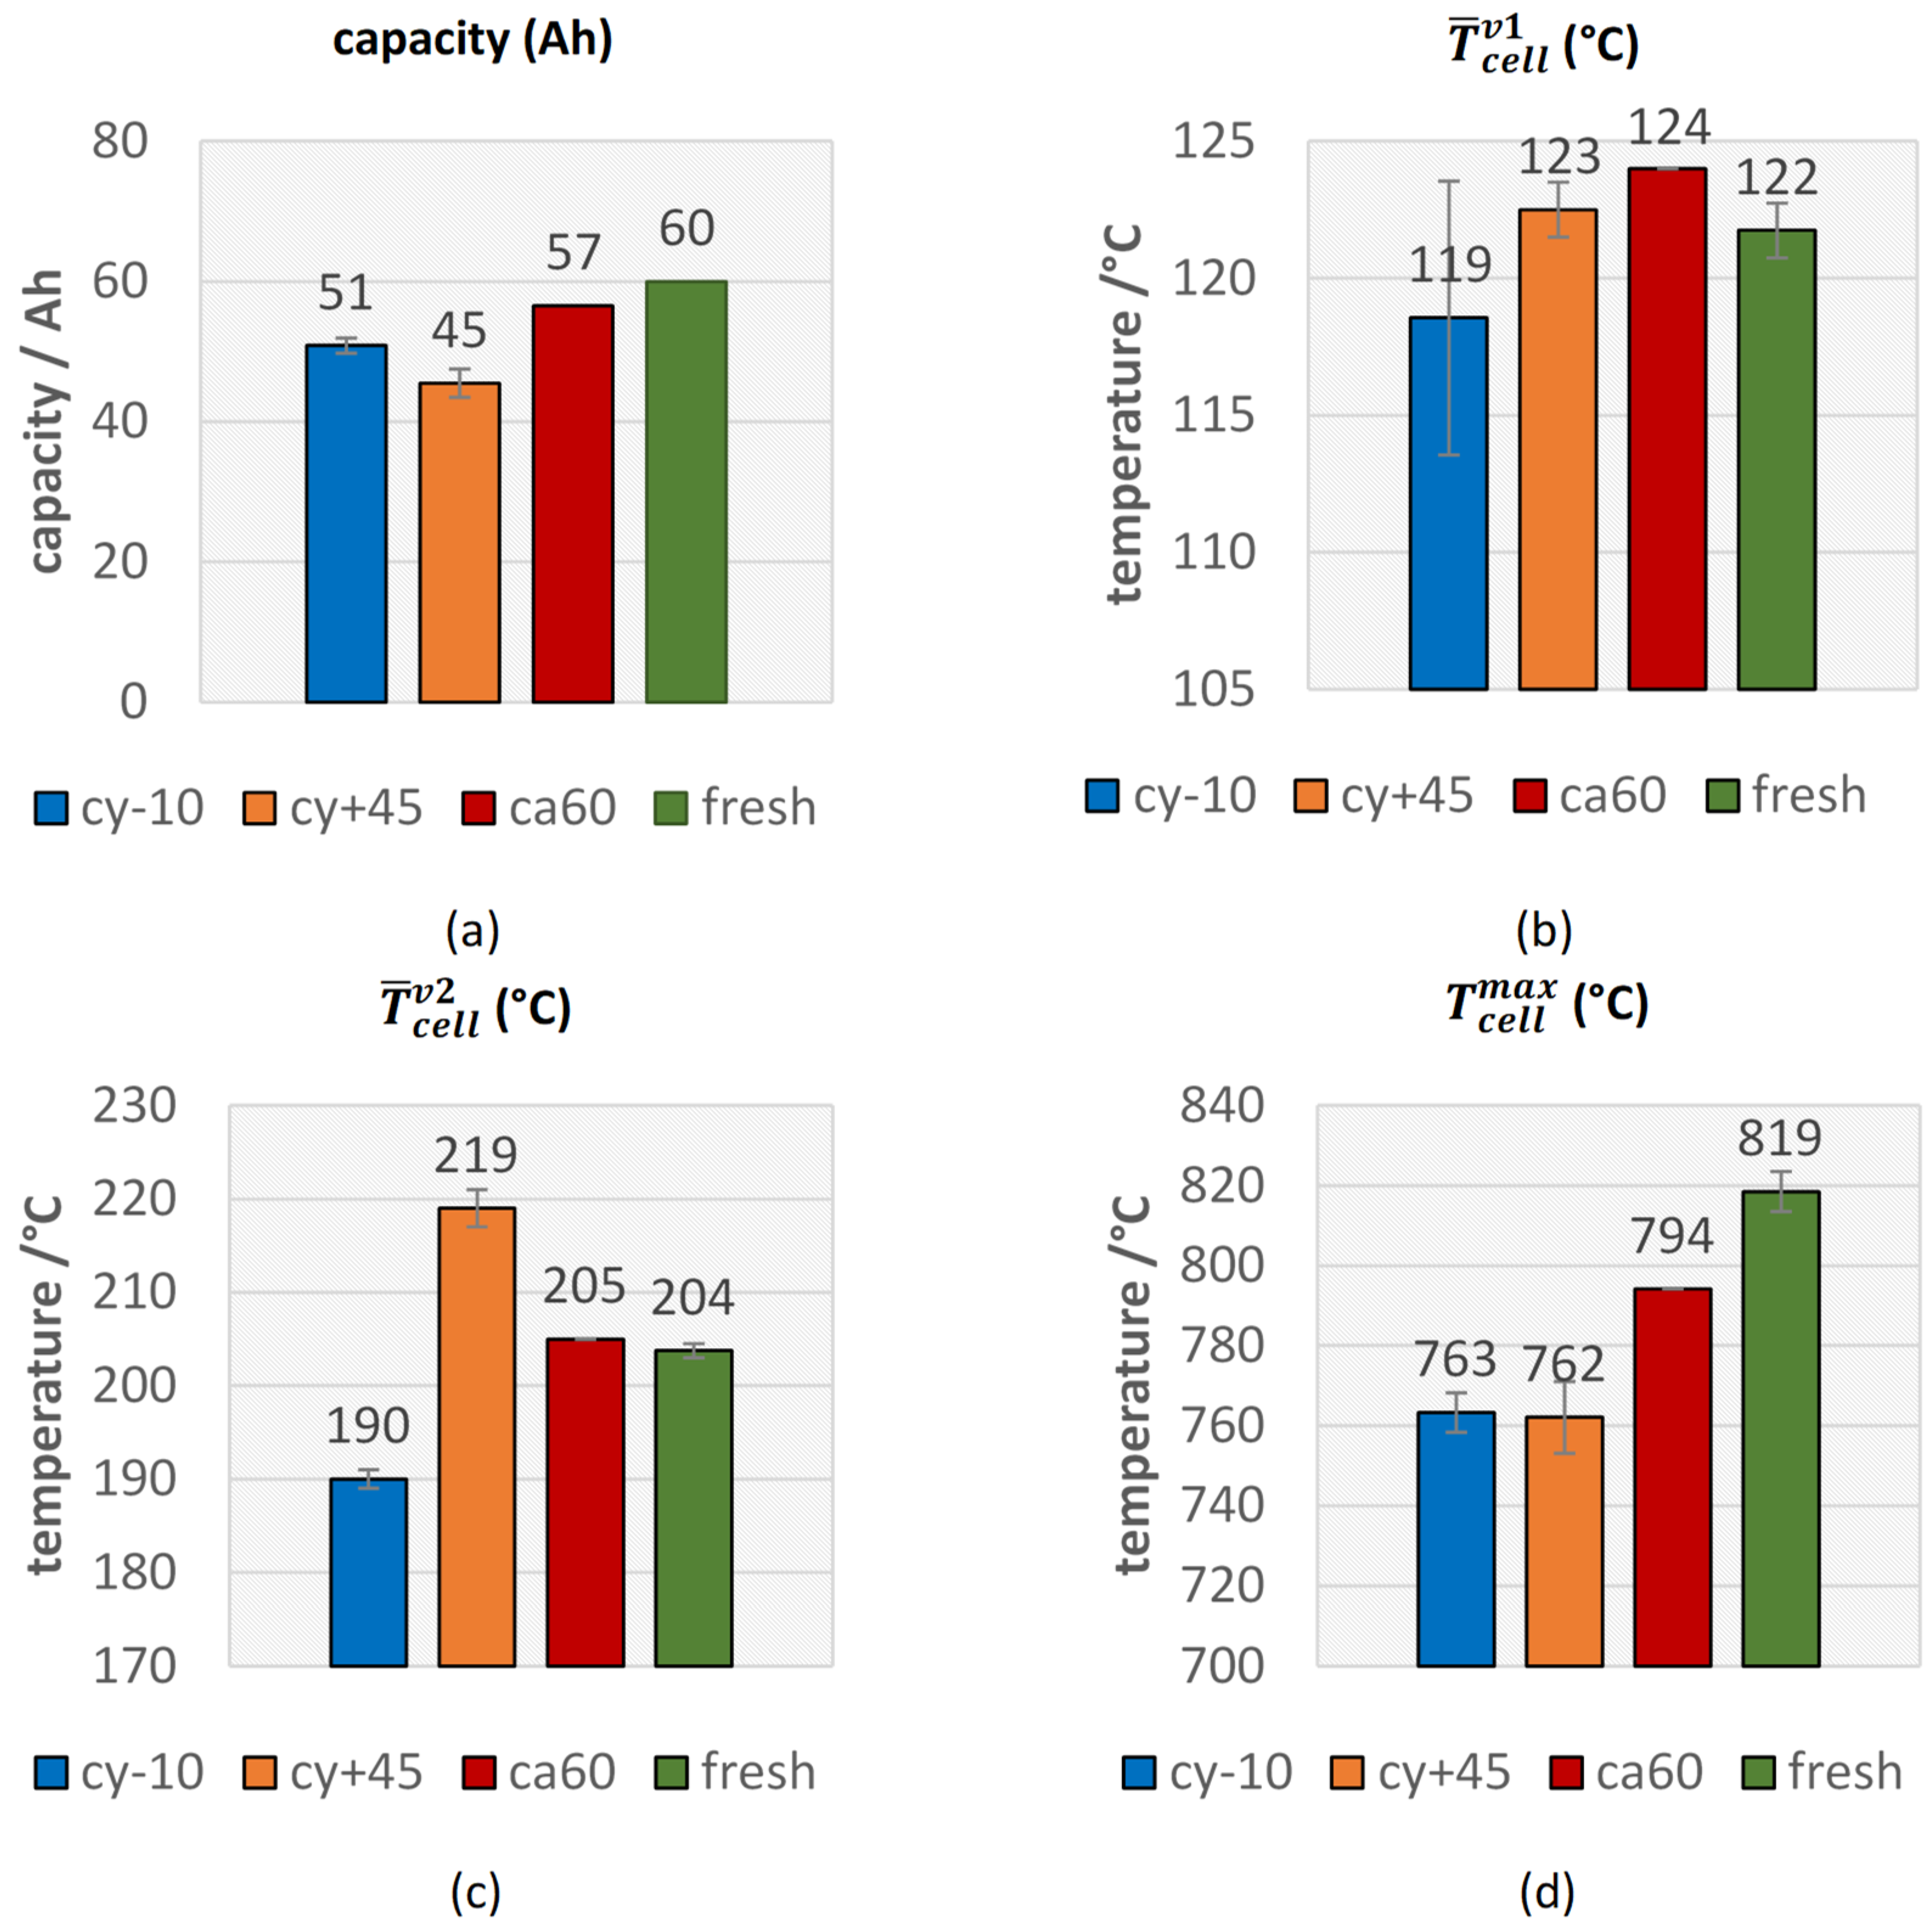
The cyclic aged cells at 45 °C showed the highest capacity fade compared to the other two aging paths and the calendric aged cells at 60 °C, the lowest capacity fade (see Figure 3a).
This can be explained in the following way: the storage temperature, the cell chemistry, the SOC, and the storage duration affect the calendric aging. Calendric aging is dominated by side reactions between the used chemical substances [52] and is accelerated with increasing temperature [53]. A major side reaction affecting the cell capacity during storage at high temperature (60 °C) is the Li oxidation on the negative electrode [54]. Röder et al. showed that calendric aging is mainly affected by loss of cyclable Li due to SEI growth [49].
The aging mechanism of the cycled cells at 45 and −10 °C can be explained due to the additional aging mechanisms: additional to the aging mechanisms described for calendric aged cells, for the cyclic aged cells high and low temperature, external electrical, electromechanical, and mechanical stress influence the aging process. Waldmann et al. investigated aging mechanisms of NMC/LMO cells during cyclic aging between −20 and +70 °C [55], and they found out that the predominant aging mechanism below 25 °C is Li plating and above 25 °C it is the cathode degradation (Mn loss on the cathode side and Mn deposition on the anode side) and the SEI growth on the anode. Mn dissolution was also reported in [56,57]. During charging at low temperature, metallic Li deposits on the anode outside the SEI because of the negative anode potential versus Li/Li+ [46,55]. The probability of this Li plating is affected by the temperature, the charging rates, and the SOC [58]. A rest time after the Li plating can reduce Li plating. Waldmann et al. reported a reduction of Li plating during a rest time due to chemical intercalation of the metallic Li into the graphite particles [46]. In general, TR experiments on cells with Li plating lead to a reduced thermal stability [28,59] and a stronger TR reaction [46,50].
At temperatures above 25 °C Li plating does not occur and instead degradation of the cathode and SEI growth dominate the degradation reactions [55]. Damage of the cathode structure [60] and particle cracking [18] were reported. The SEI growth correlates with loss of mobile Li. Consequently, the internal resistance of the cell increases and the capacity decreases. A reduced exothermic reaction is expected for these cells [48,49].
The first venting of the cell was observed in all aged test samples and each cell was triggered into TR afterwards. The basic effects occurring during the TR of these investigated #1 cells (such as loss of cell voltage, self-heating of the cell, production of gas, cell rupture, particle ejection) were very similar to the results of other different cell types tested in the same TR reactor (see [7,13]).
The tested aged cells did not show a more harmful failing reaction compared to fresh cells. This correlates with the literature of aged cells at higher temperature without metallic Li plating. Consequently, during cyclic aging at −10 °C, either no Li-plating was produced, or the produced Li plating reacted in the meantime between the aging experiment and the TR experiment, because the cells could not be tested immediately after the aging experiment. The cy−10 cells were stored at 25 °C for another five months before the TR tests. In this time, if there was produced metallic Li plating, this Li plating might have reacted. A possible Li plating reaction is chemical intercalation into the graphite particles, which was reported by Waldmann et al. during rest periods [46]. Additionally, Liu et al. published that in EC containing electrolytes, EC passivates metallic Li plating [61]. Consequently, if the cell can rest after metallic Li plating was produced, the failing reaction is not more harmful than for other cells.
In this study, the aged cells showed in the TR experiments reduced maximal temperatures, lower amount of produced gas, and significantly lower CO amounts in the vent gas than fresh cells. In the next chapters, the thermal behavior, the vent gas emission, vent gas composition, and the mass loss of aged cell type #1 cells are presented and discussed in comparison to the fresh cells.
3.1. Thermal Behavior
In Table 3, the most important thermal parameters during failing aged type #1 LIBs are compared with the results of the fresh type #1 cells. The average value over repeated experiments is presented with the deviation between the repeated experiments. Except for the ca60 aging path, there was only one cell available.
The main results are presented graphically in the following figures always in the same order: First the results of the cy−10 cells are plotted, then cy+45, ca60, and finally the results of the fresh cells.
There were no significant changes in from fresh cells to aged cells (see Figure 3b), but there was a trend towards higher for aged cells. Only one cyclic aged cell at −10 °C showed an earlier opening of the pouch bag. This observation was consistent with the investigations of Ren et al., who measured the first venting almost at the same temperature of ~120 °C independent of the four different degradation paths and SOH [20]. Slightly increased might be explained with the degradation of electrolyte and subsequent lower amount of electrolyte inside the cells, which forces the cell housing to open due to vaporization of the electrolyte.
For the parameter , the second venting, a correlation between the aging path and the failing behavior was observed (see Figure 3c). Both cells with the highest capacity fade (cy+45) showed a significant higher average temperature for than for fresh cells and an increase in thermal stability. These results were comparable with the observations of Feng et al. for cyclic aging at higher temperature [28] and Zhang et al. for calendric aging [48]. Because the loss of mobile Li, smaller amount of Li can react with the electrolyte and consequently the exothermic reaction starts at a higher average temperature. In contrast to the cy+45 cells, both cy−10 aged cells showed a lower . The decreased thermal stability of cells aged at low temperature was also observed by Fleischhammer et al. in [50] and Feng et al. in [28]. This might be explained due to the Li deposits outside the SEI in course of cycling at low temperature and the enabled reaction between the Li and the electrolyte after the decomposition of the passivation of the metallic Li. The second venting, the TR, was observed at a lower average temperature than for fresh cells. The calendric aged cell was comparable with the results of the fresh cells, which can be explained due to the lower capacity fade of the calendric aged cell.
The parameter is comparable with the defined TR onset temperature in other literature [28,49] and correlates with the observations of . increased for the cy+45 aged cells, which was consistent with the literature [48,49], but decreased for the cy−10 aged cells.
A clear reduction of the maximum temperatures on the cell surface was observed for all aged cells (see Figure 3d), although the thermocouple positions in our test setup were limited in amount and in position, and this parameter showed higher deviations from one experiment to the other. The hottest position on the cell surface was not known before the experiment and consequently in some experiments, the hottest cell surface spot was not covered. Independent of the aging path, in each experiment, the maximum measured cell-case temperature was above 740 °C, which is higher than the melting temperature of aluminum.
The vent gas temperature can be measured more easily for hard case cells with a defined burst plate, than for pouch cells, because the pouch foil can open at all pouch foil-welded sides simultaneously. Since there was no defined burst plate for the pouch cells, the thermocouples positioned on the pouch foil welded sides did not guarantee to measure the vent gas temperature and certainly did not measure the highest vent gas temperature. Nevertheless, remarkably high could be measured (up to 1300 °C) during the experiments with the five aged type #1 cells.
3.2. Vent Gas Emission
As in the experiments with the fresh cells, the pressure inside the reactor increased slowly during the first venting of the pouch cell and abruptly at the TR of the fully charged cells. The main amount of gas was produced during the TR itself.
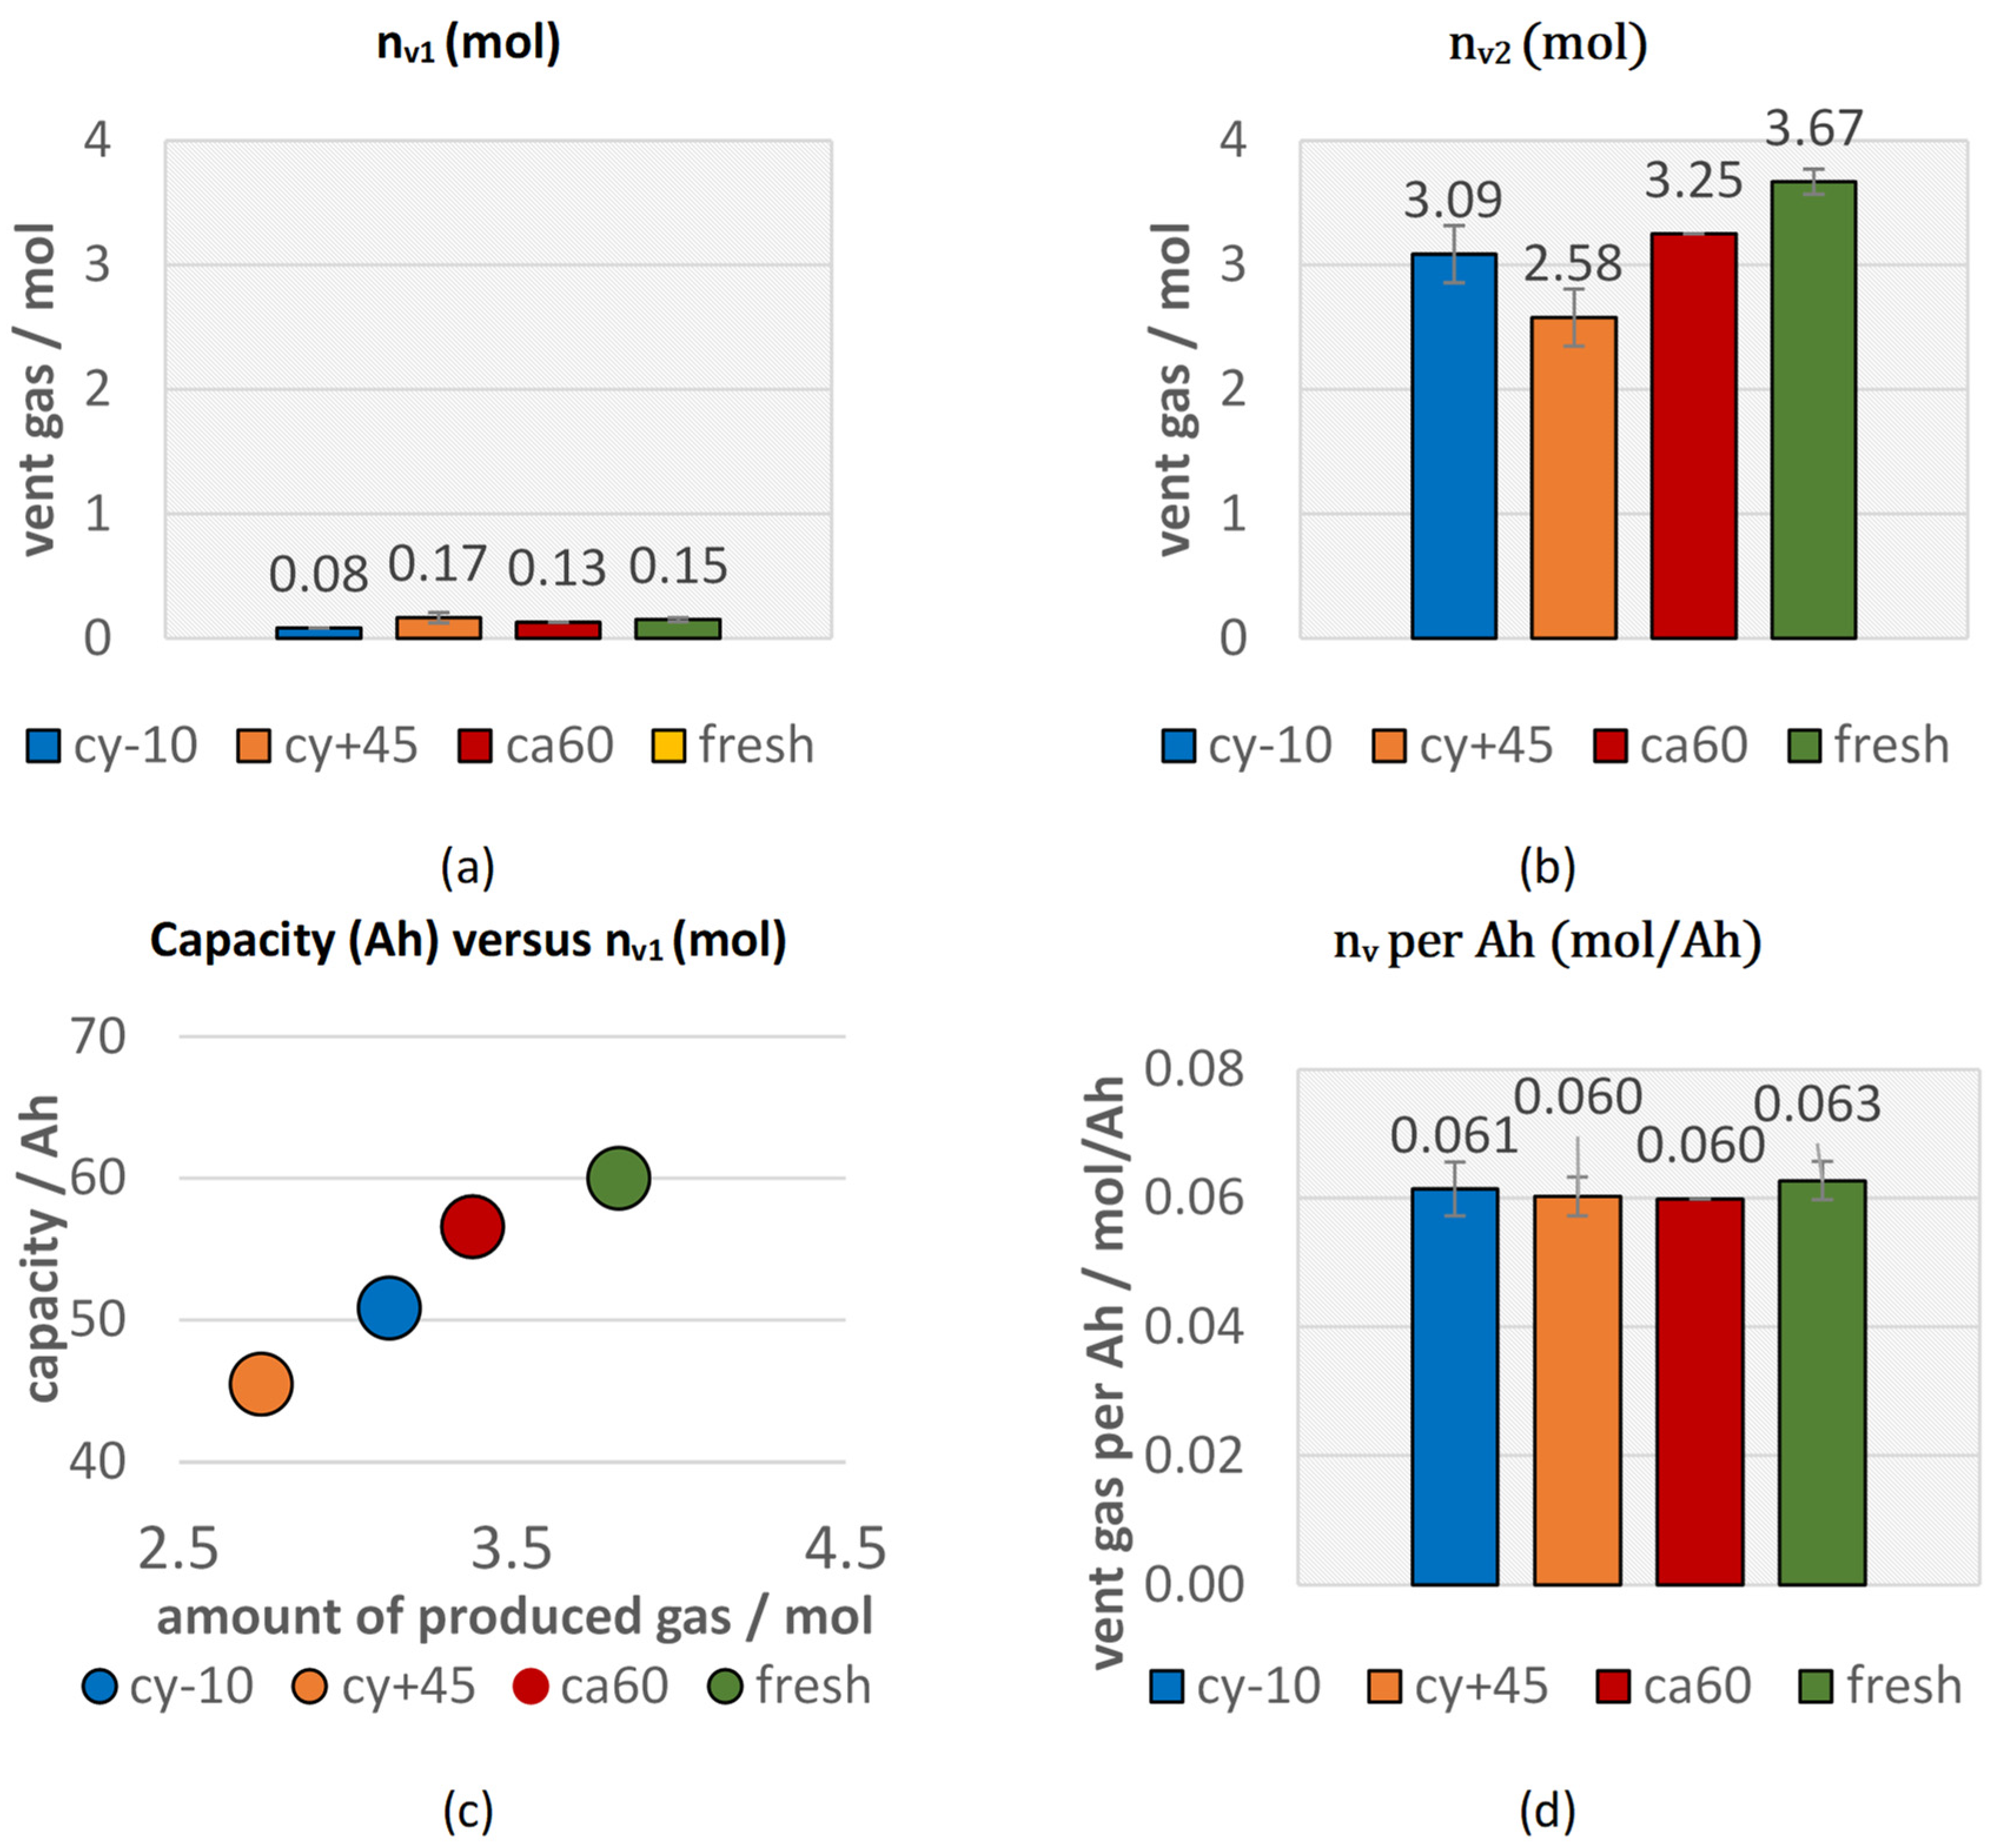
Figure 4a shows the amount of gas produced starting at and ending at the (nv1). The aged and the fresh type #1 cells produced comparable amounts of vent gas after the opening of the cell housing until . Only the cyclic aged cell at −10 °C (cy−10) produced lower amounts of gas during the first venting. Figure 4b presents the amount of gas produced after the start of the second venting for aged cells and fresh cells in overtemperature TR trigger in comparison. The aged cells produced significantly lower total amount of gas than the fresh cells. This might be explained due to the reduced amount of reactive Li and reduced amount of electrolyte. A linear correlation between the amount of produced vent gas and the current capacity of each cell can be seen in Figure 4c,d. Cell type #1 produced independently of the investigated aging path about 0.06 mol vent gas per Ah in overtemperature triggered TR experiments. No literature could be found on the effect of the aging path on the vent gas amount in failing state for comparison. As shown in our previous study on the trigger influence [13], another series product cell (type #2) from a different cell manufacturer with NMC 622 chemistry and graphite anode also produced about 0.06 mol/Ah in overtemperature trigger. Consequently, a vent gas production of 0.06 mol/Ah could be a general relation describing the degassing amount of NMC (622)-graphite chemistry cells with liquid electrolyte mixture (EC, EMC, DMC, DEC) for overtemperature TR experiments. The use of different TR trigger has an influence on the amount of produced vent gas and in overcharge experiments, higher amounts of gas are produced [13].
3.3. Vent Gas Composition
The vent gas composition was measured roughly about ten minutes after the first venting and after the TR. The vent gas composition after the first venting of the aged type #1 cells were compared with the vent gases measured after the first venting of fresh cells. For the calendric aged cell at 60 °C and for the fresh cells, only one gas measurement after the first venting was taken, consequently only one measurement can be presented.
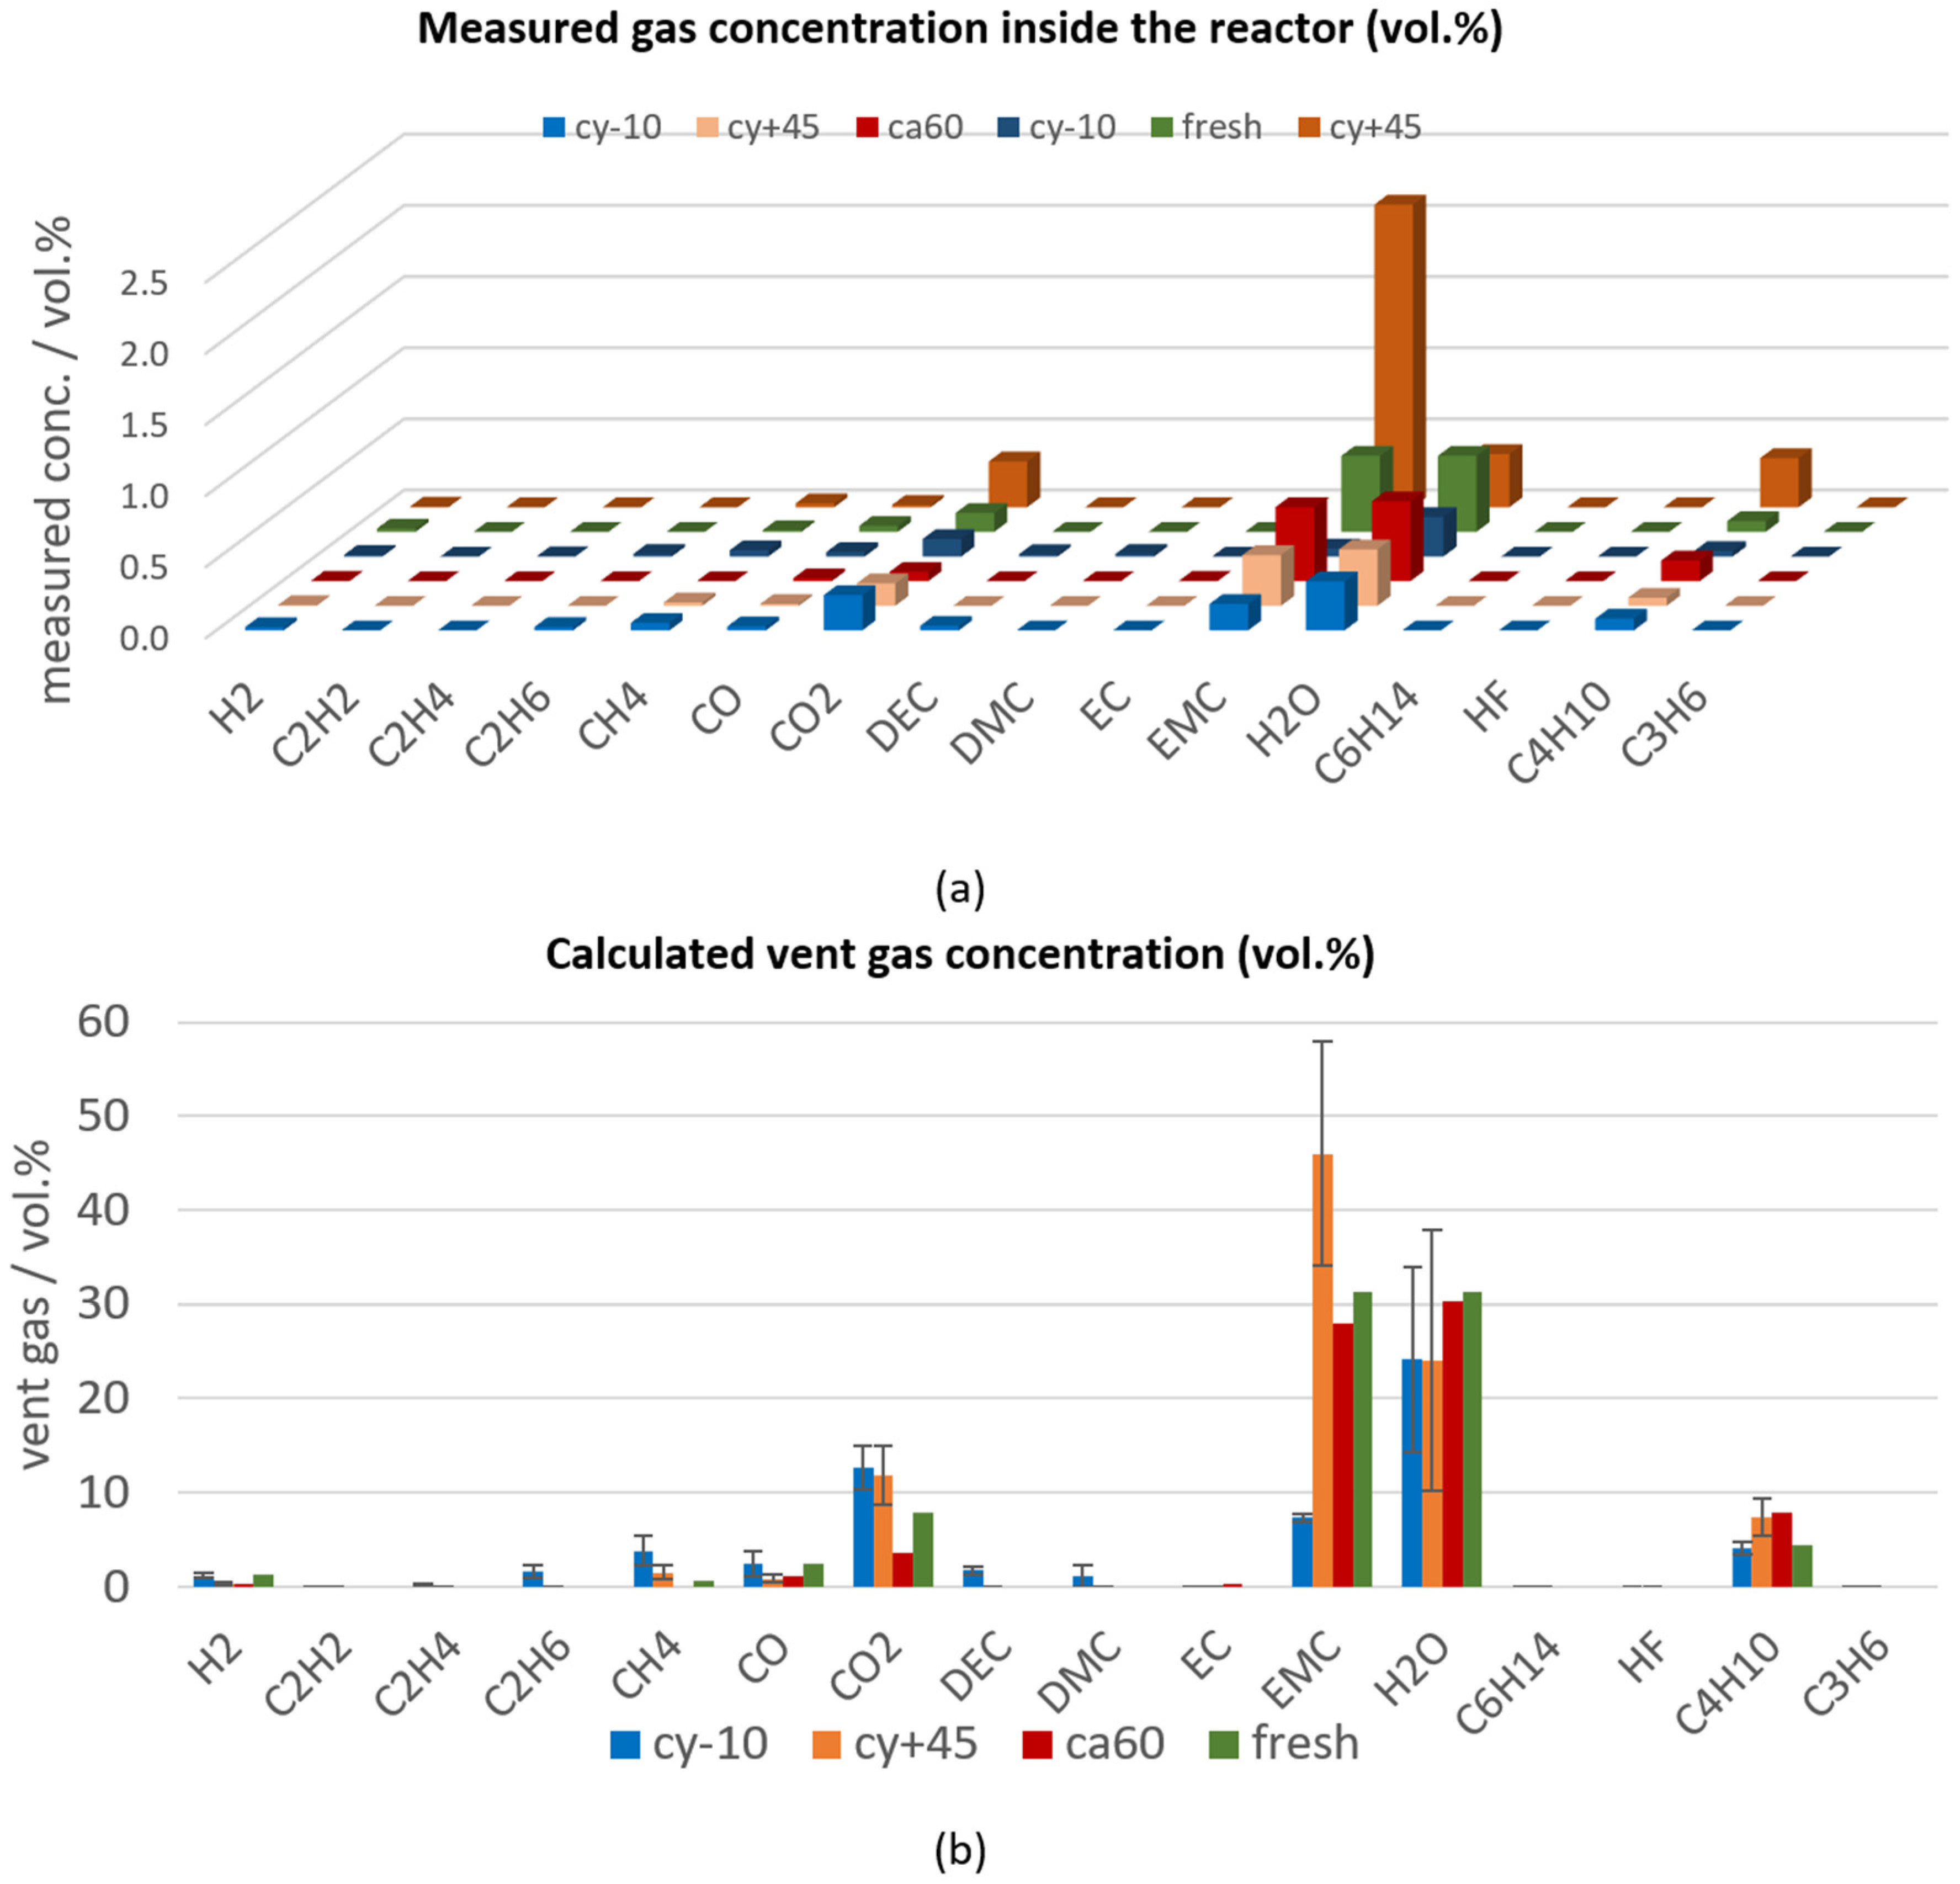
In overtemperature experiments the measured gases after the first venting describe the sum of accumulated gases evolved from inside the cell at the opening of the cell housing (here EMC, H2O, CO2, CO, C4H10, CH4, H2) and gases produced continuously due to constant heating. Constant heating leads to additional evaporation of electrolyte (here EMC) and further decomposition gases (here CO2, CO, C4H10, H2O). Consequently, the total amount of gas and the gas composition highly depends on the exact time when this measurement is taken. In Figure 5a, the vent gas measurements (in volume percent (vol.%)) are ranked according to the time between the first venting and the gas measurement: the gas measurement of one cy−10 cell was taken eight minutes after the venting and is shown in the first row, and the measurement of one cy+45 cell was taken 19 min after the venting and is presented furthest back. After the first venting, the main gas components are electrolyte components (for this cell type #1 EMC), and decomposition products of the electrolyte and the SEI (H2O, CO2). In Figure 5a, it can be seen that the concentration of the electrolyte vapor EMC increases with increasing time between the venting and the gas measurement. During one experiment using a cy−10 cell, the vent gas after the first venting was unintentionally diluted with additional N2 (additional 4.3 mol N2 was added to about 5.4 mol N2 from the beginning of the experiment). So, the measured gas concentrations of this experiment using a cy−10 cell (dark blue measured gas concentration in Figure 5a) were lower than the other gas concentrations measured about the same time after opening of the cell housing.
The main gas compounds measured after the first venting of fresh cells and the different aging paths of cell type #1 led to the same main gases, but the exact vent gas composition differed between the different aging paths, as can be seen in Figure 5b. Here, the average calculated vent gas composition (according to Equation (1) in [13]) of the repeated experiments is presented in vol.%, which is independent of the total amount of produced gases.
The calendric high temperature aged cells showed the lowest capacity fade compared to the other two aging paths, and consequently, the gas composition after the first venting of the calendric aged cells was most comparable to the vent gases produced for fresh cells.
The cyclic aging at −10 °C led to decomposition products of the electrolyte component EMC into DEC, DMC, C2H6, and CH4, which were measured after the opening of the cell housing. The trans–esterification reaction of EMC into DEC and DMC was described by Blomgren et al. in [62]. CH4 and C2H6 as decomposition products might be produced from the methyl radicals (CH3) [63], which are formed from decomposing EMC [64]. As a consequence of the SEI decomposition, small amounts of H2 were measured, because H2 most probably developed due to the reaction of the linear electrolyte component EMC and the anode [65]. Very low C2H4 concentrations were measured after the first venting. Because C2H4 is mainly produced during the decomposition of EC, we can assume that only minor parts of EC were decomposed after the first venting.
The presented vent gases after the first venting highly depend on the used electrolyte. This can be observed by comparing the vent gases produced at the first venting in overtemperature of cell type #1 and cell type #3 published in [7]. For cell type #3, DEC, H2O, CO2, CO, C2H6, H2, C2H4 were the main gas compounds. The degradation paths of the electrolyte components are described in [66].
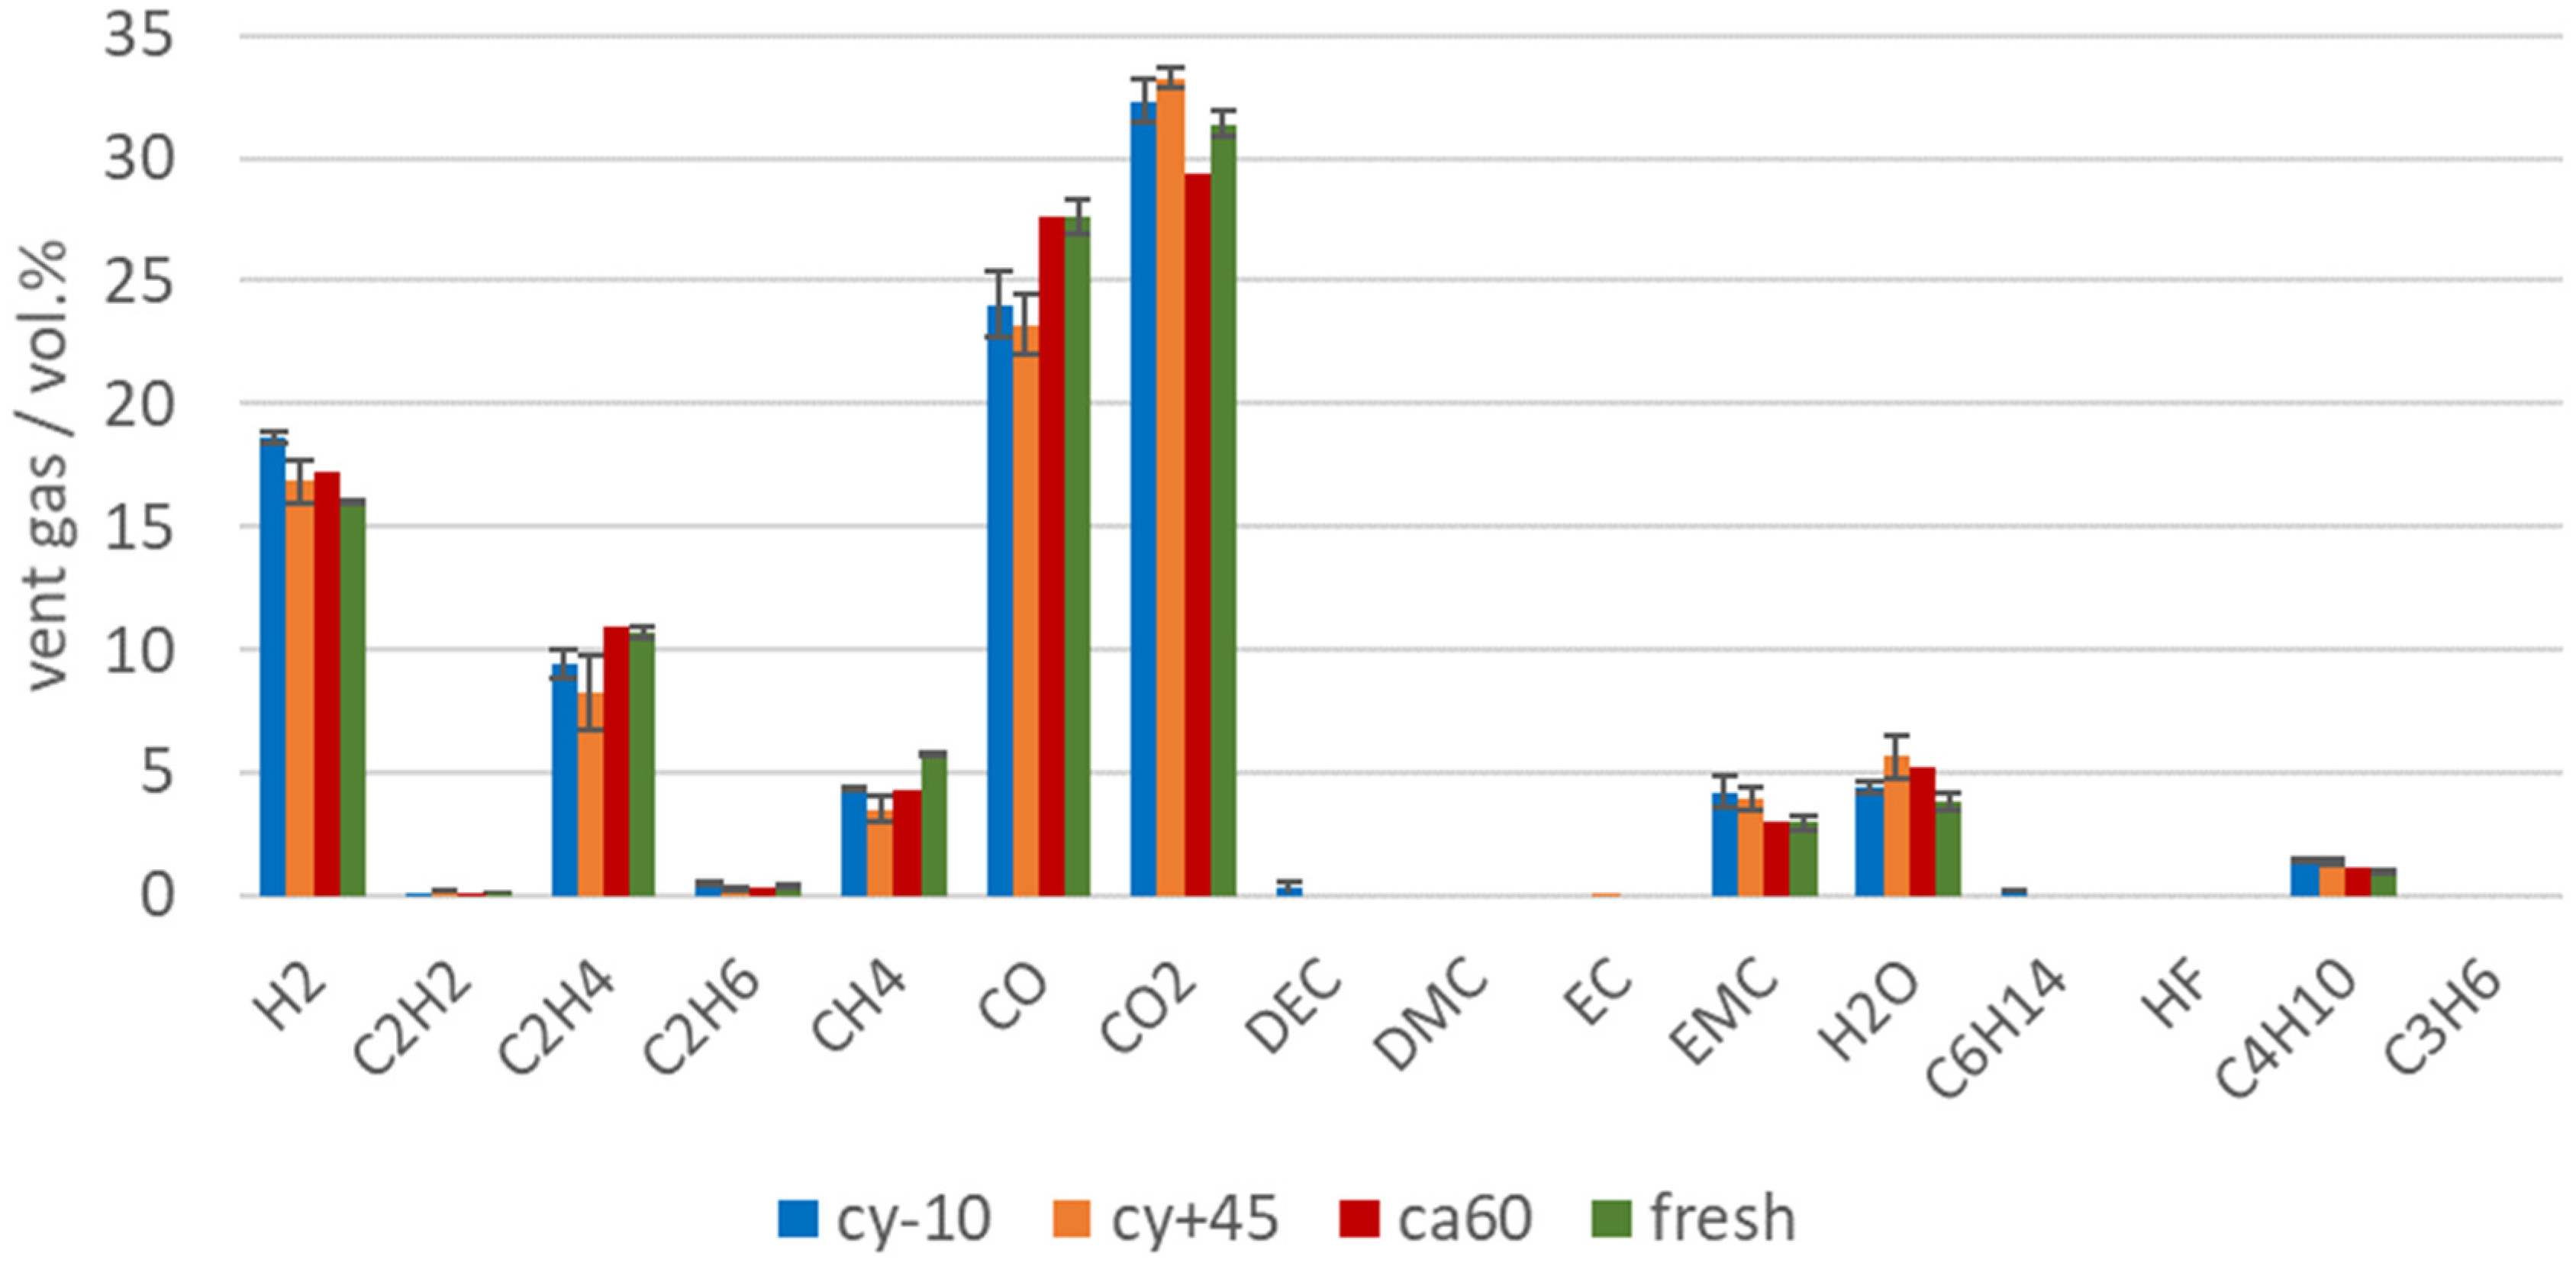
During the TR, the main amount of vent gas was produced. The main gas compounds produced during the TR of cell type #1 were CO2, CO, H2, and higher hydrocarbons (see Figure 6). These main vent gas compounds were similar to published vent gas compositions from other NMC LIBs with commercial electrolyte solvents (such as EC, DEC, DMC, EMC), like published in [37,40]. The presented results are within the error bars of each gas component presented in [37] Figure 4. The gases produced during the TR can be explained by SEI decomposition [9,65], electrolyte decomposition [67,68], NMC (cathode) degradation, and reaction of the solvent with the cathode [43,69]. As shown in the investigation of the TR trigger in [13], the failing mechanism driven by the Li deposit inside the cathode/anode (see overtemperature versus overcharge) also influences the vent gas composition.
The vent gas composition is also influenced by the used electrolyte components and additives [70]. Although parts of the electrolyte were consumed in the SEI, or decomposed, EMC was still measurable in the vent gas in a significant amount. EC was unlikely to be measured in this setup, because of the high boiling point and EC is not volatile enough to be detected in this setup.
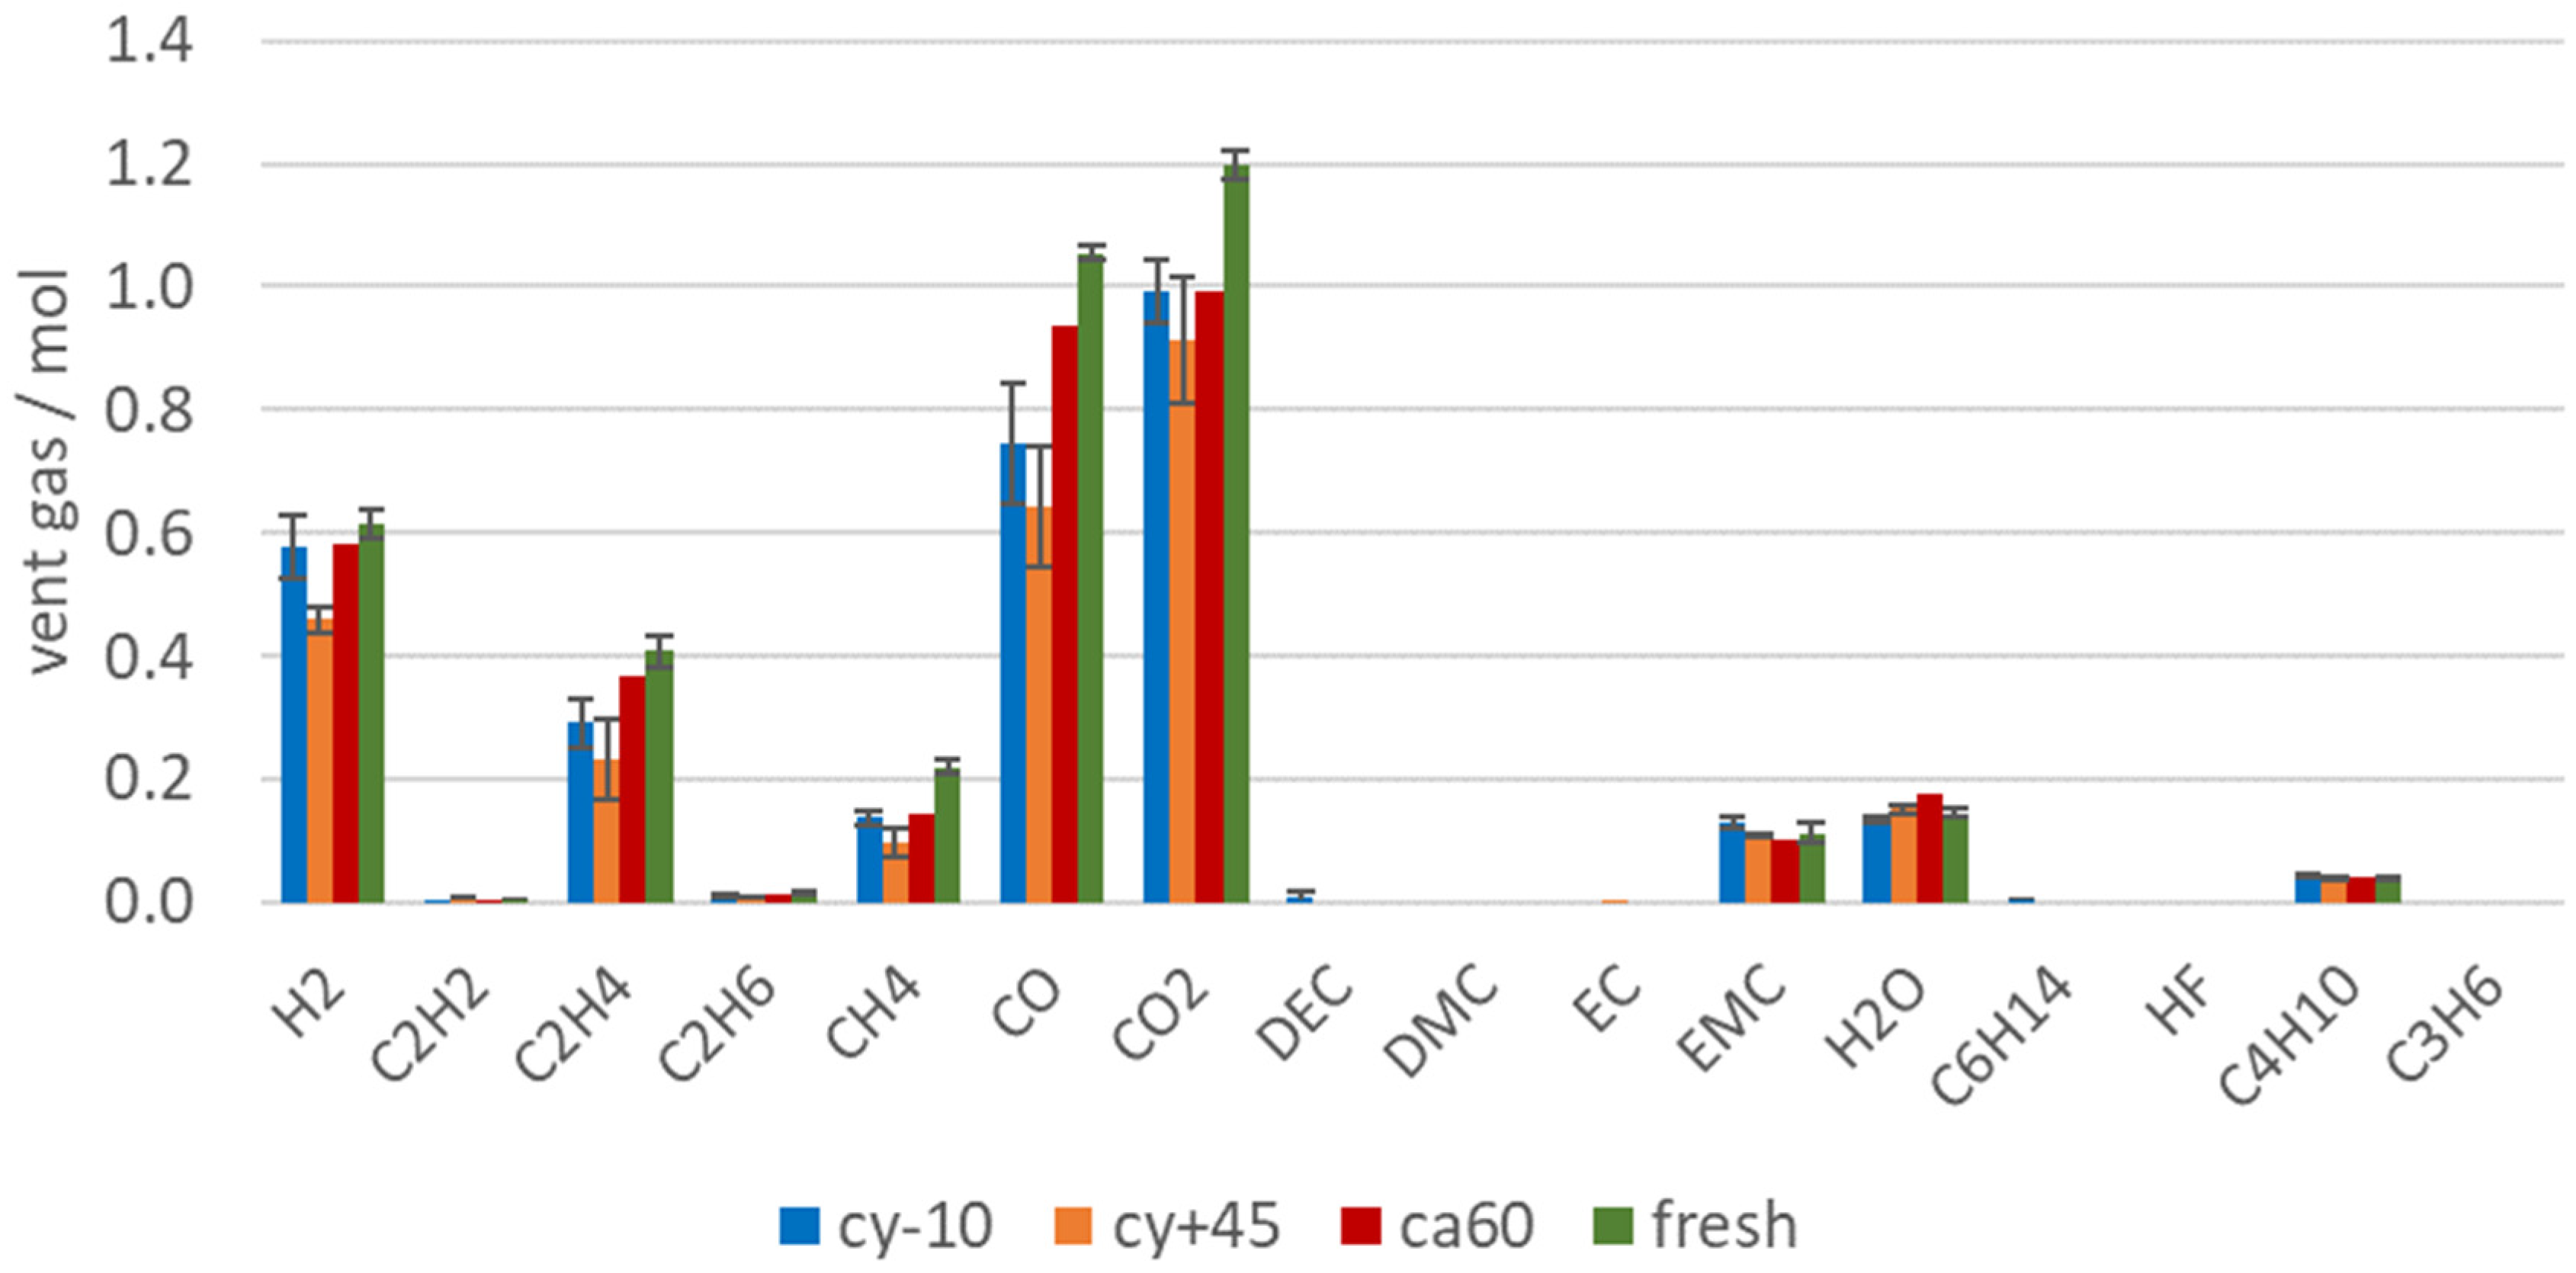
Figure 7 shows the amount of produced vent gas in mol in order to emphasize on the reduced gas production of failing aged cells. Beside the reduced amount of vent gas emission of aged LIBs, the aging influence can also be observed in the vent gas composition. Capacity and power fade, irreversible loss of reactive Li and electrolyte led to a significant decrease of the amount of toxic gas CO, but also the total amount (in mol) of CO2, H2, C2H4, CH4 were reduced. C2H4 was produced during EC reduction [66]. For the cells with the highest capacity fade (cy+45 and cy−10) the amount of C2H4 was reduced compared to fresh cells, because parts of EC were already consumed irreversibly due to aging effects. At the same time, a decrease of the CO2 amount was measured for the aged cells (cy+45 and cy−10). CO2 was produced mainly during electrolyte decomposition [67,71] and SEI decompositions [10,65]. Broussely et al. also mentioned CO2 gas evolution resulting from the electrolyte oxidation on the positive electrode interface [24]. Although for the aged cells with the highest capacity fade (cy+45 and cy−10), the SEI grew due to aging effects and the SEI decomposition also generates CO2, the same amount of CO2 was not produced during the overtemperature experiment than with using fresh cells. Consequently, if electrolyte was consumed in the SEI growth, less CO2 was produced (and less CO and higher hydrocarbons).
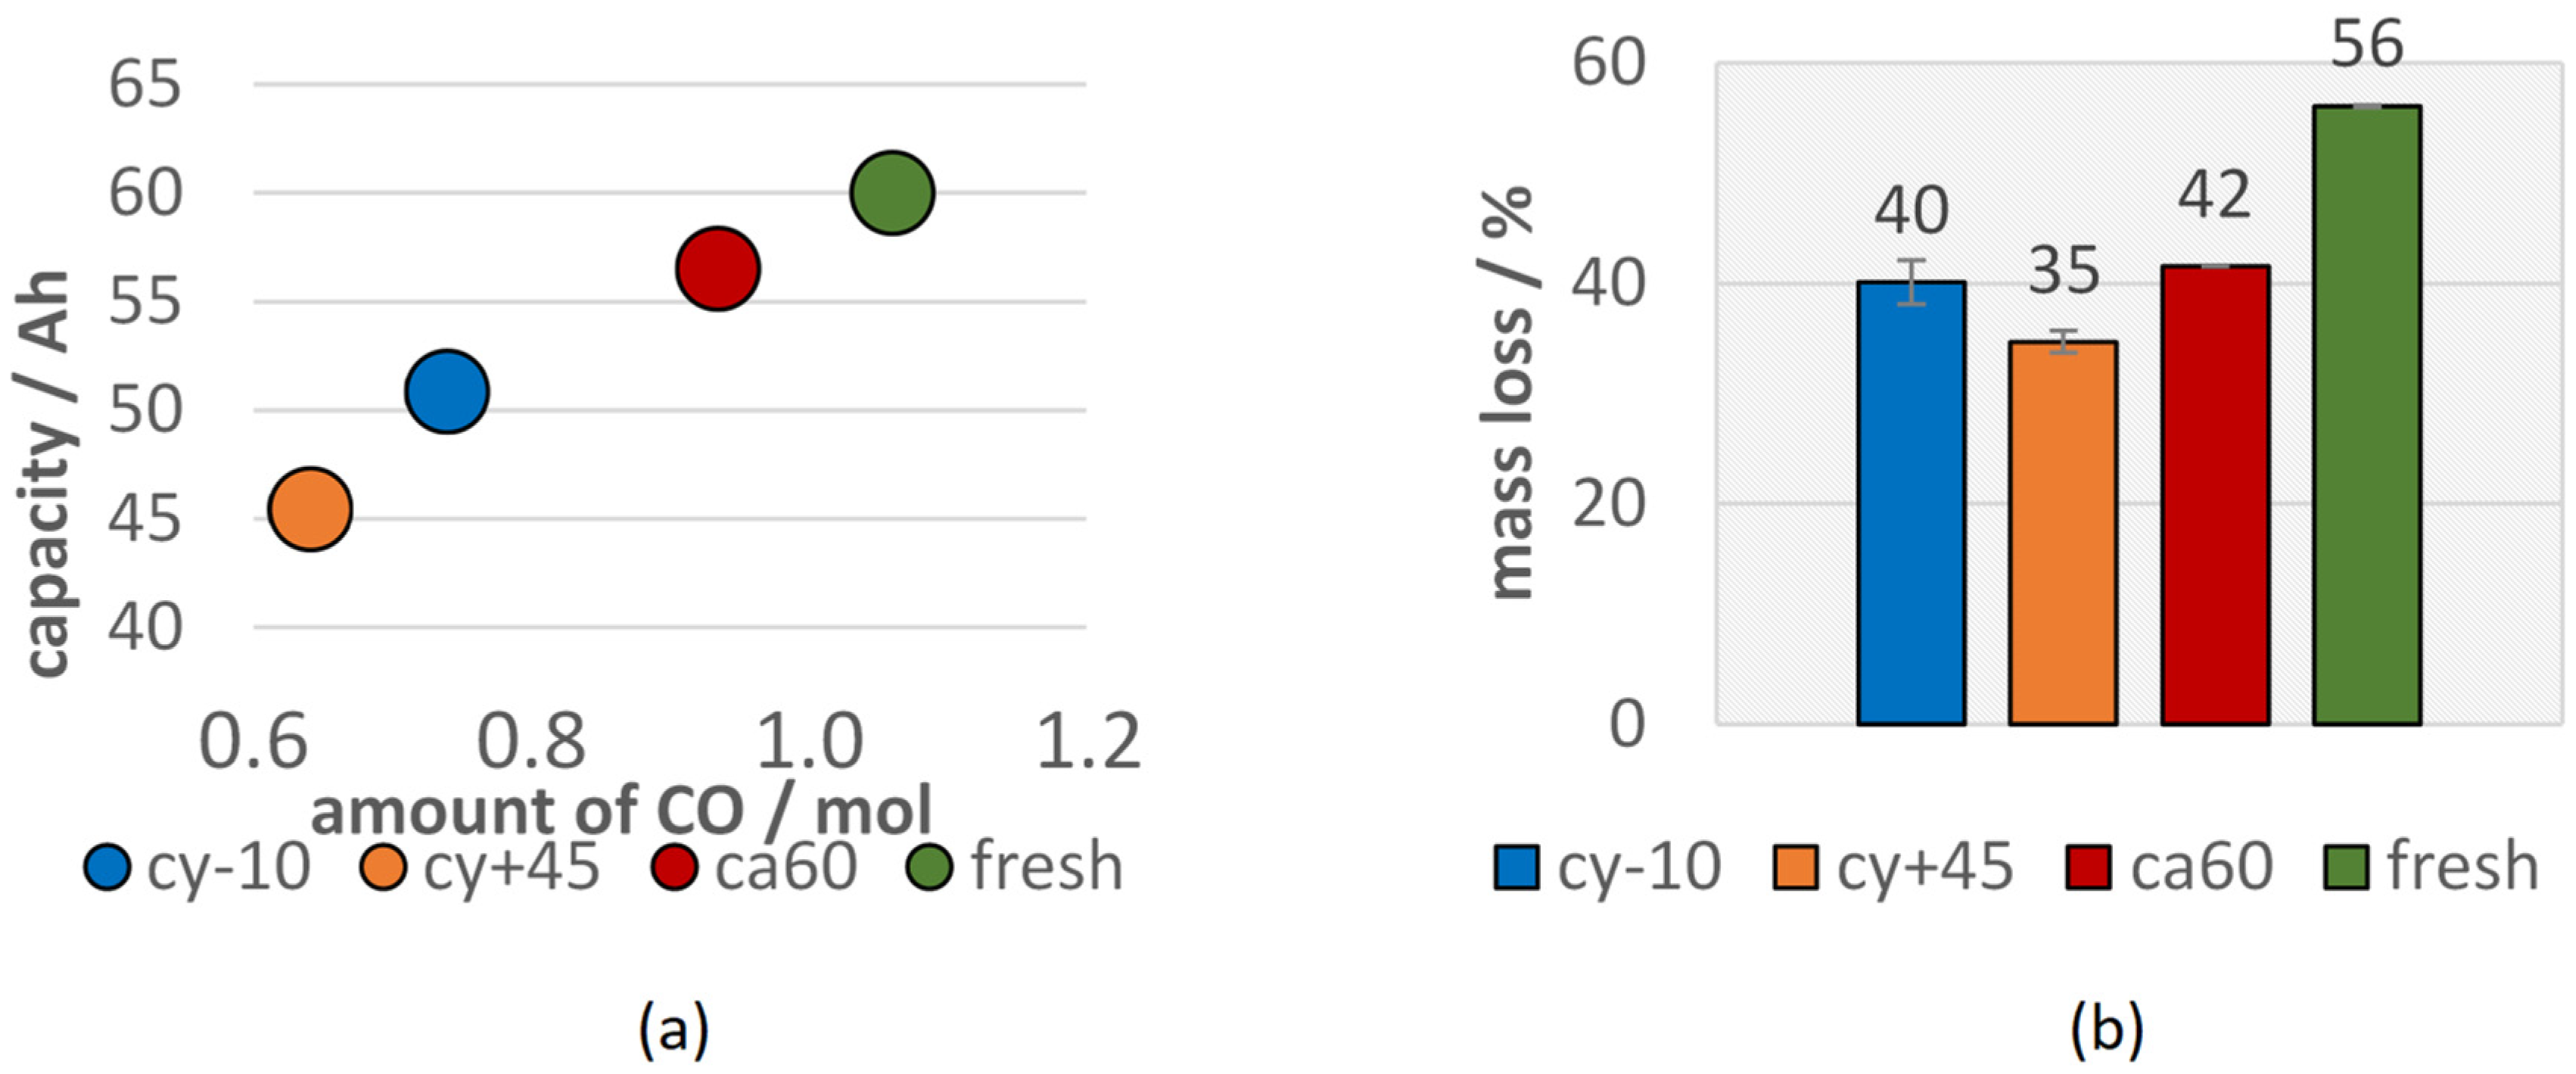
Although the calendric aged cell lost less capacity than the cells with other aging paths, differences in the vent gas composition after the TR can be observed. Lammer et al. observed higher amounts of H2 for failing aged cells compared to the fresh cells. In this study, the vol.% of H2 in the vent gas increased for aged cells, but did not increase in total amount (compare Figure 6 and Figure 7). The highest H2 reduction was observed for the cells with the highest capacity fade. This can be explained by the reduced amount of electrolyte available for the reaction. H2 was most probably produced due to the reaction between the linear electrolyte components and the anode [65]. Aurbach et al. also stated the H2 production by the reaction of Li with water contaminated electrolyte solutions [72]. In this study, the amount of produced H2 did not decrease as much as the CO or CO2 amount for failing aged cells. The high amount of H2 produced from the cy−10 cells might be explained due to the reaction of plated Li at the anode side with the electrolyte. Du Pasquier et al. assumed that hydrogen was generated during the reaction between the PVDF binder and LixC6 at T > 300 °C [73]. Wang et al. also stated that the collapsed graphite particles LixC6 can react with PVDF and lead to further electrolyte decomposition, heat generation, and H2 production [12]. The amount of produced CO decreased significantly with the loss of capacity. A linear correlation between the current capacity (Ah) and the amount of measured CO (mol) can be seen in Figure 8a.
As in former experiments, inside the same test setup [7,13], in the presented results no hydrogen fluoride (HF) was identified with the FTIR spectrometer inside the FTIR gas measurement chamber after the first venting or the TR.
Since the TR was triggered for all 100% SOC charged cells, all cells lost a significant amount of weight during the experiment due to particle and gas emission (see Figure 8b). The mass loss during the TR of aged cells was reduced compared to fresh cells. This is consistent with a reduced heat release during the TR reaction for aged cells and can be explained with less available reactive Li and less available electrolyte. The cells with the highest capacity fade (cy+45) showed the lowest mass loss during the overtemperature TR experiment. The mass loss of the LIBs during overtemperature experiments also correlated with the capacity of the cells before the failure event.
In Table 4, the safety relevant parameters are summarized for the failing aged, investigated cells and compared to the results of fresh cells during overtemperature TR trigger. Only one ca60 cell was available, consequently no variation between repeated experiments is shown.
First and second degassing were observed in all experiments, independent of the aging path. The calendric aged cells showed the lowest capacity fade compared to the other two aging paths.
Additional to the mentioned safety relevant parameters, the duration of the TR venting and the venting rates were analyzed. The duration of the TR venting was the shortest for the ca60 cell and the longest for one cy+45 cell. This cyclic aged cell at 45 °C vented significantly longer than the other investigated type #1 cells, because according to the thermocouple measurement, the TR started close to the second nearest thermocouple to the cathode tab and needed more time to spread through the cell. Therefore, the duration of the TR venting depended on the origin of the TR. The reproducibility of this parameter was surprisingly high for the experiments with the fresh type #1 cells and the cyclic aged cells at −10 °C.
The reproducibility of the overtemperature TR experiments for the investigated cell type is shown in [13] and confirmed with low standard deviations of the quantification of safety relevant parameters. Though the ca60 experiment could not be repeated, based on the repeatability shown in the other experiments and the reproducible gas quantity (0.06 mol/Ah), the ca60 results were representative. For further information on aging effects and aging models see [52,74,75,76,77]. Aging models were not the focus of this study.
This observed influence of aging is valid for the investigated pouch cell type #1 for the investigated aging paths. Although the results were representative for currently used mass-produced EV cells, the results might be slightly different for other cell types from different cell manufacturers. Though a proper choice of materials and additives may lead to certain changes in the aging behavior, the cycle stability, and the failing behavior, these observed results may not be true for different cell chemistries. For a different cell type, such as prismatic hard case cells, differences in the opening of the cell housing (the first venting), the duration of the TR event, and consequently the characteristic venting rates are expected [13]. Additionally, external compression of the cell during aging might lead to changes in the TR results. The mechanical pressure increases the electrical contact [25] and the wettability of the electrodes [22], but too high applied external compression leads to reduced ionic transport, separator creep, power fade, and capacity fade [22,26,78]. Again, it needs to be mentioned that the TR tests were not conducted immediately after the aging tests, the cells were stored at room temperature for another five months before testing inside the TR reactor.
Compared to the literature, a general rule might be, that a less violent TR behavior is observed for aged cells with power and capacity fade, if no metallic Li plating is produced. But if fresh metallic Li plating is produced, a more intense TR reaction is expected. To be able to predict the exact failing behavior, a detailed analysis for each cell chemistry/cell type is highly recommended.
4. Conclusions
Since most EV incidents happen not immediately after the car is produced, but when the cells are aged by varying degrees, in this study, the effect of different aging paths on the failing behavior of the cells were investigated. Automotive large LIBs were tested in overtemperature triggered TR experiments after three different aging paths (cyclic aging at −10 °C (cy−10) and at 45 °C (cy+45) and high temperature calendric aging at 60 °C (ca60)) and compared with the results of fresh cells in three main categories: thermal behavior, the vent gas emission, and vent gas composition.
The cyclic aged cells at 45 °C showed the highest capacity fade compared to the other two aging paths and the calendric aged cells at 60 °C exhibited the lowest capacity fade. All tested aged cells showed a reduced (less violent) failing reaction compared to fresh cells. The expectation of a stronger reaction of the failing aged (cy−10 °C) cell due to Li plating was not confirmed. Because of the rest time after the Li plating, the plated Li might have intercalated or chemically reacted, which had positive effects on the safety behavior of the cell during TR. In this study, using aged cells in overtemperature TR experiments ended up in reduced maximum temperatures, lower amount of produced gas, significantly lower amount of CO in the vent gas, and lower mass loss than in the same experiments using fresh cells.
For each cell, a first venting before the TR was observed. The results showed that there were no significant changes for the first venting temperature, , between fresh cells to aged cells, but a significant higher average temperature for the second venting, , for cyclic aged cells at 45 °C, which means an increase in thermal stability for cells cycled at 45 °C. A decrease of thermal stability was observed for cells cycled at −10 °C, because the second venting started at a lower temperature (∆T = −14 °C). A clear reduction of the maximum measured temperature on the cell surface was observed for all aged cells.
Additionally, the aged cells produced significant lower total amounts of gas than the fresh cells. Only a small amount of gas was produced after the first venting and the main amount of gas was produced during the TR reaction. A linear correlation between the total amount of produced vent gas and the current capacity of each cell before the TR experiment was observed and reported as a new finding. Also, 0.06 mol/Ah vent gas in overtemperature TR triggered cells could be a possible relation in general for NMC (622)-graphite chemistry cells with liquid electrolyte mixture (EC, EMC, DMC, DEC).
After the first venting, the main vent gas components were independent of the different aging paths (electrolyte vapor (EMC), CO2, H2O), but the exact vent gas composition differed between the different aging paths. Different decomposition reactions of the used cell material were observed, such as the trans–esterification reaction of EMC into DEC and DMC during cyclic aging at −10 °C. The main gas compounds produced during the TR (CO2, CO, H2) and higher hydrocarbons were independent of the aging path, but correlations to the aging were visible. The total amount of CO in the vent gas decreases with decreasing capacity. Also, the amount of CO2, H2, C2H4, and CH4 were reduced for failing aged cells compared to fresh cells.
Aging of LIBs and the aging paths have a significant effect on the failing behavior of LIBs during TR, and consequently on the safety relevant parameters such as gas emission, maximum reached cell surface temperatures, and vent gas composition. A general rule might be that a less violent TR behavior is observed for aged cells with power and capacity fade in comparison to fresh cells, if no fresh metallic Li plating is produced. If fresh metallic Li plating is produced inside the cell, a stronger TR reaction is expected. If we exclude the case of Li plating, these results show that experiments with fresh cells represent the worst case of TR reaction. Consequently, we recommend the use of fresh cells for the determination of safety-relevant parameters for the design of battery applications.
In future investigations, cells with fresh metallic Li should be investigated immediately after the aging experiment inside the TR test rig in order to quantify the influence of fresh Li plating on the failing behavior. Since the cell chemistry has an influence on the failing behavior, for different cell chemistries, a detailed analysis of the effect of the aging paths on the failing behavior is recommended.
Author Contributions
Conceptualization, C.E.; methodology, C.E.; software, C.E.; validation, C.E.; formal analysis, C.E.; investigation, C.E.; data curation, C.E.; TR data conversion, A.W.G.; writing—original draft preparation, C.E.; writing—review and editing, C.E. and A.F.; visualization, C.E.; supervision, A.F.; project administration, C.E.; funding acquisition, C.E. All authors have read and agreed to the published version of the manuscript.
Funding
This publication was written at Virtual Vehicle Research GmbH in Graz. The authors would like to acknowledge the financial support within the COMET K2—Competence Center for Excellent Technologies Program of the Federal Ministry for Transport, Innovation and Technology (BMVIT), the Federal Ministry for Digital and Economic Affairs (BMDW), the Austrian Research Promotion Agency (FFG), the Province of Styria and the Styrian Business Promotion Agency (SFG).
Institutional Review Board Statement
Not applicable.
Informed Consent Statement
Not applicable.
Data Availability Statement
Not applicable.
Conflicts of Interest
The authors declare no conflict of interest.
Abbreviations
| LIB | lithium-ion battery |
| EV | electric vehicle |
| BEV | battery electric vehicle |
| HEV | hybrid electric vehicles |
| PHEV | plug-in hybrid vehicles |
| FCEV | fuel cell electric vehicles |
| TR | thermal runaway |
| FTIR | Fourier-transform infrared (spectroscopy) |
| GC | gas chromatography |
| SOC | state-of-charge |
| SOH | state-of-health |
| SEI | solid electrolyte interface |
| CEI | cathode electrolyte interface |
| OCV | open circuit voltage |
| EC | ethylene carbonate |
| DMC | dimethyl carbonate |
| DEC | diethylene carbonate |
| EMC | ethyl methyl carbonate |
| NMC | LiNiMnCoO2 |
| NCA | LiNiCoAlO2 |
| LMO | LiMn2O4 |
| LFP | LiFePO4 |
| LCO | LiCoO2 |
| LLI | loss of mobile Li inventory |
| LAM | loss of active material |
References
- Winter, M.; Barnett, B.; Xu, K. Before Li Ion Batteries. Chem. Rev. 2018, 118, 11433–11456. [Google Scholar] [CrossRef]
- Nowak, S.; Winter, M. Elemental analysis of lithium ion batteries. J. Anal. At. Spectrom. 2017, 32, 1833–1847. [Google Scholar] [CrossRef]
- Besenhard, J.O.; Winter, M. Insertion reactions in advanced electrochemical energy storage. Pure Appl. Chem. 1998, 70, 603–608. [Google Scholar] [CrossRef] [Green Version]
- Winter, M.; Brodd, R.J. What are batteries, fuel cells, and supercapacitors? Chem. Rev. 2004, 104, 4245–4269. [Google Scholar] [CrossRef] [Green Version]
- Wagner, I. Projected Vehicle Sales in China, the U.S. and the EU between 2017 and 2030, by Propulsion Technology. Statista 2017, statistic_id264754. Available online: https://0-www-statista-com.brum.beds.ac.uk/statistics/264754/worldwide-vehicle-sales-by-propulsion-technology-2025/ (accessed on 2 March 2020).
- Ahlswede, A. Absatz von Batterieelektro- und Plug-in-Hybrid-Automobilen in Ausgewählten Märkten Weltweit in den Jahren 2015 bis 2019. Statista 2020, statistic_id681259. Available online: https://de.statista.com/statistik/daten/studie/681259/umfrage/absatz-von-elektroautos-in-ausgewaehlten-maerkten-weltweit/ (accessed on 2 March 2020).
- Essl, C.; Golubkov, A.W.; Gasser, E.; Nachtnebel, M.; Zankel, A.; Ewert, E.; Fuchs, A. Comprehensive hazard analysis of failing automotive Lithium-ion batteries in overtemperature experiments. Batteries 2020, 6, 30. [Google Scholar] [CrossRef]
- Sun, P.; Bisschop, R.; Niu, H.; Huang, X. A Review of Battery Fires in Electric Vehicles; Springer: New York, NY, USA, 2020. [Google Scholar] [CrossRef]
- Pfrang, A.; Kriston, A.; Ruiz, V.; Lebedeva, N.; di Persio, F. Chapter Eight—Safety of Rechargeable Energy Storage Systems with a focus on Li-ion Technology. In Emerging Nanotechnologies in Rechargeable Energy Storage Systems; Elsevier Inc.: Amsterdam, The Netherlands, 2017; Volume 1, pp. 253–290. [Google Scholar] [CrossRef]
- Spotnitz, R.; Franklin, J. Abuse behavior of high-power, lithium-ion cells. J. Power Sources 2003, 113, 81–100. [Google Scholar] [CrossRef]
- Bandhauer, T.M.; Garimella, S.; Fuller, T.F. A Critical Review of Thermal Issues in Lithium-Ion Batteries. J. Electrochem. Soc. 2011, 158, R1–R25. [Google Scholar] [CrossRef]
- Wang, Q.; Sun, J.; Yao, X.; Chen, C. Thermal Behavior of Lithiated Graphite with Electrolyte in Lithium-Ion Batteries. J. Electrochem. Soc. 2006, 153, A329–A333. [Google Scholar] [CrossRef]
- Essl, C.; Golubkov, A.W.; Fuchs, A. Comparing Different Thermal Runaway Triggers for Two Automotive Lithium-Ion Battery Cell Types. J. Electrochem. Soc. 2020, 167, 1–13. [Google Scholar] [CrossRef]
- Bisschop, R.; Willstrand, O.; Amon, F.; Rosengren, M. Fire Safety of Lithium-Ion Batteries in Road Vehicles; RISE Research Institutes of Sweden: Borås, Sweden, 2019.
- Isidore, C. Are electric cars more likely to catch fire? CNNMoney (New York), 2018. Available online: https://money.cnn.com/2018/05/17/news/companies/electric-car-fire-risk/index.html(accessed on 16 December 2020).
- Skarics, R. Wie oft Brennen Elektroautos im Vergleich zu Fahrzeugen mit Verbrennungsmotor. Available online: https://autorevue.at/ratgeber/statistik-brennen-elektroautos (accessed on 16 December 2020).
- Larsson, F.; Anderson, P.; Mellander, B.-E. Are Electric Vehicles Safer Than Combustion Engine Vehicles. In Systems Perspectives on Electromobility; Chalmers University of Technology: Gothenburg, Sweden, 2013; pp. 33–44. [Google Scholar]
- Birkl, C.R.; Roberts, M.R.; McTurk, E.; Bruce, P.G.; Howey, D.A. Degradation diagnostics for lithium ion cells. J. Power Sources 2017, 341, 373–386. [Google Scholar] [CrossRef]
- Vortmann-Westhoven, B.; Winter, M.; Nowak, S. Where is the lithium? Quantitative determination of the lithium distribution in lithium ion battery cells: Investigations on the influence of the temperature, the C-rate and the cell type. J. Power Sources 2017, 346, 63–70. [Google Scholar] [CrossRef]
- Ren, D.; Hsu, H.; Li, R.; Feng, X.; Guo, D.; Han, X.; Lu, L.; He, X.; Gao, S.; Hou, J.; et al. A comparative investigation of aging effects on thermal runaway behavior of lithium-ion batteries. eTransportation 2019, 2, 1–13. [Google Scholar] [CrossRef]
- Ramadass, P.; Haran, B.; White, R.; Popov, B.N. Capacity fade of Sony 18650 cells cycled at elevated temperatures: Part I. Cycling performance. J. Power Sources 2002, 112, 606–613. [Google Scholar] [CrossRef] [Green Version]
- Barai, A.; Tangirala, R.; Uddin, K.; Chevalier, J.; Guo, Y.; McGordon, A.; Jennings, P. The effect of external compressive loads on the cycle lifetime of lithium-ion pouch cells. J. Energy Storage 2017, 13, 211–219. [Google Scholar] [CrossRef] [Green Version]
- Evertz, M.; Kasnatscheew, J.; Winter, M.; Nowak, S. Investigation of various layered lithium ion battery cathode materials by plasma- and X-ray-based element analytical techniques. Anal. Bioanal. Chem. 2019, 411, 277–285. [Google Scholar] [CrossRef] [PubMed]
- Broussely, M.; Biensan, P.; Bonhomme, F.; Blanchard, P.; Herreyre, S.; Nechev, K.; Staniewicz, R.J. Main aging mechanisms in Li ion batteries. J. Power Sources 2005, 146, 90–96. [Google Scholar] [CrossRef]
- Müller, V.; Scurtu, R.G.; Memm, M.; Danzer, M.A.; Wohlfahrt-Mehrens, M. Study of the influence of mechanical pressure on the performance and aging of Lithium-ion battery cells. J. Power Sources 2019, 440, 1–11. [Google Scholar] [CrossRef]
- Peabody, C.; Arnold, C.B. The role of mechanically induced separator creep in lithium-ion battery capacity fade. J. Power Sources 2011, 196, 8147–8153. [Google Scholar] [CrossRef]
- Dubarry, M.; Truchot, C.; Liaw, B.Y. Synthesize battery degradation modes via a diagnostic and prognostic model. J. Power Sources 2012, 219, 204–216. [Google Scholar] [CrossRef]
- Feng, X.; Ren, D.; Zhang, S.; He, X.; Wang, L.; Ouyang, M. Influence of aging paths on the thermal runaway features of lithium-ion batteries in accelerating rate calorimetry tests. Int. J. Electrochem. Sci. 2019, 14, 44–58. [Google Scholar] [CrossRef]
- Deng, J.; Bae, C.; Marcicki, J.; Masias, A.; Miller, T. Safety modelling and testing of lithium-ion batteries in electrified vehicles. Nat. Energy 2018, 3, 261–266. [Google Scholar] [CrossRef]
- Andersson, P.; Anderson, J.; Larsson, F.; Mellander, B.-E. Modelling of thermal events in Lithium-ion batteries. In Proceedings of the 2nd IAFSS European Symposium of Fire Safety Science, Nicosia, Cyprus, 8 September 2014; pp. 1–5. [Google Scholar]
- Golubkov, A.W.; Planteu, R.; Krohn, P.; Rasch, B.; Brunnsteiner, B.; Thaler, A.; Hacker, V. Thermal runaway of large automotive Li-ion batteries. RSC Adv. 2018, 8, 40172–40186. [Google Scholar] [CrossRef] [Green Version]
- Larsson, F. Assessment of Safety Characteristics for Li-Ion Battery Cells by Abuse Testing. Ph.D. Thesis, Chalmers University of Technology, Gothenburg, Sweden, 2014. [Google Scholar]
- Fernandes, Y.; Bry, A.; de Persis, S. Identification and quantification of gases emitted during abuse tests by overcharge of a commercial Li-ion battery. J. Power Sources 2018, 389, 106–119. [Google Scholar] [CrossRef]
- Somandepalli, V.; Marr, K.; Horn, Q. Quantification of Combustion Hazards of Thermal Runaway Failures in Lithium-Ion Batteries. SAE Int. J. Altern. Powertrains 2014, 3, 98–104. [Google Scholar] [CrossRef]
- Diaz, F.; Wang, Y.; Weyhe, R.; Friedrich, B. Gas generation measurement and evaluation during mechanical processing and thermal treatment of spent Li-ion batteries. Waste Manag. 2019, 84, 102–111. [Google Scholar] [CrossRef]
- Golubkov, A.W.; Scheikl, S.; Planteu, R.; Voitic, G.; Wiltsche, H.; Stangl, C.; Fauler, G.; Thaler, A.; Hacker, V. Thermal runaway of commercial 18650 Li-ion batteries with LFP and NCA cathodes—Impact of state of charge and overcharge. RSC Adv. 2015, 5, 57171–57186. [Google Scholar] [CrossRef] [Green Version]
- Koch, S.; Fill, A.; Birke, K.P. Comprehensive gas analysis on large scale automotive lithium-ion cells in thermal runaway. J. Power Sources 2018, 398, 106–112. [Google Scholar] [CrossRef]
- Zhao, C.; Sun, J.; Wang, Q. Thermal runaway hazards investigation on 18650 lithium-ion battery using extended volume accelerating rate calorimeter. J. Energy Storage 2020, 28, 1–9. [Google Scholar] [CrossRef]
- Feng, X.; Zheng, S.; Ren, D.; He, X.; Wang, L.; Liu, X.; Li, M.; Ouyang, M. Key characteristics for thermal runaway of Li-ion batteries. Energy Procedia 2019, 158, 4684–4689. [Google Scholar] [CrossRef]
- Golubkov, A.W.; Fuchs, D.; Wagner, J.; Wiltsche, H.; Stangl, C.; Fauler, G.; Voitic, G.; Thaler, A.; Hacker, V. Thermal-runaway experiments on consumer Li-ion batteries with metal-oxide and olivin-type cathodes. RSC Adv. 2014, 4, 3633–3642. [Google Scholar] [CrossRef] [Green Version]
- Roth, E.P.; Orendorff, C.J. How electrolytes influence battery safety. Electrochem. Soc. Interface 2012, 21, 45–49. [Google Scholar] [CrossRef]
- Nagasubramanian, G.; Fenton, K. Reducing Li-ion safety hazards through use of non-flammable solvents and recent work at Sandia National Laboratories. Electrochim. Acta 2013, 101, 3–10. [Google Scholar] [CrossRef]
- Roth, E.P.; Doughty, D.H.; Franklin, J. DSC investigation of exothermic reactions occurring at elevated temperatures in lithium-ion anodes containing PVDF-based binders. J. Power Sources 2004, 134, 222–234. [Google Scholar] [CrossRef]
- Kumai, K.; Miyashiro, H.; Kobayashi, Y.; Takei, K.; Ishikawa, R. Gas generation mechanism due to electrolyte decomposition in commercial lithium-ion cell. J. Power Sources 1999, 81–82, 715–719. [Google Scholar] [CrossRef]
- Perea, A.; Paolella, A.; Dubé, J.; Champagne, D.; Mauger, A.; Zaghib, K. State of charge influence on thermal reactions and abuse tests in commercial lithium-ion cells. J. Power Sources 2018, 399, 392–397. [Google Scholar] [CrossRef]
- Waldmann, T.; Wohlfahrt-Mehrens, M. Effects of rest time after Li plating on safety behavior—ARC tests with commercial high-energy 18650 Li-ion cells. Electrochim. Acta 2017. [Google Scholar] [CrossRef]
- Li, Y.; Feng, X.; Ren, D.; Ouyang, M.; Lu, L.; Han, X. Thermal Runaway Triggered by Plated Lithium on the Anode after Fast Charging. ACS Appl. Mater. Interfaces 2019, 11, 46839–46850. [Google Scholar] [CrossRef]
- Zhang, J.; Su, L.; Li, Z.; Sun, Y.; Wu, N. The evolution of lithium-ion cell thermal safety with aging examined in a battery testing calorimeter. Batteries 2016, 2, 12. [Google Scholar] [CrossRef] [Green Version]
- Röder, P.; Stiaszny, B.; Ziegler, J.C.; Baba, N.; Lagaly, P.; Wiemhöfer, H.D. The impact of calendar aging on the thermal stability of a LiMn 2O4-Li(Ni1/3Mn1/3Co 1/3)O2/graphite lithium-ion cell. J. Power Sources 2014, 268, 315–325. [Google Scholar] [CrossRef]
- Fleischhammer, M.; Waldmann, T.; Bisle, G.; Hogg, B.I.; Wohlfahrt-Mehrens, M. Interaction of cyclic ageing at high-rate and low temperatures and safety in lithium-ion batteries. J. Power Sources 2015, 274, 432–439. [Google Scholar] [CrossRef]
- Essl, C.; Golubkov, A.W.; Planteu, R.; Rasch, B.; Fuchs, A. Transport of Li-Ion Batteries: Early Failure Detection by Gas Composition Measurements. In Proceedings of the 7th Transport Research Arena, Vienna, Austria, 16 April 2018; pp. 1–10. [Google Scholar] [CrossRef]
- Redondo-Iglesias, E.; Venet, P.; Pelissier, S. Eyring acceleration model for predicting calendar ageing of lithium-ion batteries. J. Energy Storage 2017, 13, 176–183. [Google Scholar] [CrossRef] [Green Version]
- Bloom, I.; Cole, B.W.; Sohn, J.J.; Jones, S.A.; Polzin, E.G.; Battaglia, V.S.; Henriksen, G.L.; Motloch, C.; Richardson, R.; Unkelhaeuser, T.; et al. An accelerated calendar and cycle life study of Li-ion cells. J. Power Sources 2001, 101, 238–247. [Google Scholar] [CrossRef]
- Broussely, M.; Herreyre, S.; Biensan, P.; Kasztejna, P.; Nechev, K.; Staniewicz, R.J. Aging mechanism in Li ion cells and calendar life predictions. J. Power Sources 2001, 97–98, 13–21. [Google Scholar] [CrossRef]
- Waldmann, T.; Wilka, M.; Kasper, M.; Fleischhammer, M.; Wohlfahrt-Mehrens, M. Temperature dependent ageing mechanisms in Lithium-ion batteries—A Post-Mortem study. J. Power Sources 2014, 262, 129–135. [Google Scholar] [CrossRef]
- Vetter, J.; Novák, P.; Wagner, M.R.; Veit, C.; Möller, K.C.; Besenhard, J.O.; Winter, M.; Wohlfahrt-Mehrens, M.; Vogler, C.; Hammouche, A. Ageing mechanisms in lithium-ion batteries. J. Power Sources 2005, 147, 269–281. [Google Scholar] [CrossRef]
- Wohlfahrt-Mehrens, M.; Vogler, C.; Garche, J. Aging mechanisms of lithium cathode materials. J. Power Sources 2004, 127, 58–64. [Google Scholar] [CrossRef]
- Waldmann, T.; Hogg, B.-I.; Kasper, M.; Grolleau, S.; Couceiro, C.G.; Trad, K.; Matadi, B.P.; Wohlfahrt-Mehrens, M. Interplay of Operational Parameters on Lithium Deposition in Lithium-Ion Cells: Systematic Measurements with Reconstructed 3-Electrode Pouch Full Cells. J. Electrochem. Soc. 2016, 163, A1232–A1238. [Google Scholar] [CrossRef]
- Börner, M.; Friesen, A.; Grützke, M.; Stenzel, Y.P.; Brunklaus, G.; Haetge, J.; Nowak, S.; Schappacher, F.M.; Winter, M. Correlation of aging and thermal stability of commercial 18650-type lithium ion batteries. J. Power Sources 2017, 342, 382–392. [Google Scholar] [CrossRef]
- Xie, S.; Ren, L.; Yang, X.; Wang, H.; Sun, Q.; Chen, X.; He, Y. Influence of cycling aging and ambient pressure on the thermal safety features of lithium-ion battery. J. Power Sources 2020, 448, 1–8. [Google Scholar] [CrossRef]
- Liu, Q.Q.; Xiong, D.J.; Petibon, R.; Du, C.Y.; Dahn, J.R. Gas Evolution during Unwanted Lithium Plating in Li-Ion Cells with EC-Based or EC-Free Electrolytes. J. Electrochem. Soc. 2016, 163, A3010–A3015. [Google Scholar] [CrossRef]
- Blomgren, G.E. Electrolytes for advanced batteries. J. Power Sources 1999, 81–82, 112–118. [Google Scholar] [CrossRef]
- Chen, S.; Wang, Z.; Yan, W. Identification and characteristic analysis of powder ejected from a lithium ion battery during thermal runaway at elevated temperatures. J. Hazard. Mater. 2020, 400, 1–12. [Google Scholar] [CrossRef]
- Nedjalkov, A.; Meyer, J.; Köhring, M.; Doering, A.; Angelmahr, M.; Dahle, S.; Sander, A.; Fischer, A.; Schade, W. Toxic Gas Emissions from Damaged Lithium Ion Batteries—Analysis and Safety Enhancement Solution. Batteries 2016, 2, 5. [Google Scholar] [CrossRef]
- Wu, K.; Yang, J.; Liu, Y.; Zhang, Y.; Wang, C.; Xu, J.; Ning, F.; Wang, D. Investigation on gas generation of Li4Ti5O 12/LiNi1/3Co1/3Mn1/3O2 cells at elevated temperature. J. Power Sources 2013, 237, 285–290. [Google Scholar] [CrossRef]
- Gachot, G.; Ribière, P.; Mathiron, D.; Grugeon, S.; Armand, M.; Leriche, J.B.; Pilard, S.; Laruelle, S. Gas chromatography/mass spectrometry as a suitable tool for the li-ion battery electrolyte degradation mechanisms study. Anal. Chem. 2011, 83, 478–485. [Google Scholar] [CrossRef]
- Onuki, M.; Kinoshita, S.; Sakata, Y.; Yanagidate, M.; Otake, Y.; Ue, M.; Deguchi, M. Identification of the Source of Evolved Gas in Li-Ion Batteries Using 13C-labeled Solvents. J. Electrochem. Soc. 2008, 155, A794–A797. [Google Scholar] [CrossRef]
- Gachot, G.; Grugeon, S.; Jimenez-Gordon, I.; Eshetu, G.G.; Boyanov, S.; Lecocq, A.; Marlair, G.; Pilard, S.; Laruelle, S. Gas chromatography/Fourier transform infrared/mass spectrometry coupling: A tool for Li-ion battery safety field investigation. Anal. Methods 2014, 15, 6120–6124. [Google Scholar] [CrossRef]
- Huang, P.; Wang, Q.; Li, K.; Ping, P.; Sun, J. The combustion behavior of large scale lithium titanate battery. Sci. Rep. 2015, 5, 1–12. [Google Scholar] [CrossRef] [Green Version]
- Doughty, D.H.; Roth, E.P.; Crafts, C.C.; Nagasubramanian, G.; Henriksen, G.; Amine, K. Effects of additives on thermal stability of Li ion cells. J. Power Sources 2005, 146, 116–120. [Google Scholar] [CrossRef]
- Yang, H.; Zhuang, G.V.; Ross, P.N. Thermal stability of LiPF6 salt and Li-ion battery electrolytes containing LiPF6. J. Power Sources 2006, 161, 573–579. [Google Scholar] [CrossRef] [Green Version]
- Aurbach, D.; Weissman, I.; Zaban, A.; Dan, P. On the role of water contamination in rechargeable Li batteries. Electrochim. Acta 1999, 45, 1135–1140. [Google Scholar] [CrossRef]
- Du Pasquier, A.; Disma, F.; Bowmer, T.; Gozdz, A.S.; Amatucci, G.; Tarascon, J.-M. Differential Scanning Calorimetry Study of the Reactivity of Carbon Anodes in Plastic Li-Ion Batteries. J. Electrochem. Soc. 1998, 145, 472–477. [Google Scholar] [CrossRef]
- Todeschini, F.; Onori, S.; Rizzoni, G. An experimentally validated capacity degradation model for Li-ion batteries in PHEVs applications. IFAC Proc. Vol. 2012, 8, 456–461. [Google Scholar] [CrossRef]
- Barré, A.; Deguilhem, B.; Grolleau, S.; Gérard, M.; Suard, F.; Riu, D. A review on lithium-ion battery ageing mechanisms and estimations for automotive applications. J. Power Sources 2013, 241, 680–689. [Google Scholar] [CrossRef] [Green Version]
- Baghdadi, I.; Briat, O.; Delétage, J.Y.; Gyan, P.; Vinassa, J.M. Lithium battery aging model based on Dakin’s degradation approach. J. Power Sources 2016, 325, 273–285. [Google Scholar] [CrossRef]
- Petit, M.; Prada, E.; Sauvant-Moynot, V. Development of an empirical aging model for Li-ion batteries and application to assess the impact of Vehicle-to-Grid strategies on battery lifetime. Appl. Energy 2016, 172, 398–407. [Google Scholar] [CrossRef]
- Cannarella, J.; Arnold, C.B. Stress evolution and capacity fade in constrained lithium-ion pouch cells. J. Power Sources 2014, 245, 745–751. [Google Scholar] [CrossRef]
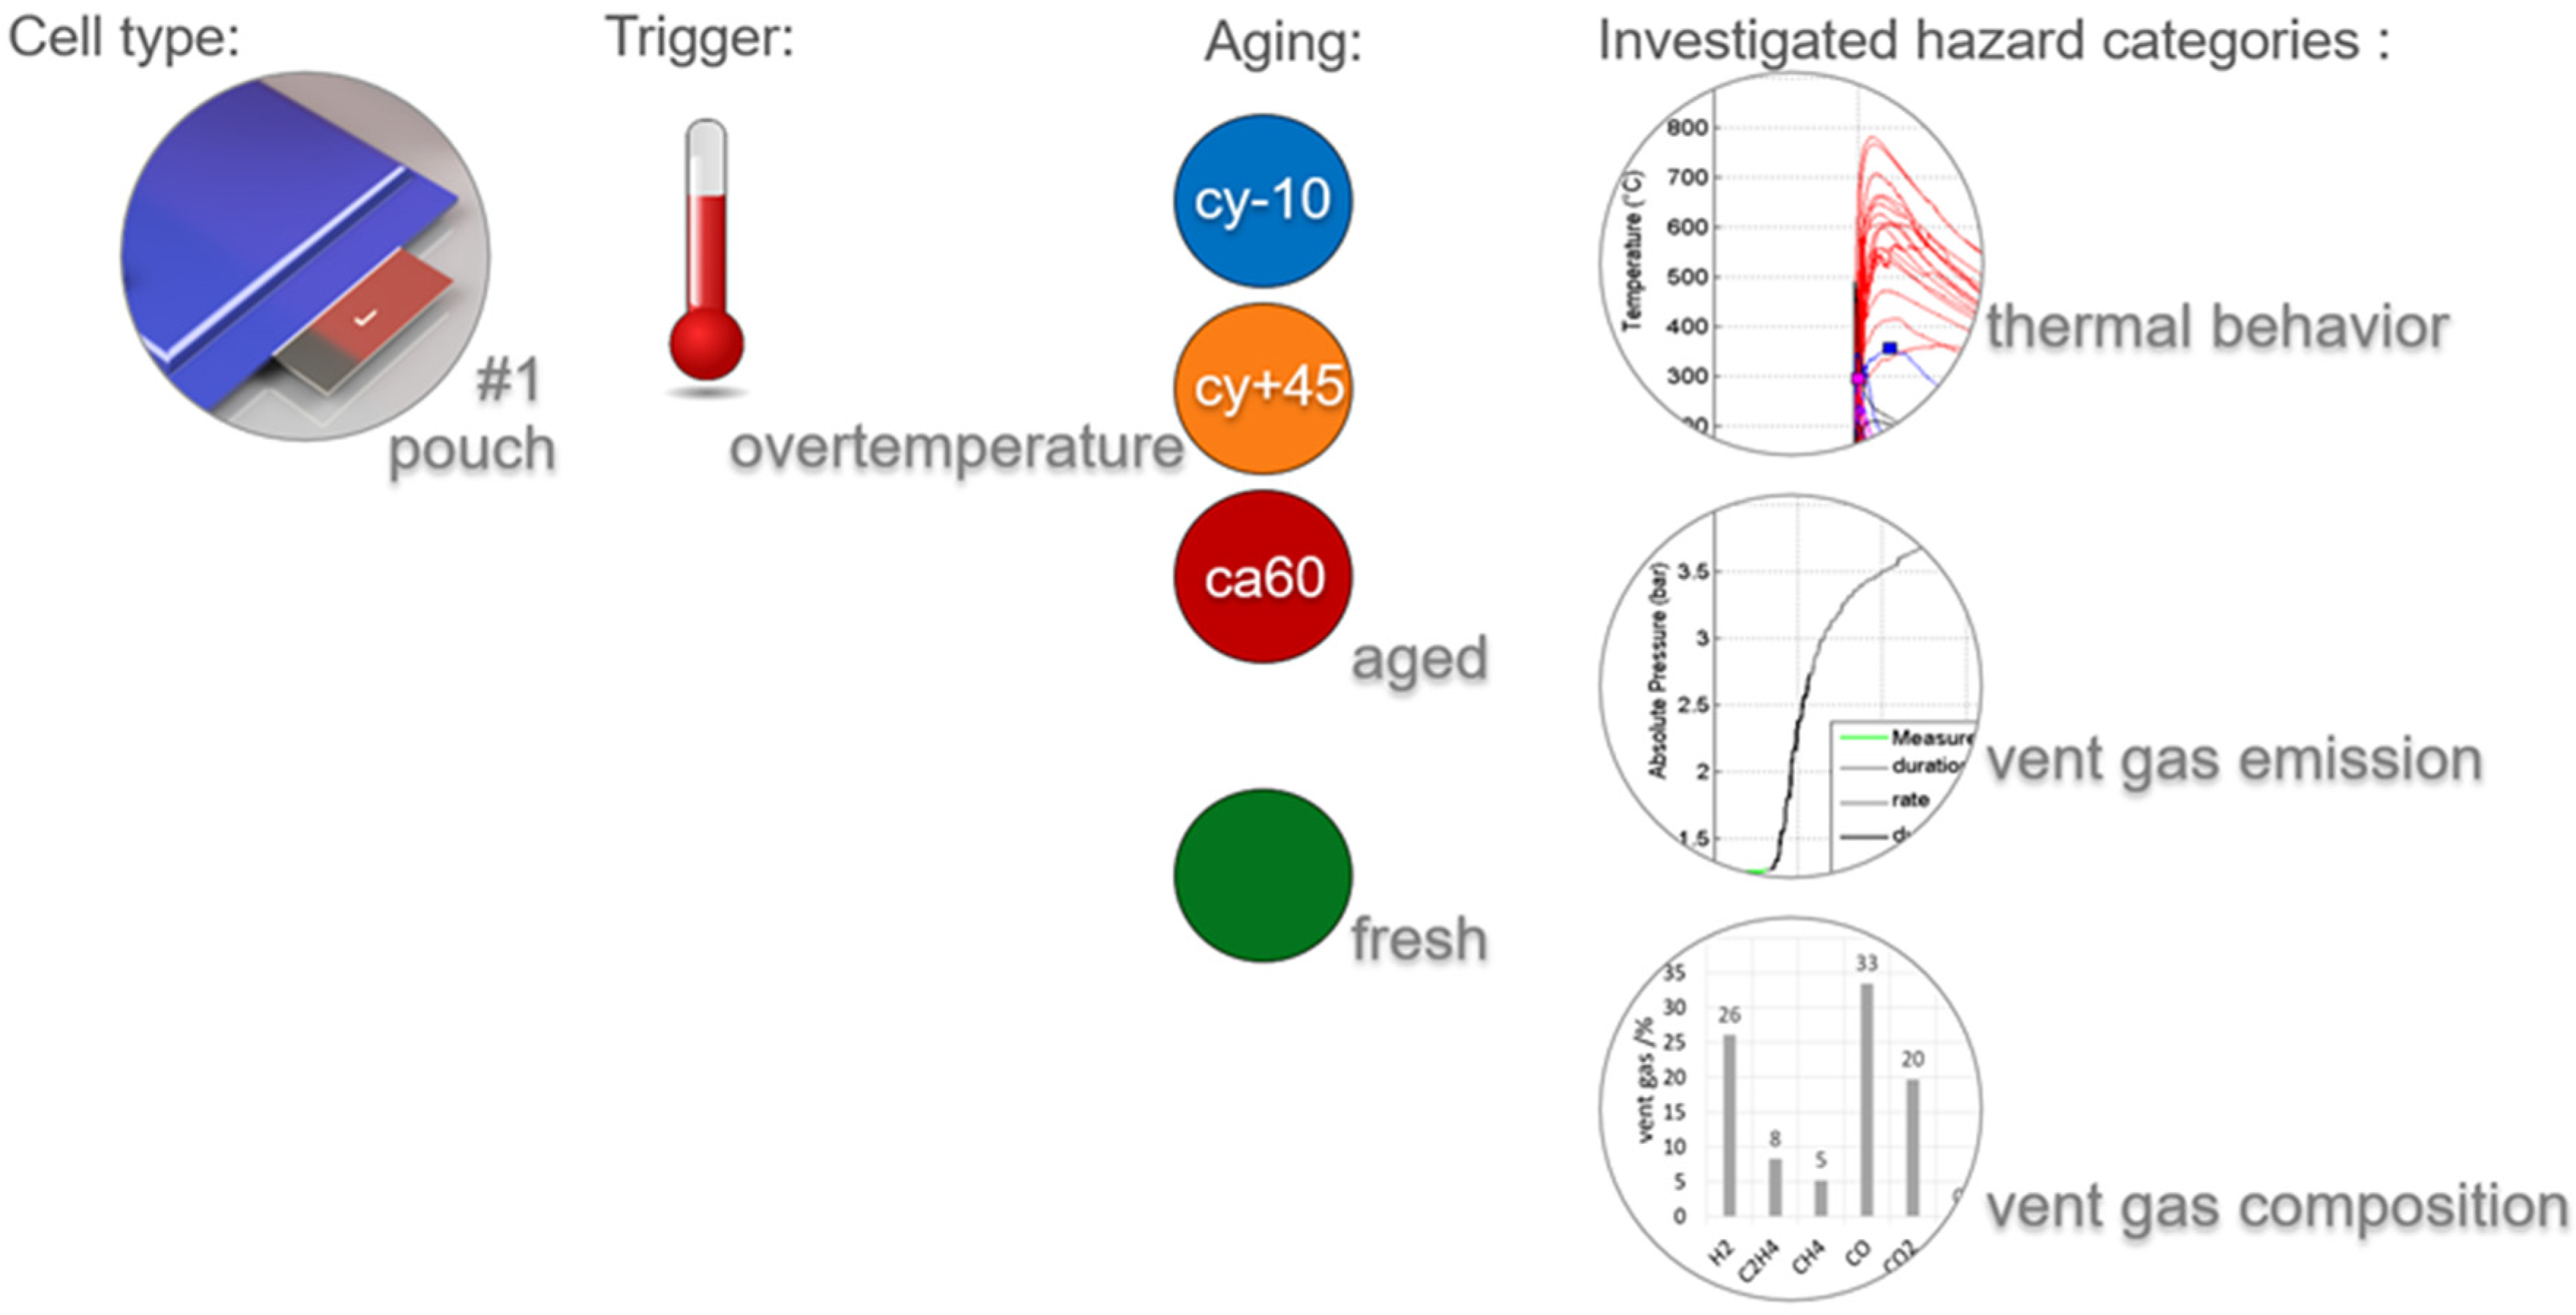
Figure 1.
Design of experiment—Influence of different aging paths on the failing behavior of cell type #1. Three different aging paths were investigated (cyclic aging at −10 °C (cy−10) and at 45 °C (cy+45) and calendric aging at 60 °C (ca60)) and compared with the results of fresh cells. The results were discussed in three main hazard categories: thermal behavior, vent gas emission, and vent gas composition. Each cell was charged to 100% SOC and was tested using overtemperature trigger.

Figure 2.
Design of experiment to investigate the influence of aging on the failing behavior: In total, five aged and two fresh #1 pouch cells were triggered into thermal runaway (TR) using overtemperature TR trigger.
Figure 2.
Design of experiment to investigate the influence of aging on the failing behavior: In total, five aged and two fresh #1 pouch cells were triggered into thermal runaway (TR) using overtemperature TR trigger.

Figure 3.
Comparison of safety relevant thermal parameters in overtemperature triggered TR of fresh (green) and aged (cy−10: blue, cy+45: orange, ca60: red) #1 cells. (a) The measured capacity of the cells immediately before the TR experiment; the average cell surface temperature at (b) the first venting and at (c) the second venting; (d) the maximal measured temperature on the cell surface.

Figure 4.
Vent gas emission during overtemperature TR experiments of aged cells (cy−10: blue, cy+45: orange, ca60: red) compared to fresh cells (green): (a) vent gas emission nv1 starting at and ending at (b) vent gas emission nv2, (c) current capacity of aged and fresh cells versus the total vent gas emission; (d) the total vent gas emission per Ah.

Figure 5.
Vent gas composition after the first venting of aged type #1 cells (cy−10: blue, cy+45: orange, ca60: red) in overtemperature experiments in comparison to the results of fresh cells (green). (a) Measured gas concentration (in vol.%) inside the reactor ranked according to the time between the venting and the gas measurement; (b) calculated vent gas composition in vol.% (presenting the battery vent gases only).

Figure 6.
Vent gas composition in vol.% after the TR of aged type #1 cells (cy−10: blue, cy+45: orange, ca60: red) in overtemperature experiments in comparison to the results of fresh cells (green).
Figure 6.
Vent gas composition in vol.% after the TR of aged type #1 cells (cy−10: blue, cy+45: orange, ca60: red) in overtemperature experiments in comparison to the results of fresh cells (green).

Figure 7.
Vent gas composition in mol after the TR of aged type #1 cells (cy−10: blue, cy+45: orange, ca60: red) in overtemperature experiments in comparison to the results of fresh cells (green).
Figure 7.
Vent gas composition in mol after the TR of aged type #1 cells (cy−10: blue, cy+45: orange, ca60: red) in overtemperature experiments in comparison to the results of fresh cells (green).

Figure 8.
(a) Current capacity (Ah) of aged cells versus the amount of produced CO (mol) (b) mass reduction after TR of the aged (cy−10: blue, cy+45: orange, ca60: red) type #1 cells in comparison to the fresh type #1 cells (green).
Figure 8.
(a) Current capacity (Ah) of aged cells versus the amount of produced CO (mol) (b) mass reduction after TR of the aged (cy−10: blue, cy+45: orange, ca60: red) type #1 cells in comparison to the fresh type #1 cells (green).


Table 1.
Specification of the investigated automotive Li-ion cells.
| Parameter | Cell Type #1 |
|---|---|
| Design | pouch |
| Cathode Material | NMC |
| Anode Material | graphite |
| Electrolyte | EC:EMC (1:1) |
| Capacity | 60 |
| Nominal Voltage | 3.6 V |
| Gravimetric Energy Density | 250 Wh/kg |
| Aging State | fresh and aged |
| Start State-of-Charge (SOC) | 100% |
Table 2.
Key parameters of the aging experiments using cell type #1.
| Aging Description | Abbr. | T/°C | SOC/% | Charge C/A | Discharge C/A | ∆SOC/% | Days | Nr. of Cycles | State-of-Health (SOH)/% |
|---|---|---|---|---|---|---|---|---|---|
| Calendric 60 °C | ca60 | 60 | 100 | - | - | - | 150 | - | 94 |
| Cycling −10 °C | cy−10 | −10 | - | 12 | 20 | 0–100 | - | 800 | 85 ± 2 |
| Cycling 45 °C | cy+45 | 45 | - | 20 | 20 | 0–100 | - | 1000 | 76 ± 3 |
Table 3.
Thermal parameters of failing aged cell type #1 cells in overtemperature abuse tests in comparison to fresh cells.
Table 3.
Thermal parameters of failing aged cell type #1 cells in overtemperature abuse tests in comparison to fresh cells.
| Aged Cy−10 Cell Type #1 | Aged Cy+45 Cell Type #1 | Aged Ca60 Cell Type #1 | Fresh Cell Type #1 | |
|---|---|---|---|---|
| (°C) | 119 ± 5 | 123 ± 1 | 124 | 122 ± 1 |
| (°C) | 199 ± 4 | 217 ± 2 | 203 | 206 ± 1 |
| (°C) | 190 ± 1 | 219 ± 2 | 205 | 204 ± 1 |
| (°C) | 763 ± 5 | 762 ± 9 | 794 | 819 ± 5 |
| (°C) | 982 ± 238 | 934 ± 202 | 1306 | 584 ± 1 |
Table 4.
Summary of safety relevant parameters of differently aged automotive type #1 cells using overtemperature trigger in comparison to the results of fresh cells.
Table 4.
Summary of safety relevant parameters of differently aged automotive type #1 cells using overtemperature trigger in comparison to the results of fresh cells.
| Aged Cy−10 Cell Type #1 | Aged Cy+45 Cell Type #1 | Aged Ca60 Cell Type #1 | Fresh Cell Type #1 | |
|---|---|---|---|---|
| Capacity (Ah) | 51 ± 1 | 45 ± 2 | 57 | 60 |
| First vent | yes | yes | yes | Yes |
| (°C) | 119 ± 5 | 123 ± 1 | 124 | 122 ± 1 |
| Thermal Runaway (TR) | yes | yes | yes | Yes |
| (°C) | 199 ± 4 | 217 ± 2 | 203 | 206 ± 1 |
| (°C) | 190 ± 1 | 219 ± 2 | 205 | 204 ± 1 |
| (°C) | 763 ± 5 | 762 ± 9 | 794 | 819 ± 5 |
| (°C) | 982 ± 238 | 934 ± 202 | 1306 | 584 ± 1 |
| Duration TR venting (s) | 3.0 ± 0.2 | 4.0 ± 1.0 | 2.5 | 3.5 ± 0.1 |
| Amount of gas (mol) | 3.1 ± 0.3 | 2.7 ± 0.3 | 3.4 | 3.8 ± 0.1 |
| Vent gas/capacity (mol/Ah) | 0.061 | 0.060 | 0.060 | 0.063 |
| Venting rate ṅch (l/s) | 39 ± 5 | 25 ± 5 | 42 | 34 ± 2 |
| Main gas compounds | CO2, CO, H2 | CO2, CO, H2 | CO2, CO, H2 | CO2, CO, H2 |
| cH2 (vol.%) | 19 ± 1 | 17 ± 1 | 17 | 16 ± 1 |
| cCO (vol.%) | 24 ± 1 | 23 ± 1 | 28 | 28 ± 1 |
| Mass loss (%) | 40 ± 2 | 35 ± 1 | 42 | 56 ± 1 |
Publisher’s Note: MDPI stays neutral with regard to jurisdictional claims in published maps and institutional affiliations. |
© 2021 by the authors. Licensee MDPI, Basel, Switzerland. This article is an open access article distributed under the terms and conditions of the Creative Commons Attribution (CC BY) license (https://creativecommons.org/licenses/by/4.0/).
Share and Cite
MDPI and ACS Style
Essl, C.; Golubkov, A.W.; Fuchs, A. Influence of Aging on the Failing Behavior of Automotive Lithium-Ion Batteries. Batteries 2021, 7, 23. https://0-doi-org.brum.beds.ac.uk/10.3390/batteries7020023
AMA Style
Essl C, Golubkov AW, Fuchs A. Influence of Aging on the Failing Behavior of Automotive Lithium-Ion Batteries. Batteries. 2021; 7(2):23. https://0-doi-org.brum.beds.ac.uk/10.3390/batteries7020023
Chicago/Turabian StyleEssl, Christiane, Andrey W. Golubkov, and Anton Fuchs. 2021. "Influence of Aging on the Failing Behavior of Automotive Lithium-Ion Batteries" Batteries 7, no. 2: 23. https://0-doi-org.brum.beds.ac.uk/10.3390/batteries7020023
Note that from the first issue of 2016, this journal uses article numbers instead of page numbers. See further details here.