1. Introduction
When developing a lithium-ion cell chemistry, it is necessary to produce prototypes in a fully sized cell format, to provide information on electrochemical performance, energy density, and safety. Before that, the cell chemistry is first optimised in a smaller format test cell, typically coin cells or an equivalent. The cell technology is then scaled up to a fully engineered stacked or wound prototype [
1]. This approach is adopted by every lithium-ion cell manufacturer. New active materials, electrolytes or electrode formulations are evaluated on a small scale, and then progressively scaled up to full sized cells. This can be in a cylindrical, prismatic or soft pouch enclosure [
1], depending on the target application and previous capital investment in specific cell making equipment.
There is always a dilemma about when to transition from a test cell format to a fully engineered cell. Generally, confidence in performance extrapolation from coin cells to prototype cells is low. A key benefit of coin cells is that large numbers of cells can be produced from a single mix, requiring only a few grams of active material. Coin cells provide a very useful comparison, but they have limitations, because of their design and construction. They use a significant excess of electrolyte, and the cell body has a relatively large thermal mass. Both of these can mask problems that will only become evident in a full-sized cell. Additionally, realistic values of energy density and power density can only be measured in a properly engineered stacked or wound cell, though values can be estimated using various modelling approaches, based on coin cell data. Generally, models are good at predicting energy density. Power density can be more difficult to calculate, because of the various different contributions to the overall cell resistance. Manufacturing full size cells requires more materials, to produce double sided coatings, and the various cell making steps also involve much more time and effort. Clearly, it would be useful to be able to predict accurately the performance properties of a stack or wound cell format from a smaller cell format.
In this work, we are developing lithium-ion cells for high power applications like hybrid electric vehicles (HEV). Typically, electrodes for this type of cell have low areal capacities, thicker metal foils, relatively high porosities, and a greater amount of conductive carbon in the electrode formulation [
2]. During cell development, it is useful to know whether the performance measured in coin cells is representative of full-sized cells. Therefore, cells have been made in three cell formats, using the same electrode coatings. This avoided the scale up issues that are associated with mixing and coating [
3]. The cell types are coin cells, stacked pouch cells, and as an intermediate, pouch cells with two single sided electrode pieces. Various properties of these cells are compared in
Table 1.
Performance properties have been studied in cells across different cell formats with a range of scales, as illustrated in
Table 2 [
4,
5,
6,
7,
8,
9]. Similar cycling performance was achieved across three widely ranging cell sizes [
4]. Coin cells were used for accelerated cycle life tests, while pouch cells were used for expansion tests [
5]. The performance of LFP cathodes patterned using very fast laser pulses was similar in Swagelok
® (Solon, OH, USA) and pouch cells [
6]; the pouch cell dimensions were specified in a parallel publication [
10]. In a typical scale up project, coin cells were used to identify promising electrode compositions, and establish optimum cycling protocols [
7]. These were then applied to pouch cells, which were subjected to a range of tests including rate tests, hybrid pulse power characterisation (HPPC) [
11], and cycling tests. By way of contrast, the specification for a full-sized cell with a high energy density was used to work backwards to a coin cell specification [
8]. This required lithium foil (<50 um, not 250 um), a high areal capacity (>3.5 mA h cm
−2) and a low quantity of electrolyte (<3 g (A h)
−1). It is much easier to achieve long cycle life in a coin cell using thick lithium metal foils, low coat weight cathodes, and a significant excess of electrolyte. It can be difficult to make direct like for like comparisons of electrolyte quantity across cell formats because there is much more void space or dead volume (proportionately) in a coin cell than a stacked pouch cell [
12,
13].
In development work on lithium/sulphur cells, different degradation mechanisms were identified in the different cell formats [
9]. In coin cells, the lithium polysulphide shuttle mechanism was the main issue. However, in pouch cells, the lithium metal was a greater problem, with the formation of dendrites, and ultimately powdering of the electrode material.
There are also cell format studies over a much narrower range of scales. For example, graphite + 8 wt% nano-silicon anodes and NMC-811 cathodes were used to make 0.75 A h pouch cells and 2.0 A h 18650 cylindrical cells [
14]. The pouch cells were tested under various fixed or flexible pressures, to study the impact on the expansion and contraction of the silicon. The cylindrical cells confirmed the problems of inhomogeneous compression. After testing, electrodes from the pouch cells were extracted, and used to make coin cells and symmetric pouch cells for further characterisation. There are a several other examples where coin cells have been built using electrodes harvested from full sized cells [
15,
16,
17,
18,
19,
20]. This enabled cell level degradation processes to be attributed to one (or both) electrodes.
Various cylindrical cells from 1.5 A h 18650 to 5.0 A h 21700 cells have been compared in two studies [
21,
22]. The energy density depended on the areal capacities of the electrodes but not the cell size. However, using a larger cell size, with a higher capacity, will reduce cell and module manufacturing costs, for the same battery energy. There are various modelling papers that compare properties across the three main formats [
23,
24]. The influence of thermal effects on cycling performance was modelled using a multi-scale, multi-domain framework [
23]. Cell degradation was linked to the average cell temperature, and to non-uniformities in temperature and state of charge across the cells. The outcome of external short circuit tests was modelled using a multi-dimensional modelling approach, with a 2D electrical model and a 3D thermal model [
24]. Cells with a high surface area to volume ratio were most likely to avoid thermal runaway.
Even for relatively simple coin cells, care is required to achieve consistent and useful results. In particular, cell assembly must use a repeatable methodology [
25], and cell testing results need to be averaged over multiple, equivalent cells [
26]. Even with this approach, x-ray spatial profiling revealed differences in compression across the electrode surface, and variable porosity in the polymeric separator [
27]. Greater consistency was obtained for the alternative EL-CELL configuration using automated electrode handling and alignment during cell assembly [
28].
2. Results
After cell formation is complete, the most common test applied to lithium-ion cells is long term cycling. However, there are a wide range of other tests that give useful and complementary information. The effect of discharge rate on discharge capacity is important in many applications. In this study, the rate tests were performed in separate tests, rather than combined with cycling tests. HEV drive cycles involve short charge and discharge pulses, which is a different test from full, continuous discharge, following a low-rate charge. Therefore, short duration charge and discharge pulse tests were performed, at rates up to 50 C. A useful measurement of cell resistance is area specific impedance (ASI). This is also measured with a sequence of short pulses [
29]. The galvanostatic intermittent titration technique (GITT) is an intermediate between the short ASI pulses and full discharge. The voltage transients during a series of fixed current pulses are analysed, to interpret the limiting mechanisms within the cell [
30,
31]. The GITT current density and step durations should be optimised for different cell chemistries [
32].
Batches of ten cells were prepared for each of the three cell formats, based on a cathode capacity of 1 mA h cm
−2 and an excess anode capacity of 10%. In the
Supplementary Materials, properties are calculated for the three cell formats and two different areal capacities. The lower areal capacity is typical for a cell optimised for high power applications, and the higher value for a cell designed for maximum energy density. During the cell assembly processes, the weights of all the components were measured and recorded. As a comparison,
Figure 1a shows the calculated coat weights of the NMC-622 active material in the cathode (gsm = g m
−2). The stacked pouch cells values are the same because an average weight per electrode was used. The larger variation for the coin cells reflects the much smaller electrode area, and fluctuations in coat weight along and across the coating. Coat weight measurements recorded using the Mesys system gave a ±2% variation for the anode coating and ±4% for the cathode coating. This compared to ±1% and ±3%, respectively, for 3 mA h cm
−2 coatings, which were prepared for a parallel project. The systematic trend for the coin cells was due to matching of anode and cathode weights, to maintain a consistent anode: cathode capacity ratio. These coat weights and other measurements from the formation cycle are summarised in
Table 3. The values in brackets are standard deviations. The areal discharge capacities are plotted in
Figure 1b.
The cell voltages recorded during the tests, the actual first cycle loss (FCL) values, and the areal discharge energies are plotted in the
Supplementary Materials. Coin cell 3 and single sided pouch pair cell 6 were defective, and coin cell 1 and single sided pouch pair 1 had low discharge capacities. All four of these cells were excluded from the mean and standard deviation calculations. The lower mean areal capacities for the coin cells reflected the spread of coat weights. The first cycle loss was due to the formation of solid electrolyte interphase (SEI) layer on the surface of the anode particles. The higher FCL for the stacked pouch cells was due to the anode coatings on the outside of the two end pieces in the stack. The average discharge voltage values were obtained by dividing the discharge energy (W hr) by the discharge capacity (A h) [
33]. This value depends mainly on the cell chemistry but also has some contribution from the cell internal resistance.
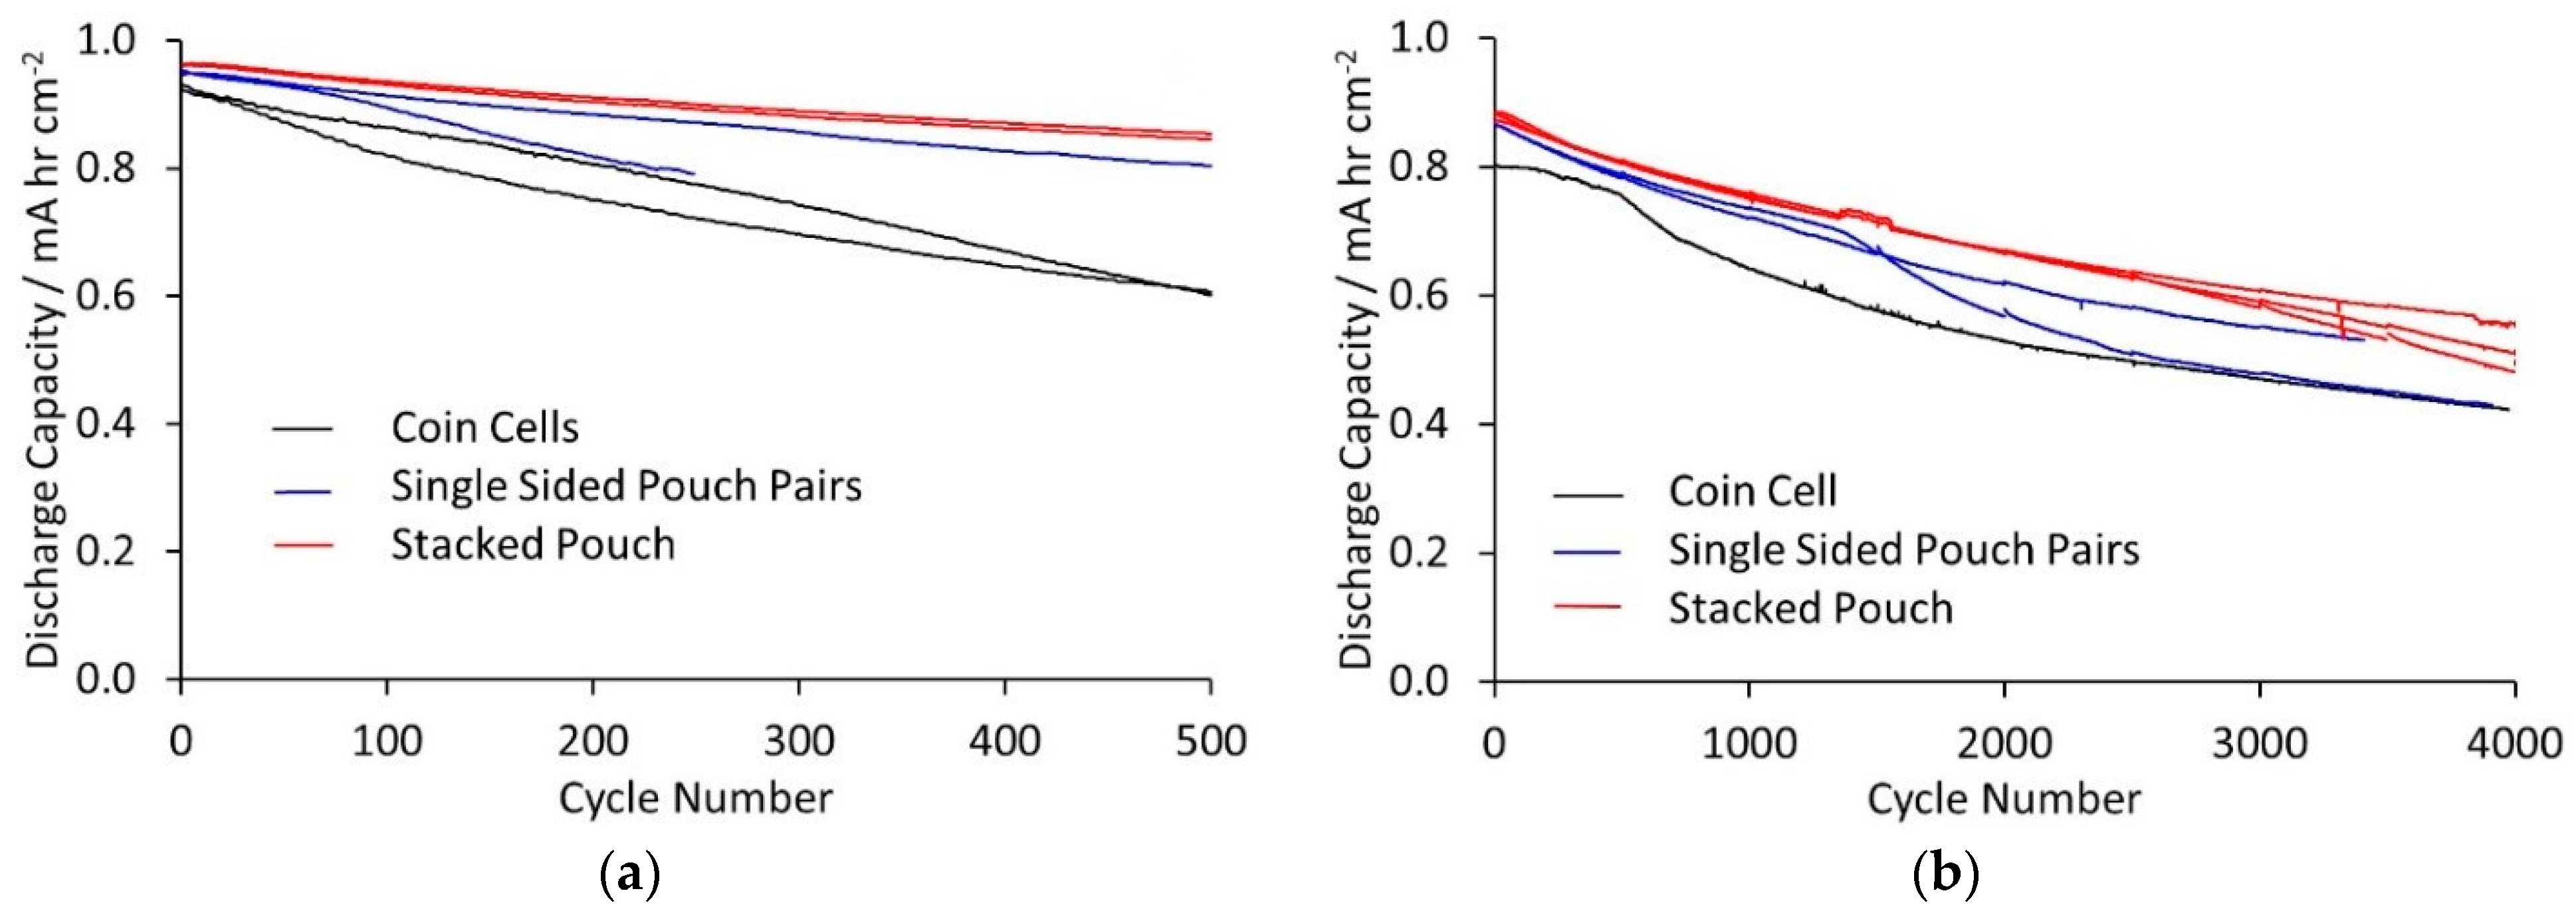
To characterise the cycle life, two test protocols were applied to all three cell types, cycling at ±C/2 and ±3 C. The former is a typical regime for all lithium-ion cells, whereas the latter is more applicable for cells intended for high-rate applications, and also accelerates the degradation processes within the cell. The discharge capacities for the two tests are shown in
Figure 2. Coulombic efficiencies for the tests are given in the
Supplementary Materials. For cycling at ±C/2, the cycles to 80% of initial capacity were 225 and 300 (coin cells), 300 and >500 (single sided pouch cells), and >500 (stacked pouch cells). Linear extrapolation predicted around 1000 cycles to 80% for the stacked pouch cells. The cycle life was better than the coulombic efficiency would suggest. To achieve five hundred cycles above 80% of initial capacity, the average efficiency needs be above 99.955% (0.99955
500 = 0.798). The observed cycle life therefore implies some reversible self-discharge or side reactions that do not consume active lithium [
34]. For cycling at ±3 C, the cycles to 80% of initial capacity were 1000 (coin cell), 1300 and 1400 (single sided pouch cells), and 1550–1675 (stacked pouch cells). Thus, for both tests, capacity retention was clearly best in the stacked pouch cells. One single sided pair cell on each test almost matched the stacks, but the other was closer to the coin cells.
The ±3 C cycle protocol included a cell characterisation test every five hundred cycles; the detailed steps are described in the Materials and Methods section (
Section 4).
Figure 3 shows the 5 C pulses for one of the stacked cells, and the calculated DC resistances for all of the cells. Examples of the 5 C pulses for the other cell types are contained in the
Supplementary Information, along with comparisons before cycling and after one thousand cycles. There was a clear difference between the stacked pouch cells and the other two cell types. For the stacked pouch cells, there was a steady increase in resistance with cycling, along with a slow decline in capacity. For the other cells, there was less increase in resistance up to one thousand cycles. However, beyond this point, the declining capacity meant that the cells were below 3 V after the 60% discharge, making the resistance values unrepresentative.
During cycling, most cells show a loss of active lithium and an increase in their internal resistance. One analytical technique is to calculate the average voltages during charge and discharge [
33]. Loss of active lithium shifts the relative state of charge of the two electrodes and increases the average voltages. An increase in resistance increases the difference between the average charge and discharge voltages. Results for the cells cycled on the ±C/2 protocol are plotted in the
Supplementary Materials. As with the cycling at ±3 C, the coin cells showed predominantly loss of active lithium, and the stacked pouch cells mainly an increase in resistance.
The cells were intended for a high power application and were therefore subjected to resistance and rate performance tests. Area specific impedance (ASI) measurements were made on four-coin cells and four single sided pouch pair cells. The test protocol was based on the Argonne National Laboratory (ANL) methodology [
29] and the requirements of the BatPac model [
35]. To look at the relative contributions of the anode and cathode, equivalent measurements were also made on anode and cathode coin cell half cells. Plots of the cell voltages during the tests and the calculated ASI values are included in the
Supplementary Materials. Average values for each cell are shown in
Figure 4. One of the four coin cells was more resistive than the other three. Overall, the coin cells had slightly higher ASI values than the single pair pouch cells. Both were similar to the initial DC resistances in the ±3 C cycling tests. The ASI values obtained for the coin cell half cells were interesting. As shown in the
Supplementary Materials, there was a large increase in the cathode half cell ASI at low states of charge, so the increase seen in full cell ASI values at low states of charge was clearly due to the cathode. However, the theory underlying the ASI measurement technique predicts that ASI
total = ASI
anode + ASI
cathode + ASI
fixed [
36]. Therefore, the indication is that the lithium metal counter electrode makes a significant contribution to the ASI values in half cells.
The voltage transients arising from constant current pulses can be analysed in three parts; an immediate IR change, ∆E
t, the voltage change during the transient, and ∆E
s, the change in rest voltage due to the change in state of charge [
30]. Ten second pulses for the four cell types at 50% state of charge are presented in the
Supplementary Materials. The main difference between the full cells and the half cells was in the IR drop, rather than ∆E
t or ∆E
s. The median values for IR were 15 and 30 mV for full cells and half cells on the initial pulse after a one-hour rest, and 10 and 20 mV for the subsequent reverse pulse. The ASI calculation is based on IR + ∆E
t − ∆E
s, so an increase in IR means an increase in ASI.
To investigate the ASI contribution from the lithium metal counter electrode, measurements were made in a symmetrical lithium//lithium cell. The combined ASI was around 8 Ω cm2, and the voltage change was almost all IR drop, with ∆Et ~0. This suggests the presence of an SEI film on the lithium metal surface. Before the pulse tests, the symmetrical cell went through one conditioning cycle, lasting one day. The half cells experienced multiple cycles, over several days. Therefore, the SEI layer on the lithium counter electrode in the half cells was probably thicker, with a higher resistance. In consequence, the ASI values measured in the half cells were higher than in the full cells.
Another standard cell characterisation test is the discharge capacity as a function of the discharge rate. This test was applied to stacked pouch cells, single sided pouch pair cells, and anode and cathode coin cell half cells. Plots of cell voltage against capacity for representative cells are included in the
Supplementary Materials. Plots of discharge capacity against discharge rate are shown in
Figure 5; by analogy with Ragone plots [
37], these are usually plotted as log–log graphs. The maximum rate that could be used with stacked cells was 30 C, due to the current limit of the test rig. Even so, at 30 C, the stacked cells clearly outperformed the single pair pouch cells.
The anode half cell tests were complicated by the creation of internal short circuits; in many cases the delithiation capacity was much higher than the lithiation capacity. High rate delithation at the anode requires high-rate lithium deposition on the lithium metal, i.e., an increased risk of dendrite formation. The capacities were derived from the first maximum in the cell voltage, rather than waiting to reach the 1.5 V limit. Despite this, the anode capacities exceeded the cathode capacities, at the same rate. The full cells are clearly rate limited by the cathode rather than the anode.
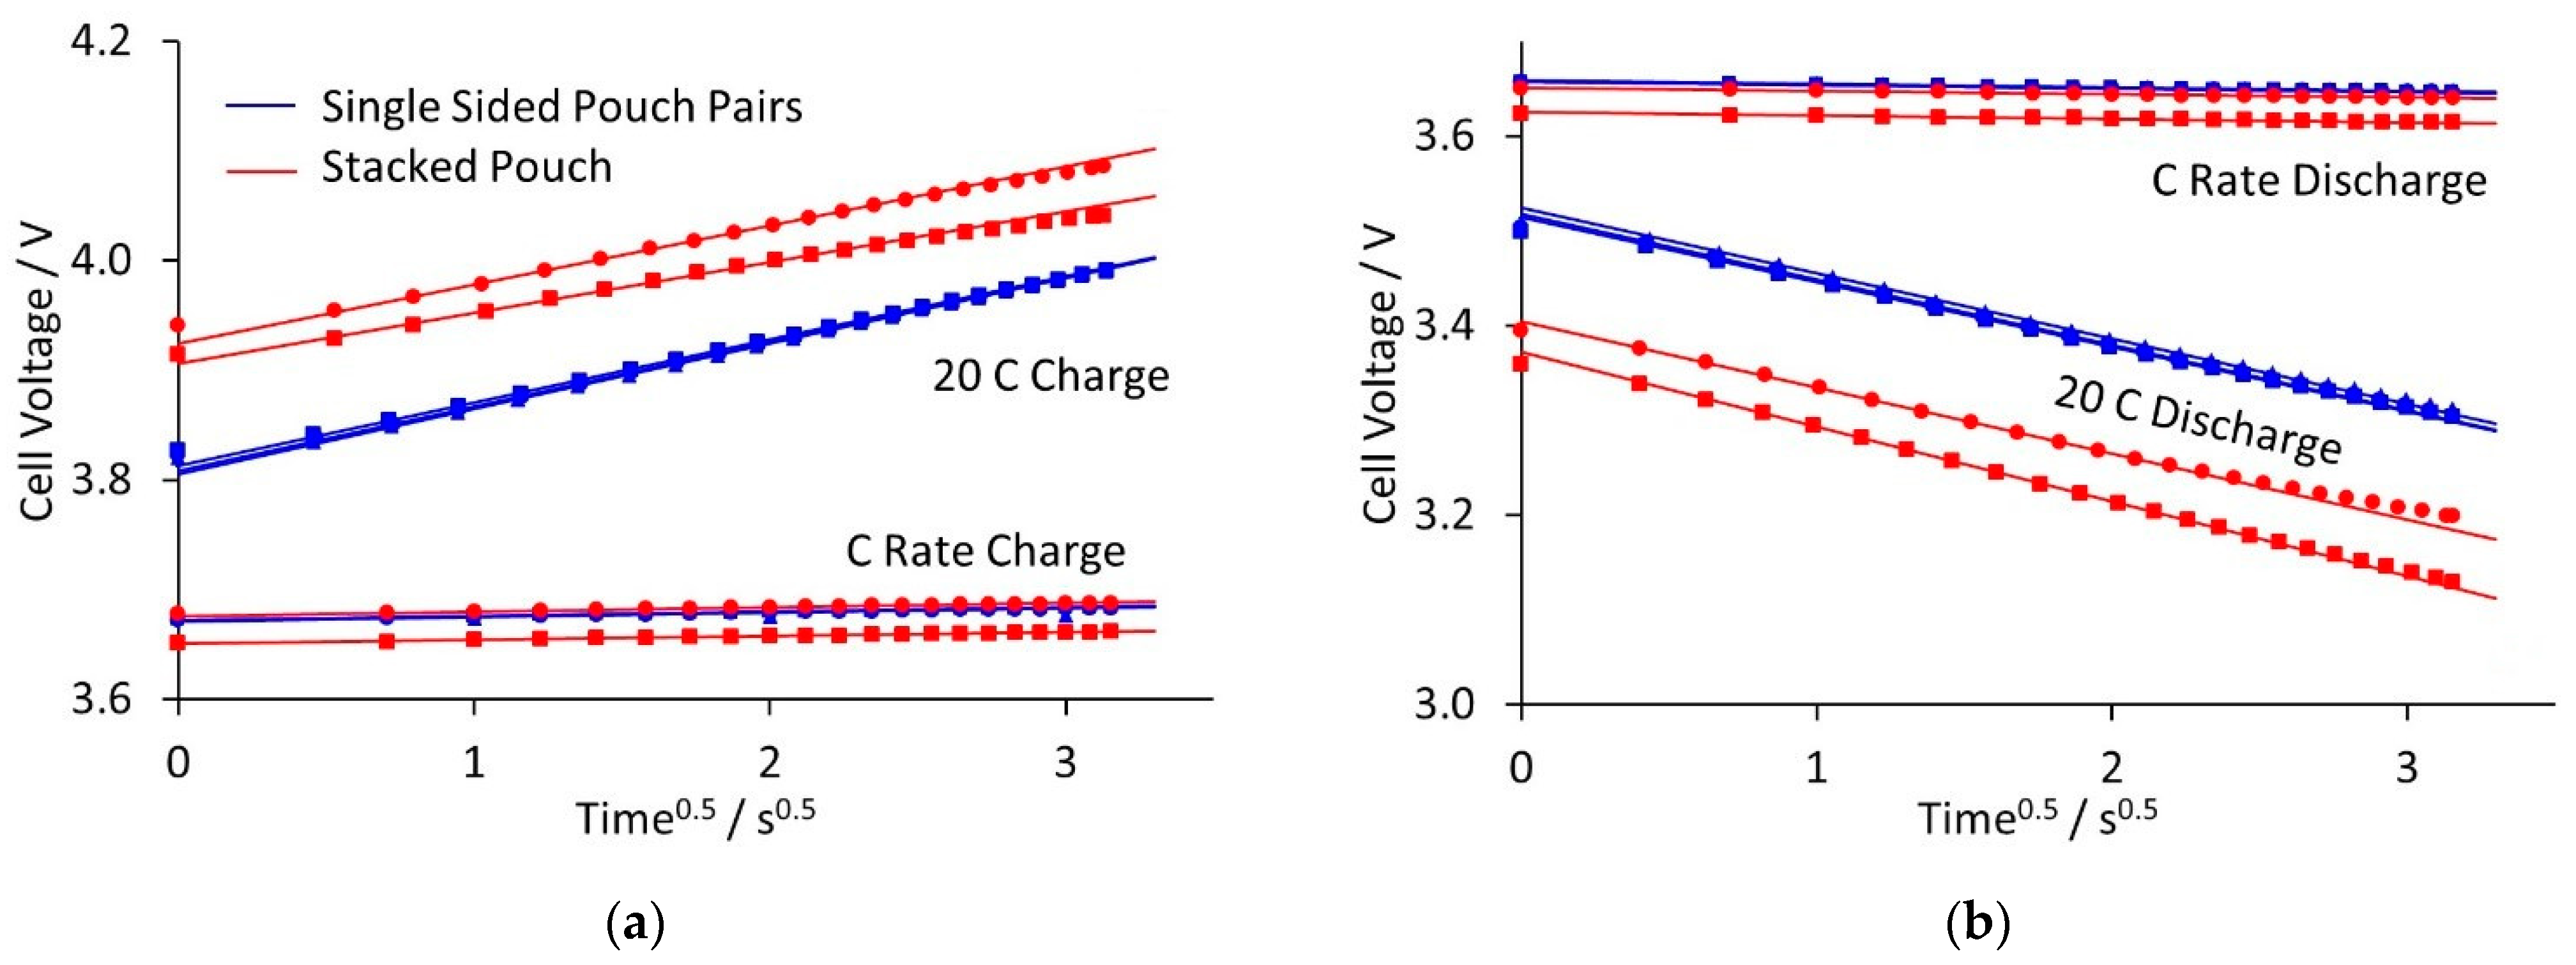
Rather than high rate full, continuous discharge, many high-power applications involve relatively short charge and discharge pulses. Therefore, stacked pouch cells and single sided pair cells were subjected to sequences of two second and then ten second pulses. Examples of the voltage transients for each type are plotted in the
Supplementary Materials. The stack cells were limited to 33 C by the maximum current capability of the equipment, but the single sided pairs were tested up to 50 C. The results are summarised in
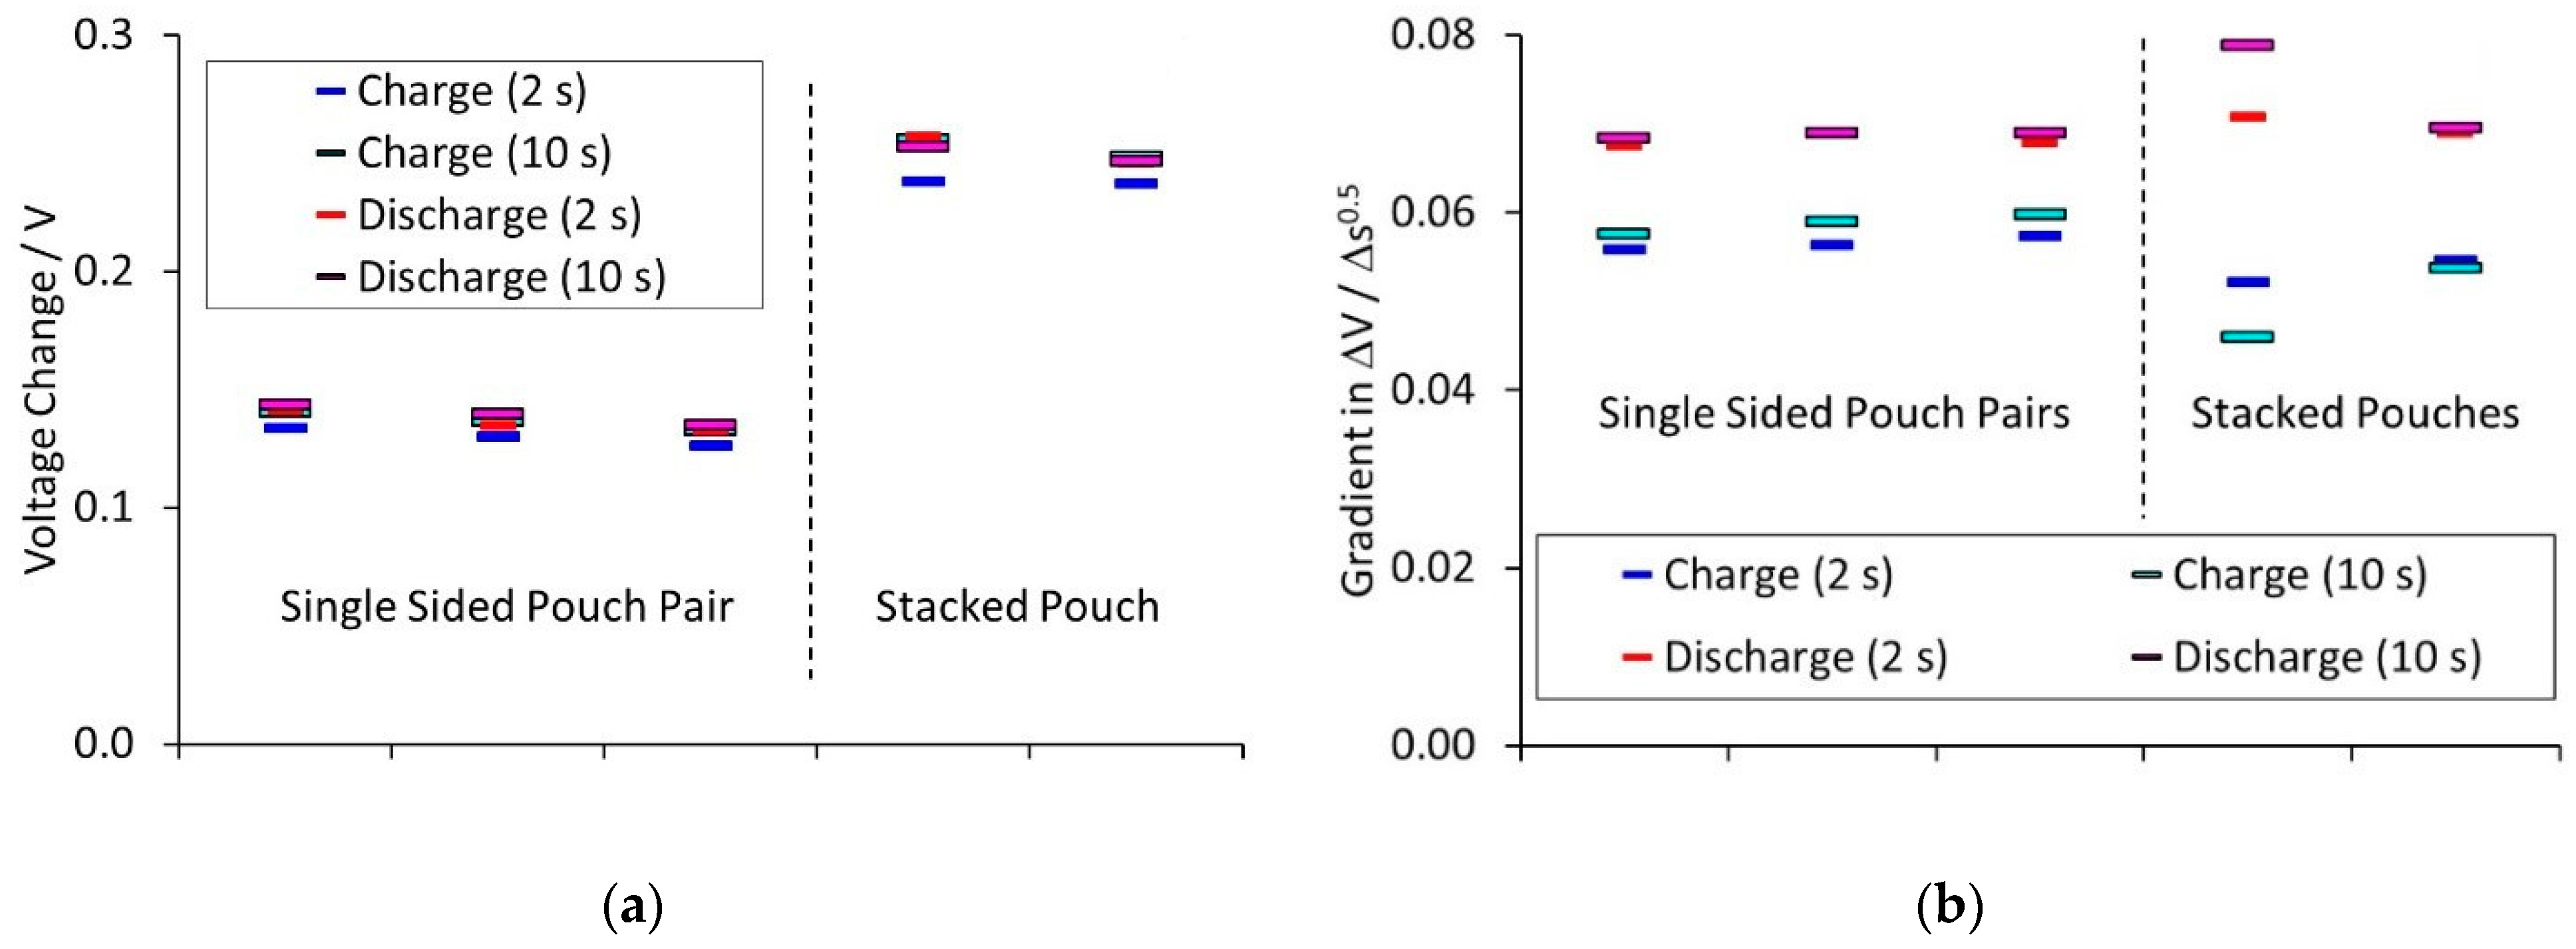
Figure 6, which shows the voltage transients at ±C and ±20 C, for the ten second pulses. The ■ and ● symbols represent two, nominally equivalent cells. The transients showed two limiting processes. There was an immediate step change in voltage, followed by a linear change of voltage with time
0.5. Calculated values for the initial voltage drop and subsequent gradient are shown in
Figure 7.
The initial voltage change was the difference between the voltages at time t = 0 for the 1 and 20 C pulses. This step change was due to the total cell resistance, including the tab resistance. The single sided pair and stacked pouch cells contained the same tabs, but the former have much lower capacity. This reduced the IR drop across the tabs, for the same rate, giving a smaller voltage change.
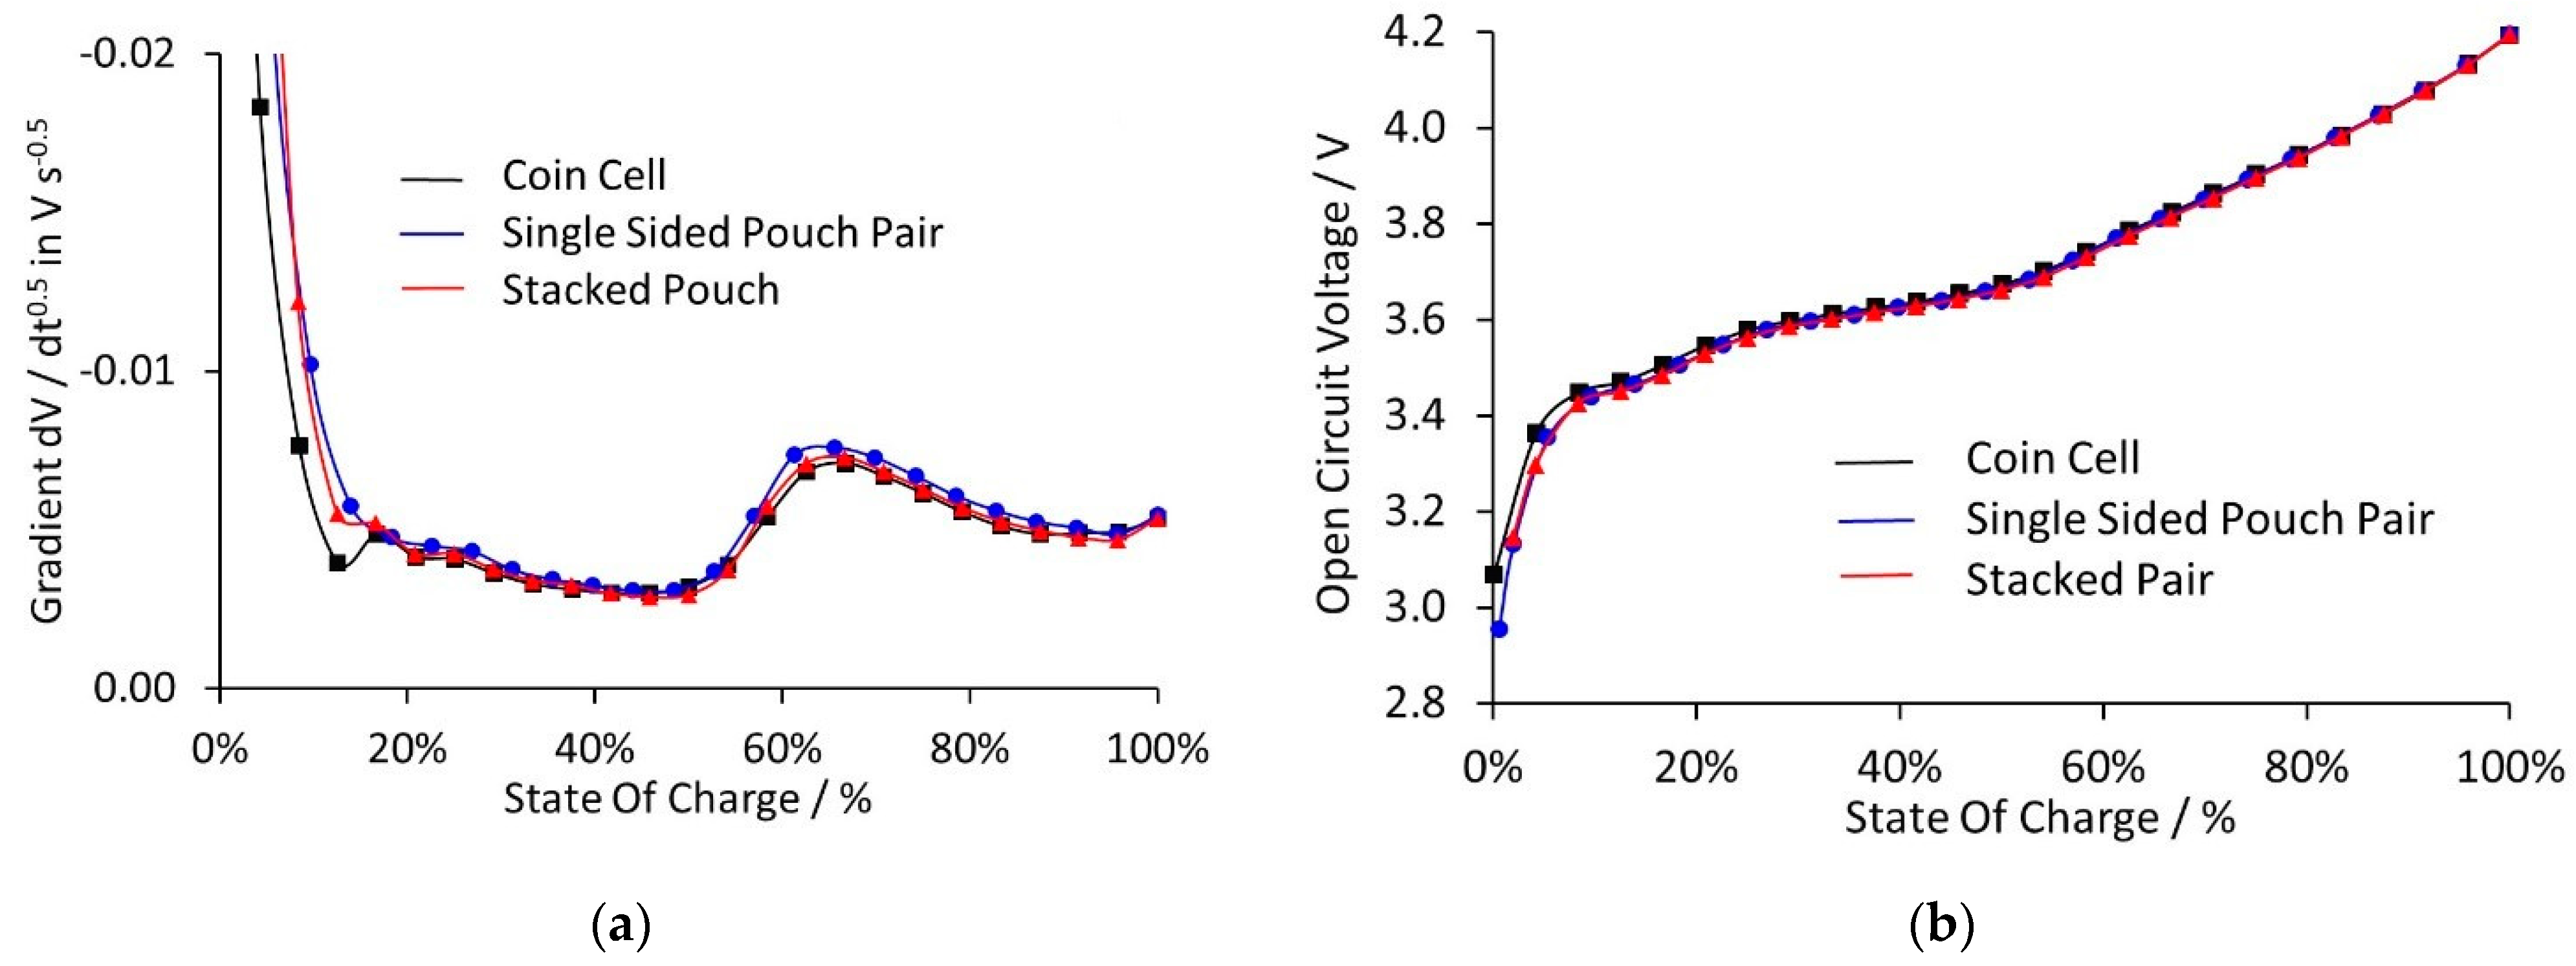
Galvanostatic intermittent titration technique or GITT tests are often performed on cells, as part of characterisation tests. For example, measurements of diffusion coefficient and open circuit voltage as a function of state of charge are very useful in cell modelling [
20]. Therefore, a GITT discharge test was performed on one cell of each type, with twenty-five C rate discharge steps of 150 s, alternating with one hour rest steps. Sets of transients are plotted in the
Supplementary Materials.
Figure 8 compares the dV/dt
0.5 gradients, and the open circuit voltages, for the three cells. There was good agreement across the cell types, except at low states of charge. The dV/dt
0.5 gradient, open circuit voltage and cell resistance all change rapidly with SoC in this range, at it is likely that there were small differences in the actual state of charge across the three cell formats.
It is possible to calculate values for the diffusion coefficient, as a function of state of charge (and temperature), using an equation of the form [
32]:
The gradients dE/dt
0.5 and dE/dQ can be determined from the graphs in
Figure 8, and the current I is known from the experiment. The main issue is obtaining the diffusion path length, L. The original GITT theory was developed for thin film electrodes, with linear diffusion between the surface and a blocking current collector. The electrodes used in lithium-ion cells are actually composites of millions of small particles, each with their own size, shape and orientation. Thus, it is surprising that the transients show clear linearity of voltage against time
0.5. Diffusion occurs within the layers of active materials like graphite and NMC. In graphite, it is neither linear nor spherical. In NMC materials, diffusion across the layers within the individual primary particles could be approximated to spherical diffusion in the secondary particles. Thus, the diffusion path length could be anywhere between the thickness of the coating and the average radius of the individual particles. An alternative approach is to estimate L from the molar volume and effective surface area [
20].
3. Discussion
The differences between the three cell formats on the four main tests are summarised in
Table 4. In cycling tests, the coin cells lost capacity more rapidly than the stacked pouch cells. During cycling at ±C/2, the number of cycles to 80% of initial capacity was around 300 cycles for coin cells, compared to an extrapolated 1000 cycles for stacked pouch cells. For ±3 C cycling, the equivalent number were ~1000 and ~1600 cycles. The single sided pouch pairs showed more variability, which will improve with greater optimisation of the cell format and design. The better cells gave results close to the stacked pouch cells. At present, a larger batch size is necessary to provide definitive results. In particular, the degree of compression achieved during cell manufacturing determines whether the main degradation process is thermal or mechanical.
There are numerous possible degradation reactions that can occur in lithium-ion cells during cycling [
38,
39]. A common cause of resistance increase is growth of the SEI layer on the anode. This is a temperature dependent process, accelerating at higher temperatures [
38]. The stacked pouch cells have a much lower mass: capacity ratio and will therefore experience higher internal temperatures, for equivalent tests. Thus, the rate of resistance increase from SEI growth should be higher in stacked pouch cells, which was observed experimentally.
Loss of active lithium is usually associated with mechanical degradation processes, from the isolation of individual particles to wholesale delamination of coatings. Lithiation and delithiation of active materials is associated with expansion and contraction of the particles. In pouch cells, this process can be measured using experiments based on Archimedes’ displacement principle [
40]. However, in coin cells, there is a spring applying compression to the electrode layers. Therefore, mechanical damage and hence loss of active lithium will be more rapid in coin cells. For the single sided pouch cells, degradation reactions can be caused by mechanical or thermal factors. If the electrode pair is tightly compressed, then heat transfer will be good, but mechanical damage will be accelerated. If the electrode pair is loosely compressed, then heat transfer will be poor, but mechanical damage will be minimised. In this cell format, close attention needs to be paid to the depth of the pouch, and the thickness of the inert spacer, to achieve a consistent degree of compression.
According to the theory developed to interpret GITT experiments [
30,
31,
32], if plots of voltage against time
0.5 are linear, then the cell is expected to be under solid state diffusion control. If the voltage curves away from linearity, the implication is that a different process has become limiting, for example, saturation or depletion at the surface of the active material particles, restricted ionic conductivity, or in the worst case, lithium plating [
41]. The gradients of ΔV/Δt
0.5 were calculated using linear regression. The gradients were similar in all the cells, apart from one stacked pouch cell, which was in a slightly different state of charge. There was a clear difference between the charge and discharge steps, i.e., an asymmetry in the solid-state diffusion mechanism. More extreme asymmetry has been observed previously in equivalent tests on electrodes extracted from commercial lithium-ion cells [
41]. The most likely cause of the asymmetry was the presence of heterogeneous layers, e.g., the diffusion coefficients of lithium in graphite and the SEI layer are different [
42].
The diffusion limited reactions were common to stacked pouch cells and single sided pair pouches. However, the voltage drops depended on the actual current, and hence the cell format and capacity. The initial voltage drops were smaller with single pair pouch cells, but the stacked pouch cells gave higher discharge capacities at 30 C. This was due to a further factor, temperature. The single sided pair pouches generated a small amount of heat, even during a continuous high-rate discharge. This can be dissipated through the tabs, and the cells remained close to the set temperature. It is difficult to measure changes in external temperature using thermocouples on this cell format [
43]. The stacked pouch cells generated much more heat, increasing the cell external (and internal) temperature. This can improve the reaction kinetics and increase the discharge capacity, provided that the cells did not reach a damagingly high temperature.
4. Materials and Methods
Double sided anode and cathode coatings were prepared, with relatively low coat weights. The design capacities were 1.0 mA h cm−2 for the cathode, and 1.1 mA h cm−2 for the anode, based on 60 gsm for the cathode, and 30 gsm for the anode. The anode was graphite based, containing Hitachi SMG-A5: CMC: SBR: C65: CNT = 91: 1.2: 1.8: 5: 1.2 wt%. The cathode was NMC-622: PVDF 5130: LITX50: KS6L = 92: 1.75: 4.25: 2 wt%. (CMC = carboxy methyl cellulose, SBR = styrene butadiene rubber, CNT = carbon nanotubes, NMC-622 = LiNi0.6Mn0.2Co0.2O2, and PVDF = polyvinylidene difluoride). The anode was prepared using a Bühler high speed mixer and coated on 12 um copper foil using a Megtec reverse comma bar coater. The cathode was prepared with a Bühler high torque mixer and coated on 20 um aluminium foil. After an initial drying stage, the electrodes were calendared down to the target porosities of 40% (anode) and 33% (cathode), using an Innovative Machine Corporation (IMC) calender. Single sided sections of the same coatings were calendared in a similar manner and used to make the coin cells and single sided pouch cells.
Stack pouch cells were assembled using production line equipment supplied by Sovema. The anode active area was 70 × 50 mm, and the cathode 68.5 × 48.5 mm. The cells contained 18 cathodes and 19 anodes, assembled using a Z fold stacking machine [
44]. The end pieces were double sided anode coatings. The separator was Celgard
® H1609 (Celgard LLC, Charlotte, NC, USA). The electrolyte was 1 mol dm
−3 LiPF
6 in EC:EMC = 3:7 vol, with 1 wt% VC, from Soulbrain, MI, USA. The single sided pouch pair cells were prepared using essentially the same equipment, but they were hand wound rather than machine stacked. A 3 mm thick polyethylene spacer was used to fill out the pouch in the cell. The coin cells were prepared using Hohsen 2032 cell components. The anodes had a diameter of 15.0 mm, and the cathodes 14.8 mm. Metal spacers (1 mm + 0.5 mm thicknesses) were used to fill out the cell volume, both placed between the negative electrode and the spring. Half cells were prepared with pre-cut disks of lithium metal, also with a diameter of 15.0 mm.
The cells were formed using a ±C/20 charge and discharge cycle. The stacked pouch cells were degassed and re-sealed after this cycle. Cells from each batch were then allocated to either long term cycling or rate and performance tests. The stacked pouch cells were tested on a Maccor 4000 series cycler, with a 10 A channel limit. For higher rate pulse tests, four channels were paralleled together, to give a 40 A limit. The single sided pair cells were tested on a Maccor 4000 series cycler, with four current ranges up to 5 A. All of these tests occurred with the cells inside an environmental test chamber, set to 25 °C. Most of the coin cell tests used a Bio-Logic BCS-805 cycler, with multiple current ranges up to 150 mA. The cells were connected directly to the front of the cycler, in a room air conditioned to 25 °C. Some of the coin cell tests used the 5 A Maccor unit.
The cycling tests at ±C/2 and ±3 C used a CC-CV charge protocol, and voltage limits of 2.5 V and 4.2 V. The CV steps were stopped when the current fell to one tenth of the CC step value. The periodic cell characterisation test on the ±3 C cycling regime involved the following steps: three cycles at ±C, a full charge, a 60% discharge, a one hour rest, a ten second pulse at 5 C, and then a forty second rest. The DC resistance was calculated from R = (V
A − V
B)/(I
A − I
B), where “A” is the end of the 5 C pulse, and “B” is the end of the subsequent rest. The same equation was used to calculate the ASI values. The test protocol was based on the ANL methodology [
29]. Following a full charge, ten second discharge and charge pulses were performed at nine states of charge between 90% and 10%. A further charge was followed by two second pulses at 50% SoC, and thirty second pulses at 20% SoC. In each case the discharge pulse was at 1.8 C, and the charge pulse at 1.2 C. The pulse tests at different rates occurred with the cells charged to 3.65 V. A sequence of two second pulses was followed by a set of ten second pulses. Each discharge pulse was followed by a low-rate charge step, to maintain the state of charge, and vice versa.
5. Conclusions
The same anode and cathode coatings have been used to prepare lithium-ion cells in three different formats: coin cells, single sided pouch pairs, and stacked pouch cells. Stacked cells are the ultimate determinant of cell performance, but require much greater time, effort, and quantity of materials to prepare. The smaller cell sizes provide an indication of the performance in a full-sized cell, but we have shown some systematic differences between formats. Within each cell format, improvements are likely to be retained through into scaled up cells.
The dominant degradation mechanism depended on the cell format. Loss of active lithium is associated with mechanical processes, e.g., compression leading to particle isolation, whereas increases in cell resistance are associated with thermally activated processes like SEI growth. Coin cells have a relatively high thermal mass but contain a relatively powerful spring. Therefore, the main degradation process was mechanical, leading to faster capacity loss but minimal resistance increase. Stacked pouch cells have a low mass: capacity ratio but can expand and contract. The main degradation process was thermal, leading to faster resistance increases, but slower capacity loss.
The conclusion from the rate, pulse and ASI tests is that the ultimate performance of stacked pouch cells is not fully reflected in tests on smaller cells. However, within each cell type, relative comparisons are useful and informative. Most of the screening and development work during the project used coin cells. However, periodically the mixing and coating was scaled up to allow stacked pouch cells to be manufactured. These cells also showed improvements, in line with those observed in the coin cell tests.
Overall, this work shows that the scale up process from coin cells to stacked pouch cells (and by implication prismatic and cylindrical cells) is not simple. It is important to understand the different contributions of mechanical and thermal factors to degradation process in each cell format. Further work is required to predict stacked pouch cell performance from coin cell tests with greater accuracy, and to understand different contributions to degradation processes and cell resistance. However, any improvements made in one cell format can be transferred across to other cell formats and designs.


