
Methodology for Determining Time-Dependent Lead Battery Failure Rates from Field Data

1
Robert Bosch GmbH, Mittlerer Pfad 9, 70499 Stuttgart, Germany
2
Electrical Energy Storage Systems, Institute for Photovoltaics, University of Stuttgart, Pfaffenwaldring 47, 70569 Stuttgart, Germany
*
Author to whom correspondence should be addressed.
Batteries 2021, 7(2), 39; https://0-doi-org.brum.beds.ac.uk/10.3390/batteries7020039
Submission received: 30 March 2021
/
Revised: 24 May 2021
/
Accepted: 2 June 2021
/
Published: 15 June 2021
(This article belongs to the Special Issue Battery Systems and Energy Storage beyond 2020)
Abstract
:The safety requirements in vehicles continuously increase due to more automated functions using electronic components. Besides the reliability of the components themselves, a reliable power supply is crucial for a safe overall system. Different architectures for a safe power supply consider the lead battery as a backup solution for safety-critical applications. Various ageing mechanisms influence the performance of the battery and have an impact on its reliability. In order to qualify the battery with its specific failure modes for use in safety-critical applications, it is necessary to prove this reliability by failure rates. Previous investigations determine the fixed failure rates of lead batteries using data from teardown analyses to identify the battery failure modes but did not include the lifetime of these batteries examined. Alternatively, lifetime values of battery replacements in workshops without knowing the reason for failure were used to determine the overall time-dependent failure rate. This study presents a method for determining reliability models of lead batteries by investigating individual failure modes. Since batteries are subject to ageing, the analysis of lifetime values of different failure modes results in time-dependent failure rates of different magnitudes. The failure rates of the individual failure modes develop with different shapes over time, which allows their ageing behaviour to be evaluated.
1. Introduction
The change in individual mobility is particularly evident in the electrification and automation of vehicles. The electrification of the powertrain leads to an increase in the weight of the vehicles. In addition to automation functions, this leads to higher safety requirements especially for electric braking and steering power assistance. Apart from these essential safety-relevant consumers steering (e.g., steer-by-wire) and braking (e.g., brake-by-wire), automated driving functions require sensors and actuators for position and environment detection as well as for control [1]. These components are supplied via the 12 V on-board power supply system (also known as powernet) of the vehicle and need a safe power supply to ensure a safe operation.
Therefore, knowing the failure behaviour and failure rates of the components and the power supply is crucial for the overall safety concept of the power supply system and the vehicle itself. Dominguez-Garcia et al. have already dealt with this increasing problem of safety-relevant consumers and their power supply in [2] by designing safe power supply system topologies. Subsequently, Kurita et al. also addressed the design of on-board power supply systems in [3] and placed the focus on the importance for future driving applications, which supports the actuality of the topic.
In such on-board power supply systems, the power supply is provided during normal operation by the alternator or DCDC converter in hybrid or electric vehicles. In addition, the 12 V battery is a main component of the power supply system and, besides buffering peak loads and supplying the vehicle with standby power, e.g., when parking, it also acts as a backup power supply. This backup function of the 12 V battery in the on-board power supply system is now becoming very important and the search for a safe power supply at the 12 V level with proof of reliability must be conducted.
Modern vehicle architectures consist to a large extent of electrical and/or electronic (E/E) systems. These systems are crucial for the safe operation of the vehicle and must therefore meet functional safety standards. The vehicle power supply system, as an obligatory component for safe operation, must therefore be developed according to the ISO 26262 standard [4,5]. Batteries are not in the scope of the ISO 26262 standard although the battery is a main component of the power supply system and its failure rates need to be included. In contrast to electrical components with constant failure rates, electrochemical components such as batteries are subject to ageing and thus do not have constant failure rates over time. Nevertheless, this failure behaviour and the resulting increasing failure rates must be included in the functional safety concept. Therefore, a method for determining battery failure rates must be established and checked for plausibility with the failure mechanisms investigated.
The lead battery can be part of a safe power supply system architecture if its ageing mechanisms and faults are manageable. In an early stage Albers et al. identified in [6] the necessity for further investigations of batteries in the context of functional safety requirements in the changing environment of vehicles with new functions. Proving reliability is difficult for electrochemical components such as the lead battery due to their ageing behaviour over time. Previous investigations on the reliability of the lead battery, such as those carried out by Albers et al. in [7], examined the batteries by tear down analysis to obtain a probability distribution of the failures that occurred. With the failure distribution, they were able to calculate fixed failure rates for the lead battery by using the corresponding ADAC failure statistics [8]. However, the ageing behaviour and thus the failure rate of electrochemical elements such as the lead battery does not follow the bathtub curve like electronic components, which are dominated by random failures in terms of time. The ageing process of electrochemical components starts with first use and batteries can be considered as wear out components. This means that the ageing behaviour behaves like the third area of the bathtub curve with increasing failure rate and therefore a fixed failure rate is less appropriate for wear out components.
In [9], Mürken et al. chose the approach of using workshop data on the battery exchange of the vehicle battery and its lifetime values. With the help of the individual lifetime values, it was possible to determine an ageing model based on a Weibull distribution for the failure of the battery. This made it possible to calculate the reliability of the overall battery over time and thus time-dependent failure rates. A consideration of the different failure modes and thus corresponding failure rates could not be investigated in this study due to lack of knowledge about the occured failure mechanisms. Furthermore, many batteries are replaced without faults and thus these functioning batteries are included in the failure rates in this approach.
Varying ageing mechanisms lead to different ageing behaviour; this was already recognised by Kumar et al. in [10]. It was shown that lifetime estimates of batteries are possible with Weibull analyses and that the Weibull parameters determined differ for varying failure mechanisms. Thus, an assignment of the failure mechanisms to the gradual faults or the sudden faults was possible. However, it remains open how the failure rate for certain failure modes develops over time and whether this is plausible with the knowledge of the ageing mechanism.
Since recent studies by the ADAC in [11] again show that the battery is responsible for a large number of vehicle failures as well as increasing safety requirements for future driving applications, it is important to include specific battery failure rates. Therefore, this article presents a method to calculate time-dependent failure rates of different investigated battery failures to get a better understanding of the progressing of ageing mechanisms. For this purpose, the knowledge about the dominant failure mechanism is required in addition to the lifetime values of the failed batteries. With the knowledge gained about the development of the failure mechanisms over time, the diagnostic mechanisms of the electric battery sensor can be prioritised and further developments can be made to ensure a safe power supply from the battery.
The main focus of this study is on the methodology for determining time-dependent failure rates and not on absolute values of the failure rates. The reason for that is the data available so far from 12 V lead batteries come from conventional combustion vehicles and were partly operated without any energy management and therefore do not cover the future application of a safety battery in backup operation at all. The failure criterion in previous studies is the ability to start the vehicle by providing the high starting current, whereas the requirement for a safety battery is the safe supply in the event of a safe stop scenario. For future investigations, the current profile required in a safe stop scenario would therefore be more suitable as a failure criterion. Nevertheless, in order to present the methodology with real field data, the collected field data of the Battery Council International (BCI) are used, which, however, come from such conventional vehicles. The BCI publishes a Report on Battery Failure Modes every five years; the most recent one from 2020 [12] is only available for purchase, which is why the methodology in this paper is shown using the example of the study from 2015 [13].
This study begins with an introduction to the methodology for determining time-dependent failure rates for different failure modes based on field data. Subsequently, a database is presented to demonstrate the methodology. Finally, the results of time-dependent failure rates are presented in normalised format and then discussed.
2. Methodology
This section presents the methodology for determining time-dependent failure rates of different failure modes using field data. For this purpose, the lifetime distribution is presented, which can be used to represent the field data. In order to be able to examine different failure modes in relation to each other, censoring methods are introduced and bias correction is applied due to limited sample sizes in some cases. Finally, the derivation of the failure rate from the obtained parameters is presented, which can then be used to calculate the time-dependent failure rates.
2.1. Lifetime Distribution
The raw data of lifetime values are the basis for lifetime analyses. For statistical estimations, these empirical data need to be represented by functions. The failure probability F(t) can represent such empirical lifetime values in a continuous matter. There are different types of lifetime distributions to properly represent various failure behaviours. A widely used distribution function that can be adapted to a large variety of shapes is the Weibull distribution. The Weibull distribution as the 2-parametric version has a shape parameter b and a scale parameter T to vary its behavior. The distribution also has the statistical variable t, which is in this case the lifetime value [14,15].
The failure probability F(t) of the 2-parametric Weibull distribution is given by:
The derivative of the failure probability F(t) of the 2-parametric Weibull is the probability density function f(t):
Both the shape parameter b and the scale parameter T have to be estimated so that the Weibull distribution represents the collected lifetime values well. A widely used robust analysis method is the maximum likelihood estimation (MLE). The likelihood function is maximised to find the most likely values of the distribution parameters for a given data set. The logarithmic likelihood function, which is easier to maximize, is based on the probability density function for a chosen lifetime distribution, in this case the 2-parametric Weibull distribution from Equation (2) with the parameters b and T to be estimated:
Subsequently, the values for the parameters must be found, which result in the highest value for this function. The partial derivatives of the likelihood function are set equal to zero for each parameter:
These determined Weibull parameters represent the lifetime behaviour for the given data set [16].
In a previous work, Mürken et al. already investigated the failure behaviour of the entire battery based on workshop data on battery replacement. In this approach, however, there was no information about the reason for the failure and consequently aged batteries in a still functional state were also included [9].
The approach presented in this paper allows individual failure modes to be investigated separately but in relation to the entire sample. For this purpose, a methodology is presented to determine ageing models for individual ageing mechanisms from individual lifetime values of batteries, which are verified with the knowledge of the ageing mechanisms.
In order to perform separate Weibull analyses for different failure modes, the data must be censored with respect to the different failure modes. Furthermore, the approach is shown on a data set that shows the details of the individual failure modes only for a certain period of time, so additional censoring with respect to time must be applied. These adjustments are explained in the following section.
2.2. Censoring Data
This approach is shown with lifetime values of batteries with different failure modes; therefore, censoring according to the investigated failure modes is necessary. This censoring according to individual failure modes is shown in Table 1; the Failure mode A, B as well as Functional are listed next to the lifetime values in hours. The “1” indicates which lifetime values are to be assigned to the failure mode and accordingly the “0” indicates which lifetime values are censored for the specific reliability analysis. This approach is shown on lifetime values based on the BCI Report on Battery Failure Modes 2015 in which the breakdown into individual failure modes covers only a period up to 4 years, although the entire sample contains batteries that survived beyond these 4 years up to 12 years. Therefore, the BCI study, used to present this approach, is considered to be a study performed over a certain period of time, in this case for 4 years, and the batteries that survive this period are censored. Thus a censoring according to time has to be applied, which is known as a right censoring of type 1. The censoring according to time is applied for lifetime values from 4 years onwards, thus all remaining lifetime values of the batteries that survived longer than these 4 years are assigned a lifetime value of = 4 years = 35,040 h as shown in Table 1.
With both censoring methods the Table 1 is an example of a censoring table as used for reliability analysis and ageing model building in this work.
The censoring of the data with regard to different failure modes may result in only a small sample number for rarely occurring failure mechanisms. For such small subsamples, the accuracy of the Weibull distribution fitting suffers and the Weibull parameters determined in the reliability analysis are overestimated. To avoid this, a bias correction is applied to the reliability analyses carried out in this work. The unbiased shape parameter is obtained by multiplying the shape parameter b determined by MLE with the bias correction factor U:
Since multiple failure modes are investigated, censored data are examined; the bias correction factor U according to Zhang et al. [17] is given by:
The calculated bias correction factor U varies with the number of failures considered r and the total sample size N. If a bias correction is carried out, first the biased shape parameter b determined in Equation (4) is unbiased by Equation (5). Then the corresponding scale parameter T is calculated using Equation (4). According to Tevetoglu et al. this provides valid results for reliability analysis even for small sample sizes and recommends the use of bias correction methods [18]. However, even with larger samples it is advisable to apply a bias correction to increase accuracy [19].
The techniques presented in this section can be used to determine characteristic Weibull parameters for individual failure modes using the Weibull distribution from Section 2.1. In Section 2.3, time-dependent failure rates can be calculated with these determined shape parameters b and scale parameters T.
2.3. Derivation of Time-Dependet Failure Rates
Since Weibull analyses have been carried out and the specific shape parameters b and scale parameter T have been determined, time-dependent failure rates can now be calculated. With the probability density function f(t) in Equation (2) and the failure probability F(t) in Equation (1) the failure rate is obtained with Equation (7). By using the determined shape parameters b and scale parameter T, the failure rate can be calculated for different times t. This also applies to Weibull parameters, which were determined using bias correction as described in Section 2.2.
In addition to the shape parameter b, the development of the failure rate over time gives an indication of the ageing and failure behaviour due to different failure modes of a component. In order to be able to show the presented methodology for batteries with different failure modes, it is applied to lifetime values derived from the field investigations of the BCI with the Report on Battery Failure Modes 2015. Therefore, in the following Section 3, this database is presented and the individual failure modes are explained for a better understanding in relation to the development of the failure rate over time.
3. Database of Lifetime Values
The presented methodology in Section 2 requires a suitable database to prove its validity. The Battery Council International presented a field investigation of lead batteries in Report on Battery Failure Modes in 2015 [13]. This study is used to prove the presented approach from Section 2 with real battery data and thus the applicability to electrochemical elements and their different ageing mechanisms. Therefore, the database and the major battery failure modes are presented in this section.
3.1. Field Data of Batteries
The BCI collected a total sample of 1454 batteries from different locations in the USA and presented the results in [13]. The batteries were collected within five months between August and December 2014 and analysed using a teardown analysis to find the dominant failure mode that led to the battery failure. Although several ageing mechanisms can occur in parallel and in total can affect the performance of the battery, there is one failure mode that is most pronounced and has thus been identified as the dominant failure mode for this battery failure. If this dominant ageing mechanism did not occur to the same extent, the battery would possibly still be functional at this time.
The sample reflects the different influences of temperature on batteries because of the different climatic conditions of the sample locations. Due to the large climatic differences in the USA between the North and the South, the sample can be divided into North and South accordingly. In the North with lower mean temperatures 857 batteries were collected; in the South with higher mean temperatures 597 batteries were collected.
In addition to climatic differences due to the locations where the batteries were collected, the sample contains batteries of varying quality and from a wide variety of cars. With an age of up to 12 years, the oldest batteries date back to 2002 and thus come from vehicles that rarely had energy management or start-stop function. Furthermore, besides the manufacturing quality of the batteries, nothing is known about the type, so the sample contains few or no advanced lead batteries such as absorbent glass mat or enhanced flood batteries but mainly older flood batteries.
Furthermore, the design of the batteries differs. For example, the sample includes battery housings according to the European standard with a protective terminal niche [20]. However, this type of housing represents a maximum of about 20% of the sample, most batteries are built according to the US standard or the Japanese Industrial Standards (JIS) [21]. This means that the majority of the batteries in the sample have a battery housing without terminal niche and the battery terminals are exposed. This makes mechanical impacts on the battery housing, e.g., during installation or removal or even during transportation when stacked, much more critical. Due to improper handling, the battery terminals are prone to mechanical damage. This can cause fractures between the battery terminal and the cell, which partially or directly destroys the battery.
All in all the lead batteries investigated in this sample are no longer relevant for today’s driving applications with high safety requirements. Since the operational demands on the battery were different back then, energy management was rarely implemented and a wide variety of qualities and types of lead batteries can be found in the sample. For future driving applications, however, only high-quality lead batteries of the latest generation will be used in combination with a powerful battery sensor and energy management.
In addition to the failure probability F(t) for the total sample, those of the sample parts North and South over a time period of 12 years are also published. In this study, the data of the total sample is used for the evaluation, because it covers locations from all over the USA. In combination with batteries surviving up to 12 years, this sample can be recognised as a representative sample of lead batteries in the field in 2014. These batteries represent the various stress levels, qualities and types used at that time. To perform the statistical approach the graphs are digitised again and converted into individual lifetime values of the batteries. The total sample used for this analysis is shown in Figure 1 as probability of failure F(t) for all failure modes including exchanged but functional batteries in one curve. The failure probability F(t) always starts for t = 0 with F(t=0) = 0% failed parts and always results after t = n until all parts of the sample failed in F(t=n) = 100%.
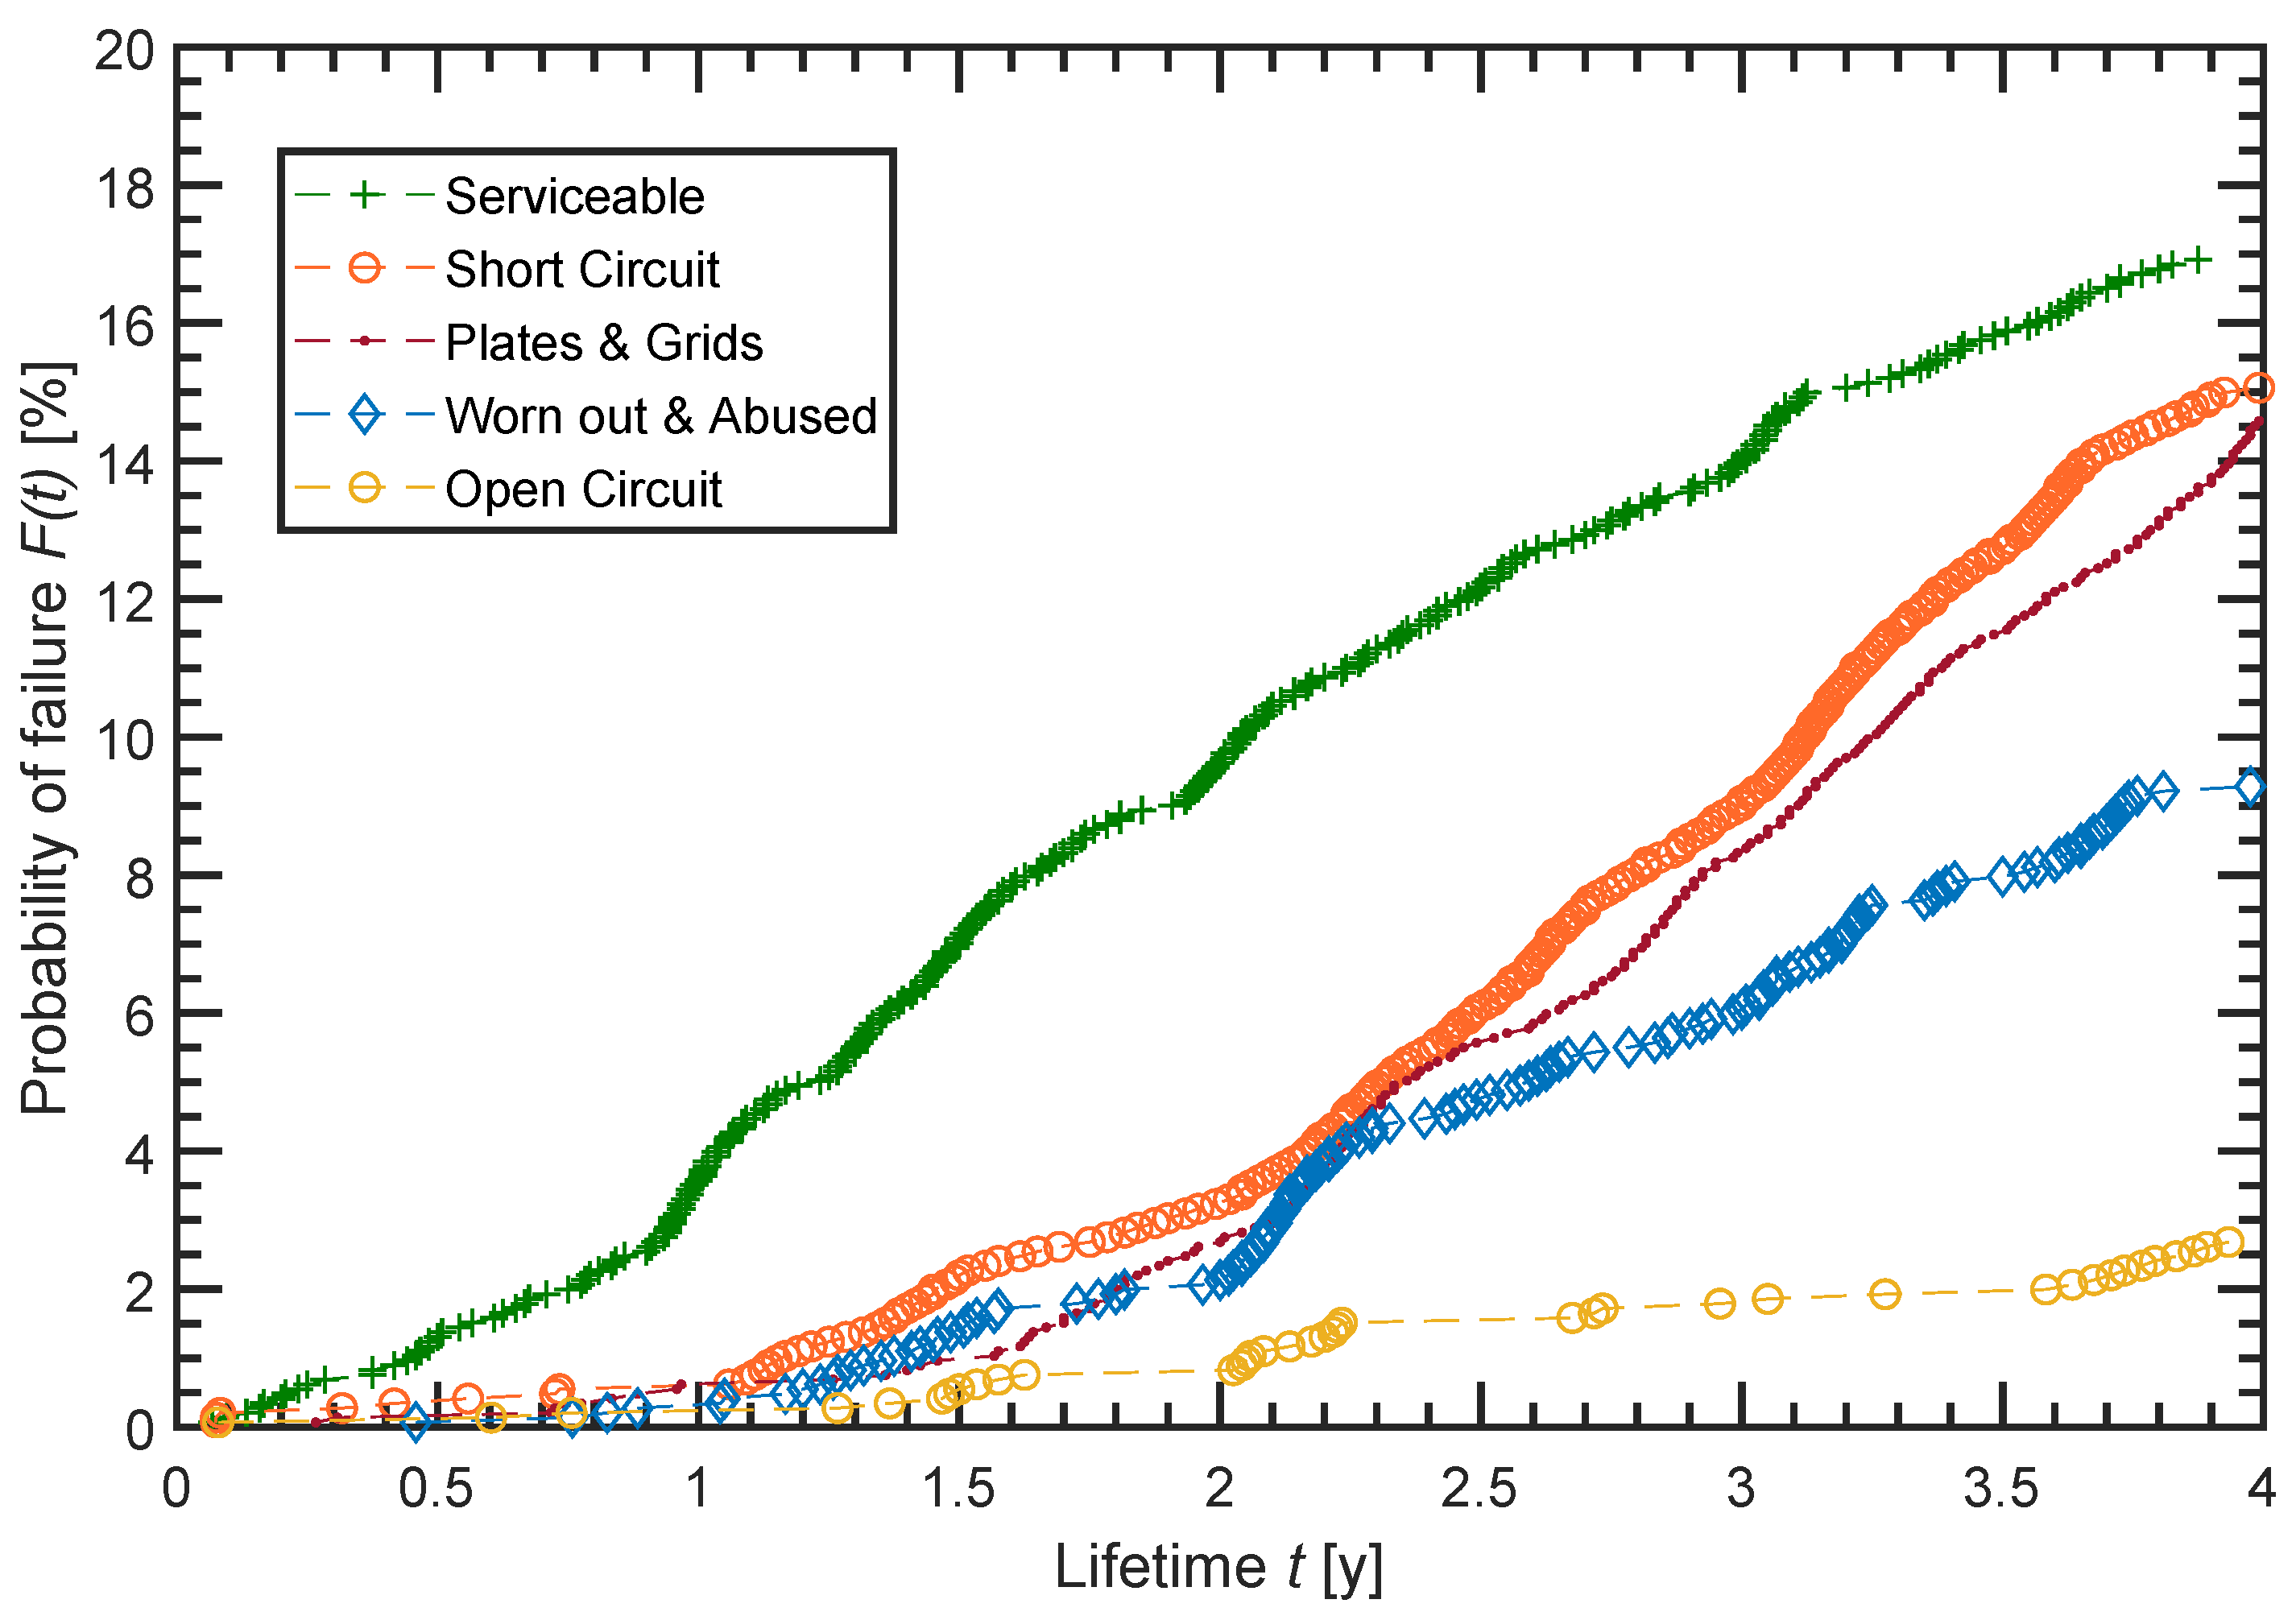
Besides the failure probability F(t) of all failures modes as a sum, the failure probabilities F(t) of the major five failure modes found by BCI while examining the batteries are published as well. The probability of failures F(t) of each failure mode is separately presented for a time period of 4 years for the sample parts North and South by BCI. The failure probabilities F(t) of these five failure modes are shown for the total sample in Figure 2.
Figure 2 shows the major failure modes. For a better differentiation of the individual curves, they are mentioned in relation to the time of 4 years. Starting from the top, Serviceable, Short Circuit, Plates and Grids, Worn out and Abused and Open Circuit are displayed.
Both Figure 1 and Figure 2 are based on single lifetime values derived from the Report on Battery Failure Modes by BCI in 2015 [13]. In particular, the data of the five major failure modes in Figure 2 are the basis to present the methodology for determining time-dependent failure rates in Section 2.
In order to discuss the time-dependent failure rates of the individual failure modes in relation to their ageing behaviour, the five major failure modes are presented in the following sections.
3.2. Failure Modes of Lead Batteries
Various ageing effects influence the performance of batteries and contribute to battery failure. Ruetschi investigates the ageing mechanisms of lead batteries in [22], where more detailed explanations of the failure modes mentioned in this section can also be found. Brik et al. presented their causal relation structured in a fault tree in [23]. However, the focus of this work is on the statistical consideration and the principle development of the different failure modes. The field data with the failure modes presented by BCI in [13] are only used to show the methodology. For safety applications, higher requirements apply for the design of a safety concept. This also includes the 12 V battery as a safe power supply. Therefore, suitable monitoring with energy management is a premise for safe operation of the battery. However, this cannot be assumed for the BCI sample, and hence this sample only serves to demonstrate the methodology. In addition to very old batteries, this sample includes various technologies that were operated with different load scenarios, that cannot be derived from the published data. However, the operation was rarely done with a suitable energy management. Moreover, the failure criterion used for this sample is the ability to start the vehicle. Nevertheless, this database is used to demonstrate the methodology and for this purpose the failure modes are described again in this section. These failure modes summarise different battery ageing mechanisms and can thus be categorised as sudden faults and gradual faults. The sudden faults occur abruptly and without notice and thus cannot be detected or predicted by diagnostic functions with a battery sensor. The sudden faults lead to a complete loss of power. The gradual faults refer to battery failures caused by ageing mechanisms and wearing out that occurs slowly during use and can thus be detected by appropriate diagnostic functions [10,24].
3.3. Open Circuit
The failure mode Open Circuit can be caused by broken connections at various parts of the battery. The electrical connection between the battery terminal and the connected cell can break due to massive mechanical impact from outside the battery housing and especially the battery terminals. As a result, the battery directly loses its full performance capability. Since many battery housings do not have terminal niches and the battery terminals are exposed, they are probably very prone to unintentional mechanical influences from the outside. This can lead to more frequent occurrences of Open Circuit, whereas terminal niche may protect the battery terminal from careless handling and prevent frequent Open Circuit. The individual cells of the lead battery are electrically contacted internally via solid inter-cell connectors to connect the six individual cells to one battery. If one of these inter-cell connectors between the cells breaks, there is also an Open Circuit. Finally, within each of the six individual cells, there are connections from the positive and negative electrodes to the respective inter-cell connector. These partial elements of the electrodes, known as electrode lugs, can break as well and thus make this electrode inactive. However, this means that only one part of a cell and thus one part of its capacity is no longer available; the remaining electrodes and cells work as usual. Due to the failure of Open Circuit the battery can lose its entire performance, as its circuit is interrupted. The Open Circuit happens suddenly without prior indication and thus is not detectable. Consequently it is allocated to the sudden faults and clearly defined by BCI with Open Circuit.
3.4. Plates and Grids
The failure mode Plates and Grids summarises ageing mechanisms that contribute to the increase of the internal resistance. Besides the main ageing mechanism corrosion in this category, this is to some extent also sulphation. Corrosion is favoured by a low acid concentration in the electrolyte, i.e., at low states of charge. However, high charging voltage and especially operation at high temperatures have a major influence. The general cycling of the battery also leads to corrosion over time. Corrosion mainly affects the positive electrode. In this case, corrosion leads to a reduction of the grid cross-section and thus to less active area for electron transport between the active mass of the electrode and the grid itself, and thus the grid resistance increases. With the decreasing grid cross-section, the mechanical stability also decreases. If the battery is very corroded, even parts of the active mass can lose contact with the grid and thereby no longer be reached and contribute to the reaction. In extreme cases, this can also reduce the available capacity. Primarily, however, corrosion leads to an increase in internal resistance. In addition to corrosion, sulphation can contribute to an increase in internal resistance. Sulphation occurs when the battery is frequently operated in states of partial charge and when the battery is rarely fully charged. This operation sometimes also leads to the occurrence of acid stratification. In addition to the operating conditions, high temperatures favour the formation of sulphation on the one hand but also lead to good dissolution of fine sulphate crystals if the charging voltage is sufficiently high. Low temperatures, on the other hand, have negative effects on the charging ability and can lead to the already mentioned rare full charges and frequent partial states of charge. In particular, the low states of charge lead to a higher solubility of Pb2 ions due to a lower acid concentration in the electrolyte, which form a sulphate layer by recrystallisation to PbSO4. The sulphate layer develops on both electrodes during discharge; as the pores of the negative electrode are larger, the sulphate crystals can become much larger than on the positive electrode. The larger the sulphate crystals are, the more difficult it is to dissolve them again by extensive full charging; during normal charging processes in the vehicle, reversible dissolution of the fine sulphate crystals hardly takes place. Due to the coarse sulphate crystal structure on the active electrode surface, this is reduced and loses conductivity. The lower conductivity increases the internal resistance. The binding of active material in the sulphate crystals reduces the available active mass and leads to a lower acid density of the electrolyte. The lower acid density means that very high maximum open-circuit voltages can no longer be achieved, thus limiting the capacity from above. This influence is assigned to the next category Worn out and Abused as well. Overall, the failure mode Plates and Grids with its ageing mechanisms corrosion and sulphation is to be assigned to the gradual faults, as they can only arise through extensive use over time.
3.5. Worn out and Abused
This failure mode covers the ageing mechanisms that lead to loss of capacity. The capacity of the battery determines to a large extent how much electrical energy it can store. If it loses capacity, it may no longer be able to supply enough energy for an application. This process thus has a decisive influence on the lifetime of a battery. The loss of capacity is primarily influenced by loss of active mass and due to cycling and sulphation. The sulphation has already been shortly explained in the previous Section 3.4, but decrease is mainly due to the processes described in the following. During the normal use of the battery, it is discharged and charged, that means cycled. This leads gradually to the wearing out of the active mass, mainly at the positive electrode, which is decisive for the capacity. This cycling stress is intensified by deep discharging or discharging with high currents, because the mechanical stress for the active material is correspondingly higher. When charging or discharging, parts of the electrode material are transformed and the volume changes. If large rapid volume changes take place, parts of the active material can become internally decontacted and thus can no longer contribute in the reaction. The porosity and conductivity decreases, which mainly reduces the available capacity but also slightly increases the internal resistance. In summary, cycling in particular contributes significantly to the loss of capacity, as does sulphation to some extent. These processes only become apparent when the battery is used or remains in a low state of charge and therefore Worn out and Abused is allocated to gradual faults.
3.6. Short Circuit
The failure mode Short Circuit implies an additional electrical path between positive and negative electrodes within a cell of the battery [25]. This additional connection has a resistance that varies depending on the characteristics of the short circuit and can discharge the cell at different rates. In addition to a changed open-circuit voltage, a short circuit can be recognised by an increased overall resistance of the battery. In principle, there are four possibilities for internal short circuits in lead batteries. Due to strong corrosion, the grid can change considerably and grow together above the active electrode surface in the area of the busbar. In addition, due to severe corrosion and accompanying change in volume of the electrodes, the separator can be damaged, causing a connection between the positive and negative electrodes. The mechanism of corrosion has already been explained in the previous Section 3.4. On the other hand, deep discharge of the battery and operation out of the specification can cause dendrites to grow, which can create a connection between the electrodes. Similarly to sulphation, at low states of charge and accompanying low acid density, the solubility of the lead increases and fine nonconductive dendrites of lead sulphate can form. Frequent use of the battery outside the specification at very low states of charge can cause the dendrites to grow and form fine filaments which can grow through the separator. At higher states of charge, the nonconductive lead sulphate is reduced to electrically conductive metallic lead, which can create an electrical connection. The fine short-circuit thus develops slowly during use, as do the other ageing mechanisms, and it can be avoided by appropriate operational management and monitoring. Only the hard short-circuit, by penetration with, e.g., a nail, could produce a sudden hard short-circuit, which, however, can only be achieved by external action and is not possible by normal operation.
3.7. Serviceable
The last failure mode listed is labelled Serviceable, which defines actually still good, functional batteries whose ageing progress has not yet led to failure. These batteries were replaced prematurely, presumably due to customer request. This failure mode is therefore not a failure mode of the battery but only indicates how many batteries have been replaced before the end of their lifetime.
These five major failure modes presented in the previous sections can be found in the field data in Figure 2 and in Section 3.1. The following Section 4 presents the results of the Weibull analysis and the calculated time-dependet failure rates .
4. Results
Since this work is about the methodology for determining time-dependent failure rates for individual failure modes and no field data from batteries are available that represent future load scenarios and failure criteria, the results are presented in normalised form. This section shows the results of the Weibull analysis performed with the field data derived from the Report on Battery Failure Modes by BCI 2015 as described in Section 3.
Nevertheless, the older database is used to demonstrate the methodology from Section 2, but the absolute failure rates are not relevant for the reasons mentioned above. The Weibull parameters are presented, but the scale parameter T is normalised with respect to a typical vehicle lifetime. Subsequently, the calculated time-dependent failure rates are also presented normalised. The time is normalised with respect to a typical vehicle lifetime . The failure rates of the individual failure modes from Section 3 are normalised to the failure rate of the still functional batteries of the failure mode Serviceable after vehicle lifetimes according to the following Equation (8):
The parameters determined by Weibull analyses are summarised in a table in the following section and the determined time-dependent failure rates are listed individually.
4.1. Estimated Weibull Parameters
The results of the Weibull analyses are obtained by parameter estimation with maximum likelihood estimation (MLE) and the application of bias correction. Table 2 shows the results of the estimated Weibull parameters. For the available five failure modes, the determined shape parameters b and the normalised scale parameter T are listed.
The parameters listed in Table 2 give an indication for the failure behaviour of the obtained component. In general, components can fail due to different reasons. The classic bathtub curve is divided into three areas that show different stages of failure behaviour and thus are linked to different magnitudes of the shape parameter b. Early failures with a decreasing failure rate and a shape parameter are often due to manufacturing defects, incorrect storage and long storage times. Random failures with a constant failure rate and a shape parameter are often encountered in electronic components. The third area of the bathtub curve is indicated as wear out or ageing failures with an increasing failure rate and a shape parameter . As batteries age with first use, their failure rate is expected to be continuously or exponentially increasing during use like with a shape parameter . The second parameter determined is the scale parameter T. This parameter indicates the time at which the probability of failure % is reached and a corresponding amount of parts of the sample have failed.
In the following Section 4.2, the results of the Weibull analyses are presented as time-dependent failure rates for the different failure modes listed in Table 2 and its parameters and failure behaviour are discussed.
4.2. Failure Rates of Lead Battery Failure Modes
The Weibull parameters listed in Table 2 are obtained by Weibull adaptions according to the methodology presented in Section 2 to lifetime values of the different failures modes as presented in Section 3. According to Section 2.3 the failure rate can be calculated with Equation (7). By using the determined shape parameters b and scale parameter T, the failure rate can be calculated for different times t. The five failure modes and their Weibull parameters from Table 2 are used to calculate these failure rates . In the following, this is shown individually with the Weibull parameters from Table 2 in normalised graphs by a typical vehicle lifetime . All failure rates are displayed with their upper and lower confidence interval for a confidence level of 95% (on time, type 1).
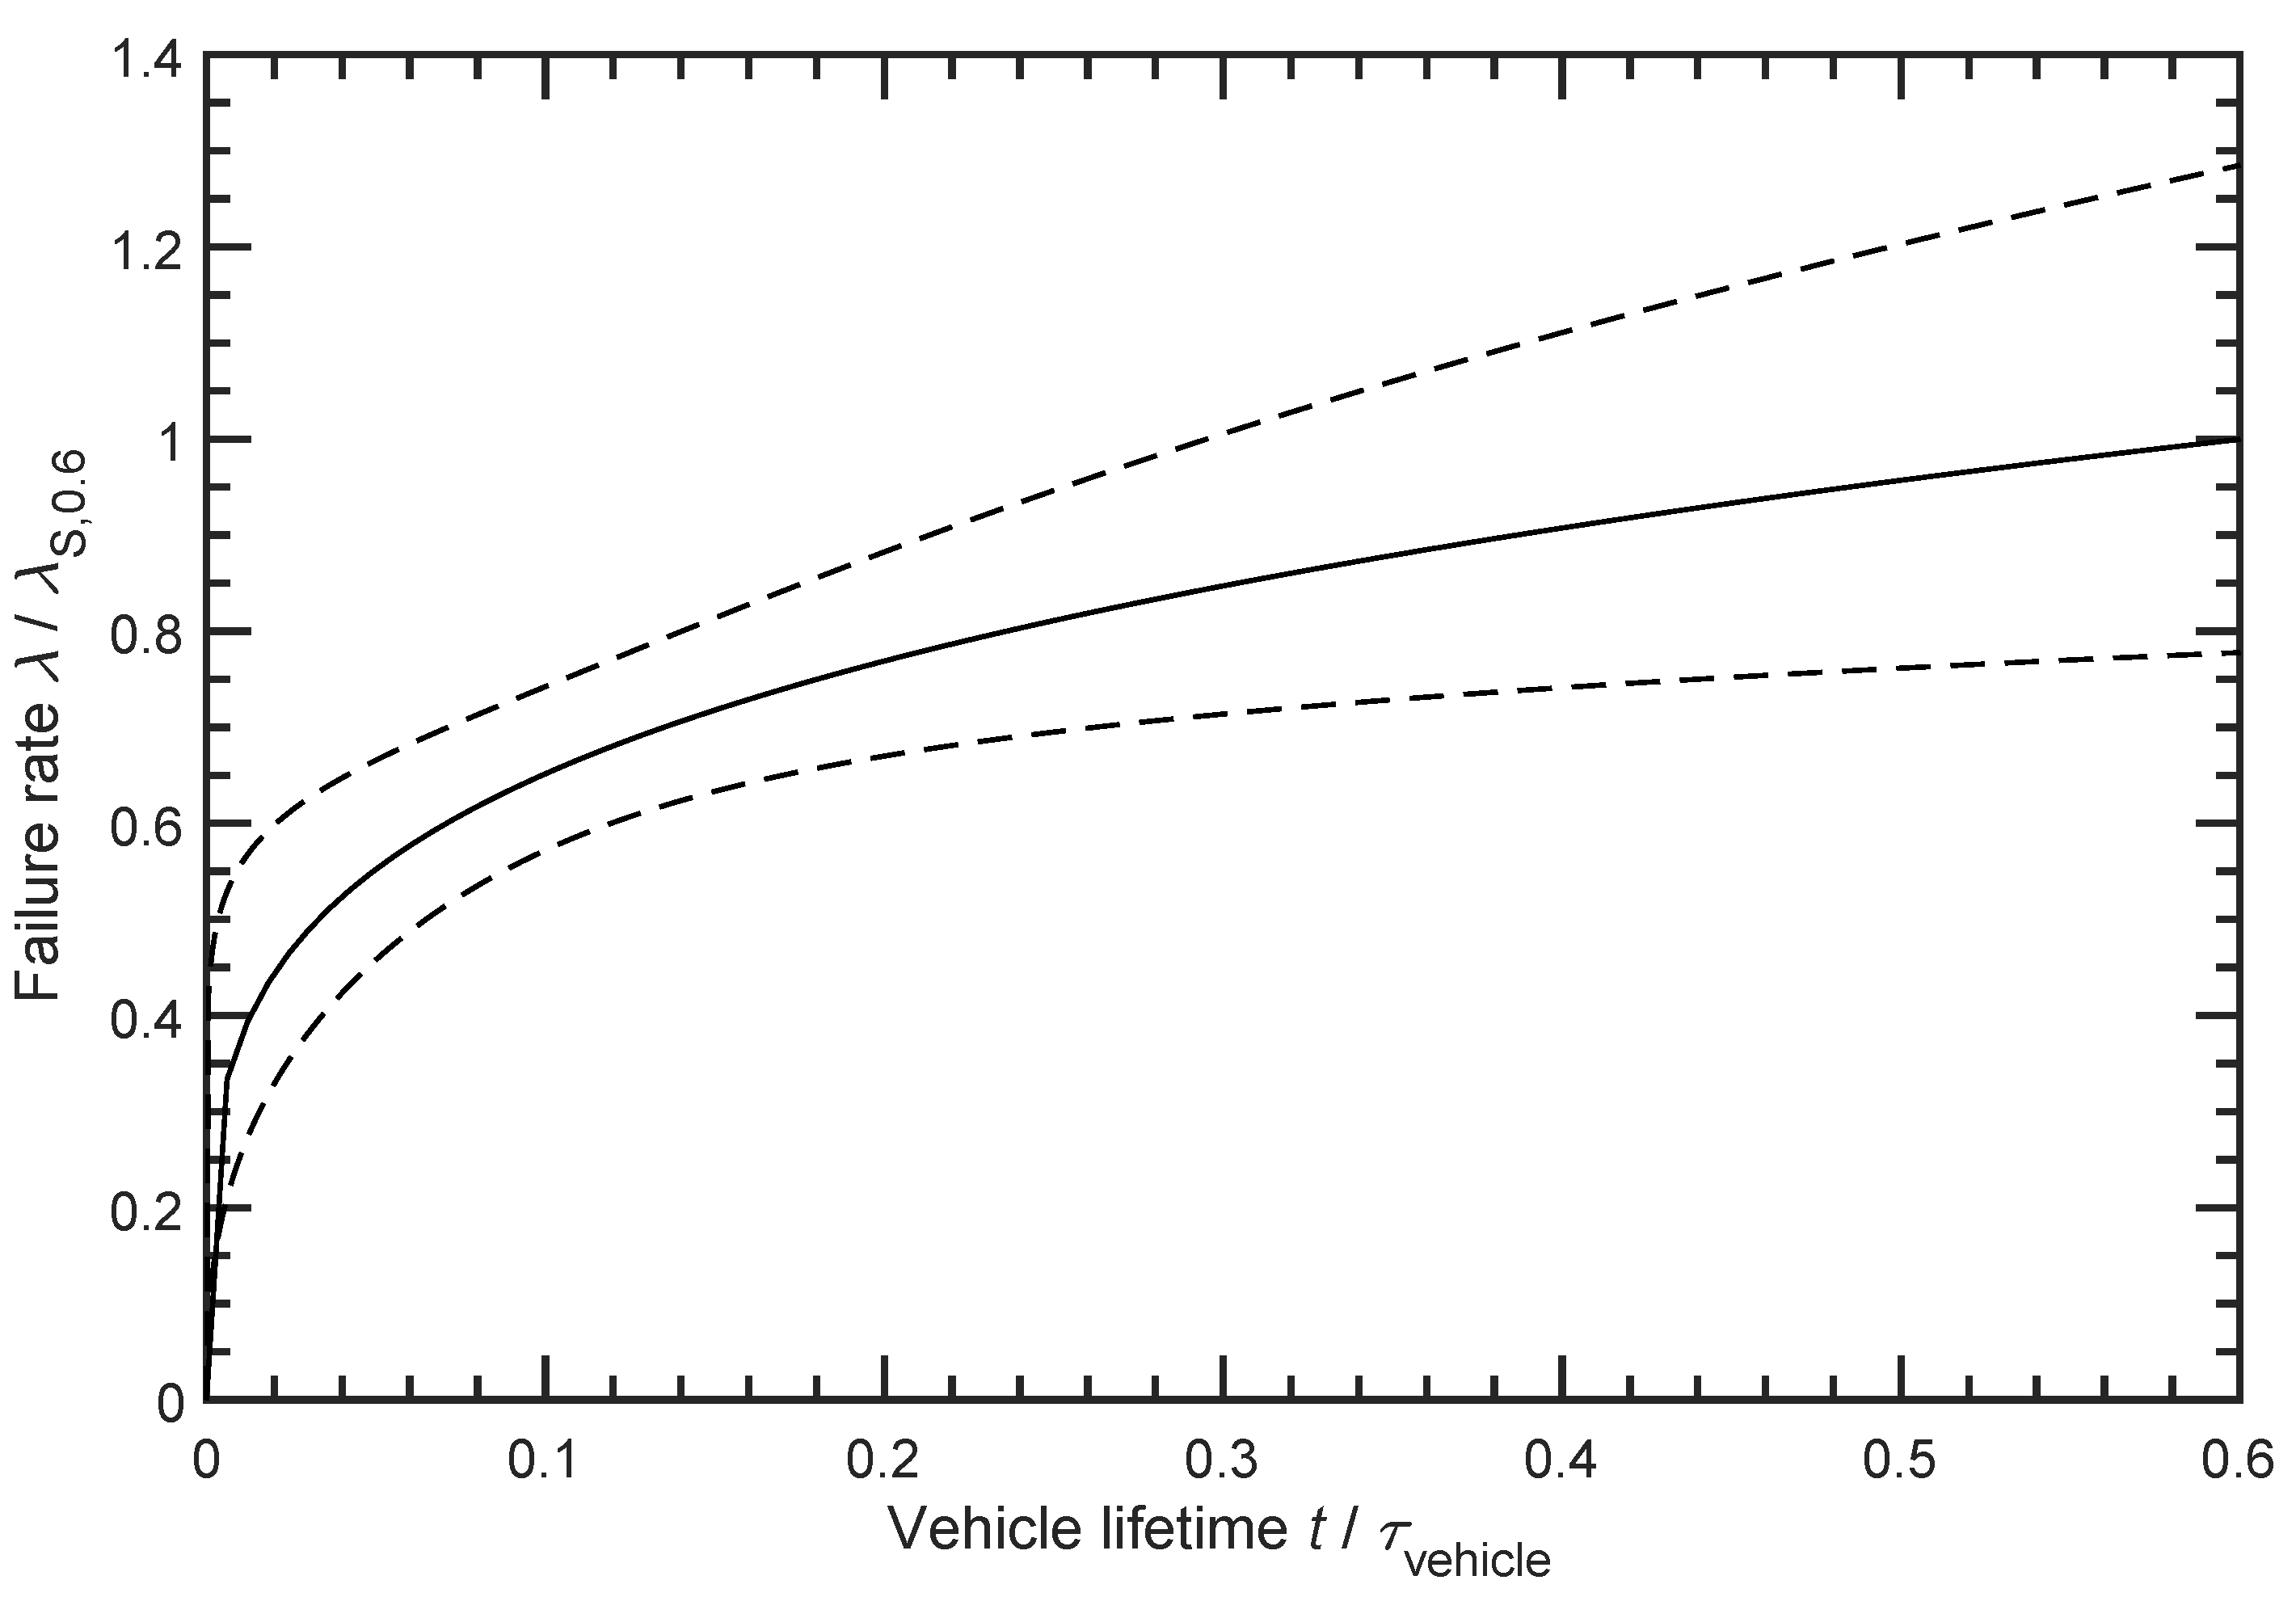
The failure rates are normalised by failure rate of the functional batteries of the failure mode Serviceable according to Equation (8). Consequently the still good batteries and their failure rate is displayed at first in Figure 3.
The pattern of the failure rate of the failure mode Serviceable in Figure 3 clearly belongs to the category of random failures with a shape parameter very close to b = 1. This makes sense with the information about this failure mode according to Section 3.7. Since the batteries are still functional and there is no fault due to ageing, the battery changes in car workshops due to Serviceable are highly random and logically there is no progression, as expected with an ageing mechanism.
The failure rate of the first real failure mode Open Circuit is shown in Figure 4.
The failure rate in Figure 4 shows a pattern that cannot be clearly assigned to either random or ageing mechanisms. The failure rate increases with time for the shape parameter b = 1.819 determined by Weibull analysis. However, no clear assignment to ageing effects with linear or exponential increase and shape parameter or to completely random failures with shape parameter is possible. This uncertainty is also shown by the wide confidence bounds. Only a few batteries failed with this failure mode, as can be seen in Figure 2. The small sample size of this failure mode results in very wide confidence bounds. Thus, on the one hand, the progression of the failure rates could be rather exponential, as shown by the upper confidence limit. On the other hand, it could be almost randomly distributed, as the lower confidence limit shows. This could be explained by the knowledge of the failure mode Open Circuit from Section 3.3. It can be assumed that the Open Circuit is mainly caused by a mechanical impact from the outside and only in rare cases, e.g., corrosion inside leads to such strong instabilities that a rupture can occur due to normal vibrations in the vehicle. Before an Open Circuit occurs, a failure of the battery is more likely due to its greatly increased internal resistance. This Weibull statistical analysis shows that for the Open Circuit failure mode, different ageing mechanisms overlap and the failure rate does not show a consistent failure behaviour. According to the failure description in Section 3.3, an assignment of the failure mode Open Circuit to the sudden failures would fit but cannot be done definitively with this database. For this purpose, a larger sample and a longer observation period would make sense in order to obtain more meaningful results.
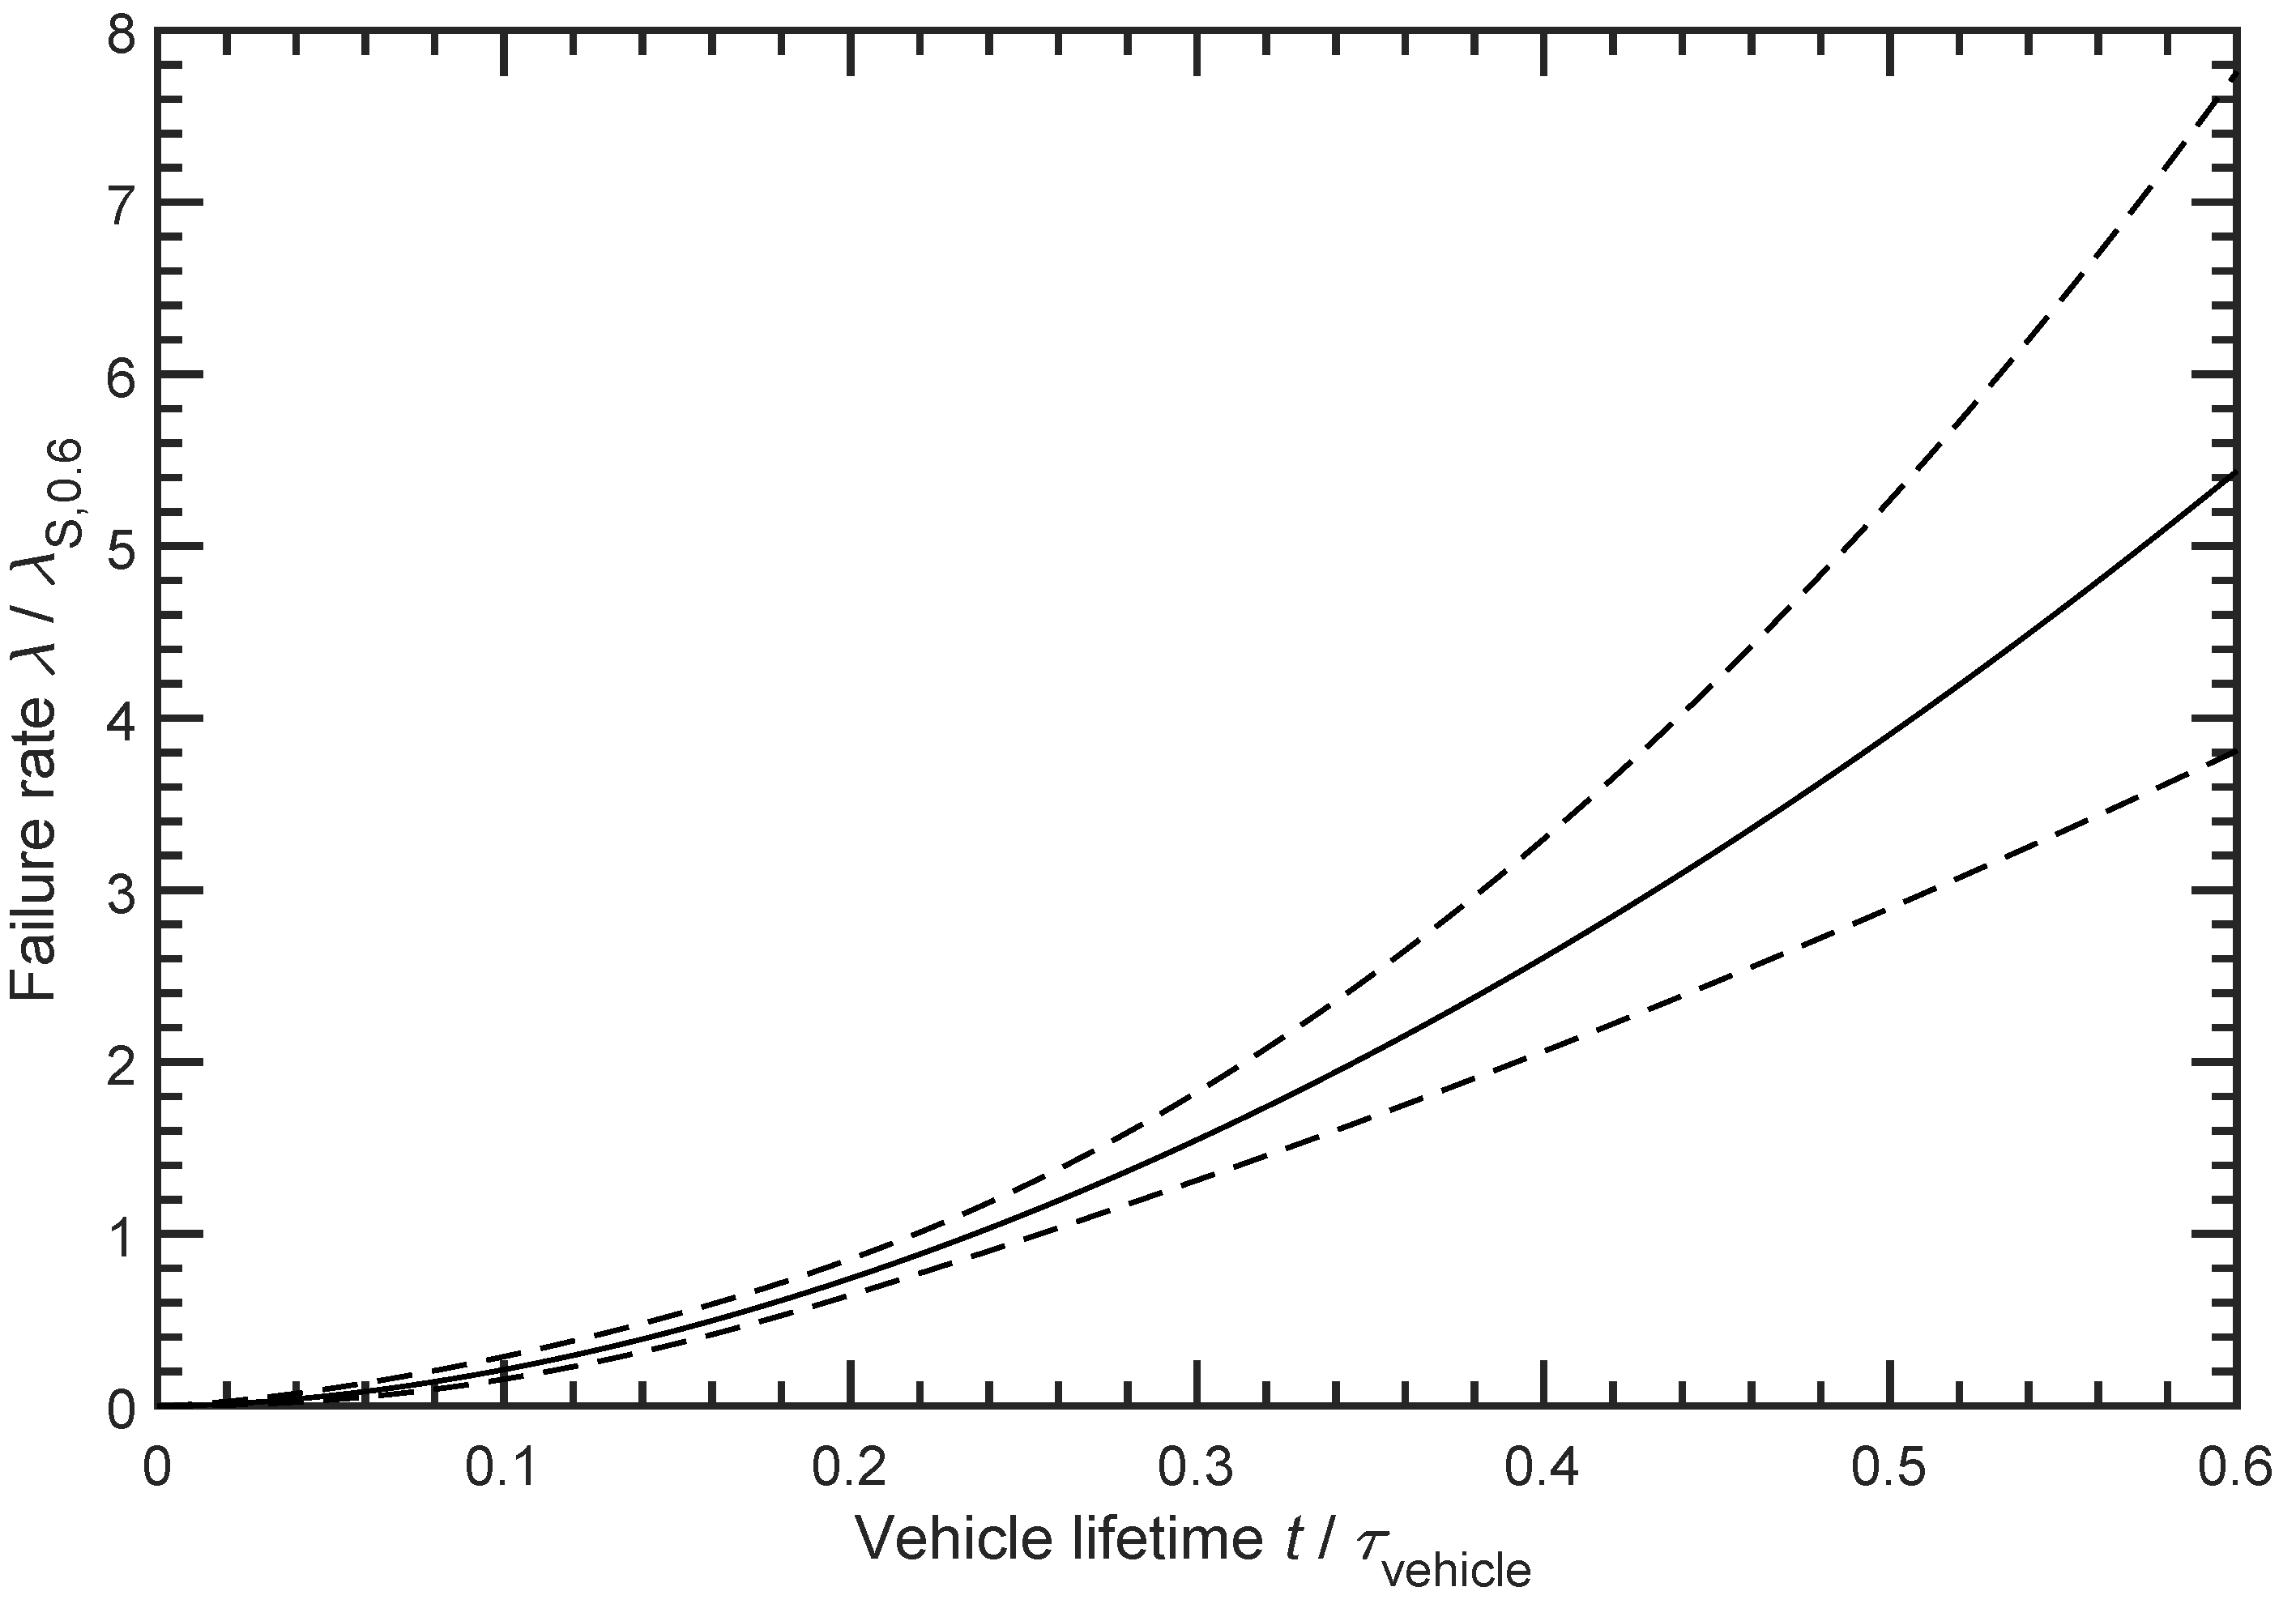
The next failure mode according to Table 2 is Plates and Grids and the corresponding failure rate is shown in Figure 5.
The development of the failure rate in Figure 5 shows a moderate exponential increase. The shape parameter b = 2.812 clearly belongs to the ageing effects, which are characterised by a shape parameter . With the knowledge of the ageing mechanism Plates and Grids from Section 3.4, the curve in Figure 5 is understandable. When the battery is not in use, only minor ageing takes place. Only with increasing time and use of the battery does the ageing effect become apparent and eventually lead to a failure of the battery due to increased internal resistance. The allocation of the failure mode Plates and Grids to the gradual faults is suitable for the curve according to Figure 5, resulting from the shape parameter b.
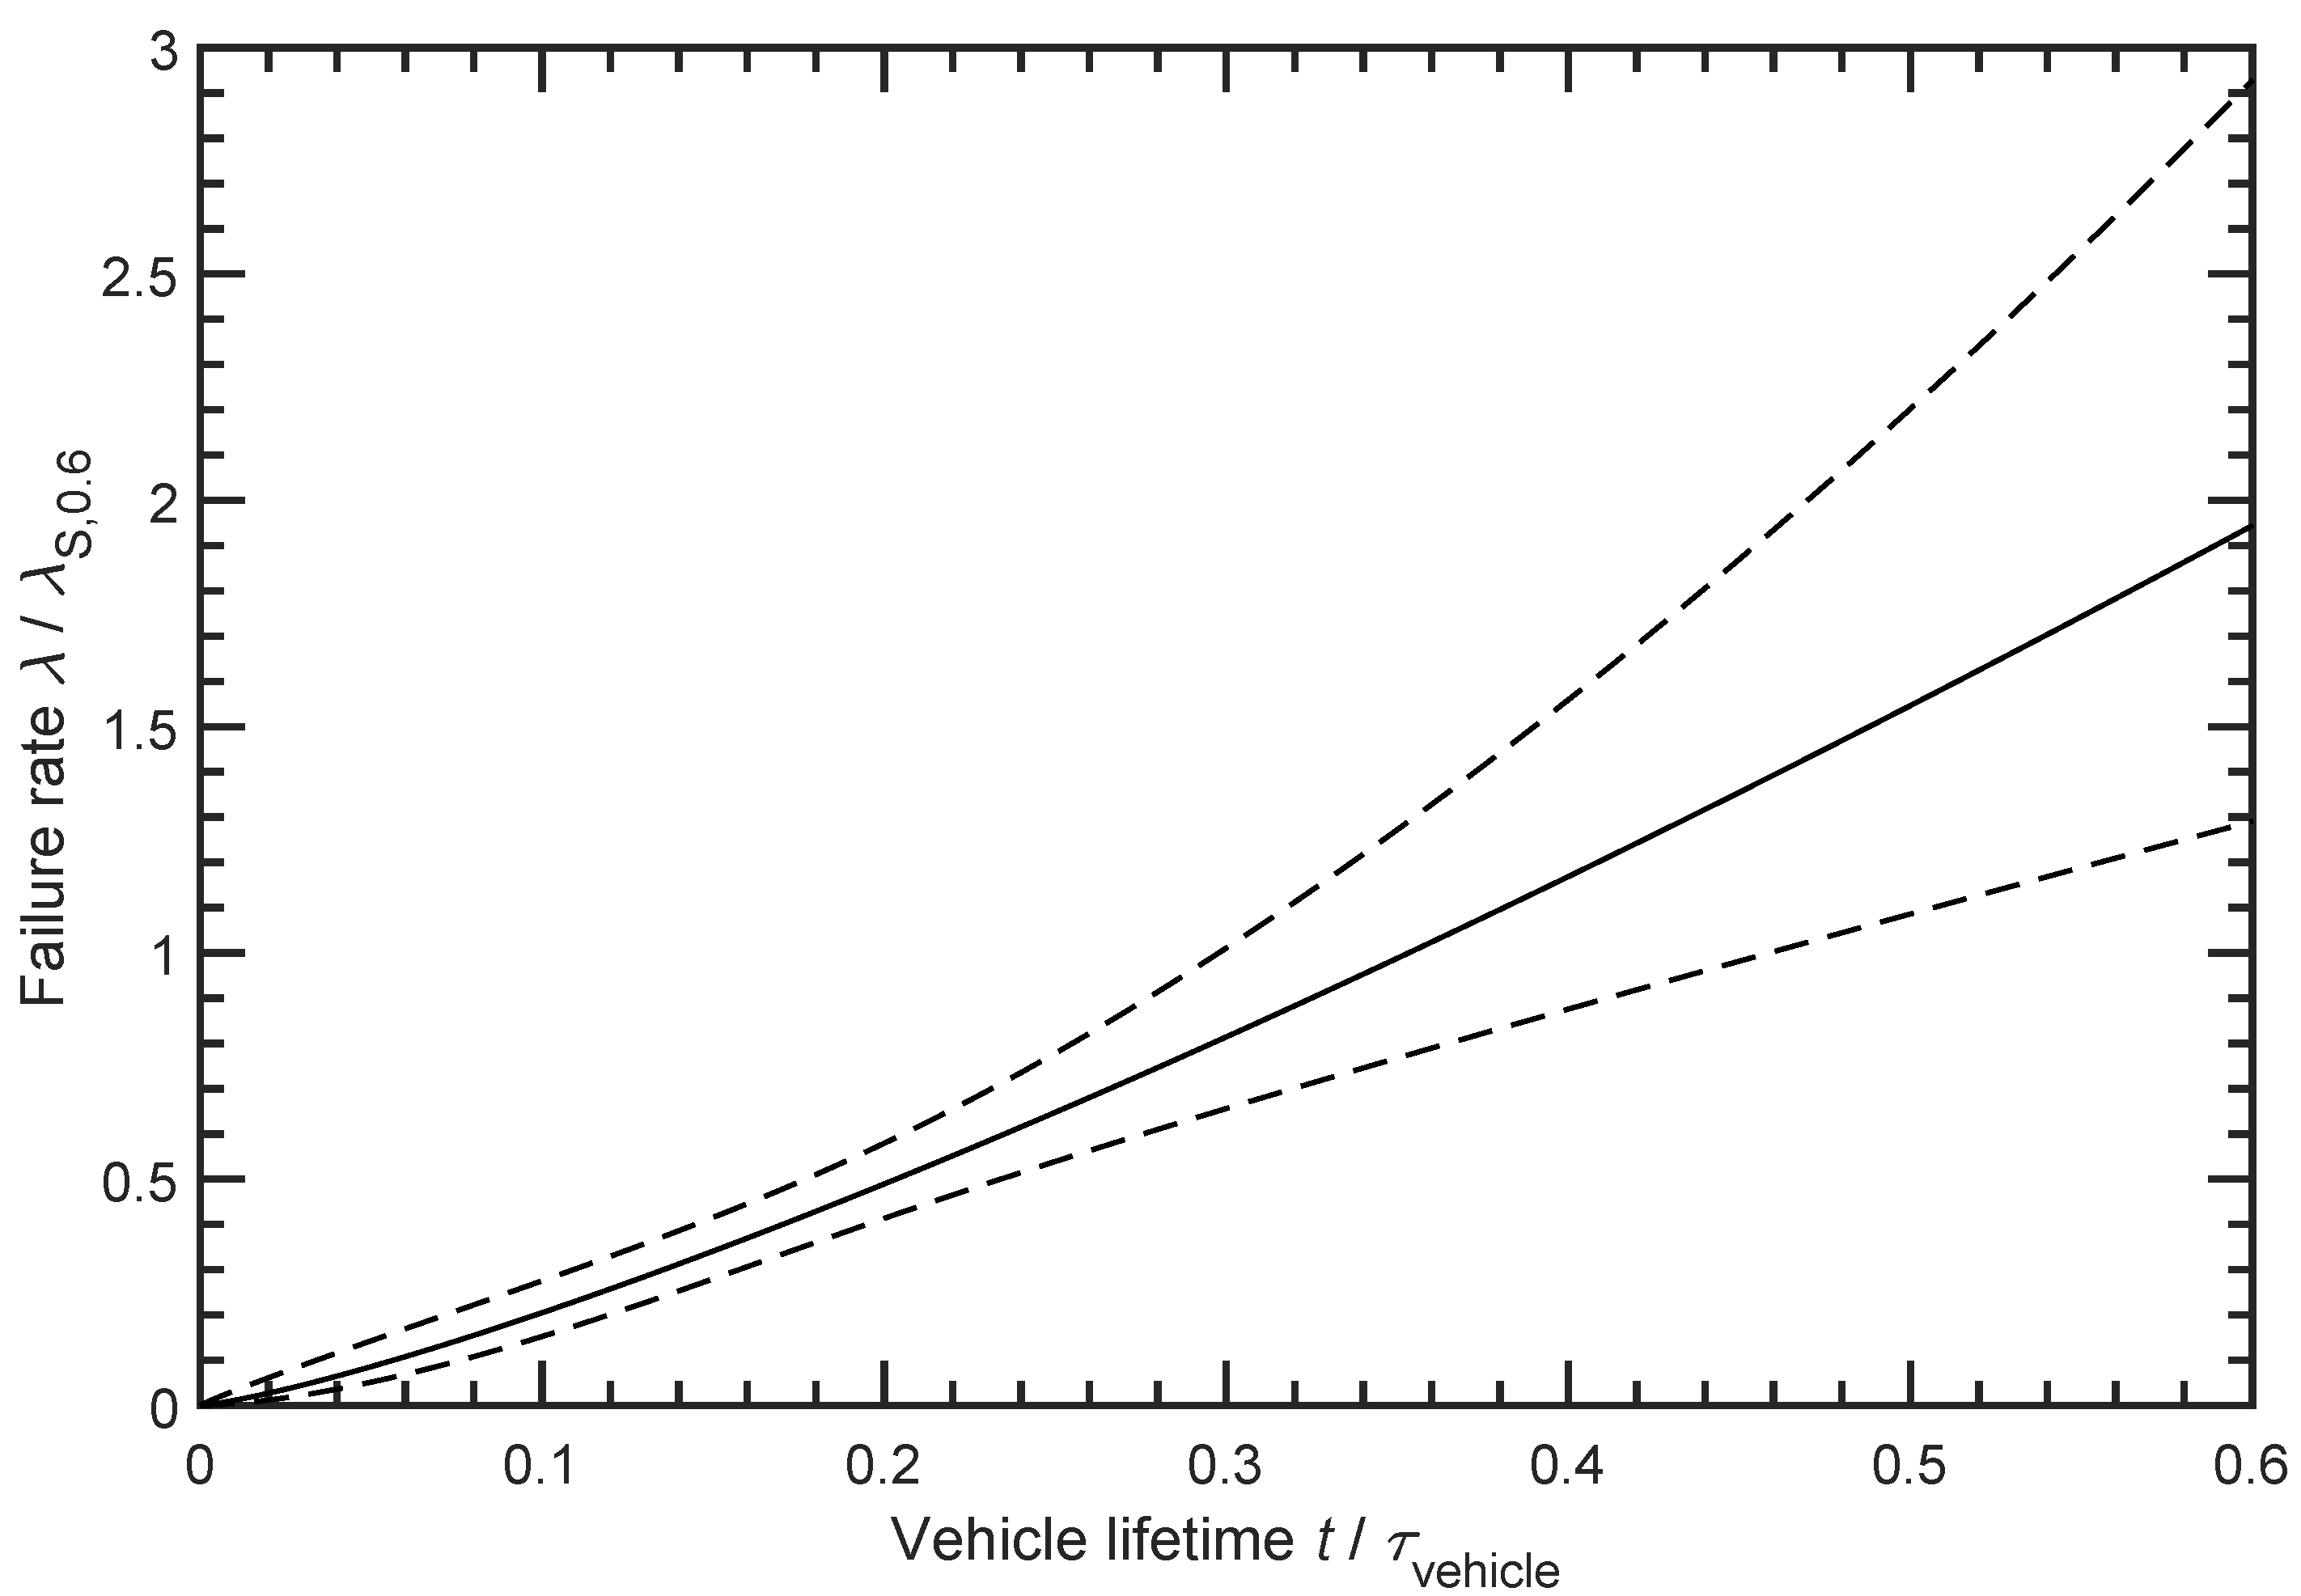
The following Figure 6 shows the normalised failure rate of the failure mode Worn out and Abused.
The shape of the failure mode Worn out and Abused in Figure 6 is almost linear with a shape parameter close to . This clearly indicates a wear failure or ageing mechanism. In addition, the scale parameter T shows that many batteries survive for a very long time of a typical vehicle lifetime until this failure mode becomes sufficiently dominant to cause the battery to fail. This can be well explained by Section 3.5, since capacity loss is decisively caused by cyclisation of the battery, which requires the battery to be used for a long time. The clear assignment of the failure mode to the ageing effects fits well with the gradual faults.
The failure mode Short Circuit is shown in Figure 7.
The development of the failure rate in Figure 7 shows a slightly exponential increase with the shape parameter b = 2.637. This indicates a strongly use-dependent ageing mechanism. According to Section 3.6, the failure mode Short Circuit can occur for different reasons. It can only occur completely randomly due to misuse from the outside or extreme operation out of specifications with frequent severe deep discharges, so dendrites can grow at an early stage. In normal use, energy management should protect the battery from frequent deep discharge conditions so that dendrite growth, if it occurs at all, takes a long time to develop. The comparatively small scale parameter T indicates vehicles in which the energy management is poor from the start and the battery is thus exposed to frequent deep discharges early on.
The results of the Weibull adaptation and the Weibull parameters determined on the basis of the BCI 2015 Report on Battery Failure Modes field data and the visualised failure rates for the individual failure modes are summarised and discussed in the following Section 5.
5. Conclusions
Reliability analyses in vehicles are becoming increasingly important due to the complexity of vehicles. To ensure safe operation, proof of reliability must be provided for more components. In this study, an approach to determine failure rates for lead batteries from field data is presented. It has been shown that the statistical reliability analysis can also be applied to electrochemical components to derive appropriate failure rates. In particular, by knowing the reason for the failure of the lead battery, the developments of the failure modes over time as shown can be understood but also justified.
Batteries with the failure mode Serviceable show a progression of the failure rate over time, which clearly indicates random failures, as the failure description indicated. The failure mode Open Circuit, on the other hand, shows a failure behaviour over time that cannot be clearly assigned to random or ageing failures. The small sample size and the short observation period can have a negative influence on the accuracy of the Weibull analysis. For a longer observation period, a clearer result could emerge for the failure mode Open Circuit and a clearer assignment to sudden faults or gradual faults could be possible. The two failure modes, Plates and Grids as well as Worn out and Abused, show progressions of the failure rates over time, which can clearly be assigned to the ageing mechanisms. The last investigated failure mode Short Circuit can, according to the description in Section 3.6, arise due to dendrites slowly developing through deep discharges, also called soft short, or due to hard short circuits caused by external rather random influences. The determined failure rate for the failure mode Short Circuit shows an exponential progression over time and is rather to be assigned to the wear or ageing mechanisms for these data.
With the presented approach, ageing models for the investigated failure modes can be determined from field data, which are useful for the safety analysis in the power supply system and the entire vehicle. The field data examined are still based on conventional vehicles in which the lead battery is used as a typical starter battery. In future driving applications, however, a 12 V battery will be needed in the power supply system, which will not be used for starting the engine anymore but much more for the safe supply of energy in critical cases. This means that the 12 V battery must provide the energy and power for a so-called safe stop scenario, which brings the vehicle to a safe stop at the emergency lane by a double lane change. These requirements are of course different from those of a conventional, mainly manually driven vehicle. Thus, the battery is continuously monitored and operated in a favourable operating range for the battery. By monitoring the battery’s condition and ageing progress, it is possible to replace the battery before it fails, so that critical failures can be avoided.
Nevertheless, this study used these old field data from outdated batteries just to show the approach for future field investigations on batteries to determine relevant failure rates for future driving applications. Therefore, in further investigations, the collected lead batteries could be tested with the new failure criterion of a defined safe stop scenario when collecting field data. Furthermore, the determination of the failure mode by tear down analysis is prone to subjective evaluations. One possibility would be to electrically test the collected batteries and evaluate their ageing progress with objective criteria. This would be useful for assessing the reliability of 12 V batteries such as lead batteries for future driving applications.
Author Contributions
Conceptualization, R.C., F.H. and K.P.B.; methodology, R.C. and F.H.; software, R.C.; validation, R.C. and F.H.; formal analysis, R.C. and F.H.; investigation, R.C. and F.H.; resources, R.C.; data curation, R.C.; writing—original draft preparation, R.C.; writing—review and editing, R.C.; visualization, R.C.; supervision, F.H. and K.P.B.; project administration, R.C. and F.H.; All authors have read and agreed to the published version of the manuscript.
Funding
This research received no external funding.
Institutional Review Board Statement
Not applicable.
Informed Consent Statement
Not applicable.
Data Availability Statement
Not applicable.
Conflicts of Interest
The authors declare no conflict of interest.
References
- Stolte, T.; Bagschik, G.; Maurer, M. Safety goals and functional safety requirements for actuation systems of automated vehicles. In Proceedings of the IEEE 19th International Conference on Intelligent Transportation Systems (ITSC), Rio de Janeiro, Brazil, 1–4 November 2016. [Google Scholar]
- Dominguez-Garcia, A.D.; Kassakian, J.G.; Schindall, J.E. Reliability evaluation of the power supply of an electrical power net for safety-relevant applications. Reliab. Eng. Syst. Saf. 2006, 5, 505–514. [Google Scholar] [CrossRef]
- Kurita, Y.; Münzing, P.; Koller, O. Future Powernet Topology for Automated Driving. In Proceedings of the 2017 JSAE Annual Congress, Yokohama, Japan, 24–26 May 2017; pp. 109–114. [Google Scholar]
- Koehler, A.; Bertsche, B. An Approach of Fail Operational Power Supply for Next Generation Vehicle Powernet Architectures. In Proceedings of the 30th European Safety and Reliability Conference and 15th Probabilistic Safety Assessment and Management Conference (ESREL2020-PSAM15), Venice, Italy, 1–5 November 2020; pp. 32–58. [Google Scholar] [CrossRef]
- Koehler, A.; Bertsche, B. Cyclisation of Safety Diagnoses: Influence on the Evaluation of Fault Metrics. In Proceedings of the 67th Annual Reliability & Maintainability Symposium (RAMS2021), Orlando, FL, USA, 24–27 May 2021. to be published. [Google Scholar]
- Albers, J.; Koch, I. Functional Safety of Lead-acid Batteries in New Vehicle Applications. In Proceedings of the 14th European Lead Battery Conference, Edinburgh, Scotland, 9–12 September 2014. [Google Scholar]
- Albers, J.; Koch, I. Reliability of lead-acid batteries. In The Printed Proceedings of EEHE 2016 Elektrik/Elektronik in Hybrid- und Elektrofahrzeugen und elektrisches Energiemanagement VII; Expert Publishers: Tübingen, Germany, 2016; ISBN 978-3-8169-3346-5. [Google Scholar]
- ADAC e.V. Pannenstatistik 2014. Allgemeiner Deutscher Automobil-Club e.V. 2014. Available online: https://bit.ly/3eqyYyf (accessed on 9 June 2021).
- Mürken, M.; Kübel, D.; Thanheiser, A.; Gratzfeld, P. Analysis of automotive lead-acid batteries exchange rate on the base of field data acquisition. In Proceedings of the IEEE International Conference on Electrical Systems for Aircraft, Railway, Ship Propulsion and Road Vehicles International Transportation Electrification Conference (ESARS-ITEC), Nottingham, UK, 7–9 November 2018; pp. 1–6. [Google Scholar]
- Kumar, E.S.; Sarkar, B. Improvement of life time and reliability of battery. Int. J. Eng. Sci. Adv. Technol. 2012, 2, 1210–1217. [Google Scholar]
- ADAC e.V. Pannenstatistik 2020. Allgemeiner Deutscher Automobil-Club e.V. 2020. Available online: https://bit.ly/3srT4gn (accessed on 9 June 2021).
- Knauer, D. Report on Battery Failure Modes; Battery Council International: Chicago, IL, USA, 2020. [Google Scholar]
- Knauer, D. Report on Battery Failure Modes; Battery Council International: Chicago, IL, USA, 2015. [Google Scholar]
- Pasha, G.R.; Khan, M.S.; Pasha, A.H. Empirical analysis of the Weibull distribution for failure data. J. Stat. 2006, 10, 33–45. [Google Scholar]
- Bertsche, B.; Lechner, G. Zuverlässigkeit im Fahrzeug-und Maschinenbau: Ermittlung von Bauteil-und System-Zuverlässigkeiten; Springer: Berlin, Germany, 2006. [Google Scholar]
- Cohen, A.C. Maximum likelihood estimation in the Weibull distribution based on complete and on censored samples. Technometrics 1965, 7, 579–588. [Google Scholar] [CrossRef]
- Zhang, L.F.; Xie, M.; Tang, L.C. Bias correction for the least squares estimator of Weibull shape parameter with complete and censored data. Reliab. Eng. Syst. Saf. 2006, 8, 930–939. [Google Scholar] [CrossRef]
- Tevetoglu, T.; Bertsche, B. On the Coverage Probability of Bias-Corrected Confidence Bounds. In Proceedings of the Asia-Pacific International Symposium on Advanced Reliability and Maintenance Modeling (APARM), Vancouver, BC, Canada, 20–23 August 2020; pp. 1–6. [Google Scholar]
- Ross, R. Bias and standard deviation due to Weibull parameter estimation for small data sets. IEEE Trans. Dielectr. Electr. Insul. 1996, 3, 28–42. [Google Scholar] [CrossRef]
- Blei-Akkumulatoren-Starterbatterien Teil 2: Maße von Batterien und Kennzeichnung von Anschlüssen—DIN EN 50342-2; Verband der Elektrotechnik, Elektronik und Informationstechnik: Frankfurt am Main, Germany, 2021.
- Lead-Acid Starter Batteries—JSA JIS D 5301; Japanese Standards Association: Tokyo, Japan, 2019.
- Ruetschi, P. Aging mechanisms and service life of lead–acid batteries. J. Power Source 2004, 127, 33–44. [Google Scholar] [CrossRef]
- Brik, K.; Ammar, F. Causal tree analysis of depth degradation of the lead acid battery. J. Power Source 2013, 228, 39–46. [Google Scholar] [CrossRef]
- Culpin, B.; Rand, D.A.J. Failure modes of lead/acid batteries. J. Power Source 1991, 4, 415–438. [Google Scholar] [CrossRef]
- Zeng, Y.; Hu, J.; Ye, W.; Zhao, W.; Zhou, G.; Yonglang, G. Investigation of lead dendrite growth in the formation of valveregulated lead-acid batteries for electric bicycle applications. J. Power Source 2015, 286, 182–192. [Google Scholar] [CrossRef]
Figure 1.
The total sample as a sum of all failures modes is shown in this graph for a time period of 12 years. On the left side the empirical probability of failure F(t) is shown [13].
Figure 1.
The total sample as a sum of all failures modes is shown in this graph for a time period of 12 years. On the left side the empirical probability of failure F(t) is shown [13].

Figure 2.
The major five failure modes found by BCI are shown for the total sample. The individual probability of failures F(t) is displayed for a time period of 4 years [13].
Figure 2.
The major five failure modes found by BCI are shown for the total sample. The individual probability of failures F(t) is displayed for a time period of 4 years [13].

Figure 3.
The normalised failure rate of the failure mode Serviceable with a shape parameter b = 1.239 and a normalised scale parameter T = 1.134 is shown. In addition, the upper and lower confidence limits for a confidence level of 95% are displayed.
Figure 3.
The normalised failure rate of the failure mode Serviceable with a shape parameter b = 1.239 and a normalised scale parameter T = 1.134 is shown. In addition, the upper and lower confidence limits for a confidence level of 95% are displayed.

Figure 4.
The normalised failure rate of the failure mode Open Circuit with the estimated shape parameter b = 1.819 and a normalised scale parameter T = 2.127 is shown. In addition, the upper and lower confidence limits for a confidence level of 95% are displayed.
Figure 4.
The normalised failure rate of the failure mode Open Circuit with the estimated shape parameter b = 1.819 and a normalised scale parameter T = 2.127 is shown. In addition, the upper and lower confidence limits for a confidence level of 95% are displayed.

Figure 5.
The normalised failure rate of the failure mode Plates and Grids with a shape parameter b = 2.812 and a normalised scale parameter T = 0.582 is shown. In addition, the upper and lower confidence limits for a confidence level of 95% are displayed.
Figure 5.
The normalised failure rate of the failure mode Plates and Grids with a shape parameter b = 2.812 and a normalised scale parameter T = 0.582 is shown. In addition, the upper and lower confidence limits for a confidence level of 95% are displayed.

Figure 6.
The normalised failure rate of the failure mode Worn out and Abused with a shape parameter b = 2.255 and a normalised scale parameter T = 0.826 is shown. In addition, the upper and lower confidence limits for a confidence level of 95% are displayed.
Figure 6.
The normalised failure rate of the failure mode Worn out and Abused with a shape parameter b = 2.255 and a normalised scale parameter T = 0.826 is shown. In addition, the upper and lower confidence limits for a confidence level of 95% are displayed.

Figure 7.
The normalised failure rate of the failure mode Short Circuit with a shape parameter b = 2.637 and a normalised scale parameter T = 0.596 is shown. In addition, the upper and lower confidence limits for a confidence level of 95% are displayed.
Figure 7.
The normalised failure rate of the failure mode Short Circuit with a shape parameter b = 2.637 and a normalised scale parameter T = 0.596 is shown. In addition, the upper and lower confidence limits for a confidence level of 95% are displayed.


Table 1.
Example of a table to censor data according to the failure mode and time.
| Lifetime [h] | Failure Mode A | Failure Mode B | Functional |
|---|---|---|---|
| 10,000 | 1 | 0 | 0 |
| 20,000 | 1 | 0 | 0 |
| 15,000 | 0 | 1 | 0 |
| 25,000 | 0 | 1 | 0 |
| 5000 | 0 | 0 | 1 |
| 15,000 | 0 | 0 | 1 |
| 35,040 | 0 | 0 | 0 |
| 35,040 | 0 | 0 | 0 |
| 35,040 | 0 | 0 | 0 |
Table 2.
Determined Weibull parameters for the failure modes of the total sample. The table shows the estimated shape parameter b for each failure mode and the normalised scale parameter T by a typical vehicle lifetime . (Analysis method: MLE; Rank method: Median ranks; Confidence bounds method: Fisher matrix; unbiasing parameters)
| Failure Mode | Shape Parameter b | Normalised Scale Parameter T |
|---|---|---|
| Serviceable | 1.239 | 1.134 |
| Open Circuit | 1.819 | 2.127 |
| Plates & Grids | 2.812 | 0.582 |
| Worn out & Abused | 2.255 | 0.826 |
| Short Circuit | 2.637 | 0.596 |
Publisher’s Note: MDPI stays neutral with regard to jurisdictional claims in published maps and institutional affiliations. |
© 2021 by the authors. Licensee MDPI, Basel, Switzerland. This article is an open access article distributed under the terms and conditions of the Creative Commons Attribution (CC BY) license (https://creativecommons.org/licenses/by/4.0/).
Share and Cite
MDPI and ACS Style
Conradt, R.; Heidinger, F.; Birke, K.P. Methodology for Determining Time-Dependent Lead Battery Failure Rates from Field Data. Batteries 2021, 7, 39. https://0-doi-org.brum.beds.ac.uk/10.3390/batteries7020039
AMA Style
Conradt R, Heidinger F, Birke KP. Methodology for Determining Time-Dependent Lead Battery Failure Rates from Field Data. Batteries. 2021; 7(2):39. https://0-doi-org.brum.beds.ac.uk/10.3390/batteries7020039
Chicago/Turabian StyleConradt, Rafael, Frederic Heidinger, and Kai Peter Birke. 2021. "Methodology for Determining Time-Dependent Lead Battery Failure Rates from Field Data" Batteries 7, no. 2: 39. https://0-doi-org.brum.beds.ac.uk/10.3390/batteries7020039
Note that from the first issue of 2016, this journal uses article numbers instead of page numbers. See further details here.