Article

Absolute Local Quantification of Li as Function of State-of-Charge in All-Solid-State Li Batteries via 2D MeV Ion-Beam Analysis

1
Institute of Energy and Climate Research, Materials Synthesis and Processing (IEK-1), Forschungszentrum Jülich GmbH, Wilhelm Johnen Str., 52425 Jülich, Germany
2
National Institutes for Quantum and Radiological Science and Technology, 1233 Watanuki-machi, Takasaki 370-1292, Gunma, Japan
3
MEET—Münster Electrochemical Energy Technology, Corrensstraße 46, 48149 Münster, Germany
4
Institute of Energy and Climate Research, Helmholtz-Institute Münster (IEK-12), Forschungszentrum Jülich GmbH, Corrensstraße 46, 48149 Münster, Germany
5
Graduate School of Science and Technology, Gunma University, 1-5-1 Tenjin-cho, Kiryu 376-8515, Gunma, Japan
6
The Graduate School for the Creation of New Photonics, 1955-1 Kurematsu, Nishiku, Hamamatsu 431-1202, Shizuoka, Japan
7
Department of Chemical Science and Engineering—School of Materials and Chemical Technology, Tokyo Institute of Technology, 4259 Nagatsuta, Midori-ku, Yokohama 226-8502, Kanagawa, Japan
8
Institute of Laser Engineering, Osaka University, 2-6 Yamadaoka, Suita 565-0871, Osaka, Japan
*
Authors to whom correspondence should be addressed.
Submission received: 3 May 2021 / Revised: 11 June 2021 / Accepted: 15 June 2021 / Published: 20 June 2021
(This article belongs to the Special Issue Lithium-Ion Batteries Aging Mechanisms)

Abstract

:
Direct observation of the lithiation and de-lithiation in lithium batteries on the component and microstructural scale is still difficult. This work presents recent advances in MeV ion-beam analysis, enabling quantitative contact-free analysis of the spatially-resolved lithium content and state-of-charge (SoC) in all-solid-state lithium batteries via 3 MeV proton-based characteristic x-ray and gamma-ray emission analysis. The analysis is demonstrated on cross-sections of ceramic and polymer all-solid-state cells with LLZO and MEEP/LIBOB solid electrolytes. Different SoC are measured ex-situ and one polymer-based operando cell is charged at 333 K during analysis. The data unambiguously show the migration of lithium upon charging. Quantitative lithium concentrations are obtained by taking the physical and material aspects of the mixed cathodes into account. This quantitative lithium determination as a function of SoC gives insight into irreversible degradation phenomena of all-solid-state batteries during the first cycles and locations of immobile lithium. The determined SoC matches the electrochemical characterization within uncertainties. The presented analysis method thus opens up a completely new access to the state-of-charge of battery cells not depending on electrochemical measurements. Automated beam scanning and data-analysis algorithms enable a 2D quantitative Li and SoC mapping on the µm-scale, not accessible with other methods.

1. Introduction

The development of advanced lithium ion batteries (LIB) with higher energy and power densities and longer cycle- and shelf life while maintaining or even improving safety is a major scientific endeavor with high practical relevance. The majority of the cells on the market are still using the rocking-chair principle invented in the late 1980s and commercialized by Sony in the 1990s [1]. The large improvements in power and energy density seen over the past 3 decades stem mainly from optimization of the cell design, the electrode and separator microstructure, and active material optimizations. On the one hand, advanced active materials feature improved composition and microstructure on both the anode (e.g., Si-C mixtures [2,3]) and the cathode side (e.g., Ni-rich NMC [4,5]). On the other hand, the importance of the optimization on the microstructural “mesoscale” for further improvement of Li-ion batteries should not be underrated [1,6,7]. Nevertheless, the physico-chemical limits for the obtainable energy density on the cell level of Li-ion cells [8] requires a radical rethinking of materials, cell designs, and microstructure.
To aid in this, modelling of battery components and full cells started already in the 1990s with significant improvements in the past 15 years. The first simulations described the Li transport and insertion in the electrodes using porous electrode theory, homogenizing the simulated volume, and thus convoluting the morphological effects into mean properties [9,10,11]. Recent approaches, however, resolve the microstructure of the simulated electrode volume and enable investigations of local effects. Garcia et al. used a microstructure-resolved numerical finite-element model (FEM) to investigate the effect of Lithium accumulation in particles close to the separator, predicting the development of concentration fields during operation, which might lead to structural degradation of the active material [12]. In 2011, A. Latz and J. Zausch developed a microstructure-resolved model to investigate the effect of the multi-phase electrode morphology on the heat transport, leading to both an improved description for porous media theory models and microstructure-resolved models [13]. This approach was continued and refined [14], cumulating in the microscale modelling of Li-ion batteries [15] via simulation programs like BEST by Fraunhofer ITWM [16] or as added functionality in commercial software like GeoDict® by Math2Market. In all cases, microstructure-resolved modelling showed remarkable capability for knowledge-based optimization and is a powerful tool to further develop Li-based batteries on the meso- and micro-scale. This was recently successfully demonstrated for the prediction of the performance of thick cathodes for high energy LIBs. Starting with the validation of the model and prediction of limiting factors [17], the microstructures resulting from specific processing routes were investigated [18]. This knowledge was used to model, predict, and validate the influence of binder and carbon distribution and of the salt concentration on the battery performance of high-energy NMC-based LIBs [19,20].
However, direct verification of the simulated results requires in-situ or operando techniques in order to verify the results of the spatially-resolved simulations—e.g., (over-) potential or cation distribution maps. Here in-situ refers to measurements “in the natural or original position or place” [21]. Operando refers to measurements during operation or under operating conditions (e.g., cycling) [22]. The used techniques should be non-invasive and allow for measurements of cells as close to practical cells as possible [23]. Thus, quantifying all relevant elemental concentrations from H to Ta with about 1% precision and µm spatial resolution in a practical cell setup would provide the required detailed information on initial composition and dynamic evolution of element concentrations. Unfortunately, only a limited amount of techniques is available, which combine spatial “mapping” of elements with quantification of the respective atomic species without severe modification of the analyzed cell. So far, analytical techniques allowing for spatially-resolved measurements are based on either x-rays, electrons, neutrons, ions, VIS- and IR-light, or magnetic fields.
Small lab-scale equipment for electron-based techniques like scanning-electron microscopy (SEM) and light-based techniques like Raman and infrared spectroscopy are readily available to obtain morphological and chemical information of the surface or the sample. However, Li, as the most interesting atom and ion in the sample, cannot be measured or quantified directly by these methods. Furthermore, the surface sensitivity often hinders or prevents operando cell analysis.
Mid-scale lab equipment for magnetic resonance (MR) and transmission electron microscopy (TEM) techniques have the advantage of widespread availability and bulk probing capability. The complementary methods based on nuclear magnetic resonance (NMR) and electron paramagnetic resonance (EPR) offer the advantage of being quantitative, due to the knowledge of the skin depth. Therefore, they offer spatially resolved quantification of e.g., metallic Li-dendrites both in the early stages [23] and on large scales [24]. However, the requirements for sample preparation are rather high (very long and thin cells), the measurement times long (up to days), and the spatial resolution is low (tens–hundreds of µm). Thus, they are impractical for operando measurements of practical cells. Similarly, TEM cells for in-situ or operando measurements require difficult preparation techniques for the cells due to the requirement of ultra-high vacuum and, for high-resolution imaging, the field of view is limited to the nanoscale. Nevertheless, combined operando TEM–EELS measurements of solid-state cells very close to a practical cell design were demonstrated [25,26], yielding first insight into interface structures. Nevertheless, radiation damage induced by high-energy electron beams always has to be considered and often hampers measurements requiring long exposure times.
Large-scale user facilities like synchrotrons for x-ray-based techniques and fission reactors or spallation sources for neutron-based techniques offer extremely high spatial resolution coupled with chemical and/or structural information. Scanning transmission x-ray microscopy (STXM) in combination with near edge x-ray absorption fine structure (NEXAFS) provides high lateral resolution and even tomographic information (XTM) in the few 10 nm range. This allows for investigating the morphological evolution, oxidation state, and the chemical phase changes, as well as compositional changes of the active materials during battery operation [27,28]. However, due to the nature of x-ray absorption, low Z atoms such as Li, C, and O cannot be readily measured, and important materials and components like the organic electrolyte, anode active materials, and polymers contained in the cell remain invisible. Neutrons are complementary in this regard, showing large scattering and absorption/reaction cross-sections with light elements facilitating mapping and quantification of these elements both in-situ and operando. Neutron depth profiling (NDP) uses nuclear reactions with Li to quantify the Li content as a function of depth in working cells [29,30,31]. Nevertheless, a high spatial resolution, resulting from the energy-loss of the generated secondary particles, is only obtained in the direction of the beam (perpendicular to the sample surface), while the lateral resolution is defined by the collimation of the neutron beam and typically in the mm range. A comprehensive and well-written review on state of the art in-situ/operando methods for Li-ion battery research by D. Liu et al. can be found in [21].
A measurement technique that is not widely used in battery research yet is ion beam analysis (IBA). IBA requires mid-scale lab equipment. The more facile production and focusing of charged ions opens up the possibility of both high lateral and high depth resolution and, as the interactions of charged particles with matter numerous interactions, quantification of both light and heavy elements simultaneously is possible. The application of micro-beams in combination with Rutherford-backscattering spectrometry (RBS), nuclear reaction analysis (NRA), particle induced x-ray emission analysis (PIXE), and particle induced gamma-ray emission analysis (PIGE) was already successfully applied for the analysis of lithium battery materials [32,33]. These methods could also be used for powder, component, or full-cell analysis. However, they also pose some increased requirements in terms of thermal and radiation-induced displacement damage stability on the used materials in the cell. Especially, in the case of state-of-the art liquid electrolyte-based Li-ion batteries, the high vapor pressure and fast decomposition are challenging when irradiating with high-energy primary ions. Nevertheless, the application of IBA for conventional cells was successfully developed over the past decade by the authors and such cells were successfully measured in-situ and operando [34,35,36,37].
To further broaden the application range and tackle the challenges associated with liquid electrolytes, the advantages of new generations of batteries, especially those featuring solid-state electrolytes (all-solid-state batteries—ASBs) can be investigated with IBA. Due to their higher intrinsic stability towards ion bombardment and thermal stress, they are ideal candidates for the prolonged ion beam exposure during operando measurements, making potential drawbacks irrelevant. Three major solid electrolyte classes exist, namely polymers, sulphides, and oxides, each having a large variance in stability, processability, and material cost [38].
Sulphide solid electrolyte-based ASBs show excellent performance at room temperature, due to the extremely high conductivity of the electrolyte [39]. However, the limited chemical stability requires processing under inert conditions and the application of pressure during the operation of the cell [40]. Nevertheless, recent progress shows high energy density Li-metal ASBs based on an argyrodite electrolytes are prospective candidates for commercialization [41]. In previous works, we already showed the proof of concept of IBA based ex-situ analysis of sulphide-based cells [42]. The other two classes of solid electrolytes, solid polymers and ceramic oxides, show much lower ionic conductivity and thus often need to be operated at elevated temperatures to feature relevant capacities. In contrast to sulphide ASBs, they are more stable (especially against Li-metal anodes and processing in air) and require less external pressure applied during operation. Even though they are not on par with sulphide-based ASBs yet, promising lab-scale cells were previously demonstrated and reported by the authors for oxides [43,44] as well as polymers [45,46]. The need for elevated operational temperatures is not critical for ex-situ measurements, however, for in-situ or operando measurements, heating the sample to typical operating temperatures around 50–60 °C is challenging. The cell and its holder (including the thermal management system) need to be thermally isolated from the rest of the IBA setup and its detectors without introducing materials that will block or alter the measurement.
Starting with a similar setup from a former study with conventional Li-ion batteries [36,37], we adapted and improved the equipment and technique to enable ex-situ and operando measurements of polymer and oxide-based ASBs including an absolute quantification of Li at different states of charge (SoC). ASBs based on the ceramic, garnet-type solid-state Li-ion conductor Li6.6La3Zr1.6Ta0.4O12 (LLZO) and the dry polymer solid-electrolyte Poly[bis(2-2-methoxyethoxy)ethoxy)phosphazene] (MEEP) were fabricated in a cross-section geometry. Using 2-D PIXE and PIGE mapping, they were analyzed ex-situ in four different SoCs, and one polymer-based cell was measured operando at 60 °C during the charging process. The data analysis and methodical limits of micro-beam IBA were derived for each cell type and thus give sample preparation guidelines for optimized measurements in the future. Finally, we compare and discuss the SoC determined via electrochemical measurements with the quantitative IBA. This demonstration of the feasibility of 2-D mapping and absolute quantification using micro-beam IBA opens up a completely new era of spatially resolved, ex-situ, in-situ, and operando investigations of future Li batteries and enables a knowledge-driven design and validation of improvements on the microstructural level.

2. Results

This section discusses the results of the elemental profiling and the obtained SoCs. Section 4 lists the details of the sample preparation, the IBA methodology, and the uncertainties.

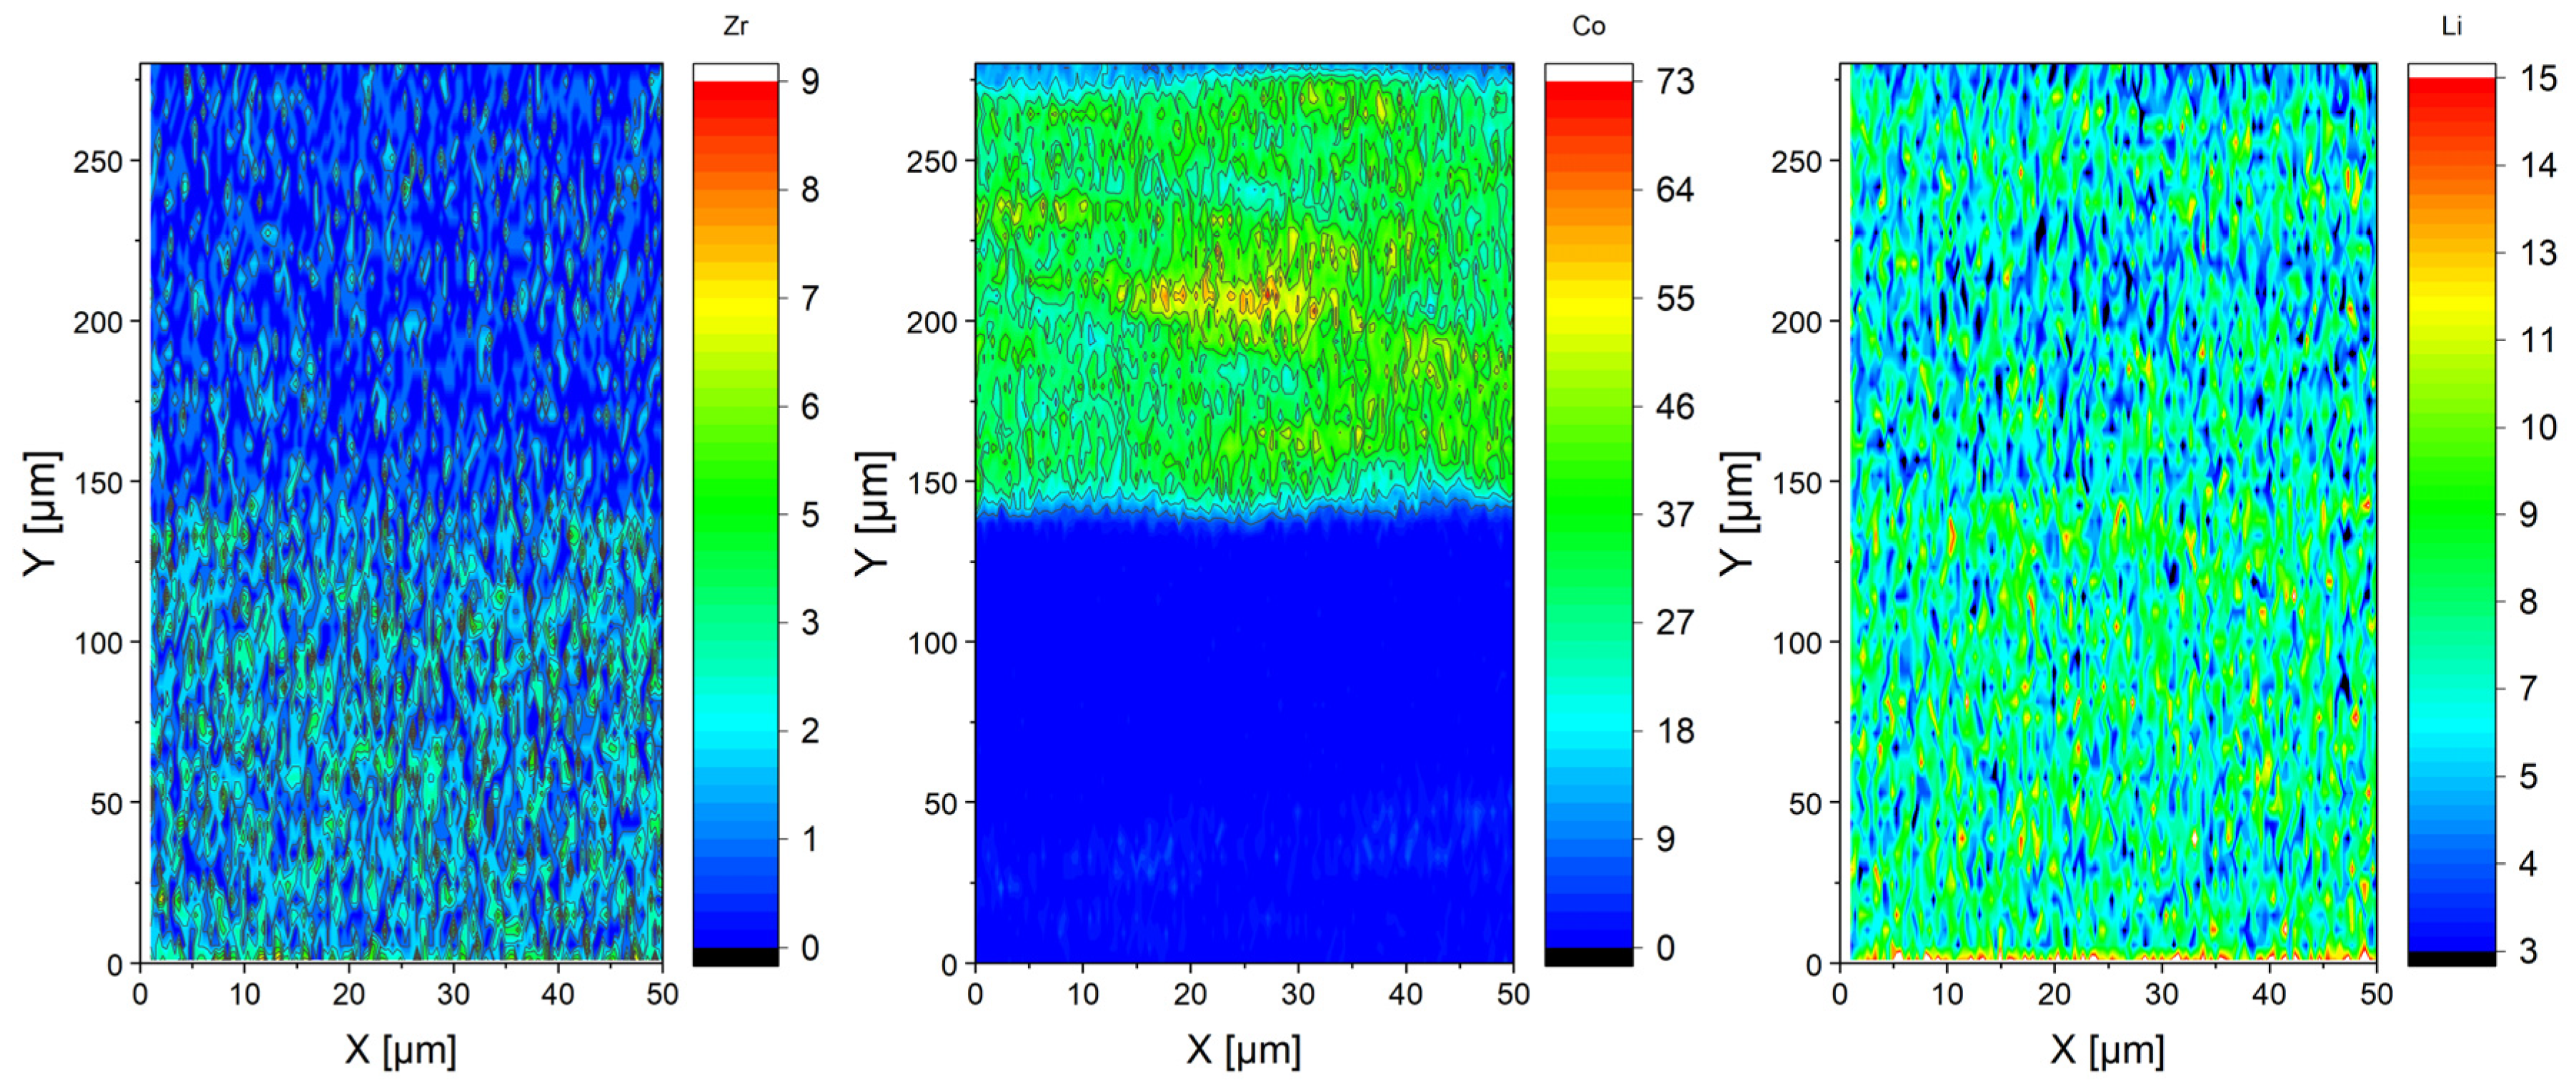
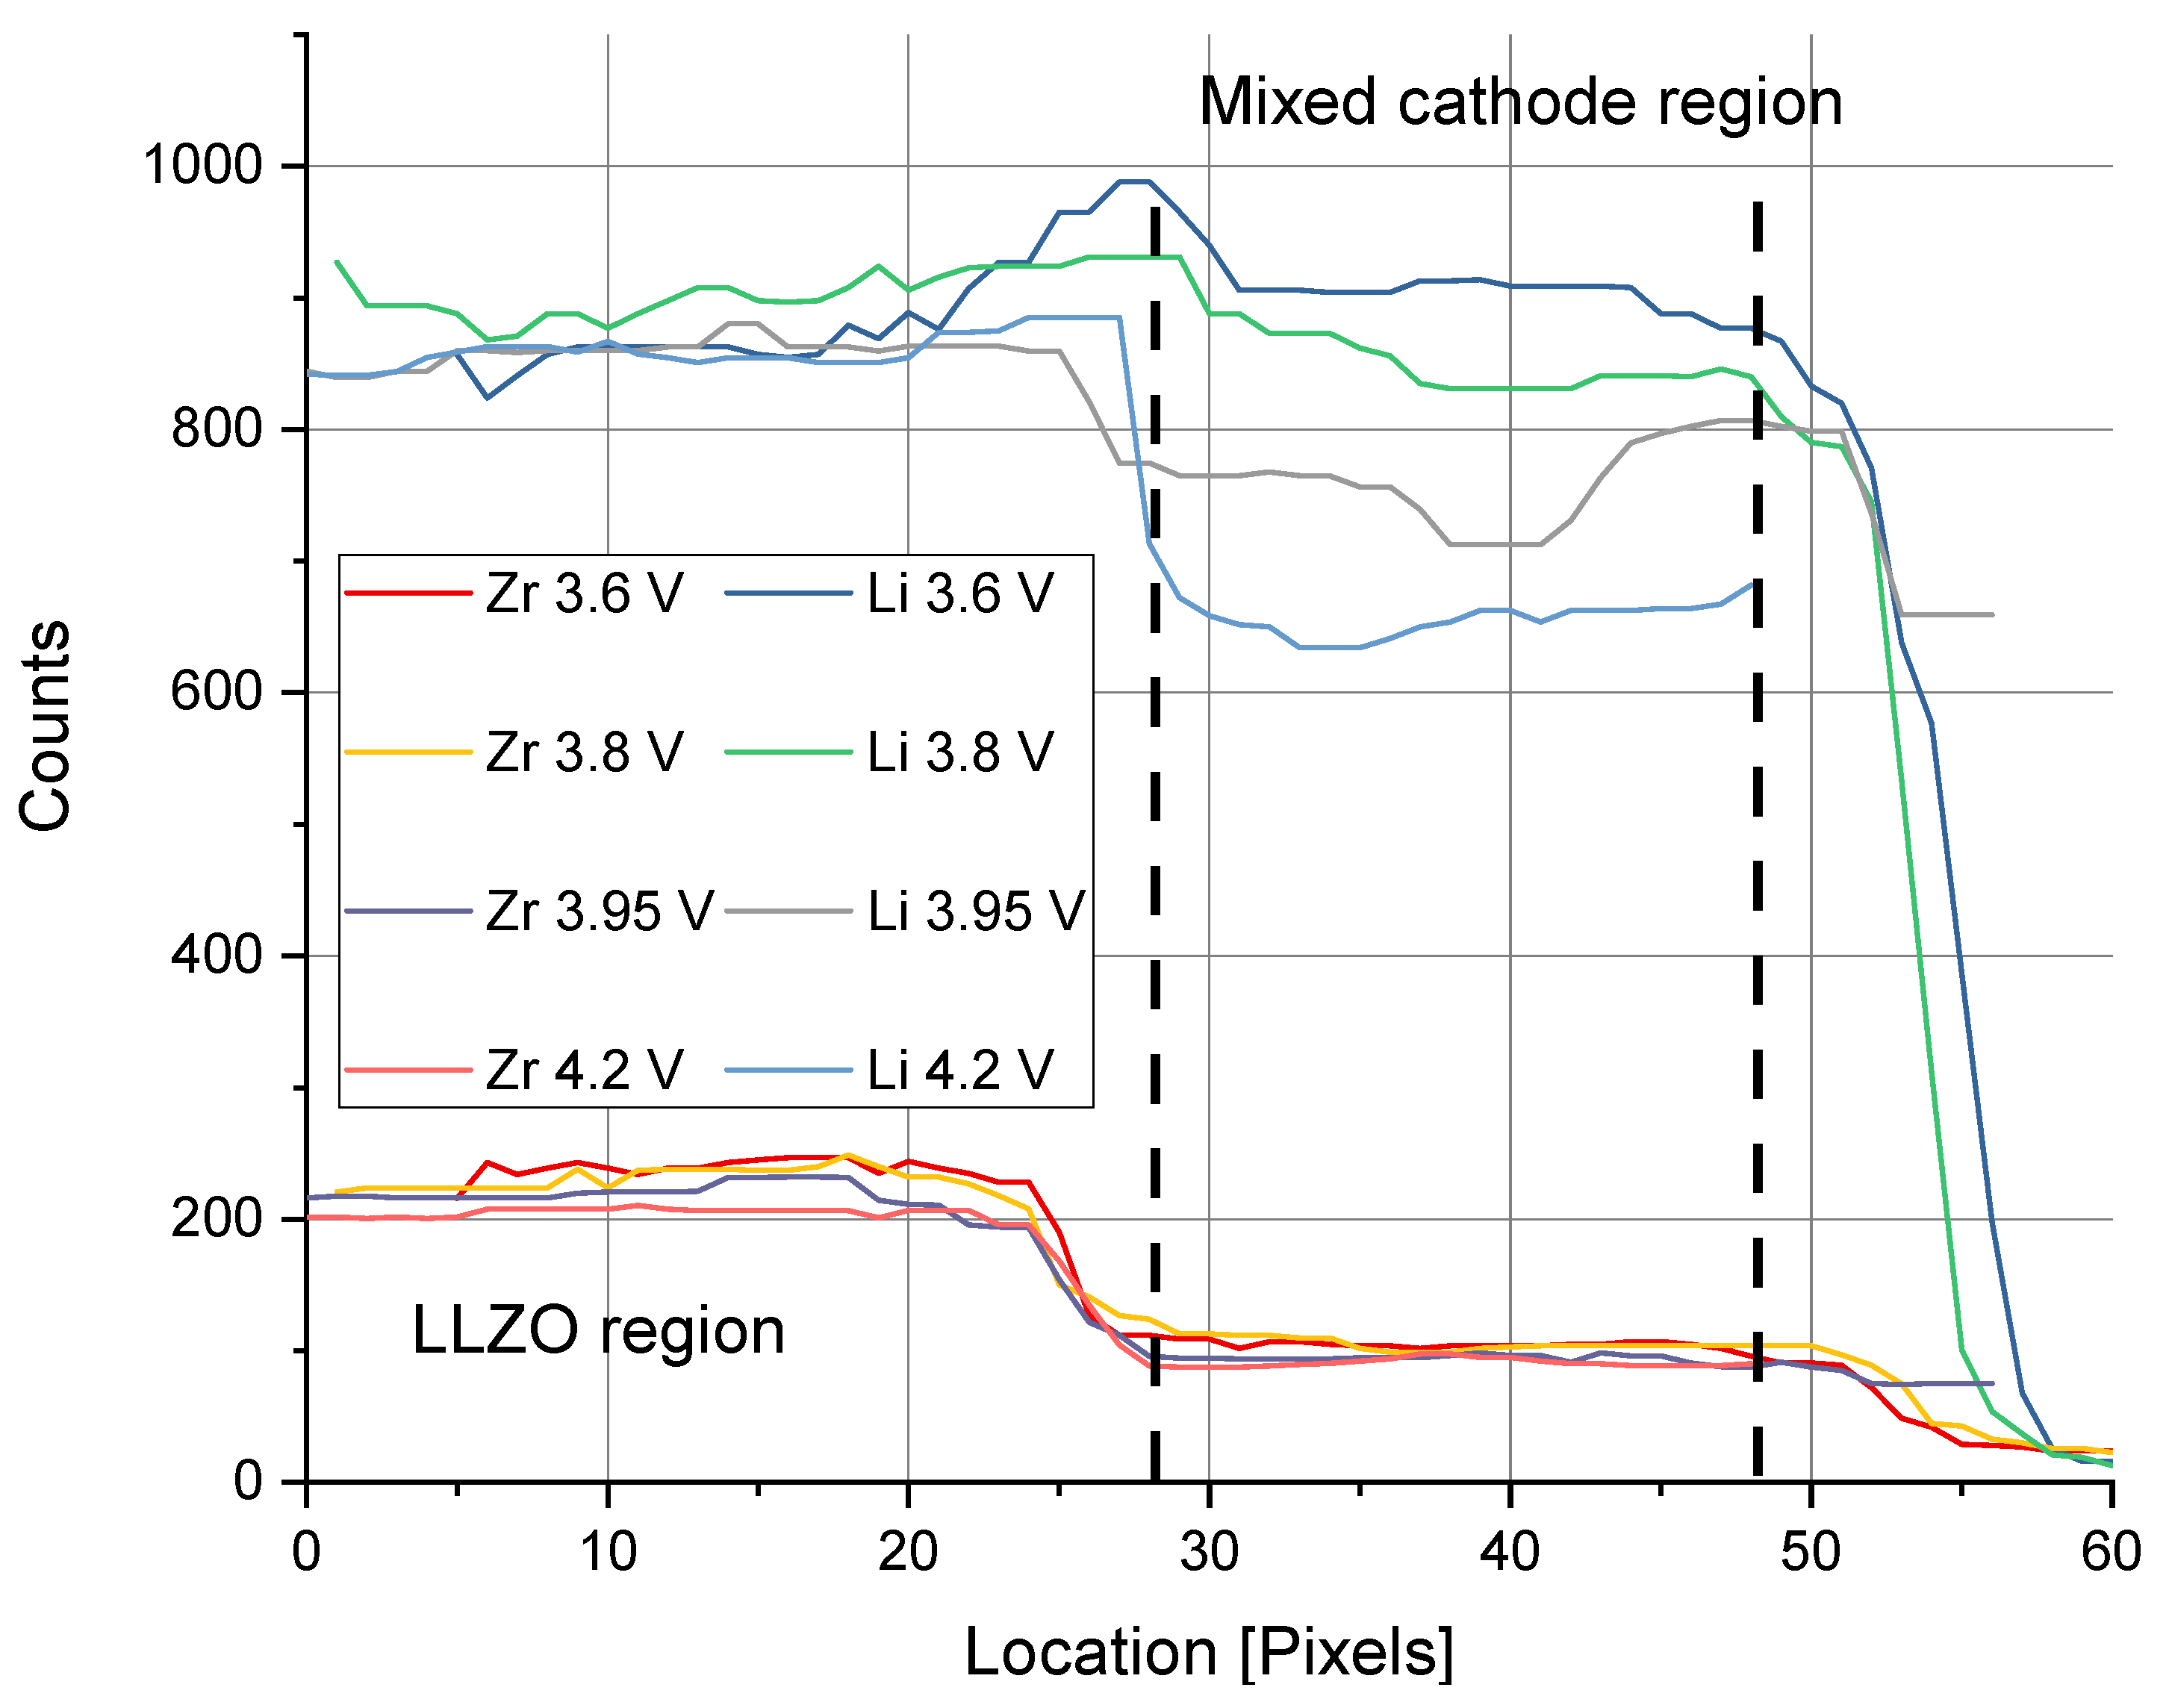
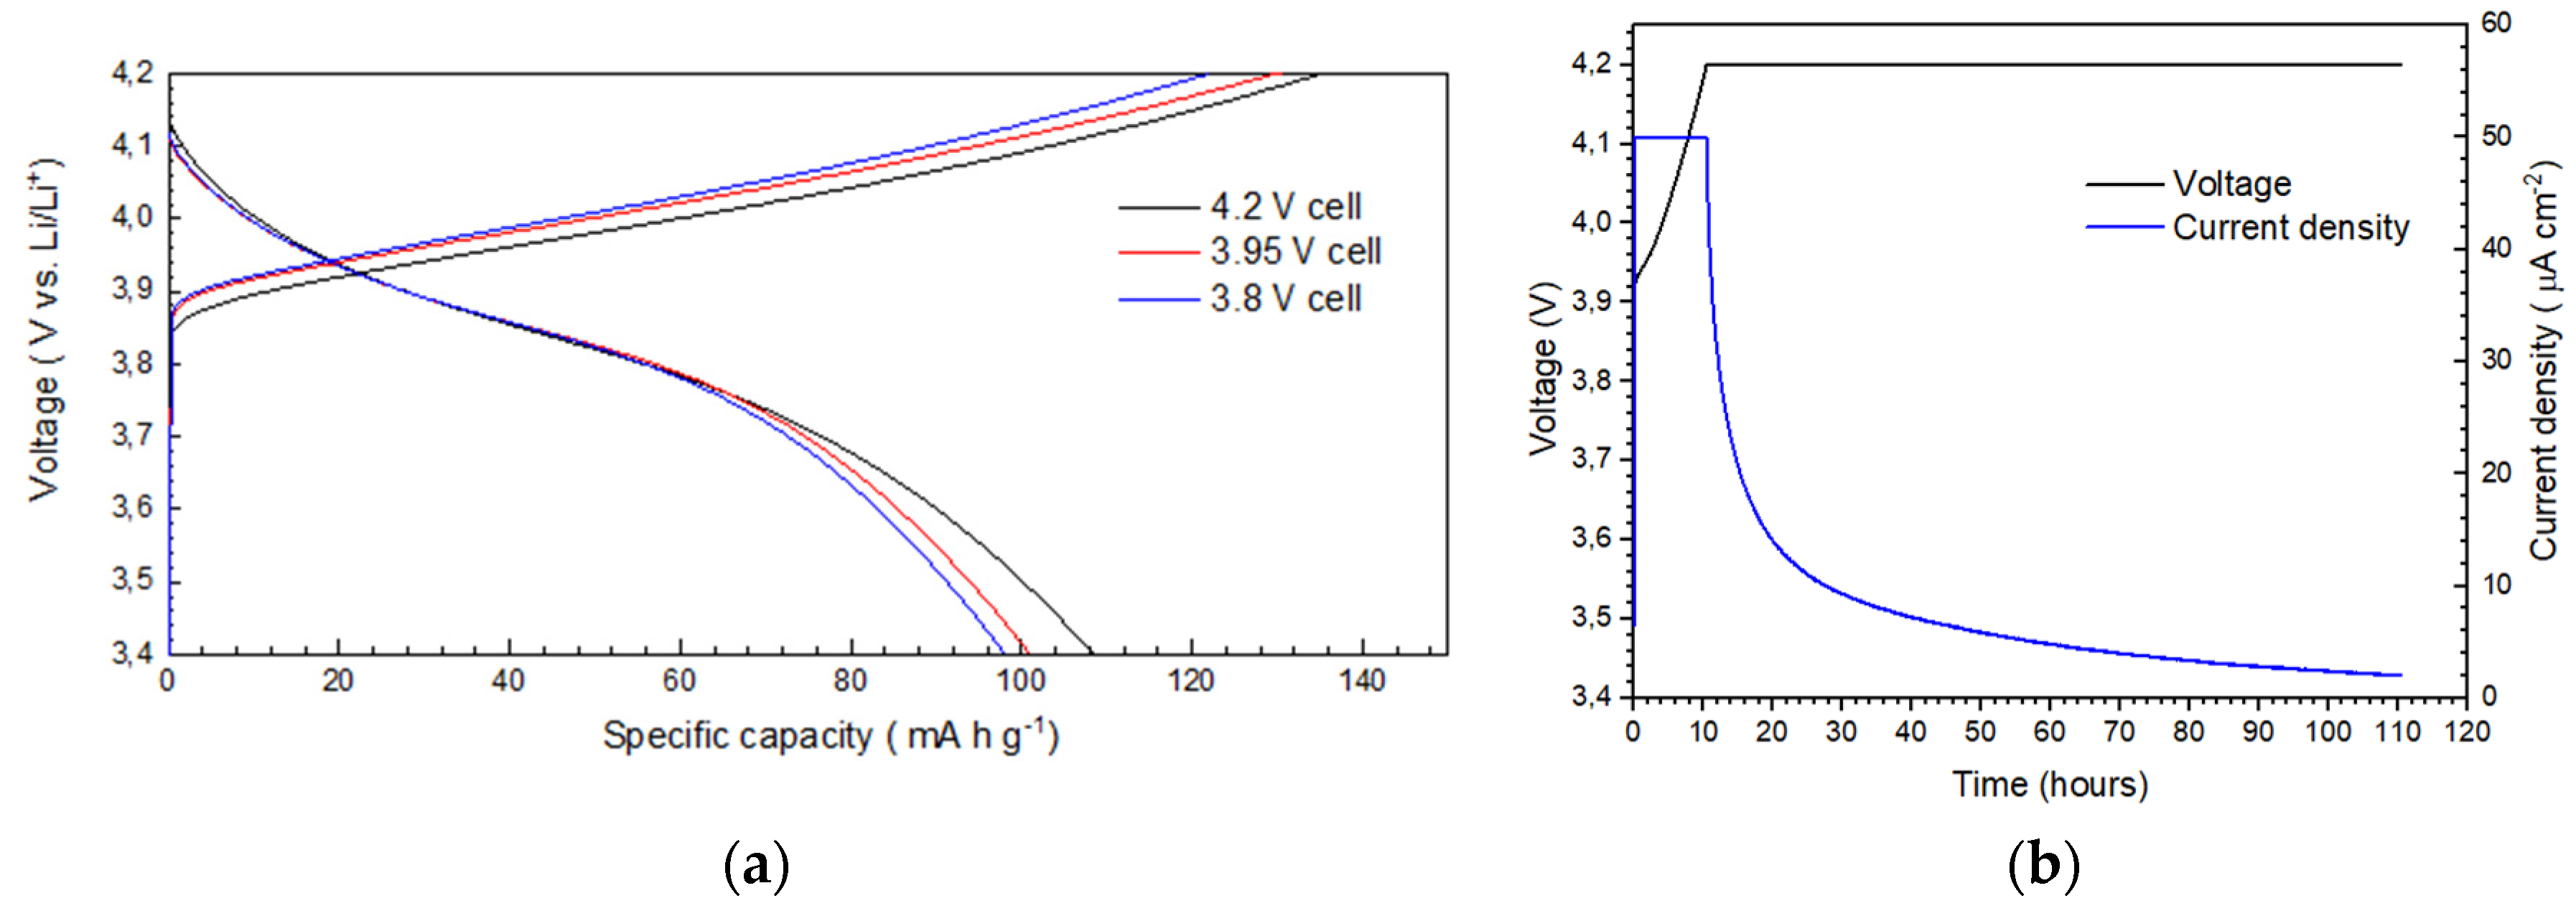
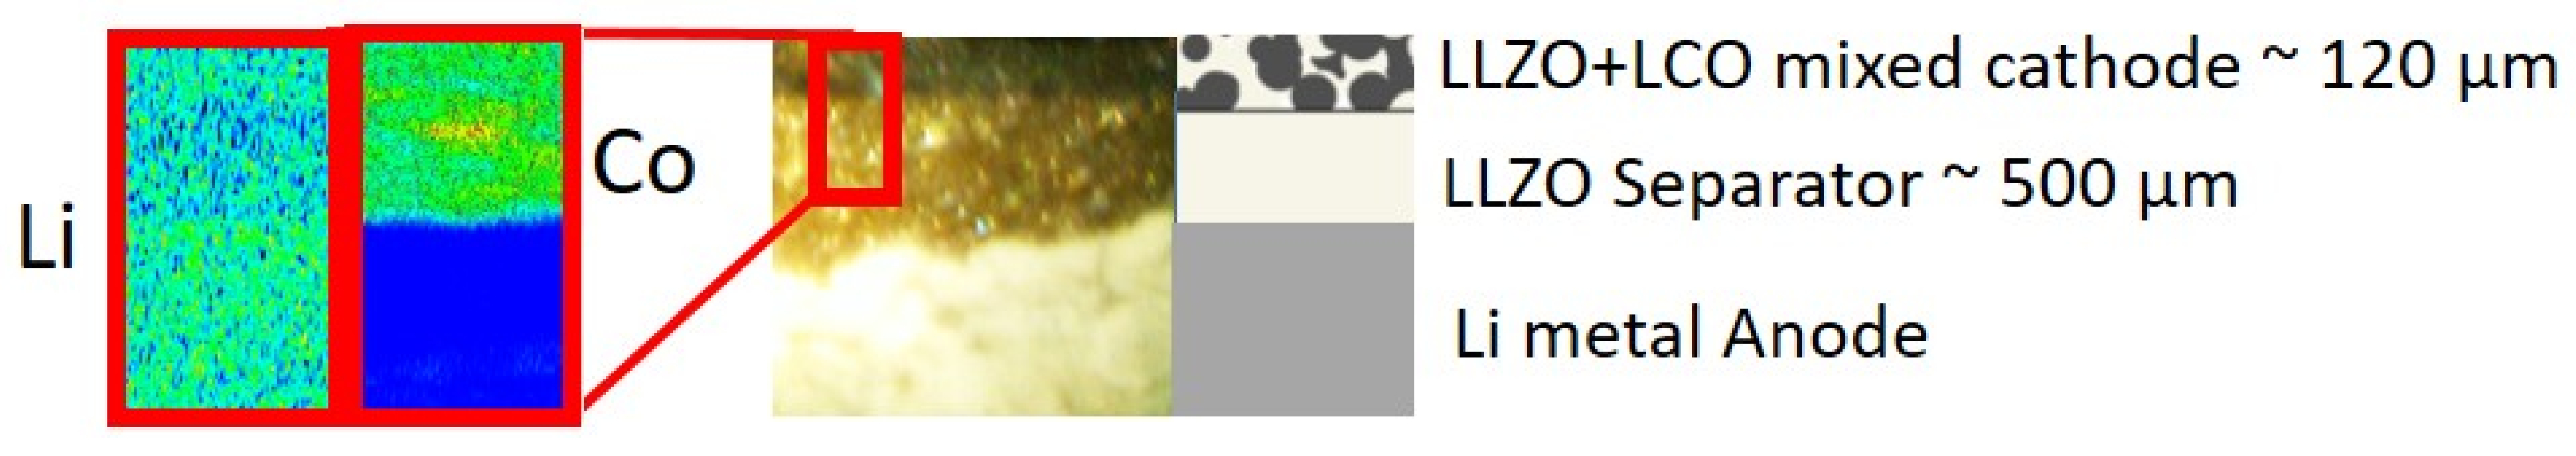
2.1. Ceramic Based Cells (Ex-Situ)

The 2D maps of elemental distribution in the ex-situ LLZO cells (charged to 4.2 V Figure 1) demonstrate a clear separation of the individual components (LZZO Separator and LLZO + LCO mixed cathode). The corresponding 1D profiles shown in Figure 2 demonstrate flat areas in all profiles for all investigated elements, within the square-root statistical fluctuations. Integration over the profiles of Li and Zr yield the condensed data of Table 1. For all cells, the results show a constant ratio of 2.28 for the Zr signal between the pure LLZO (separator) and LCO + LLZO (mixed cathode), which means all cells have the same LCO loading. Considering the about 18% smaller stopping power of LLZO + LCO (1:1) compared to pure LLZO, this corresponds to the designated fraction of 50 wt.% LCO. We can see a clear decrease of the Li signal with increasing charging voltage. Conversion of this signal reduction yields the Li content as determined by IBA in Table 1 and outlined in the supplemental information.
To compare the obtained Li content in a meaningful way to the state-of-charge (SoC) expected from the electrochemical measurements, careful investigation of the dependence of the Li content on applied charging potential is necessary. Li is reversibly de-/intercalated into the O3 phase of LCO between 3.4 and 4.2 V, with x in LixCoO2 ranging from 1 to 0.5 [47,48]. However, due to the rather flat plateau between 3.9 V and 4.0 V, the exact Li content can vary in a large range between x = 0.95 and 0.7 in LixCoO2, making it hard to extract exact values from literature data. Small changes in the internal resistance or polarization of the measured cell vs. the literature cell will lead to large variations in Li content in this range. This is most often the case for research type cells, where the fabrication and reproducibility often vary between individual cells. Thus, a facile measurement of the Li content in research type but also industrial cells and mixed cathodes is of high relevance to obtain a mechanistic understanding of the lithiation.
For a detailed discussion of our results and comparison to literature data, we first examine the “extreme points” of the charging curve. At 3.8 V, there is little charging and thus Li extraction, while at 4.2 V, almost full delithiation to x = 0.5 should take place [47,48]. Additionally, there is a large irreversible capacity-loss for all cells during the first cycle, as can be seen in Figure 3, with largely unknown origin. Thus, the first comparison of interest in this study is between the sample “as prepared” and charged to 3.8 V, which represents the discharged state after the first cycle. From the 1D plots in Figure 2, a significant loss of Li in the mixed cathode can be observed between the as prepared and 3.8 V sample. Table 1 compiles the quantitative results, showing a drop in Li concentration in LCO from the expected (stoichiometric) value of x = 1 to x = 0.86 after the first cycle. This drop of Δx = 0.135 translates to 27% of the total available capacity and consists of approx. 18% irreversible capacity losses observed in the first charge/discharge cycle of the sample charged to 3.8 V (see Figure 3) and some small Li extraction happening from 3.5 towards 3.8 V. As IBA confirms a Li loss in the cathode, side reactions not involving Li that might take place during charging can thus be ruled out as a cause for the higher charge capacity and the origin of the loss of Li remains unclear. On the one hand, it can be interpreted as an average loss of available Li sites in LCO for lithiation after the first charging cycle, e.g., due to secondary phase formation and thus higher local overpotentials. On the other hand, this loss can also be interpreted as loss of available LCO, e.g., due to mechanical failure and/or loss of electrical or ionic contact at the LCO/LLZO interface. Both explanations seem plausible and would directly relate the poor Coulombic efficiency of the first cycle(s) to the electro-mechanical degradation of the mixed cathode. However, as the microstructure varies in the measurement volume of the ex-situ cells, only an operando measurement could ultimately prove which of the two mechanisms is dominant. If larger areas become inaccessible for lithiation (e.g., due to crack formation), the lateral resolution of the our IBA measurements should be sufficient for detection. Nevertheless, the obtained SoC on an absolute (theoretical) scale can now be calculated and is compiled in Table 1.
The 3.8 V cell and corresponding Li concentration can also be seen as the baseline for further charge-/discharge cycles, excluding the irreversible losses in the first cycle. Setting the Li concentration of the 3.8 V sample with x = 0.865 as SoC = 0, we can now investigate the “second” charging cycle by comparing the values of the 3.95 V and 4.2 V charged sample. Another “extreme point” of the charging cycle is 4.2 V, where reversible Li extraction ends for LCO. We still again expect a de-lithiation down to x = 0.5 for the 4.2 V charge sample, however, the actual Li content only drops to x = 0.54. This again means another irreversible capacity loss of ~8% in the second charging cycle, which is, however, in good agreement with previous observations made on cells prepared the same way in our group and published elsewhere [38,39]. Losses of 18–20% for the first cycle, around 5% for the next 10 cycles, and degradation continuing at this rate were observed in these cells. The origin of the steep degradation is most likely the increase in area-specific resistance (ASR) and the resulting polarization of the cathode [44]. Again, this behaviour could be caused by mechanical failure (cracks) or formation of highly resistive interphases at the LCO/LLZO interface. Nevertheless, setting the 3.8 V sample as SoC = 0% and the 4.2 V sample as 100% SoC for the second cycle, we can proceed to calculate the SoC of the cell charged to 3.95 V. With an average Li concentration of x = 0.783, we obtain an SoC of approx. 24%, which is in the typical range for LCO at this voltage [47]. All SoC values after the second cycle are compiled in Table 1.
Even though these SoC estimations feature significant uncertainties, they are directly obtained by the actual Li content in the mixed cathode. While the total Li content gives a measure of how electrochemically active a region is compared to the initial state, the above correlation also shows the reversible Li content after each cycle or partial cycle. In the future, this allows to use the developed normalization to obtain 2D maps of the local SoC within the mixed cathode at certain points in the charge-/discharge cycle. However, to obtain competitive uncertainties, this would require improved counting statistics and thus measurement times or instrumental optimizations. Nevertheless, this is the first step towards direct correlation of microstructure and lateral changes in the Li content to electrochemical measurements of the full cell, which are needed to verify the microstructure-resolved models mentioned in the introduction.

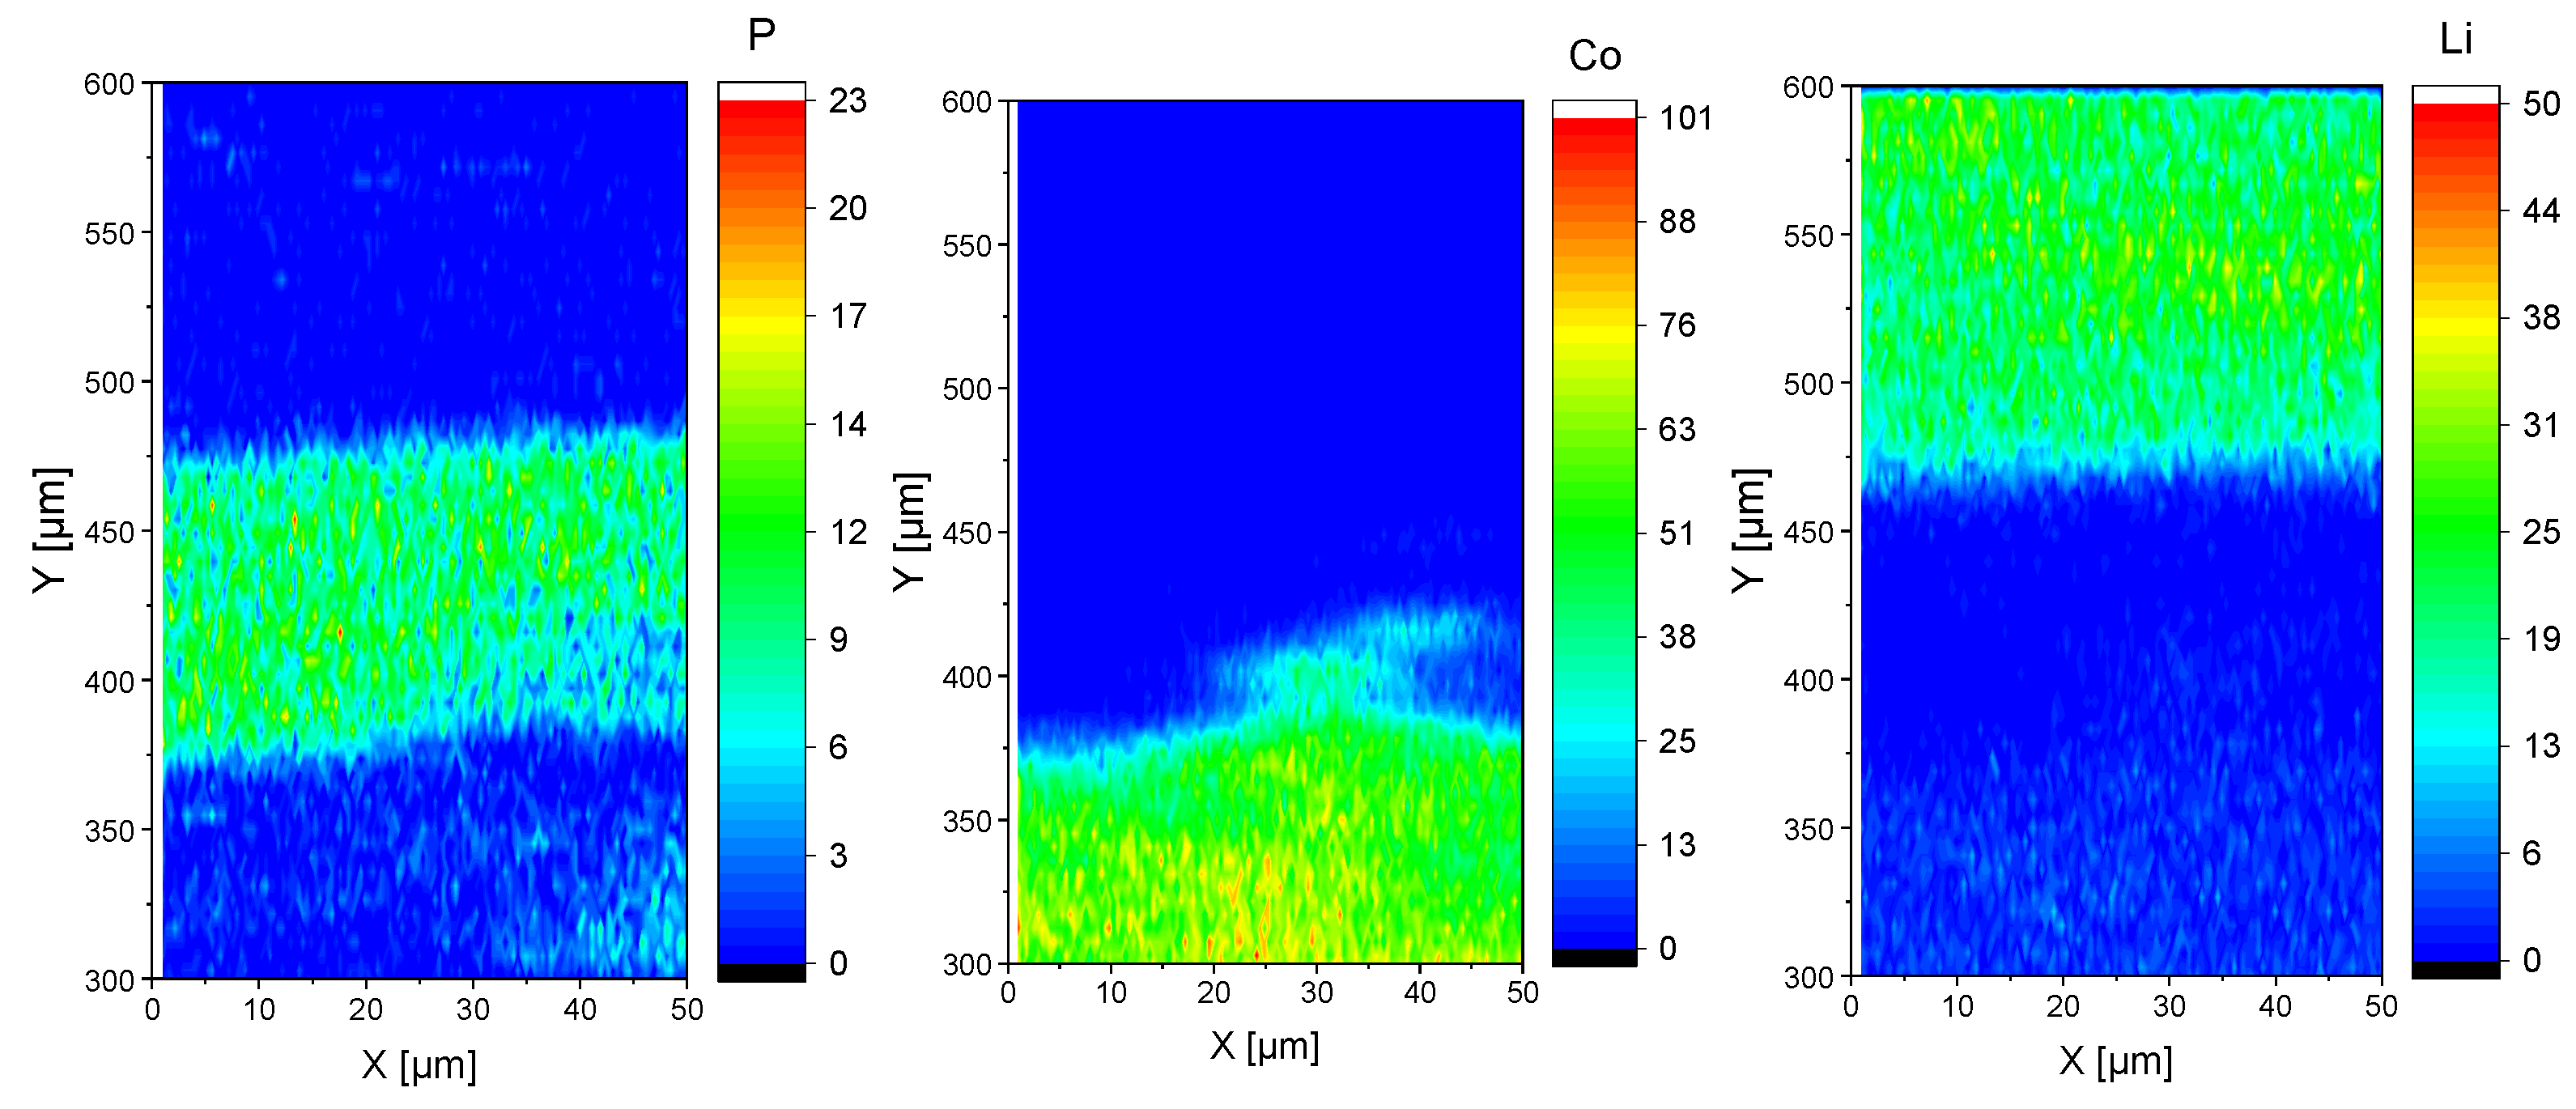
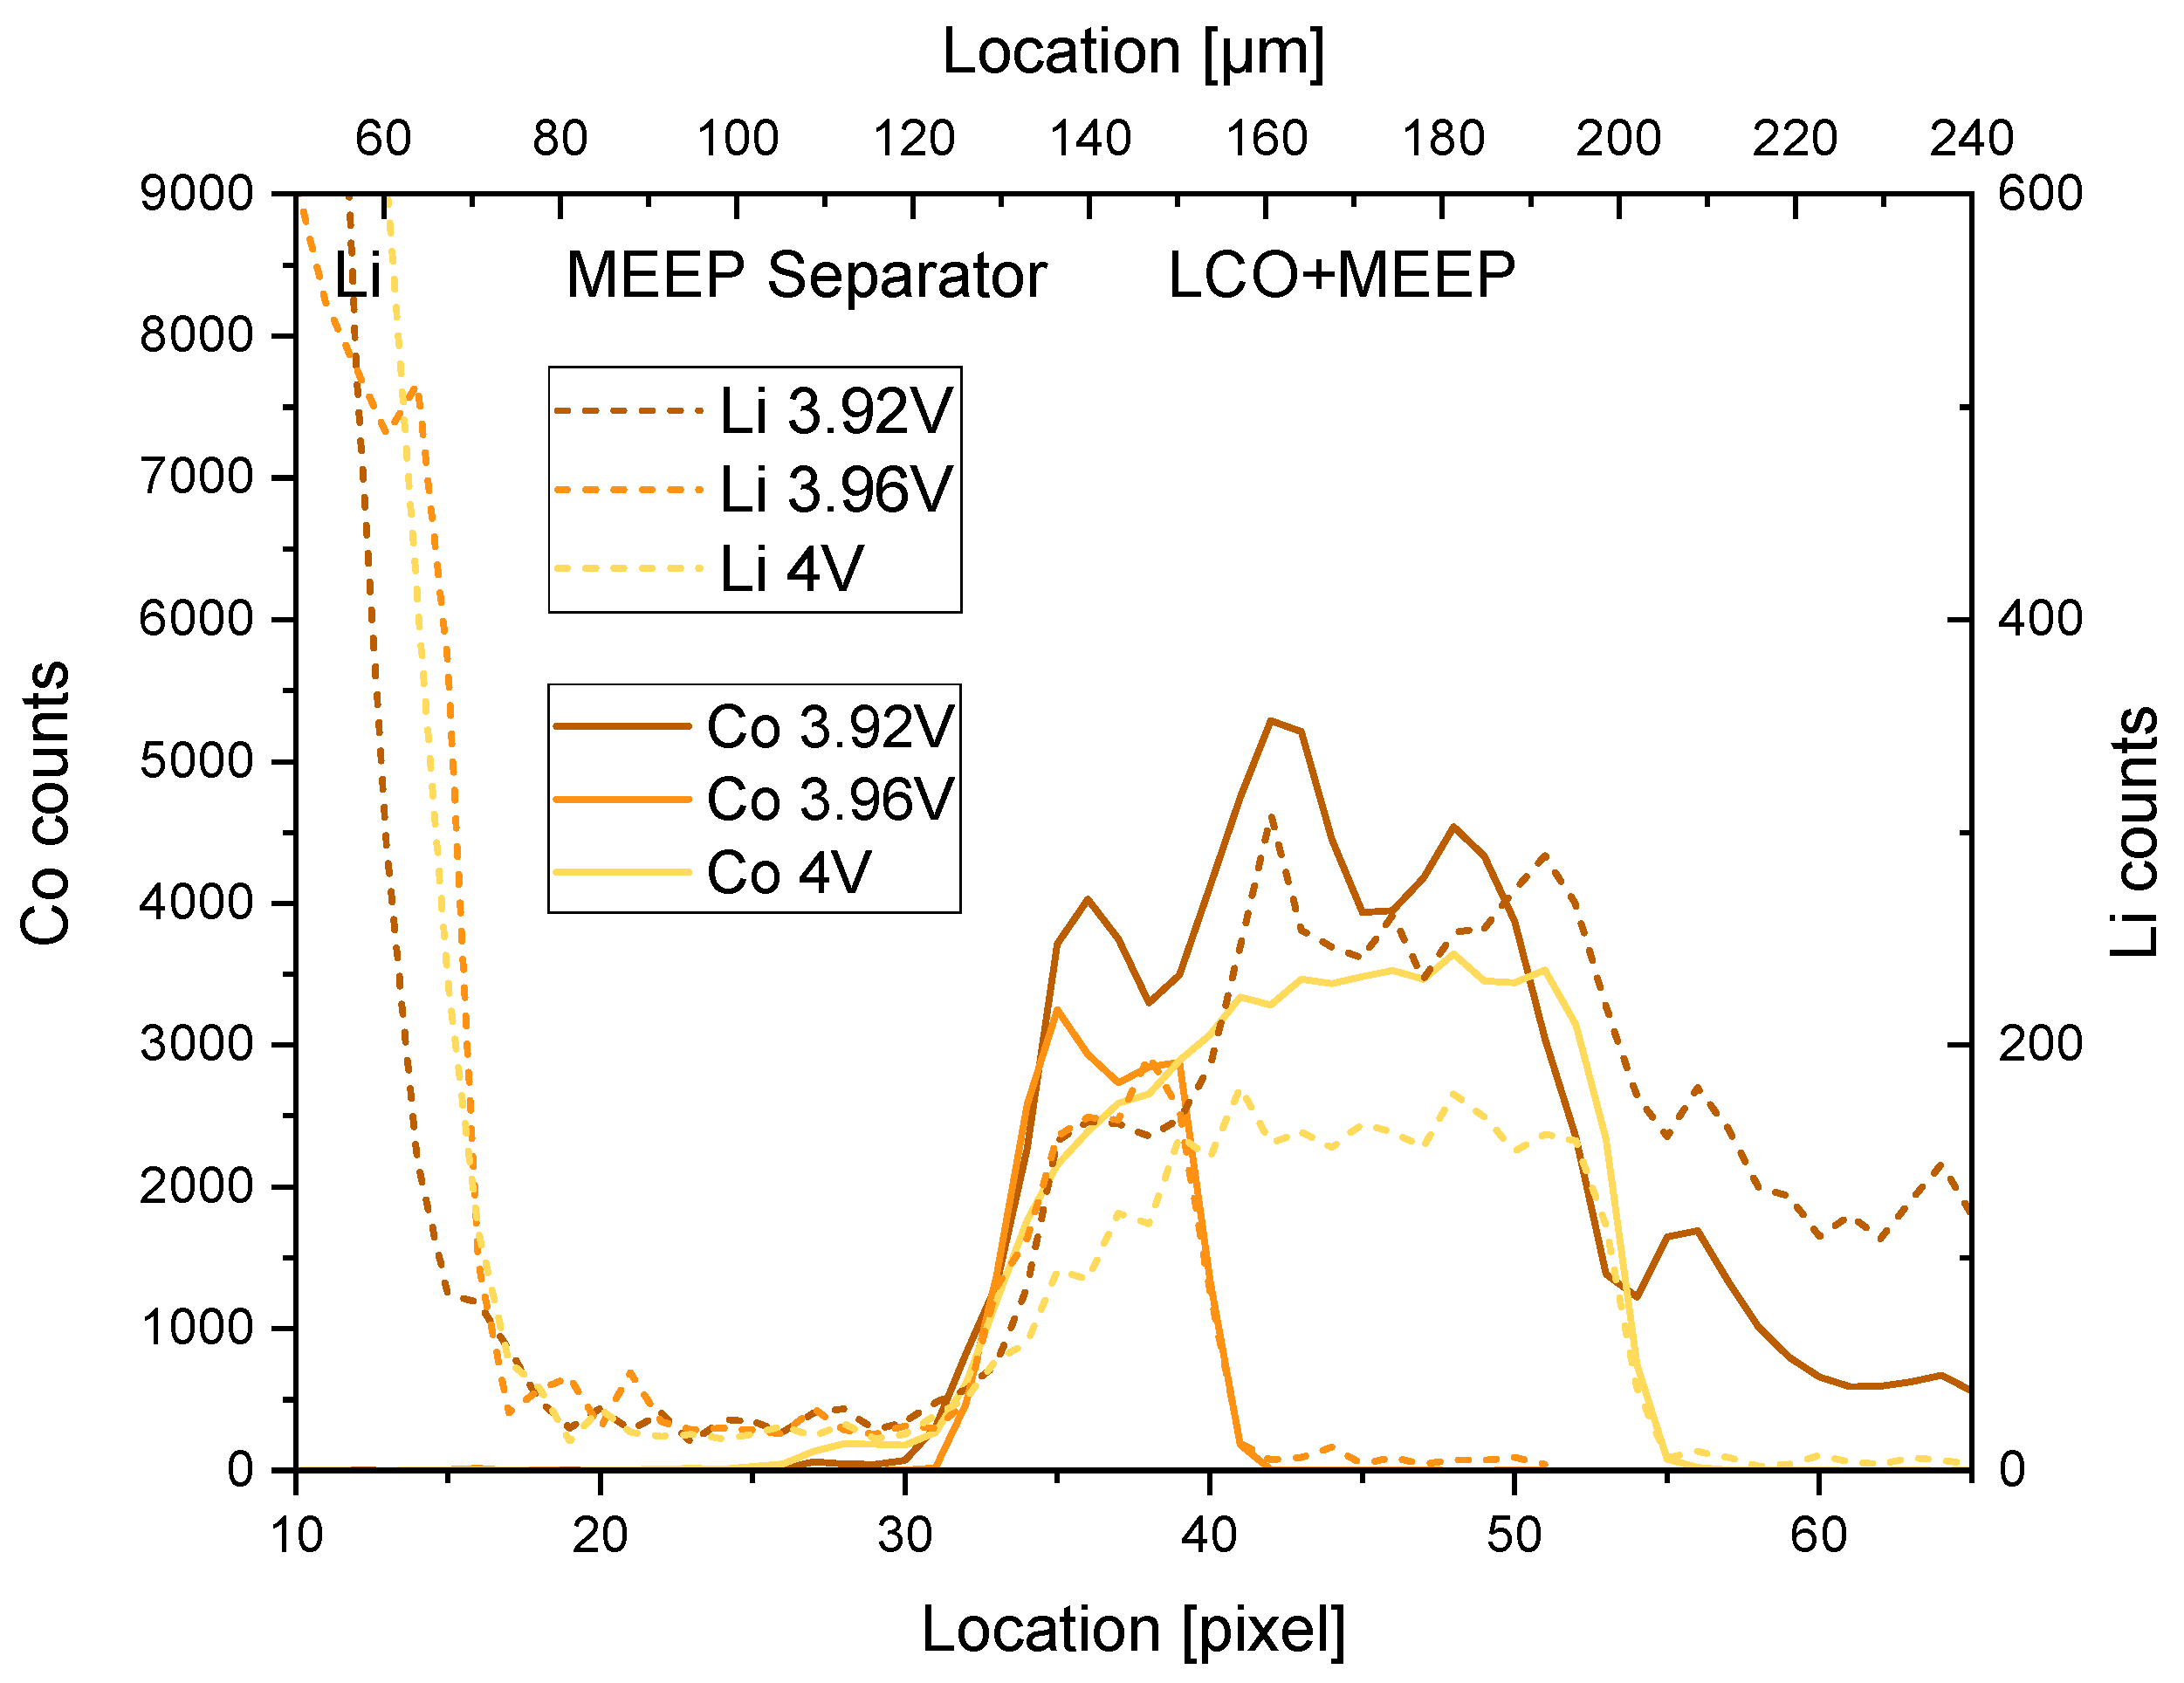
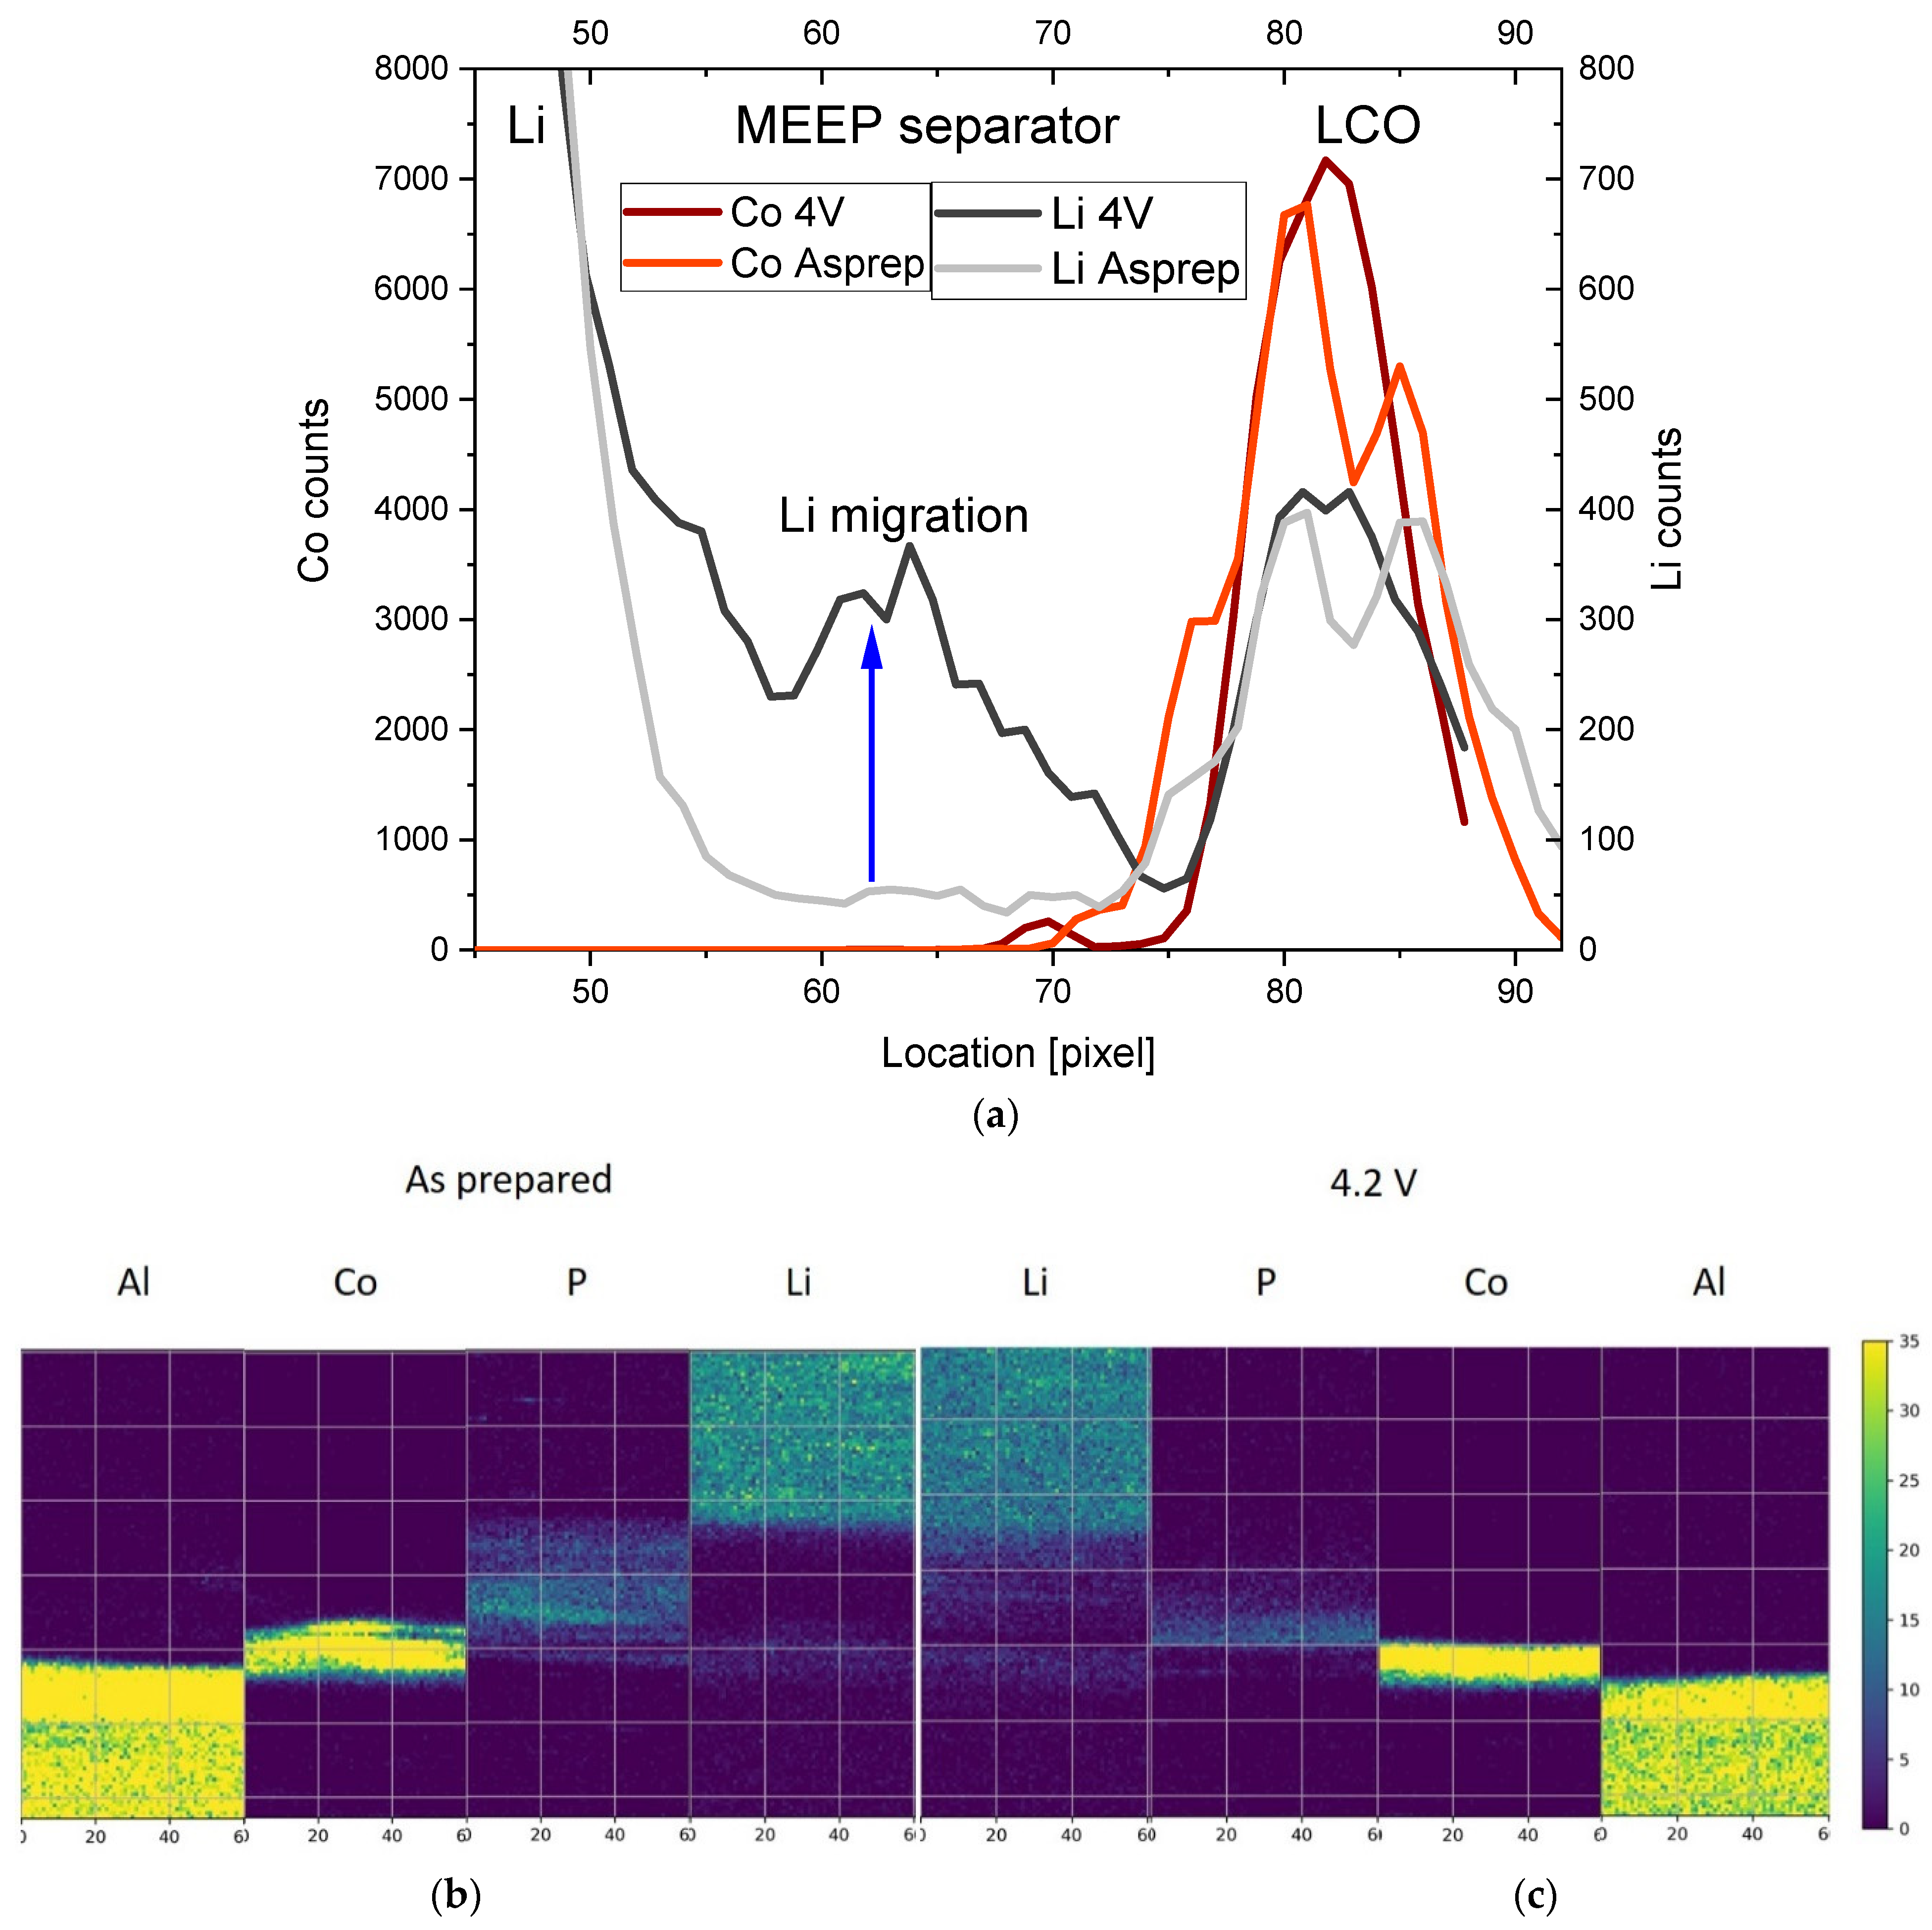
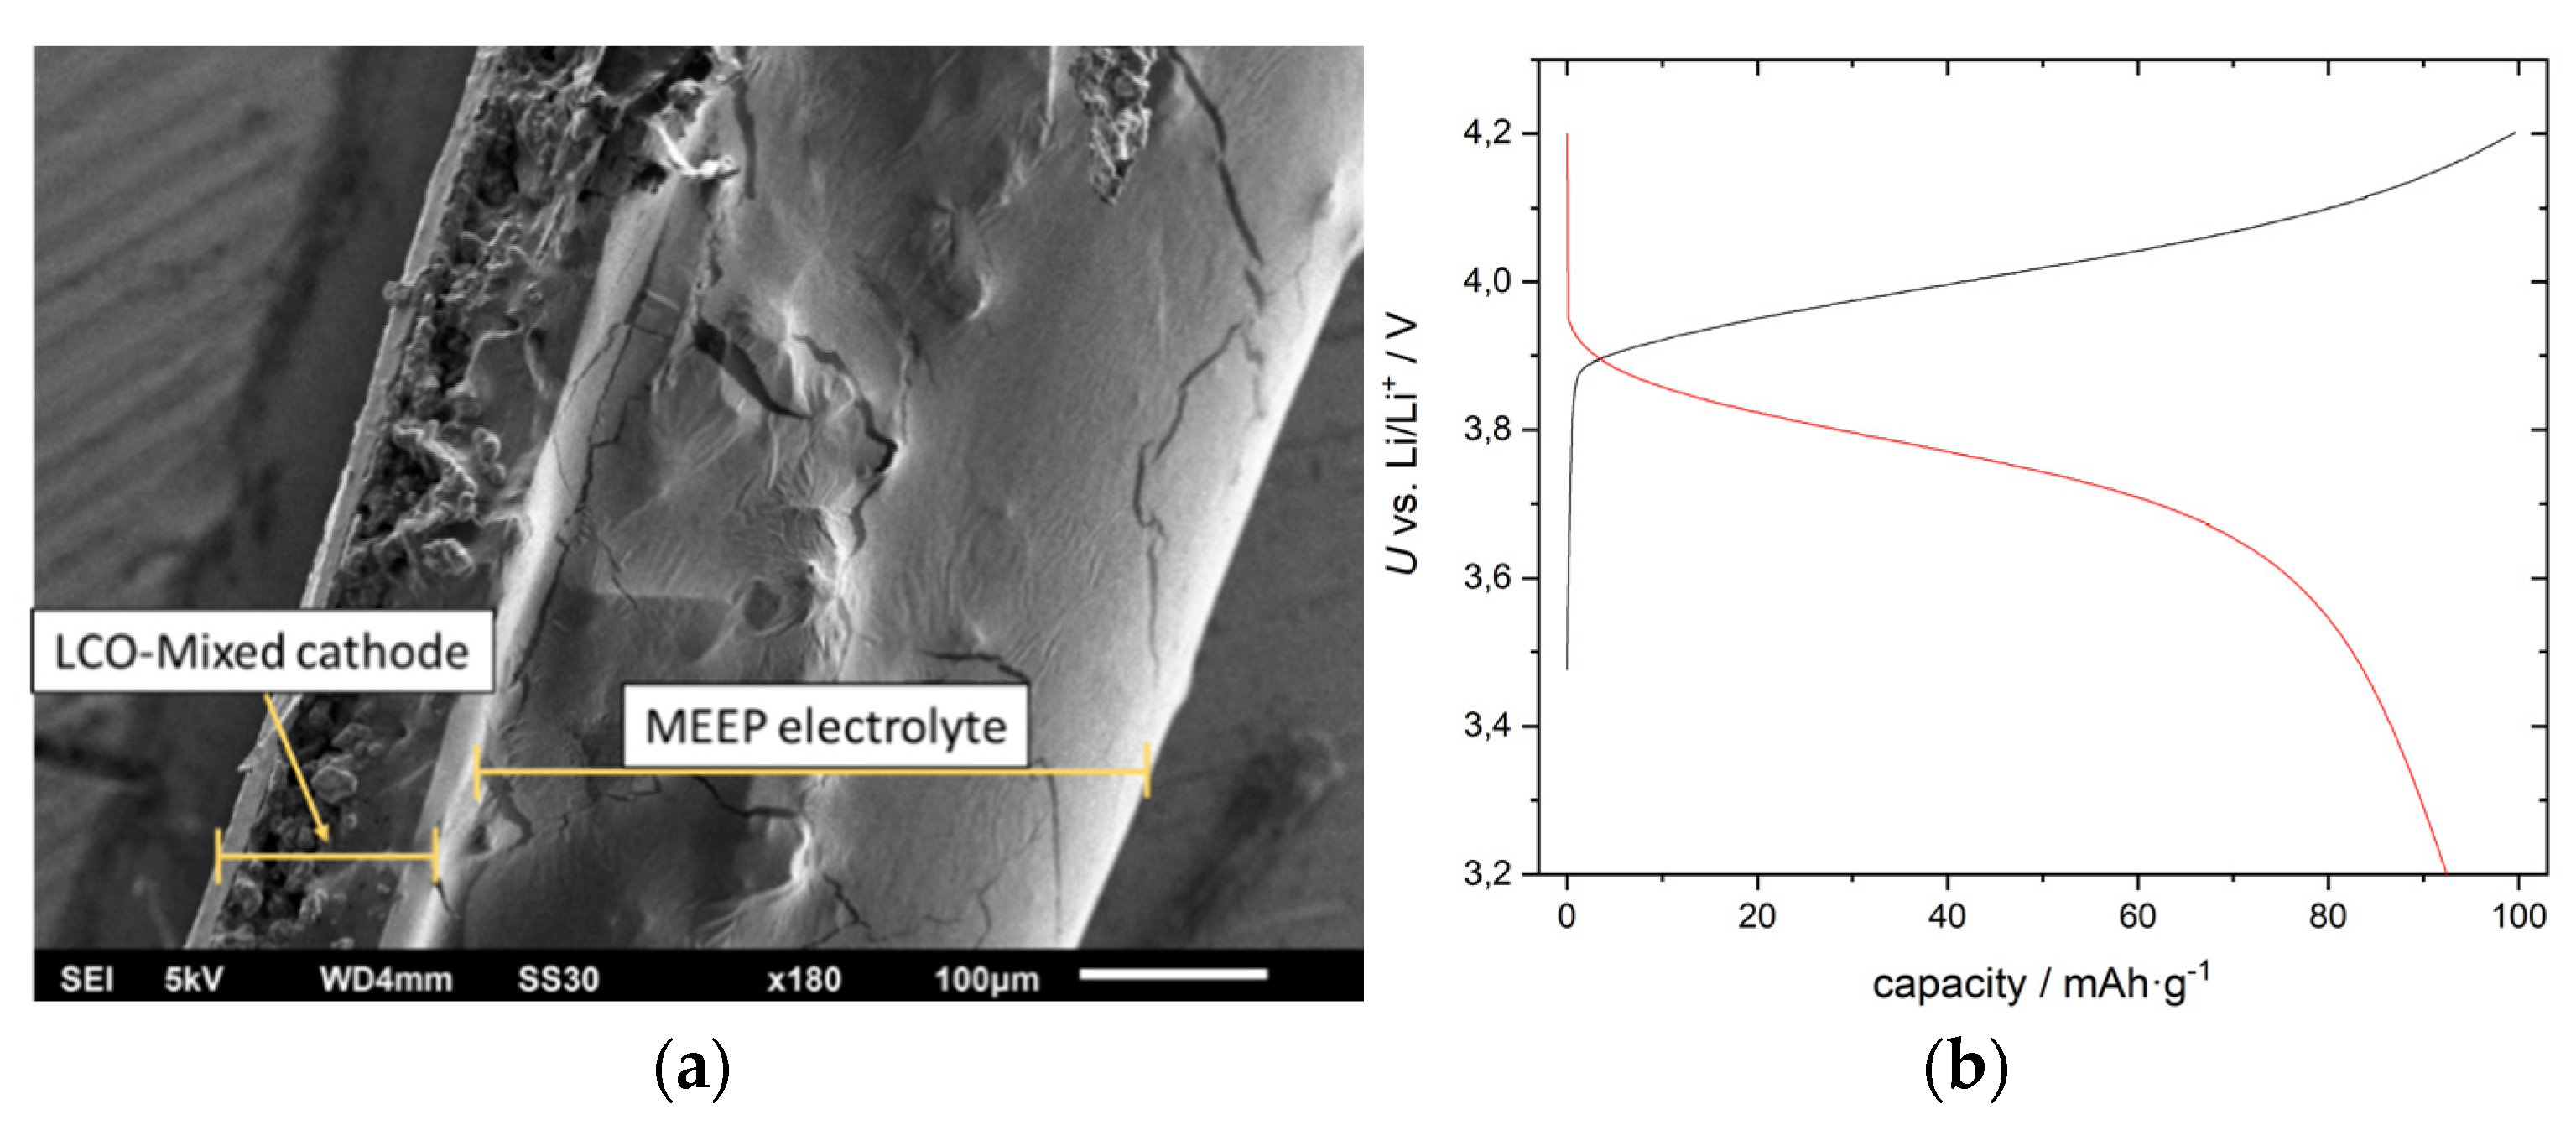
2.2. Polymer Based Cells (Ex-Situ)

For the ex-situ MEEP cells and the operando MEEP cell, a quantification for the LLZO-based cells is not possible. The ex-situ cells show inhomogeneous layer structures as depicted exemplary in Figure 4 for the 4.0 V cell. Looking at the Co and Li signal in Figure 4, a small island of LiCoO2 at around Y = 400 is clearly visible, blurring the corresponding 1D profile. For the other cells, the Co signal also extends into the MEEP layer, most likely due to a slight angle of the cell layers towards the ion beam and the resulting signal mixing. For a qualitative assessment, these inhomogeneous regions are excluded in post-processing to obtain clearer 1D integration areas in order to achieve sharp layer interfaces. Figure 5 shows the 1-D Li and Co profiles for the MEEP-based cells, showing still a significant variation of the individual cell layers. The ratio of P (not shown) to the Li and Co signals differs significantly between the cell charged to 3.92 V sample (SoC = 16%) and the one charged to 3.96 V (SoC = 57%) and 4 V (SoC = 100%). The latter one shows comparable ratios at the elemental peaks, although their widths strongly differ. Restricting the analysis to the peak values of the two cells where the signal intensity ratios of Co/Li are 16.9 at 3.96 V and 21.6 at 4 V results in an approx. Li extraction of 20 at%. In principle, the normalization of Li to Co offers a more reliable value, since it does not depend on the mixture ratio of LCO to MEEP, which could vary between the ex-situ cells due to the fabrication process. The Co signal of the 4 V cell with its non-plateau behaviour suggests an inhomogeneous, thin layer of LCO. The proton beam would penetrate such a thin layer, resulting in smaller Co and Li signals as the layer gets thinner. The energy-dependent PIGE and PIXE cross-sections prevent a quantitative analysis for thin layers with unknown thickness.

2.3. Operando Polymer Based Cell

The analysis of the operando MEEP cell, Figure 6, shows some challenges regarding the conclusive evaluation of the lithium content, again resulting from inhomogeneities in the prepared cell cross-sections. Averaging over the complete mixed cathode, the Co/Li count ratios of 13.1 ± 0.2 and 13.3 ± 0.2 are identical within the uncertainties of the analysis. This is a direct result of the low overall charged capacity, but a qualitative evaluation of the results is still possible to demonstrate the potential of this technique. As the polymer gets softer at 60 °C, the cell also slightly shifts during the applied charging and heating procedure, which is mainly visible in the slight change of width and position of the Co peak. Shifting the 4 V data by 3 pixels leads again to a good qualitative overlap of the LCO peaks. As all parts of the cell are visible (anode/separator/mixed cathode), investigating the Li concentration at the interfaces is interesting, as the small charge capacity will most likely lead to changes close to the interface of the mixed cathode/separator and the Li-metal anode/separator. Due to the shift of the cell, we will not discuss the visible changes at the cathode/separator interface, as they are affected by this shift. However, when taking a detailed look at the anode/separator interface, the Li concentration in this region increases by about a factor of 5, clearly demonstrating the operando observation of migration of Li through the MEEP separator towards the Li metal side. The affected region is 20 pixel wide (~70 µm), meaning it is definitely not an artefact from the slight cell shift. In addition, a clear gradient in Li concentration can be observed, with the highest deposition of Li close to the Li-metal anode, slowly reducing towards the cathode side. This is consistent with the expected Li plating starting at the Li-metal anode and slowly pushing through the polymer towards the cathode side. Even though the resolution is currently too low to detect small dendrites, this proves that IBA can also be applied to investigate mesoscopic morphological changes on metal anode surfaces.

3. Discussion

A new experimental setup and data evaluation method for quantitative lithium analysis in all-solid-state batteries based on MeV ion beams was developed and applied. Specially designed sealed containers enabled analyzing the cells under atmosphere. The evaluation of the obtained multi-dimensional data demonstrated the advantages of ion-beam analysis (IBA) in battery research. IBA covers applications from quality assessment, over 2-D plots of the full elemental distribution in practical cell components and full cells all the way to quantification of Li and operando measurements of the local SoC via a method relying on the local distribution of Li, independent of cell voltages.
Building on former experiments, we successfully quantified the absolute lithium content in ceramic ASBs based on LLZO, LCO, and lithium metal. IBA clearly revealed the migration of lithium upon charging as afunction of SoC. A relative calibration together with simulations enabled the determination of the SoC with a good agreement to the electrochemical data. This allowed a first insight into the origin of the often-observed steep degradation of all-solid-state-batteries in the first cycles. The same analysis of MEEP polymer-based ASBs suffered from the structural non-uniformity of the prepared cells. However, the comparison of two cells also yielded clear evidence of lithium migration in reasonable agreement with the electrochemical data. In both cases, the reduction of uncertainties in the absolute and relative quantification proved essential for ion-beam analysis of lithium cells. The experiments achieved an absolute accuracy of 7.1% and a relative accuracy of 2.2% for the lithium content compared between different cells, which is exceptionally high compared to other methods. Improved counting statistics and higher ratios of active material over electrolyte, as desired for commercial cells, would strongly reduce these values, allowing even for 2D plots of the local SoC and further widening the application range of this method with an accuracy competitive to electrical methods.
Finally, heating, charging, and operando IBA analysis of a MEEP + LCO cell was successfully conducted. Even though operando lithium migration experiments ease the data analysis, the small charging current and limited experiment time prevented a quantification of the results for the given cell. Qualitatively, changes in the elemental profiles show a Li plating at the polymer/Li-metal anode interface, demonstrating the capability of the technique to also investigate the anode side in full cells.
In conclusion, IBA for battery applications is still in its infancy, but shows tremendous potential, especially when combined with other Li-sensitive techniques like neutron depth profiling, 2D NMR, or SIMS. The further development of IBA for battery application is another necessary step to deliver data for microstructure-resolved continuum modelling and 2D/3D analysis techniques for practical cells. This will finally enable a mechanistic understanding of the electro-chemo-mechanic coupling of the various materials and components in Li and Li-ion batteries and enable future technological innovations.

4. Materials and Methods

4.1. Ceramic-Based Cell Preparation

For ex-situ measurements, cells with different and stable state-of-charge (SoC) were needed that are as similar as possible from a materials and performance perspective. Four cells based on LLZO and LiCoO2 (LCO), for details see the cell preparation Section 4.5, were charged from the as-prepared state (asprep) to 4.2 V and then discharged to 3.4 V at 50 °C. The capacities were calculated for each cell from the data shown in Figure 3a to check for the reproducibility of the cell preparation. The initial charging to 4.2 V yields an average 129 ± 5 mAh/g, a value close to the theoretical limit of 137 mAh/g (considering only 50% of the Li is reversibly available in LCO). This means almost all available Li is extracted during the first charging cycle [49]. The first discharge capacity, however, shows only an average 101 ± 5 mAh/g, resulting in a LCO utilization of only 78 ± 6% and thus a low Coulombic efficiency of the cells. A more detailed electrochemical investigation of these cells can also be found in our previous publications [43,44]. The measurements presented here demonstrate that the cells can be considered identical. To prepare an equilibrium Li concentration in the mixed cathode for ex-situ measurements, the cells were then charged to 4.2 V, 3.95 V, and 3.8 V and kept at the corresponding voltage for more than 100 h to reach equilibrium (Current density approaching 0), as shown in Figure 3b. Since the Li concentration directly relates to the voltage in equilibrium, this approach should ensure an even distribution of Li throughout the mixed cathode, which persists after cell disassembly, cross-section preparation, and shipping to the ion beam facility.

4.2. Polymer-Based Cell Preparation

A similar approach was used for the polymer-based cells to prepare samples with different SOC. The cathodes are initially charged and discharged in half-cells vs. metallic lithium in a three-electrode setup. The charging/discharging is carried out at 0.05 C and a temperature of 60 °C. The resulting total capacities read 0.95 ± 0.02 mAh with slight variations of the intermediate SoC voltages; a typical charge/discharge curve with the normalized capacity is shown in Figure 7. After this first cycle, the cells are charged to a specific cell voltage. The chosen potentials vs. Li/Li+ are 3.92 V, 3.96 V, and 4.0 V. Here 4.0 V is selected as the 100% SoC state due to the polymer stability. Correspondingly, the theoretical capacity is slightly smaller compared to the LLZO-based cells. A constant current corresponding to 0.05 C is applied until reaching these desired cell voltages. A subsequent constant voltage step at this very voltage is applied for 24 h.

4.3. Ion-Beam Analysis

Figure 8 schematically depicts the sample holder, sample arrangement, and ion beam setup. The cells are cut in half, exposing their cross-section for analysis by lateral beam scanning and installed under protective atmosphere in a hermetically sealed holder made from Polyether ether ketone (PEEK). The operando cell is installed between two aluminum jaws fixating the sample and providing mechanical pressure and electrical contact for the operando charging. The operando cell holder also featured a resistive wire heating plate installed behind the cell in combination with a 1 K accuracy Pt100 temperature sensor, both connected to a proportional-integral-derivative (PID) module for feedback controlled sample temperatures up to 473 K. A 7.5 µm thick Kapton foil covers the beam entrance window of about 2 mm diameter, keeping the protective atmosphere inside the holder during the relatively short sample mounting procedure. For transport to the beamline, the holders were sealed in pouch bags under protective atmosphere to prevent oxidation of the Li metal anode.
The ion-beam analysis at TIARA [50] employed 3020 keV protons with a beam spot diameter of 1.2 µm and a beam current on the order of 24 pA. For lithium quantification, the 7Li(p,pγ1-0)7Li reaction at 477.6 keV (PIGE) and for the other elements PIXE with K and L lines up to 20 keV are recorded. The Compton background of higher energy peaks present on the high-energy side of the 477.6 keV peak is subtracted for analysis. The 7.5-µm-thick entrance foils of the holders result in an energy loss of 109 keV and a beam energy width of 22 keV, both considered as real incident beam properties in the following evaluation. The Particle*Sr could not be determined in this setup. PIXE signals are detected using a PGTLS30135 SiLi (5 mm thickness) detector with 22 mm distance between sample, 145 eV resolution, and target at 45° backscattering angle. A 8 µm Be window and a 100 µm PET absorber with 3 mm hole in the center cover the detector. PIGE is detected using an APTEC PS305-D7-5C HPGe detector with 250 mm2 sensitive area, 12 mm thickness, and 2 keV resolution positioned directly behind the sample holder (0° to the beam). A 12.7 µm Be window together with a 0.5 mm graphite absorber and the sample and holder cover this detector with respect to the beam impact spot.
The analysis starts with a rough localization of the region of interest via camera observation, see Figure 9 center. After a first 30 min overview measurement, the analysis region is set to cover both the mixed cathode and the separator, resulting in analysis regions of approx. 50 µm horizontal and 300 µm vertical size. The beam scans this region repeatedly using 128 × 128 points for about 1.5 h, while PIXE and PIGE spectra are recorded. In Figure 9, the resulting Co PIXE and Li PIGE 2D maps of the chosen region are shown for the LLZO-based cell charged to 4.2 V.
The operando cell was first analyzed in the as-prepared state, then heated to 333 ± 2 K, charged for 2 h to 4 V with up to 26 µA for 29.7 µAh, and finally analyzed while cooling down to room temperature (due to limitations in the total time allotted for the experiment). The used charging current and total charge at the end of this procedure indicate that the charging remains incomplete after the applied CC-CV program. Comparison to the other identical cells suggests an approximate SoC = 31 ± 3%. Unfortunately, the sample did not allow for higher charging currents at the given temperature limits.

4.4. Ion-Beam Analysis Spectrum Evaluation Methodology

The dataset produced by the detectors is convoluted, containing both spatial information and full spectra for each scanning point, acquired over time. The data can be evaluated on various levels—e.g., as fully integrated spectra over both time and space, as shown in Figure 10 for the x-rays (a) and gamma-rays (b). This representation of the data allows a spectral evaluation of the acquired data with respect to background, peak position, sharpness, overlaps, etc. and gives measures for quality control.
To generate 2D maps of the elements of interest from this data, we extract the counts for the respective elemental peaks for each scanned pixel and plot their intensity against the respective pixel position. These maps are then fine rotated to obtain a horizontally aligned interface between the Separator and the mixed cathode (see e.g., Figure 1) in order to offset minor alignment issues during sample mounting. These 2D maps reveal the homogeneity and interface quality for each sample, allowing choosing an even narrower ROI to exclude inhomogeneities at the interface from further analysis, thus increasing the signal-to-noise ratio for inhomogeneous cells. However, narrowing the ROI also increases the measurement uncertainty by reducing the counting statistics. The integration along the x-axis (parallel to the interface) reduces the 2D maps to 1D profiles (see e.g., Figure 2), enabling a comparison of the elemental composition of each layer (separator or electrode) on both a relative and an absolute scale (with normalization). Due to the lack of the Particle * Sr and detector efficiency calibrations, an absolute compositional analysis using the instrument parameters is not possible at this point, but absolute changes of atomic concentrations at different charging states can be extracted by normalizing to the composition of a reference sample (e.g., the as prepared state).
To determine the Li concentration, a region of interest is chosen in the electrolyte + LCO (mixed cathode) region of the 1-D profiles, where we also expect a reduction of Li content upon charging. Half of the lithium can be removed upon charging from LCO, varying the stoichiometry of LiXCoO2 with x between 0.5 and 1. Accordingly, LCO contains 25 at.% Li in the discharged state and 14.3 at.% in the fully charged (x = 0.5) state. Additionally, the solid electrolyte mixed to the cathode contains a constant fraction of Li.
For the employed stoichiometric Li6.3Al0.1La3Zr1.6Ta0.4O12, a fixed 27 at.% Li need to be considered. A separate NRA measurement confirms this number for the given samples within the accuracy of 10%. The applied 1:1 weight ratio of LLZO + LCO translates to a ratio of 51.7 vol.% for LCO and 48.3 vol.% for LLZO. Calculating the dynamic range of Li for the mixed cathode gives 25.84 at.% for fully lithiated LCO to 21.7 at.% for fully delithiated LCO. Converting this further into the expected relative PIGE signal for Li, a drop of only 24% can be expected upon charging in the LLZO + LCO cathodes from a state-of-charge (SoC) 0% to 100%. Appendix A gives further details and steps for this calculation of absolute quantities. In contrast, the MEEP/LIBOB contains only ~1 at.% Li due to its low density and relatively low salt concentration. This negligible Li background, in principle, leads to a 1:1 change of the Li PIGE Signal with Li concentration, e.g., resulting in ~50% change in the Li signal upon fully charging the cell. This higher contrast also reduces the error in determination of the SoC of polymer-based mixed cathodes.
Due to the small signal changes in LCO + LLZO cells for various SoCs, counting statistics represents an important aspect of the analysis. In particular, low photon energies demonstrate fluctuations in X-ray count rates for La, Co, P, and Al along the material layers. The origin of these fluctuations remains unclear, but the effect decreases with increasing photon energy, indicating a relevance of absorption effects in sample (e.g., due to the microstructure of the mixed cathode) and foil. At the Zr K lines (~17 keV) and the 478 keV Li-PIGE line, no graining is observed and the noise equals the counting uncertainty of a few percent. Since it is unknown whether the fluctuations are unipolar (±) or monopolar (only-) as an absorption effect would suggest, the Zr K lines are chosen to represent the LLZ-containing regions, neglecting the La-L lines; in MEEP, only the P can be detected. Thus, to represent the materials in the cross-sections, Zr is chosen for LLZ, Co for LCO, P for MEEP, and Li as the element for quantification. All measurements are conducted for achieving counting statistics of 10,000 to 20,000 counts per layer and element. This limits the relative accuracy of the IBA results to 1%. In the relative consideration to a reference intensity, the uncertainty in Particle * Sr drops out, instead 2% of the Zr/P-based normalization have to be considered. In addition, the uncertainties in cell synthesis/fabrication and capacity differences (Section 2.1 and Section 2.2) add another 4% uncertainty. Data evaluation and cross-section error bars contribute another 5% to the uncertainties. The often-observed LiOH and Li2CO3 formation on LLZO might have introduced thin surface layers on the sample, despite the handling in inert atmosphere (glove-box). This would lead to a low but unknown background intensity. Observations on similar samples exposed to air suggest a maximum layer thickness of about 100 nm for our samples, leading to a background of about 2% unconnected to the SoC. In total, the error propagation leads to an uncertainty in the absolute determined lithium content of 7.1%. As systematic errors such as cross-sections or surface layers do not contribute to the error when normalizing the signal to a reference sample, the uncertainties of the lithium content for normalized values are much lower with only 2.2%.
For accurate quantification of the Li content, further effects need to be considered. The change of Li content upon dis-/charging induces changes in stopping power in the order of 10%, requiring a PIGE data analysis via SimNRA 7.02 [51] for a relative comparison of Li content. Cross-sections for forward detection of 7Li(p, pγ1-0)7Li are available from recent measurements with an uncertainty of 2%. SimNRA runs for the cathodes were conducted for six different Li contents of the mixed cathode, corresponding to x = 1, 0.9, 0.8, 0.7, 0.6, and 0.5 for LixCoO2. The resulting count rates are normalized to the fully lithiated state to obtain the correlations between relative PIGE signal and Li content as depicted in Figure 11. This plot now enables the recalculation of the relative intensities to SoC for the given materials. Since an extraction of 0.5 Li per unit formula LiCoO2 is considered 100% SoC for our cells, each Δx = 0.1 corresponds to a ΔSoC of 20%.

4.5. Cell Preparation

Preparation of ceramic all-solid-state batteries: The ceramic LLZO-based ASBs were fabricated by using dense Li6.3Al0.1La3Zr1.6Ta0.4O12 (LLZO:Ta) discs of approx. 11 mm diameter and 0.6 mm thickness as ceramic separator on which the mixed LCO/LLZO:Ta cathode was coated. The Li concentration was verified via nuclear reaction analysis (NRA). The mixed cathode was prepared using a 1:1 mass ratio of LCO (MTI Corp.) and LLZO:Ta powder. An ink was prepared with 6% Ethyl cellulose (Sigma-Aldrich) dissolved in terpineol (Sigma-Aldrich), an 8250 thinner (Dupont), and the ceramic powder in a weight ratio of 3:2:5. The cells were then sintered in a tube furnace (Nabertherm) with a heating rate of 2 K min−1 to 873 K followed by 10 K min−1 to 1323 K and 30 min dwell time using Al2O3 ceramic boat as carrier in air. After the sintering process, a desktop sputter coater (Cressington 108cuto coater) was used to apply a thin gold film on top of the mixed cathode to serve as current collector and on the LLZO:Ta separator to help Li-metal anode adhesion. The thickness of the mixed cathode is in the range of 150 µm (see Figure 9) and the details on the fabrication process of the cells can be found in our previous reports [43,44].

Preparation of Polymer All-Solid-State Batteries

For the polymer-based ASBs, the synthesis of Poly[bis(2-2-methoxyethoxy)ethoxy)phosphazene] (MEEP) was carried out under inert conditions according to a four-step synthesis by Wang et al. [52,53] and a slightly modified subsequent living cationic polymerization referring to Allcock et al., [54]; further details can be found in previous publications [45,55].
Lithium cobalt oxide (LCO) composite cathodes were prepared via a casting method using an electrode paste consisting of Lithium cobalt oxide (LCO, 85 wt.%), carbon black (5 wt.%), MEEP with the conducting salt lithium bis(oxalato)borate (LiBOB, 5 wt.%), and polyvinylidene fluoride (PVdF, 5 wt.%), in dimethyl sulfoxide (DMSO). After drying under reduced pressure at elevated temperatures, the composite electrodes were cut into circular pieces with a diameter of 12 mm, yielding roughly 2–3 mg of LCO active material per electrode.
The electrolyte films were prepared using a drop coating method. The coating solution consisted of 0.5 g of dry MEEP polymer, 10 wt.% of benzophenone, and 15 wt.% of lithium bis(oxalato)borate (LiBOB) dissolved in 1.4–1.6 mL dry tetrahydrofuran (THF). After stirring the solution until benzophenone and the lithium salt completely dissolved, it was directly applied onto the composite cathodes. Figure 7 shows the resulting cell cross-cut.

Supplementary Materials

The following are available online at https://0-www-mdpi-com.brum.beds.ac.uk/article/10.3390/batteries7020041/s1, Video S1: supplementary.v2.mp4.

Author Contributions

Conceptualization and Methodology: S.M., B.T., T.S., T.K., K.S., H.-D.W., Y.K., K.M. and M.F. Investigation and Formal Analysis: S.M., B.T., R.G., T.S., Y.I. and K.F. Writing Original Draft: all authors. Administration and Funding Acquisition: M.F., T.S., H.-D.W. and K.M. All authors have read and agreed to the published version of the manuscript.

Funding

This research was funded by the German Federal Ministry of Education and Research (BMBF) within the InDiCate (FKZ: 03XP0124A) and InCa (FKZ: 03XP0228D) project and the Festbatt project (FKZ: 13XP0173A) and is gratefully acknowledged here.

Institutional Review Board Statement

Not applicable.

Informed Consent Statement

Not applicable.

Data Availability Statement

The raw data and the processed data required to reproduce these findings are available to download from https://0-doi-org.brum.beds.ac.uk/10.26165/JUELICH-DATA/XJPWRQ.

Acknowledgments

Special thanks to Doris Sebold and Chih-Long Tsai from IEK-1 for the SEM and EDX measurements and for the preparation of the LLZO based cells as well as Marija Hoffmeyer and Sarah M. Schmülling from the Institut für anorganische und Analytische Chemie WWU Münster for the lab supervision in case of the MEEP synthesis and polymer cell preparation.

Conflicts of Interest

The authors declare no conflict of interest.

Appendix A

Here, the details of the calculations for the conversion of the Li PIGE signal into x in LixCoO2 in mixed cathodes is given. As the signal is proportional to the total amount of Li atoms in a given volume, the Li concentration needs to be calculated for LLZO and in case of LCO for the two extreme values x = 1 and x = 0 related to charged and discharged state, first. The intermediate conversion values between signal and x can then be derived from linear regression with high accuracy.
Table A1. Calculation of Li atoms/cm3 for LLZO and LCO at x = 0 and x = 1.
LCOg/molg/cm3mol LCO/cm3Li atoms/cm3
x = 197.95.050.05160.0516
x = 0.594.44.870.05160.0258
LLZOg/molg/cm3mol LLZO/cm3Li atoms/cm3
0.4 Ta873.62855.40.00620.0399
Next, these values need to be converted into the values for the mixed cathode. Since a 1:1 mass ratio was used in making the cathode, a volume ratio of LCO:LLZO of 0.516:0.484 needs to be used due to different material density. We further consider, that changing x in LCO from 1 to 0.5 upon charging reduces the Li concentration from 25% to 14.29% by calculating the Li atom% for every x of the stoichiometric formula. A variation in density with x is neglected, since ion-beam analysis is considered insensitive to the distances between the target atoms. At the same time, the Li in LCO changes, the Li in the electrolyte part of the mixed cathode remains constant, resulting in a reduced relative concentration change of Li. The applied SimNRA model includes the impact of x dependent stopping power of the material related to the change in stoichiometry, which further alters the yield of photons (PIGE signal) emitted per lithium atom in the sample. Table A2 gives the amount of Li atoms/cm3 in the mixed cathode for an x between 1 and 0.5 in 0.1 steps considering the discussed chain of corrections.
Table A2. Calculated at Li/cm3 for various SoC in the LCO + LLZO mixed cathode and simulated PIGE signal by SIMNRA enabling a reverse calculation of x from the measured PIGE signal.
x in LixCoO2Li-atoms/cm3at. Li/cm3 in Mixed CathodeCalculated Relative Concentration ChangeSimNRA PIGE Signal
10.05160.045911.0000
0.90.04640.04330.94200.9476
0.80.04130.04060.88390.8875
0.70.03610.03790.82590.8375
0.60.03090.03530.76780.7797
0.50.02580.03260.70980.7177

References

  1. Nazri, G.-A.; Pistoia, G. Lithium Batteries: Science and Technology; Springer Science & Business Media: Berlin/Heidelberg, Germany, 2008. [Google Scholar]
  2. Kim, I.-S.; Kumta, P.N. High capacity Si/C nanocomposite anodes for Li-ion batteries. J. Power Sources 2004, 136, 145–149. [Google Scholar] [CrossRef]
  3. Marinaro, M.; Yoon, D.-h.; Gabrielli, G.; Stegmaier, P.; Figgemeier, E.; Spurk, P.C.; Nelis, D.; Schmidt, G.; Chauveau, J.; Axmann, P.; et al. High performance 1.2 Ah Si-alloy/Graphite| LiNi0. 5Mn0. 3Co0. 2O2 prototype Li-ion battery. J. Power Sources 2017, 357, 188–197. [Google Scholar] [CrossRef]
  4. Xia, Y.; Zheng, J.; Wang, C.; Gu, M. Designing principle for Ni-rich cathode materials with high energy density for practical applications. Nano Energy 2018, 49, 434–452. [Google Scholar] [CrossRef]
  5. Rozier, P.; Tarascon, J.M. Review—Li-Rich Layered Oxide Cathodes for Next-Generation Li-Ion Batteries: Chances and Challenges. J. Electrochem. Soc. 2015, 162, A2490. [Google Scholar] [CrossRef]
  6. Fuller, T.F.; Doyle, M.; Newman, J. Simulation and Optimization of the Dual Lithium Ion Insertion Cell. J. Electrochem. Soc. 1994, 141, 1. [Google Scholar] [CrossRef] [Green Version]
  7. Dai, Y.; Srinivasan, V. On graded electrode porosity as a design tool for improving the energy density of batteries. J. Electrochem. Soc. 2015, 163, A406. [Google Scholar] [CrossRef]
  8. Janek, J.; Zeier, W.G. A solid future for battery development. Nat. Energy 2016, 1, 16141. [Google Scholar] [CrossRef]
  9. Doyle, M.; Fuller, T.F.; Newman, J. Modeling of galvanostatic charge and discharge of the lithium/polymer/insertion cell. J. Electrochem. Soc. 1993, 140, 1526. [Google Scholar] [CrossRef]
  10. de Vidst, P.; White, R.E. Governing equations for transport in porous electrodes. J. Electrochem. Soc. 1997, 144, 1343. [Google Scholar] [CrossRef]
  11. Ramadass, P.; Haran, B.; Gomadam, P.M.; White, R.; Popov, B.N. Development of first principles capacity fade model for Li-ion cells. J. Electrochem. Soc. 2004, 151, A196. [Google Scholar] [CrossRef]
  12. Garcia, R.E.; Chiang, Y.M.; Carter, W.C.; Limthongkul, P.; Bishop, C.M. Microstructural modeling and design of rechargeable lithium-ion batteries. J. Electrochem. Soc. 2005, 152, A255. [Google Scholar] [CrossRef]
  13. Latz, A.; Zausch, J. Thermodynamic consistent transport theory of Li-ion batteries. J. Power Sources 2011, 196, 3296–3302. [Google Scholar] [CrossRef] [Green Version]
  14. Latz, A.; Zausch, J. Multiscale modeling of lithium ion batteries: Thermal aspects. Beilstein J. Nanotechnol. 2015, 6, 987–1007. [Google Scholar] [CrossRef] [Green Version]
  15. Less, G.B.; Seo, J.H.; Han, S.; Sastry, A.M.; Zausch, J.; Latz, A.; Schmidt, S.; Wieser, C.; Kehrwald, D.; Fell, S. Micro-scale modeling of Li-ion batteries: Parameterization and validation. J. Electrochem. Soc. 2012, 159, A697. [Google Scholar] [CrossRef]
  16. Latz, A.; Zausch, J. Available online: http://www.itwm.fraunhofer.de/best (accessed on 31 January 2021).
  17. Danner, T.; Singh, M.; Hein, S.; Kaiser, J.; Hahn, H.; Latz, A. Thick electrodes for Li-ion batteries: A model based analysis. J. Power Sources 2016, 334, 191–201. [Google Scholar] [CrossRef] [Green Version]
  18. Latz, A.; Danner, T.; Horstmann, B.; Jahnke, T. Microstructure-and Theory-Based Modeling and Simulation of Batteries and Fuel Cells. Chem. Ing. Tech. 2019, 91, 758–768. [Google Scholar] [CrossRef]
  19. Kremer, L.S.; Danner, T.; Hein, S.; Hoffmann, A.; Prifling, B.; Schmidt, V.; Latz, A.; Wohlfahrt-Mehrens, M. Influence of the Electrolyte Salt Concentration on the Rate Capability of Ultra-Thick NCM 622 Electrodes. Batter. Supercaps 2020, 3. [Google Scholar] [CrossRef]
  20. Kremer, L.S.; Hoffmann, A.; Danner, T.; Hein, S.; Prifling, B.; Westhoff, D.; Dreer, C.; Latz, A.; Schmidt, V.; Wohlfahrt-Mehrens, M. Manufacturing Process for Improved Ultra-Thick Cathodes in High-Energy Lithium-Ion Batteries. Energy Technol. 2020, 8, 1900167. [Google Scholar] [CrossRef]
  21. Liu, D.; Shadike, Z.; Lin, R.; Qian, K.; Li, H.; Li, K.; Wang, S.; Yu, Q.; Liu, M.; Ganapathy, S.; et al. Review of recent development of in situ/operando characterization techniques for lithium battery research. Adv. Mater. 2019, 31, 1806620. [Google Scholar] [CrossRef] [PubMed]
  22. Grey, C.P.; Tarascon, J.M. Sustainability and in situ monitoring in battery development. Nat. Mater. 2017, 16, 45–56. [Google Scholar] [CrossRef]
  23. Sathiya, M.; Leriche, J.B.; Salager, E.; Gourier, D.; Tarascon, J.M.; Vezin, H. Electron paramagnetic resonance imaging for real-time monitoring of Li-ion batteries. Nat. Commun. 2015, 6, 6276. [Google Scholar] [CrossRef] [PubMed] [Green Version]
  24. Chandrashekar, S.; Trease, N.M.; Chang, H.J.; Du, L.-S.; Grey, C.P.; Jerschow, A. 7 Li MRI of Li batteries reveals location of microstructural lithium. Nat. Mater. 2012, 11, 311–315. [Google Scholar] [CrossRef]
  25. Gong, Y.; Zhang, J.; Jiang, L.; Shi, J.-A.; Zhang, Q.; Yang, Z.; Zou, D.; Wang, J.; Yu, X.; Xiao, R.; et al. In Situ Atomic-Scale Observation of Electrochemical Delithiation Induced Structure Evolution of LiCoO2 Cathode in a Working All-Solid-State Battery. J. Am. Chem. Soc. 2017, 139, 4274–4277. [Google Scholar] [CrossRef] [PubMed]
  26. Wang, Z.; Santhanagopalan, D.; Zhang, W.; Wang, F.; Xin, H.L.; He, K.; Li, J.; Dudney, N.; Meng, Y.S. In situ STEM-EELS observation of nanoscale interfacial phenomena in all-solid-state batteries. Nano Lett. 2016, 16, 3760–3767. [Google Scholar] [CrossRef] [PubMed]
  27. Hong, L.; Li, L.; Chen-Wiegart, Y.-K.; Wang, J.; Xiang, K.; Gan, L.; Li, W.; Meng, F.; Wang, F.; Wang, J.; et al. Two-dimensional lithium diffusion behavior and probable hybrid phase transformation kinetics in olivine lithium iron phosphate. Nat. Commun. 2017, 8, 1–13. [Google Scholar] [CrossRef] [Green Version]
  28. Kuppan, S.; Xu, Y.; Liu, Y.; Chen, G. Phase transformation mechanism in lithium manganese nickel oxide revealed by single-crystal hard X-ray microscopy. Nat. Commun. 2017, 8, 14309. [Google Scholar] [CrossRef] [Green Version]
  29. Oudenhoven, J.F.M.; Labohm, F.; Mulder, M.; Niessen, R.A.H.; Mulder, F.M.; Notten, P.H.L. In situ neutron depth profiling: A powerful method to probe lithium transport in micro-batteries. Adv. Mater. 2011, 23, 4103–4106. [Google Scholar] [CrossRef]
  30. Harks, P.-P.R.M.L.; Verhallen, T.W.; George, C.; van den Biesen, J.K.; Liu, Q.; Wagemaker, M.; Mulder, F.M. Spatiotemporal quantification of lithium both in electrode and in electrolyte with atomic precision via operando neutron absorption. J. Am. Chem. Soc. 2019, 141, 14280–14287. [Google Scholar] [CrossRef] [Green Version]
  31. Habedank, J.B.; Günter, F.J.; Billot, N.; Gilles, R.; Neuwirth, T.; Reinhart, G.; Zaeh, M.F. Rapid electrolyte wetting of lithium-ion batteries containing laser structured electrodes: In situ visualization by neutron radiography. Int. J. Adv. Manuf. Technol. 2019, 102, 2769–2778. [Google Scholar] [CrossRef]
  32. Surblé, S.; Paireau, C.; Martin, J.F.; Tarnopolskiy, V.; Gauthier, M.; Khodja, H.; Daniel, L.; Patoux, S. Operando analysis of lithium profiles in Li-ion batteries using nuclear microanalysis. J. Power Sources 2018, 393, 37–42. [Google Scholar] [CrossRef] [Green Version]
  33. Habrioux, A.; Surblé, S.; Berger, P.; Khodja, H.; D’Affroux, A.; Mailley, S.; Gutel, T.; Patoux, S. Nuclear microanalysis of lithium dispersion in LiFePO4 based cathode materials for Li-ion batteries. Nucl. Instrum. Methods Phys. Res. Sect. B Beam Interact. Mater. Atoms 2012, 290, 13–18. [Google Scholar] [CrossRef]
  34. Gonzalez-Arrabal, R.; Panizo-Laiz, M.; Fujita, K.; Mima, K.; Yamazaki, A.; Kamiya, T.; Orikasa, Y.; Uchimoto, Y.; Sawada, H.; Okuda, C.; et al. Meso-scale characterization of lithium distribution in lithium-ion batteries using ion beam analysis techniques. J. Power Sources 2015, 299, 587–595. [Google Scholar] [CrossRef] [Green Version]
  35. Mima, K.; Gonzalez-Arrabal, R.; Azuma, H.; Yamazaki, A.; Okuda, C.; Ukyo, Y.; Sawada, H.; Fujita, K.; Kato, Y.; Perlado, J.M.; et al. Li distribution characterization in Li-ion batteries positive electrodes containing LixNi0.8Co0.15Al0.05O2 secondary particles (0.75 ⩽ x ⩽ 1.0). Nucl. Instrum. Methods Phys. Res. Sect. B Beam Interact. Mater. Atoms 2012, 290, 79–84. [Google Scholar] [CrossRef] [Green Version]
  36. Yamazaki, A.; Orikasa, Y.; Chen, K.; Uchimoto, Y.; Kamiya, T.; Koka, M.; Satoh, T.; Mima, K.; Kato, Y.; Fujita, K. In-situ measurement of the lithium distribution in Li-ion batteries using micro-IBA techniques. Nucl. Instrum. Methods Phys. Res. Sect. B Beam Interact. Mater. Atoms 2016, 371, 298–302. [Google Scholar] [CrossRef] [Green Version]
  37. Kato, Y.; Ogumi, Z.; Perlado, M. Diagnostics of Lithium-Ion Batteries: Overview, Simulation, and diagnostics; Pan Stanford Publishing: Singapore, 2019. [Google Scholar]
  38. Manthiram, A.; Yu, X.; Wang, S. Lithium battery chemistries enabled by solid-state electrolytes. Nat. Rev. Mater. 2017, 2, 16103. [Google Scholar] [CrossRef]
  39. Kamaya, N.; Homma, K.; Yamakawa, Y.; Hirayama, M.; Kanno, R.; Yonemura, M.; Kamiyama, T.; Kato, Y.; Hama, S.; Kawamoto, K.; et al. A lithium superionic conductor. Nat. Mater. 2011, 10, 682–686. [Google Scholar] [CrossRef]
  40. Kato, Y.; Hori, S.; Saito, T.; Suzuki, K.; Hirayama, M.; Mitsui, A.; Yonemura, M.; Iba, H.; Kanno, R. High-power all-solid-state batteries using sulfide superionic conductors. Nat. Energy 2016, 1, 16030. [Google Scholar] [CrossRef]
  41. Lee, Y.-G.; Fujiki, S.; Jung, C.; Suzuki, N.; Yashiro, N.; Omoda, R.; Ko, D.-S.; Shiratsuchi, T.; Sugimoto, T.; Ryu, S.; et al. High-energy long-cycling all-solid-state lithium metal batteries enabled by silver–carbon composite anodes. Nat. Energy 2020, 5, 299–308. [Google Scholar] [CrossRef]
  42. Yamada, Y.; Suzuki, K.; Yoshino, K.; Taminato, S.; Satoh, T.; Finsterbusch, M.; Kamiya, T.; Yamazaki, A.; Kato, Y.; Fujita, K.; et al. Ex-situ Analysis of Lithium Distribution in a Sulfide-based All-solid-state Lithium Battery by Particle-induced X-ray and Gamma-ray Emission Measurements. Electrochemistry 2020, 88, 45–49. [Google Scholar] [CrossRef] [Green Version]
  43. Finsterbusch, M.; Danner, T.; Tsai, C.-L.; Uhlenbruck, S.; Latz, A.; Guillon, O. High Capacity Garnet-Based All-Solid-State Lithium Batteries: Fabrication and 3D-Microstructure Resolved Modeling. ACS Appl. Mater. Interfaces 2018, 10, 22329–22339. [Google Scholar] [CrossRef] [PubMed]
  44. Tsai, C.-L.; Ma, Q.; Dellen, C.; Lobe, S.; Vondahlen, F.; Windmüller, A.; Grüner, D.; Zheng, H.; Uhlenbruck, S.; Finsterbusch, M.; et al. A garnet structure-based all-solid-state Li battery without interface modification: Resolving incompatibility issues on positive electrodes. Sustain. Energy Fuels 2019, 3, 280–291. [Google Scholar] [CrossRef]
  45. Jankowsky, S.; Hiller, M.M.; Wiemhöfer, H.D. Preparation and electrochemical performance of polyphosphazene based salt-in-polymer electrolyte membranes for lithium ion batteries. J. Power Sources 2014, 253, 256–262. [Google Scholar] [CrossRef]
  46. Jankowsky, S.; Hiller, M.M.; Stolina, R.; Wiemhöfer, H.D. Performance of polyphosphazene based gel polymer electrolytes in combination with lithium metal anodes. J. Power Sources 2015, 273, 574–579. [Google Scholar] [CrossRef]
  47. Yabuuchi, N.; Kawamoto, Y.; Hara, R.; Ishigaki, T.; Hoshikawa, A.; Yonemura, M.; Kamiyama, T.; Komaba, S. A Comparative Study of LiCoO2 Polymorphs: Structural and Electrochemical Characterization of O2-, O3-, and O4-type Phases. Inorg. Chem. 2013, 52, 9131–9142. [Google Scholar] [CrossRef] [PubMed]
  48. Okumura, T.; Yamaguchi, Y.; Shikano, M.; Kobayashi, H. Correlation of lithium ion distribution and X-ray absorption near-edge structure in O3-and O2-lithium cobalt oxides from first-principle calculation. J. Mater. Chem. 2012, 22, 17340–17348. [Google Scholar] [CrossRef]
  49. Nitta, N.; Wu, F.; Lee, J.T.; Yushin, G. Li-ion battery materials: Present and future. Mater. Today 2015, 18, 252–264. [Google Scholar] [CrossRef]
  50. Koka, M.; Ishii, Y.; Yamada, N.; Okubo, T.; Kada, W.; Kitamura, A.; Iwata, Y.; Kamiya, T.; Sato, T. Light Ion Microbeam Analysis/Processing System and Its Improvement; No. JAEA-TECHNOLOGY--2016-006; Japan Atomic Energy Agency: Naka-gun, Japan, 2016. [Google Scholar]
  51. Mayer, M. SIMNRA User’s Guide; Report IPP 9/113; Max-Planck-Institut für Plasmaphysik: Garching, Germany, 1997. [Google Scholar]
  52. Wang, B.; Rivard, E.; Manners, I. A New High-Yield Synthesis of Cl3PNSiMe3, a Monomeric Precursor for the Controlled Preparation of High Molecular Weight Polyphosphazenes. Inorg. Chem. 2002, 41, 1690–1691. [Google Scholar] [CrossRef] [PubMed]
  53. Wang, Z.; Manners, I. Synthesis and characterization of water-soluble cationic and anionic polythionylphosphazene polyelectrolytes. Macromolecules 2005, 38, 5047–5054. [Google Scholar] [CrossRef]
  54. Allcock, H.R.; Reeves, S.D.; de Denus, C.R.; Crane, C.A. Influence of Reaction Parameters on the Living Cationic Polymerization of Phosphoranimines to Polyphosphazenes. Macromolecules 2001, 34, 748–754. [Google Scholar] [CrossRef]
  55. Paulsdorf, J.; Kaskhedikar, N.; Burjanadze, M.; Obeidi, S.; Stolwijk, N.A.; Wilmer, D.; Wiemhöfer, H.D. Synthesis and ionic conductivity of polymer electrolytes based on a polyphosphazene with short side groups. Chem. Mater. 2006, 18, 1281–1288. [Google Scholar]
Figure 1. Exemplary 2D elemental maps of the spatial distribution of element specific counts of the three major elements of the LLZ-based cell charged to 4.2 V. The maps show the LCO + LLZO part at Y = 150–280 µm and the LLZ separator at Y = 0–150 µm.
Batteries 07 00041 g001
Figure 2. 1D plot of the signal intensity for Zr (PIXE) and Li (PIGE) for all four LLZO-based cells. Pure LLZO separator on the left, LCO + LLZO mixed cathode on the right side. Dotted lines mark the ~100-µm-thick LLZO + LCO cell regions over which the counts were integrated to obtain the absolute Li concentration.
Batteries 07 00041 g002
Figure 3. Electrochemical characterization of all three LLZO-based ASBs showing reproducible cell performance in the first cycle (a) and example of the ex-situ preparation of the 4.2 V LLZO-based cell with a holding time of 110 h to allow equilibration of Li-concentration within the mixed cathode (b).
Batteries 07 00041 g003
Figure 4. Exemplary elemental maps of the four major elements of the LCO + MEEP-based cell charged to 4.0 V. The map clearly shows the Li metal from Y = 470–600 µm, the MEEP separator from Y = 370–470 µm, and the LCO + MEEP from Y = 300–370 µm. The layer structure of the MEEP-based cells is less clear and homogeneous compared to the LLZO-based cells.
Batteries 07 00041 g004
Figure 5. 1-D profiles of the MEEP-based ex-situ cells. The cells show strong differences in the mixed-cathode width, indicated by the LCO concentration and most likely due to the manufacturing or cross sectioning process. The ratios of Li to Co indicate a loss of approx. 20 at% Li in particular when comparing the 3.96 V and 4 V samples.
Batteries 07 00041 g005
Figure 6. (a) Li and Co profiles of the operando cell. The LCO + MEEP layer lies at the right, a MEEP separator in the center, and the lithium metal on the left side. The LCO layer slightly changes its width and position upon charging with 4.2 V with a lithium concentration increase around pixel 65. (b) Elemental map before (asprep) and (c) after charging at 60 °C and 4.2 V. Li clearly migrated from the separator side of the LCO towards the Li metal. The scale bar is the same for all and represents the counts per pixel.
Batteries 07 00041 g006
Figure 7. SEM image of a MEEP cell cross-cut (a) and a representative charge-discharge curve of this cell type (b).
Batteries 07 00041 g007
Figure 8. Side view of the analysis setup with outside connections for in-situ charging. Photon detectors are positioned behind (PIGE) and in front of the sample at 45° (PIXE). A 7.5-µm-thick beam entrance window allows for sample transport and analysis under protective atmosphere. The light yellow parts are made from PEEK, grey parts from Al, screws from stainless steel. The right side shows a zoom to the cell details with typically two cells installed in a single holder.
Batteries 07 00041 g008
Figure 9. Camera image of the 4.2 V charged LLZO-based cells as seen through the beam window (centre) with a schematic of the cell setup (right) including approximate thicknesses. The red rectangle marks the analysis region of 50 × 300 µm2 and the resulting Co mapping by PIXE and Li mapping by PIGE (left).
Batteries 07 00041 g009
Figure 10. Cumulative (time and space) characteristic x-ray (PIXE, a) and gamma ray spectrum (PIGE, b) of ceramic ASBs featuring LLZO as solid electrolyte and LCO as cathode active material.
Batteries 07 00041 g010
Figure 11. The relation between PIGE signal intensity calculated by SimNRA7.02 and amount of Li in the mixed cathode is linear (R2 = 0.999) for the assumed LCO + LLZ 1:1 mixture. The decrease of signal intensity is only 28%, due to the limited amount of mobile Li in LiCoO2 and the 1:1 wt.% mixture of LCO and LLZO.
Batteries 07 00041 g011
Table 1. IBA results of the LLZ + LCO cells showing a clear decrease of lithium signal with increasing SoC. The four different charge states can be resolved considering uncertainties. The As-prep sample is defined as SoC = 0. Considering the measured irreversible capacity loss in the first cell cycle, compared to As-prep, the SoC of the investigated 2nd cycle increases accordingly.
Charging [V]Mean PIGE Li Signal [a.u.]Relative PIGE Li-SignalX in LixCoO2 via IBADerived IBA SoC [%]SoC Relative (2nd Cycle) [%]
As-prep904110-
3.88470.9370.865280
3.958180.9050.78343.424
4.27100.7850.5492100
Publisher’s Note: MDPI stays neutral with regard to jurisdictional claims in published maps and institutional affiliations.

