
Investigation into the Lithium-Ion Battery Fire Resistance Testing Procedure for Commercial Use


1
Maritime Advanced Research Centre, Szczecinska 65, 80-392 Gdansk, Poland
2
Institute of Fluid Flow Machinery, Polish Academy of Sciences, Fiszera 14, 80-231 Gdansk, Poland
*
Author to whom correspondence should be addressed.
†
These authors contributed equally to this work.
Batteries 2021, 7(3), 44; https://0-doi-org.brum.beds.ac.uk/10.3390/batteries7030044
Submission received: 18 May 2021
/
Revised: 9 June 2021
/
Accepted: 16 June 2021
/
Published: 30 June 2021
(This article belongs to the Special Issue Electrochemical, Thermal, and Safety Properties of Lithium and Post-Li Materials and Cells II)
Abstract
:Lithium-ion batteries (LIBs) have many advantages (e.g., high voltage and long-life cycle) in comparison to other energy storage technologies (e.g., lead acid), resulting in their applicability in a wide variety of structures. Simultaneously, the thermal stability of LIBs is relatively poor and can be damaged by exposure to fire. This paper presents an investigation into a fire resistance safety test for LIBs and the use of thermal sensors to evaluate exposure conditions and estimate the temperatures to which cells are subjected. Temperature distribution data and statistical analysis show significant differences of over 200 C, indicating the stochastic nature of the heating curve despite following the testing procedure requirements. We concluded that the current testing procedure is inadequate for the reliable testing of LIBs, leaving an alarming loophole in the fire safety evaluation. The observed instability is mostly related to wind speed and direction, and fire source size.
Keywords:
safety; lithium ion battery; fire; temperature; rechargeable energy storage system; LIB; RESS; thermocouple; pool fire1. Introduction
Lithium-ion batteries (LIBs) have recently increased in popularity and are currently used as a power source in both commercial (e.g., cars [1] and airplanes [2]) and every-day (e.g., notebooks) applications. The wide applicability of LIBs is associated with their advantages: good stability, high voltage, low self-discharge rate, high energy density, and long life cycle [1]. The disadvantages of LIBs are their narrow operational temperature range [3] and sensitivity to abusive conditions including high temperature, crush, overcharge, overdischarge, short circuit, etc. [4]. LIB sensitivity to heating necessitates the determination of maximal temperature (below 60 C) for safety storage and operation [5]. Exploitation at higher temperature results in faster degradation of the battery as well as shortening of its lifetime [3]. Additionally, exposition on such temperatures results in proximity to cell self-heating temperatures [5].
Due to their limited thermal stability, any LIB failure may cause fire or, under a certain circumstances, explosion [3]. The LIB sensitivity to fire strongly depends on their state of charge (SOC): 100% SOC results in the strongest LIB reactivity [6]. Some examples of fire accidents in structures with rechargeable energy storage subsystems (RESS, or ’battery’) are presented in Table 1. The problems with LIB thermal stability have necessitated the implementation of safety requirements related to aircraft transportation. LIBs can be transported only in cargo airplanes and their SOC should be not higher than 30% [7]. The typical causes of battery failure in electric vehicles are fire during charging process, self-ignition while driving, and fire after the traffic accidents such as high-speed collisions [2].
Despite the possibility of fire occurrence in electric- and fuel-powered vehicles being similar, the processes differ and must be detected as early as possible [1]. Fire resistance tests of any newly designed LIB should be performed. A variety of extinguishing technologies tests should also be conducted. RISE institute (Sweden) conducted a fire suppression test for several LIBs from electric vehicles using water spray and mist. During the procedure, thermal runaway was initiated in one LIB module exposed directly to a gas burner. The extinguishing effectiveness was compared to the behavior of an LIB-burning process without any external interference. It was concluded that the fire suppression system inside the LIB produced a good and lasting cooling effect on the LIB and prevented thermal runaway propagation. External activation was only useful for suppressing flames outside the LIB to protect the surroundings [8].
LIBs overheating (e.g., due to exposition to fire) may result in temperature values higher than those of the normal operating range. Therefore, active materials will decompose or react with each other (exothermic reactions), leading to thermal runaway [3,11]. The electrochemical reaction process inside an LIB at high temperature involves the following chemical transformations: solid electrolyte interface layer decomposition, reaction between the anode material and electrolyte, reaction between the cathode material and the electrolyte, electrolyte decomposition, and the reaction between the anode and the binder [3]. Under elevated temperatures, electrode materials decompose to release oxygen, which further reacts with electrolytes, such as LiPF and organic carbonate solvents [3], which are commercially used, leading to a large amount of generated heat [1]. When the battery enters thermal runaway, it may vent and eject particulates as well as flammable and toxic gases that are harmful to the environment [3,6,11]. Examples of toxic gases that can originate from batteries due to fire are hydrogen fluoride (HF) [6,11], CO, NO, SO, HCl [6], and phosphorous oxyfluoride (POF) [11].
To increase the safety of objects with LIBs, it is important to analyze the influence of fire on batteries and the combustion process. Feng et al. [12] determined the exposure temperature range for large-format LIBs. The moment of the re-usability of the battery was assumed as the melting point of the electrodes separator [12]. Nordmann et al. [10] proposed a method to localize the thermal event to obtain more detailed knowledge of a battery pack’s thermal characteristics. Ping et al. [13] constructed a deconvolution-based method to analyze thermal reactions in a single electrode system and a full cell system. Ouyang et al. [1] analyzed the influence of RESS parameters (e.g., the dimension of the gap between cells and SOC value) on thermal failure characteristics. Wang et al. [3] reviewed the thermal runaway phenomenon and the related fire dynamics in single LIB cells and multi-cell battery packs. Doughty et al. [4] examined the development of damage in an LIB and vehicles containing RESS due to fire as well as safety devices solutions incorporated into RESS. Pfrang et al. [5] comprehensively reviewed battery safety when exposed to fire or explosion, and possible failure battery scenarios due to overheating. Williard et al. [9] described the challenges related to battery applications in the Boeing 787 as well as methods related to improving aircraft safety related to batteries. Larsson et al. [11] analyzed the behavior of LIBs (with cells having lithium–iron phosphate cathodes and a conventional laptop battery pack with a cobalt-based cathode) exposed to propane fire. The experimental investigation allowed determining the toxicity of fumes originating from LIBs under fire. The toxicity of gases emitted by a battery exposed to fire was also investigated by Ribiere et al. [6].
The growing popularity of RESS applications resulted in the implementation of regulatory documents regarding their principal requirements and testing procedures with respect to fire resistance. One of such procedures studied in this paper is regulation No. 100 revision 2 constituted by the United Nations Economic Commission for Europe (UN ECE) [14], abbreviated as R100.02. R100.02 applies to electric power train of road vehicles of categories M and N (carrying goods or passengers) [15] and is obligatory for UN members; therefore, test procedures within the document are expected to be responsible for the quality assurance of a given product prior to its commercial use. We observed that the fire testing procedure in its current state does not guarantee repeatable conditions.
For a measurement technique and equipment, open pool fires and analysis of heat transfer inside the fire were investigated. The experimental setup involved K-type thermocouples (0.7 mm in diameter) and an adiabatic cask allowing for focusing on convective heat transfer [16] of thermocouples embedded into the engulfed bodies [17]. R100.02 lacks any form of control over the testing conditions; hence, for the study, the placement of the thermocouples was founded on the rules described in passive fire protection procedures [18], which assess the thermal insulation of samples. In addition, the approach to fire testing was adopted to use reinforced gypsum pads as a cover excluding the influence of radiation heat transfer [19]. Unfortunately, investigations were conducted on individual [11] lithium-ion cell or a few grouped together [1]; therefore, a testing setup for full-scale and commercially available RESS packs needs to be constructed.
The goal of this study was primarily to evaluate the reliability and accuracy of the failure prevention procedure R100.02 and to present the thermal runaway possibility of the tested system. The first part was carried out through temperature distribution measurements on the RESS and the second involved using a numerical method of estimating the interior temperature during the test.
The paper is organized as follows: Firstly, the fire test assumptions and problems are briefly described, then the experimentally investigated RESS with a measurement set-up is presented. Next, the experimental investigation (fire test) results are presented and discussed. Then, a theoretical calculation of temperature inside the examined RESS is shown. Finally, conclusions are drawn.
2. LIB Fire Safety Procedure
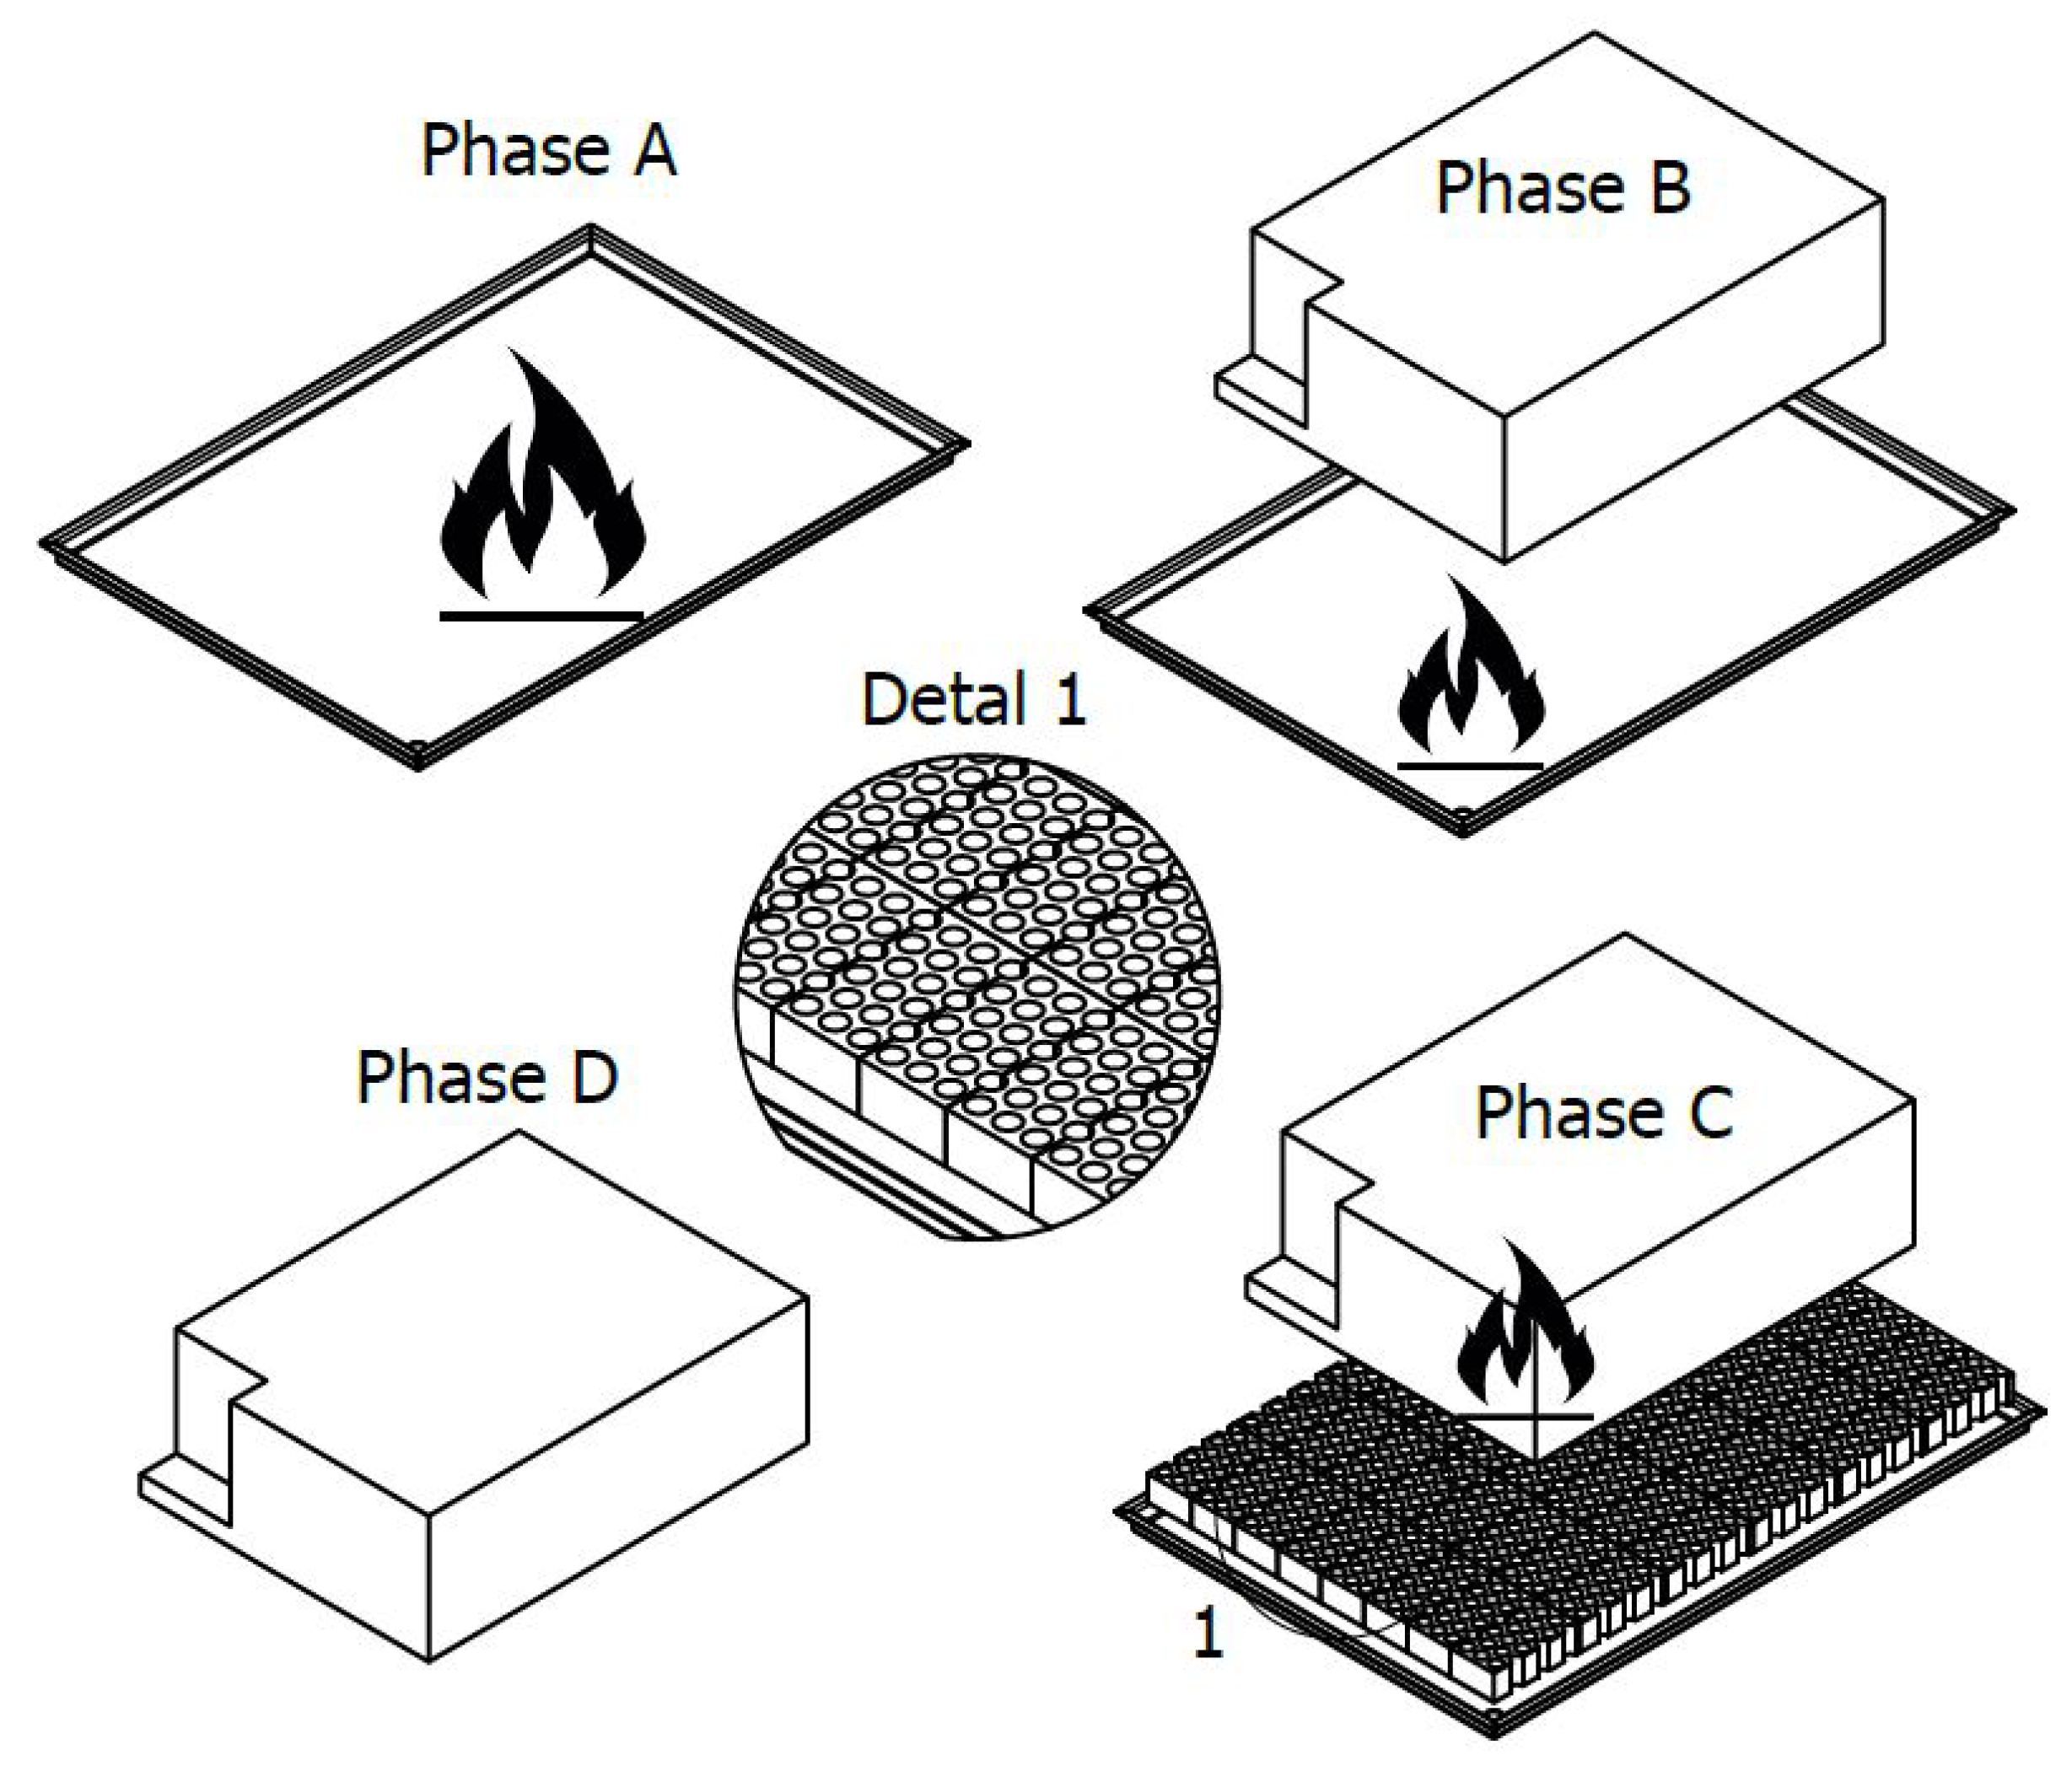
The main purpose of a fire resistance test is to evaluate the resistance against heat exposure propagated by fuel spills and ensure the driver and passengers have enough time to evacuate. The exposure of RESS to fire during the test is provided by positive-ignition engine burning under atmospheric pressure. The specimen is engulfed in flames for a given time period and then observed for any signs of explosion. The test procedure, shown in Figure 1 and listed in Table 2, comprises four phases. During phase A, fuel is freely burning with the RESS being at least 3 m away from the fire source. In phase B, the battery is directly exposed to flame. Next, during phase C, the fire source is moderated by a screen of perforated bricks composed of refractory material. In the last phase, D, the battery is removed from fire source to the initial position and observed until the surface temperature of the specimen decreases to ambient temperature or has been decreasing for a minimum time of 3 h.
During R100.02 fire resistance testing, the following conditions have to be satisfied:
- The test must be carried out in an ambient temperature of at least 20 C.
- Wind speed has to be limited to 2.5 km/h measured over the fire source.
- The flame source horizontal dimensions must be larger than the specimen by 20–50 cm.
- Positive-ignition fuel needs to be used as a fire source.
- The tested specimen has to be set at 0.5 m height from the fire source.
Performing the internal tests of the RESS according to R100.02, fulfilling all from the above-listed conditions, does not guarantee sufficient accuracy of the test results. Variance in the testing conditions may result in differences in the safety level findings of commercially available RESS.
To better understand the problems with the testing conditions, they are briefly described here in relation to heat transfer. The topic of heat transfer to the bodies engulfed in pool fires was studied and a couple of models were suggested [20]. A body enveloped in a fire is exposed to convective and radiative heat transfer [21]. Net heat transfer may be presented as
where and are the convective and radiative parts of heat flux, respectively. Studies showed, however, that it is a difficult parameter to estimate due to the many variables and conditions to which sensors are subjected, and calculations may involve estimation error as high as ±40% [22]. Notably, the fire source in the study was significantly larger than the engulfed body, i.e., 20, 28, or 39 times larger in diameter. When compared to the RESS studied in the test, R100.02 requires a flame source only 1.5 to 2.5 times larger than the battery. The same study also showed that the temperature difference between the middle line and the edge of the fire pool can be as high as 500 C [17]; therefore, to provide equal heating conditions on all sides, the fire source should be significantly larger than the RESS.
Another important factor in the fire resistance tests is wind speed. A study suggested the 7.2 km/h critical value above which the mass burning rate is increased [23]; per R100.02, wind speed should be limited to 2.5 km/h above the fuel source. At this speed, wind may not affect on the burning rate; however, it may direct the flames to the randomly selected side of the RESS, creating uneven heating conditions [24], especially when the fire pool is not large enough to provide the necessary overlap.
Discrepancies between the studies were also found in the transitory period length. The transitory period corresponds to the development of the fire when there is a continuous increase in the size of the flames and a progressive increase in the burning rate and temperature; hence, the exposure conditions are unstable during that period. One study found 40–50 s was needed to obtain stable conditions [23], whereas another suggested even 150 s may be necessary [17]. However, R100.02 requires 60 s of initial pre-heating after which the sample is exposed to direct fire for 70 s. As a result, the specimen may not be exposed to stabilized fire, impairing the reliability of the procedure.
Heat flux, related to the LIB test, was simplified to only the convective part for the calculations.
Heat flux can be expressed as [25]
where is the heat transfer coefficient and is the surface temperature over which the temperature of air (ambient temperature of at least 20 C) is . The heat transfer coefficient is a function of time t and position-; therefore, a partial derivative can be formulated as
Subsequently, due to the testing set-up, i.e., battery over flame source and casing shape, the equation for convection over a horizontal plate most accurately fit this model. To estimate the coefficient, Nusselt number was used, which is defined as
where is the Rayleigh number. Experimental data in the form of temperature measurements were used for iteration.
3. Object of Investigation
The experimental analyses were performed on a complete rechargeable energy storage system with the following dimensions: 110 cm long, 80 cm wide, and 40 cm high, which was composed of lithium titanium oxide (LTO) cells and a lagging system. The SOC value was set to 51% of the normal operating range prior to the test. No active protection devices were present for the test. For temperature distribution measurement, 10 thermocouples (denoted TC1–TC10) were mounted on the outer surface of the battery. The exact thermocouples locations are described in Table 3 and shown in Figure 2. All thermocouples, except for TC6, were fixed using square-shaped gypsum pads with adhesive to isolate the measuring tip from environmental influences and to measure solely the surface temperature [19]. Type K (NiCr-Ni) thermocouples used in the test were calibrated to class 1 accuracy according to DIN EN 60584-2, which corresponds to an error of C at 900 C. A DataTaker logger with checked measuring path was used as a data acquisition center for thermocouples with a sampling interval of 3 s. Expanded uncertainty for the whole temperature measurement was established as C.
The test rig was composed of a fuel pan, brick screen, and a cart with a grating table and specimen on top. The fire source, in the form of a steel pan filled with petrol, was fixed as a stationary element with the cart and brick screen being freely movable. The RESS was placed on the grating table constructed with steel rods with an 8 mm outer diameter with 40 mm spacing in between, additionally supported with flat steel bars. The test rig was protected from wind with panels to keep wind velocity at the pan level below 2.5 km/h.
The fuel pan exceeded the horizontal projection of the tested device by 40 cm in length and 30 cm in width (requirement is between 20 and 50 cm). One ensured that during the exposure, the RESS was positioned centrally to the pan to ensure even flame distribution. The sidewalls of the pan projected between 0 and 5 mm above the fuel level at the beginning of the test. The bottom surface of the test specimen was set at a height of 50 cm from the petrol surface.
RON 95 petrol was used in the test as a fire source. The amount of fuel for the duration of the procedure was 25 L/m [26,27].
Ambient conditions before the test were: temperature 18.3 C and humidity 68.1%. Average wind velocity measured before the test at the pan level was 0.97 km/h and for the whole duration of the test, it did not exceed 2.5 km/h (TESTO thermal anemometer, calibrated, error of 0.05 m/s at 1 m/s wind speed). Fuel average temperature before the test was 18.9 C.
4. Experimental Results
The test lasted in total 1 h 34 min 39 s starting from the ignition of fuel up to reaching ambient temperature at thermocouples TC1–TC10. Figure 3 presents the temperature measurements for the first 5 min (600 s) of the test. The results past the 10 min mark show a constant decrease in temperature until levelling with ambient conditions. The thermocouple arrangement allowed the determination of the temperature distribution in space for a chosen time.
During phase A, temperatures slowly increased until the 60 s mark due to the specimen cart movement toward the fire source. Next, immediate temperature spike was observed in phase B, where the specimen was directly subjected to the flame. In the course of indirect exposure to flame (phase C), the temperatures on the surface of the battery case reached their maximal values. In phase D, the test specimen was removed from the fire source and the temperatures generally dropped steadily until equalizing with the ambient temperature.
For each thermocouple, the maximum recorded temperature was determined using
where subscript TC is related to he thermocouple, and index 1–10 denotes its location; superscript P indicates the phase of the test according to Table 2. Table 4 shows the maximum recorded temperature at every thermocouple in each phase. Analogously, the average temperature and standard deviation during each phase was determined using the following equations
During phase A, TC9 recorded 42.2 C, which was the highest during that stage. The side of the battery with TC9 faced toward the flame; thus, one assumed wind might have directed some hot air toward the battery. The highest temperatures in phase B were recorded for TC7 (929.6 C), TC6 (799.8 C), and TC5 (711.2 C). The flame center line was observed to lean toward the side with TC7; therefore, TC6 was expected to record lower temperature, despite being closer to the fire source. Next, in phase C, the highest recorded temperatures were at TC7 (929.9 C), TC5 (880.6 C), and TC10 (714.6 C). Additionally, the remaining TC temperatures increased in comparison to the previous phase, suggesting that conditions started levelling around the battery, and the brick screen may notably reduce exposure. Phase D highest temperatures coincided with the transition from phase C, except for TC9, whereas a significant was recorded to 433.6 C, caused by ignition of the paint.
The average temperature values show that the testing conditions peaked in phase C with 452.0 C despite screen-reduced flame. The standard deviations of phase B and C were 218.3 C and 239.3 C, respectively, which supports the premise that the temperature distribution around the battery was highly irregular. With average temperature being higher later in the test and with considerable statistical dispersion, the results indicate that a steady burning rate may have not been reached by the end of the test.
In addition, for all thermocouples, the rates of temperature change (RTC) and their maximum values were respectively determined using the following formulas
where subscript is related to the thermocouple, and index 1–10 denotes its location. The superscript P indicates the phase of the test according to Table 2. Analogously, the average RTC and standard deviation during each phase were determined using the following equations
Table 5 shows the maximum RTC for every thermocouple in each phase, and the average and standard deviation of the RTC in a given phase.
The highest RTC was recorded during phase B for TC6 (298.8 C) measuring fire temperature; since the measuring tip was uncovered, the temperature spiked immediately. In phase C, TC5 registered the highest temperature of 94.0 C, which might be attributed to the flame leaning toward TC5 and TC7, both being directly exposed to flame (protecting gypsum pad detached). This also corresponds with the highest RTCs in phase D of TC5 and TC7, as they were cooled by air immediately after the battery was removed from the flame source. Notably, a sudden rise was recorded at TC9, corresponding to the ignition of the paint in the thermocouple area.
In phase B, the highest average RTC was 17.5 C/s, which was expected due to the rapid accretion in temperature caused by exposure to flame. However, in the following phase C, the average RTC was only 0.7 C/s, suggesting the testing conditions started then equalized around the battery. The standard deviation was highest in phases B and C at 38.6 and 23.2 C/s, respectively, confirming the flame was prone to momentary changes in local conditions (i.e., wind speed and puffing). Hence, the unsteady transitory period of burning was not eliminated by the initial phase A pre-heating. The absence of a steady burning rate may result in unreliable tests performed according to the same procedure.
For a more in-depth analysis, the thermocouples were divided into sets: top, bottom, and side surfaces, and plugs.
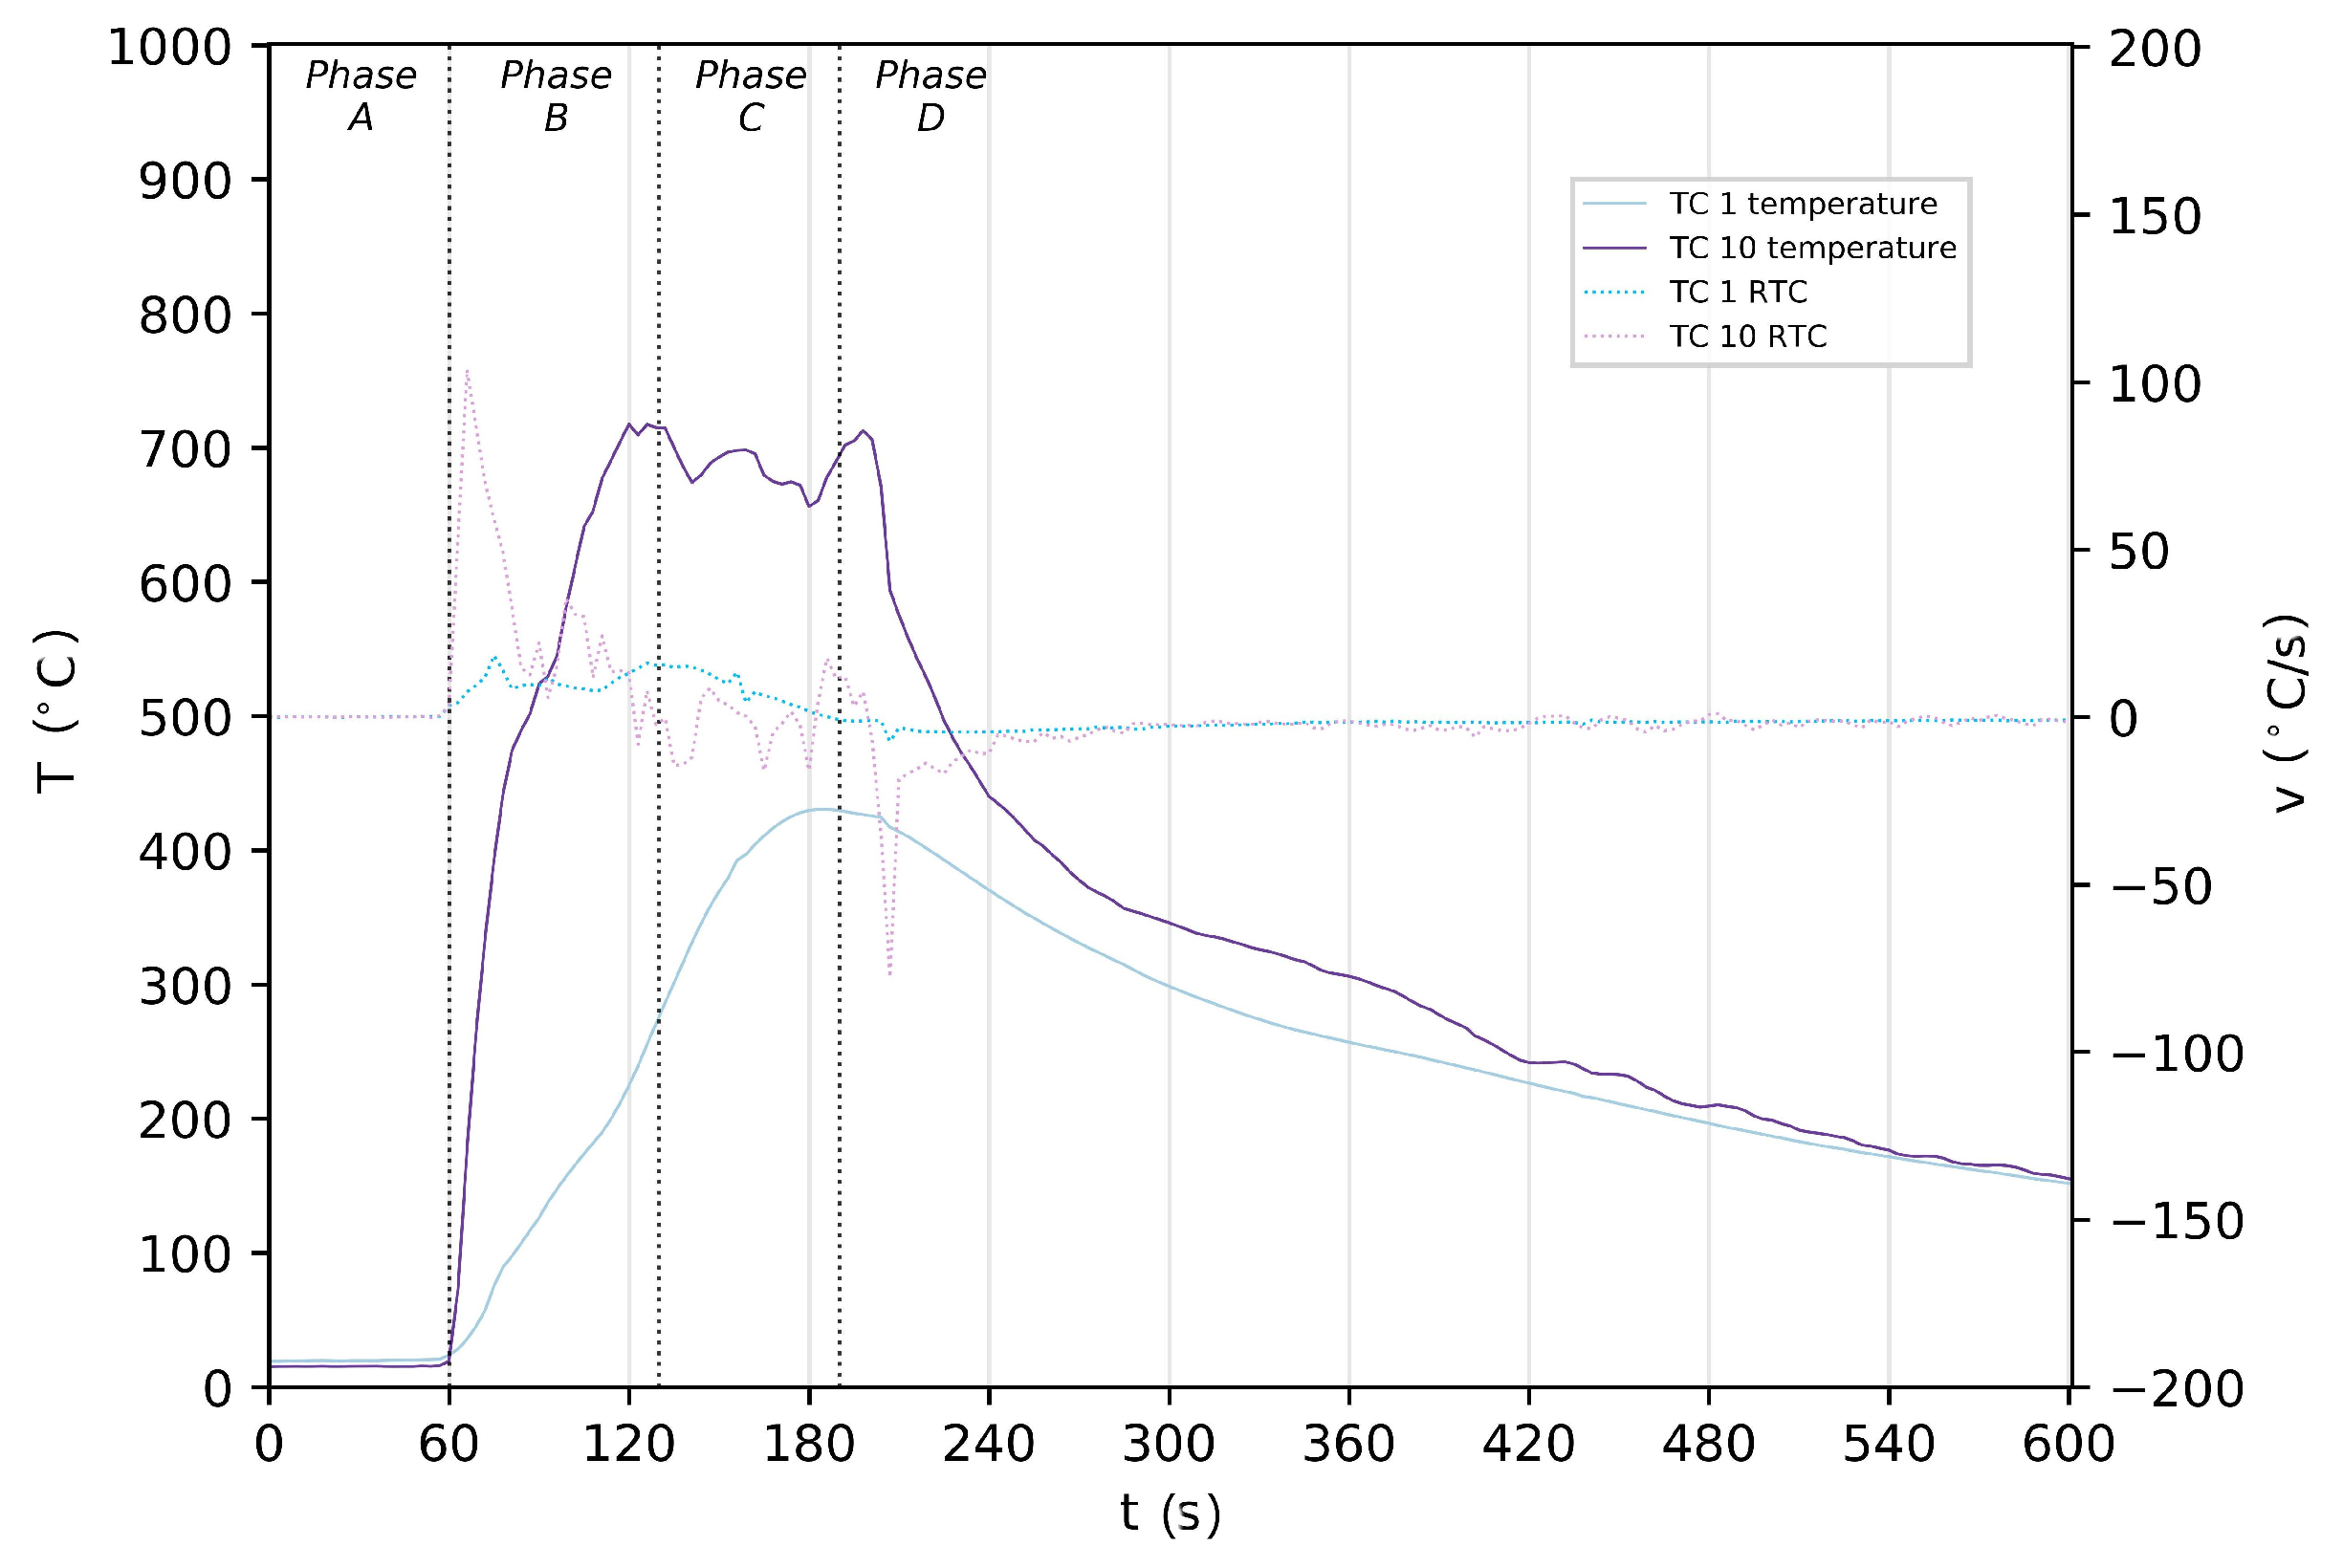
The temperature comparison between the top and bottom surfaces of the case is presented in Figure 4. The maximal temperature at the bottom surface of the RESS case (TC10) was 717.5 C (phase B) at 120 s of the test. Afterward, it fluctuated around 700 C until 198 s (at the beginning of phase D), after which it began to decrease. This showed that the bottom surface received a steady influx of heat and the temperature of the flame at this height was set around 700 C. The temperature peaked only at the end of phase B, which may imply the flame stabilized only then (i.e., at the end of the transitory period). Air velocity was maintained below 2.5 km/h; however, pool fire was observed to deviate from the centerline of the pan. The maximal temperature at the top surface (TC1) was only 430.5 C (phase C). The top surface was isolated from the direct influences of the pool fire and heat transfer. Since the temperature increase at TC1 was mainly caused by conduction through the steel case, the temperature rise was less steep, but more stable.
When the specimen was removed to its initial position at the start of phase D, the bottom surface of the battery started to dissipate the heat rapidly, as reflected in the sudden RTC drop. In comparison to TC10, the TC1 RTC was much more consistent for phases B to D. Due to the battery’s geometry, the measuring point of TC1 was hidden from the source flame and the temperature rise was assumed to be mainly caused by conductive heat transfer of the steel case.
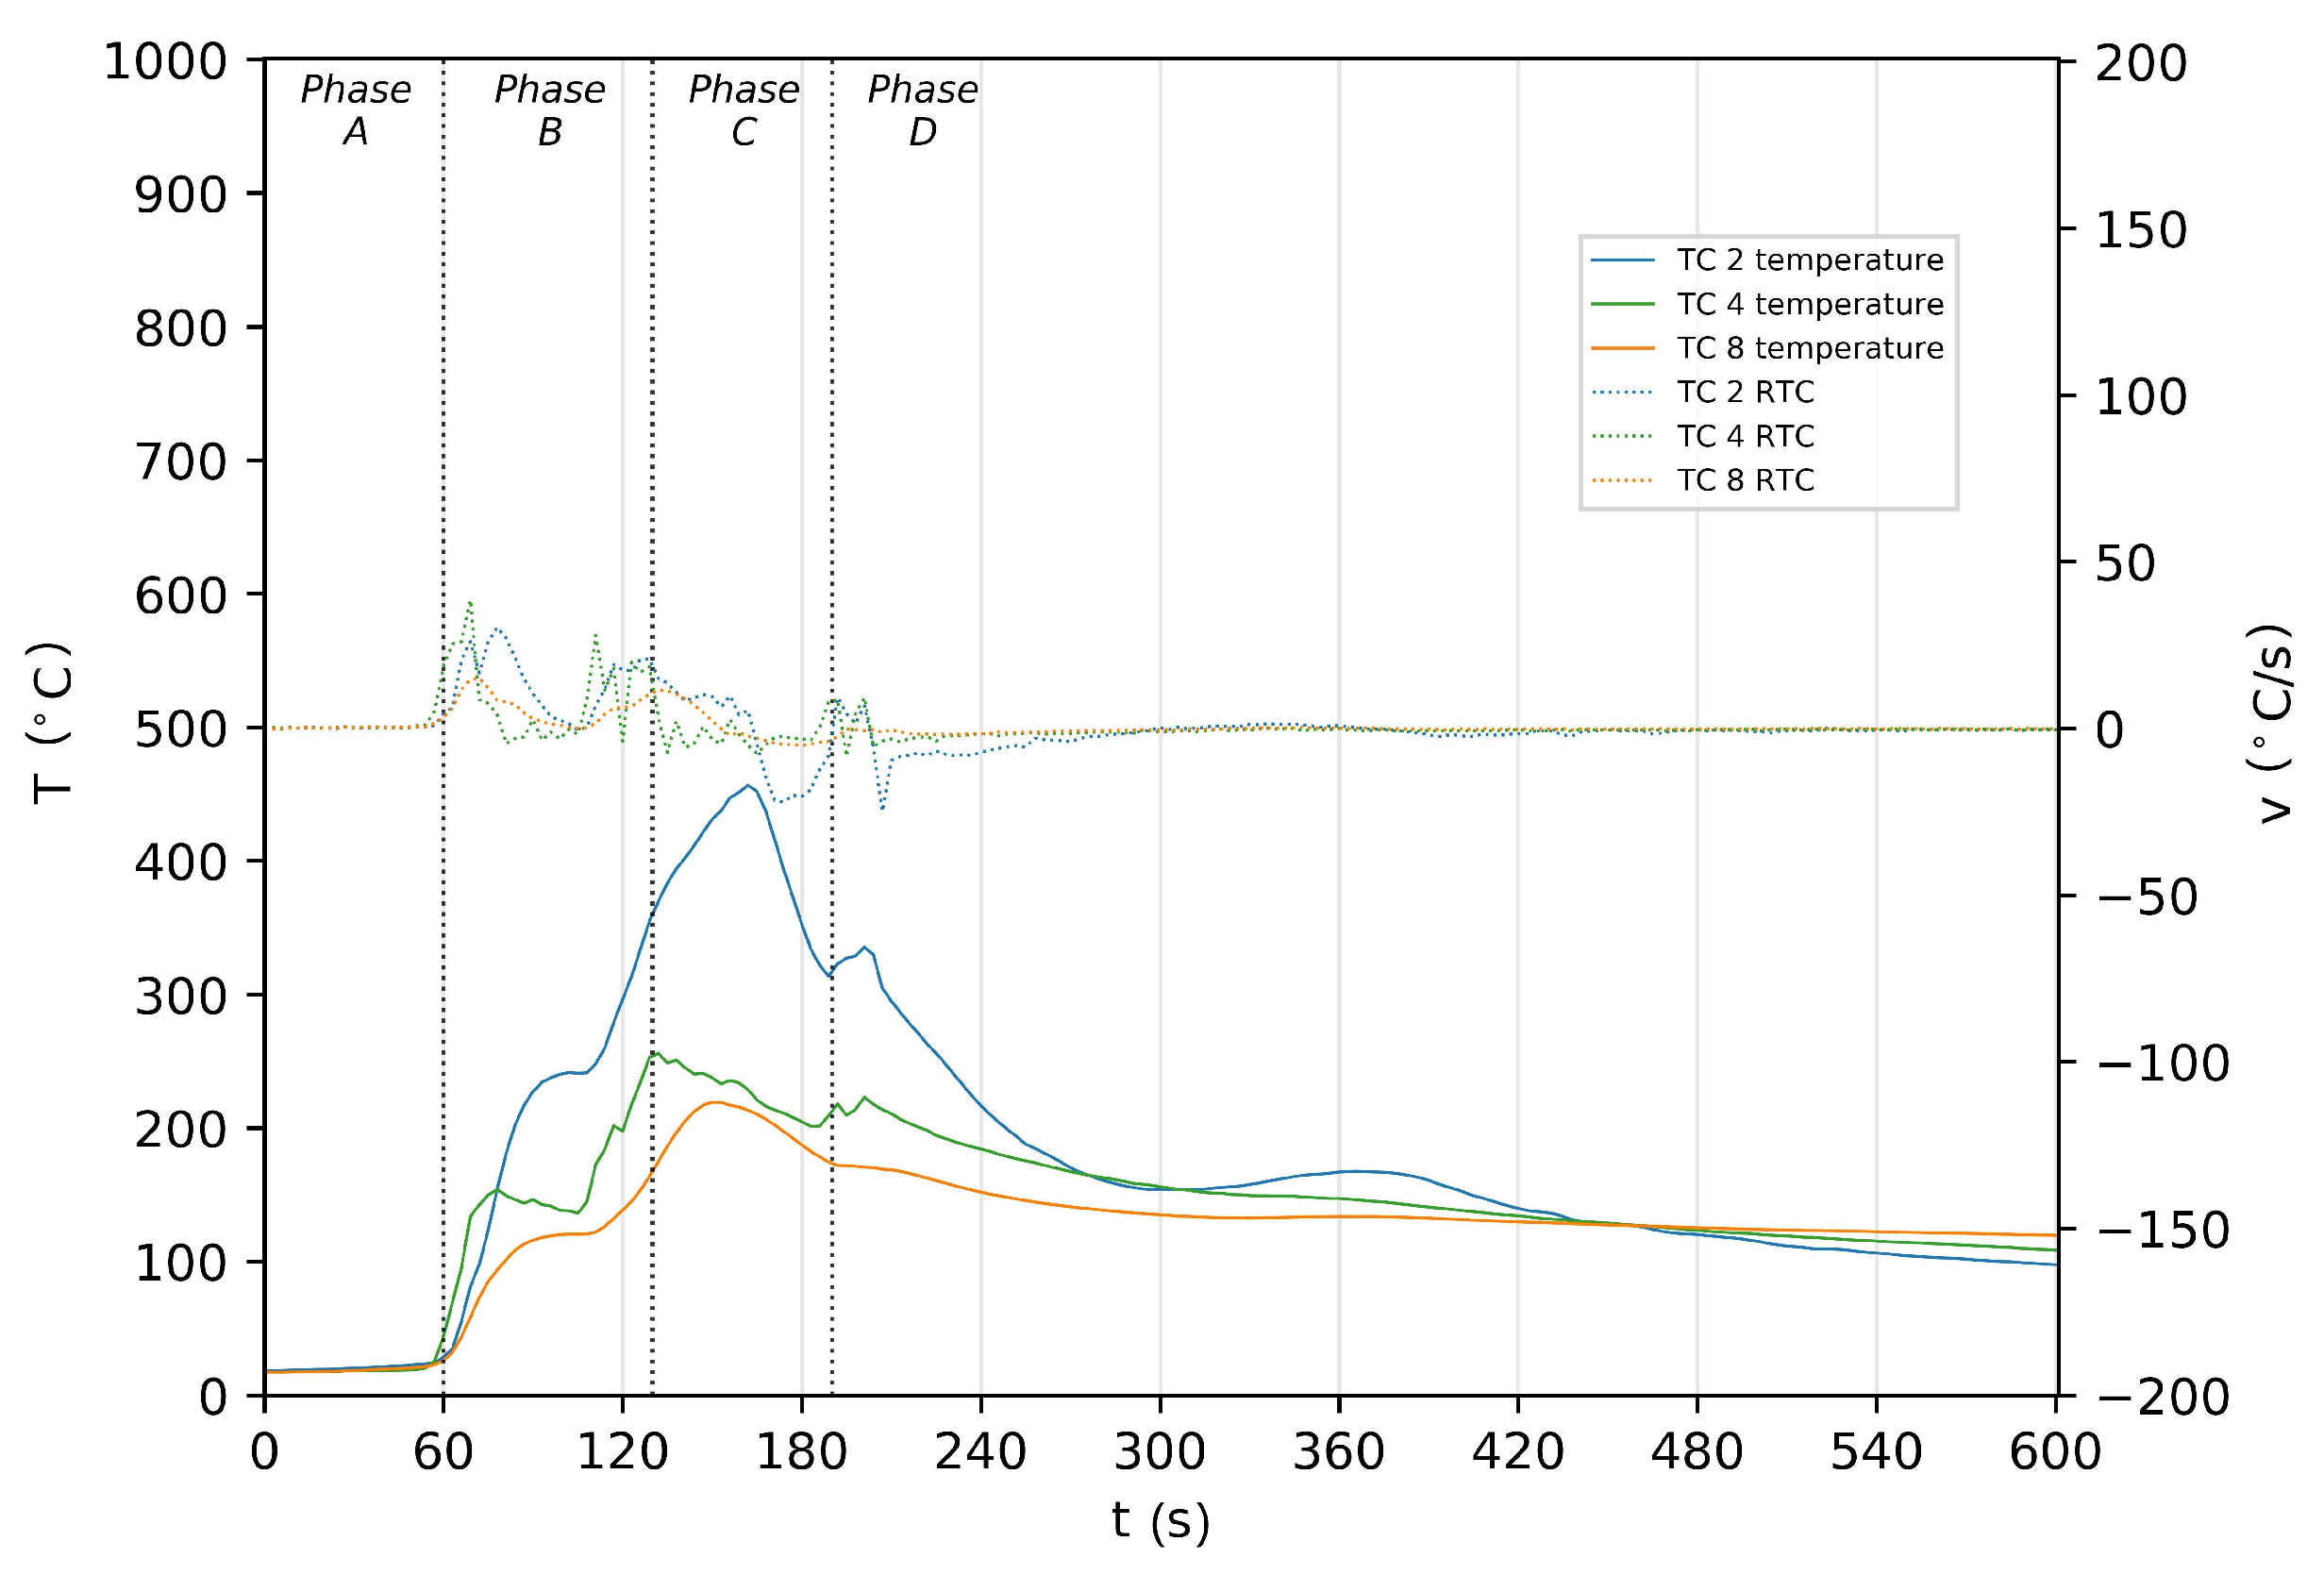
Figure 5 shows the temperature and RTC results on the plugs of the RESS subsystem. TC4 and TC8 were positioned in the nook of the battery; therefore, lower temperatures compared to the other points were expected at these particular locations. TC2 was placed on the plug, substantially closer to the edge; thus, it was more likely to record higher temperatures. However, the highest temperature was achieved in phase C, while fire source was reduced by the brick screen. This phenomenon may have been caused by difference in flame temperature distribution while changing from phase B to C [28]. As the height of the pool fire varies within above-mentioned phases, it influences fire temperature zones in the continuous flame region [29].
Additionally, parts of the electrical plugs ignited during the test, contributing to the inconsistency in the temperature curves and RTC changes. In Figure 5, a sudden rise at 108 s of the test, which corresponds with the flames curving around the nook (confirmed by the visual observations), can be observed. This confirms the highly stochastic nature of the pool fire even under controlled environmental conditions [30].
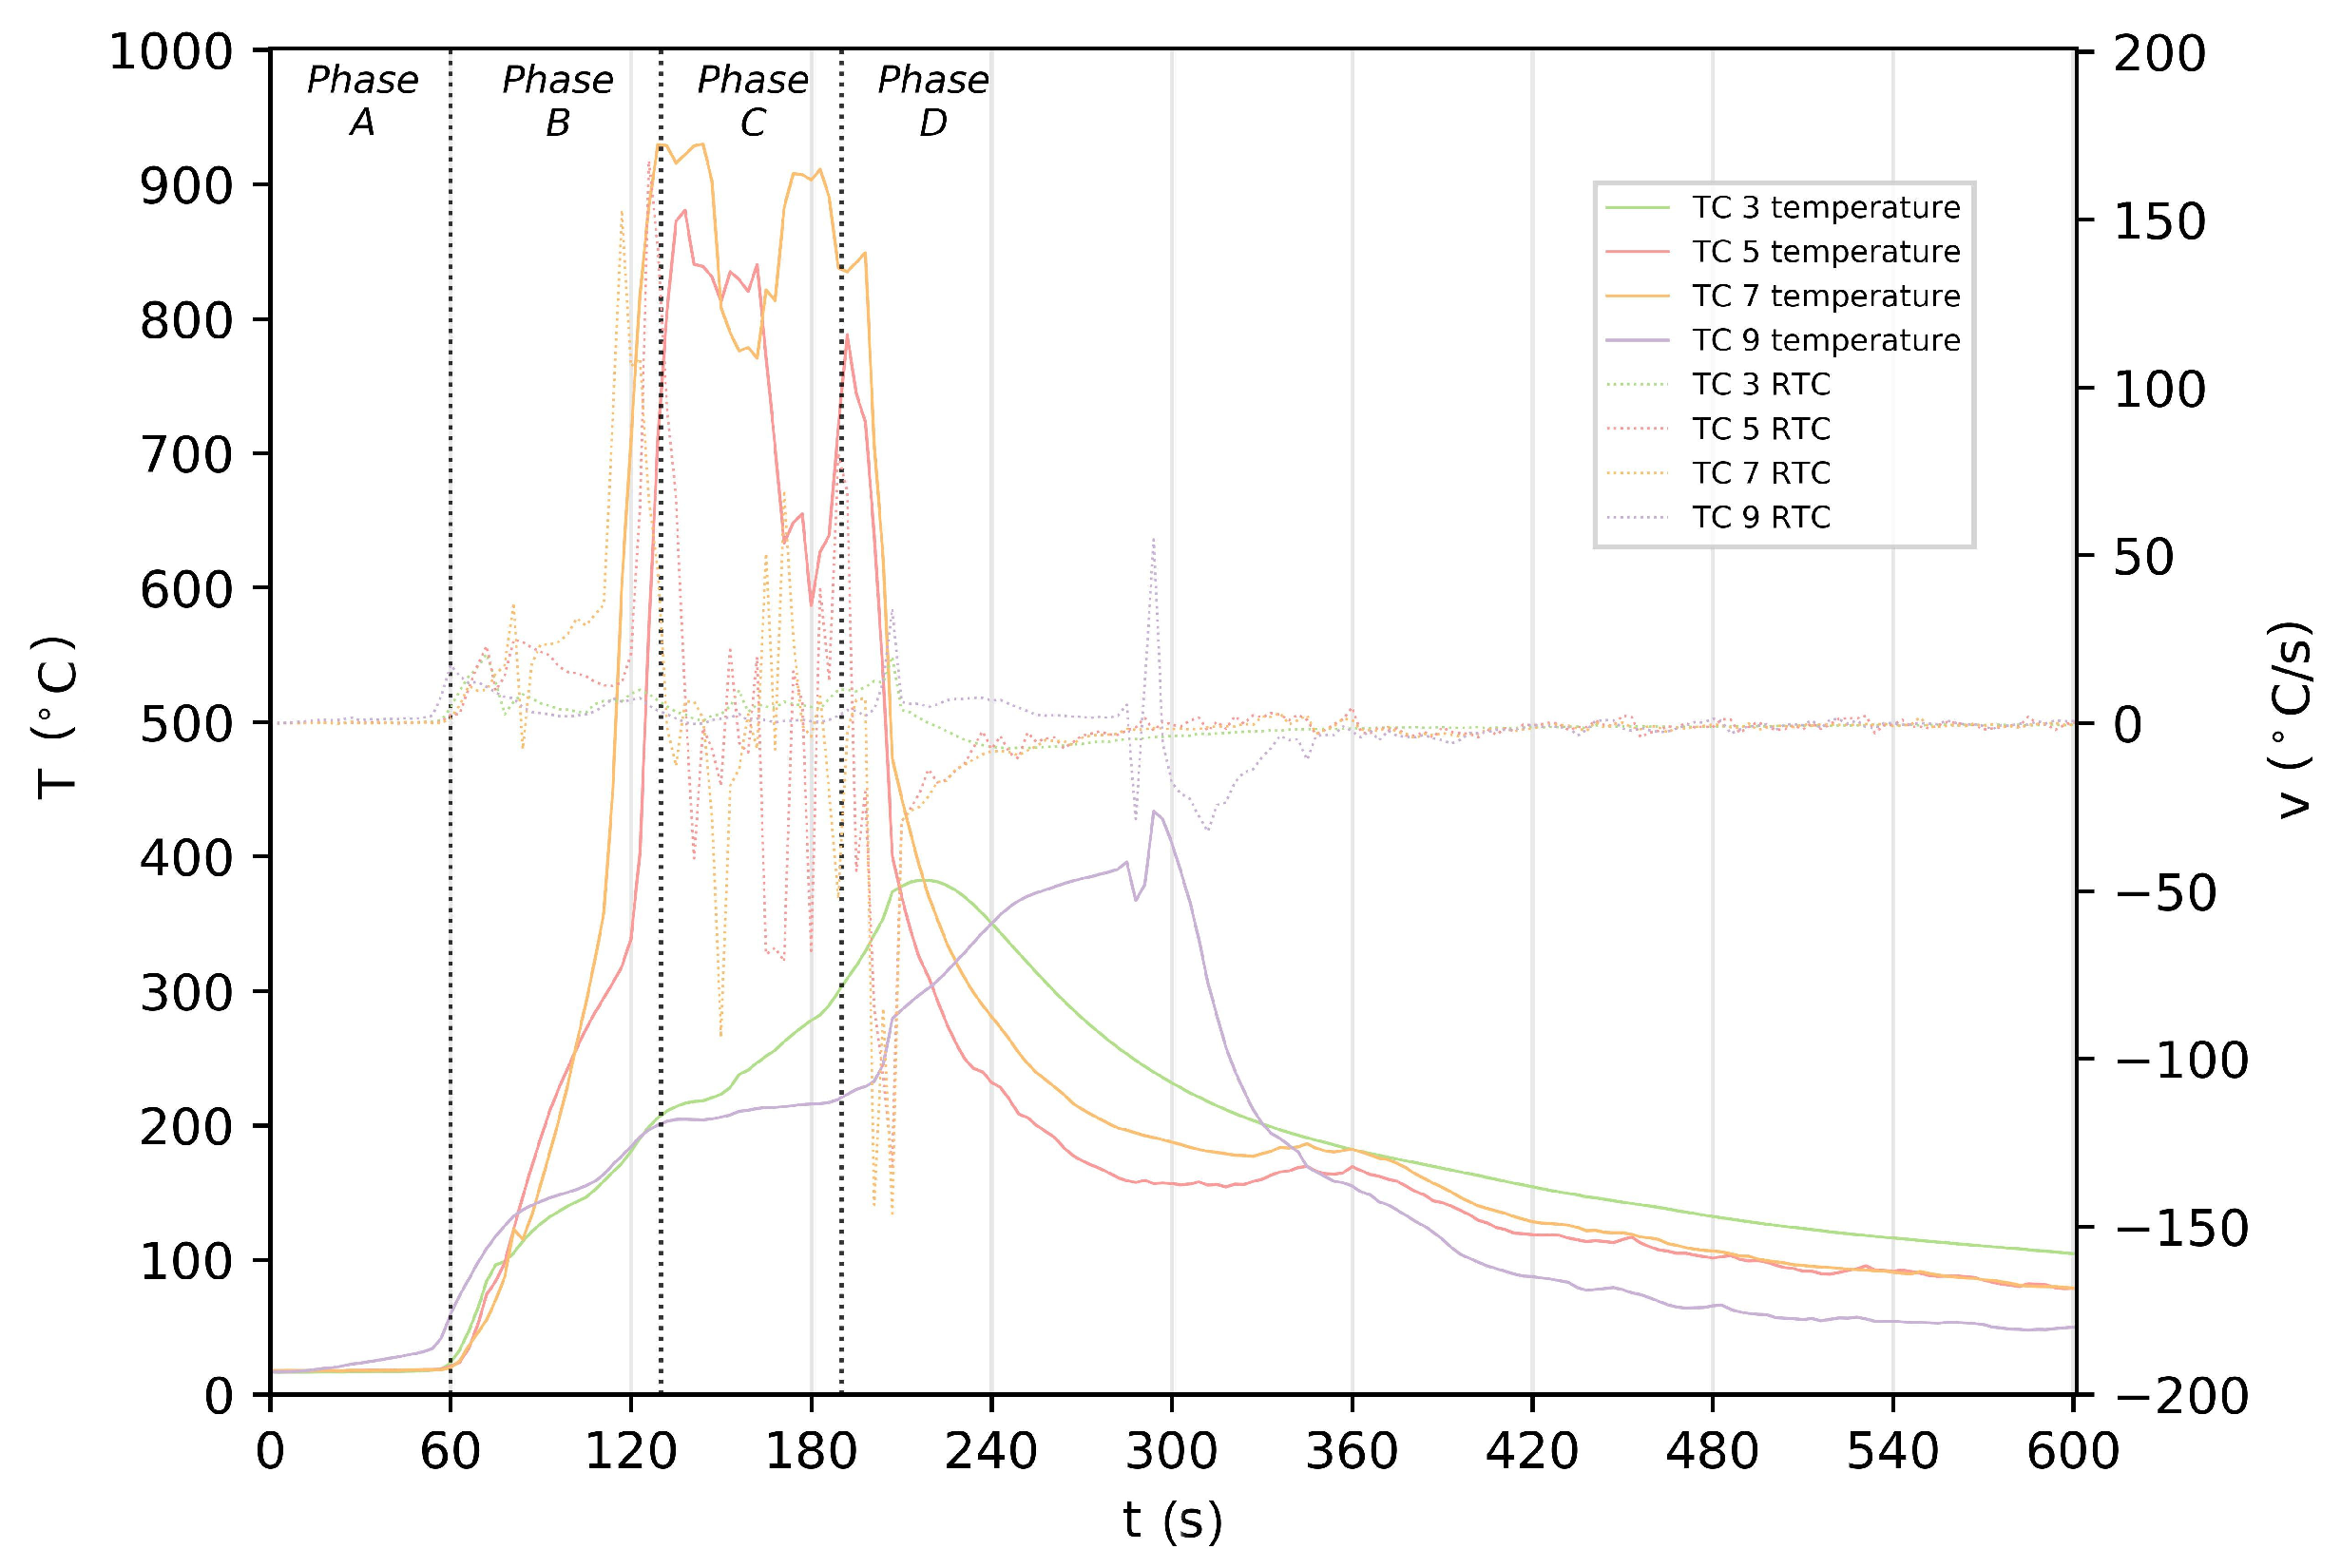
The temperature measurements and RTC from the sides of the battery are presented in Figure 6. Firstly, a large temperature difference distribution around the battery was observed. During phase C, the highest temperatures of 929.9 and 880.6 C were recorded at TC7 and TC5, respectively; at TC3 and TC9, the temperature remained at max. 299.3 C and 219.2 C, respectively. At TC3 and TC9, the highest temperatures were registered at the moment of reverting the test specimen to the initial position during phase D. This phenomenon may be attributed to the pool fire and its unpredictable behavior, as well as lack of a sufficiently sized fire source. The temperature readouts also indicated that the flame stabilized during phase C, similar to TC10.
We noticed that at TC5 and TC7, a substantial fluctuation in the rate of temperature change occurred, especially during phase C. Since temperatures reached over 800 C, the gypsum pad protecting the measuring tip detached and the thermocouples were directly subjected to the flame and its fluctuations. This event allowed us to evaluate the scale of temperature changes in the battery’s surroundings. In 162 s of the test, the flame stopped leaning toward the TC5 side, which can be noticed in the temperature curve, showing a rapid decline and local minimum value of 586.8 C at 180 s. Following this, there was a temperature rise to 788.1 C at the end of phase C, which is a difference of 201.4 C between the values within 18 s of the test, showing that a slight change in the pool fire free-burning conditions may substantially alter the testing temperature. In contrast, the TC3 and TC9 RTCs were characterized by notably less zig-zagged curve during phases B and C, since the flame was directed to other sides. However, at the beginning of phase D and just before 300 s of the test, two spikes occurred in TC9. By visual observation, they may be attributed to the sudden ignition of the case painting, which dissipated quickly after they were noted.
5. Theoretical Estimation of Temperature inside the RESS System
The temperature distribution inside the RESS system was determined theoretically. Calculations were performed using the temperature values determined experimentally during the test.
The following assumptions were used to allow interior temperature calculations:
- Heat transfer is one-dimensional.
- R values of lagging, i.e., battery case and insulation, are taken as constant, irrespective of the temperature.
- The dominant form of heat flux generated by the fire source is presumed to be convective.
- The battery case remains airtight for the duration of the test or losses generated by the air circulating outside the battery are negligible.
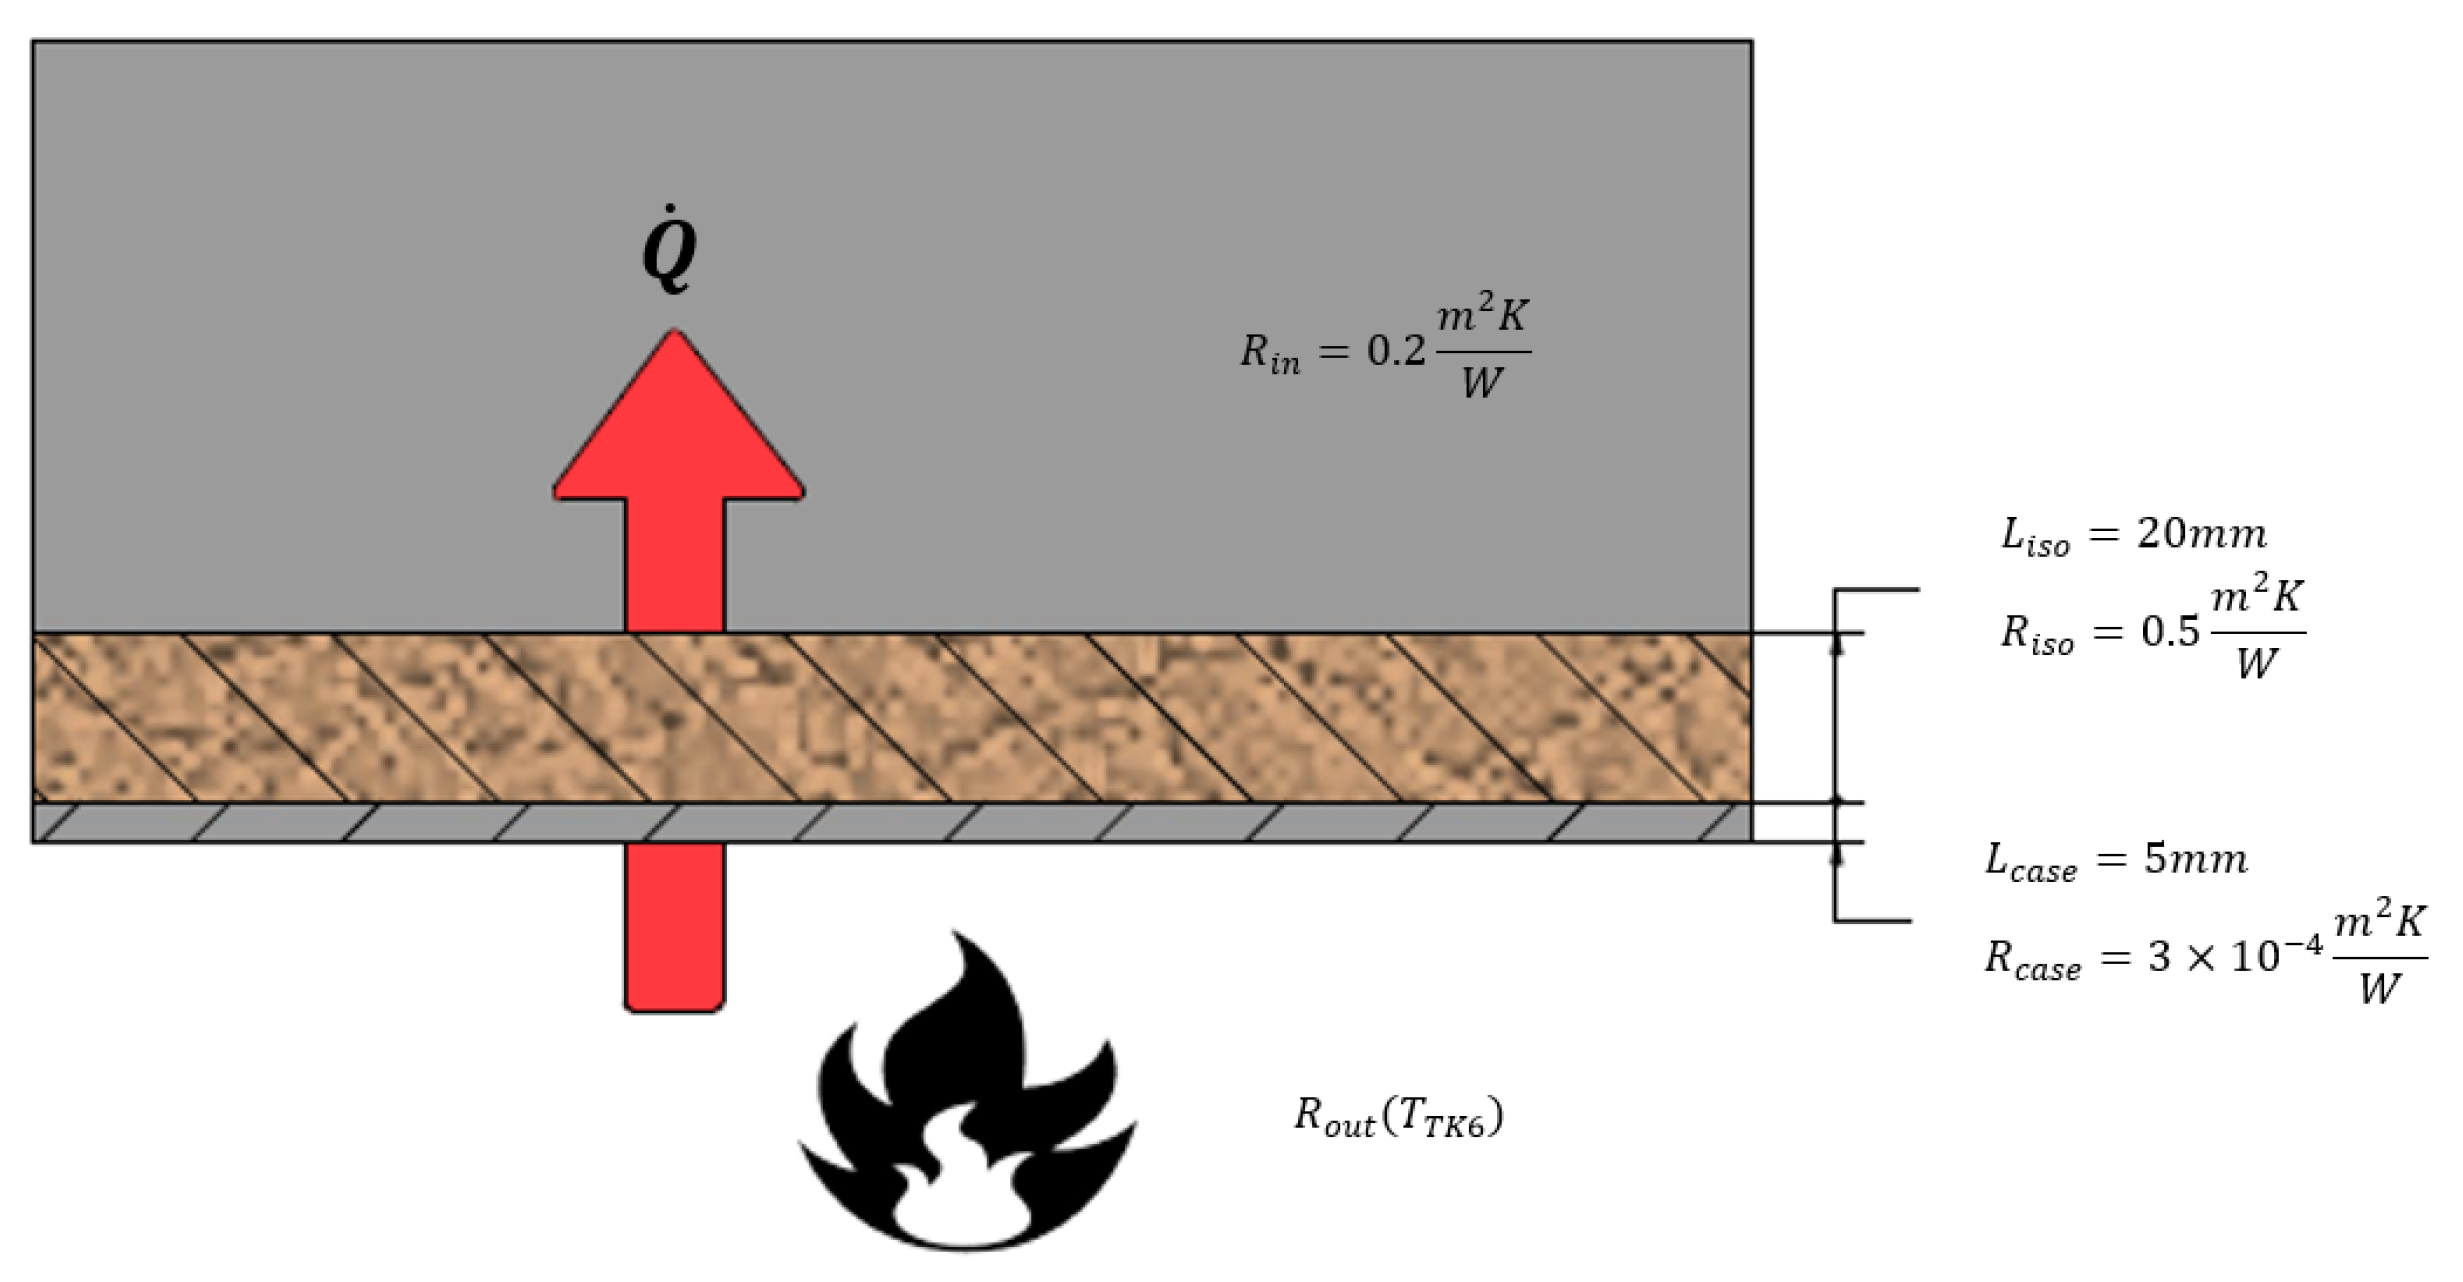
A simplified one-dimensional model, see Figure 7, of heat transfer inside the RESS was constructed to estimate the temperature of the battery’s interior and then to evaluate if the cells might have reached the critical point in comparison with known data during the fire test. For this purpose, one assumed that heat was transferred only by the bottom division and the battery was airtight with a specific amount of internal air. Heat flux was moderated with a 5 mm thick steel casing and 20 mm thick insulation material . In reality, the exact material used for the RESS lagging is a trade secret of the RESS manufacturer.
Pool burning heat generation consists of many variables and is dependent on the diameter of the pool. Generally, according to the conservation of energy of the liquid, fire source heat flux can be expressed as [31]:
where is radiant flux, is the heat absorbed by convective means, is the re-radiant heat loss as the surface of the pool is at high temperatures, and defines any other losses (i.e., conduction of the walls and stochastic terms). In this particular situation, one assumed that the dominant heat transfer was convective.
As mentioned above, flux is estimated to be largely dependent on the convective heat transferred by the pool fire. Convective heat flux was determined using the following equation [32]:
where A is area of the bottom surface, is the internal temperature, and R is total thermal insulance.
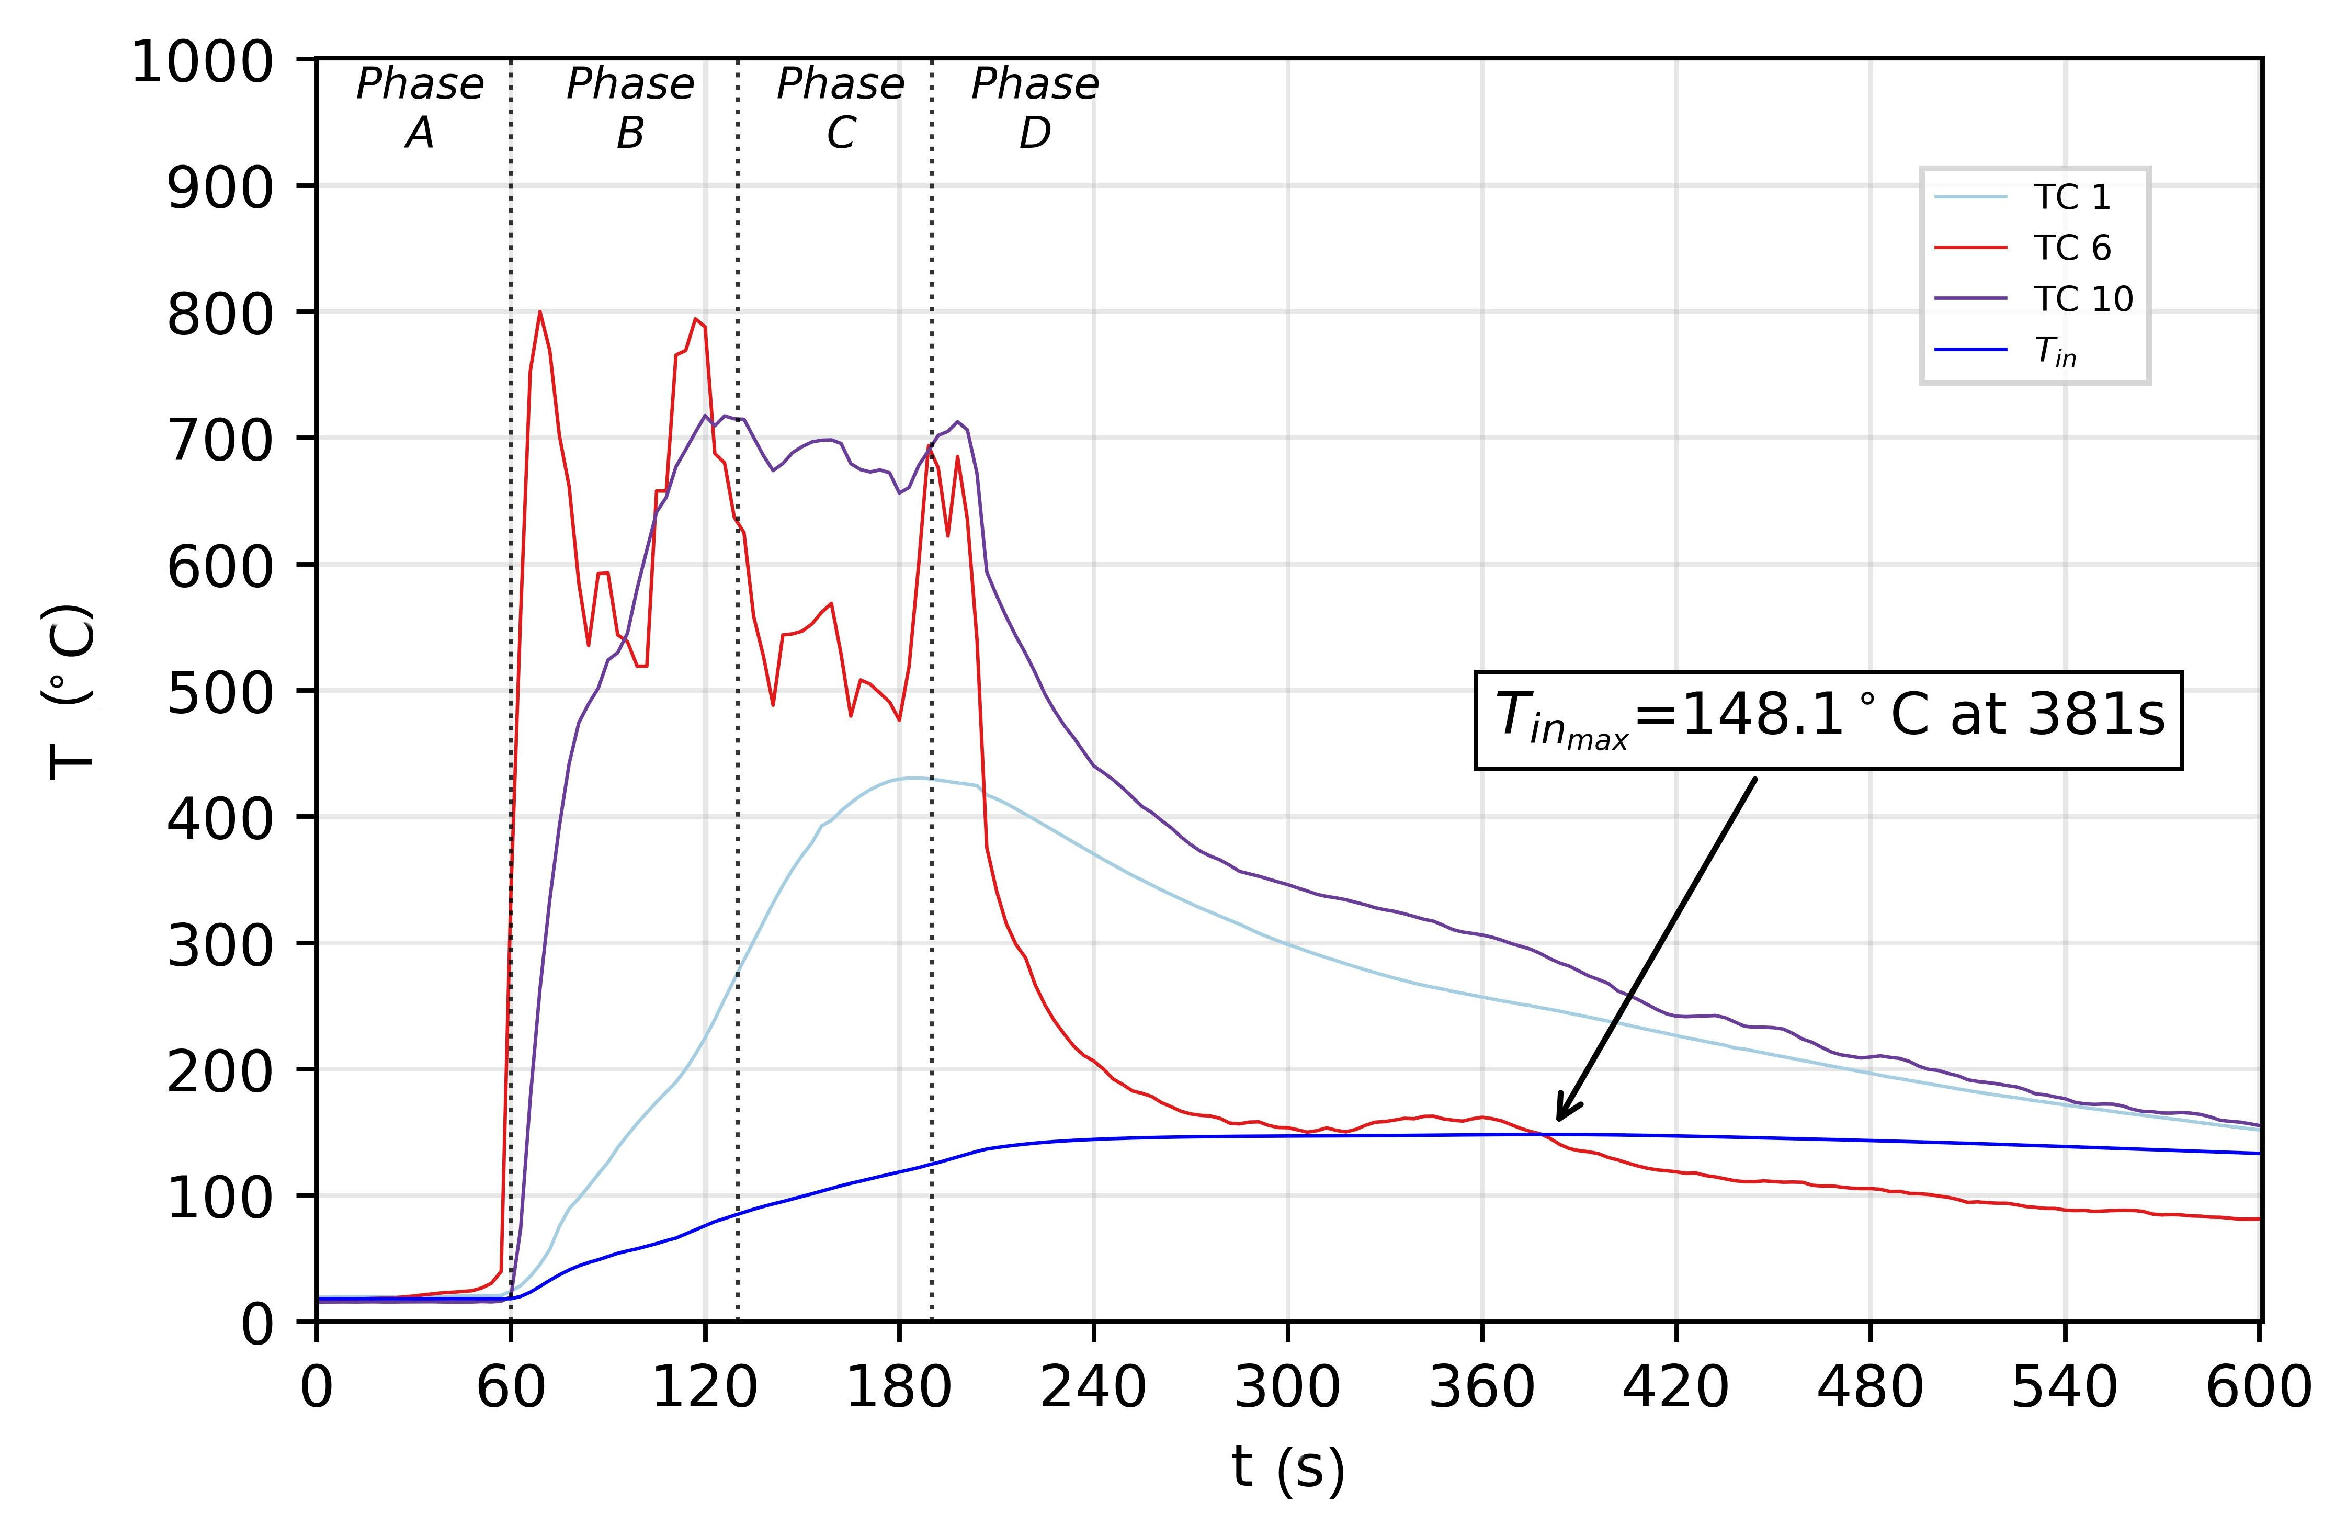
where r is the thermal insulance of each division. Thermal insulance varies depending on the temperature of the medium; yet in this approximation, the R value of the case, insulation, and air inside (denoted as , , and , respectively) is taken as a constant value, since the error will not exceed 5%. The variables here were the convective heat coefficient of air outside and its thermal insulance, which were contingent upon the test temperature data of TC6 and TC10. At the beginning of phase B, the temperature inside the battery () was equal to ambient (18 C) and it served as a starting point for iteration. Therefore, the momentary energy transferred to the inside of the battery and then the temperature increase due to such energy could be calculated as follows:
where m is the mass of air inside the battery and is the specific heat at atmospheric pressure as a function of TC6 temperature. The calculation results are presented in Figure 8. The internal temperature was estimated to rise up to 148.1 C at 381 s. This indicates that even with flame source removed, the temperature is likely to rise for some additional time. Crucial to battery failure is the breaching critical point, where the thermal runaway of the battery starts. The above results show that the reaction is more probable to happen past the flame exposure phases, where the temperatures of each insulating division, the surroundings, and the interior of the battery begin to level. Notably, thermal runaway processes start at 69 C with breakdown of the SEI layer and with self-sustained exothermic reactions starting at 90 C, with the eventual melting of the separator between 135 and 160 C, which causes an internal short circuit and rapid thermal runaway [3]. This suggests that cell temperature was lower than the calculated 148.1 C and the separator did not fail during the test; therefore, there were no signs of self-ignition or flaming from the battery, nor rupture was found on its case.
The limitations of the presented model are listed below:
- Due to the upward heat transfer direction, the above-mentioned calculations are valid only for the testing set-up in this paper, i.e., fire source below the battery.
- The fire source dimensions may not substantially exceed the battery’s horizontal projection, as the heat transfer on the sides of the battery is also expected to have a significantly higher impact on the interior temperature (the maximum range is 500 mm in each direction).
- With increasing size of the pool fire, the contribution of the radiant flux is expected to rise; therefore, the total heat flux should be either a sum of convective or radiant flux. The latter, however, is dependent on many variables due to the changing emissivity coefficient of the surface of the battery, which is attributable to random phenomena such as burning of the paint and sooting of the flame.
- The model assumes a two-layer passive heat insulation system, which is comparable to an actual system. In reality, the battery interior has a much more complex design and any use of additional lagging or cooling systems may vary the results.
6. Conclusions
One evaluated the R100.02 fire testing safety procedure in terms of reliability and accuracy in everyday use. The temperature distribution on the battery was measured and studied. The key issues with the uncertainties in the R100.02 procedure are related to the wind’s influence on fire behavior, unsteady burning rate, and relatively small fire source compared to the specimen. Based on the foregoing results, the following conclusions were drawn:
- Temperature data obtained during the fire resistance test of a RESS showed that even with the precautions required by the reference document, the flame source is highly stochastic in nature. The pool fire produced vastly diversified temperature around the casing, which was influenced by different factors such as the size of the fire pool, wind speed, and the length of the testing phases.
- The variance in the temperature distribution showed that a steady burning rate may have not been reached by the end of the exposure. Lack of this state may have adverse impacts on the reliability of the procedure and therefore on failure prevention detection, which this procedure should provide.
- The current restrictions and rules in the R100.02 fire testing procedure may be considered as insufficient to provide reliable conditions for a homologous testing procedure. The procedure should be revised in terms of the method of exposure.
- The approximation of the temperature inside the battery showed that the SEI layer of cells might have started decomposing [3]; however, it was not enough to start the breakdown of any of the cells’ separators or internal short circuit followed by thermal runaway.
- Thermal runaway of the battery is more likely to occur after fire exposure, when the temperatures begin to equalize inside and around the battery.
It is important to remember that the R100.02 fire resistance testing procedure determines whether the product is allowed for commercial use; therefore, it is of utmost importance for the procedure to provide reliable results when conducted correctly.
Author Contributions
Conceptualization, D.D. and M.M.; methodology, D.D. and M.M.; software, D.D. and M.M.; validation, D.D. and M.M.; formal analysis, D.D. and M.M.; investigation, D.D. and M.M.; resources, D.D. and M.M.; data curation, D.D. and M.M.; writing—original draft preparation, D.D. and M.M.; writing—review and editing, D.D. and M.M.; visualization, D.D. and M.M.; supervision, D.D. and M.M.; project administration, D.D. and M.M.; funding acquisition, D.D. and M.M. All authors have read and agreed to the published version of the manuscript.
Funding
This research received no external funding.
Institutional Review Board Statement
Not applicable.
Informed Consent Statement
Not applicable.
Data Availability Statement
Not applicable.
Acknowledgments
The test stand and the equipment used in the described test were designed and constructed in a project entitled “Testing Standard Implementation of Electrical Energy Storage Systems to Extend Scope of Accreditation” of CTO Own Research Fund (“Fundusz Badań Własnych”) in 2018. Additionally, this paper is dedicated to Helena Modrzejewska for her tremendous support toward publication.
Conflicts of Interest
The authors declare no conflict of interest.
Abbreviations
The following abbreviations are used in this manuscript:
| Standard deviation of the temperature in a given phase | |
| Standard deviation of the RTC in a given phase | |
| A | Area of the bottom surface of the casing |
| Specific heat at atmospheric pressure | |
| Conductive heat transfer coefficient | |
| k | Thermal conductivity |
| Thickness of steel casing of the battery | |
| Thickness of insulation material of the battery | |
| m | Mass of the air inside |
| Nusselt number | |
| Net heat flux | |
| Convective part of heat flux of the fire source | |
| Radiative part of heat flux of the fire source | |
| Heat flux of the fire source | |
| Convective flux | |
| Miscellaneous heat loss | |
| Radiant flux | |
| Re-radiant heat loss | |
| R | Sum of thermal insulances |
| Thermal insulance of the steel casing of the battery | |
| Thermal insulance of the air inside the battery | |
| Thermal insulance of the insulation material of the battery | |
| Thermal insulance of the air outside the battery | |
| Rayleigh number | |
| t | Time |
| Average temperature in a given phase | |
| Temperature of internal air | |
| Temperature of the surface | |
| Temperature of the denoted thermocouple | |
| Temperature of the denoted thermocouple in a given phase | |
| Temperature of the surroundings | |
| Rate of temperature change of the denoted thermocouple | |
| Rate of temperature change of the denoted thermocouple at a given phase | |
| Coordinates |
References
- Ouyang, D.; Weng, J.; Hu, J.; Chen, M.; Huang, Q.; Wang, J. Experimental investigation of thermal failure propagation in typical lithium-ion battery modules. Thermochim. Acta 2019, 676, 205–213. [Google Scholar] [CrossRef]
- Sun, P.; Bisschop, R.; Niu, H.; Huang, X. A review of battery fires in electric vehicles. Fire Technol. 2020, 1–50. [Google Scholar] [CrossRef]
- Wang, Q.; Mao, B.; Stoliarov, S.I.; Sun, J. A review of lithium ion battery failure mechanisms and fire prevention strategies. Prog. Energy Combust. Sci. 2019, 73, 95–131. [Google Scholar] [CrossRef]
- Doughty, D.H.; Roth, E.P. A general discussion of Li ion battery safety. Electrochem. Soc. Interface 2012, 21, 37–44. [Google Scholar]
- Pfrang, A.; Kriston, A.; Ruiz, V.; Lebedeva, N.; Di Persio, F. Safety of Rechargeable Energy Storage Systems with a focus on Li-ion Technology. In Emerging Nanotechnologies in Rechargeable Energy Storage Systems; Elsevier: Amsterdam, The Netherlands, 2017; pp. 253–290. [Google Scholar]
- Ribière, P.; Grugeon, S.; Morcrette, M.; Boyanov, S.; Laruelle, S.; Marlair, G. Investigation on the fire-induced hazards of Li-ion battery cells by fire calorimetry. Energy Environ. Sci. 2012, 5, 5271–5280. [Google Scholar] [CrossRef]
- IATA. Transport of Lithium Metal and Lithium Ion Batteries. Lithium Battery Guidance Document; IATA: Montreal, QC, Canada, 2019. [Google Scholar]
- Willstrand, O. Att Hantera Brandrisker Med Li-Jonbatterier i Fordon; RISE Research Institutes of Sweden AB: Gothenburg, Sweden, 2019. [Google Scholar]
- Williard, N.; He, W.; Hendricks, C.; Pecht, M. Lessons learned from the 787 dreamliner issue on lithium-ion battery reliability. Energies 2013, 6, 4682–4695. [Google Scholar] [CrossRef] [Green Version]
- Nordmann, H.; Frisch, M.; Sauer, D.U. Thermal Fault-Detection method and analysis of peripheral systems for large battery packs. Measurement 2018, 114, 484–491. [Google Scholar] [CrossRef]
- Larsson, F.; Andersson, P.; Blomqvist, P.; Lorén, A.; Mellander, B.E. Characteristics of lithium-ion batteries during fire tests. J. Power Sources 2014, 271, 414–420. [Google Scholar] [CrossRef]
- Feng, X.; Sun, J.; Ouyang, M.; He, X.; Lu, L.; Han, X.; Fang, M.; Peng, H. Characterization of large format lithium ion battery exposed to extremely high temperature. J. Power Sources 2014, 272, 457–467. [Google Scholar] [CrossRef]
- Ping, P.; Wang, Q.; Huang, P.; Sun, J.; Chen, C. Thermal behaviour analysis of lithium-ion battery at elevated temperature using deconvolution method. Appl. Energy 2014, 129, 261–273. [Google Scholar] [CrossRef]
- United Nations Economic Commission for Europe. Regulation No 100 of the Economic Commission for Europe of the United Nations (UNECE)—Uniform provisions Concerning the Approval of Vehicles with Regard to Specific Requirements for the Electric Power Train; ECE: Geneva, Switzerland, 2010; p. 85. [Google Scholar]
- United Nations Economic Commission for Europe. Regulation (EU) 2018/858 of the European Parliament and of the Council of 30 May 2018; ECE: Geneva, Switzerland, 2018; Available online: https://eur-lex.europa.eu/eli/reg/2018/858/oj (accessed on 10 May 2021).
- Sudheer, S.; Prabhu, S. Heat transfer in vertical casks engulfed in open pool fires. J. Fire Sci. 2013, 31, 541–562. [Google Scholar] [CrossRef]
- Sudheer, S.; Prabhu, S. Partitioning of Convective and Radiative Heat Fluxes Absorbed by a Lumped Body Engulfed in a Diffusion Flame. Fire Technol. 2015, 51, 801–822. [Google Scholar] [CrossRef]
- Polish Committee for Standardization. Fire Resistance Tests for Non-Loadbearing Elements—Part 1: Walls; Polish Committee for Standardization: Warsaw, Poland, 2018.
- Polish Committee for Standardization. Fire Resistance Tests—Part 1: General Requirements; Polish Committee for Standardization: Warsaw, Poland, 2018.
- Wickström, U.; Amanda, R.; Baker, G. The Use of Adiabatic Surface Temperature to Design Structures For Fire Exposure. J. Struct. Fire Eng. 2011, 2, 21–28. [Google Scholar] [CrossRef]
- Ohja, M.; Dhiman, A.; Guha, K. Simulation of thermally protected cylindrical container engulfed in fire. J. Loss Prev. Process. Ind. 2012, 25, 391–399. [Google Scholar]
- Sudheer, S.; Wehrstedt, K.; Prabhu, S. Heat transfer to bodies engulfed in di-tert-butyl peroxide pool fires –Numerical simulations. Loss Prev. 2016, 44, 204–211. [Google Scholar]
- Chartis, J.; Quintela, J.; Folch, J.; Planas, E.; Arnaldos, J.; Casal, J. Experimental study of burning rate in hydrocarbon pool fires. Combust. Flame 2001, 126, 1373–1383. [Google Scholar]
- Chen, L.; Tang, F.; Pang, H. Ceiling heat flux and downward received radiation heat flux induced by weak and relative strong fire plume in ventilation tunnels. Appl. Therm. Eng. 2020, 169, 1359–4311. [Google Scholar] [CrossRef]
- Bird, R.; Steward, W.; Lightfoot, E. Transport Phenomena; John Wiley & Sons: New York, NY, USA, 2006. [Google Scholar]
- Babrauskas, V. Estimating large pool fire burning rates. Fire Technol. 1983, 19, 251–261. [Google Scholar] [CrossRef]
- Koseki, H. Combustion properties of large liquid pool fires. Fire Technol. 1989, 25, 241–255. [Google Scholar] [CrossRef]
- Simmons, R. Premixed Burning. In SFPE Handbook of Fire Protection Engineering; DiNenno, P., Drysdale, D., Eds.; NFPA: Quincy, MA, USA, 2002; pp. 1-144–1-154. [Google Scholar]
- Karlsson, B.; Quintiere, J. Enclosure Fire Dynamics; CRC Press: Boca Raton, FL, USA, 1994. [Google Scholar]
- Jung, H.; Kim, K.; Lee, K.; Kwon, H. A Study on Fire Resistance Test Procedure for Traction Battery. In Proceedings of the 23rd International Technical Conference on the Enhanced Safety Vehicles, Seoul, Korea, 27–30 May 2013. [Google Scholar]
- Heskestad, G. Fire Plumes, Flame Height and Air Entrainment. In SFPE Handbook of Fire Protection Engineering; DiNenno, P., Beyler, C., Eds.; NFPA: Quincy, MA, USA, 2002; pp. 2-1–2-17. [Google Scholar]
- Atreya, A. Convection Heat Transfer. In SFPE Handbook of Fire Protection Engineering; DiNenno, P., Drysdale, D., Eds.; NFPA: Quincy, MA, USA, 2002; pp. 1-44–1-72. [Google Scholar]
Figure 1.
Testing setup and testing procedure.

Figure 2.
Thermocouple positioning scheme. (Top view of the tested element—left); (Side view of the tested element—right).
Figure 2.
Thermocouple positioning scheme. (Top view of the tested element—left); (Side view of the tested element—right).
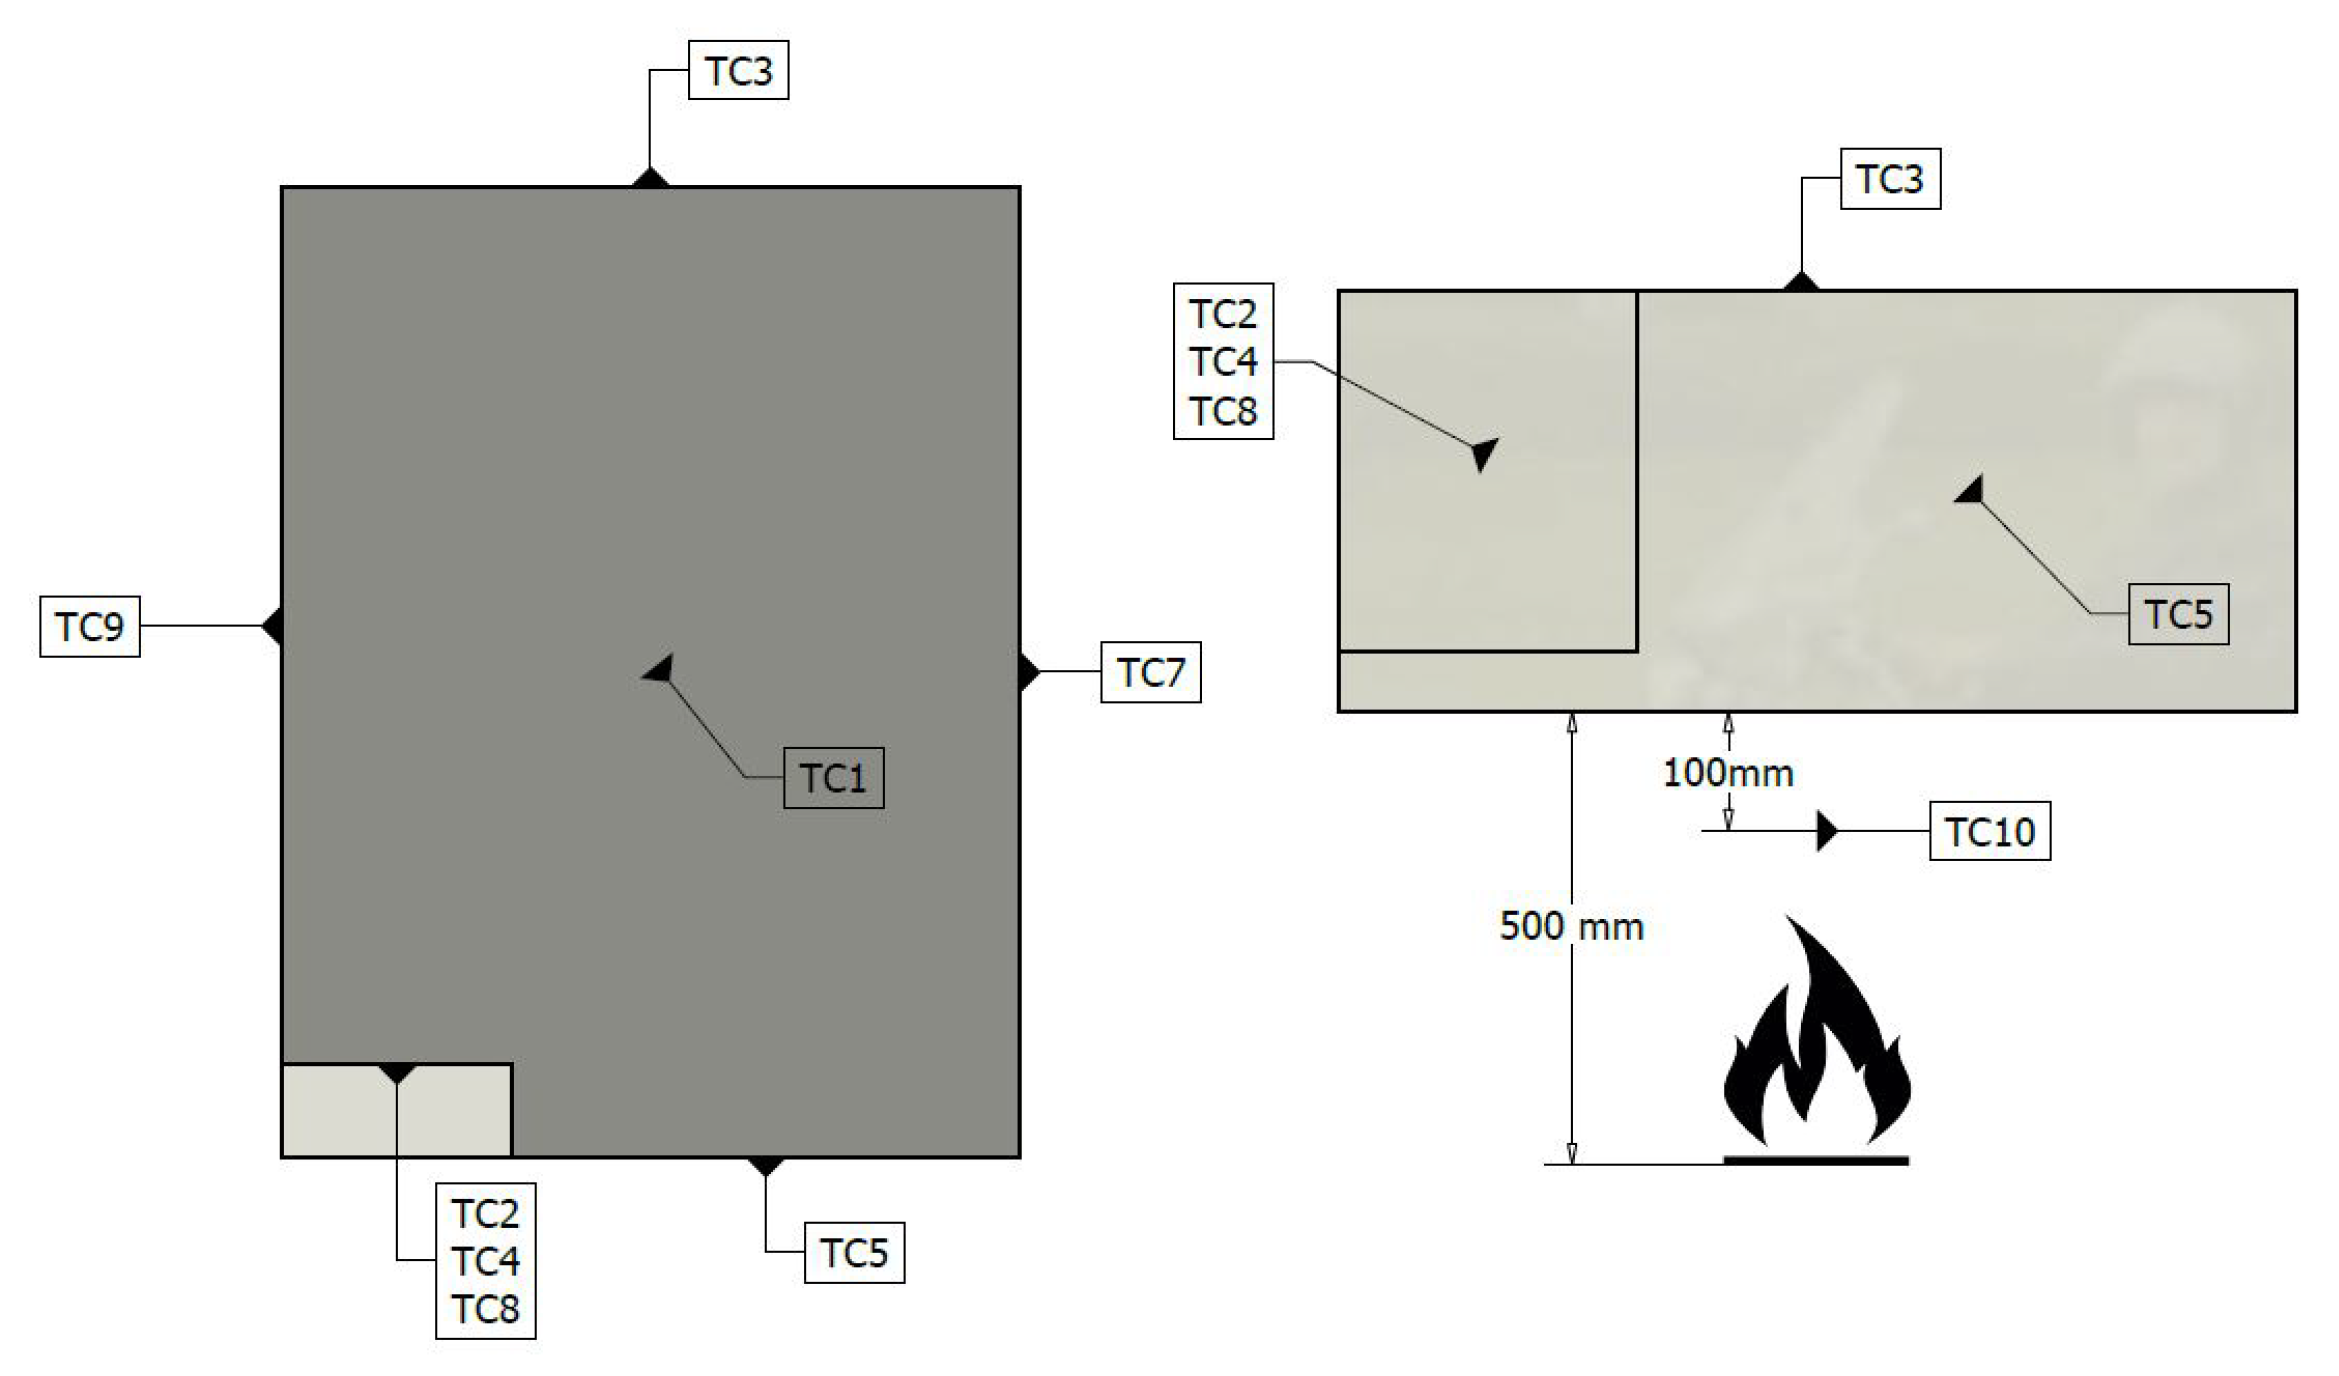
Figure 3.
Temperature of thermocouples TC1–TC10 during the first 600 s of the test. Phases A, B, C, and D according to Table 2 and Figure 1.
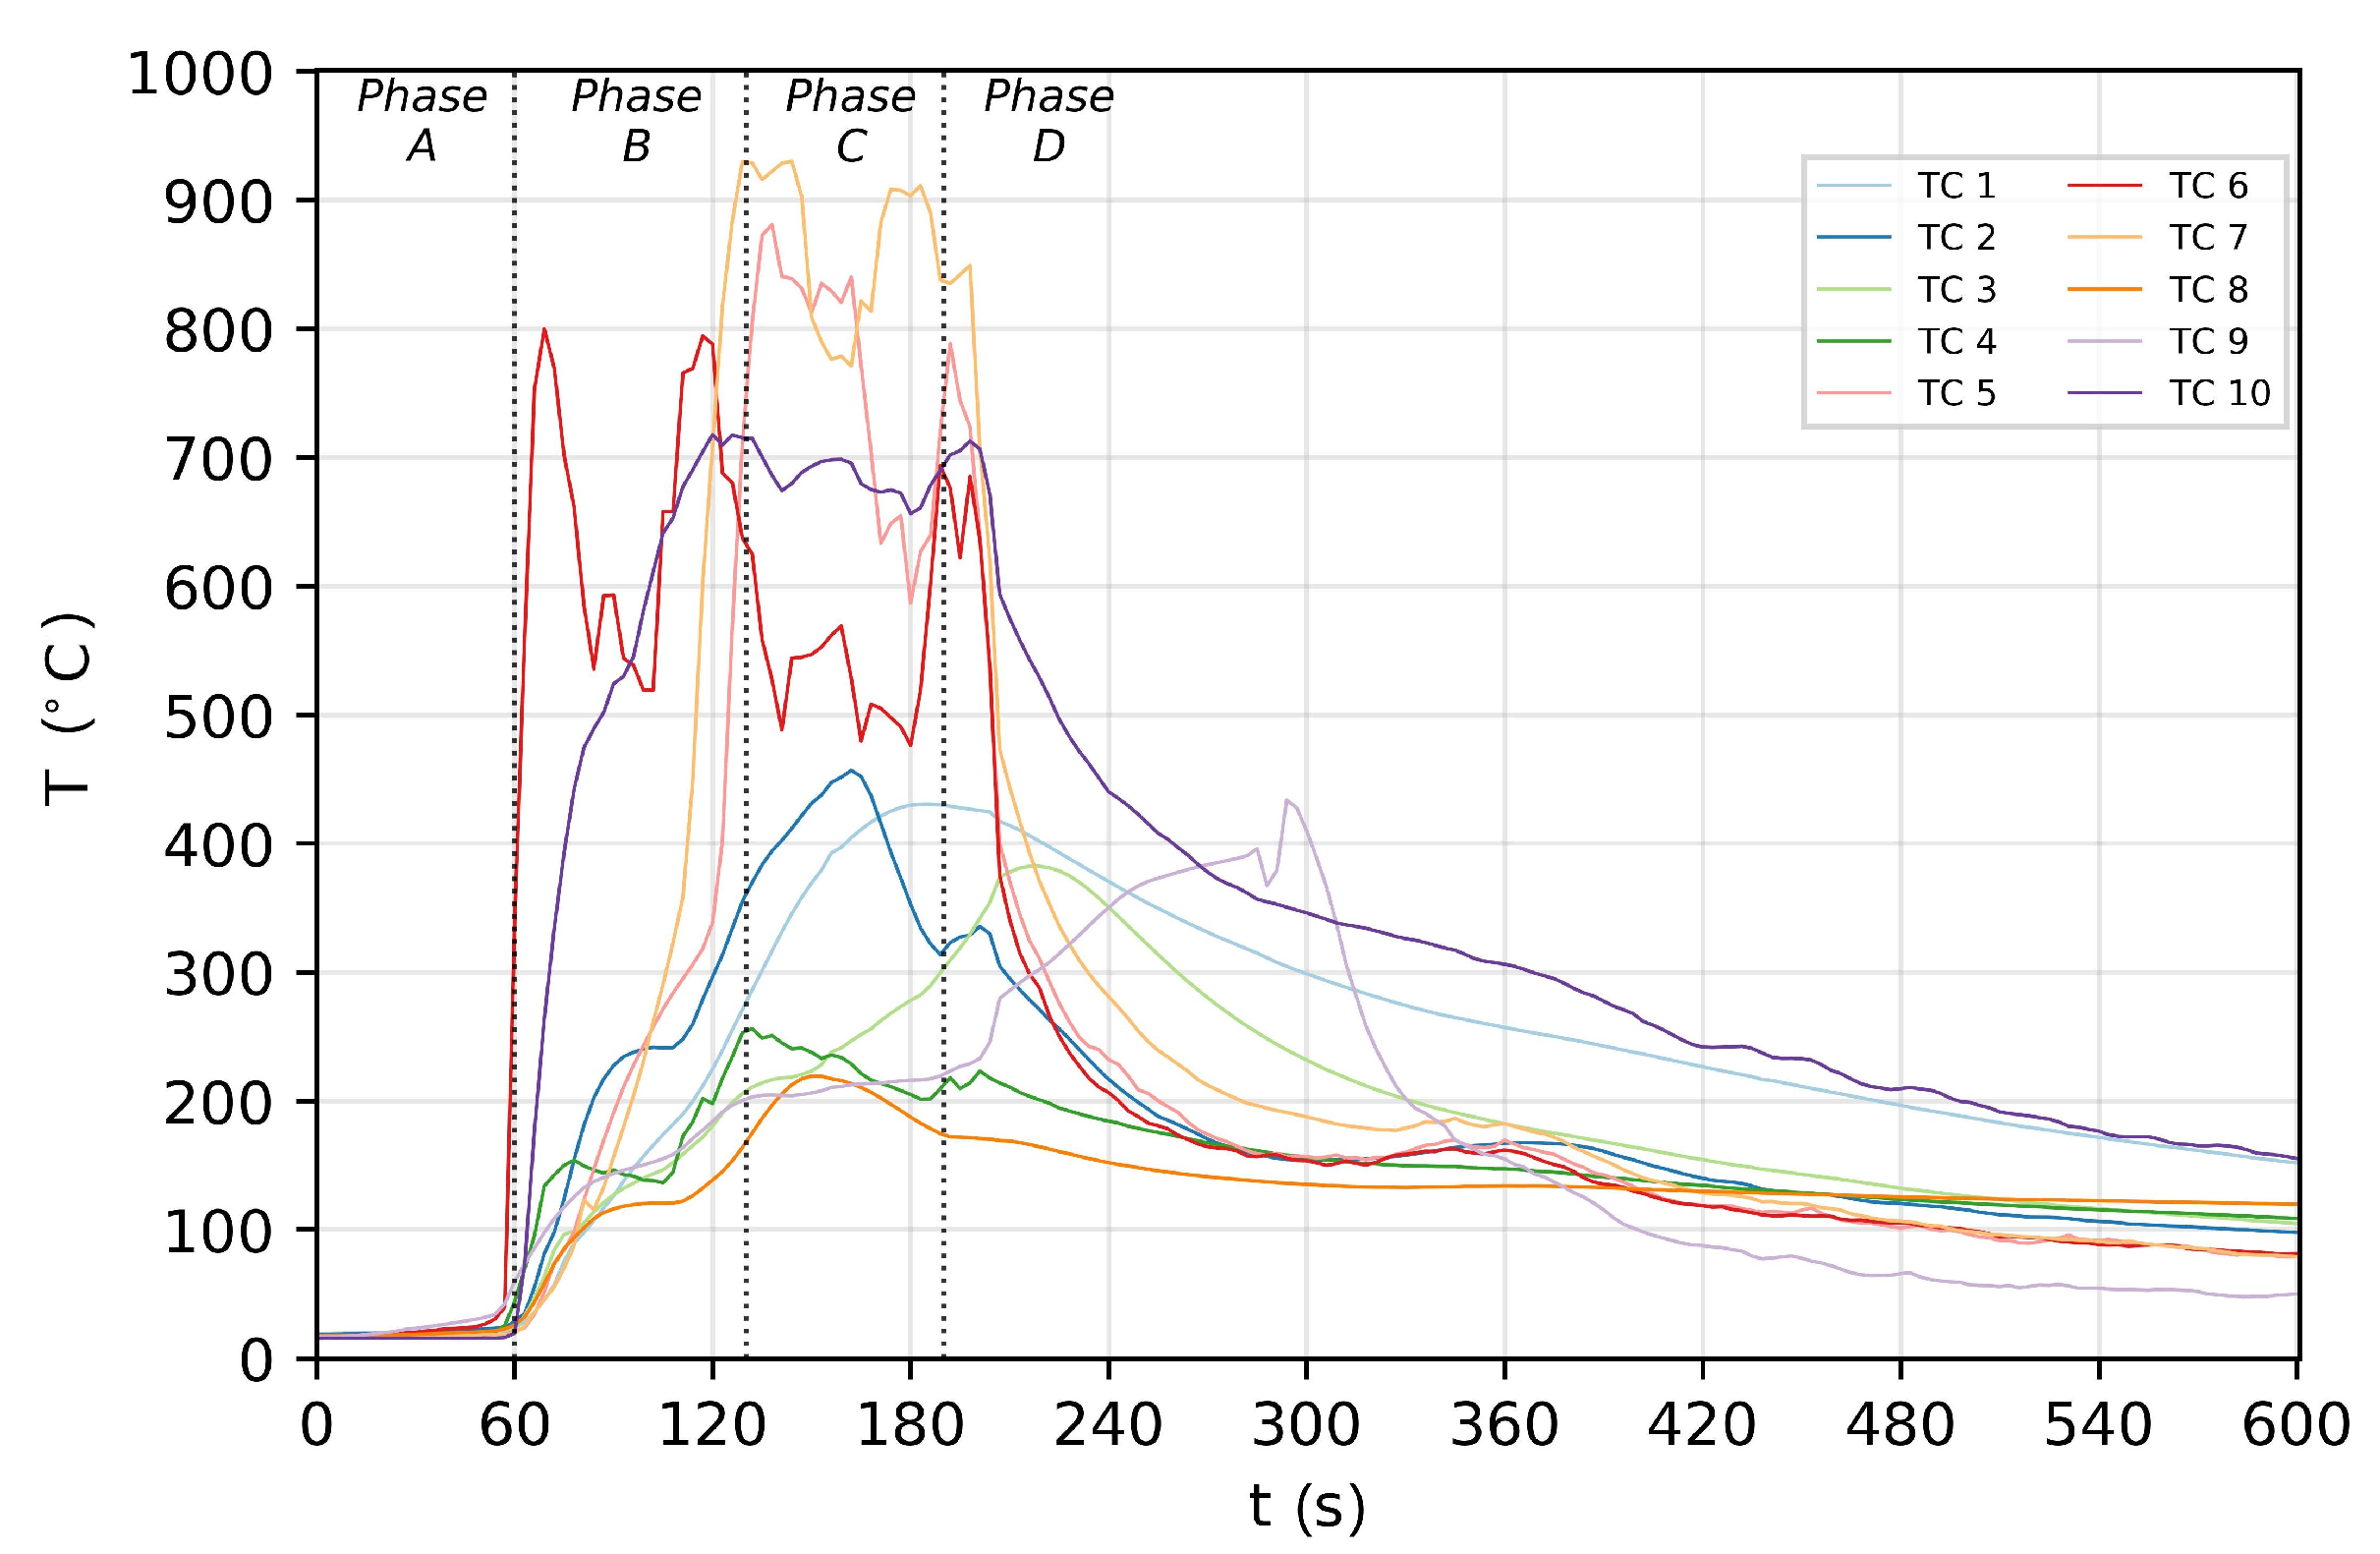
Figure 4.
Temperature and RTC of thermocouples TC1 and TC10 in the first 600 s of the test. Phases A, B, C, and D according to Table 2 and Figure 1.

Figure 5.
Temperature and RTC readings of thermocouples TC2, TC4, and TC8 during the first 600 s of the test. Phases A, B, C, and D according to Table 2 and Figure 1.

Figure 6.
Temperature and RTC readings of TC3, TC5, TC7, and TC9 in the first 600 s of the test. Phases A, B, C, and D according to Table 2 and Figure 1.

Figure 7.
Model of the internal battery temperature calculation.

Figure 8.
Temperature inside the battery in comparison to TC1, TC6, and TC10.


Table 1.
Examples of fire accidents in structures with RESS.
| Object | Reason | Description | Year | Lit. |
|---|---|---|---|---|
| Boeing 787 | On-board | Emergency landing | 2013 | [9] |
| battery failure | ||||
| Boeing 787 | Problems with | Grounding of | 2013 | [9] |
| LIBs safety | all Boeing 787s | |||
| Tesla Model S | Crash with | Fire in | 2018 | [1,10] |
| a concrete wall | battery module | 2018 | ||
| Two deaths | ||||
| and one injury | ||||
| Electric vehicle | Faulty interconnection | Fire in the vehicle | 2016 | [1] |
| BMW i3 REX | Spontaneous ignition | Fire in the parked vehicle | 2018 | [2] |
Table 2.
Fire resistance test phases.
| Phase | Description | Duration |
|---|---|---|
| A | Pre-heating | 60 s |
| B | Direct exposure to flame | 70 s |
| C | Indirect exposure to flame | 60 s |
| D | End of test | Conditional |
Table 3.
Thermocouples locations on the RESS.
| Thermocouple | Location |
|---|---|
| TC1, TC10 | The top and bottom surface of the RESS case in the centre |
| TC2, TC8 | The plugs |
| TC3, TC5, TC7, TC9 | The sides of the RESS case |
| TC4 | The RESS case 100 mm away from the closest plug |
| TC5 | The bottom surface of the RESS case in the center |
| TC6 | 60 mm below the specimen in the center (in a line with TC10) |
Table 4.
Maximal recorded temperature (C) of thermocouples TC1–TC10 and the average temperature in a given phase. Phases A, B, C, and D according to Table 2 and Figure 1.
| Thermocouple | Phase A | Phase B | Phase C | Phase D |
|---|---|---|---|---|
| TC1 | 20.6 | 270.7 | 430.5 | 428.8 |
| TC2 | 24.1 | 354.9 | 456.6 | 335.4 |
| TC3 | 18.7 | 205.6 | 299.3 | 382.2 |
| TC4 | 25.4 | 252.9 | 255.9 | 223.1 |
| TC5 | 18.6 | 711.2 | 880.6 | 788.1 |
| TC6 | 39.6 | 799.8 | 693.5 | 685.0 |
| TC7 | 18.2 | 929.6 | 929.9 | 849.0 |
| TC8 | 22.7 | 163.7 | 219.3 | 171.9 |
| TC9 | 42.2 | 200.3 | 219.2 | 433.6 |
| TC10 | 16.0 | 717.5 | 714.6 | 712.6 |
| 19.1 | 254.7 | 452.0 | 44.5 | |
| 3.7 | 218.3 | 239.3 | 54.9 |
Table 5.
Maximal recorded RTC ( C/s) for all thermocouples and the average RTC in a given phase. Phases A, B, C, and D according to Table 2 and Figure 1.
| Thermocouple | Phase A | Phase B | Phase C | Phase D |
|---|---|---|---|---|
| TC1 | 0.2 | 18.4 | 15.6 | −7.3 |
| TC2 | 0.8 | 30.3 | −22.1 | −25.0 |
| TC3 | 0.9 | 20.6 | 9.9 | 19.8 |
| TC4 | 5.1 | 38.5 | 7.8 | 9.2 |
| TC5 | 0.4 | 167.5 | 94.0 | −132.2 |
| TC6 | 9.3 | 298.9 | 92.8 | −163.9 |
| TC7 | 0.3 | 152.8 | −93.7 | −147.1 |
| TC8 | 1.4 | 14.9 | 11.3 | −2.5 |
| TC9 | 8.3 | 17.3 | 2.7 | 54.7 |
| TC10 | 0.5 | 103.7 | 17.6 | −77.7 |
| 0.4 | 17.5 | 0.7 | −0.2 | |
| 1.0 | 38.6 | 23.2 | 3.2 |
Publisher’s Note: MDPI stays neutral with regard to jurisdictional claims in published maps and institutional affiliations. |
© 2021 by the authors. Licensee MDPI, Basel, Switzerland. This article is an open access article distributed under the terms and conditions of the Creative Commons Attribution (CC BY) license (https://creativecommons.org/licenses/by/4.0/).
Share and Cite
MDPI and ACS Style
Darnikowski, D.; Mieloszyk, M. Investigation into the Lithium-Ion Battery Fire Resistance Testing Procedure for Commercial Use. Batteries 2021, 7, 44. https://0-doi-org.brum.beds.ac.uk/10.3390/batteries7030044
AMA Style
Darnikowski D, Mieloszyk M. Investigation into the Lithium-Ion Battery Fire Resistance Testing Procedure for Commercial Use. Batteries. 2021; 7(3):44. https://0-doi-org.brum.beds.ac.uk/10.3390/batteries7030044
Chicago/Turabian StyleDarnikowski, Daniel, and Magdalena Mieloszyk. 2021. "Investigation into the Lithium-Ion Battery Fire Resistance Testing Procedure for Commercial Use" Batteries 7, no. 3: 44. https://0-doi-org.brum.beds.ac.uk/10.3390/batteries7030044
Note that from the first issue of 2016, this journal uses article numbers instead of page numbers. See further details here.