
An ASIC-Based Miniaturized System for Online Multi-Measurand Monitoring of Lithium-Ion Batteries

 , , , ,
  and
and 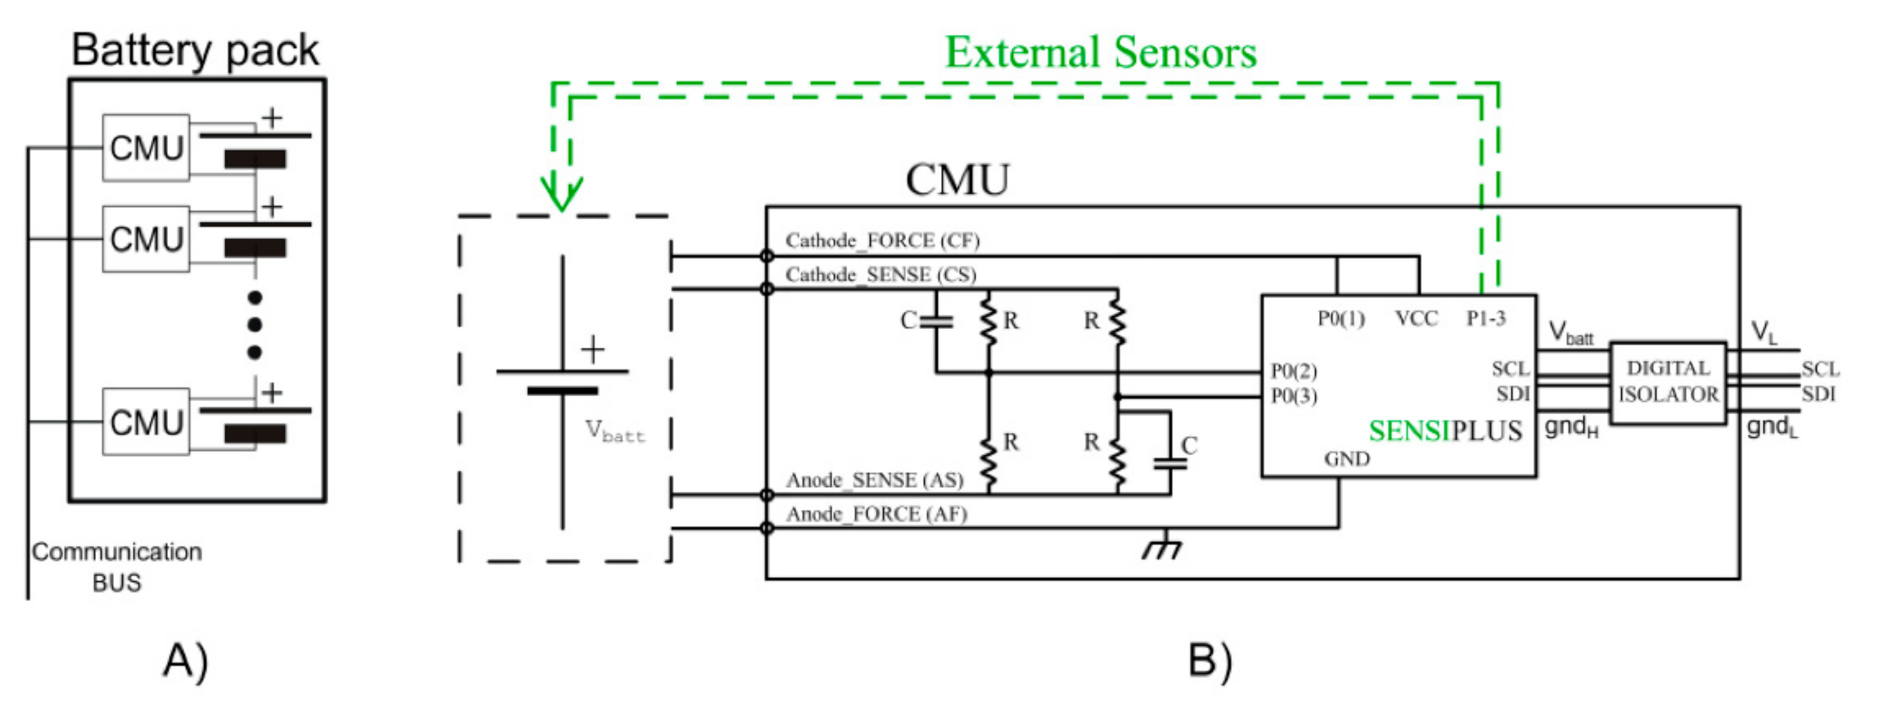
Abstract
:1. Introduction
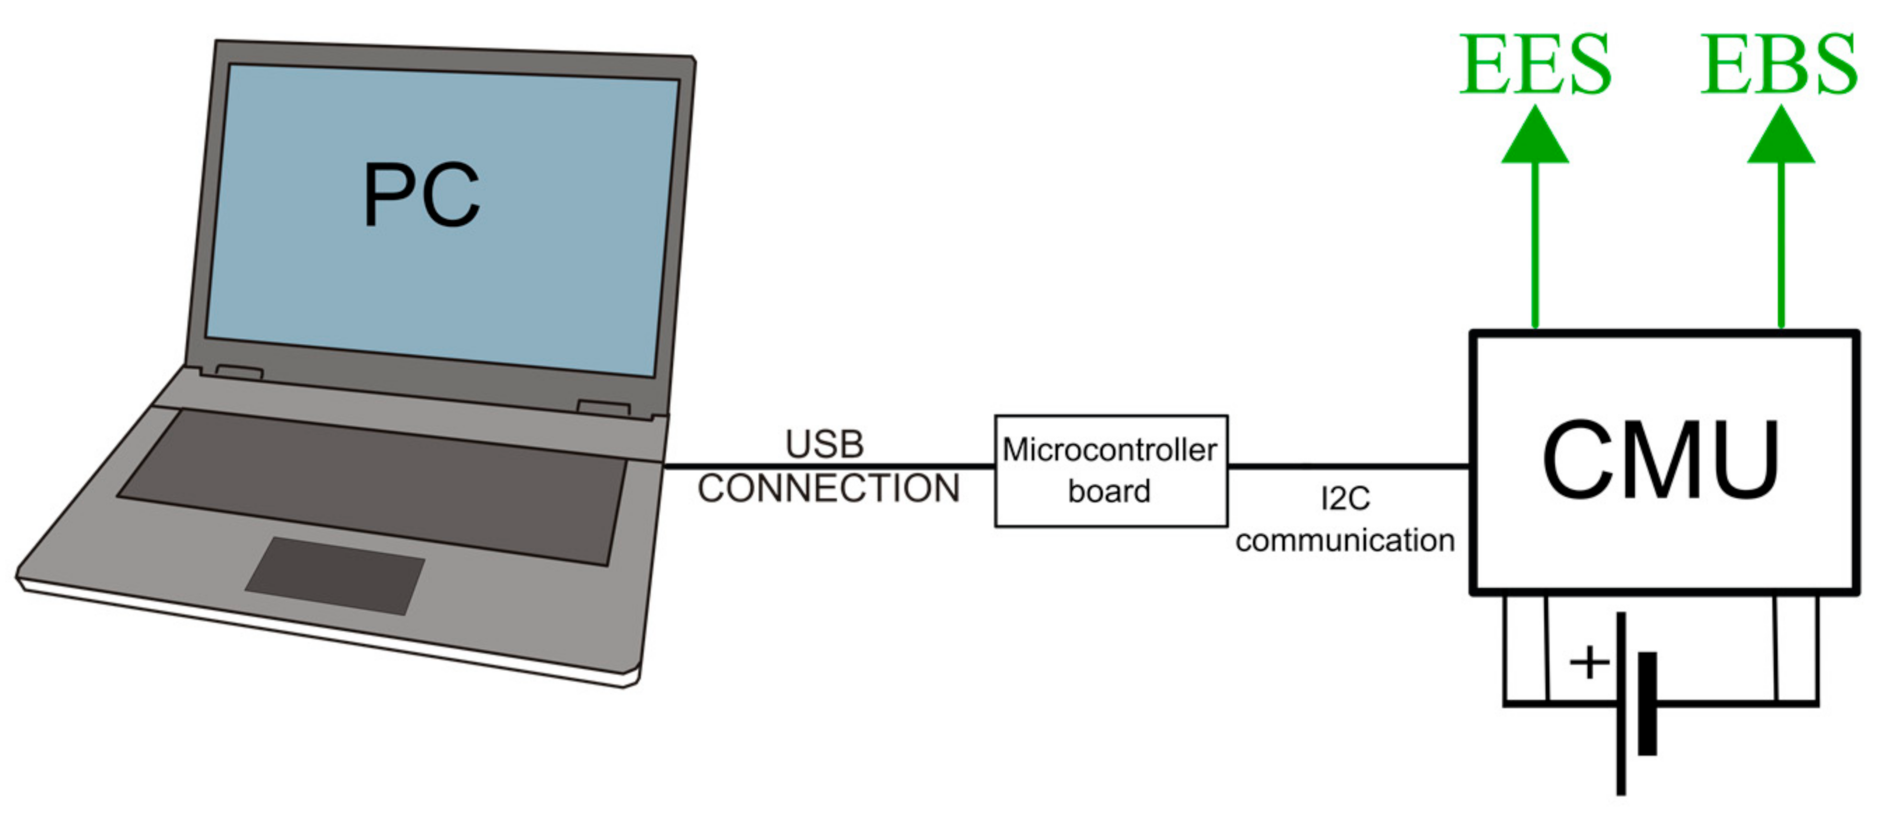
2. System Architecture
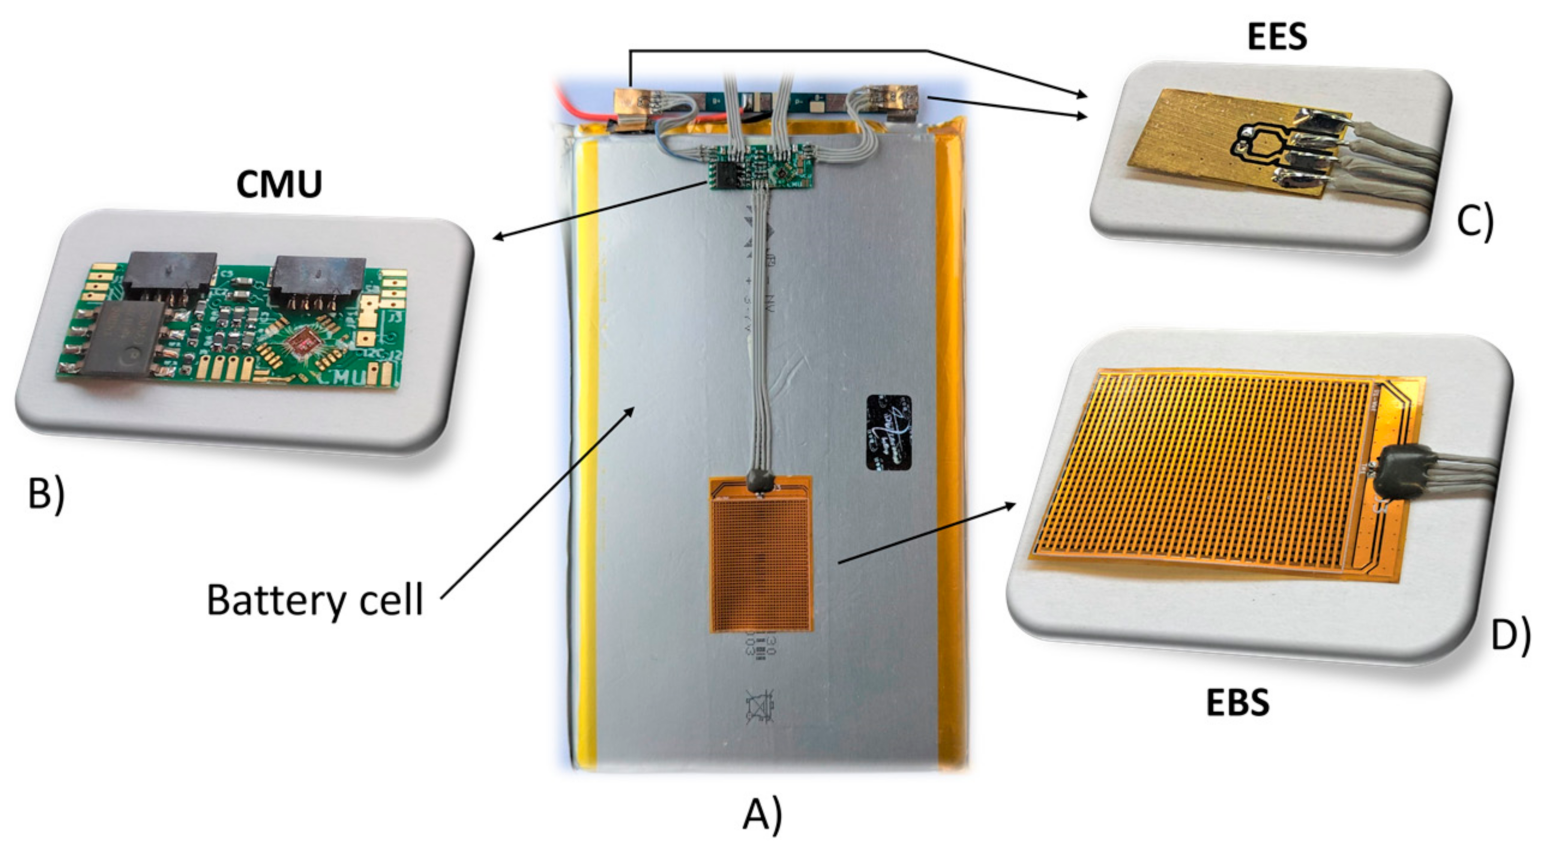
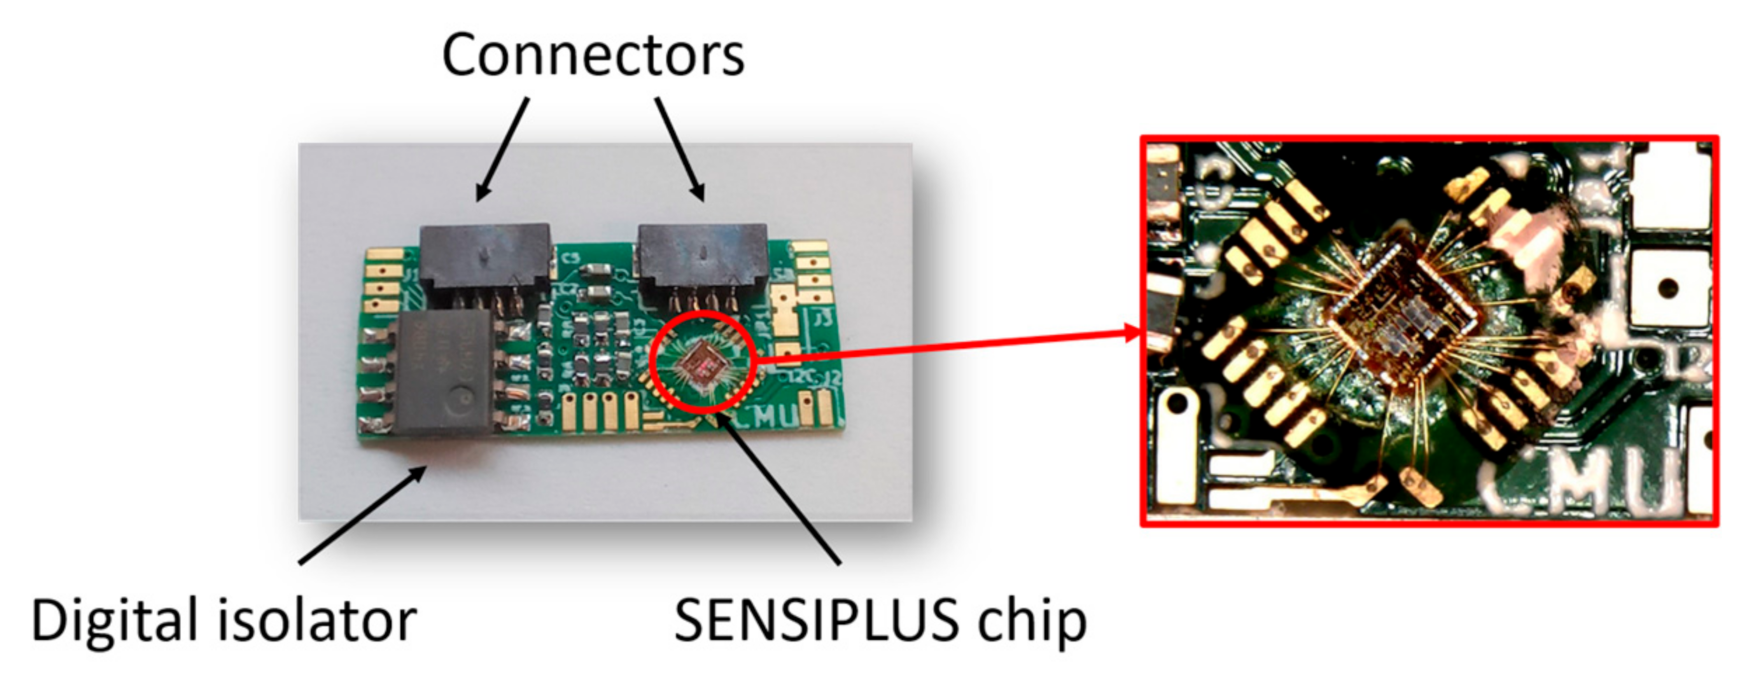
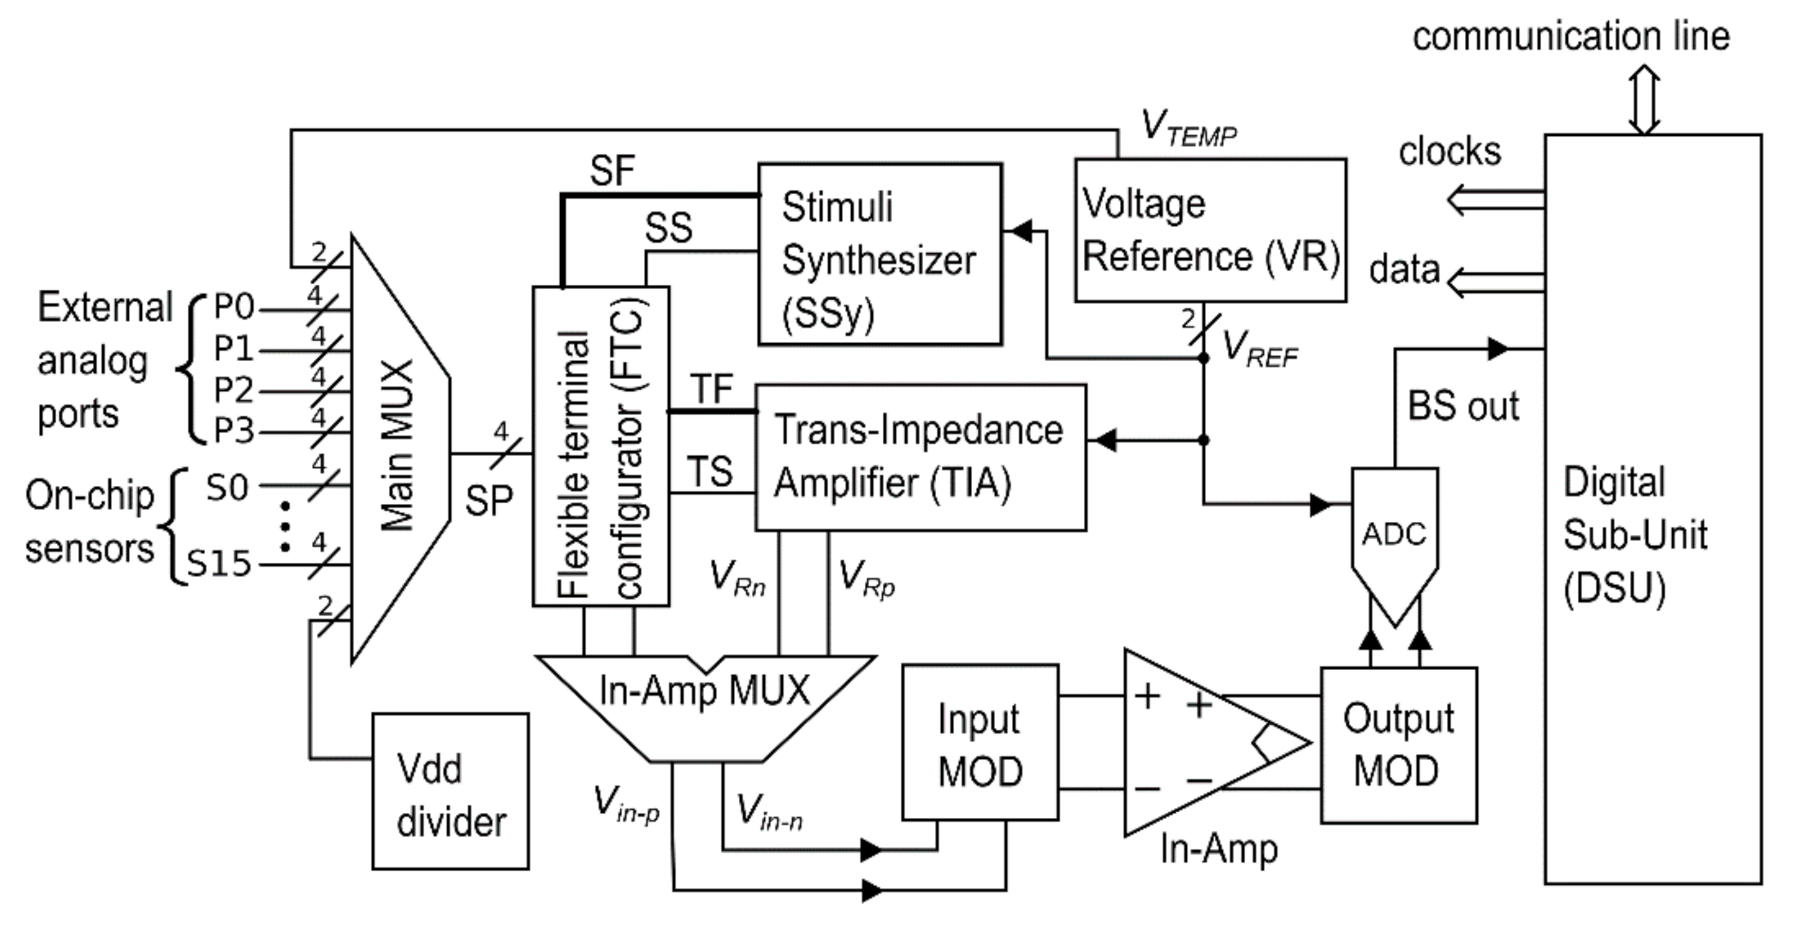
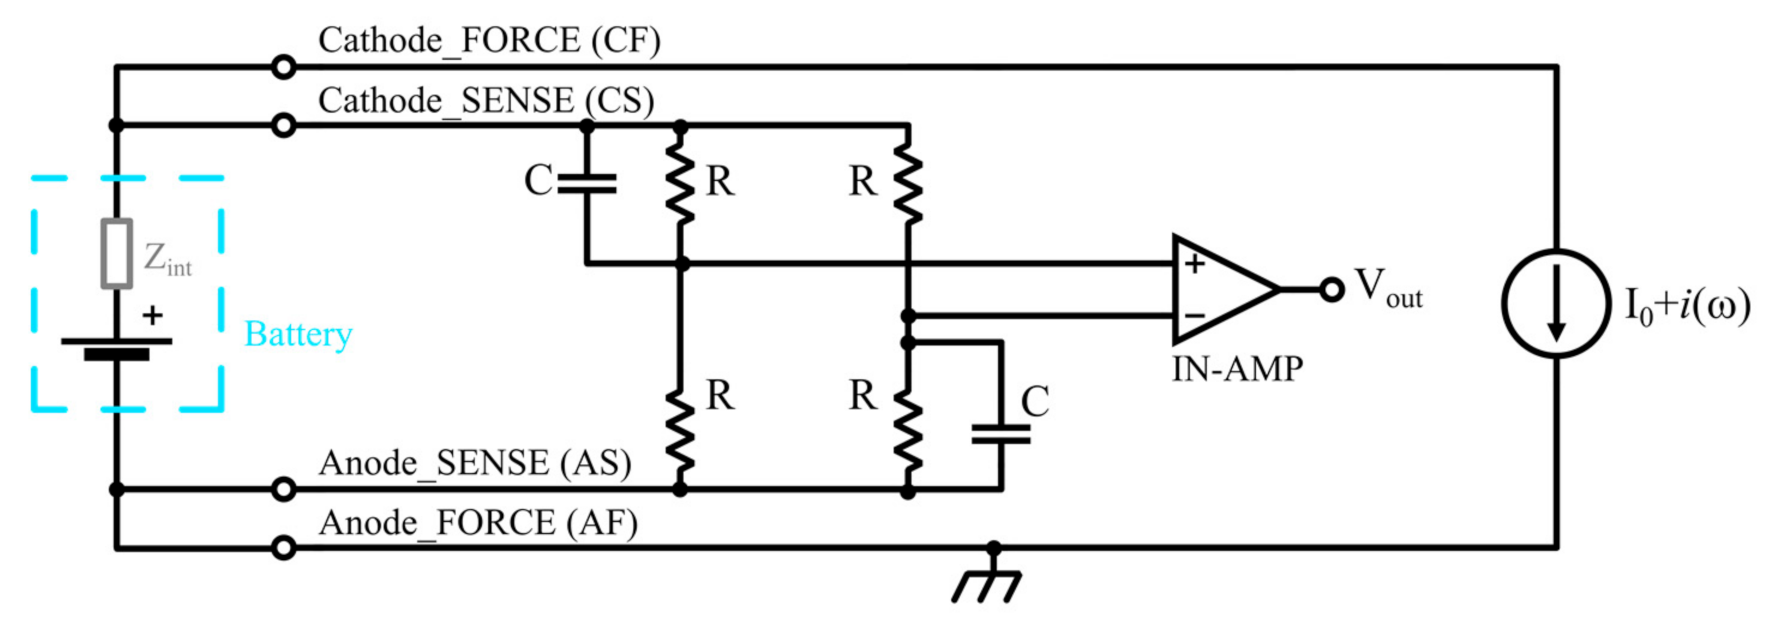
2.1. CMU Description
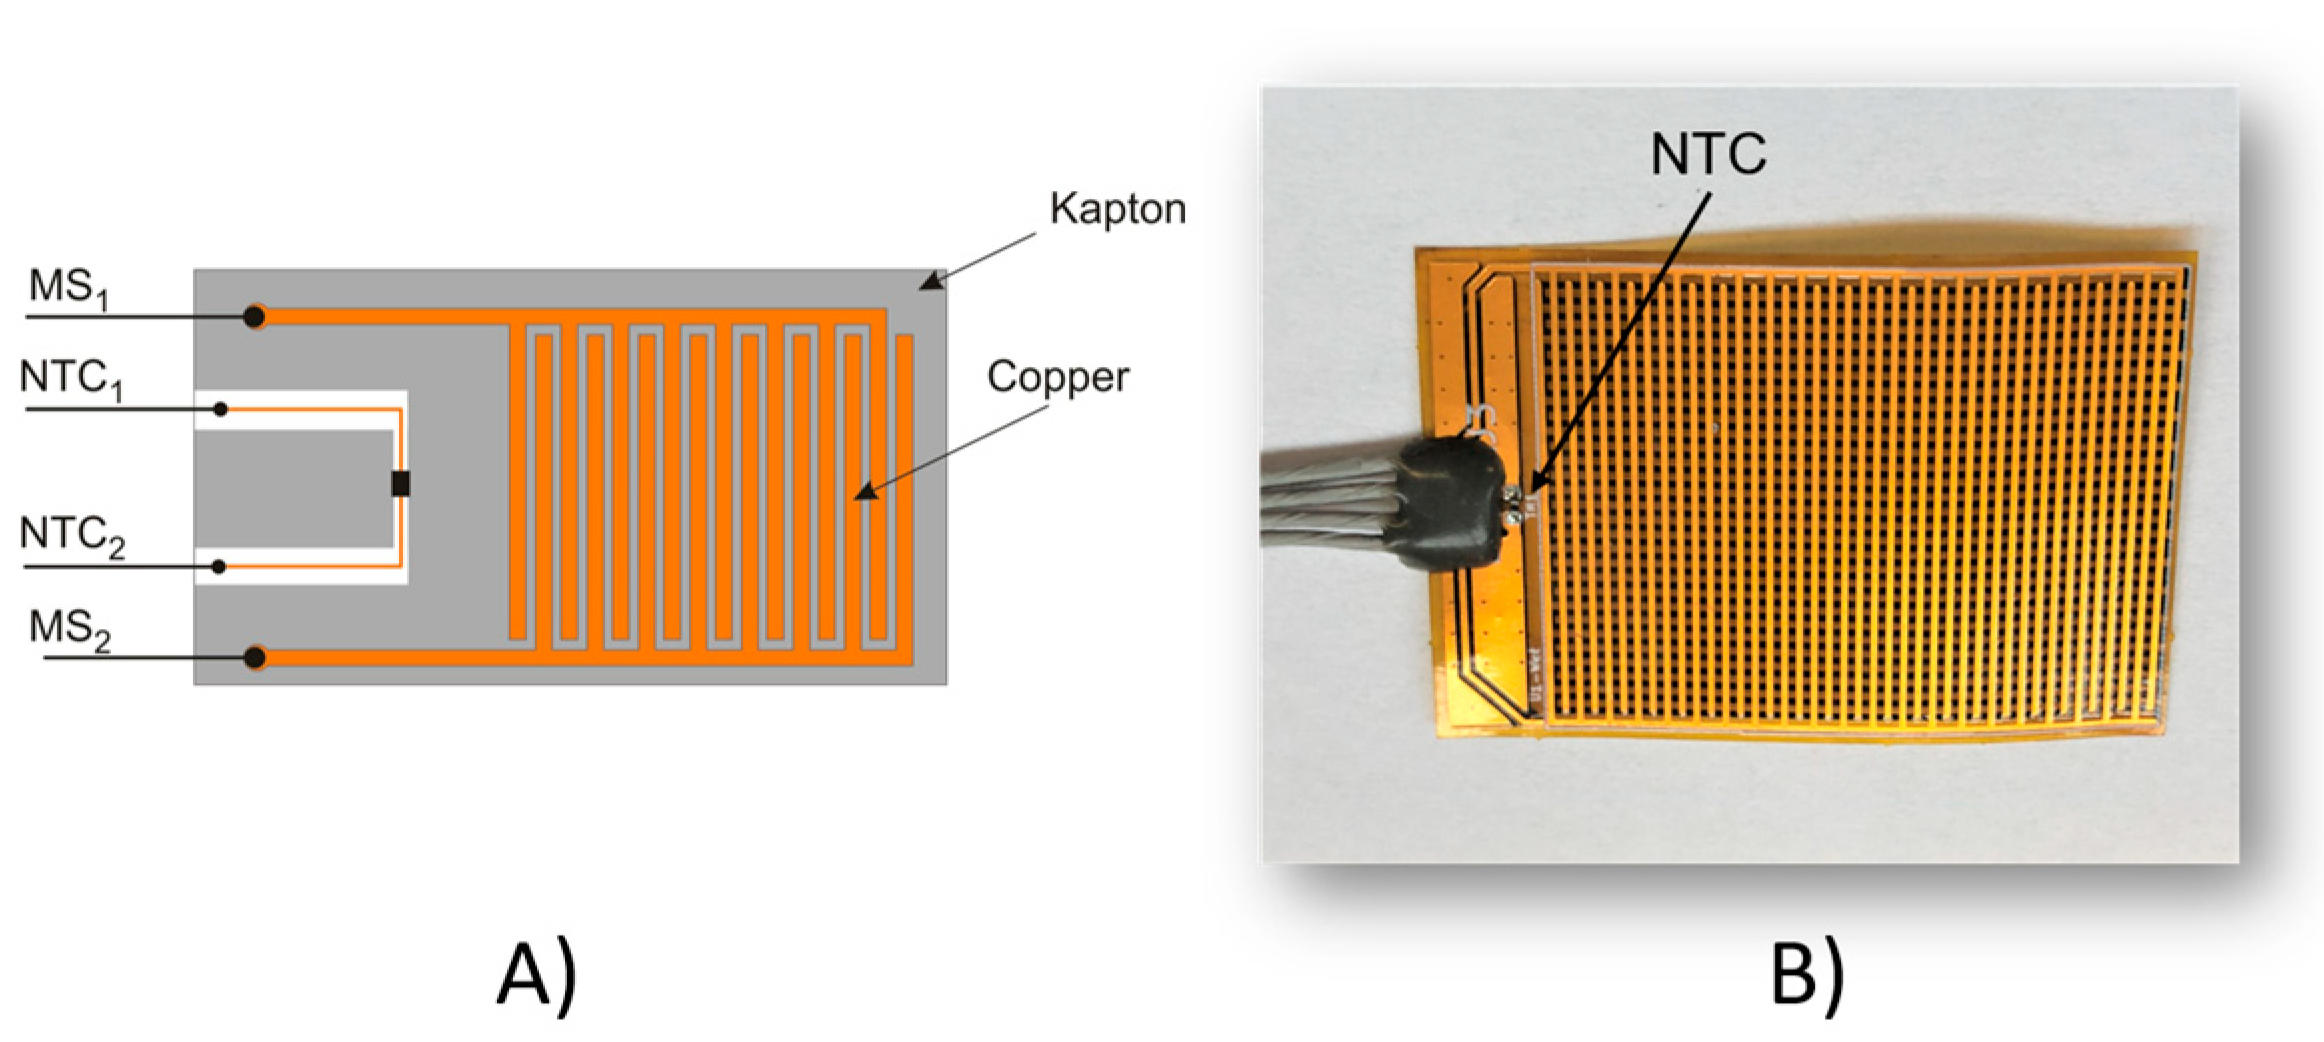
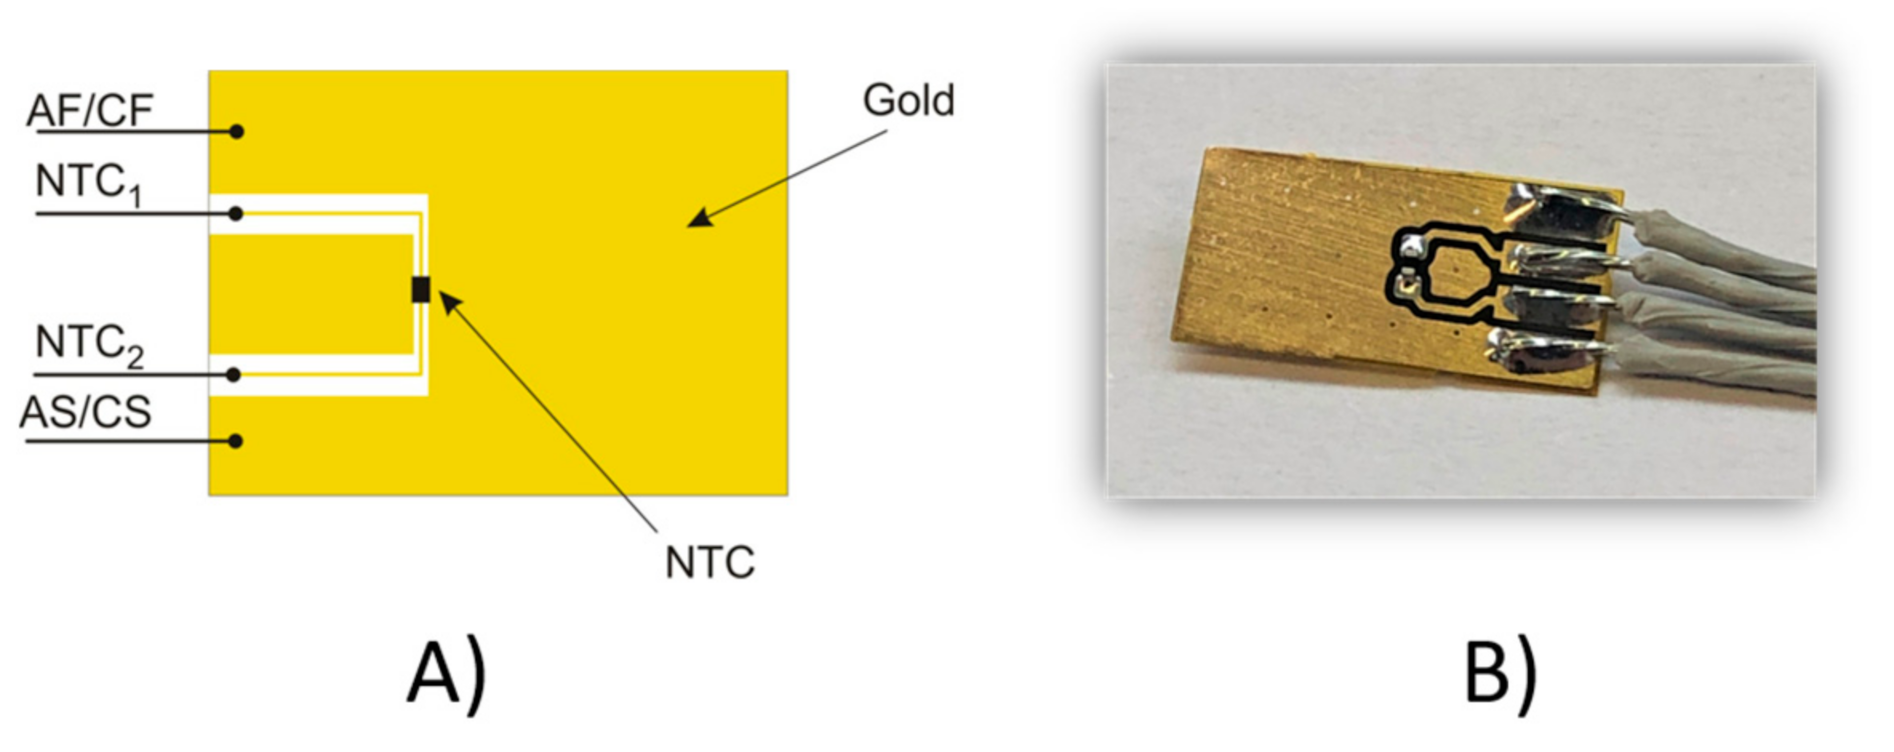
2.2. External Sensor Description
3. Measurements and Results
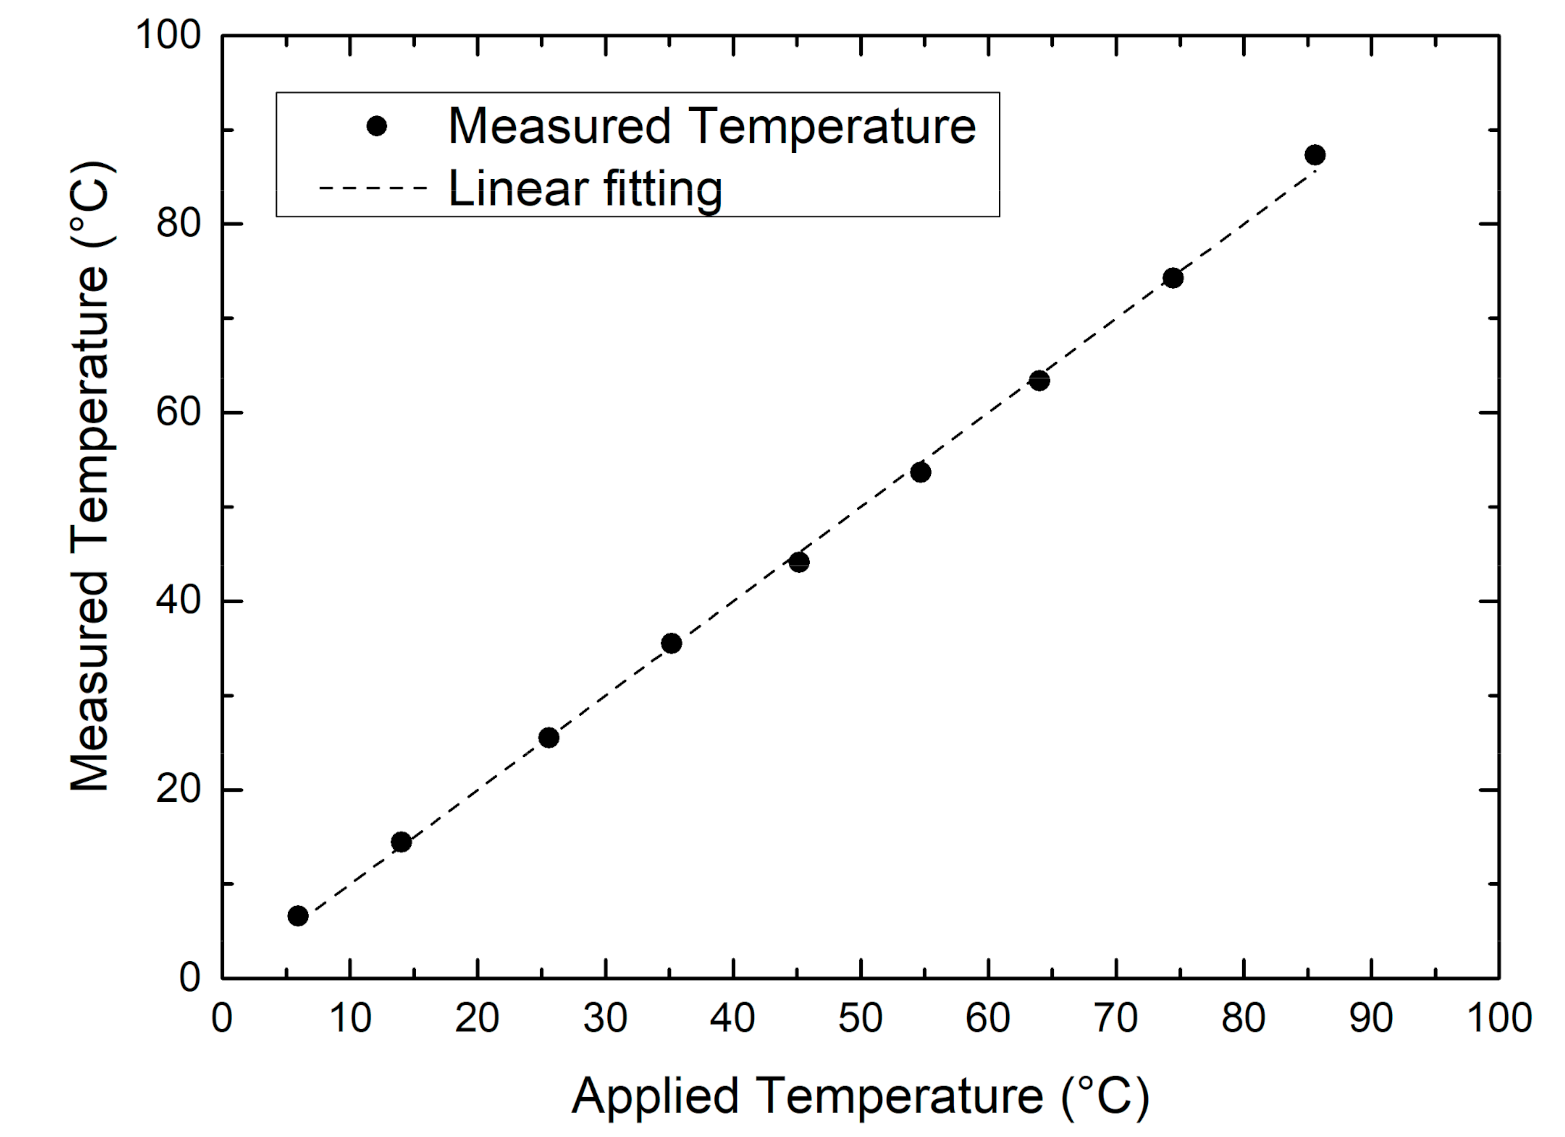
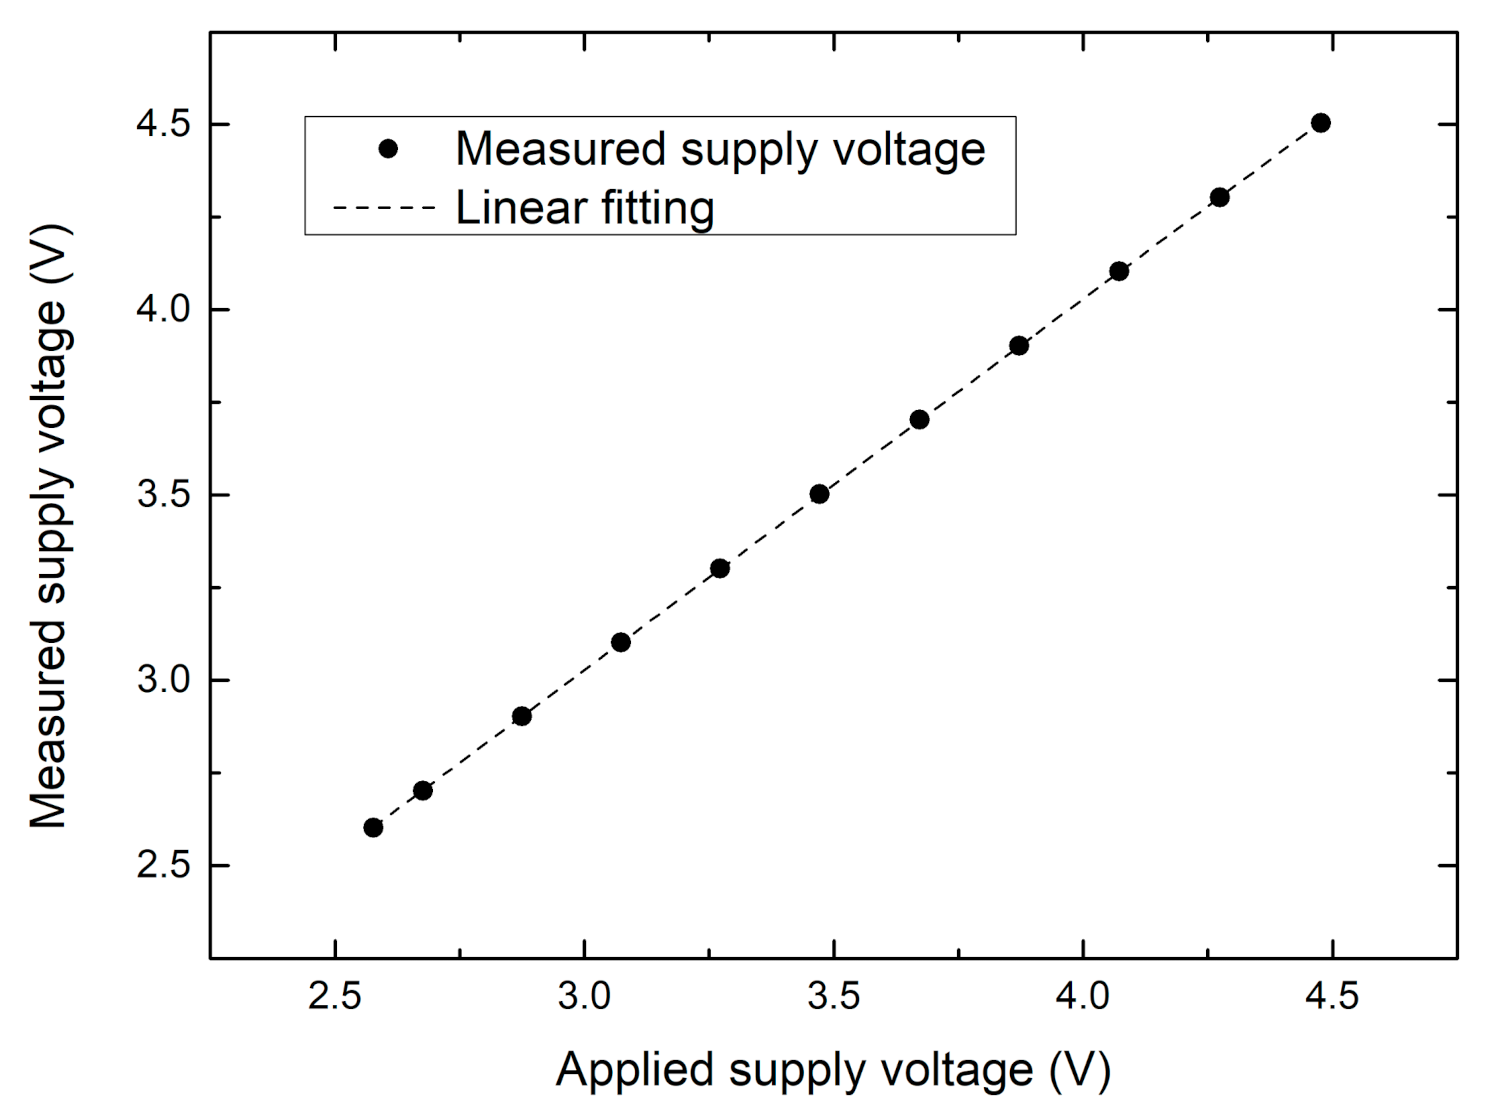
3.1. CMU Characterization
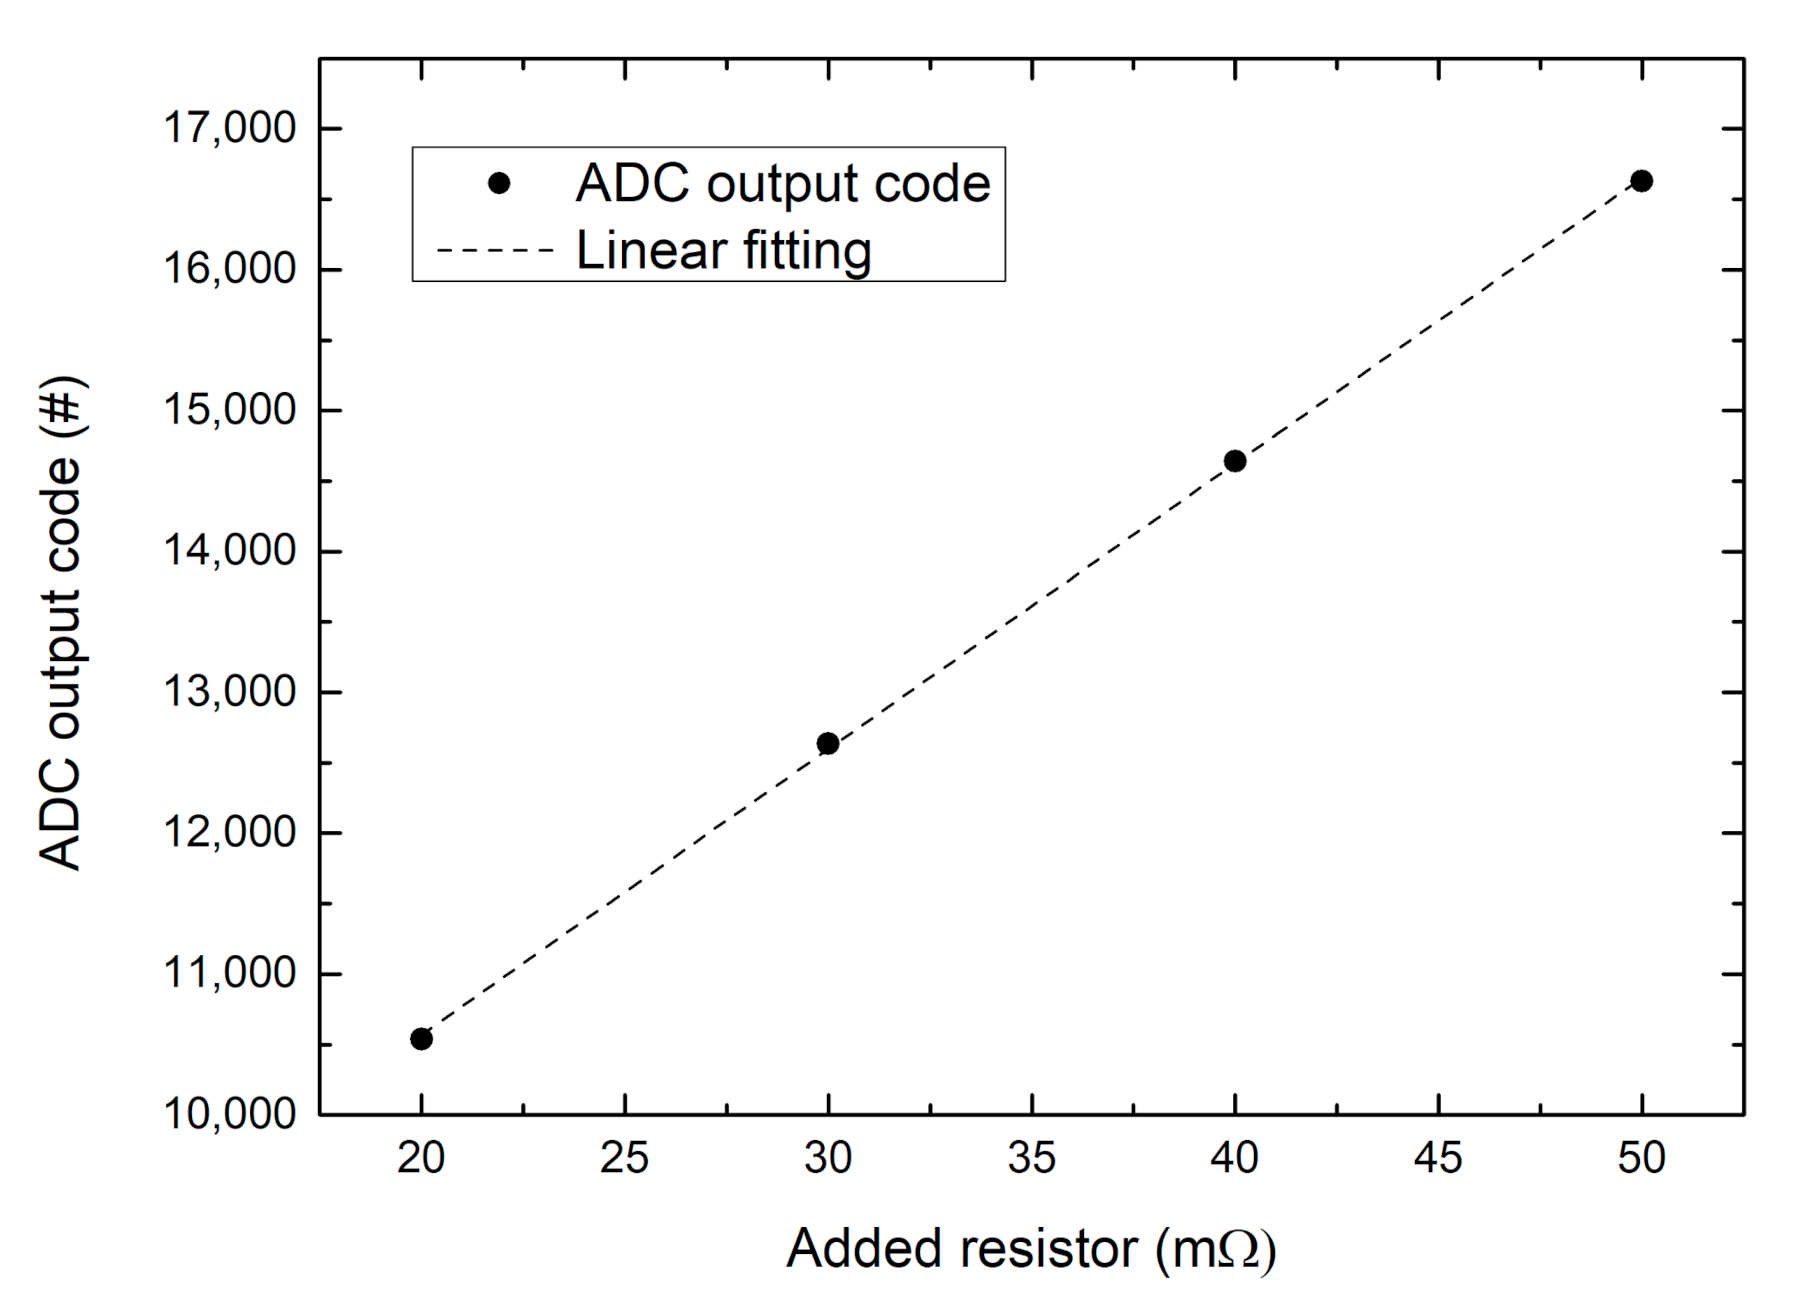
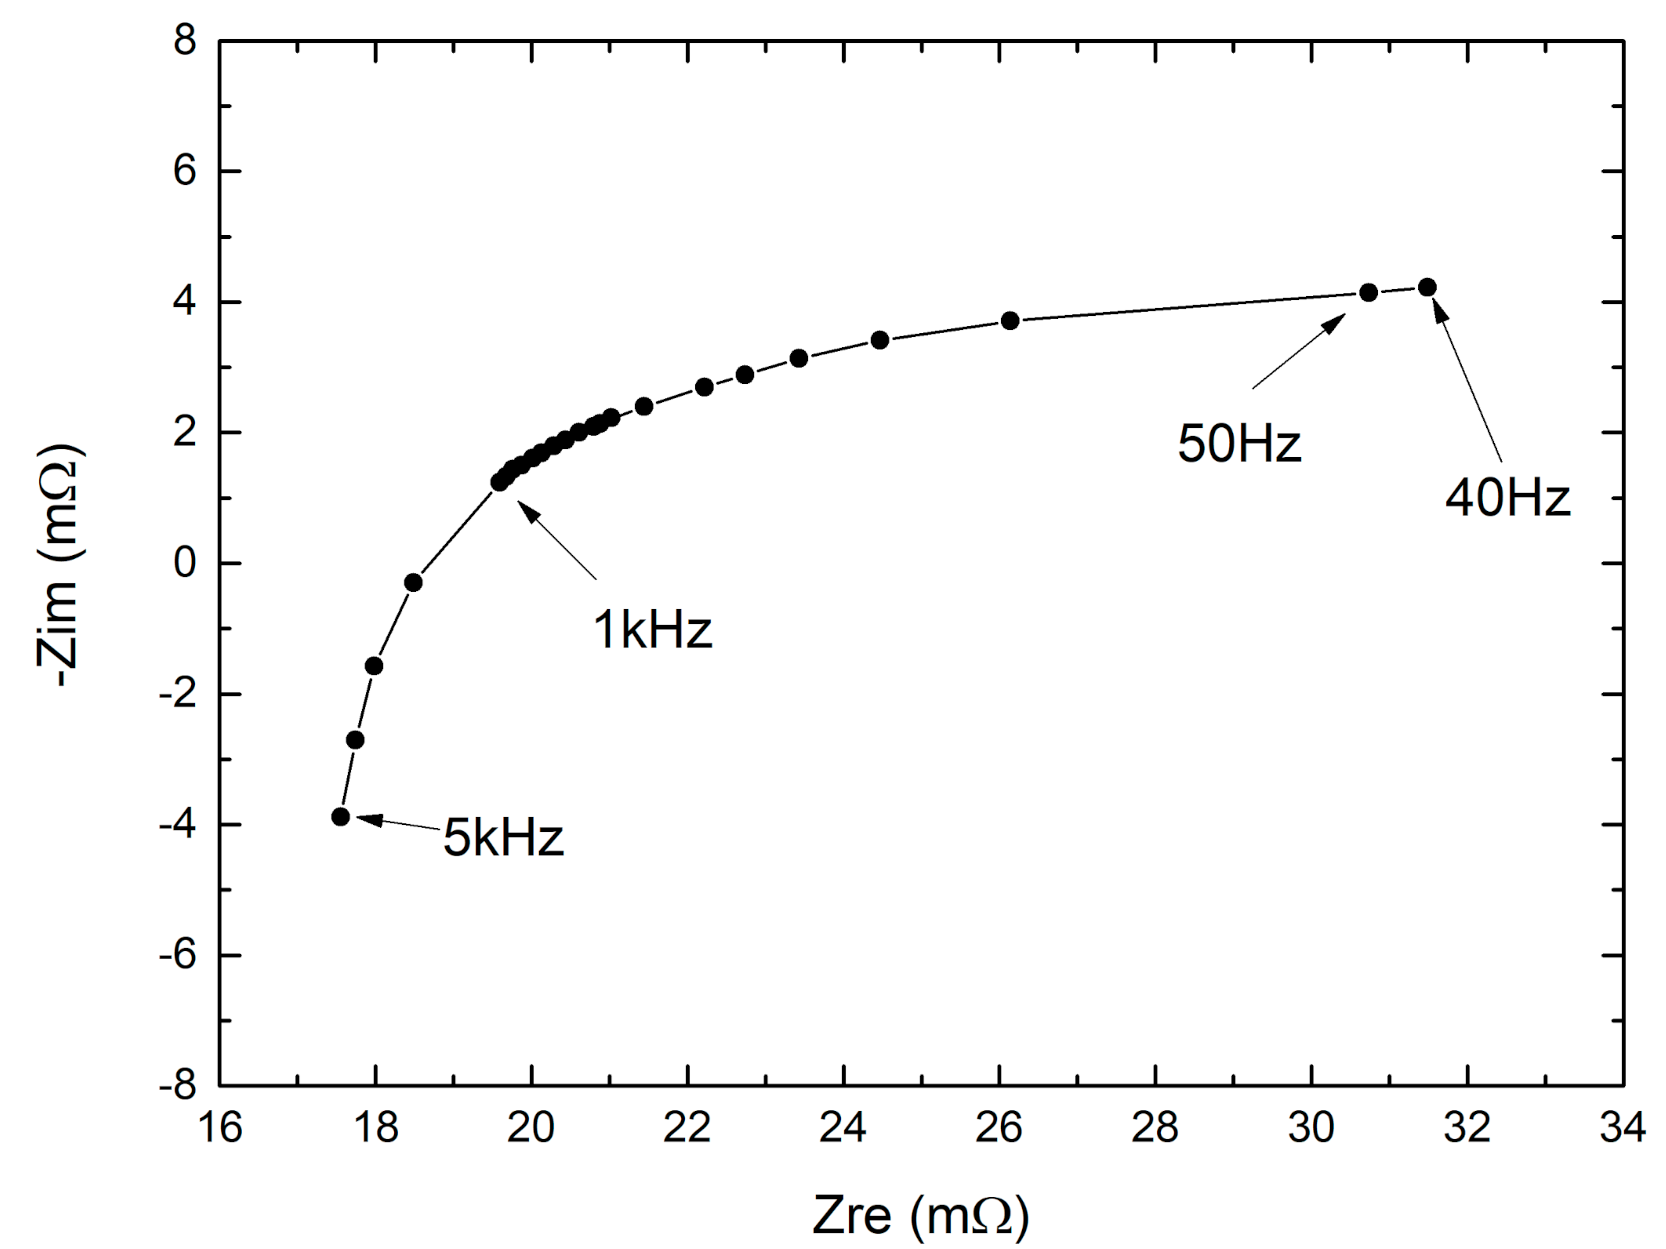
3.2. External Sensor Characterization
4. Conclusions
Author Contributions
Funding
Conflicts of Interest
References
- Goodenough, J.B.; Park, K.S. The Li-ion rechargeable battery: A perspective. J. Am. Chem. Soc. 2013, 135, 1167–1176. [Google Scholar] [CrossRef]
- Blomgren, G.E. The development and future of lithium ion batteries. J. Electrochem. Soc. 2016, 164, A5019. [Google Scholar] [CrossRef] [Green Version]
- Wu, F.; Maier, J.; Yu, Y. Guidelines and trends for next-generation rechargeable lithium and lithium-ion batteries. Chem. Soc. Rev. 2020, 49, 1569–1614. [Google Scholar] [CrossRef]
- Dunn, B.; Kamath, H.; Tarascon, J.M. Electrical energy storage for the grid: A battery of choices. Science 2011, 334, 928–935. [Google Scholar] [CrossRef] [Green Version]
- Armand, M.; Tarascon, J.M. Building better batteries. Nature 2008, 451, 652–657. [Google Scholar] [CrossRef] [PubMed]
- Chen, Y.; Kang, Y.; Zhao, Y.; Wang, L.; Liu, J.; Li, Y.; Liang, Z.; He, X.; Li, X.; Tavajohi, N.; et al. A review of lithium-ion battery safety concerns: The issues, strategies, and testing standards. J. Energy Chem. 2020. [Google Scholar] [CrossRef]
- Waag, W.; Fleischer, C.; Sauer, D.U. Critical review of the methods for monitoring of lithium-ion batteries in electric and hybrid vehicles. J. Power Sources 2014, 258, 321–339. [Google Scholar] [CrossRef]
- Berecibar, M.; Gandiaga, I.; Villarreal, I.; Omar, N.; Van Mierlo, J.; Van den Bossche, P. Critical review of state of health estimation methods of Li-ion batteries for real applications. Renew. Sustain. Energy Rev. 2016, 56, 572–587. [Google Scholar] [CrossRef]
- Park, S.; Ahn, J.; Kang, T.; Park, S.; Kim, Y.; Cho, I.; Kim, J. Review of state-of-the-art battery state estimation technologies for battery management systems of stationary energy storage systems. J. Power Electron. 2020, 1–15. [Google Scholar] [CrossRef]
- Wang, Y.; Tian, J.; Sun, Z.; Wang, L.; Xu, R.; Li, M.; Chen, Z. A comprehensive review of battery modeling and state estimation approaches for advanced battery management systems. Renew. Sustain. Energy Rev. 2020, 131, 110015. [Google Scholar] [CrossRef]
- Kim, C.H.; Kim, M.Y.; Moon, G.W. A modularized charge equalizer using a battery monitoring IC for series-connected Li-ion battery strings in electric vehicles. IEEE Trans. Power Electron. 2012, 28, 3779–3787. [Google Scholar] [CrossRef]
- Dai, H.; Jiang, B.; Hu, X.; Lin, X.; Wei, X.; Pecht, M. Advanced battery management strategies for a sustainable energy future: Multilayer design concepts and research trends. Renew. Sustain. Energy Rev. 2020, 110480. [Google Scholar] [CrossRef]
- Steinhorst, S.; Lukasiewycz, M.; Narayanaswamy, S.; Kauer, M.; Chakraborty, S. Smart cells for embedded battery management. In Proceedings of the 2014 IEEE International Conference on Cyber-Physical Systems, Networks, and Applications, Hong Kong, China, 25–26 August 2014; pp. 59–64. [Google Scholar] [CrossRef]
- Berecibar, M. Accurate predictions of lithium-ion battery life. Nature 2019, 568, 325–326. [Google Scholar] [CrossRef] [PubMed]
- Wei, Z.; Zhao, J.; He, H.; Ding, G.; Cui, H.; Liu, L. Future smart battery and management: Advanced sensing from external to embedded multi-dimensional measurement. J. Power Sources 2021, 489, 229462. [Google Scholar] [CrossRef]
- Available online: https://sensichips.com (accessed on 29 June 2021).
- Osaka, T.; Mukoyama, D.; Nara, H. Development of diagnostic process for commercially available batteries, especially lithium ion battery, by electrochemical impedance spectroscopy. J. Electrochem. Soc. 2015, 162, A2529. [Google Scholar] [CrossRef]
- Choi, W.; Shin, H.C.; Kim, J.M.; Choi, J.Y.; Yoon, W.S. Modeling and applications of electrochemical impedance spectroscopy (EIS) for lithium-ion batteries. J. Electrochem. Sci. Technol. 2020, 11, 1–13. [Google Scholar] [CrossRef] [Green Version]
- Wang, L.F.; Geng, M.M.; Ding, X.N.; Fang, C.; Zhang, Y.; Shi, S.S.; Zheng, Y.; Yang, K.; Zhan, C.; Wang, X.D. Research progress of the electrochemical impedance technique applied to the high-capacity lithium-ion battery. Int. J. Miner. Metall. Mater. 2021, 28, 538–552. [Google Scholar] [CrossRef]
- Islam, S.M.R.; Park, S.-Y.; Balasingam, B. Unification of Internal Resistance Estimation Methods for Li-Ion Batteries Using Hysteresis-Free Equivalent Circuit Models. Batteries 2020, 6, 32. [Google Scholar] [CrossRef]
- Kehl, D.; Jennert, T.; Lienesch, F.; Kurrat, M. Electrical Characterization of Li-Ion Battery Modules for Second-Life Applications. Batteries 2021, 7, 32. [Google Scholar] [CrossRef]
- Varnosfaderani, M.A.; Strickland, D. A comparison of online electrochemical spectroscopy impedance estimation of batteries. IEEE Access 2018, 6, 23668–23677. [Google Scholar] [CrossRef]
- Huang, W.; Qahouq, J.A.A. An online battery impedance measurement method using DC–DC power converter control. IEEE Trans. Ind. Electron. 2014, 61, 5987–5995. [Google Scholar] [CrossRef]
- Varnosfaderani, M.A.; Strickland, D. Online impedance spectroscopy estimation of a dc–dc converter connected battery using a switched capacitor-based balancing circuit. J. Eng. 2019, 2019, 4681–4685. [Google Scholar] [CrossRef]
- Gong, Z.; Liu, Z.; Wang, Y.; Gupta, K.; Da Silva, C.; Liu, T.; Zheng, Z.H.; Zhang, W.P.; van Lammeren, J.M.; Bergveld, H.J.; et al. IC for online EIS in automotive batteries and hybrid architecture for high-current perturbation in low-impedance cells. In Proceedings of the 2018 IEEE Applied Power Electronics Conference and Exposition (APEC), San Antonio, TX, USA, 4–8 March 2018; pp. 1922–1929. [Google Scholar] [CrossRef]
- Crescentini, M.; De Angelis, A.; Ramilli, R.; De Angelis, G.; Tartagni, M.; Moschitta, A.; Traverso, P.A.; Carbone, P. Online EIS and diagnostics on lithium-ion batteries by means of low-power integrated sensing and parametric modeling. IEEE Trans. Instrum. Meas. 2020, 70, 1–11. [Google Scholar] [CrossRef]
- Rehman, S.; Khan, K.; Zhao, Y.; Hou, Y. Nanostructured cathode materials for lithium–sulfur batteries: Progress, challenges and perspectives. J. Mater. Chem. A 2017, 5, 3014–3038. [Google Scholar] [CrossRef]
- Wen, G.; Rehman, S.; Tranter, T.G.; Ghosh, D.; Chen, Z.; Gostick, J.T.; Pope, M.A. Insights into Multiphase Reactions during Self-Discharge of Li-S Batteries. Chem. Mater. 2020, 32, 4518–4526. [Google Scholar] [CrossRef]
- Del Cesta, S.; Ria, A.; Simmarano, R.; Piotto, M.; Bruschi, P. A compact programmable differential voltage reference with unbuffered 4 mA output current capability and ±0.4% untrimmed spread. In Proceedings of the ESSCIRC 2017—43rd IEEE European Solid State Circuits Conference, Leuven, Belgium, 1–14 September 2017; pp. 11–14. [Google Scholar] [CrossRef]
- Del Cesta, S.; Ria, A.; Piotto, M.; Simmarano, R.; Bruschi, P. A compact current-mode instrumentation amplifier for general-purpose sensor interfaces. AEU Int. J. Electron. Commun. 2018, 8–14. [Google Scholar] [CrossRef]
- Bruschi, P.; Cerro, G.; Colace, L.; De Iacovo, A.; Del Cesta, S.; Ferdinandi, M.; Ferrigno, L.; Molinara, M.; Ria, A.; Simmarano, R.; et al. A novel integrated smart system for indoor air monitoring and gas recognition. In Proceedings of the 2018 IEEE International Conference on Smart Computing (SMARTCOMP), Taormina, Italy, 18–20 June 2018; pp. 470–475. [Google Scholar] [CrossRef]
- Molinara, M.; Ferdinandi, M.; Cerro, G.; Ferrigno, L.; Massera, E. An End to End Indoor Air Monitoring System Based on Machine Learning and SENSIPLUS Platform. IEEE Access 2020, 72204–72215. [Google Scholar] [CrossRef]


Publisher’s Note: MDPI stays neutral with regard to jurisdictional claims in published maps and institutional affiliations. |
© 2021 by the authors. Licensee MDPI, Basel, Switzerland. This article is an open access article distributed under the terms and conditions of the Creative Commons Attribution (CC BY) license (https://creativecommons.org/licenses/by/4.0/).
Share and Cite
Manfredini, G.; Ria, A.; Bruschi, P.; Gerevini, L.; Vitelli, M.; Molinara, M.; Piotto, M. An ASIC-Based Miniaturized System for Online Multi-Measurand Monitoring of Lithium-Ion Batteries. Batteries 2021, 7, 45. https://0-doi-org.brum.beds.ac.uk/10.3390/batteries7030045
Manfredini G, Ria A, Bruschi P, Gerevini L, Vitelli M, Molinara M, Piotto M. An ASIC-Based Miniaturized System for Online Multi-Measurand Monitoring of Lithium-Ion Batteries. Batteries. 2021; 7(3):45. https://0-doi-org.brum.beds.ac.uk/10.3390/batteries7030045
Chicago/Turabian StyleManfredini, Giuseppe, Andrea Ria, Paolo Bruschi, Luca Gerevini, Michele Vitelli, Mario Molinara, and Massimo Piotto. 2021. "An ASIC-Based Miniaturized System for Online Multi-Measurand Monitoring of Lithium-Ion Batteries" Batteries 7, no. 3: 45. https://0-doi-org.brum.beds.ac.uk/10.3390/batteries7030045