Article

Identification of Degradation Mechanisms by Post-Mortem Analysis for High Power and High Energy Commercial Li-Ion Cells after Electric Vehicle Aging

1
CEA—Commissariat à l’Energie Atomique et aux Energies Alternatives, LITEN—Laboratoire d’Innovation pour les Technologies des Energies Nouvelles et les Nanomatériaux, DEHT—Département de l’Electricité et de l’Hydrogène pour les Transports, Grenoble Alpes University, F-38000 Grenoble, France
2
ZSW—Zentrum für Sonnenenergie und Wasserstoff-Forschung Baden-Württemberg, D-89081 Ulm, Germany
3
CEA—Commissariat à l’Energie Atomique et aux Energies Alternatives, LRM—Laboratoire de Résonance Magnétique, MEM—Laboratoire Modélisation et Exploration des Matériaux, IRIG—Institut de Recherche Interdisciplinaire de Grenoble, Grenoble Alpes University, F-38000 Grenoble, France
4
IMP UB RAS—M.N. Miheev Institute of Metal Physics of Ural Branch of Russian Academy of Sciences, 620137 Ekaterinburg, Russia
*
Authors to whom correspondence should be addressed.
Submission received: 27 May 2021 / Revised: 17 June 2021 / Accepted: 8 July 2021 / Published: 16 July 2021
(This article belongs to the Special Issue Lithium-Ion Batteries Aging Mechanisms, 2nd Edition)

Abstract

:
Driven by the rise of the electric automotive industry, the Li-ion battery market is in strong expansion. This technology does not only fulfill the requirements of electric mobility, but is also found in most portable electric devices. Even though Li-ion batteries are known for their numerous advantages, they undergo serious performance degradation during their aging, and more particularly when used in specific conditions such as at low temperature or high charging current rates. Depending on the operational conditions, different aging mechanisms are favored and can induce physical and chemical modifications of the internal components, leading to performance decay. In this article, the identification of the degradation mechanisms was carried out thanks to an in-depth ante- and post mortem study on three high power and high energy commercial 18,650 cells. Li-ion cells were aged using a battery electric vehicle (BEV) aging profile at −20 °C, 0 °C, 25 °C, and 45 °C in accordance with the international standard IEC 62-660, and in calendar aging mode at 45 °C and SOC 100%. Internal components recovered from fresh and aged cells were investigated through different electrochemical (half-coin cell), chemical (EDX, GD-OES, NMR), and topological (SEM) characterization techniques. The influence of power and energy cells’ internal design and Si content in the negative electrode on cell aging has been highlighted vis-à-vis the capacity and power fade.

1. Introduction

Li-ion batteries with graphite-based negative electrodes are today largely widespread in electric mobility applications due to their higher energy density and durability than other storage systems. Currently the main developments in Li-ion batteries concerns the increase of their power density and lifetime by introducing new positive electrode materials or adding silicon in the negative electrode. Lifetime is more particularly studied because certain environmental and operational conditions favor some degradation mechanisms inside the cell that can accelerate the capacity fade [1,2]. Indeed, depending on the cycling and storage conditions, different aging mechanisms can be activated and degrade the electrode components (loss of active materials) or their interfaces (loss of cyclable lithium). The two main side reactions that irreversibly consume cyclable lithium take place at the graphite-based negative electrodes: the solid electrolyte interphase (SEI) growth and the lithium plating phenomenon.
Many research groups have already studied the impact of cell usage conditions on degradation mechanism especially regarding Li plating [3,4,5,6,7], SEI growth [8,9,10,11], or positive electrode degradation [11,12,13,14]. A state-of-the-art of the knowledge in this field based on those studies, and others, is given in the literature [1,15,16]. They demonstrate that low temperature, high charging current, and high state of charge favor Li plating [3,4,5,6,7]. Different methods, including (i) coulometric efficiency measurement [17,18], (ii) analysis of the cell voltage relaxation profile in the post-charge rest period [18,19,20], (iii) analysis of the high voltage plateau on the stripping discharge [18,19,20], and (iv) differential voltage analysis by post-treating the voltage profile [3,4,18] provide evidence of anode lithium plating. Lithium-plating phenomenon can be also studied by performing electrochemical tests in a three-electrode cell [18]. Indeed, monitoring the anode potential can be considered as an indicator of the occurrance of lithium plating which can thermodynamically emerge when the anode potential drops below 0 V (vs. Li/Li+). Some characterization techniques can be more particularly used to detect anode lithium plating: (i) scanning electron microscopy (SEM) images allow to observe the morphology of the deposit on the electrode surface [6,18], (ii) nuclear magnetic resonance spectroscopy (NMR) can detect metallic lithium [6,18,19], and (iii) neutron diffraction [18,19] correlates the changing LiC12 and LiC6 peak intensities in relaxation with Li plating. Such techniques can be performed operando or on the anode by post mortem analysis. Energy dispersive X-ray spectroscopy (EDX) or X-ray photoelectron spectroscopy (XPS) are not able to detect Li metal without ambiguity. EDX analyses can highlight a higher oxygen percentage on an electrode surface covered by lithium deposit than on a surface without deposit [21]. Additionally, XPS analysis provides indirectly the presence of lithium metal detected as Li oxides in the O1s and Li1s spectra [22].
The SEI growth mainly consumes cyclable lithium. This phenomenon is favored at a high state of charge (SOC) and at high temperature cycling or storage [8,9,10,11]. The characterization of the SEI can be achieved by electrochemical techniques such as (i) EIS measurement [23,24,25] or (ii) high precision coulometry efficiency measurement [26]. Furthermore, a large variety of morphological, chemical, and structural characterizations can be performed. For example (i) scanning electron microcopy (SEM) allows to observe the evolution of the surface state of graphite particle after aging [27,28], (ii) transmission electron microscopy (TEM) [29,30], and (iii) atomic force microscopy (AFM) [31] can be used to evaluate the SEI thickness.
Another aging mechanism already studied in the literature can be responsible for capacity fading: the deformation and mechanical stress in electrode materials [32]. During cycling, lithiation/delithiation induce dilatation/contraction of the electrode active material which can lead to active material fracture, loss of contact with current collectors, and exposure of fresh electrode surface causing a continuous formation of SEI [32,33,34].
However, most of these studies focused on a few specific aging conditions regarding the temperature, the charging current rate, or the state of charge, which consequently restrict the cell’s range of operation and the degradation mechanisms that will appear within the cell. Moreover, the studies are often based on homemade lab cells with simplified single-sided positive and negative electrode designs and with a restricted number of cells, meaning that the repeatability of results could be questioned. In addition, the post mortem characterization is not systematically performed to identify experimentally the nature of the degradation mechanisms [2].
The objective of the present study is to perform an extended evaluation of the cycling behavior of 18,650 high power and high energy commercial cells at different temperatures and to link the performance decay to the internal degradation mechanisms through post mortem analysis at the electrode scale. To accomplish this, three references of commercial 18650-type Li-ion cells have been considered. The cycling and calendar aging profiles applied are those of the international standard IEC 62-660 for BEV (battery electric vehicle). The representative BEV cycling test was carried out at various temperatures (−20 °C, 0 °C, 25 °C, 45 °C) from SOC 0–20% to 100%. For the calendar test, the storage was carried out at SOC 100% and at 45 °C. The same aging protocols were applied to the three cell references in order to obtain easily comparable results. Ante mortem and post mortem analyses at the electrode scale, including electrochemical tests in half-coin cell, SEM, EDX, GD-OES, XRD, and Li NMR characterizations, were performed in order to clearly identify the main aging mechanism(s) that led to the cell performance fading.

2. Material and Methods

The three chosen commercial cells are from SAMSUNG SDI: INR18650-30Q (noted 30Q thereafter), INR18650-32E (noted 32E thereafter) and INR18650-35E (noted 35E thereafter) and are issued from their same respective production batches. The choice of the same manufacturer was made to ensure that the mechanical design, the separator and the electrolyte composition of the three cell references are similar. To access these internal characteristics, all three reference cells were analyzed. The obtained design characteristics are detailed in the ante mortem section.
The cells were aged using a BEV (battery electric vehicle) representative cycling test according to the international standard IEC 62-660 at various temperatures (−20 °C, 0 °C, 25 °C, 45 °C). The calendar aging was carried out at 45 °C, either at constant voltage (CV) at 4.2 V, or at 100% SOC in open circuit voltage (OCV, meaning that the voltage is not maintained constantly). The voltage difference between CV and OCV calendar aging is between 0.02 V and 0.1 V maximum after 6 weeks aging. The cycling is representative of a typical driving cycle including a CC-CV charge and a discharge profile with current pulses that simulate acceleration (discharge) and braking (charge) phases. As described in the standard IEC 62-660, the cycling test is stopped once the cell has lost at least 20% of its initial performance in terms of capacity, energy or power density, or after 6 months of cycling. The storage test is stopped in calendar conditions after 18 weeks. State of health assessment via electrical performance measurements were realized at 25 °C every 28 days of cycling and every 6 weeks for calendar aging. Such electrical measurements allow tracking of the evolution of some relevant cell characteristics: capacity, internal resistance, and nominal voltage. Every aging profile was performed on 15 cells for each condition. The cycling test and periodical electrical performance measurements were made on a PEC® SBT 05250 test bench (6 V, 50 A).
After aging, the cells were opened in a glove box under Ar atmosphere (H2O and O2 ≤ 10 ppm). Samples were extracted from each cell electrodes and washed two times in DMC to remove the lithium salt. Electrochemical characterizations were performed on both positive and negative electrodes extracted from fresh and aged cells in coin cell vs. metallic lithium. All electrode disks have been sampled in the middle of the electrode length to avoid being impacted by very local heterogeneities that may more particularly appear in the core area of the winding. The laboratory test bench used was a modular potentiostat/galvanostat/EIS VMP3 from Bio-Logic® ([−5 V, +5 V], 400 mA).
SEM and EDX analysis were performed using a LEO 1530 Gemini Zeiss microscope. Images of the negative electrodes were taken with a 5 kV acceleration beam voltage and a working distance of 6.0 mm. Complementary characterizations were done on negative electrodes to clearly identify aging mechanism: 7Li Magic Angle Spinning (MAS) NMR analysis were performed using a Bruker AVANCE III 500 spectrometer with a magnetic field of 11.7 T and a larmor precession frequency of ω0 = 194.37 MHz and elemental depth profiling has been obtained by GD-OES (Spectruma GDA750).

3. Results and Discussion

3.1. Ante Mortem Analysis

Such study requires a thorough knowledge of the initial electrochemical performance and the internal design of the cell. For this reason, we started with a detailed ante mortem analysis. Two representative cells of each reference were taken to undergo electrochemical tests in the aim of determining their initial performances in terms of capacity, internal resistance, and nominal voltage. One cell of each reference was dismantled to recover internal components samples (positive and negative electrodes, separator, and electrolyte). By performing dimensional measurements and physical and chemical analyses, the exact design and chemical composition of the three cells was obtained. All results of ante mortem studies are given in Table 1. Positive and negative active materials were determined by SEM-EDX and XRD analysis. Electrolyte composition was obtained by GC-MS analysis. The nature of the polymer matrix and coated layer were identified by FTIR analysis.
It is noteworthy that the three batches of cells (equal to 100 units for each batch) showed a very low standard deviation (σ) of cell’s characteristics such as weight, capacity, nominal voltage, internal resistance, and energy density, as reported in Table 1. The chemistry of three cells showed similarities regarding the nature of the positive material consisting of a blend in which the principal material was NCA (LiNi0.88Co0.10Al0.02O2). The minority compound of the positive electrode blend was NC (LiNi0.8Co0.2O2) for cells 30Q and NCA (≈LiNi0.78Co0.20Al0.02O2) for cells 32E and 35E. The nature of separator (AlOOH coated PE film) was the same for the three cell references. Some more significant differences were noted concerning the negative electrode that was composed of graphite with silicon oxide content of 4.5%wt for 30Q cell, pure graphite for 32E cell, and graphite with silicon oxide content of 1.5%wt for 35E cell. The electrolyte composition, analyzed by GC-MS, was not exactly the same but two main solvents (EC:DMC) were common to the three cells. FEC was present when silicon oxide was present at the negative electrode (30Q and 35E). All of them contained succinonitrile in low quantities. This is an additive known to improve the thermal stability and broaden the oxidation electrochemical window of electrolyte [35]. A low amount of methyl propionate as an additive to improve the low temperature performance [36] was detected only in the 32E cell. The cell design was very different for the three references. The 30Q cell had the thinnest and therefore the longest electrodes compared to 35E and 32E cells, which gave it a power design with the ability to accept high currents. On the other hand, 35E and 32E cells had an energy design as the electrodes were thicker and consequently shorter in length. Such a power design was obtained because the thickness of the negative electrode could be reduced by the presence of a silicon compound whose high specific capacity made it possible to obtain a high surface capacity. In the case of the 35E cell, the lower quantity of silicon in the negative electrode led to an increase in its surface capacity, a decrease in its thickness, and consequently allowed association of it to a more loaded positive electrode. Such design is representative of an energy design more advanced than the 32E design where the negative electrode is pure graphite and consequently thicker that the 35E negative electrode.

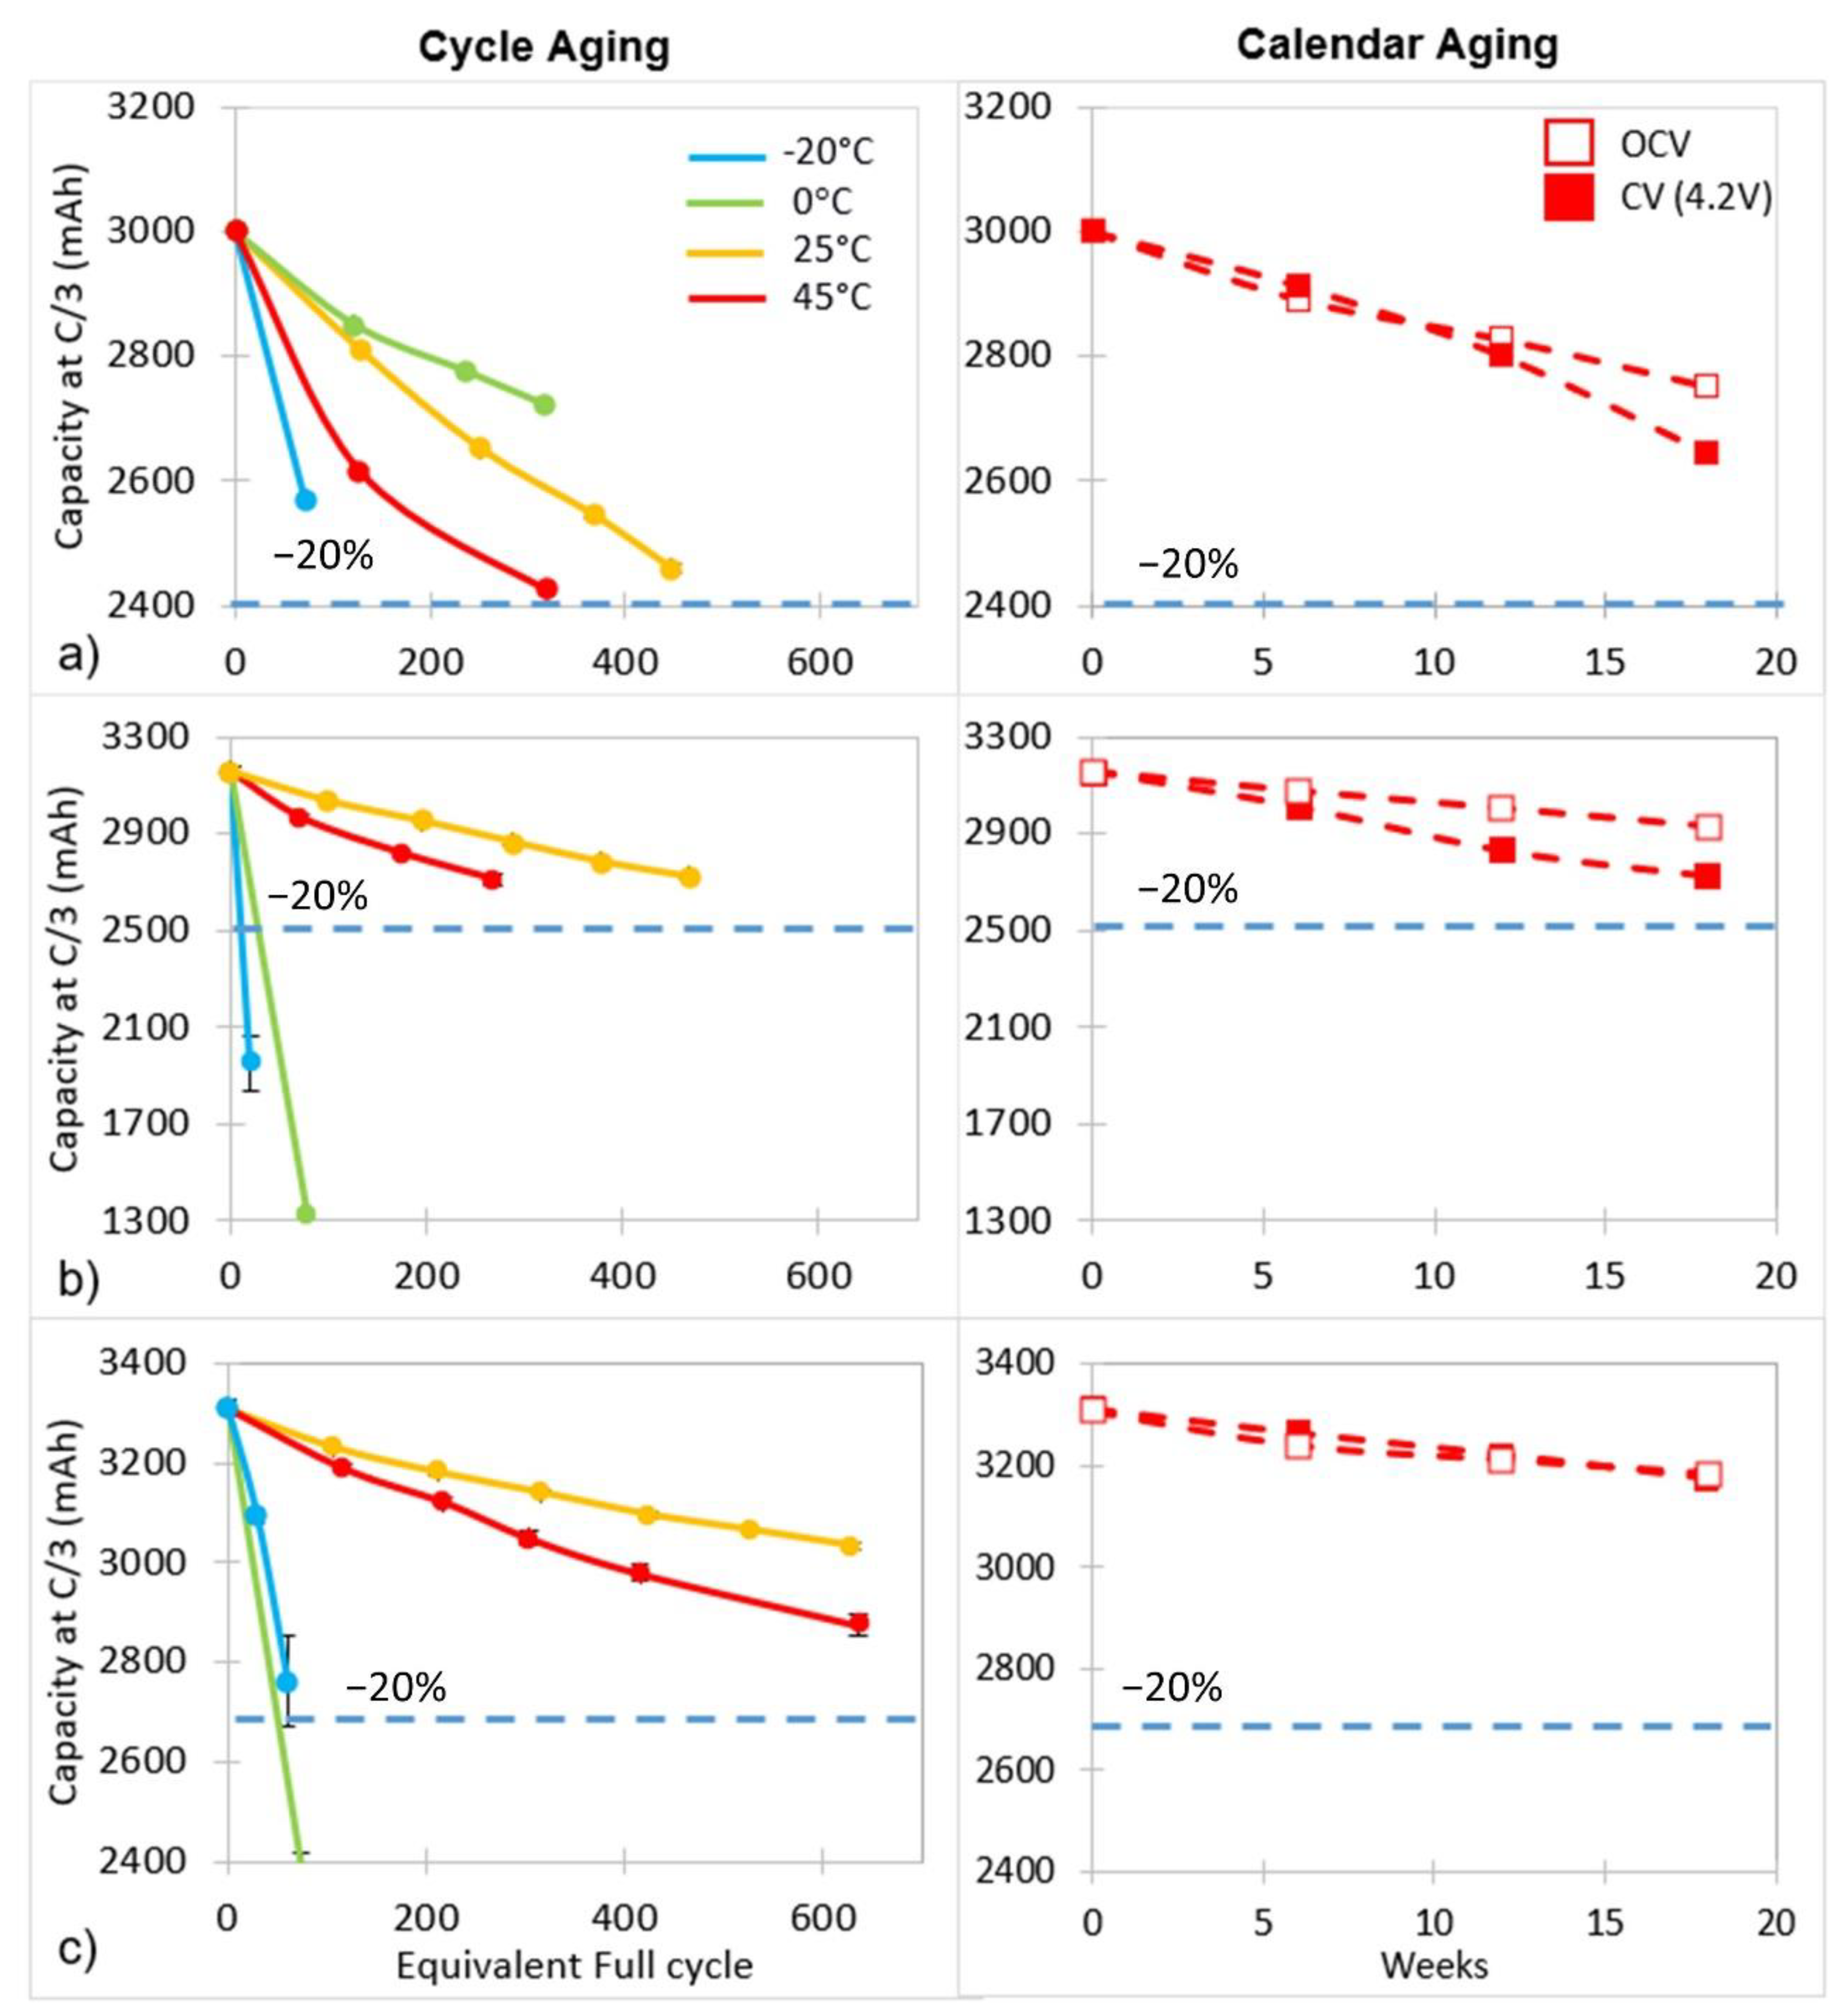
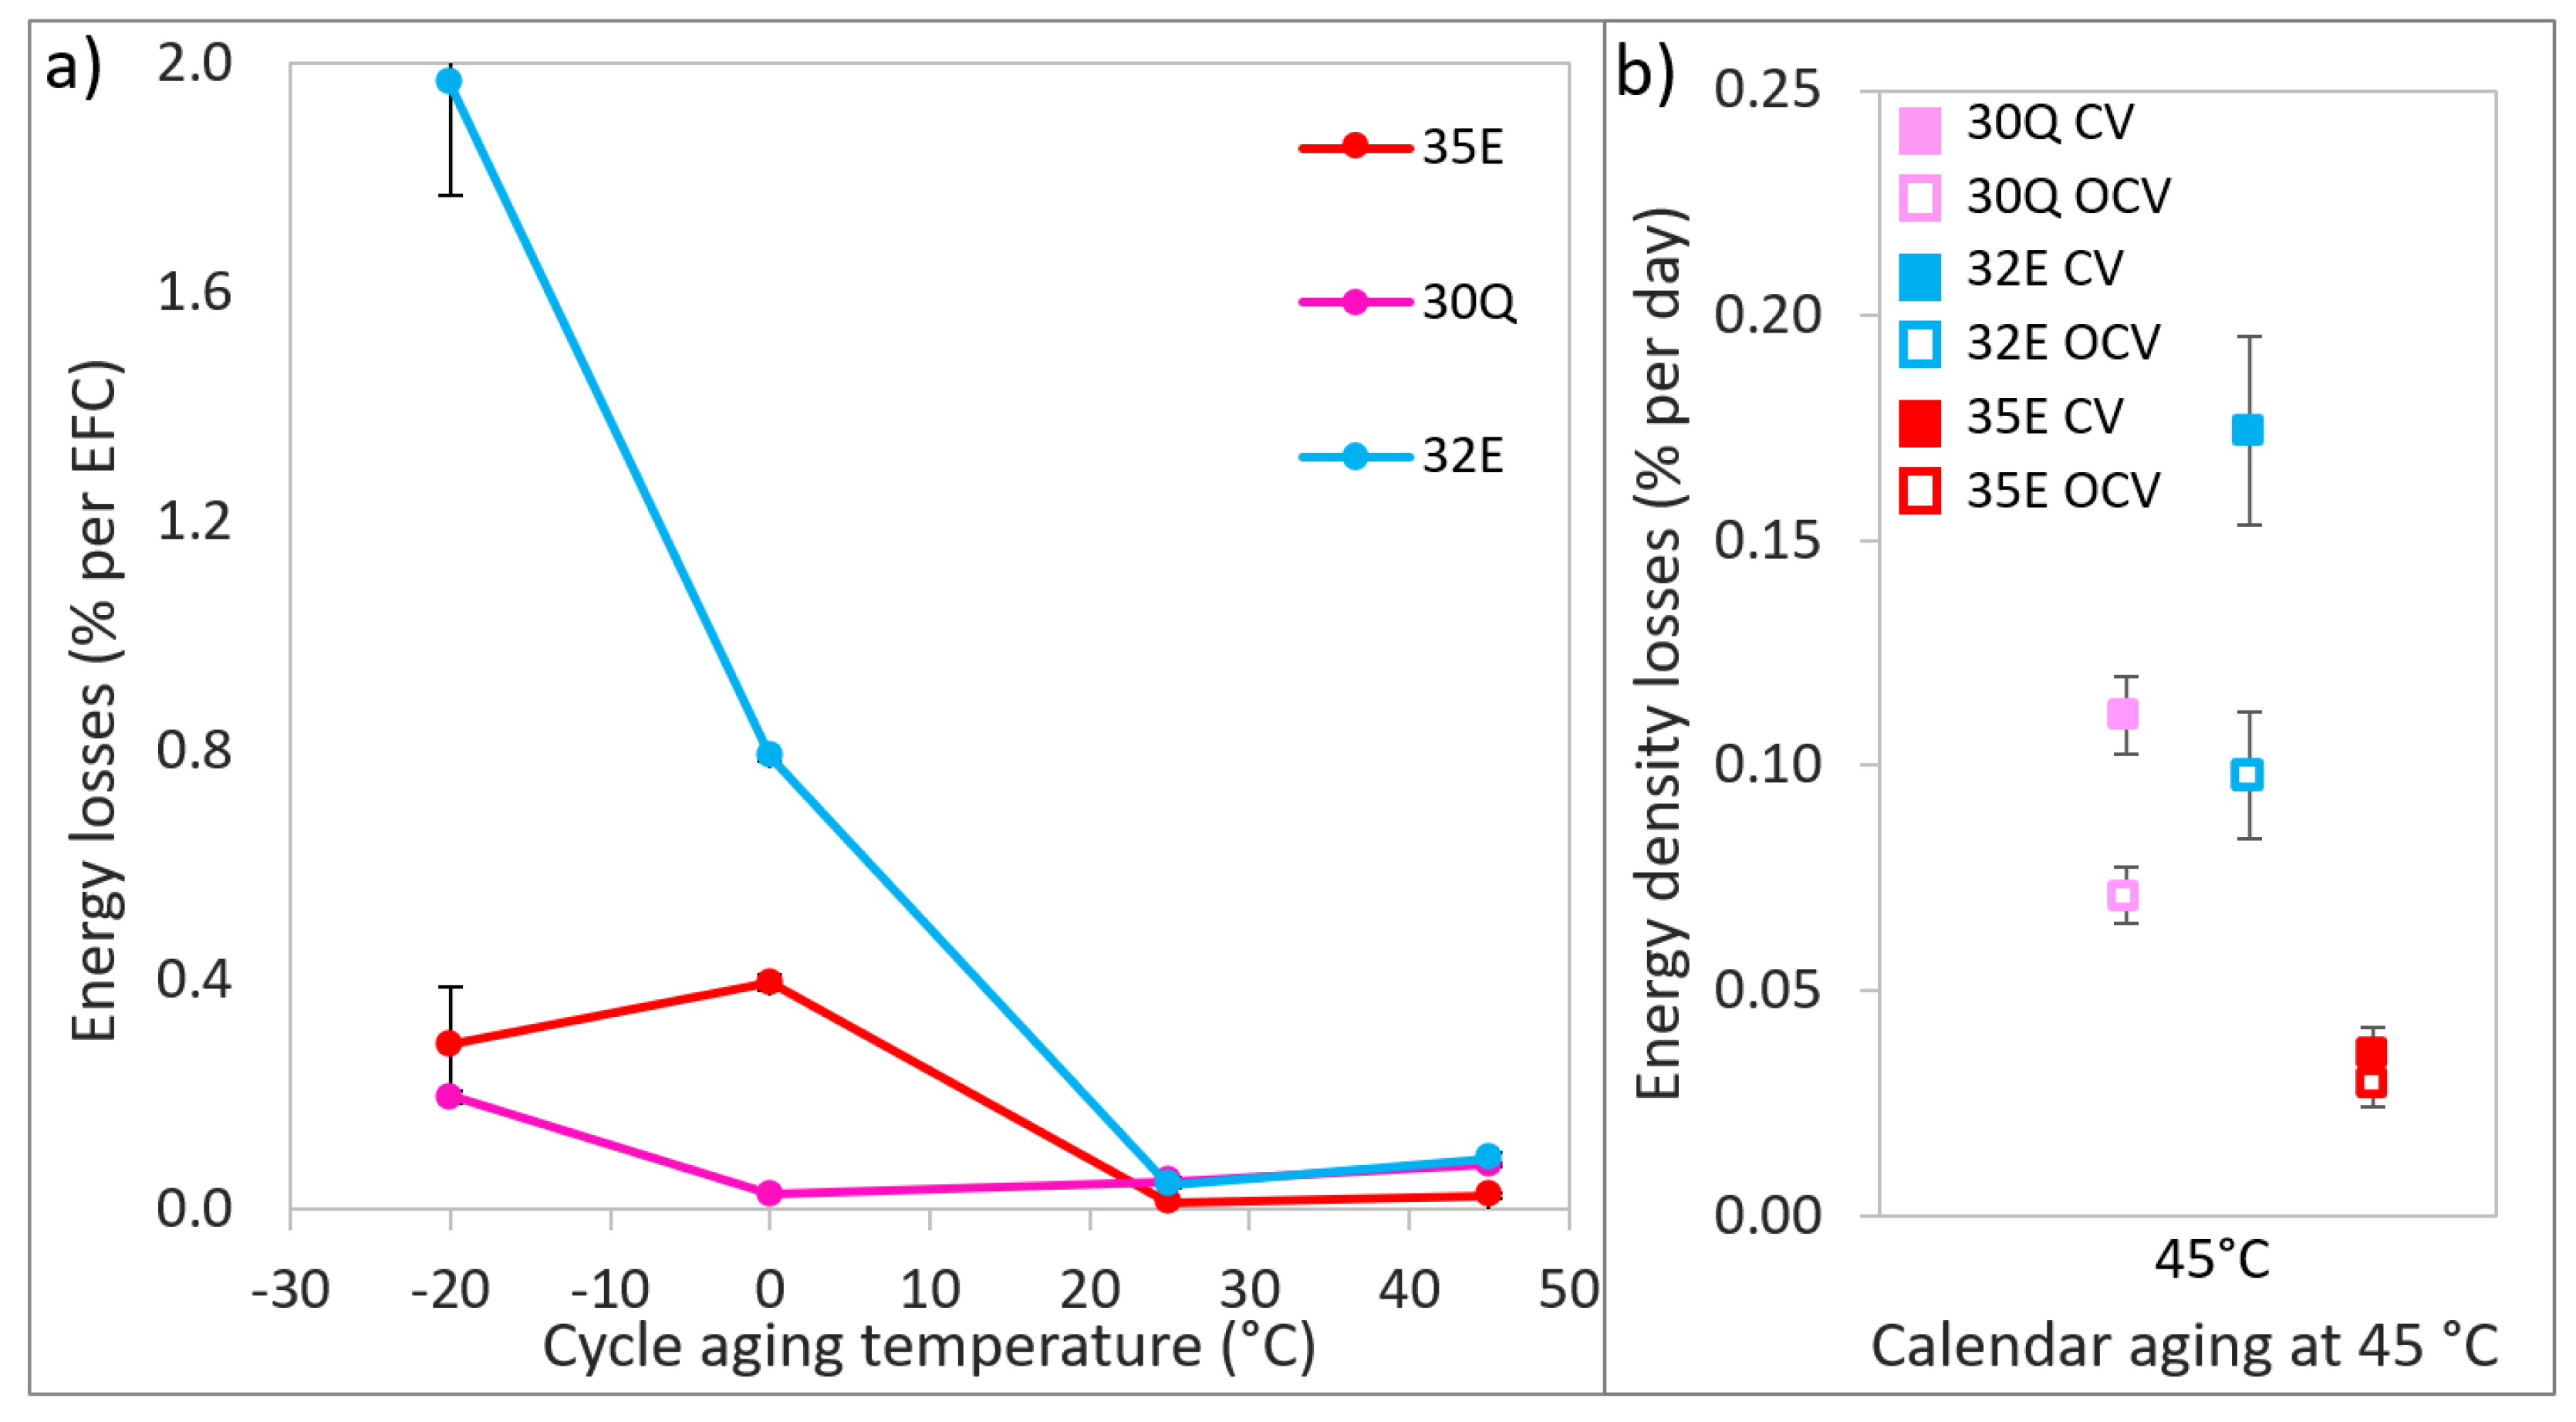
3.2. Aging and Cell Performance Monitoring

Aging effects on cell performance were followed all along the tests. The cell performance evolution is presented in Figure 1. It is noteworthy that each mark on the curves is the average value of the parameter considered measured on 15 cells for each temperature condition. The standard deviation is indicated by an error bar and reached a maximum value of ±3.3% for 35E cell values at −20 °C, but is mostly less than ±1%.
The behavior in cycling is given in Figure 1 (left curves). Cycling at very low temperature (−20 °C) is very harmful. At high temperature cycling (45 °C) the cell performance decreases quite quickly: the effective capacity decreases by about 20% after 300 equivalent cycles for cell 30Q. When cycling at 0 °C and 25 °C, the evolution of 30Q cell capacity is less pronounced: capacity fading is approximately 10% at 0 °C and 15% at 25 °C after 300 equivalent cycles. All those results are in agreement with the manufacturer data sheets [37] which specify a lifetime equal to 250 cycles with charging conditions between 0 °C and 50 °C. After 18 weeks of calendar aging at 45 °C (Figure 1, right curves) and for the three cell references, the loss of capacity is approximately 10%. As expected, capacity decay during calendar aging is less pronounced than for cycling aging, but not negligible. The performance fading is generally slower during calendar aging than during cycling at the same temperature and the same test time. Calendar aging in CV is more damaging than in OCV. Considering the individual behavior of the three cell references, 32E and 35E cells show a quite different cycling behavior compared to the 30Q cell. They present a fast decay of capacity at 0 °C and, in contrast, very slow performance losses at 25 °C and 45 °C. The calendar aging of 35E cell is very weak compared to the others.
The internal resistance and the nominal voltage were also monitored during aging and their evolution are accessible in the Supplementary Materials, respectively in Figures S1 and S2. Regarding the internal resistance measurements, we observe that aging impacts the internal resistance with the same trend for the three cell references. The internal resistance increases more significantly during cycling especially at high temperatures (25 °C and 45 °C). For example, the 30Q cell internal resistance increases approximately by about 35% after cycling at 0 °C and −20 °C and by about 160% after cycling at 25 °C and 45 °C. Calendar aging is also more particularly stressful under CV condition. For example, the 30Q cell internal resistance increases by 60% in OCV and by 175% in CV. In terms of the internal resistance variation, 18 weeks of calendar aging at 4.2 V and 45 °C is equivalent to 320 cycles at the same temperature. The evolution of nominal voltage shows similarities for the three references. At high temperatures (25 °C and 45 °C), in cycling and calendar aging, the nominal voltage decreases while in cycling at low temperatures (0 °C and −20 °C) the nominal voltage does not show significant changes. For example, the 30Q cell nominal voltage falls down by about 0.1 V after cycling at 45 °C and increases only about 0.01 V after cycling at −20 °C.
The performance of the three cell references are combined in the Figure 2. Cell energy losses during cycling and calendar aging are plotted in function of the operating temperatures. The cell energy depends on both capacity and nominal voltage parameters. Cycling at −20 °C induces faster energy losses of 2% per EFC (Equivalent Full Cycle) for 32E cell than for 35E cell and also for 30Q cell that exhibit a similar loss of 0.2% per EFC. At 0 °C both energy cells, the 32E and the 35E, have significant losses whereas the 30Q power cell is not damaged. Whatever the cell reference is, cycling at 25 °C and 45 °C do not induce huge energy losses; 0.02% per EFC and 0.08% per EFC respectively. According to Figure 2, we can state that the power cell has an optimal working temperature range between 0 °C and 25 °C while the energy cell operates best between 25 °C and 45 °C. Energy losses during calendar aging at 45 °C are not negligible and are included between 0.03% per day and 0.18% per day. The constant voltage (CV) calendar aging is most degrading than the open circuit voltage (OCV) calendar aging.
Lower temperatures are more detrimental and it is crucial to evaluate the importance of the degradation mechanisms leading to the performance decay. Post mortem analysis have been thus performed.

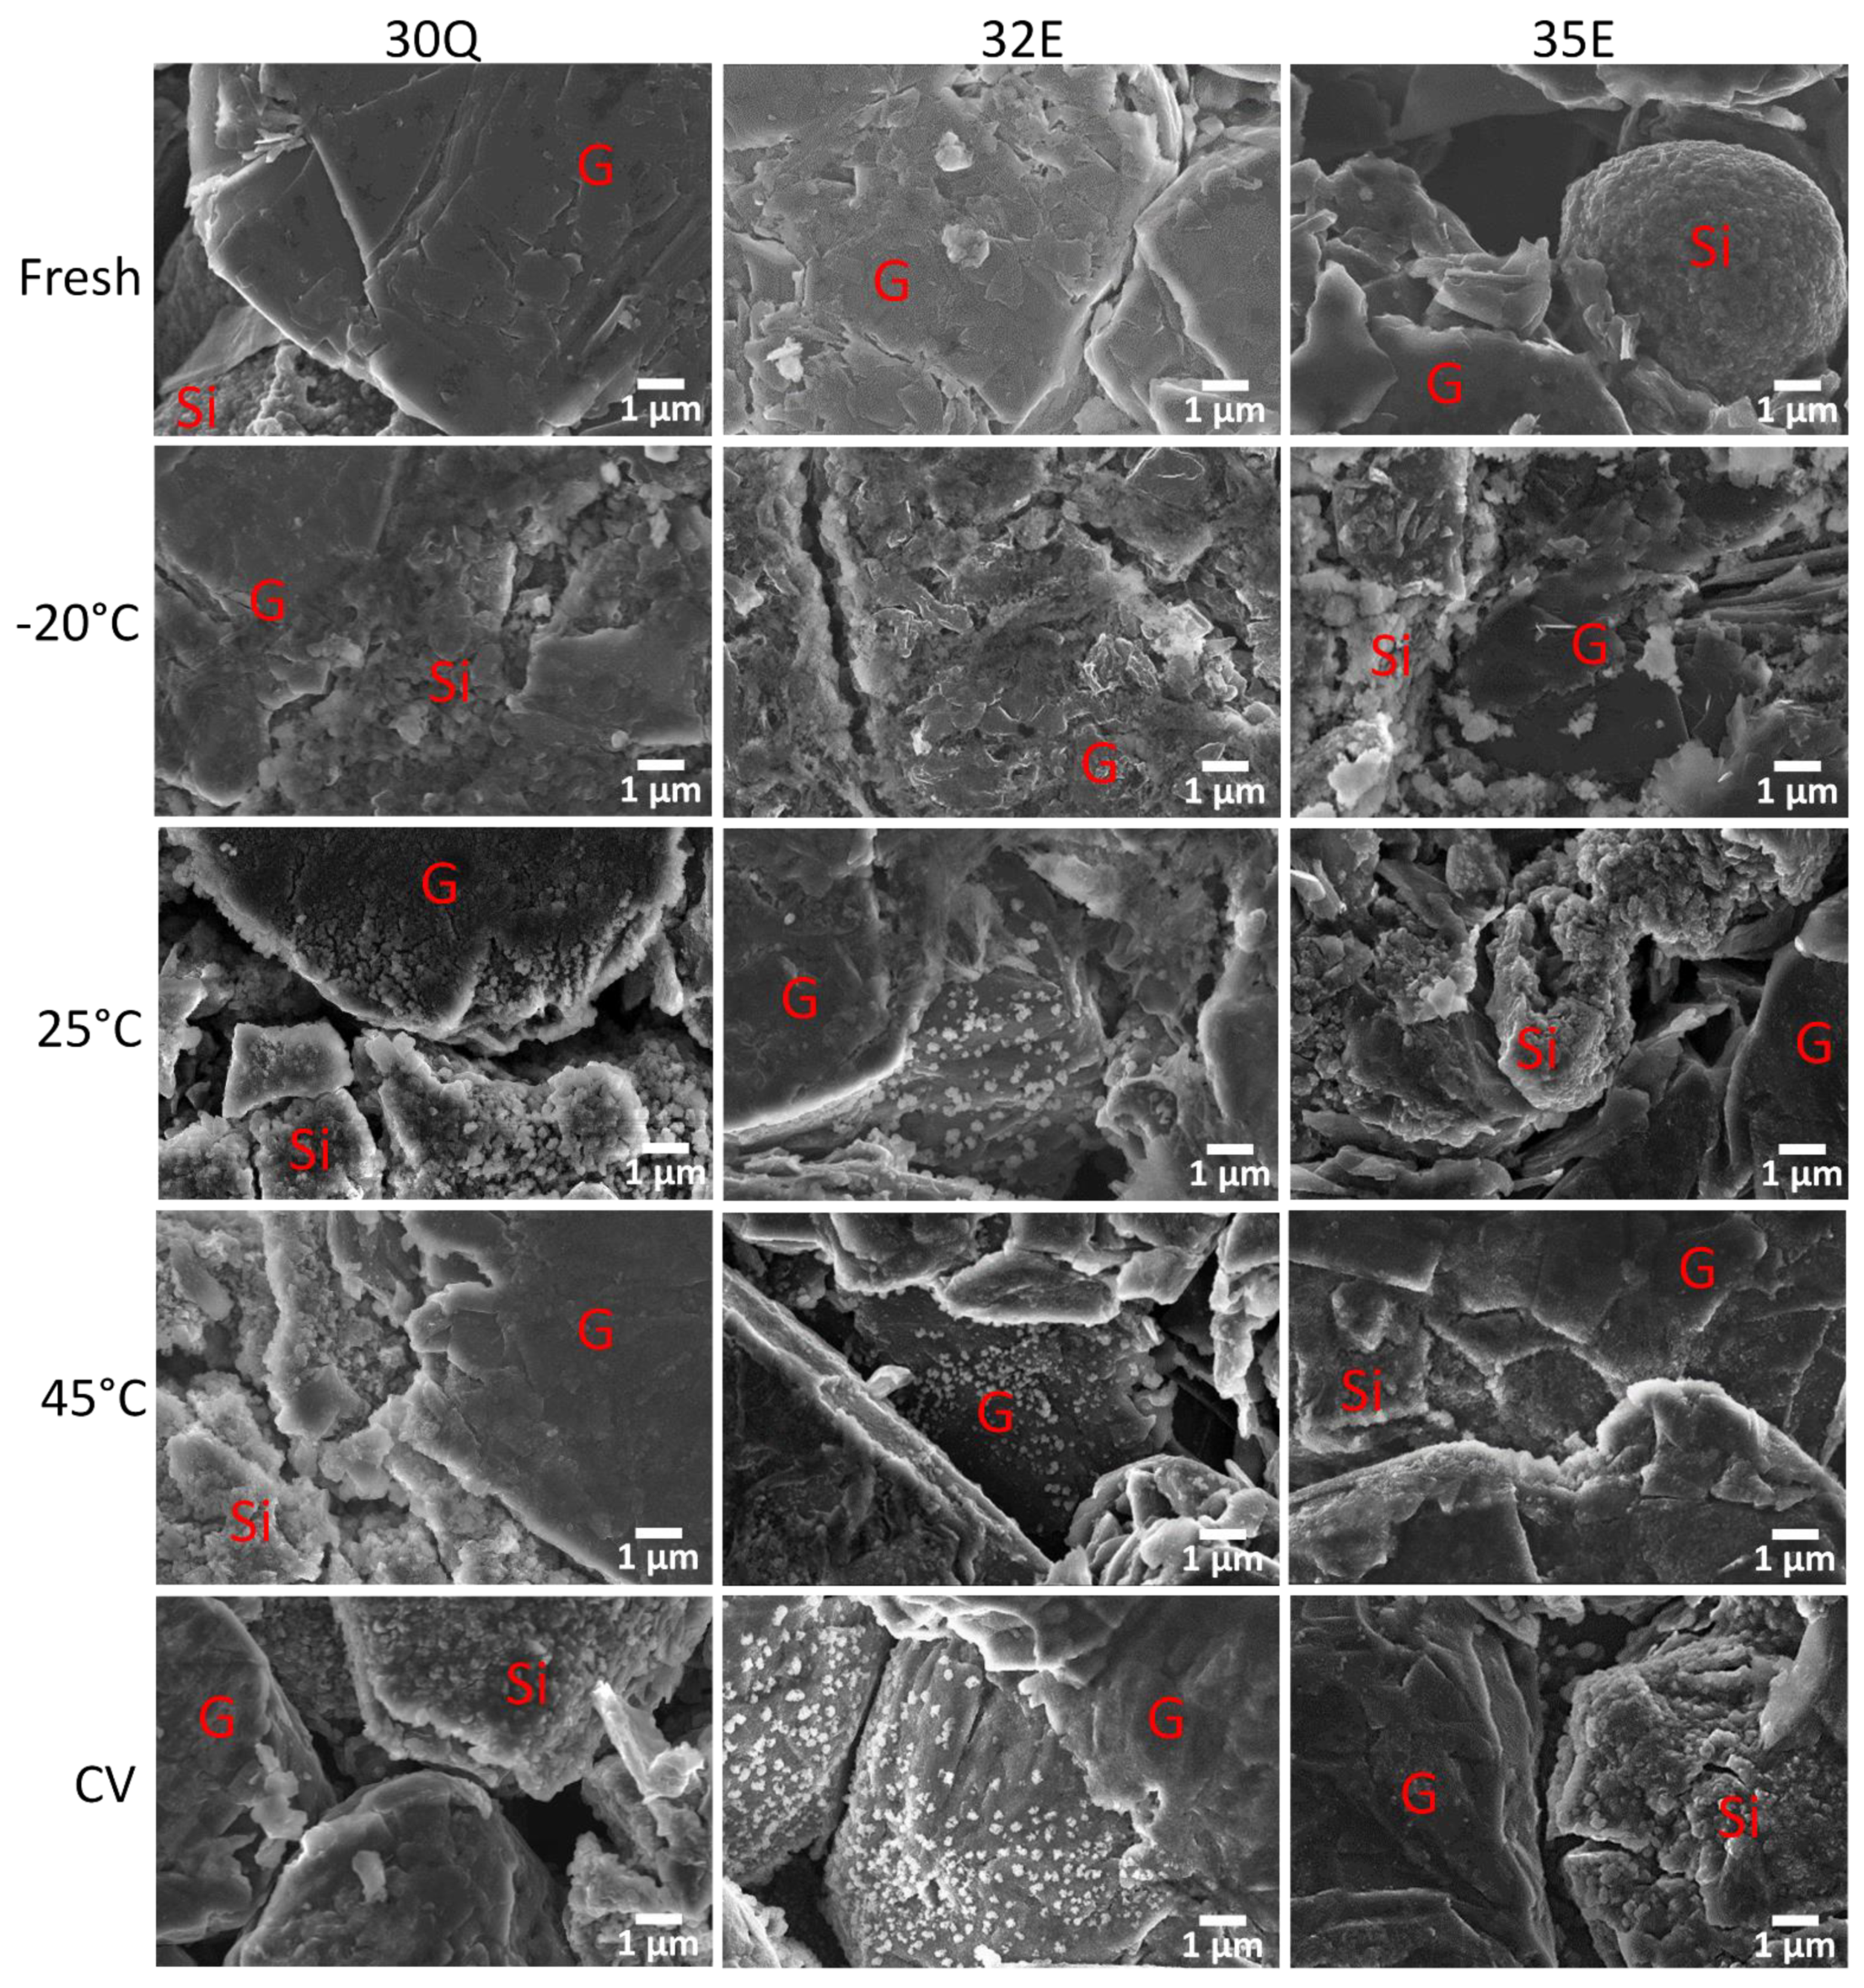
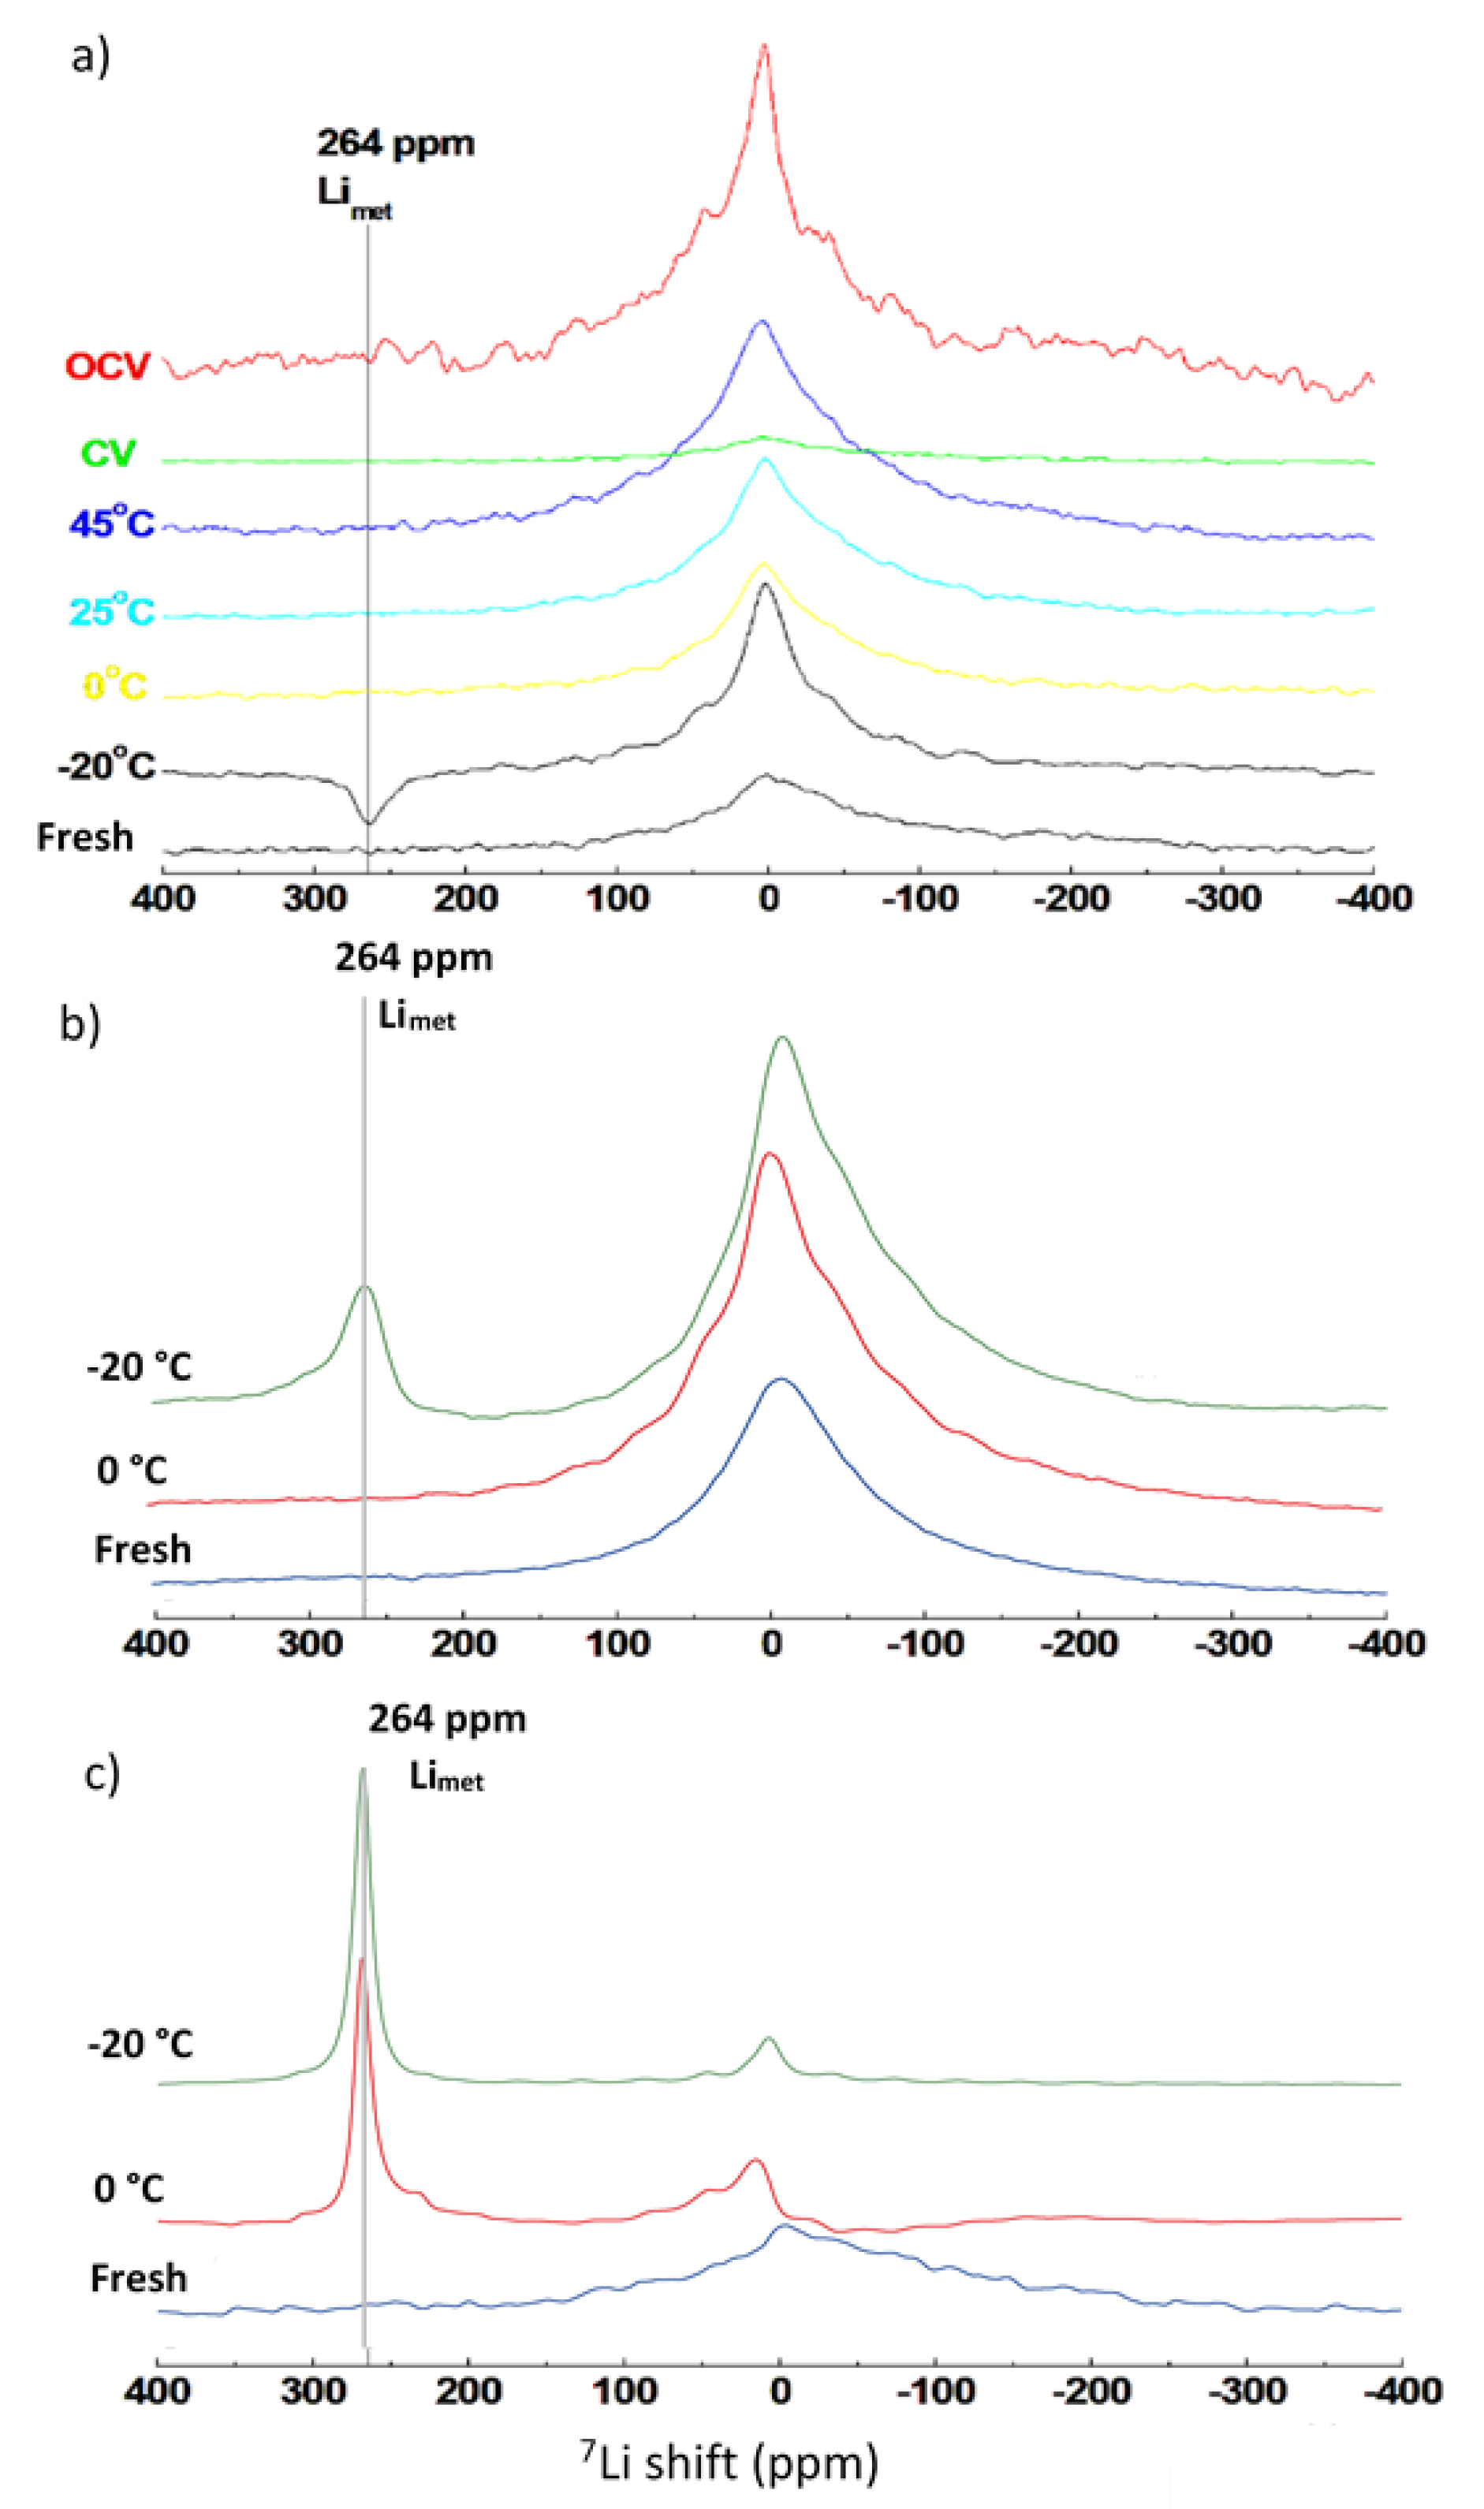
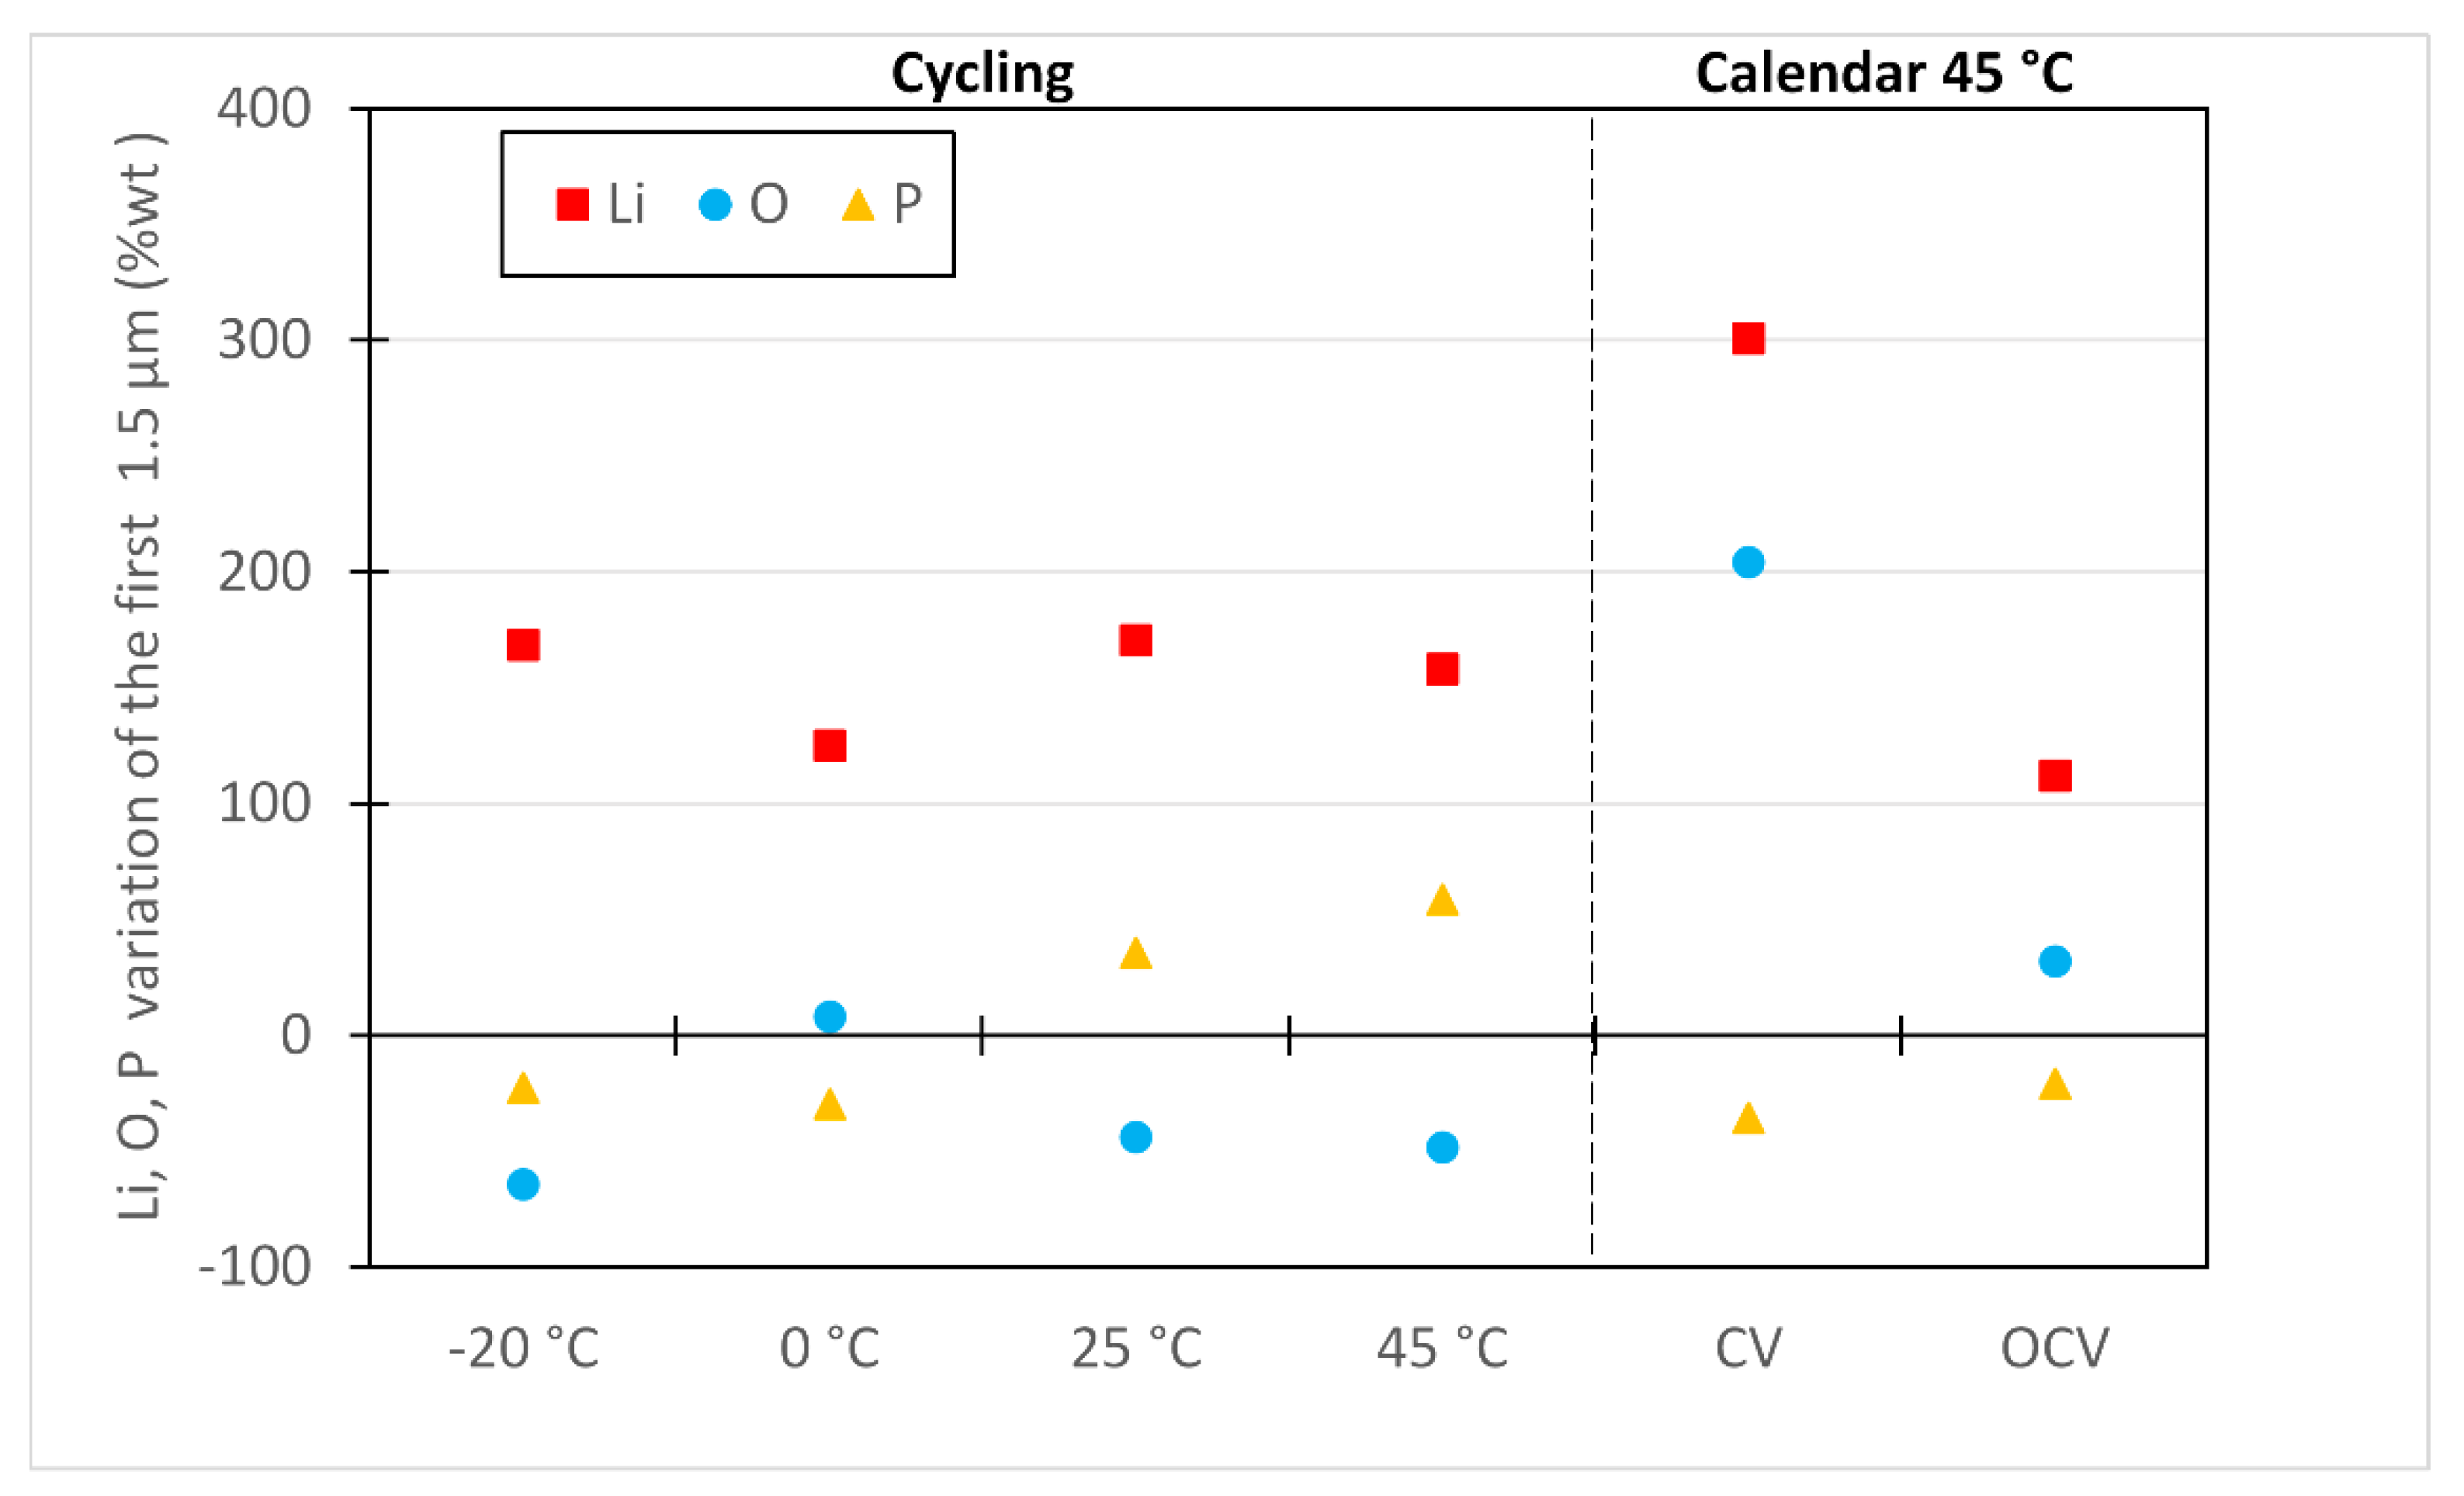
3.3. Post Mortem Analysis

Aged cells are disassembled at 0% SOC and samples from negative and positive electrodes are cut out in order to achieve all further electrochemical, physical, and chemical analyses. Figure 3 compares the potential profiles vs. metallic Li in half cells of the fresh and aged electrodes for the three cell types. For a better clarity, only four key aging conditions are represented (cycling at −20 °C, 25 °C, 45 °C and calendar aging under CV at 45 °C).
Regarding the positive electrode, similar behaviors are shown after aging for the three cell types. The aging at low temperature (−20 °C) did not change significantly the potential profile of the positive electrode, which means that cycling at low temperature did not induce any degradation on this level. However, aging at high temperature (45 °C) impacted the potential profile of the positive electrode with a significant increase in the electrode polarization observed after aging at 25 °C and 45 °C. The voltage drop was approximately equal to 0.1 V in lithiation for the three references cycled at 45 °C. Such positive electrode evolution has been reported in the literature [38]. This voltage drop was smaller for the electrode from the cell aged in calendar mode (CV) at 45 °C. Therefore, we can assume that on the positive electrode level, aging at high temperature (25 °C, 45 °C cycling and 45 °C calendar CV) causes damages to active material, whereas aging at low temperature did not cause significant damages. This damaging could be attributed to interfacial phenomena leading to changes in the kinetic properties of the active material.
Regarding the negative electrode, the aging impacted slightly more significantly the negative electrode profiles for 30Q and 35E cells after cycling at low temperature (−20 °C) and calendar aging under CV (45 °C), while the impact on 32E negative electrode seemed to be more negligible. That impact resulted in a small polarization causing voltage drop (0.03 V) in the last LiC12/LiC6 potential plateau (~60–80% SOC) [39,40,41] in lithiation and in the Si feature (~20% SOC) in delithiation. This feature is specifically indicative of the crystalline Li15Si4 phase, which was formed (at 0.053 V) during lithiation of amorphous α-LixSi and dissipates (at 0.4 V) on delithiation [42]. It is noteworthy that the 0.4 V feature during delithiation was more affected for the 30Q cell that contains a higher amount of silicon. The difference in potential profile characteristics after aging affected how the limiting lower cutoff potential intervened, impacting differently the lithiation condition of Si particles. Considering that, we can assume that the cycling at low temperature (−20 °C) and calendar aging at high temperature (45 °C) damaged the negative active material.
In a first approach, SEM, EDX, and XRD analysis reveal (not presented here) that the positive electrode did not have significant morphological and structural changes after aging, as already noted in the literature for similar aging conditions [43]. As mentioned above, the suspected aging mechanisms on the positive electrode responsible for the potential profile modification (Figure 3) are a crystalline phase transformation on particle surface through transition metal (Ni, Co, Al) dissolution [15,44,45] and/or CEI (cathode–electrolyte interface) growth [46] during high temperature aging. One and/or the other phenomenon could be confirmed by implementing characterization techniques at the atomic scale (high-resolution TEM) or at the surface chemistry scale of the material (XPS).
Because the negative electrode focuses the major degradation mechanisms at an electrode scale [15,47], post mortem analysis was focused on that electrode and highlighted some morphological and chemical changes within the electrode. Figure 4 represents the EDX cartography performed on the three fresh negative electrodes extracted from the cell 30Q, 35E, and 32E. EDX cartography and spot analysis allow identification of graphite and silicon particles. The graphite particles have a smooth and angular aspect in contrast to the silicon particles, which are rather rough and spherical. Once the particles are identified, their evolution after aging can be observed. Figure 5 shows the SEM images of fresh and aged negative electrode surface from the three cells (30Q, 32E and 35E). For better readability, only four key aging conditions are represented (cycled at −20 °C, 25 °C, 45 °C, and 45 °C calendar CV).
After cycling at −20 °C, a deposit covering the particle surface was visible for the three cell types. This deposit appeared very important because it partially masked the surface particles and the empty space between particles. Regarding the 30Q and 35E electrodes, the Si particles did not seem as visible as in the fresh electrode but appear fragmented. After cycling aging at 0 °C, a more scattered surface deposition was observable. After aging at 45 °C (cycle and calendar), the particle’s surface states looked puffy due to a film surface deposition associated with SEI growth as already reported in the literature [8,9,10,11,48]. This surface film deposition was observable for all aged electrodes. Although the electrodes were washed before being analyzed, 32E electrodes cycled at 25 °C, and to a lesser extent after calendar aging under OCV at 45 °C, showed extra deposition attributed to salt residue.
On the negative electrodes, morphological surface modifications are thus observed for all aging conditions but are possibly the consequence of two different degradation mechanisms, i.e., lithium metal deposition partially or totally oxidized by contact reaction with electrolytes at low temperature and SEI growth at high temperature as largely reported in the literature [4]. XRD analysis revealed (not presented here) that the graphite particles of the negative electrode did not have significant structural changes after aging. However, it is not excluded that graphite cracks or exfoliation of the graphene edges had occurred [27,28]. To detect the presence of metallic “dead” lithium, 7Li MAS NMR was performed. Furthermore, to gain information on the nature and the thickness of this covering film, elemental depth profiling of the electrode surface were obtained by GD-OES (Glow Discharge–Optical Emission Spectroscopy). GD-OES is thus very information rich. However, dure to the rare availability of this technique, only one reference cell was investigated. The choice was made to characterize in priority the 30Q cell electrode containing the greater amount silicon in weight.
The direct detection signal acquisition mode for 7Li MAS NMR measurements induces a significant phase shift for large chemical displacements (264 ppm). This is why here the peak associated with lithium metal is downwards (Figure 6a). The phase can then be corrected so that the peak rotates upwards Figure 6b,c, but this produces baseline distortions. This is of no consequence given that the objective of this analysis is simply to detect the presence of metallic lithium. Metallic Li is observed after aging at −20 °C for 30Q, 32E, and 35E cells, and also after aging at 0 °C for 32E cell.
Figure 7 shows the evolution of the surface composition for the elements Li, O, and P of the cell 30Q after different aging conditions measured by GD-OES. The integration of the first 1.5 µm of the electrode surface (i.e., near the separator) was observed and gave indications about the main aging mechanisms taking place at each aging condition. For comparison, single sided coating of this electrode is 45 µm thick.
After cycling at −20 °C, the amount of Li is higher whereas the quantity of O and P is lower comparing to other cycling aging conditions. This could possibly indicate the formation of lithium plating in sufficient quantity so that a part of it, not oxidized by electrolyte, remains active in metallic form. However, in the case of anodes containing Si, the GD-OES method is not capable of identifying Li depositions clearly due to formation of Li silicates [49]. A method development into this direction is currently on the way at ZSW’s labs.
For 25 °C and 45 °C, the Li content is similar like for −20 °C; however, the contents of P is higher. In combination with the observed low O content, this indicates SEI growth by salt degradation considering the chemical reaction below [50,51].
LiPF 6 + 2 x   e + 2 x   Li +   x + 1 LiF +   Li x PF 5 x
At 0 °C, the quantity of Li is similar as for −20 °C and 25 °C, but not the quantity of O and P. Most likely, this temperature is in a range where neither one nor the other main aging mechanism is dominating. This matches with the slow cell performance decay at this temperature. NMR shows that Li is not in a metallic state for aging at 0 °C. The detected Li could originate from a low quantity of deposited lithium totally oxidized by reaction with the organic molecules of the electrolyte.
At 45 °C calendar aging, the increase of Li coupled with the increase of O and the decrease of P could reveal a SEI growth rather by solvent degradation than by degradation of conductive salt. This mechanism seems to be more pronounced under the CV than under the OCV condition, according to the chemical reactions below [50,51].
EC : 2 CH 2 O 2 CO + 2 e + 2 Li + CH 2 OCO 2 Li 2 +   C 2 H 4  
DMC :   CH 3 OCO 2 CH 3 + e + Li + CH 3 OCO 2 Li +   CH 3
DEC :   CH 3 CH 2 OCO 2 CH 2 CH 3 + e + Li + CH 3 CH 2 OCO 2 Li   +   CH 3 CH 2
The arrow notation in the reaction schemes refers to solid products that become part of the SEI layer (↓), and to gaseous products removed from the surface (↑). The dot notation (•) in the reaction schemes refers to free radicals which are not stable and will react with another compound in their environment.
Figure 8 shows the GD-OES depth profiles for silicon of the fresh and aged negative electrodes for the 30Q cell. The Si concentration of the negative electrode surface (near the separator) has changed after aging. After cycling at −20 °C and 0 °C, the Si content has increased relatively to the fresh cell. This could be related to the Si particle cracking observed on SEM images and to the migration of soluble Si species from them to the electrode surface. Whereas after aging at 25 °C and 45 °C (cycling and calendar aging) the Si content decreases on the electrode surface probably due to the growth and dissolution of SEI layers.
It is noteworthy that the Si content, which is initially well distributed in negative electrode depth in form of the Si particles [49], was found to be more concentrated on the electrode surface after the formation, as well as the low and high temperature aging. This migration is most likely related to the formation of Li-silicates [49,52], which consume cyclable Li as described by the chemical reaction below.
5 SiO + 6 Li Li 2 O +   Li 4 SiO 4 + 4 Si
5 SiO 2 + 4 Li   2 Li 2 Si 2 O 5 + Si
In the investigated electrodes, there is the additional effect of Si particle fragmentation, which could possibly increase this effect at low temperatures. On the other hand, the Si compounds on the surface are partly soluble [49], which is likely to be increased at high temperatures.
In view of the information obtained, a schematic representation of the main degradation mechanism on the negative electrode surface according to the aging conditions can be proposed in Figure 9. At low temperature cycling, lithium plating and silicon particle cracking are the two dominant aging mechanisms. It can be expected that at higher C-rates both mechanisms become more pronounced [53,54]. At high aging temperatures, SEI growth is the main aging degradation mechanism, but the origin of this mechanism seems to be different for cycling and calendar aging. During cycling, the salt degradation is the origin of the thickening of the SEI layer. However, during calendar aging, it is the solvent decomposition that is responsible for the same mechanism. Another observed aging mechanism on silicon particles is the formation of Li silicates, especially at high temperature.

4. Conclusions

Ante- and post mortem characterizations have provided essential insight to link aging conditions to degradation mechanisms. Thanks to these results, an identification of the degradation mechanisms was performed on three commercial 18,650 cell types after aging according to a BEV (battery electric vehicle) aging profile in cycling at −20 °C, 0 °C, 25 °C, 45 °C, and in calendar aging conditions at 45 °C and SOC 100%. The complementary information obtained from electrochemical, morphological (SEM) and chemical (EDX, GD-OES, and NMR) characterization techniques allowed to identify the main aging mechanisms for each aging condition.
The main degradations are located at the negative electrode and are manifested by the growth of SEI, either by solvent degradation during high temperature calendar aging, or by the growth of SEI by salt degradation during high temperature cycling. The deposition of lithium metal for low temperature cycling leading to the formation of a secondary SEI is identified. In addition, silicon particles suffer significantly during cycling aging at low temperature through particle cracking and disaggregation.
The internal design of the cell influences the aging mechanisms, as high energy cells are more exposed at low temperature to lithium metal deposition due to their thicker electrodes coating which decrease the electrodes’ kinetics.

Supplementary Materials

The following are available online at https://0-www-mdpi-com.brum.beds.ac.uk/article/10.3390/batteries7030048/s1, Figure S1: Internal resistance evolution of (a) 30Q, (b) 32E and (c) 35E cells during their cycle (left curves) and calendar (right curves) aging. Internal resistance was measured with the voltage drop at the end of a 10 s current pulse at Imax., Figure S2: Nominal Voltage evolution of (a) 30Q, (b) 32E and (c) 35E cells during their cycle (left curves) and calendar (right curves) aging.

Author Contributions

P.K.: Conceptualization, methodology, experimentation, data curation, writing, supervision. O.R., T.W., M.W.-M. and P.A.: Conceptualization, methodology, and supervision. K.R., M.B. and A.B.: experimentation, data curation. S.G.: Conceptualization, methodology, experimentation, writing, and supervision. All authors have read and agreed to the published version of the manuscript.

Funding

This research was funded by the research center CEA LITEN. One part of the experiment has been performed in the framework of the European project TEESMAT under Grant Agreement N° 814106 in partnership with the research center ZSW. AB is kindly grateful to the Ministry of Science and Higher Education of Russian Federation (Theme No. AAAA-A19-119012990095-0) for support.

Data Availability Statement

The data are not publicly available.

Acknowledgments

The authors sincerely thank Marc Haber for proofreading the publication.

Conflicts of Interest

The authors declare no conflict of interest.

References

  1. Schlasza, C.; Ostertag, P.; Chrenko, D.; Kriesten, R.; Bouquain, D. Review on the aging mechanisms in li-ion batteries for electric vehicles based on the FMEA method. In Proceedings of the 2014 IEEE Transportation Electrification Conference and Expo, Dearborn, MI, USA, 15–18 June 2014. [Google Scholar]
  2. Waldmann, T.; Iturrondobeita, A.; Kasper, M.; Ghanbari, N.; Aguesse, F.; Bekaert, E.; Daniel, L.; Genies, S.; Jiménez Gordon, I.W.; Löble, M.; et al. Review-Post-Mortem Analysis of Aged Lithium-Ion Batteries: Disassembly Methodology and Physico-Chemical Analysis Techniques. J. Electrochem. Soc. 2016, 163, A2149–A2164. [Google Scholar] [CrossRef]
  3. Ecker, M.; Shafiei Sabet, P.; Sauer, D.U. Influence of operational condition on lithum plating for commercial lithium-ion batteries —Electrochimical experiments and post-mortem-analysis. Appl. Energy 2017, 206, 934–946. [Google Scholar] [CrossRef]
  4. Petzl, M.; Danzer, M.A. Nondestructive detection, characterization, and quantification of lithium plating in commercial lithium-ion batteries. J. Power Sources 2014, 254, 80–87. [Google Scholar] [CrossRef]
  5. Rangarajan, S.P.; Barsukov, Y.; Mukherjee, P.P. In operando signature and quantification of lithium plating. J. Mater. Chem. A 2019, 7, 20683–20695. [Google Scholar] [CrossRef]
  6. Matadi, B.P.; Geniès, S.; Delaille, A.; Chabrol, C.; de Vito, E.; Bardet, M.; Martin, J.-F.; Daniel, L.; Bultel, Y. Irreversible Capacity Loss of Li-Ion Batteries Cycled at Low Temperature Due to an Untypical Layer Hindering Li Diffusion into Graphite Electrode. J. Electrochem. Soc. 2017, 164, A2374–A2389. [Google Scholar] [CrossRef]
  7. Senyshyn, A.; Mühlbauer, M.J.; Dolotko, O.; Ehrenberg, H. Low-temperature performance of li-ion batteries: The behavior of lithiated graphite. J. Power Sources 2015, 282, 235–240. [Google Scholar] [CrossRef]
  8. Peled, E.; Menkin, S. Review-SEI: Past, Present and Future. J. Electrochem. Soc. 2017, 164, A1703–A1719. [Google Scholar] [CrossRef]
  9. Grolleau, S.; Delaille, A.; Gualous, H.; Gyan, P.; Revel, R.; Julien, B.; Redondo-Iglesias, E.; Peter, J. Calendar aging of commercial graphite/LiFePO4 cell- predicting capacity fade under time depenent storage conditions. J. Power Sources 2013, 255, 450–458. [Google Scholar] [CrossRef]
  10. Eddahech, A.; Briat, O.; Vinassa, J.-M. Performance comparison of four lithium-ion battery technologies under calendar aging. Energy 2015, 84, 542–550. [Google Scholar] [CrossRef]
  11. Klett, M.; Erikson, R.; Groot, J.; Svens, P.; Ciosek Högstrom, K.; Wreland Lindström, R.; Berg, H.; Torbjörn, G.; Lindbergh, G.; Edström, K. Non-uniform aging of cycled commercial LiFePO4//graphite cylindrical cells revealed by post-mortem analysis. J. Power Sources 2014, 257, 126–137. [Google Scholar] [CrossRef]
  12. Buchberger, I.; Seidlmayer, S.; Pokharel, A.; Piana, M.; Hattendorff, J.; Kudejova, P.; Gilles, R.; Gasteiger, H.A. Aging Analysis of Graphite LiNiMnCoO Cells Using XRD, PGAA, and AC Impedance. J. Electrochem. Soc. 2015, 162. [Google Scholar] [CrossRef]
  13. Liu, L.; Li, M.; Chu, L.; Bing, J.; Lin, R.; Zhu, X.; Cao, G. Layered tenary metal oxides: Performance degradation mechanisms as cathodes, and design strategies for high-performance batteries. Prog. Mater. Sci. 2020. [Google Scholar] [CrossRef]
  14. Wohlfahrt-Mehrens, M.; Vogler, C.; Garche, J. Aging mechanisms of tlithium cathode materials. J. Power Sources 2004, 127, 58–64. [Google Scholar] [CrossRef]
  15. Kabir, M.M.; Demirocak, D.E. Degradation mechanisms in Li-ion batteries: State-of-the art review. Int. J. Energy Res. 2017, 41, 1963–1986. [Google Scholar] [CrossRef]
  16. Barré, A.; Deguilhem, B.; Grolleau, S.; Gérard, M.; Suard, F.; Riu, D. A review on lithium-ion battery ageing mechanisms and estimations for automotive application. J. Power Sources 2013, 241, 680–689. [Google Scholar] [CrossRef] [Green Version]
  17. Burns, J.C.; Stevens, D.A.; Dahn, J.R. In-Situ Detection of Lithium Plating Using High Precision Coulometry. J. Electrochem. Soc. 2015, 162, A959–A964. [Google Scholar] [CrossRef]
  18. Janakiraman, U.; Garrick, T.R.; Fortier, M.E. Review—Lithium Plating Detection Methods in Li-Ion Batteries. J. Electrochem. Soc. 2020, 167, 160552. [Google Scholar] [CrossRef]
  19. Waldmann, T.; Hogg, B.-I.; Wohlfahrt-Mehrens, M. Li plating as unwanted side reaction in commercial Li-ion cells—A review. J. Power Sources 2018, 384, 107–124. [Google Scholar] [CrossRef]
  20. Schindler, S.; Bauer, M.; Petzl, M.; Danzer, M.A. Voltage relaxation and impedance spectroscopy as in-operando methods for the detection of lithium plating on graphitic anodes in commercial lithium-ion cells. J. Power Sources 2016, 304, 170–180. [Google Scholar] [CrossRef]
  21. Campbell, I.D.; Marzook, M.; Marinescu, M.; Offer, G.J. How Observable Is Lithium Plating? Differential Voltage Analysis to Identify and Quantify Lithium Plating Following Fast Charging of Cold Lithium-Ion Batteries. J. Electrochem. Soc. 2019, 166, A725–A739. [Google Scholar] [CrossRef]
  22. Profatilova, I.; De Vito, E.; Genies, S.; Vincens, C.; Gutel, E.; Fanget, O.; Martin, A.; Chandesris, M.; Tulodziecki, M.; Porcher, W. Impact of Silicon/Graphite Composite Electrode Porosity on the Cycle Life of 18650 Lithium-Ion Cell. ACS Appl. Energy Mater. 2020, 3, 11873–11885. [Google Scholar] [CrossRef]
  23. Zhang, S.S.; Xu, K.; Jow, T.R. EIS study on the formation of solid electrolyte interface in Li-ion battery. Electrochim. Acta 2006, 51, 1636–1640. [Google Scholar] [CrossRef]
  24. Morales-Ugarte, J.E.; Bolimowska, E.; Rouault, H.; Santos-Peña, J.; Santini, C.C.; Benayad, A. EIS and XPS Investigation on SEI Layer Formation during First Discharge on Graphite Electrode with a Vinylene Carbonate Doped Imidazolium Based Ionic Liquid Electrolyte. J. Phys. Chem. C 2018, 122, 18223–18230. [Google Scholar] [CrossRef]
  25. Pastor-Fernandez, C.; Uddin, K.; Chouchelamane, G.H.; Widanage, W.D.; James, M. A Comparison between Electrochemical Impedance Spectroscopy and Incremental Capacity-Differential Voltage as Li-ion Diagnostic Techniques to identify and Quantify the Effects of Degradation Modes within Battery Management Systems. J. Power Sources 2017, 360, 301–318. [Google Scholar] [CrossRef]
  26. Smith, A.J.; Burns, J.C.; Zhao, X.; Xiong, D.; Dahn, J.R. A High Precision Coulometry Study of the SEI Growth in Li/Graphite Cells. J. Electrochem. Soc. 2011, 158, A447. [Google Scholar] [CrossRef]
  27. Stiaszny, B.; Ziegler, J.C.; Krauß, E.E.; Schmidt, J.P.; Ivers-Tiffée, E. Electrochemical characterization and post-mortem analysis of aged LiMn2O4-Li(Ni0.5Mn0.3Co0.2)/graphite lithium ion batteries. Part I: Cycle aging. J. Power Sources 2014, 251, 439–450. [Google Scholar] [CrossRef]
  28. Stiaszny, B.; Ziegler, J.C.; Krauß, E.E.; Zhang, M.; Schmidt, J.P.; Ivers-Tiffée, E. Electrochemical characterization and post-mortem analysis of aged LiMn2O4-Li(Ni0.5Mn0.3Co0.2)/graphite lithium ion batteries. Part II: Calendar aging. J. Power Sources 2014, 258, 61–75. [Google Scholar] [CrossRef]
  29. Dollé, M.; Grugeon, S.; Beaudoin, B.; Dupont, L.; Tarascon, J.-M. In Situ TEM study of the interface carbon/electrolyte. J. Power Sources 2001, 97–98, 104–106. [Google Scholar] [CrossRef]
  30. Nie, M.; Abraham, D.P.; Chen, Y.; Bose, A.; Lucht, B.L. Silicon Solid Electrolyte Interphase (SEI) of Lithium Ion Battery Characterized by Microscopy and Spectroscopy. J. Phys. Chem. C 2013, 117, 13403–13412. [Google Scholar] [CrossRef]
  31. Luchkin, S.Y.; Lipovskikh, S.A.; Katorova, N.S.; Savina, A.A.; Abakumov, A.M.; Stevenson, K.J. Solid-electrolyte interphase nucleation and growth on carbonaceous negative electrodes for Li-ion batteries visualized with in situ atomic force microscopy. Sci. Rep. 2020, 10. [Google Scholar] [CrossRef]
  32. Mukhopadhyay, A.; Sheldon, B.W. Deformation and stress in electrode materials for Li-ion batteries. Prog. Mater. Sci. 2014, 63, 58–116. [Google Scholar] [CrossRef]
  33. Zhou, W.; Hao, F.; Fang, D. The effects of elastic stiffening on the evolution of the stress field within a spherical electrode particle of lithium-ion batteries. Int. J. Appl. Mech. 2013, 05, 1350040. [Google Scholar] [CrossRef]
  34. Zhou, W. Effects of external mechanical loading on stress generation during lithiation in Li-ion battery electrodes. Electrochim. Acta 2015, 185, 28–33. [Google Scholar] [CrossRef] [Green Version]
  35. Chen, R.; Liu, F.; Chen, Y.; Ye, Y.; Huang, Y.; Wu, F.; Li, L. An investigation of functionalized electrolyte using succinonitrile additive for high voltage lithium-ion batteries. J. Power Sources 2016, 306, 70–77. [Google Scholar] [CrossRef]
  36. Smart, M.; Tomcsi, M.R.; Whitcanack, L.D.; Ratnakumar, B.V.; Nagata, M.; Visco, V. The Use of Methyl Propionate-Based Electrolytes with Additives to Improve the Low Temperature Performance of LiNiCoAlO2-Based Li-Ion Cells. Meet. Abstr. 2013, MA2013-02, 1135. [Google Scholar]
  37. Samsung. Specification Sheet INR 18650-30Q 2014. Available online: https://datasheetspdf.com/pdf-file/951041/Samsung/INR18650-30Q/1 (accessed on 15 July 2021).
  38. Radin, M.D.; Hy, S.; Sina, M.; Fang, C.; Liu, H.; Vinckeviciute, J.; Zhang, M.; Whittingham, M.S.; Meng, Y.S.; Van der Ven, A. Narrowing the Gap between Theoretical and Practical Capacities in Li-Ion Layered Oxide Cathode Materials. Adv. Energy Mater. 2017, 7, 1602888. [Google Scholar] [CrossRef] [Green Version]
  39. Shu, Z.X.; Mc Millan, R.S.; Murray, J.J. Electrochemical Intercalation of Lithium into Graphite. J. Electrochem. Soc. 1993, 140, 922–927. [Google Scholar] [CrossRef]
  40. Son, S.; Cao, L.; Yoon, T.; Cresce, A.; Hafner, S.E.; Liu, J.; Groner, M.; Xu, K.; Ban, C. Interfacially Induced Cascading Failure in Graphite-Silicon Composite Anodes. Adv. Sci. 2019, 6, 1801007. [Google Scholar] [CrossRef] [Green Version]
  41. Winter, M.; Besenhard, J.O.; Spahe, M.E.; Novak, P. Insertion Electrode Materials for rechargeable Lithium Batteries. Adv. Mater. 1998, 10, 725. [Google Scholar] [CrossRef]
  42. Klett, M.; Gilbert, J.A.; Pupek, K.Z.; Trask, S.E.; Abraham, D.P. Layered Oxide, Graphite and Silicon-Graphite Electrodes for Lithium-Ion Cells: Effect of Electrolyte Composition and Cycling Windows. J. Electrochem. Soc. 2017, 164, A6095–A6102. [Google Scholar] [CrossRef]
  43. Kuntz, P.; Azais, P.; Genies, S.; Raccurt, O. Evolution of the safety behavior of Li-ion cells after aging. In Proceedings of the 32nd Electric Vehicle Symposium EVS32, Lyon, France, 20–22 May 2019. [Google Scholar]
  44. Balakrishnan, P.G.; Ramesh, R.; Prem Kumar, T. Safety mechanisms in lithium-ion batteries. J. Power Sources 2006, 155, 401–414. [Google Scholar] [CrossRef]
  45. Zhang, S.S. A review on electrolyte additives for lithium-ion batteries. J. Power Sources 2006, 162, 1379–1394. [Google Scholar] [CrossRef]
  46. Zhang, J.-N.; Li, Q.; Wang, Y.; Zheng, J.; Yu, X.; Li, H. Dynamic evolution of cathode electrolyte interphase (CEI) on high voltage LiCoO2 cathode and its interraction with Li anode. Energy Storage Mater. 2018, 14, 1–7. [Google Scholar] [CrossRef]
  47. Birkl, C.R.; Roberts, M.R.; McTurk, E.; Bruce, P.G.; Howey, D.A. Degradation diagnostics for lithium ion cells. J. Power Sources 2017, 341, 373–386. [Google Scholar] [CrossRef]
  48. Vetter, J.; Novak, P.; Wagner, M.R.; Veit, C.; Möller, K.-C.; Besenhard, J.O.; Winter, M.; Wohlfahrt-Mehrens, M.; Vogler, C.; Hammouche, A. Ageing mechanisms in lithium-ion batteries. J. Power Sources 2005, 147, 269–281. [Google Scholar] [CrossRef]
  49. Richter, K.; Waldmann, T.; Kasper, M.; Pfeifer, C.; Memm, M.; Axmann, P.; Wohlfahrt-Mehrens, M. Surface Film Formation and Dissolution in Si/C Anodes of Li-ion Batteries: A Glow Discharge Optical Emission Spectroscopy Depth Profiling Study. J. Phys. Chem. 2019, 18795–18803. [Google Scholar] [CrossRef]
  50. Andersson, A. Surface Phenomena in Li-Ion Batteries. Compr. Summ. Upps. Diss. Fac. Sci. Technol. 2001, 656, 11–12. [Google Scholar]
  51. Aurbach, D.; Markovsky, B.; Shechter, A.; Ein-Eli, Y.; Cohen, H. A Comparative Study of Synthetic Graphite and Li Electrodes in Electrolyte Solutions Based on Ethylene Carbonate-Dimethyl Carbonate Mixtures. J. Electrochem. Soc. 1996, 143, 3809–3820. [Google Scholar] [CrossRef]
  52. Nakagawa, A.; Kuwata, N.; Matsuda, Y.; Kawamura, J. Characterization of Stable Solid Electrolyte Lithium Silicate for Thin Film Lithium Battery. J. Phys. Soc. Jpn. 2010, 79, 98–101. [Google Scholar] [CrossRef]
  53. Klinsmann, M.; Rosato, D.; Kamlah, M.; McMeeking, R.M. Modeling Crack Growth during Li Extraction in Storage Particles Using a Fracture Phase Field Approach. J. Electrochem. Soc. 2016, 163, A102–A118. [Google Scholar] [CrossRef]
  54. Waldmann, T.; Wilka, M.; Kasper, M.; Fleischhammer, M.; Wohlfahrt-Mehrens, M. Temperature dependent ageing mechanisms in Lithium-ion batteries—A Post-Mortem study. J. Power Sources 2014, 262, 129–135. [Google Scholar] [CrossRef]
Figure 1. C/3 capacity fade of (a) 30Q cell; (b) 32E cell; (c) 35E cell during cycling at different temperatures (left) and during calendar aging (right). For cycling, performance parameters are plotted in function of “Equivalent Full Cycle” (EFC) that indicates how many times the cell has restituted its nominal capacity during the cycling test. For calendar aging, they are plotted in function of the number of weeks of storage.
Batteries 07 00048 g001
Figure 2. Comparison of energy losses during (a) cycle and (b) calendar aging in terms of operating temperature for 30Q, 32E and 35E cells (EFC = Equivalent Full Cycle).
Batteries 07 00048 g002
Figure 3. Cycling curve of positive and negative electrodes vs. lithium for fresh and aged cells for references (a) 30Q, (b) 32E, and (c) 35E in CC-CV (C/10-C/50).
Batteries 07 00048 g003
Figure 4. EDX cartography of fresh negative electrodes of cell (a) 30Q, (b) 35E, and (c) 32E for the identification of graphite (red) and silicon (green) particle.
Batteries 07 00048 g004
Figure 5. SEM images of fresh and aged negative electrode for 30Q, 32E, and 35E cells.
Batteries 07 00048 g005
Figure 6. 7Li NMR measurements of negative electrodes after aging for (a) 30Q, (b) 35E, and (c) 32E cells.
Batteries 07 00048 g006
Figure 7. Relative variation compares to fresh cell of Li, O, and P in the 30Q negative electrode surface after aging as measured by GD-OES depth profiling.
Batteries 07 00048 g007
Figure 8. Si concentration of the surface (0.3 first µm) for fresh and aged negative electrodes from 30Q cell.
Batteries 07 00048 g008
Figure 9. Schematic representation of main aging degradation mechanisms of negative electrode for different aging conditions.
Batteries 07 00048 g009
Table 1. Cell characteristics (Note that the standard deviation σ is given).
30Q Cell32E Cell35E Cell
Manufacturer data sheet
Voltage limits (V)2.5–4.22.5–4.22.65–4.2
Maximal current
discharge-charge (A)
15–46.4–3.28–2
Temperature range (°C)0–500–450–45
Lifetime (cycles)250300500
Measured data
Batch of cells average (σ = standard deviation)
Weight (g)45.83 (σ = 0.04)47.93 (σ = 0.06)47.88 (σ = 0.04)
Capacity at C/3 (mAh)3025 (σ = 9)3158 (σ = 25)3328 (σ = 19)
Nominal voltage at C/3 (V)3.63 (σ = 0.01)3.65 (σ = 0.01)3.61 (σ = 0.01)
Rint (1 kHz) at 50% SOC (mΩ)13.73 (σ = 0.13)21.71 (σ = 0.10)22.28 (σ = 0.22)
Rint (pulse) at 50% SOC 5A-5 ms (mΩ)15.38 (σ = 0.34)26.89 (σ = 0.44)26.39 (σ = 0.45)
Energy at C/3 (Wh)10.92 (σ = 0.01)11.48 (σ = 0.17)11.98 (σ = 0.11)
Positive electrode
Dimensions790 × 58 mm610 × 58 mm560 × 59 mm
Thickness45 µm65 µm73 µm
ChemistryNCANCANCA
Specific capacity (mAh/cm2)3.144.624.86
Negative electrode
Dimensions810 × 59 mm660 × 59, 5 mm610 × 60 mm
Thickness44 µm87 µm75 µm
ChemistryGraphite
4.5%w SiOx
GraphiteGraphite
1.5%w SiOx
Specific capacity (mAh/cm2)3.104.814.94
Electrolyte
Solvent10EC:7.5DMC:
7.5FEC
10FEC:7DMC:
4EC:4PC
10DMC:7EC:
3EMC:2FEC
AdditiveSuccinonitrileMethyl propionate SuccinonitrileSuccinonitrile
Separator
MatrixPEPEPE
Coated layerAlOOHAlOOHAlOOH
Publisher’s Note: MDPI stays neutral with regard to jurisdictional claims in published maps and institutional affiliations.

