
In-Situ Tools Used in Vanadium Redox Flow Battery Research—Review
by
 ,
,
Purna C. Ghimire
1,*, 
Arjun Bhattarai
1,*, 
Tuti M. Lim
2,
Nyunt Wai
3,
Maria Skyllas-Kazacos
4 and
Qingyu Yan
5,* 1
V-flow Tech Pte Ltd., Singapore, 1 Cleantech Loop, Singapore 637141, Singapore
2
School of Civil and Environmental Engineering, Nanyang Technological University, 50 Nanyang Avenue, Singapore 639798, Singapore
3
Energy Research Institute @Nanyang Technological University, 1 Cleantech Loop, Singapore 637141, Singapore
4
School of Chemical Engineering, The University of New South Wales, Sydney 2052, Australia
5
School of Material Science and Engineering, Nanyang Technological University, Singapore 637141, Singapore
*
Authors to whom correspondence should be addressed.
Batteries 2021, 7(3), 53; https://0-doi-org.brum.beds.ac.uk/10.3390/batteries7030053
Submission received: 17 March 2021
/
Revised: 29 June 2021
/
Accepted: 22 July 2021
/
Published: 4 August 2021
(This article belongs to the Special Issue Redox Flow Batteries for Large-Scale Energy Storage)
Abstract
:Progress in renewable energy production has directed interest in advanced developments of energy storage systems. The all-vanadium redox flow battery (VRFB) is one of the attractive technologies for large scale energy storage due to its design versatility and scalability, longevity, good round-trip efficiencies, stable capacity and safety. Despite these advantages, the deployment of the vanadium battery has been limited due to vanadium and cell material costs, as well as supply issues. Improving stack power density can lower the cost per kW power output and therefore, intensive research and development is currently ongoing to improve cell performance by increasing electrode activity, reducing cell resistance, improving membrane selectivity and ionic conductivity, etc. In order to evaluate the cell performance arising from this intensive R&D, numerous physical, electrochemical and chemical techniques are employed, which are mostly carried out ex situ, particularly on cell characterizations. However, this approach is unable to provide in-depth insights into the changes within the cell during operation. Therefore, in situ diagnostic tools have been developed to acquire information relating to the design, operating parameters and cell materials during VRFB operation. This paper reviews in situ diagnostic tools used to realize an in-depth insight into the VRFBs. A systematic review of the previous research in the field is presented with the advantages and limitations of each technique being discussed, along with the recommendations to guide researchers to identify the most appropriate technique for specific investigations.
1. Introduction
The rapid development of industries for more than two centuries has heavily relied on the exploitation of fossil fuels. Due to strong concerns over substantial environmental impact and energy sustainability associated with fossil fuel consumption, there has been a worldwide consensus that renewable energy sources are crucial to social-economic development. Unlike conventional power plants, renewable sources such as solar and wind are intermittent, with electricity production depending on climatic conditions and time. These problems necessitate the integration of renewable generation with storage during production and delivery on demand. With the rapid increase in renewable energy generation, mainly due to the sharp decline in solar photovoltaic (PV) cost, utilities are looking for solutions to address grid instability and poor reliability presented by integrating renewable sources. This has led to the need for integrating storage systems into the so-called “smart grid” [1]. Large-scale energy storage technologies, such as batteries, address this issue by offering a recognized ability to improve grid stability and reliability [2].
Among the different types of electrochemical systems, redox flow batteries (RFBs) represent one of the attractive choices for large-scale stationary energy storage [3,4]. An RFB consists of two containers which store energy comprising of two distinct redox couples. As two different types of redox couples are stored in two containers, RFB has the advantage of decoupling the power capacity and energy capacity. Numerous chemistries, such as iron chromium, vanadium chromium, all iron, zinc bromine etc., have been investigated based on their active species and their solvents in redox flow batteries. A common problem in almost all combinations is the cross-over of the active ions through the membrane, resulting in cross-contamination and permanent capacity loss. The vanadium redox flow battery (VRFB) overcomes this problem by utilizing the same element in both halves of the cell [5,6].
Over the past three decades, VRFB technology has made significant progress in terms of performance improvement and worldwide deployment. In the 1980s, Maria Skyllas-Kazacos and colleagues at the University of New South Wales (UNSW) carried out the first successful demonstration of the VRFB using vanadium in a sulfuric acid solution in each half cell [7]. Early licensing by UNSW in Thailand, Japan and Australia led to early field trials with further development of the VRFB continuing to the present day in all aspects of the VRFB [5,8,9]. Today, several companies around the world are developing the VRFB on a commercial scale, including Sumitomo Electric Industries, RedT Energy plc, Enerox GMbH, VRB Energy, Rongke Power, H2 Inc, V-Flow Tech. The VRFB commercialization includes large-scale grid connected and off-grid renewable energy storage, isolated power supply, load levelling and backup applications [6].
An important feature of vanadium redox flow batteries is the independent sizing of their power and energy rating. Energy capacity, which depends on a reactant concentration and electrolyte volume, and power, which depends on the area of electrode and the number of cells in a stack, can be independently optimized to suit specific user requirements. A unique feature of the VRFB is that both half-cells use the same element at different oxidation states. Electrolyte cross over from one half-cell to the other half is unavoidable due to the inability of any ion exchange membrane to completely block the movement of the ions. However, this crossover is not detrimental for VRFBs due to the use of the same electrolyte in both half-cells and therefore, does not affect its life and performance. A VRFB can be used as an uninterrupted power supply (UPS) due to its fast response time [10] and due to its high, round-trip efficiency, and is ideal for peak shaving and load levelling applications. Since capacity can be readily increased by adding larger volumes of electrolytes, the cost per kWh drops dramatically with increasing storage durations. The VRFB is therefore particularly attractive for applications that require long duration storage capacity (above 4 h), as in the case of renewable energy storage. VRFBs can be completely discharged to a very low state of charge (SOC) and can be recharged even after being held in a long-term discharge condition. As electrolytes are contained in external electrolyte tanks, there is negligible capacity loss during extended standby. Theoretically, the electrolyte can perform an infinite number of charge/discharge cycles with an appropriate periodic remixing or re-balancing to maintain and restore capacity. The maintenance cost for a VRFB is also negligible.
One of the limitations of the VRFB for certain applications includes the low specific energy (~25 Wh kg−1) compared to the Li-ion and nickel metal hydride battery. The specific energy is limited by the solubility of the vanadium ions in the electrolyte over the required operating temperature range. The low energy density is still acceptable for most stationary applications but limits its use in mobile systems. Secondly, the operating temperature of a VRFB usually ranges from 10 °C to 40 °C. Temperatures above 40 °C can result in thermal precipitation of V(V) species in the positive electrolyte, while operating below 10 °C can lead to the precipitation of a V(II) and V(III) sulphate in the negative electrolyte [11,12]. The narrow temperature window means that heating/cooling systems are often needed to control temperature in harsh climates, but this is also the case for many other battery technologies [13]. Thirdly, vanadium is a relatively expensive transition metal which drives the electrolyte cost and the corresponding system cost. Hence, the upfront cost is high, but the very long cycle life gives very competitive levelized costs over the life of the system. The indefinite life of the electrolyte also leads to a high residual value of the solutions that can be readily reprocessed to recover the vanadium or be redeployed in other VRFB systems. Finally, the VRFB can have a negative impact on the environment in the event of spillage, so it needs to be contained in double-layered tanks to mitigate this issue. Compared with Li-ion batteries however, VRFBs are much safer and are not prone to catching fire.
To store the chemical energy, the VRFB uses a mixture of vanadium compounds dissolved in sulfuric acid as the electrolyte. The V4+/V5+ (VO2+/VO2+) redox couple is utilized as the positive half-cell solution or catholyte and V2+/V3+ as the negative half-cell solution or anolyte with sulphuric acid as a supporting electrolyte [14]. The electrolyte is usually prepared by the electrochemical dissolution of vanadium pentoxide. The concentration of vanadium is held below 2 M due to the solubility limits of vanadium ions in sulphuric acid [11,15]. A VRFB comprising an electrochemical cell and two separate tanks to store the electrolytes is shown in Figure 1.
The electrochemical reactions during the charging or discharging in each half cell occur as follows.
During the discharge process, V2+ ions in the negative tank are oxidized to V3+, while VO2+ ions are reduced to VO2+ in the positive tank. During the charging process, the reactions are reversed. Protons, H+ migrate across the membrane to maintain the charge balance of the cell.
Electrolyte transfer can also occur through the ion exchange membrane during long-term operation and induces electrolyte imbalance. The direction of the net electrolyte transfer depends on the type of membrane used in the stack (negative to positive half-cell for cation and opposite direction for anion exchange).
A single cell consists of porous, carbon felt electrodes, carbon (bipolar) plates, an ion exchange membrane, flow frames, gaskets, current collectors and endplates, as shown in Figure 2.
The porous carbon electrode is one of the core components which facilitates the reaction of the redox couples. To provide ample reaction sites, a high surface area graphite/carbon felt electrode is used. Carbon felt has a high surface area, which can be significantly enhanced after pre-treatment. Likewise, carbon felts are chemically inert and can withstand the highly corrosive positive half-cell electrolyte. They are also electrically conductive to transport current to the bipolar plate [9,16]. Various modification techniques are implemented to activate the carbon felt to enhance the overall performance of the cell. Modification techniques include thermal [17,18,19,20,21,22], chemical [23,24,25], plasma etching [19], corona discharge [26], impregnation of catalyst [27,28,29,30,31,32,33,34,35], etc. Ion exchange membranes separate the two half-cells, and allow transport of the charge balancing ions, such as H+, SO42− and HSO4− [36].
The ion exchange membrane divides two half-cells containing the negative and the positive electrolyte by allowing only charge transport to keep electrical neutrality. The ion exchange membrane ideally must have characteristics, such as high selectivity for the charge transporting species with a minimum transfer of vanadium cations, minimum transfer of water across the membrane and higher mechanical stability [37,38]. Mostly, either anion or cation exchange membrane are used in VRFB applications.
In terms of cell architecture and flow configuration, the most common types of VRFB are” flow-through” and” flow-by” design. The flow path of the reactant (electrolyte) is the major difference between the two types. The flow-by design, also known as fuel cell design, uses forced convection of the electrolyte in the through-plane direction of the electrode. In flow-through design, convective transport of the electrolyte occurs in the in-plane direction of the electrode. Out of these, the latter is currently found in commercial systems. In fuel cell type design, higher current densities can be achieved with tailored flow fields in the bipolar plates that allow very low anode-cathode distances and electrolyte flow through parallel, serpentine or interdigitated channel designs. To date however, VRFBs using such flow field designs have only been reported for small laboratory single cells.
The VRFB performance is assessed by cell cycling. Cell efficiencies are important parameters for evaluating a VRFB’s performance, namely coulombic, energy and voltage efficiencies.
Coulombic efficiency (CE) is the ratio of the charge obtained during the discharge process to the charge delivered during the charge process, as expressed in Equation (4).
where is the number of coulombs extracted from a battery during discharge in Amp hr, is the number of coulombs supplied during charging, is the discharge current in Amp, is the charging current and is the time in hours. Coulombic efficiency is dependent on the properties of the membrane.
Energy efficiency (EE) is the ratio of energy obtained during discharge to the energy provided during charging. If no consideration is given to mechanical losses (pump power), energy efficiency is expressed by Equation (5).
where is the power delivered by the battery during discharge, is the power supplied to a battery during charge in Watt, and is time in hours.
Voltage efficiency (VE) is the ratio of average cell/stack voltage during discharge to the average voltage during charge. It is a measurement of ohmic and polarization losses during cell charging and discharging.
where is the cell voltage during discharge and is the cell voltage during charge.
Voltage efficiency is also the ratio of energy efficiency and coulombic efficiency as shown in Equation (7).
In addition to the efficiencies used to compare different VRFB cell designs, area-specific resistance (ASR), ρ, is also one of the valuable parameters that describes the performance of a cell in terms of its design and cell materials.
If there are no voltage losses in the cell, then the cell voltage would be the same as the open-circuit potential. Because of the ohmic and polarization resistance losses however, cell voltage is given
and
where j is current density (A·cm−2), Vo is open circuit voltage and ρ is area specific resistance expressed in Ω·cm2. Numerous studies have been performed for vanadium redox flow batteries (VRFBs) on electrode pre-treatment, electrolyte stability, membrane and cell design to improve the overall cell performance. Typically, ex situ characterization techniques are used to assess the overall performance of VRFB cells. Nevertheless, this black box approach cannot offer an in-depth insight on the changes that occur during the process within the cell. Due to the availability of real-time data with today’s technology, in situ methods have gained great importance and can therefore be applied to evaluate the performance of VRFBs during operation. In this review, the focus will be on the investigation of various in situ techniques employed in VRFBs. The systematic review of the available technique including its working principle is discussed together with the advantages and limitations of each technique. The in situ techniques described in this review paper are presented in Table 1.
Vcharge = Vo + jρ
Vdischarge = Vo − jρ
2. Discussion
2.1. In Situ Diagnostic Techniques
2.1.1. Cell Charging and Discharging
Cell charging and discharging (cell cycling) is the most widely used in situ characterization technique for VRFBs. The cell is charged and discharged alternately at certain currents and the corresponding voltage vs. time plots are recorded. The performance of the cell due to material, design and operational parameters can be evaluated by cell charging and discharging at constant current and constant power modes. Coulombic, voltage and energy efficiencies, as given in Equations (8)–(10), can be derived from the cell cycling data. Usually, cell cycling at various current densities for certain numbers of cycles are performed to access the cyclic performance, as shown in Figure 3.
Different parameters can be derived from the cell cycling, one of the important ones being capacity utilization. The capacity utilization is the ratio of the actual charge capacity to the theoretical capacity depending on the amount of the electroactive species [39]. Figure 4a only shows a decrease in charging and discharging time with an increasing current density. An increasing current density will lead to a decrease in capacity utilization, since a higher current cannot be supported at the appropriate SOC limit [40] unless there is an accompanying increase in the flow-rate to overcome mass transport limitations at the high SOCs. Increasing current density results in the decrease in both voltage efficiency and capacity utilization. While both can be improved by increasing electrolyte flowrate, this could be at the expense of higher pumping energy losses. Therefore, it is very important to optimize the current density with acceptable, overall system efficiency to meet the economics of VRFBs [6,41,42,43,44,45].
Although cell cycling is a very straightforward and convenient technique, multiple parameters can be calculated from the results. For example, a plot of cell voltage vs. time or specific capacity (Figure 4) is commonly used for comparing the overpotential during the charging/discharging cycle from the measurement of the voltage plateau. It is easy to compare the increase or decrease in overpotential, as well as the electrolyte utilization across the electrode, as shown in Figure 4b. The other important aspect of the cell cycling is to study the degradation of different components of the VRFB over long periods. Although the degradation study via cell cycling is slow in comparison to other accelerated degradation study techniques, it is the most convenient and realistic approach. The long-term examination of different components during extended cell cycling is an important research area for VRFBs; however, there is a lack of studies that provide data over several thousand cycles to fully understand the long-term degradation processes in operating cells.
While cell cycling provides valuable information on changes to battery performance and materials, it does not provide direct evidence about the source of performance losses and their mechanisms. To understand the type of losses due to change in electrodes, membranes, flow fields etc., different types of in situ diagnostic tools can be utilized.
Cell cycling tests in flow battery operations can be time consuming, so it is important to fast screen materials and conduct quick performance testing. For this purpose, cell cycling in a static cell is often employed by various research groups [46,47,48,49,50]. In static cells, the carbon felt electrode is soaked with a fixed amount of electrolyte and quick charge-discharge cycling can be performed without the need to circulate the electrolyte. The other approach of fast performance screening can also be done by polarization tests, which will be described in the next section.
The selectivity of the membrane plays a major role in VRFB performance analysis. Cation exchange membrane (CEM) type membranes tend to have a higher selectivity for vanadium and sulfate ions and lower water transfer compared with the Anion exchange membrane (AEM), but this depends on the ion exchange capacity and swelling properties of each membrane [51,52]. The change in the electrolyte volume results in a gradual drop in capacity, as well as energy and voltage efficiencies during extended charge/discharge cycling, although this type of capacity loss can be restored by periodic electrolyte remixing. For material characterization tests requiring cells to be assembled multiple times, it is advisable to use a membrane with a lower electrolyte transfer rate to minimize any effect on cell efficiencies arising from an electrolyte imbalance. Most researchers will perform continuous rebalancing of the electrolyte, either by remixing or partial electrolyte replacement, but this cannot be conducted in a static cell.
2.1.2. Polarization Test
Polarization plots have proved an interpretive tool for recognizing the prevailing limitation in cell performance. The polarizations are obtained by plotting cell voltage against the current during charge or discharge at a fixed SOC. Normally, the polarization curve is determined using regulated current steps to record the voltage at each current step. The cell is initially charged at a specified current for a short time (sec to min) and the potential is recorded. Following a short rest at the OCV, the cell is then discharged at the same current and the discharge voltage is recorded. The process is repeated from the low current density to very high current density, preferably in a randomized order to minimize trends associated with changes in the SOC during the measurements. The measured cell voltage is plotted against the current density to obtain the polarization curves for the charging and discharging processes. This gives an overview of the different voltage losses in the cell, which comprises activation, ohmic and concentration polarization. Figure 5a,b depicts the polarization procedure and curve showing three distinct regions, namely activation, ohmic and concentration polarization. Another important feature is the limiting current density that will vary with the SOC and flowrate.
In a polarization curve, a limiting current density is observed with increasing polarization, the magnitude of which is related to the concentration of the reacting species and flow rate. The limiting current is therefore a consequence of a low SOC, low electrolyte flow rate, non-uniform electrolyte distribution and a high residence time of the electrolyte. The cell should not be charged at a current density higher than the limiting current as it will lead to concentration polarization that gives rise to gassing side reactions and overcharge at the higher cell voltage that may gradually degrade the positive electrode and bipolar plate (BP). Discharging above the limiting current density could lead to cell reversal in a multicell stack, so also needs to be avoided [53].
Three regions can be obtained from a typical polarization curve:
- Activation polarization-At lower current densities, the polarization curve is dominated by activation polarization that reflects the energy needed to overcome the activation energy associated with the charge transfer processes. It is a measure of the kinetics of the charge transfer reactions at the electrode-electrolyte interfaces. This form of loss can be minimized by electrode pre-treatment (thermal, chemical or catalyst addition) or by increasing the electrode surface area that reduces the current per unit area of the electrode. The use of a high surface area, porous carbon felt will usually reduce the activation polarization by reducing the effective current density.
- Ohmic polarization-Ohmic polarization in a cell consists of voltage losses associated with the ionic transport resistances of the electrolyte and membrane, the electrical resistance of the cell components (current collector, graphite felt and BP) and the contact resistances at the interfaces (current collector to BP and BP to the electrode). The linear part of the polarization curve is dominated by the ohmic losses that can be determined from the slope of this region of the plot. Strategies are implemented to minimize resistance using highly conducting electrodes and thin membranes [54]. The contact resistances between the porous electrode and the bipolar plate surface are usually minimized by felt compression that also reduces the resistivity of the carbon felt itself. Some battery developers may also apply a conducting paste to glue the felt to the bipolar plate [55].
- Concentration polarization-The concentration polarization is observed in the high current density region and is associated with mass transport limitations in the cell. Concentration overpotential is the result of the change in the concentration of electroactive species at the electrode surface compared with the bulk solution. Electron transfer takes place at the electrode-electrolyte interface and leads to a depletion of the electroactive species at the electrode surface. This leads to the formation of a diffusion layer and ions diffuse from the bulk solution to the electrode surface under the influence of the concentration gradient. At high currents, the supply of reactants cannot keep up with the rate of electron transfer, and this leads to concentration polarization [56]. Flow rate, current density and the concentration of electrolytes influence the concentration overpotential and the limiting current density in the cell.
Table 2 summarizes type of loss, its origin, dominant region and the techniques for minimization.
The above-mentioned polarization losses all contribute to the cell voltage when a current flows through the cell. Nonetheless, the dominant effect of each polarization is observed within each specific region of the polarization curve [57]. In flow cells, the electrolyte is pumped into the cell and returned to the tank after the electrochemical reaction. The oxidation state of the electroactive species changes after circulating through the cell. The interval between each step of measurement is therefore critical to the accuracy of the polarization curve measurement, particularly for lab-scale cells with small electrolyte volumes. Long duration charging or discharging steps could result in misleading data due to changes in the SOC. The accuracy of the polarization study thus requires a sufficient volume of charged species in the tank to maintain a constant SOC during the measurement. This effect can be minimized by applying a charging current of equal magnitude immediately after the discharging current at each measurement point, but when an insufficient electrolyte volume is used, small errors can still arise due to coulombic efficiency losses. An alternative method is to obtain a polarization curve via a single pass electrolyte flow, where the electrolyte is not circulated to a single reservoir [40].
The polarization curve for the VRFB can also be exploited to acquire information about the limiting current density with respect to variations in cell configuration, flow rate [58,59], materials and operating parameters. Cell configuration includes the cell design (e.g., flow through, flow by, tubular, etc.) and the type of flow field used (interdigitated, serpentine, parallel, etc.) [58,59,60,61,62]. Polarization studies are also performed to evaluate the different types of electrode materials and modification techniques [61,63] for varying electrode thickness [64], compression level [65], electrolyte temperature [66], SOC [67], concentration of electrolyte [58], current scan rate [68], and membrane [61]. Traditional cell polarization methods thus provide data on the overall cell performance, but they cannot isolate the contributions from individual half-cells or components. A different approach adopted by Darling et al. [69] involved the use of a single electrolyte reservoir containing a mixture of reduced and oxidized ions in the solution. The positive half-cell electrolyte was circulated through both the anode and cathode chambers, allowing the polarization behavior of the positive half-cell to be characterized. Apart from isolating one half-cell, the main benefit of this arrangement is the steady state operation that leads to “zero” net chemical change, thereby maintaining constant SOC throughout the experiment, although this only applies for a current efficiency of 100%. Tugrul et al. investigated a mass transport mechanism employing the strip cell. For this study, a strip cell with various channel depths was employed by performing single pass polarization. The result showed an increase in the overall VRFB performance with the decreasing channel depth [70].
2.1.3. Reference Electrode Configuration
To allow an individual half-cell to be characterized separately in a cell, a reference electrode can also be used to provide information about the potential distribution, kinetics and overpotential for each half-cell reaction, with respect to changes in the electrode material, flow rate of the electrolyte, SOC of electrolyte, electrolyte concentration, etc. This approach has first been described in fuel cells, where a fine reference wire is sandwiched (sandwich type), between membranes or enclosed to a region within the polymer electrolyte that stretches past the cell [71,72]. In another configuration (edge-type), the reference electrode is attached to the outside of the active area in the region of the membrane [71,73,74]. To minimize the ohmic (iR) overpotential, it is always necessary to place the reference electrode close to the working electrode.
The simplest method to determine the half-cell potential can be achieved by inserting the reference electrode at the outlet tube of the cell. Langner et al. [75] inserted the reference electrode at the inlet and outlet of the tubing. The cell was discharged galvanostatically to a certain SOC (30%, 50%, 70%), followed by the OCV measurement. The voltage between the reference electrodes and half-cell were measured at varying currents.
To verify that the configuration is working properly, the sum of half-cell potentials and the full cell voltage was compared. The difference between the full cell voltage and the half-cell potentials was equal to the high frequency resistance of the cell. Ghimire et al. [76] designed the cell with the special holder to adjust the reference electrode at the outlet tube. The reference electrode was inserted into the closest possible distance from the active area, with only the tip of the electrode in contact with the electrolyte, as shown in Figure 6.
From the configuration, cell cycling, as well as polarization measurements, were performed using a battery tester and multi-channel potentiostat. The full cell voltage between the terminals was continuously recorded. Simultaneously, the half-cell potentials between each terminal and the reference electrode were constantly measured by the potentiostat. To estimate the iR loss due to the positioning of the reference electrode, three reference electrodes were placed at the outlet at various distances from the porous electrode and the difference in the potential with respect to the change in the reference electrode position at different current densities was measured. From the plot of cell voltage/half-cell potential against current density the change in the overpotential in each half of the cell can be easily acquired, as shown in Figure 7.
The same configuration can be used to optimize the flow rate, electrolyte composition and electrode type. Similarly, using the same type of configuration, Bhattarai et al. [77] made an attempt to identify the location of the power drop effect (PDE) in the VRFB cell by isolating the different components of the cell. Examining the full cell voltage and half-cell, the anion exchange membrane was found to be responsible for the observed PDE effect in the VRFB. The main drawback of this arrangement is the ohmic loss from the positioning of the reference electrode. Since the reference electrode is inserted into the outlet pipe, it suffers from ohmic loss. This can be mitigated by inserting the reference electrode directly in front of the porous electrode; however, the proper configuration to adjust the reference electrode is required.
Aaron et al. [78] employed a dynamic hydrogen electrode (DHE) as a reference electrode for the electrode kinetics measurement of the positive and negative sides of a VRFB. The dynamic hydrogen (Platinum) electrode was incorporated between the two layers of the membrane. To achieve a stable reference voltage during operation, a low magnitude steady current was supplied. Similarly, Liu et al. [79] measured the local redox potential in a multilayer electrode where three potential probes (platinum wire covered with polytetrafluoroethylene) were placed between the layers of the electrode. The DHE was sandwiched between the two ion-exchange membranes in the middle of the cell. The potential difference between each probe and the DHE was assessed to examine the potential distribution, concentration distribution of reactants and reaction location on the electrodes. Gandomi et al. [80] also used a similar setup to study the potential distribution in a VRFB cell. Constant hydrogen coverage was required at the reference electrode to provide a stable potential; therefore, a small cathodic current was applied. The DHE in this case utilized two platinum wires between the membranes, where one operated as the counter electrode and the other as the working electrode after a layer of hydrogen covered the surface. Ventosa et al. [81] employed a silver-silver sulfate reference electrode to study the kinetics of the negative and positive redox couples in VRFBs. The silver wire was sandwiched between the membranes. The membrane/silver wire/membrane assembly was again sandwiched by the Teflon except at the bottom to separate it from the electrolyte solution. The whole assembly of Teflon/membrane/silver wire/membrane/Teflon was inserted between the membranes. The adjustment of the resistor in the DHE was performed by Choi et al. [82] to monitor the positive and negative potentials in the VRFB. The resistance was varied during the discharge process and the potential of each half-cell was recorded to investigate the nature of the hydrogen evolution reaction.
2.1.4. Spatially Resolved Current or Voltage Mapping
The typical VRFB configuration utilizes porous carbon or graphite felts as electrodes. There are two primary architectural designs for the distribution of flow: the conventional flow through type and the fuel cell flow by type. In flow channel architecture type, the electrolyte is distributed through a channel so that the dispersed electrolyte is parallel to the plane of the electrode. Flow channels provide pathways for the electrolyte to travel without necessarily having to pass through the electrode. In the flow frame type, the electrolyte is constrained to stream through the porous electrode without any free stream. Figure 8 shows the two types of architectural design for the flow distribution, which includes the serpentine type of fuel cell design and conventional flow frame, respectively.
Ideally, the electrolyte distribution across the electrode should be uniform to maximize the performance of the battery [83]. Basically, the flow-frame distribution structure at the inlet and outlet of the flow frame directs the stream of the electrolyte. Due to the inefficient flow distribution designs and use of thick, non-uniform porous electrodes which are anisotropic in nature, uniform electrolyte flow distribution cannot be completely achieved, especially in large-area cells. However, with the right selection of material and flow distributor design, non-homogeneity can be minimized. An uneven distribution of electrolytes within the cell can constrain the performance in various ways. Non-uniform electrolyte distribution causes local polarization, which results in gas evolution and consequently degradation of the bipolar plates during long-term operation [84,85]. Gassing side reaction will also lead to cell imbalance and capacity loss that can only be recovered by chemical or electrochemical rebalancing [86].
The insufficient supply of electrolytes also increases cell resistance by creating gas pockets within the electrode leading to a reduction in battery performance [87]. Common characterization techniques do not offer spatially resolved information across the electrode. Knowledge about flow distribution and local reactant conversion can be acquired by multi-physics modelling along with the computational fluid dynamics [88,89,90]. Results from fluid dynamics and modelling are based on several assumptions and cannot represent the real time operating conditions of the VRFBs. Experimental verification of the results predicted by the modelling is therefore required. Spatially resolved measurements across the electrode provide a method to study the current or voltage distribution during the operation of the battery.
Spatially resolved current/voltage mapping using a segmented cell is a strong diagnostic tool that has been broadly utilized in fuel cell research [91,92,93,94,95,96]; however, very limited studies have been performed in the VRFB area. The cell architecture and flow configuration of the segmented cell is similar to the normal VRFB cell; however, the electrode is divided into multiple segments which are electrically insulated from the other segments. Due to these segmentations, the independent monitoring of each segment is possible during charging and discharging. It is therefore possible to monitor the resistance, current and voltage in each segment. Segmentation includes the division of the current collector, bipolar plate and porous electrode, as shown in Figure 10. In most of the studies, the segmentation of the BP and current collector is common, while segmentation of the felt electrode is rare.
The most frequently used strategies for design and construction of the segmentation can be broadly classified into three categories:
- Printed circuit board (PCB): The basic idea behind this technique is to supplant one or both current collectors (CC) with a PCB. Through the PCB manufacturing technique, a segmented CC can be designed with each segment insulated from each other for individual collection of current/voltage. The thin, flat PCB is placed between the end plate and the flow field to ensure low contact resistance, as shown in Figure 9. A PCB substrate is mostly composed of epoxy glass fiber or polytetrafluoroethylene (PTFE). To minimize the contact resistance and to avoid corrosion, the segments are usually coated with gold. This method offers the possibility of incorporating flow fields of different types directly on the board.
- Resistor network: In the resistor network method, the end BP is divided into electrically isolate segments of the same type to form a resistor network. Characterization can be performed in two ways: active or passive. High resolution or precise shunt resistors are connected in series with each segment. In the passive method, the current density in each segment is calculated from the voltage drop across each precise resistor. The active method requires the direct connection of the resistor to the measurement units. The measurement unit directly obtains the current flowing through each resistor.
- Hall effect sensors: The fundamentals of the Hall effect sensors were introduced by Wieser et al. [98]. This technique employs the use of one Hall effect sensor for each individual segment. A Hall effect sensor is a current transducer with two pairs of terminals to allow for connection to the current source and measurement of the voltage. The sensor works on the Hall effect principle, which states that a current carrying conductor when placed in a magnetic field generates a voltage perpendicular to both the magnetic field and the current. The voltage of the sensor, which is proportional to the current, is determined by the magnetic flux density passing through each sensor.
Table 3 summarizes the measurement techniques with mechanism involved and type of hardwares used. Advantage and limitations of each technique is also explained.
There are only a few studies with segmented cells in VRFBs. Hsieh et al. [99] studied two different cell types (A and B) with a 100 cm2 active area. The cell was divided into 25 segments and the local current or voltage of each segment was measured using a shunt resistor. In design A, only the current collector was segmented without graphite plate (bipolar plate) segmentation, while the connecting cables were directly inserted into the segmented graphite collector in their design B. The current density distribution at the beginning and the end of the charging and discharging process was acquired via these configurations. For type A design, non-uniform compression of electrodes, variability in contact resistance and use of a non-segmented thicker plate, showed the lateral flow of the current noticeably affected the current distribution. Similarly, design B resulted in low discharge capacity, voltage efficiency and poor distribution due to increased contact resistance.
For precise measurement, full segmentation of the bipolar plate is required. The bipolar plate can be machined in two distinct ways: manufacture from a single block or embed bipolar segments into a non-conductive frame. The single block manufacturing is preferred as it ensures an even contact resistance in all the segments. The current or voltage mapping acquired during charging/discharging of the segmented cell is highly influenced by the variation in the segments’ contact resistance with the porous electrode. Uneven contact resistance results in a lateral flow of current in the porous electrode, hence generating inaccurate data.
Clement et al. [97] implemented a PCB with a built-in shunt resistor for in-plane, two-dimensional distributed current measurement in VRFBs. They employed fully-segmented flow plates fabricated from graphite composite. The carbon paper was placed between the flow field and segments to ensure minimal contact resistance. The experimental setup consisted of an active area of 9 cm2, with each segment of 4.5 mm × 4.5 mm being separated by 0.5 mm. The data acquisition system used employed LabVIEW from the PCB in real time. To verify that either side could be used for the study, a series of experiments in each side were performed. Single-pass polarization was carried out to understand the nature of the current distribution. The variation in terms of electrode type and thickness, current density, SOC of electrolyte, flow rate etc., were performed with this configuration. The findings suggested that local current distribution reflects the combined effect of the local concentration of electrolyte and electrolyte velocity.
Gerber et al. [100] measured the local current densities using a PCB that can be integrated as a bipolar plate/internal current collector. A cell having an active area of 40 cm2 was employed with 48 single current collector segments. The size of each segment was 8.5 mm by 7.5 mm with 1 mm spacing. The segmented current collectors were arranged at the front side of the PCB. Fully segmented electrodes were used, which allowed current only in the through-plane direction. From the front side of the segment, a shunt resistor was connected to the PCB. Voltage drop across the shunt resistor was measured to determine the local current density. The current collector at the back side of the PCB was coated with carbon ink to protect the leakage of electrolyte. The ohmic resistance deviation among 48 segments was measured to be less than 2%, which ensured even contact resistance. The study of the current density distribution at different operating points during charging, discharging, flow configuration etc. was performed using this method.
Most of the segmented cell studies have been performed with the segmented current collector and/or together with bipolar plates. The segmentation of the porous electrode is eluded in most of the study. The segmentation of the electrodes might affect the flow distribution of the electrolyte across the electrode if proper insulator material is not used. There are two major challenges from the segmentation of the porous electrode: (i) ensuring the same flow distribution with respect to the non-segmented condition; and (ii) the use of non-conductive separating material among the segments to ensure that there is no lateral flow of the current. If a non-segmented electrode is used, then there is always a possibility of minor changes in the current/voltage from the neighboring segments. The lateral flow of the current is directly related to the thickness of the undivided porous electrode. In thick porous electrodes, local current/voltage may balance quickly as in-plane conductivity is many times higher than the through-plane conductivity. Possibly, due to this reason, the segmented porous electrode study is rare not only in VRFBs, but as a whole on RFBs.
A very different approach of segmentation in terms of cell configuration and data analysis was performed by Bhattarai et al. [96]. A cell with an active area of 100 cm2 (10 cm × 10 cm) was divided into 16 identical segments. An exploded view of the whole configuration is shown in Figure 10. Segmentation was performed in the conventional flow design. The insulator plate was milled with the 16 cavities to accommodate the current collector and the bipolar plate. An effort was also made to segment the porous electrode. A non-conductive, highly porous and compressible frame made of polyurethane was employed to insulate each segment. Figure 11c shows the polyurethane plastic frame arrangement in the flow frame. The supporting endplates were also milled to insert the banana cables to the current collector. Figure 11a,b shows the schematic setup and image of the segmented side, respectively. A battery tester with integrated load and power supplies with 16 channels was employed to charge/discharge each segment.
In most of the segmented VRFB studies, current/voltage mapping is performed at the various operating conditions during the charging or discharging of the cell. The major problem encountered is the influence of contact resistance on the local current or voltage. It is extremely difficult to have the same contact resistance in all of the segments, especially where a thick porous electrode is used. Therefore, the data acquired may not truly represent local current or voltage. Figure 12 shows the common method used to study the charging/discharging current or voltage.
Bhattarai et al. [96] introduced a segmenting flow cell with a new approach of OCV mapping. The OCV, after terminating charging or discharging, were used to acquire the counter plot, as shown in Figure 13. The study showed that the OCV, directly after the cessation of the current, simulated the condition of a charged species across the electrode. Since OCV mapping is unaffected by the variation in the contact resistance between the porous electrodes and bipolar segments, the data in real time represents the flow behavior at various operating conditions. The same experimental setup was utilized to study the reactant conversion across the electrode by Ghimire et al. [102]. The acquired OCV in 16 segments were changed to the corresponding SOC of the electrolyte. Based on the difference between the theoretical and experimental difference in the SOC, a relationship was established to acquire information about the utilization of the electrolyte across electrodes. The same relationship was used to investigate electrode types, flow configuration, various stoichiometries, compression of the electrodes, etc., [103] at various operating conditions. Further, all the available literature to date on the segmented cell, as well as on the reference electrode approach, has explored a single cell only. There is a large opportunity to implement these techniques in large flow battery stacks with multiple cells to study or improve the non-linearity of voltage/current distribution, flow distribution, degradation, etc.
2.1.5. Electrochemical Impedance Spectroscopy (EIS)
Electrochemical impedance spectroscopy is one of the widely used diagnostic techniques for measuring the polarization and ohmic losses associated with an electrochemical interphase or cell [104]. In this technique, an electrochemical system is perturbed with a small magnitude current/voltage signal over wide-ranging frequencies and the resultant impedance is measured. The data can be fitted to various models to identify the individual contributions to the total impedance from charge transfer resistance, mass transport, electrode process, etc. EIS allows the separation of physical process with different relaxation frequencies [105]. EIS is performed in two ways: current controlled (PEIS or potentiastatic EIS) or voltage controlled (GEIS or Galvanostatic EIS). In the PEIS mode, an AC potential perturbation is applied and the corresponding response of the current is measured to acquire the impedance, whereas in the GEIS mode, an AC current perturbation is applied to measure the potential response of the cell [106,107]. The EIS technique can be performed either ex situ or in situ. In situ EIS has been performed for the study of VRFB single cells or VRFB stacks, while ex situ EIS is performed for the characterization of material or components.
In the potentiostatic mode, the AC perturbation voltage (Vt) with amplitude (VA) is employed with frequency (ω = 2πft) at a given potential. A minor AC voltage (5–15 mV) is applied. This can be expressed as
This input signal leads to change in current (It) with an amplitude (IA) and a phase shift (φ) given by.
The relation between input voltage and corresponding current can be stated in the impedance and phase shift as
The impedance can be resolved into real and imaginary parts, which can be represented in the Nyquist plot as shown in Figure 14.
The Nyquist plot contains some valuable information, but has one major shortcoming. The data points on the plot cannot be correlated to the frequency that was used to record that specific point. To correlate the frequency dependence of a system against the phase shift, a Bode plot is used, as shown in Figure 15.
In a system with a conductive electrolyte containing the redox couple, as in a VRFB, the different frequency ranges signify various regions dominated by the different resistances. The ohmic resistance is dominant in the high frequency (MHz to kHz) range, in the medium frequency range (Hz) the charge transfer resistance is observed, while in the low frequency range (mHz), diffusion and mass-transport is dominant.
For the evaluation of the data acquired through impedance measurement, an equivalent circuit model is applied. An equivalent circuit model in its simplest form consists of capacitive (C), inductive (L) and resistive (R) elements to explain the data from the impedance.
The planar electrode and ion conducting electrolyte are often used for the description of the electrochemical interface. In this type of interface, the redox reaction takes place on the surface of the electrode. Mostly, the simplest form of the equivalent circuit is used to explain these kinds of systems; however, for porous electrodes, as in the case of the VRFB, the system deviates from ideal behavior. This results in the implementation of the more complicated type of the equivalent circuit. In porous electrodes, the active sites are distributed and exhibit non-uniform kinetics toward the desired reaction, resulting in a non-uniform current and voltage distribution. Thus, a new type of element is introduced instead of the ideal capacitor to describe the capacitive behavior of the interphase. In addition, the Warburg element is employed to depict diffusion in the porous material. Depending upon the system, more variables can be added, which makes the circuit complicated. Figure 16 shows the Randles circuit and corresponding Nyquist plot.
Where Rs is the ohmic resistance, Rct is the charge transfer resistance, CPE is the constant phase element and Zw is the Warburg impedance associated with the diffusion process. A significant study in a porous electrode was initially performed by Levie et al. [108,109]. There are numerous publications in impedance theory related to porous electrodes. One of the areas is the influence of pore geometry on the impedance [110,111]. In most of the studies, the simple modification of the Randles circuit employing the Warburg diffusion and constant phase element is used [112,113,114]. Some of the studies used the transmission line equivalent circuit [115,116,117]. The problem often rises from the complexity of the porous electrode, where the macroscopic parameters from the physical model do not resemble the microscopic parameters of the electrode.
The in situ monitoring of the impedances of VRFBs has been performed to obtain information about changes in polarization resistance associated with electrode modification, degradation of materials, and optimization of the operating parameters, etc. [118,119,120,121,122,123,124,125,126,127,128]. The measurement of full cell impedance is performed by connecting the terminals of the signal analyzer to the terminals of the cell. In the case of half-cell measurement, the terminals of the signal analyzer are connected to one of the cell terminals and to the reference electrode. Noack et al. [125] conducted the EIS study to investigate the influence on impedance due to changes in the compression of the graphite felt, cell temperature, overcharging, membrane damage, etc.
Derr et al. [123] studied the electrochemical degradation of the porous electrode at different states of charge of electrolyte using the EIS technique through an equivalent circuit model consisting of two constant phase elements and their resistances. Sun et al. [120] used a dynamic hydrogen electrode with EIS to obtain information on the internal loss mechanisms in VRFB electrodes. The equivalent circuit used consisted of charge transfer resistance and double layer capacitance in parallel connected to the high frequency resistance in series. Similarly, Choi et al. [126] reported the impedances of a full cell, negative and positive electrodes using DHE as a reference electrode during repeated cycling. A very different method implemented by Mazur et al. [121] used platinum wires positioned at the inlet of the electrolyte channels near to the porous electrode. The platinum wires served as pseudo-reference electrodes to obtain the EIS spectra of the full cell, and the positive and negative half-cells.
EIS has been widely used in fuel cell research, mainly to investigate the oxygen reduction reaction (ORR). Spatially resolved EIS diagnosis has become quite popular in fuel cell research due to its capability to simultaneously capture activation, ohmic and concentration polarization at various segments of the electrode during operation. EIS has so far not been widely used in a segmented VRB and we see a great potential of this tool in flow batteries research. EIS and Fourier Transform analysis are also being evaluated as diagnostic tools for in situ state of health determination and fault detection in operating VRFB stacks in the field.
EIS provides valuable information on electrochemical interphase; however, it comes with a few limitations. The impedance spectrum can be easily distorted by noise from the pump. Similarly, other limitations include finding an electrochemically stable reference electrode and distortion of impedance spectra at high electrolyte concentrations.
2.1.6. Pressure Drop Measurement
The flow rate of the electrolyte has two major effects on the performance of the VRFB. First, is the effect on concentration polarization at the electrode/electrolyte interphase, which affects the output voltage and capacity of the cell. The latter is the hydraulic effect exhibited by the hydraulic resistance of the cell. A part of the energy generated by a cell is used for operating the pumps to circulate the electrolyte through the stack and to overcome pressure losses in the pipes. The pipe losses are considered to be low in comparison to the pressure losses in the porous electrode and flow frame. The viscous resistance of the electrolyte flow, which depends on the porosity of the electrode and viscosity of the electrolyte, results in a pressure drop between the entry and exit of the stack. The dependence of the various parameters on a pressure drop is given by Darcy’s law:
where is the pressure drop between the inlet and outlet, is the permeability of the electrode (depends on porosity of ), Q is the flow rate of electrolyte, L is the length of electrode and A is the flow cross sectional area, respectively.
Pressure drop measurement is the simplest but very important diagnostic technique to ensure that the system configuration is functioning properly at any given point of time. The real time data of operating pressure gives information about possible failure if there is any deviation from the normal operation. Failures might be from leakage, excessive compression of the electrode, pipe breakage or clogging due to electrolyte precipitation, etc. For the assessment of the energy efficiency, pressure drop is necessary. The net energy efficiency of the system is obtained after deducting the pump power from the system efficiency. The pump power for the specific flow rate can be estimated by Equation (13).
where is the pump power, is the pressure drop, is the flow rate and is the pump efficiency.
The simplest way to measure the pressure drop is to use pressure transducers at different sections. For the given section, the pressure drop is the difference between the upstream and downstream readings of the transducers. The energy consumed by the pumps is directly proportional to the difference in pressure between the inlet and outlet. For a well-designed and operated system, the energy consumed by the pumps should be approximately 2–3% of the total energy generated in a kW size stack [129].
During the initial operation of a VRFB cell or stack, the same electrolyte is placed in both tanks. The initial difference in pressure between each half-cell should be the same, if the two half-cells are assembled identically keeping the same felt compression on both sides. The viscosity of the electrolyte in the two half-cell reservoirs changes upon charging due to the formation of different species in each solution. Skyllas-Kazacos and co-workers showed that the viscosity and density of the positive and negative half-cell electrolytes varies almost linearly with changes in the SOC [130]. Subsequent studies by other groups confirmed that the viscosity of the negative half-cell electrolyte is at a maximum at the fully discharged condition and at the lowest in the charged condition in both half-cells [129,131,132]. This is reflected in the changes in pressure drop in the negative and positive half-cells during the operation of a VRFB as a function of SOC, as illustrated in Figure 17. The pressure difference is not significant in the positive half-cell as the change in viscosity during charging and discharging is minimal compared to the negative half-cell.
Pressure drop losses are related to system configuration due to constant electrolyte circulation and depends on the cell design and flow rate. Pressure drop should be kept as low as possible to minimize the pumping power without compromising the flow rate of the electrolyte. Several approaches have been investigated to reduce the pressure in order to minimize the pumping power. A simple method is to make the flow path shorter by using wide rectangular electrodes. However, this type of distorted configuration should be avoided in order to achieve minimum pressure loss, which may result in a non-uniform distribution of electrolytes across the electrodes.
One way to reduce the pressure drop is to use a porous electrode with a low compression level. In a normal cell arrangement, the graphite bipolar plate and porous electrode are compressed together to achieve a minimal contact resistance. However, this leads to a higher pressure drop through the felt and an increased pumping energy loss in the cell. In an alternative approach, composite bipolar electrodes were fabricated by Haddadi-Asl et al. [133] by hot-pressing the carbon felt onto the conducting plastic substrate in order to make electrical connection with the carbon filler within the matrix of the bipolar plate. The electrodes were installed in a cell without felt compression to achieve a lower pressure drop; however, despite the relatively low contact resistance between the hot-pressed graphite felt and the substrate, this kind of arrangement still suffered from poorer overall conductivity compared with graphite plates. In addition, the hot-pressed electrodes suffered from poor stability of the binding interface during overcharge. Felt compression has however been shown to reduce the resistivity of the graphite felt and is highly desirable in minimizing ohmic losses in a flow cell. Electrode compression levels of 20–30% are thus typically used to achieve a minimal contact resistance, as well as an optimal balance between felt resistivity and pressure drop [134,135]. Higher levels of electrode compression can however lead to a non-uniform flow distribution, resulting in local overcharging due to a non-uniform current distribution which eventually degrades the bipolar plates [129,135,136].
Therefore, efforts have been made to design flow frames that can ensure uniform flow through the porous electrode [13]. Operating with a high electrolyte flow rate is a way to achieve a more uniform flow distribution [137], but this increases the pressure drop resulting in increased pumping energy losses.
Recent advances in fuel cell designs have led to the development of VRFB cells that combine different types of flow field (serpentine, interdigitated, open channel, etc.) in the bipolar plate and thin porous carbon paper electrodes that allow a substantial reduction in the anode-cathode gap [40,59,60,138,139,140,141]. A significant increase in peak power was observed when incorporating the serpentine flow field and carbon paper electrode in a “zero-gap” cell [64,69]. For the different types of flow field investigated, the serpentine and interdigitated flow fields exhibited a higher performance due to the enhanced convection within the through plane direction compared to channels parallel to the direction of flow [141,142]. However, a range of pressure drop values has been reported with the incorporation of the interdigitated, serpentine or conventional design in VRFBs [40,59,60,138].
Alternative approaches used for the reduction of pressure drop have included the stacking of two porous electrodes in each half-cell [143,144]. For example, the stacking of a high surface area, carbon felt electrode with high electrochemical activity facing the membrane and a higher porosity, low resistance electrode facing the bipolar plate has been used to minimize the pressure drop and polarization losses in a cell. Another way is to incorporate the flow channels within the porous electrode itself, as shown in Figure 18. The use of flow channels at the interface between the two porous electrodes has been investigated for the reduction of pressure drop. Similarly, a study has reported the use of tapered, interdigitated channels in an electrode stacked together with another similar porous carbon electrode. The result showed a reduction in pressure drop by one third at a given flow rate [138].
There are very few publications on the incorporation of channels onto the porous electrodes, while a number of patents have been filed [145,146,147]. Inoue et al. [143] proposed parallel channels in the direction of flow with various groove shapes, such as convex and semicircular, and Golden Energy Fuel Cell Co., Ltd., (Beijing, China) [146] more recently incorporated parallel channels of 1–5 mm width by 1–5 mm depth for a carbon felt thickness of 2–10 mm, while various felt patterns with parallel, half-parallel, non-uniform parallel channels and nonlinear channels have been investigated by the Sumitomo Electric Ind. Ltd. (Osaka, Japan) and Kansai Electric Power Corp. (Osaka, Japan) [147]. The lowest pressure drop was exhibited by the parallel channel extending from inlet to outlet, but the uniformity of the electrolyte flow throughout the porous felt may be questionable. Bhattarai et al. [129] proposed the design of four different types of channels, namely cross poked circular channel, rectangular open channel, interdigitated open channel and interdigitated circular poked channel. This study showed that the interdigitated open channel and interdigitated circular poked channel reduced the pressure drop with a uniform flow of electrolytes [129].
Pressure drop and its measurement has wide implications and can be used as a diagnostic tool in VRFBs. Not only should the pressure drop through the stack be minimized to reduce pumping energy losses, but the differential pressure between the two half-cells in the stack should also be as minimal as possible to avoid damaging the membrane as excessive pressure difference between the half-cells may induce electrolyte crossover through the membrane. An excessive pressure difference can expose the membrane to the high stress. The pressure drop data can also be used to predict the potential occurrence of precipitation inside the stack, while also providing a qualitative estimation of the flow rate. The previously described sinusoidal or saw-tooth pressure drop behavior during charging and discharging of a VRFB (Figure 17), can even be used to predict the SOC of the cell, although other methods, such as open-circuit cell potential measurement, are probably more reliable. In commercial systems, pressure data could be monitored together with an open circuit cell for improved accuracy, but other methods are more useful in being able to pick up any imbalance in the two half-cell SOCs due to electrolyte cross over or differential transfer of vanadium ions through the membrane.
Pressure drop measurement is a relatively easy and inexpensive technique to implement. Pressure drop information provides information on the changes in the electrolyte flow, but it cannot pinpoint the location of the problem. Similarly, it is also very difficult to employ transducers in each component to measure the pressure drop individually.
2.1.7. State-of-Charge Monitoring Methods
The most widely used SOC monitoring method for flow batteries is the open-circuit cell that was initially proposed by NASA and used in the Fe/Cr flow battery program in the 1980s. This method relies, however, on the two half-cells being balanced. It is well known however, that an imbalance between the oxidation states in the two half-cells can arise as a result of side reactions and differential rates of transfer of the active species across the membrane. Side reactions lead to losses of capacity that can only be restored by implementing a rebalancing cell in the system. In the case of the VRFB however, the use of the same element in both half-cells also allows most of the capacity losses to be restored by a simple periodic remixing of the two half-cell solutions. It is important therefore to be able to detect any imbalances in the cell in order to implement appropriate control actions to restore capacity loss during the operation of a VRFB. A number of methods to monitor individual half-cell electrolyte SOCs were thus proposed by Skyllas-Kazacos and co-workers in the late 1980s [148]. These methods included UV-Visible spectroscopy and conductivity measurement, the latter relying on the fact that the conductivities of the two half-cell solutions change linearly with SOC. Half-cell electrolyte potential monitoring was also explored by Corcuera et al. [86], but this method is subject to errors associated with drifts in reference electrode measurements during long-term operation. The conductivity method is also subject to errors, in this case, due to the transfer of solution species across the membrane that cause changes in the electrolyte composition over time. A similar issue can occur with spectroscopic measurements, but to date, several research groups have explored its application for SOC monitoring in the VRFB.
2.1.8. Spectroscopic Measurement Method
The properties of the electrolyte change significantly during the charging and discharging of the VRFBs. Each oxidation state of the vanadium species is associated with a specific color. Skyllas-Kazacos and coworkers [148] first proposed the use of spectroscopic methods to measure the state of charge (SOC) of a VRFB though transmission or absorption spectra. Monitoring of the SOC through spectroscopy is not dependent on the electrochemistry and offers in situ analysis. It also allows the SOC of each half-cell electrolyte to be independently measured, thereby allowing for electrolyte imbalances to be detected and corrected by partial or complete remixing of the two half-cell solutions [149].
Vanadium species in aqueous solutions are highly colored and have high absorption in the visible region [150,151,152,153,154,155,156,157]. Ultraviolet-visible (UV-Vis) spectroscopy offers an accurate and direct method to determine concentration. This has been demonstrated for V2+/V3+ mixtures and for dilute mixtures of VO+2 and VO2+ [155,158]. The principle is based on the absorption capability of molecules with π electrons or non-bonding (n) electrons in the UV-vis wavelength to excite to higher anti-bonding molecular orbitals. Electrons which are easily excited have longer wavelengths of light for absorption. The configuration utilizes the spectrometer and light source, which can be a single device or separate based on the application. UV-vis spectroscopic analysis is dependent on Beer’s law for quantification and a low concentration of electrolyte is used (usually below 0.15 M) to comply with Beer’s Law absorbance limits of 1. At low concentrations, the absorbance is directly proportional to the concentration of the electrolyte [149,159]. Beer’s law relates the relationship between the concentration of material and absorbance as
where is the absorbance, is the concentration, is the path length and is the absorptivity (molar) constant. For the in situ UV-vis measurement, a separate section is customized on the path of electrolyte flow to acquire the real time data, as shown in Figure 19.
Although most of the studies employ ex situ UV-vis spectroscopy due to the simplicity, there are also a few in situ studies. Tang et al. [157] performed the absorption spectroscopic measurement of the SOC of vanadium electrolyte during in situ electrolysis and bypassing in an operating VRFB. The challenge with the absorption UV-vis spectra is that the positive redox couple does not obey the Beer’s law and hence, is not linear with respect to mixture components, due to VO+2 and VO2+ interference at high concentrations. Therefore, an in situ spectroscopic method utilizing the transmission spectra is used to monitor the electrolytes. Transmission spectra utilizes the entire spectrum range and has a better signal to noise ratio. Liu et al. [161,162] utilized an in-house built transmission spectrum analytical system with a customized adsorption cell with two glass windows to allow electrolyte flow. Zhang et al. [160] employed the on-line electrolyte spectroscopic monitoring configuration. An in-house built absorption cell with two inlet and two outlets were utilized to obtain the transmission spectra. The system can be utilized to calculate the state of charge of the electrolyte with appropriate calculation.
A synchrotron based in situ study utilizing X-ray near absorption spectroscopy (XANES) was used to investigate the evolution of the oxidation state of vanadium ions in both positive and negative redox couple during cell cycling [163]. A VRFB cell was placed on the stage and the electrolyte was circulated using a PVC pipe except in a section where a kapton tube was utilized for the X-rays. The X-ray was passed from one side to another side of the kapton tube to collect the spectra. The schematic diagram of the whole arrangement is shown in Figure 20. A charge-discharge method was proposed, where the cell is first charged at a constant current mode till 1.65 V, followed by a constant voltage charging process to achieve 100% SOC. Full utilization of the electrolyte was achieved using this technique.
2.1.9. Imaging Techniques
Imaging techniques are mainly employed to reveal changes in the interior of the materials (i.e., microstructural change) and trace the electrolyte flow in VRFB cells. The non-destructive way of imaging allows VRFB cell characterization during various operating conditions and stages of cell cycling. In situ imaging is performed basically by two methods in VRFBs, namely X-ray imaging and neutron imaging.
X-ray imaging-X-ray imaging techniques have long been used to investigate microstructural changes in solid oxide fuel cells [164,165,166,167,168,169,170,171], lithium ion batteries [172], polymer electrolyte fuel cells and electrolyzers [173,174,175]. The technique is useful for the extraction of parameters, such as surface area, shape, porosity and tortuosity, which are required for modelling. X-ray computed tomography carried out for in situ studies of VRFBs is limited. The system consists of an X-ray source, a series of detectors and a rotational platform for the object being imaged. In this technique, images are recorded by rotating the sample around the vertical axis and taking the image at angular intervals. With the aid of software, the images are reconstructed to obtain the 3D output (tomography). An image is usually called a slice, as it signifies the scan of the object along that particular plane if it is sliced. The images are analyzed with the Beer-Lambert law, which characterizes the decrease in intensity when the object is directed with X-rays from multiple directions.
Jervis et al. [176] employed X-ray computed tomography (CT) to study the carbon felt material during the operation of a VRFB cell. To maximize the X-ray penetration, the cell was constructed from polypropylene. Similarly, to reduce X-ray attenuation the wall thickness was minimized. A compromise was made between the size and volume of the cell to fit within the interests of the CT and flow cell. Gebhard et al. [177] examined the porous electrode with a customized cell to study the invasive behavior of the electrolytes and their distribution. To enable the imaging of the electrodes, the material selection was made with the aim to minimize radiation absorption. Similarly, Bevilacqua et al. [178] utilized X-ray visualization to investigate the effect of thermal treatment of the porous electrode on the wetting properties, saturation and changes in the electrochemically active surface area.
Neutron imaging- The neutron imaging is a non-destructive technique as it interacts weakly with most of the common materials [179,180,181,182]. The interaction of neutrons is strong only with a few elements, the noticeable one being hydrogen [183]. In comparison to X-ray imaging, neutron imaging is more appropriate, as hydrogen has a high neutron cross section, while the other components have a relatively low cross section. Due to this characteristic, neutrons pass through the cell components but are scattered in the aqueous solution. This results in the easier distinction between the hydrogen dense solution and low-density gas phase fluid. The technique has been widely studied in polymer electrolyte fuel cells [184,185,186,187,188,189,190,191,192,193] and direct methanol fuel cells [194,195]. VRFBs have a liquid phase in both halves of the cell, so they require special cell configuration for neutron imaging. In this technique, simple projection imaging or tomography can be applied. The working principle is the same as that of X-ray tomography. The sample is rotated along the vertical axis with an array of projection over angular intervals. The image reconstruction is performed based on a back-projection algorithm. Neutron radiography was implemented in a VRFB study by Clement et al. [196]. The customized cell was designed for the study of gas evolution reaction detection. With the aid of a PTFE steeped curvet, the coefficient for neutron attenuation for the flow field consisting of graphite composite, as well as for the electrolyte, was determined. The study showed the possibility of utilizing the neutron imaging technique for in situ diagnostics of VRFBs.
A combined electrochemical image methodology embedded in scanning electrochemical microscopy (SECM) and atomic force microscopy (AFM) was developed [197] to investigate the effect of interfacial processes on electron transfer. SECM was introduced to characterize the spatiotemporally resolved changes in the transfer of electrons during operation. An in situ AFM technique was used to confirm the surface formation, which was correlated with the result obtained from SECM. This technique is important to know the interfacial process associated with adsorption and film formation at higher concentration. Similarly, a combination of the voltammetry and SECM has also been used to investigate the characterization of carbon material toward the redox reaction [198,199].
Overall, different types of in situ tools used in VRFBs have been described in detail in the review paper. Table 4 summarizes the in situ diagnostic tools mentioned in the above.
3. Summary and Recommendations
A wide range of in situ techniques have been implemented in VRFB research to improve the performance of the cell/stack and understand the various mechanisms associated with the electrode reactions, cell performance and material behavior. Cell cycling and polarization tests are commonly used techniques in VRFBs that provide the most important parameters that determine the battery performance, such as efficiencies, resistance and capacity. The insertion of a reference electrode at the cell outlet, inside the porous electrodes, or at the membrane surface, are a few examples of attempts made to split the redox reactions in the two half-cells and investigate them separately. The segmented cell approach, as well as multi-reference electrode insertion inside the electrode have recently been used for the spatially resolved analysis of cell performance. Segmented cell technology, although requiring a complex hardware setup, seems to be a strong diagnostic tool for the study of localized flow distribution and reaction kinetics. EIS is also a strong diagnostic tool but is not used frequently in VRFB research to date for in situ investigation. UV-vis and XANES are being used to investigate the evolution of the oxidation state of vanadium ions during cell cycling, potentially for insitu SOC monitoring during long-term operation of VRFBs. Imaging techniques are mainly employed to study changes in microstructure and trace the electrolyte flow inside the porous electrodes in VRFB cells. Non-destructive ways of imaging allow characterization of the VRFB cell during the various operating conditions and stages of cell cycling.
The development of new types of in situ diagnostic tools and optimization of the existing ones are necessary to acquire information about the VRFBs under different operating conditions. It is of great importance to develop diagnostic techniques to provide detailed information about electrode/electrolyte interface. Such diagnostic techniques should convey information about the electron transfer mechanisms beyond the currently used techniques and with higher resolution. Determination of the overpotential in each half-cell is of immense importance for the evaluation of voltage losses both in the early stages of materials selection and optimization, but also for state-of-health monitoring of VRFBs during long-term operation in the field. SOC monitoring is very important for the efficient operation of VRFBs and in battery controller development. SOC sensors based on solution potential measurement rely on stable reference electrodes that do not drift over time. While double junction reference electrodes can be effective in the short term, the development of a reference electrode with good long-term stability is necessary. During the VRFB operation, the transport of electroactive species and ions occurs across the ion exchange membrane via migration, diffusion and convection. Mathematical modelling and simulation of these processes can help to predict capacity losses and the thermal behavior of VRFBs under different operating conditions; however, there is limited availability of reliable membrane parameters for such modelling studies. A new diagnostic technique to aid in the investigation of the dominant membrane transport phenomena would allow broader testing of membrane candidate materials for VRFB modelling and simulation studies. A major issue with all flow battery optimization studies is the non-uniformity of the carbon felt porous electrode materials. This leads to a non-uniform compression in assembled stacks that can create an irregular flow distribution and non-uniform current distribution. While segmented cells can help to identify these problems, current segmented cell designs suffer from the same problem. Improved designs are needed to ensure the same felt electrode compression and the same contact resistance during the operation of the cell. The segmentation of the cell should be conducted from a single block of appropriate material to ensure exactly the same resistance in all the segments.
While many in situ techniques have been developed and are currently used for the characterization of laboratory-scale VRFBs, their implementation in commercial VRFBs in the field has yet to be described. In situ methods using EIS and Fourier transform analysis are currently being evaluated at UNSW and elsewhere, to identify changes in cell performance during the long-term operation of multi-cell stacks and to investigate the effect of ripple current on VRFB performance and cycle life [200], but many opportunities still exist to implement these techniques in commercial battery management systems for state of health monitoring and fault detection. New in situ diagnostic tools should focus on providing more detailed information on electron transfer mechanisms than the current EIS technique. Other important areas of improvement are to find stable, long running reference electrodes to allow the accurate measurement of potential drop in each half-cell. Flow visualization through the electrode in an operating cell would provide the information on the mass transport loss, as they can help to determine the velocity of electrolytes and to minimize the pressure loss. As capacity loss is one of the major problems in VRFBs, diagnostic tools should concentrate on providing data on the major contributors to the capacity decay, such as electrodes and membranes.
Author Contributions
Conceptualization, P.C.G. and A.B., methodology, T.M.L. and Q.Y., writing-original draft preparation, P.C.G., A.B. and N.W., review and editing, M.S.-K., Supervision, Q.Y. All authors have read and agreed to the published version of the manuscript.
Funding
This research received no external funding.
Institutional Review Board Statement
Not applicable.
Informed Consent Statement
Not applicable.
Data Availability Statement
No new data were created or analyzed in this study. Data sharing is not applicable to this article.
Conflicts of Interest
The authors declare no conflict of interest.
References
- Suberu, M.Y.; Mustafa, M.W.; Bashir, N. Energy storage systems for renewable energy power sector integration and mitigation of intermittency. Renew. Sustain. Energy Rev. 2014, 35, 499–514. [Google Scholar] [CrossRef]
- Dunn, B.; Kamath, H.; Tarascon, J.-M. Electrical energy storage for the grid: A battery of choices. Science 2011, 334, 928–935. [Google Scholar] [CrossRef] [Green Version]
- Shigematsu, T. Redox flow battery for energy storage. SEI Tech. Rev. 2011, 73, 13. [Google Scholar]
- De Leon, C.P.; Frías-Ferrer, A.; González-García, J.; Szánto, D.A.; Walsh, F.C. Walsh, Redox flow cells for energy conversion. J. Power Sources 2006, 160, 716–732. [Google Scholar] [CrossRef] [Green Version]
- Parasuraman, A.; Lim, T.M.; Menictas, C.; Skyllas-Kazacos, M. Review of material research and development for vanadium redox flow battery applications. Electrochim. Acta 2013, 101, 27–40. [Google Scholar] [CrossRef]
- Kear, G.; Shah, A.A.; Walsh, F.C. Development of the all—Vanadium redox flow battery for energy storage: A review of techno-logical, financial and policy aspects. Int. J. Energy Res. 2012, 36, 1105–1120. [Google Scholar] [CrossRef]
- Skyllas-Kazacos, M.; Rychcik, M.; Robins, R.G.; Fane, A.G.; Green, M.A. New all—Vanadium redox flow cell. J. Electro Chem. Soc. 1986, 133, 1057. [Google Scholar] [CrossRef]
- Skyllaskazacos, M.; Chakrabarti, H.; Hajimolana, S.A.; Mjalli, F.S.; Saleem, M. Progress in flow battery research and development. J. Electrochem. Soc. 2011, 158, R55–R79. [Google Scholar] [CrossRef]
- Leung, P.; Li, X.; de Leon, C.P.; Berlouis, L.; Low, C.T.J.; Walsh, F.C. Progress in redox flow batteries, remaining challenges and their applications in energy storage. RSC Adv. 2012, 2, 10125–10156. [Google Scholar] [CrossRef]
- Poullikkas, A. A comparative overview of large-scale battery systems for electricity storage. Renew. Sustain. Energy Rev. 2013, 27, 778–788. [Google Scholar] [CrossRef]
- Wen, Y.; Xu, Y.; Cheng, J.; Cao, G.; Yang, Y. Investigation on the stability of electrolyte in vanadium flow batteries. Electrochim. Acta 2013, 96, 268–273. [Google Scholar] [CrossRef]
- Rahman, F.; Skyllas-Kazacos, M. Vanadium redox battery: Positive half-cell electrolyte studies. J. Power Sources 2009, 189, 1212–1219. [Google Scholar] [CrossRef]
- Kim, S.; Thomsen, E.; Xia, G.; Nie, Z.; Bao, J.; Recknagle, K.; Wang, W.; Viswanathan, V.; Luo, Q.; Wei, X.; et al. 1 kW/1 kWh advanced vanadium redox flow battery utilizing mixed acid electrolytes. J. Power Sources 2013, 237, 300–309. [Google Scholar] [CrossRef]
- Roe, S.; Menictas, C.; Skyllas-Kazacos, M. A High energy density vanadium redox flow battery with 3 m vanadium electrolyte. J. Electrochem. Soc. 2015, 163, A5023–A5028. [Google Scholar] [CrossRef]
- Wen, Y.; Zhang, H.; Qian, P.; Zhao, P.; Zhou, H.; Yi, B. Investigations on the Electrode Process of Concentrated V(IV)/V(V) Species in a Vanadium Redox Flow Battery. Acta Phys. Chim. Sin. 2006, 22, 403–408. [Google Scholar] [CrossRef]
- Liu, Y.; Yin, P.; Chen, J.; Cui, B.; Zhang, C.; Wu, F. Conducting polymer composites: Material synthesis and applications in electro-chemical capacitive energy storage. Mater. Chem. Front. 2017, 1, 251–268. [Google Scholar]
- Sun, B.; Skyllas-Kazacos, M. Modification of graphite electrode materials for vanadium redox flow battery application—I. Therm. Treat. Electrochim. Acta 1992, 37, 1253–1260. [Google Scholar] [CrossRef]
- Flox, C.; Rubio-García, J.; Skoumal, M.; Andreu, T.; Morante, J. Thermo–chemical treatments based on NH3/O2 for improved graphite-based fiber electrodes in vanadium redox flow batteries. Carbon 2013, 60, 280–288. [Google Scholar] [CrossRef]
- Kim, K.J.; Kim, Y.-J.; Kim, J.-H.; Park, M.-S. The effects of surface modification on carbon felt electrodes for use in vanadium redox flow batteries. Mater. Chem. Phys. 2011, 131, 547–553. [Google Scholar] [CrossRef]
- Langner, J.; Bruns, M.; Dixon, D.; Nefedov, A.; Wöll, C.; Scheiba, F.; Ehrenberg, H.; Roth, C.; Melke, J. Surface properties and graphitization of polyacrylonitrile based fiber electrodes affecting the negative half-cell reaction in vanadium redox flow batteries. J. Power Sources 2016, 321, 210–218. [Google Scholar] [CrossRef]
- Ghimire, P.C.; Schweiss, R.; Scherer, G.G.; Lim, T.M.; Wai, N.; Bhattarai, A.; Yan, Q. Optimization of thermal oxidation of electrodes for the performance enhancement in all-vanadium redox flow battery. Carbon 2019, 155, 176–185. [Google Scholar] [CrossRef]
- Kim, K.J.; Park, M.-S.; Kim, J.Y.; Kim, Y.-J. A Study on the effect of surface modifications of the carbon felt electrode on the performance of vanadium redox flow battery. ECS Meet. Abstr. 2010, 405. [Google Scholar] [CrossRef]
- Li, W.W.; Chu, Y.Q.; Ma, C.A. Highly hydroxylated graphite felts used as electrodes for a vanadium redox flow battery. Adv. Mater. Res. 2014, 936, 471–475. [Google Scholar] [CrossRef]
- Sun, B.; Skyllas-Kazacos, M. Chemical modification of graphite electrode materials for vanadium redox flow battery applica-tion—part II. Acid treatments. Electrochim. Acta 1992, 37, 2459–2465. [Google Scholar] [CrossRef]
- Wu, T.; Huang, K.; Liu, S.; Zhuang, S.; Fang, D.; Li, S.; Lu, D.; Su, A. Hydrothermal ammoniated treatment of PAN-graphite felt for vanadium redox flow battery. J. Solid State Electrochem. 2011, 16, 579–585. [Google Scholar] [CrossRef]
- Kim, K.J.; Lee, S.-W.; Yim, T.; Kim, J.-G.; Choi, J.W.; Kim, J.H.; Park, M.-S.; Kim, Y.-J. A new strategy for integrating abundant oxygen functional groups into carbon felt electrode for vanadium redox flow batteries. Sci. Rep. 2015, 4, 6906. [Google Scholar] [CrossRef] [PubMed]
- Sun, B.; Skyllas-Kazakos, M. Chemical modification and electrochemical behaviour of graphite fibre in acidic vanadium solution. Electrochim. Acta 1991, 36, 513–517. [Google Scholar] [CrossRef]
- Kim, K.J.; Park, M.-S.; Kim, J.-H.; Hwang, U.; Lee, N.J.; Jeong, G.; Kim, Y.-J. Novel catalytic effects of Mn3O4 for all vanadium redox flow batteries. Chem. Commun. 2012, 48, 5455–5457. [Google Scholar] [CrossRef]
- González, Z.; Sanchez, A.S.; Blanco, C.; Granda, M.; Menéndez, R.; Santamaría, R. Enhanced performance of a Bi-modified graphite felt as the positive electrode of a vanadium redox flow battery. Electrochem. Commun. 2011, 13, 1379–1382. [Google Scholar] [CrossRef] [Green Version]
- Li, B.; Gu, M.; Nie, Z.; Wei, X.; Wang, C.; Sprenkle, V.; Wang, W. Nanorod niobium oxide as powerful catalysts for an all vanadium redox flow battery. Nano Lett. 2014, 14, 158–165. [Google Scholar] [CrossRef] [PubMed]
- Yao, C.; Zhang, H.; Liu, T.; Li, X.; Liu, Z. Carbon paper coated with supported tungsten trioxide as novel electrode for all-vanadium flow battery. J. Power Sources 2012, 218, 455–461. [Google Scholar] [CrossRef]
- Wei, L.; Zhao, T.; Zeng, L.; Zhou, X.; Zeng, Y. Titanium Carbide Nanoparticle—Decorated Electrode Enables Significant En-hancement in Performance of All—Vanadium Redox Flow Batteries. Energy Technol. 2016, 4, 990–996. [Google Scholar] [CrossRef]
- Yang, C.; Wang, H.; Lu, S.; Wu, C.; Liu, Y.; Tan, Q.; Liang, D.; Xiang, Y. Titanium nitride as an electrocatalyst for V(II)/V(III) redox couples in all-vanadium redox flow batteries. Electrochim. Acta 2015, 182, 834–840. [Google Scholar] [CrossRef]
- Ghimire, P.C.; Schweiss, R.; Scherer, G.G.; Wai, N.; Lim, T.M.; Bhattarai, A.; Nguyen, T.D.; Yan, Q. Titanium carbide-decorated graphite felt as high performance negative electrode in vanadium redox flow batteries. J. Mater. Chem. A 2018, 6, 6625–6632. [Google Scholar] [CrossRef]
- Cao, L.; Skyllas-Kazacos, M.; Wang, D.-W. modification based on moo3 as electrocatalysts for high power density vanadium redox flow batteries. ChemElectroChem 2017, 4, 1836–1839. [Google Scholar] [CrossRef]
- Schwenzer, B.; Zhang, J.; Kim, S.; Li, L.; Liu, J.; Yang, Z. Membrane development for vanadium redox flow batteries. ChemSusChem 2011, 4, 1388–1406. [Google Scholar] [CrossRef] [PubMed]
- Sukkar, T.; Skyllas-Kazacos, M. Modification of membranes using polyelectrolytes to improve water transfer properties in the vanadium redox battery. J. Membr. Sci. 2003, 222, 249–264. [Google Scholar] [CrossRef]
- Mohammadi, T.; Skyllas-Kazacos, M. Characterisation of novel composite membrane for redox flow battery applications. J. Membr. Sci. 1995, 98, 77–87. [Google Scholar] [CrossRef]
- Blanc, C.; Rufer, A. Optimization of the operating point of a vanadium redox flow battery. In Proceedings of the 2009 IEEE Energy Conversion Congress and Exposition, San Jose, CA, USA, 20–24 September 2009; pp. 2600–2605. [Google Scholar]
- Houser, J.; Clement, J.; Pezeshki, A.; Mench, M.M. Influence of architecture and material properties on vanadium redox flow battery performance. J. Power Sources 2016, 302, 369–377. [Google Scholar] [CrossRef]
- Zhang, M.; Moore, M.; Watson, J.S.; Zawodzinski, T.A.; Counce, R.M. Capital Cost Sensitivity analysis of an all-vanadium redox-flow battery. J. Electrochem. Soc. 2012, 159, A1183–A1188. [Google Scholar] [CrossRef]
- Eckroad, S. Vanadium Redox Flow Batteries: An In-Depth Analysis; Electric Power Research Institute: Palo Alto, CA, USA, 2007; p. 1014836. [Google Scholar]
- Chen, D.; Hickner, M.; Agar, E.; Kumbur, E.C. Selective anion exchange membranes for high coulombic efficiency vanadium redox flow batteries. Electrochem. Commun. 2013, 26, 37–40. [Google Scholar] [CrossRef]
- Agar, E.; Dennison, C.; Knehr, K.; Kumbur, E. Identification of performance limiting electrode using asymmetric cell configuration in vanadium redox flow batteries. J. Power Sources 2013, 225, 89–94. [Google Scholar] [CrossRef]
- Benjamin, A.; Agar, E.; Dennison, C.; Kumbur, E. On the quantification of coulombic efficiency for vanadium redox flow batteries: Cutoff voltages vs. state-of-charge limits. Electrochem. Commun. 2013, 35, 42–44. [Google Scholar] [CrossRef]
- Ulaganathan, M.; Jain, A.; Aravindan, V.; Jayaraman, S.; Ling, W.C.; Lim, T.M.; Srinivasan, M.; Yan, Q.; Madhavi, S. Bio-mass derived mesoporous carbon as superior electrode in all vanadium redox flow battery with multicouple reactions. J. Power Sources 2015, 274, 846–850. [Google Scholar] [CrossRef]
- Janoschka, T.; Martin, N.; Martin, U.; Friebe, C.; Morgenstern, S.; Hiller, H.; Hager, M.D.; Schubert, U. An aqueous, polymer-based redox-flow battery using non-corrosive, safe, and low-cost materials. Nat. Cell Biol. 2015, 527, 78–81. [Google Scholar] [CrossRef] [PubMed]
- Park, M.; Ryu, J.; Cho, J. Nanostructured electrocatalysts for all—Vanadium redox flow batteries. Chemistry 2015, 10, 2096–2110. [Google Scholar] [CrossRef]
- Maharjan, M.; Bhattarai, A.; Ulaganathan, M.; Wai, N.; Oo, M.O.; Wang, J.-Y.; Lim, T.M. High surface area bio-waste based carbon as a superior electrode for vanadium redox flow battery. J. Power Sources 2017, 362, 50–56. [Google Scholar] [CrossRef] [Green Version]
- Skyllas-Kazacos, M.; Kazacos, G.; Poon, G.; Verseema, H. Recent advances with UNSW vanadium-based redox flow batteries. Int. J. Energy Res. 2009, 34, 182–189. [Google Scholar] [CrossRef]
- Sukkar, T.; Skyllas-Kazacos, M. Water transfer behaviour across cation exchange membranes in the vanadium redox battery. J. Membr. Sci. 2003, 222, 235–247. [Google Scholar] [CrossRef]
- Mohammadi, T.; Chieng, S.; Kazacos, M.S. Water transport study across commercial ion exchange membranes in the vanadium redox flow battery. J. Membr. Sci. 1997, 133, 151–159. [Google Scholar] [CrossRef]
- Akter, P.; Li, Y.; Bao, J.; Skyllas-Kazacos, M.; Rahman, M.F. Optimal charging of vanadium redox flow battery with time-varying input power. Batteries 2019, 5, 20. [Google Scholar] [CrossRef] [Green Version]
- Kim, K.J.; Park, M.-S.; Kim, Y.-J.; Kim, J.H.; Dou, S.X.; Skyllas-Kazacos, M. A technology review of electrodes and reaction mechanisms in vanadium redox flow batteries. J. Mater. Chem. A 2015, 3, 16913–16933. [Google Scholar] [CrossRef]
- Qian, P.; Zhang, H.; Chen, J.; Wen, Y.; Luo, Q.; Liu, Z.; You, D.; Yi, B. A novel electrode-bipolar plate assembly for vanadium redox flow battery applications. J. Power Sources 2008, 175, 613–620. [Google Scholar] [CrossRef]
- Yoon, K.J.; Huang, W.; Ye, G.; Gopalan, S.; Pal, U.B.; Seccombe, D.A., Jr. Electrochemical performance of solid oxide fuel cells manufactured by single step co-firing process. J. Electrochem. Soc. 2007, 154, B389–B395. [Google Scholar] [CrossRef]
- Mench, M.M. Fuel Cell Engines; John Wiley & Sons: Hoboken, NJ, USA, 2008. [Google Scholar]
- Aaron, D.; Tang, Z.; Papandrew, A.B.; Zawodzinski, T.A. Polarization curve analysis of all-vanadium redox flow batteries. J. Appl. Electrochem. 2011, 41, 1175–1182. [Google Scholar] [CrossRef]
- Kumar, S.; Jayanti, S. Effect of flow field on the performance of an all-vanadium redox flow battery. J. Power Sources 2016, 307, 782–787. [Google Scholar] [CrossRef]
- Xu, Q.; Zhao, T.; Zhang, C. Performance of a vanadium redox flow battery with and without flow fields. Electrochim. Acta 2014, 142, 61–67. [Google Scholar] [CrossRef]
- Liu, Q.H.; Grim, G.M.; Papandrew, A.B.; Turhan, A.; Zawodzinski, T.A.; Mench, M.M. High performance vanadium redox flow batteries with optimized electrode configuration and membrane selection. J. Electrochem. Soc. 2012, 159, A1246–A1252. [Google Scholar] [CrossRef]
- Maurya, S.; Nguyen, P.T.; Kim, Y.S.; Kang, Q.; Mukundan, R. Effect of flow field geometry on operating current density, capacity and performance of vanadium redox flow battery. J. Power Sources 2018, 404, 20–27. [Google Scholar] [CrossRef]
- Pezeshki, A.M.; Clement, J.T.; Veith, G.; Zawodzinski, T.A.; Mench, M.M. High performance electrodes in vanadium redox flow batteries through oxygen-enriched thermal activation. J. Power Sources 2015, 294, 333–338. [Google Scholar] [CrossRef] [Green Version]
- Aaron, D.; Liu, Q.; Tang, Z.; Grim, G.; Papandrew, A.; Turhan, A.; Zawodzinski, T.; Mench, M. Dramatic performance gains in vanadium redox flow batteries through modified cell architecture. J. Power Sources 2012, 206, 450–453. [Google Scholar] [CrossRef]
- Brown, L.D.; Neville, T.P.; Jervis, R.; Mason, T.J.; Shearing, P.R.; Brett, D.J. The effect of felt compression on the performance and pressure drop of all-vanadium redox flow batteries. J. Energy Storage 2016, 8, 91–98. [Google Scholar] [CrossRef] [Green Version]
- Yang, X.G.; Ye, Q.; Cheng, P.; Zhao, T.S. Effects of operating temperature on the performance of vanadium redox flow batteries. Appl. Energy 2015, 155, 349–353. [Google Scholar]
- Chen, J.-Y.; Hsieh, C.-L.; Hsu, N.-Y.; Chou, Y.-S.; Chen, Y.-S. Determining the limiting current density of vanadium redox flow batteries. Energies 2014, 7, 5863–5873. [Google Scholar] [CrossRef] [Green Version]
- Hung, Y.; Bu, Y.; Kubin, J.; Weinman, D. Effects of current scan rate on the polarization curve of vanadium redox flow batteries. In Proceedings of the 2017 International Energy and Sustainability Conference (IESC), New York, NY, USA, 19–20 October 2017; pp. 1–4. [Google Scholar]
- Darling, R.M.; Perry, M.L. The Influence of Electrode and channel configurations on flow-battery performance. ECS Meet. Abstr. 2014, 161, A1381. [Google Scholar] [CrossRef]
- Ertugrul, T.Y.; Clement, J.T.; Gandomi, Y.A.; Aaron, D.S.; Mench, M.M. In-situ current distribution and mass transport analysis via strip cell architecture for a vanadium redox flow battery. J. Power Sources 2019, 437, 226920. [Google Scholar] [CrossRef]
- Küver, A.; Vogel, I.; Vielstich, W. Distinct performance evaluation of a direct methanol SPE fuel cell. A new method using a dynamic hydrogen reference electrode. J. Power Sources 1994, 52, 77–80. [Google Scholar] [CrossRef]
- Büchi, F.; Scherer, G.G. Investigation of the transversal water profile in nafion membranes in polymer electrolyte fuel cells. J. Electrochem. Soc. 2001, 148, A183–A188. [Google Scholar] [CrossRef]
- Ren, X.; Springer, T.E.; Gottesfeld, S. Water and Methanol Uptakes in nafion membranes and membrane effects on direct methanol cell performance. J. Electrochem. Soc. 2000, 147, 92–98. [Google Scholar] [CrossRef]
- Elgammal, R.; Tang, Z.; Sun, C.-N.; Lawton, J.; Zawodzinski, T.A. Species uptake and mass transport in membranes for vanadium redox flow batteries. Electrochim. Acta 2017, 237, 1–11. [Google Scholar] [CrossRef] [Green Version]
- Langner, J.; Melke, J.; Ehrenberg, H.; Roth, C. Determination of overpotentials in all vanadium redox flow batteries. ECS Trans. 2014, 58, 1–7. [Google Scholar] [CrossRef]
- Ghimire, P.C. Electrode Modification and In-Situ Studies to Enhance the Performance of Vanadium Redox Flow Batteries. Ph.D. Thesis, Nanyang Technological University, Singapore, 2020. [Google Scholar]
- Bhattarai, A.; Whitehead, A.H.; Schweiss, R.; Scherer, G.G.; Skyllas-Kazacos, M.; Wai, N.; Nguyen, T.D.; Ghimire, P.C.; Oo, M.O.; Hng, H.H. Anomalous behavior of anion exchange membrane during operation of a vanadium redox flow battery. ACS Appl. Energy Mater. 2019, 2, 1712–1719. [Google Scholar] [CrossRef]
- Aaron, D.S.; Sun, C.-N.; Bright, M.; Papandrew, A.B.; Mench, M.M.; Zawodzinski, T.A. In situ kinetics studies in all-vanadium redox flow batteries. ECS Electrochem. Lett. 2013, 2, A29–A31. [Google Scholar] [CrossRef]
- Liu, Q.; Turhan, A.; Zawodzinski, T.A.; Mench, M.M. In situ potential distribution measurement in an all-vanadium flow battery. Chem. Commun. 2013, 49, 6292–6294. [Google Scholar] [CrossRef]
- Gandomi, Y.A.; Aaron, D.S.; Zawodzinski, T.A.; Mench, M.M. In Situ potential distribution measurement and validated model for all-vanadium redox flow battery. J. Electrochem. Soc. 2015, 163, A5188–A5201. [Google Scholar] [CrossRef] [Green Version]
- Ventosa, E.; Skoumal, M.; Vázquez, F.J.; Flox, C.; Morante, J.R. Operando studies of all-vanadium flow batteries: Easy-to-make reference electrode based on silver–silver sulfate. J. Power Sources 2014, 271, 556–560. [Google Scholar] [CrossRef]
- Choi, C.; Choi, Y.; Kim, S.; Jung, H.-Y.; Kim, H.-T. Resistor Design for the use of dynamic hydrogen electrode in vanadium redox flow batteries. Electrochim. Acta 2016, 213, 490–495. [Google Scholar] [CrossRef]
- Reed, D.; Thomsen, E.; Li, B.; Wang, W.; Nie, Z.; Koeppel, B.; Kizewski, J.; Sprenkle, V. Sprenkle, Stack developments in a kW class all va-nadium mixed acid redox flow battery at the Pacific Northwest National Laboratory. J. Electrochem. Soc. 2016, 163, A5211–A5219. [Google Scholar] [CrossRef] [Green Version]
- Schweiss, R.; Pritzl, A.; Meiser, C. Parasitic hydrogen evolution at different carbon fiber electrodes in vanadium redox flow batteries. J. Electrochem. Soc. 2016, 163, A2089–A2094. [Google Scholar] [CrossRef]
- Shah, A.; Al-Fetlawi, H.; Walsh, F. Dynamic modelling of hydrogen evolution effects in the all-vanadium redox flow battery. Electrochim. Acta 2010, 55, 1125–1139. [Google Scholar] [CrossRef] [Green Version]
- Corcuera, S.; Skyllas-Kazacos, M. State-of-charge monitoring and electrolyte rebalancing methods for the vanadium redox flow battery. Eur. Chem. Bull. 2012, 1, 511–519. [Google Scholar]
- Noack, J.; Wietschel, L.; Roznyatovskaya, N.; Pinkwart, K.; Tübke, J. Techno-Economic modeling and analysis of redox flow battery systems. Energies 2016, 9, 627. [Google Scholar] [CrossRef]
- Wandschneider, F.; Finke, D.; Grosjean, S.; Fischer, P.; Pinkwart, K.; Tübke, J.; Nirschl, H. Model of a vanadium redox flow battery with an anion exchange membrane and a Larminie-correction. J. Power Sources 2014, 272, 436–447. [Google Scholar] [CrossRef]
- Al-Fetlawi, H.; Shah, A.; Walsh, F. Non-isothermal modelling of the all-vanadium redox flow battery. Electrochim. Acta 2009, 55, 78–89. [Google Scholar] [CrossRef] [Green Version]
- Trovò, A.; Marini, G.; Sutto, A.; Alotto, P.; Giomo, M.; Moro, F.; Guarnieri, M. Standby thermal model of a vanadium redox flow battery stack with crossover and shunt-current effects. Appl. Energy 2019, 240, 893–906. [Google Scholar] [CrossRef]
- Schneider, I.; Kramer, D.; Wokaun, A.; Scherer, G. Spatially resolved characterization of PEFCs using simultaneously neutron radiography and locally resolved impedance spectroscopy. Electrochem. Commun. 2005, 7, 1393–1397. [Google Scholar] [CrossRef]
- Schneider, I.A.; Scherer, G.G. Local transient techniques in polymer electrolyte fuel cell (PEFC) diagnostics. In Handbook of Fuel Cells; Wiley: Hoboken, NJ, USA, 2010. [Google Scholar]
- Kalyvas, C.; Kucernak, A.; Brett, D.; Hinds, G.; Atkins, S.; Brandon, N. Spatially resolved diagnostic methods for polymer elec-trolyte fuel cells: A review. Wiley Interdiscip. Rev. Energy Environ. 2014, 3, 254–275. [Google Scholar] [CrossRef]
- Zamel, N.; Hanke-Rauschenbach, R.; Kirsch, S.; Bhattarai, A.; Gerteisen, D. Relating the N-shaped polarization curve of a PEM fuel cell to local oxygen starvation and hydrogen evolution. Int. J. Hydrogen Energy 2013, 38, 15318–15327. [Google Scholar] [CrossRef]
- Zamel, N.; Bhattarai, A.; Gerteisen, D. Measurement of Spatially Resolved Impedance Spectroscopy with Local Perturbation. Fuel Cells 2013, 13, 910–916. [Google Scholar] [CrossRef]
- Pérez, L.C.; Brandão, L.; Sousa, J.; Mendes, A. Segmented polymer electrolyte membrane fuel cells—A review. Renew. Sustain. Energy Rev. 2011, 15, 169–185. [Google Scholar] [CrossRef]
- Clement, J.T.; Aaron, D.S.; Mench, M.M. In Situ Localized Current Distribution Measurements in All-Vanadium Redox Flow Batteries. J. Electrochem. Soc. 2016, 163, A5220–A5228. [Google Scholar] [CrossRef] [Green Version]
- Wieser, C.; Helmbold, A.; Gülzow, E. A new technique for two-dimensional current distribution measurements in electrochemical cells. J. Appl. Electrochem. 2000, 30, 803–807. [Google Scholar] [CrossRef]
- Hsieh, W.-Y.; Leu, C.-H.; Wu, C.-H.; Chen, Y.-S. Measurement of local current density of all-vanadium redox flow batteries. J. Power Sources 2014, 271, 245–251. [Google Scholar] [CrossRef]
- Gerber, T.; Fischer, P.; Pinkwart, K.; Tübke, J. Segmented printed circuit board electrode for locally-resolved current density measurements in all-vanadium redox flow batteries. Batteries 2019, 5, 38. [Google Scholar] [CrossRef] [Green Version]
- Bhattarai, A.; Wai, N.; Schweiss, R.; Whitehead, A.; Scherer, G.G.; Ghimire, P.C.; Nguyen, T.D.; Hng, H.H. Study of flow behavior in all-vanadium redox flow battery using spatially resolved voltage distribution. J. Power Sources 2017, 360, 443–452. [Google Scholar] [CrossRef]
- Ghimire, P.C.; Bhattarai, A.; Schweiss, R.; Scherer, G.G.; Wai, N.; Yan, Q. A comprehensive study of electrode compression effects in all vanadium redox flow batteries including locally resolved measurements. Appl. Energy 2018, 230, 974–982. [Google Scholar] [CrossRef]
- Ghimire, P.C.; Bhattarai, A.; Schweiss, R.; Scherer, G.G.; Wai, N.; Lim, T.M.; Yan, Q. Investigation of reactant conversion in the vanadium redox flow battery using spatially resolved state of charge mapping. Batteries 2019, 5, 2. [Google Scholar] [CrossRef] [Green Version]
- Macdonald, J.R.; Barsoukov, E. Impedance spectroscopy: Theory, experiment, and applications. History 2005, 1, 1–13. [Google Scholar]
- Baricci, A.; Zago, M.; Casalegno, A. Modelling analysis of heterogeneity of ageing in high temperature polymer electrolyte fuel cells: Insight into the evolution of electrochemical impedance spectra. Electrochim. Acta 2016, 222, 596–607. [Google Scholar] [CrossRef]
- Harper, J.; Rust, M.; Sayers, B.; Savage, A.; Analytical, S. High-Frequency, High-Current Impedance Spectroscopy: Experimental Protocols Enabling Measurement up to 1 MHz at High Current Densities; Technical Bulletin for Solartron Analytical; Solartron Analytical: Farnborough, UK, 2004. [Google Scholar]
- Wagner, N.; Gülzow, E. Change of electrochemical impedance spectra (EIS) with time during CO-poisoning of the Pt-anode in a membrane fuel cell. J. Power Sources 2004, 127, 341–347. [Google Scholar] [CrossRef]
- De Levie, R. On porous electrodes in electrolyte solutions: I. Capacitance effects. Electrochim. Acta 1963, 8, 751–780. [Google Scholar] [CrossRef]
- De Levie, R. On porous electrodes in electrolyte solutions—IV. Electrochim. Acta 1964, 9, 1231–1245. [Google Scholar] [CrossRef]
- Keiser, H.; Beccu, K.D.; Gutjahr, M.A. Abschätzung der Porenstruktur Poröser Elektroden aus Impedanzmessungen. Electrochim. Acta 1976, 21, 539. (In German) [Google Scholar] [CrossRef]
- Keddam, M.; Rakotomavo, C.; Takenouti, H. Impedance of a porous electrode with an axial gradient of concentration. J. Appl. Electrochem. 1984, 14, 437–448. [Google Scholar] [CrossRef]
- Rammelt, U.; Reinhard, G.; Rammelt, K. Impedance dispersion on coated metal electrodes. J. Electroanal. Chem. Interfacial Electrochem. 1984, 180, 327–336. [Google Scholar] [CrossRef]
- Reinhard, G.; Rammelt, U.; Rammelt, K. Analysis of impedance spectra on corroding metals. Corros. Sci. 1986, 26, 109–120. [Google Scholar] [CrossRef]
- Paasch, G.; Micka, K.; Gersdorf, P. Theory of the electrochemical impedance of macrohomogeneous porous electrodes. Electrochim. Acta 1993, 38, 2653–2662. [Google Scholar] [CrossRef]
- MacDonald, J.R.; Johnson, W.B.; Raistrick, I.D. Impedance Spectroscopy; Wiley: New York, NY, USA, 1987; p. 90. [Google Scholar]
- Delahay, P.; Tobias, C.W. Advances in Electrochemistry and Electrochemical Engineering; Wiley: Hoboken, NJ, USA, 1967. [Google Scholar]
- Scheider, W. Theory of the frequency dispersion of electrode polarization. Topology of networks with fractional power fre-quency dependence. J. Phys. Chem. 1975, 79, 127–136. [Google Scholar] [CrossRef]
- Messaggi, M.; Rabissi, C.; Gambaro, C.; Meda, L.; Casalegno, A.; Zago, M. Investigation of vanadium redox flow batteries per-formance through locally-resolved polarisation curves and impedance spectroscopy: Insight into the effects of electrolyte, flow field geometry and electrode thickness. J. Power Sources 2020, 449, 227588. [Google Scholar] [CrossRef]
- Hsieh, C.-L.; Tsai, P.-H.; Hsu, N.-Y.; Chen, Y.-S. Effect of compression ratio of graphite felts on the performance of an all-vanadium redox flow battery. Energies 2019, 12, 313. [Google Scholar] [CrossRef] [Green Version]
- Sun, C.-N.; Delnick, F.M.; Aaron, D.S.; Papandrew, A.B.; Mench, M.M.; Zawodzinski, T.A., Jr. Probing electrode losses in all-vanadium redox flow batteries with impedance spectroscopy. ECS Electrochem. Lett. 2013, 2, A43–A45. [Google Scholar] [CrossRef] [Green Version]
- Mazur, P.; Mrlik, J.; Charvat, J.; Pocedic, J.; Vrana, J.; Dundalek, J.; Kosek, J. A complex four-point method for the evaluation of ohmic and faradaic losses within a redox flow battery single-cell. MethodsX 2019, 6, 534–539. [Google Scholar] [CrossRef] [PubMed]
- Zago, M.; Casalegno, A. Physically-based impedance modeling of the negative electrode in all-vanadium redox flow batteries: Insight into mass transport issues. Electrochim. Acta 2017, 248, 505–517. [Google Scholar] [CrossRef]
- Derr, I.; Bruns, M.; Langner, J.; Fetyan, A.; Melke, J.; Roth, C. Degradation of all-vanadium redox flow batteries (VRFB) investi-gated by electrochemical impedance and X-ray photoelectron spectroscopy: Part 2 electrochemical degradation. J. Power Sources 2016, 325, 351–359. [Google Scholar] [CrossRef]
- Schneider, J.; Bulczak, E.; El-Nagar, G.A.; Gebhard, M.; Kubella, P.; Schnucklake, M.; Fetyan, A.; Derr, I.; Roth, C. Degradation phenomena of bismuth-modified felt electrodes in vrfb studied by electrochemical impedance spectroscopy. Batteries 2019, 5, 16. [Google Scholar] [CrossRef] [Green Version]
- Noack, J.N.; Vorhauser, L.; Pinkwart, K.; Tuebke, J. Aging studies of vanadium redox flow batteries. ECS Trans. 2011, 33, 3–9. [Google Scholar] [CrossRef]
- Choi, C.; Kim, S.; Kim, R.; Lee, J.; Heo, J.; Kim, H.-T. In-situ observation of the degradation of all-vanadium redox flow batteries with dynamic hydrogen reference electrode under real operation conditions. J. Ind. Eng. Chem. 2019, 70, 355–362. [Google Scholar] [CrossRef]
- Mazúr, P.; Mrlík, J.; Beneš, J.; Pocedič, J.; Vrána, J.; Dundálek, J.; Kosek, J. Performance evaluation of thermally treated graphite felt electrodes for vanadium redox flow battery and their four-point single cell characterization. J. Power Sources 2018, 380, 105–114. [Google Scholar] [CrossRef]
- Schneider, J.; Tichter, T.; Khadke, P.; Zeis, R.; Roth, C. Deconvolution of electrochemical impedance data for the monitoring of electrode degradation in VRFB. Electrochim. Acta 2020, 336, 135510. [Google Scholar] [CrossRef]
- Bhattarai, A.; Wai, N.; Schweiss, R.; Whitehead, A.; Lim, T.M.; Hng, H.H. Advanced porous electrodes with flow channels for vanadium redox flow battery. J. Power Sources 2017, 341, 83–90. [Google Scholar] [CrossRef]
- Skyllas-Kazacos, M.; Cao, L.; Kazacos, M.; Kausar, N.; Mousa, A. Vanadium electrolyte studies for the vanadium redox bat-tery—A review. ChemSusChem 2016, 9, 1521–1543. [Google Scholar] [CrossRef]
- Xu, Q.; Zhao, T.; Zhang, C. Effects of SOC-dependent electrolyte viscosity on performance of vanadium redox flow batteries. Appl. Energy 2014, 130, 139–147. [Google Scholar] [CrossRef]
- Oriji, G.; Katayama, Y.; Miura, T. Investigations on V (IV)/V (V) and V (II)/V (III) redox reactions by various electrochemical methods. J. Power Sources 2005, 139, 321–324. [Google Scholar] [CrossRef]
- Haddadi-Asl, V.; Kazacos, M.; Skyllas-Kazacos, M. Conductive carbon-polypropylene composite electrodes for vanadium redox battery. J. Appl. Electrochem. 1995, 25, 29–33. [Google Scholar] [CrossRef]
- Oh, K.; Won, S.; Ju, H. Numerical study of the effects of carbon felt electrode compression in all-vanadium redox flow batteries. Electrochim. Acta 2015, 181, 13–23. [Google Scholar] [CrossRef]
- Khazaeli, A.; Vatani, A.; Tahouni, N.; Panjeshahi, M.H. Numerical investigation and thermodynamic analysis of the effect of electrolyte flow rate on performance of all vanadium redox flow batteries. J. Power Sources 2015, 293, 599–612. [Google Scholar] [CrossRef]
- Park, S.-K.; Shim, J.; Yang, J.H.; Jin, C.-S.; Lee, B.S.; Lee, Y.S.; Shin, K.-H.; Jeon, J.-D. The influence of compressed carbon felt electrodes on the performance of a vanadium redox flow battery. Electrochim. Acta 2014, 116, 447–452. [Google Scholar] [CrossRef]
- Tang, A.; Bao, J.; Skyllas-Kazacos, M. Studies on pressure losses and flow rate optimization in vanadium redox flow battery. J. Power Sources 2014, 248, 154–162. [Google Scholar] [CrossRef]
- Reed, D.; Thomsen, E.; Li, B.; Wang, W.; Nie, Z.; Koeppel, B.; Sprenkle, V. Performance of a low cost interdigitated flow design on a 1 kW class all vanadium mixed acid redox flow battery. J. Power Sources 2016, 306, 24–31. [Google Scholar] [CrossRef] [Green Version]
- Kee, R.J.; Zhu, H. Distribution of incompressible flow within interdigitated channels and porous electrodes. J. Power Sources 2015, 299, 509–518. [Google Scholar] [CrossRef] [Green Version]
- Ke, X.; Alexander, J.I.D.; Prahl, J.M.; Savinell, R.F. A simple analytical model of coupled single flow channel over porous electrode in vanadium redox flow battery with serpentine flow channel. J. Power Sources 2015, 288, 308–313. [Google Scholar] [CrossRef] [Green Version]
- Xu, Q.; Zhao, T.; Leung, P. Numerical investigations of flow field designs for vanadium redox flow batteries. Appl. Energy 2013, 105, 47–56. [Google Scholar] [CrossRef]
- Chen, J.Q.; Wang, B.G.; Lv, H.L. Numerical Simulation and experiment on the electrolyte flow distribution for all vanadium redox flow battery. Adv. Mater. Res. 2011, 236–238, 604–607. [Google Scholar] [CrossRef]
- Inoue, M.; Kobayashi, M. Electrode Material for Flow-Through Type Electrolytic Cell, Wherein the Electrode Comprises Carbona-Ceous Material Having at Least One Groove. U.S. Patent 5648184A, 15 July 1997. [Google Scholar]
- Lee, D.G.; Kim, K.H.; Kim, B.G.; Kook, K.M. Multi-Layered Electrode for Redox Flow Battery and Redox Flow Battery Comprising Said Multi-Layered Electrode. Korea Patent 1013708510000, 28 February 2014. [Google Scholar]
- Lee, S.-W. Electrode for a Redox Flow Battery. Korea Patent 1020120077348, 27 January 2014. [Google Scholar]
- Zheng, Z.; Zhang, C.; Ren, J.; Wang, D.; Ma, H.; Ning, H. Electrode for a Flow Battery. CN Patent PCT/CN2010/070198, 17 November 2011. [Google Scholar]
- Ogino, S.; Deguchi, H.; Tokuda, N. Electrode for Redox Flow Battery and Redox Flow Battery. Sumitomo Electric Industries. WIPO Patent WO2019239732, 19 December 2019. [Google Scholar]
- Skyllas-Kazacos, M.; Maddern, B.; Kazacos, M.; Joy, J. State-of-Charge of Redox Cell. AU Patent PCT/AU89/00252, 23 September 1989. [Google Scholar]
- Skyllas-Kazacos, M.; Kazacos, M. State of charge monitoring methods for vanadium redox flow battery control. J. Power Sources 2011, 196, 8822–8827. [Google Scholar] [CrossRef]
- Blanc, P.; Madic, C.; Launay, J.P. Spectrophotometric identification of a mixed-valence cation-cation complex between aquadioxovanadium(V) and aquaoxovanadium(IV) ions in perchloric, sulfuric, and hydrochloric acid media. Inorg. Chem. 1982, 21, 2923–2928. [Google Scholar] [CrossRef]
- Gao, X.; Bourke, A.; Lynch, R.; Leahy, M.; Buckley, D. Presented at The International Conference Flow Battery Forum 2013, Dublin, Ireland, 26–27 June 2013; Swanbarton Limited: Malmesbury, UK, 2013; pp. 20–21. [Google Scholar]
- Buckley, D.N.; Gao, X.; Lynch, R.P.; Quill, N.; Leahy, M.J. Towards Optical Monitoring of Vanadium Redox Flow Batteries (VRFBs): An Investigation of the Underlying Spectroscopy. J. Electrochem. Soc. 2014, 161, A524–A534. [Google Scholar] [CrossRef]
- Oriji, G.; Katayama, Y.; Miura, T. Investigation on V (IV)/V (V) species in a vanadium redox flow battery. Electrochim. Acta 2004, 49, 3091–3095. [Google Scholar] [CrossRef]
- Wu, X.; Wang, J.; Liu, S.; Wu, X.; Li, S. Study of vanadium (IV) species and corresponding electrochemical performance in concentrated sulfuric acid media. Electrochim. Acta 2011, 56, 10197–10203. [Google Scholar] [CrossRef]
- Martin, E.; Bentley, K. Spectrophotometric Investigation of Vanadium (II), Vanadium (III), and Vanadium (IV) in Various Media. Anal. Chem. 1962, 34, 354–358. [Google Scholar] [CrossRef]
- Madic, C.; Begun, G.M.; Hahn, R.L.; Launay, J.P.; Thiessen, W.E. Dimerization of aquadioxovanadium(V) ion in concentrated perchloric and sulfuric acid media. Inorg. Chem. 1984, 23, 469–476. [Google Scholar] [CrossRef]
- Tang, Z.; Aaron, D.S.; Papandrew, A.B.; Zawodzinski, T.A. Monitoring the state of charge of operating vanadium redox flow batteries. ECS Trans. 2012, 41, 1–9. [Google Scholar] [CrossRef]
- Manivannan, A.; Xiao, J.; Liaw, B.Y.; Mukerjee, S.; Doeff, M.; Wang, D. Batteries and Energy Technology Joint Session (General)-226th ECS Meeting; The Electrochemical Society: Pennington, NJ, USA, 2015. [Google Scholar]
- Choi, N.H.; Kwon, S.-K.; Kim, H. Analysis of the Oxidation of the V(II) by Dissolved Oxygen Using UV-Visible Spectrophotometry in a Vanadium Redox Flow Battery. J. Electrochem. Soc. 2013, 160, A973–A979. [Google Scholar] [CrossRef]
- Zhang, W.; Liu, L.; Liu, L. An on-line spectroscopic monitoring system for the electrolytes in vanadium redox flow batteries. RSC Adv. 2015, 5, 100235–100243. [Google Scholar] [CrossRef]
- Liu, L.; Xi, J.; Wu, Z.; Zhang, W.; Zhou, H.; Li, W.; Qiu, X. State of charge monitoring for vanadium redox flow batteries by the transmission spectra of V(IV)/V(V) electrolytes. J. Appl. Electrochem. 2012, 42, 1025–1031. [Google Scholar] [CrossRef]
- Liu, L.; Xi, J.; Wu, Z.; Zhang, W.; Zhou, H.; Li, W.; He, Y. Online Spectroscopic Study on the Positive and the Negative Electrolytes in Vanadium Redox Flow Batteries. J. Spectrosc. 2012, 2013, 1–8. [Google Scholar] [CrossRef]
- Jia, C.; Liu, Q.; Sun, C.J.; Yang, F.; Ren, Y.; Heald, S.M.; Liu, Y.; Li, Z.F.; Lu, W.; Xie, J. In situ x-ray near-edge absorption spec-troscopy investigation of the state of charge of all-vanadium redox flow batteries. ACS Appl. Mater. Interfaces 2014, 6, 17920–17925. [Google Scholar] [CrossRef]
- Nelson, G.J.; Harris, W.M.; Lombardo, J.J.; Izzo, J.R.; Chiu, W.K.; Tanasini, P.; Cantoni, M.; Van Herle, J.; Comninellis, C.; Andrews, J.C.; et al. Comparison of SOFC cathode microstructure quantified using X-ray nanotomography and focused ion beam–scanning electron microscopy. Electrochem. Commun. 2011, 13, 586–589. [Google Scholar] [CrossRef]
- Shearing, P.; Bradley, R.; Gelb, J.; Tariq, F.; Withers, P.; Brandon, N. Exploring microstructural changes associated with oxidation in Ni–YSZ SOFC electrodes using high resolution X-ray computed tomography. Solid State Ion. 2012, 216, 69–72. [Google Scholar] [CrossRef]
- Shearing, P.R.; Bradley, R.S.; Gelb, J.; Lee, S.N.; Atkinson, A.; Withers, P.; Brandon, N.P. Using Synchrotron X-Ray Nano-CT to Characterize sofc electrode microstructures in three-dimensions at operating temperature. Electrochem. Solid State Lett. 2011, 14, B117–B120. [Google Scholar] [CrossRef] [Green Version]
- Shearing, P.; Gelb, J.; Yi, J.; Lee, W.-K.; Drakopolous, M.; Brandon, N. Analysis of triple phase contact in Ni–YSZ microstructures using non-destructive X-ray tomography with synchrotron radiation. Electrochem. Commun. 2010, 12, 1021–1024. [Google Scholar] [CrossRef]
- Guan, Y.; Li, W.; Gong, Y.; Liu, G.; Zhang, X.; Chen, J.; Gelb, J.; Yun, W.; Xiong, Y.; Tian, Y.; et al. Analysis of the three-dimensional microstructure of a solid-oxide fuel cell anode using nano X-ray tomography. J. Power Sources 2011, 196, 1915–1919. [Google Scholar] [CrossRef]
- Izzo, J.R.; Joshi, A.S.; Grew, K.N.; Chiu, W.K.S.; Tkachuk, A.; Wang, S.H.; Yun, W. Nondestructive Reconstruction and Analysis of SOFC Anodes Using X-ray Computed Tomography at Sub-50 nm Resolution. J. Electrochem. Soc. 2008, 155, B504. [Google Scholar] [CrossRef] [Green Version]
- Shearing, P.; Gelb, J.; Brandon, N. X-ray nano computerised tomography of SOFC electrodes using a focused ion beam sample-preparation technique. J. Eur. Ceram. Soc. 2010, 30, 1809–1814. [Google Scholar] [CrossRef]
- Shearing, P.R.; Eastwood, D.S.; Bradley, R.S.; Gelb, J.; Cooper, S.J.; Tariq, F.; Lee, P.D. Exploring electrochemical devices using X-ray microscopy: 3D micro-structure of batteries and fuel cells. Microsc. Anal. 2013, 27, 19–22. [Google Scholar]
- Nelson Weker, J.; Toney, M.F. Emerging in Situ and Operando Nanoscale X—Ray Imaging Techniques for Energy Storage Ma-terials. Adv. Funct. Mater. 2015, 25, 1622–1637. [Google Scholar] [CrossRef]
- Hartnig, C.; Manke, I.; Schloesser, J.; Krüger, P.; Kuhn, R.; Riesemeier, H.; Wippermann, K.; Banhart, J. High resolution synchrotron X-ray investigation of carbon dioxide evolution in operating direct methanol fuel cells. Electrochem. Commun. 2009, 11, 1559–1562. [Google Scholar] [CrossRef]
- Hartnig, C.; Manke, I.; Kuhn, R.; Kardjilov, N.; Banhart, J.; Lehnert, W. Cross-sectional insight in the water evolution and transport in polymer electrolyte fuel cells. Appl. Phys. Lett. 2008, 92, 134106. [Google Scholar] [CrossRef] [Green Version]
- Manke, I.; Hartnig, C.; Grünerbel, M.; Lehnert, W.; Kardjilov, N.; Haibel, A.; Hilger, A.; Banhart, J.; Riesemeier, H. Investigation of water evolution and transport in fuel cells with high resolution synchrotron x-ray radiography. Appl. Phys. Lett. 2007, 90, 174105. [Google Scholar] [CrossRef]
- Jervis, R.; Brown, L.D.; Neville, T.P.; Millichamp, J.; Finegan, D.P.; Heenan, T.M.; Brett, D.J.; Shearing, P.R. Design of a miniature flow cell for in situ x-ray imaging of redox flow batteries. J. Phys. D Appl. Phys. 2016, 49, 434002. [Google Scholar] [CrossRef]
- Gebhard, M.; Schnucklake, M.; Hilger, A.; Röhe, M.; Osenberg, M.; Krewer, U.; Manke, I.; Roth, C. X–Ray—computed radiography and tomography study of electrolyte invasion and distribution inside pristine and heat–treated carbon felts for redox flow batteries. Energy Technol. 2020, 8. [Google Scholar] [CrossRef] [Green Version]
- Bevilacqua, N.; Eifert, L.; Banerjee, R.; Köble, K.; Faragó, T.; Zuber, M.; Bazylak, A.; Zeis, R. Visualization of electrolyte flow in vanadium redox flow batteries using synchrotron X-ray radiography and tomography—Impact of electrolyte species and electrode compression. J. Power Sources 2019, 439, 227071. [Google Scholar] [CrossRef]
- Banhart, J. Advanced Tomographic Methods in Materials Research and Engineering; Oxford University Press: Oxford, UK, 2008. [Google Scholar]
- Dobrzyński, L.; Blinowski, K.; Price, D.L. Neutrons and Solid State Physics. Phys. Today 1995, 48, 93. [Google Scholar] [CrossRef] [Green Version]
- Price, D.; Skold, K. Neutron Scattering; Academic Press: Cambridge, MA, USA, 1987. [Google Scholar]
- Foderaro, A.; Moldauer, P.A. The Elements of Neutron Interaction Theory. Phys. Today 1973, 26, 86. [Google Scholar] [CrossRef]
- Lehmann, E.; Vontobel, P.; Kardjilov, N. Hydrogen distribution measurements by neutrons. Appl. Radiat. Isot. 2004, 61, 503–509. [Google Scholar] [CrossRef] [PubMed]
- Pekula, N.; Heller, K.; Chuang, P.A.; Turhan, A.; Mench, M.M.; Brenizer, J.S.; Ünlü, K. Study of water distribution and transport in a polymer electrolyte fuel cell using neutron imaging. Nucl. Instrum. Methods Physics Res. Section A Accel. Spectrom. Detect. Assoc. Equip. 2005, 542, 134–141. [Google Scholar] [CrossRef]
- Turhan, A.; Heller, K.; Brenizer, J.S.; Mench, M.M. Quantification of liquid water accumulation and distribution in a polymer elec-trolyte fuel cell using neutron imaging. J. Power Sources 2006, 160, 1195–1203. [Google Scholar] [CrossRef]
- Cho, K.T.; Turhan, A.; Lee, J.H.; Brenizer, J.S.; Heller, A.K.; Shi, L.; Mench, M.M. Probing water transport in polymer electrolyte fuel cells with neutron radiography. Nucl. Instrum. Methods Phys. Res. Sect. A Accel. Spectrometers Detect. Assoc. Equip. 2009, 605, 119–122. [Google Scholar] [CrossRef]
- Heller, A.K.; Shi, L.; Brenizer, J.S.; Mench, M.M. Three dimensional water and ice quantification using neutron imaging. J. Radioanal. Nucl. Chem. 2009, 282, 183–186. [Google Scholar] [CrossRef]
- Hatzell, M.C.; Turhan, A.; Kim, S.; Hussey, D.S.; Jacobson, D.L.; Mench, M.M. Quantification of temperature driven flow in a polymer electrolyte fuel cell using high-resolution neutron radiography. J. Electrochem. Soc. 2011, 158, B717–B726. [Google Scholar] [CrossRef] [Green Version]
- LaManna, J.; Chakraborty, S.; Gagliardo, J.J.; Mench, M.M. Isolation of transport mechanisms in PEFCs using high resolution neutron imaging. Int. J. Hydrogen Energy 2014, 39, 3387–3396. [Google Scholar] [CrossRef]
- Owejan, J.; Trabold, T.; Jacobson, D.; Baker, D.; Hussey, D.; Arif, M. In situ investigation of water transport in an operating PEM fuel cell using neutron radiography: Part 2—Transient water accumulation in an interdigitated cathode flow field. Int. J. Heat Mass Transf. 2006, 49, 4721–4731. [Google Scholar] [CrossRef]
- Geiger, A.; Tsukada, A.; Lehmann, E.; Vontobel, P.; Wokaun, A.; Scherer, G. In situ investigation of two-phase flow patterns in flow fields of pefc’s using neutron radiography. Fuel Cells 2002, 2, 92–98. [Google Scholar] [CrossRef]
- Hussey, D.S.; Jacobson, D.L.; Arif, M.; Owejan, J.P.; Gagliardo, J.J.; Trabold, T.A. Neutron images of the through-plane water dis-tribution of an operating PEM fuel cell. J. Power Sources 2007, 172, 225–228. [Google Scholar] [CrossRef]
- Mukherjee, P.P.; Mukundan, R.; Spendelow, J.S.; Davey, J.R.; Borup, R.; Hussey, D.S.; Jacobson, D.L.; Arif, M. High resolution neutron imaging of water in the polymer electrolyte fuel cell membrane. ECS Trans. 2009, 25, 505–512. [Google Scholar] [CrossRef]
- Schröder, A.; Wippermann, K.; Lehnert, W.; Stolten, D.; Sanders, T.; Baumhöfer, T.; Kardjilov, N.; Hilger, A.; Banhart, J.; Manke, I. The influence of gas diffusion layer wettability on direct methanol fuel cell performance: A combined local current distribution and high resolution neutron radiography study. J. Power Sources 2010, 195, 4765–4771. [Google Scholar] [CrossRef]
- Schröder, A.; Wippermann, K.; Arlt, T.; Sanders, T.; Baumhöfer, T.; Markötter, H.; Mergel, J.; Lehnert, W.; Stolten, D.; Manke, I.; et al. Combined local current distribution measurements and high resolution neutron radiography of operating direct methanol fuel cells. Electrochem. Commun. 2009, 11, 1606–1609. [Google Scholar] [CrossRef]
- Clement, J.T. Investigation of Localized Performance and Gas Evolution in all-Vanadium Redox Flow Batteries Via In-Situ Dis-tributed Diagnostic Techniques. Ph.D. Thesis, University of Tennessee, Knoxville, TN, USA, 2016. [Google Scholar]
- Watkins, T.S.; Sarbapalli, D.; Counihan, M.J.; Danis, A.S.; Zhang, J.; Zhang, L.; Zavadil, K.R.; Rodríguez-López, J. A combined SECM and electrochemical AFM approach to probe interfacial processes affecting molecular reactivity at redox flow battery electrodes. J. Mater. Chem. A 2020, 8, 15734–15745. [Google Scholar] [CrossRef]
- Steimecke, M.; Rümmler, S.; Kühhirt, M.; Bron, M. A linear sweep voltammetric procedure applied to scanning electrochemical microscopy for the characterization of carbon materials towards the vanadium (IV)/(V) redox system. ChemElectroChem 2016, 3, 318–322. [Google Scholar] [CrossRef]
- Steimecke, M.; Rümmler, S.; Schuhmacher, N.-F.; Lindenberg, T.; Hartmann, M.; Bron, M. A Comparative Study of Functionalized High-Purity Carbon Nanotubes towards the V(IV)/V(V) Redox Reaction Using Cyclic Voltammetry and Scanning Electrochemical Microscopy. Electroanalysis 2017, 29, 1056–1061. [Google Scholar] [CrossRef]
- Akter, M.P.; Li, Y.; Bao, J.; Skyllas-Kazacos, M. The Effects of Ripple Current on Vanadium Redox Flow Batteries. In Proceedings of the International Flow Battery Forum, Lyon, France, 9–11 July 2019. [Google Scholar]
Figure 1.
Schematic diagram of VRFB.

Figure 2.
Components of VRFB single cell.

Figure 3.
(a) Typical charge-discharge cycles curve at various current densities and (b) Coulombic, energy and voltage efficiency corresponding to charge-discharge cycles.
Figure 3.
(a) Typical charge-discharge cycles curve at various current densities and (b) Coulombic, energy and voltage efficiency corresponding to charge-discharge cycles.

Figure 4.
(a) Charge and discharge curve at different current densities (b) Plot of cell voltage vs. specific capacity of VRFB.
Figure 4.
(a) Charge and discharge curve at different current densities (b) Plot of cell voltage vs. specific capacity of VRFB.

Figure 5.
(a) Current and voltage profile at consecutive charging, OCV and discharging for polarization curve (b) Polarization curve with indication of different zone of losses in VRFB.
Figure 5.
(a) Current and voltage profile at consecutive charging, OCV and discharging for polarization curve (b) Polarization curve with indication of different zone of losses in VRFB.

Figure 6.
Schematic diagram for half-cell potential measurement.

Figure 7.
E-I curve showing negative half-cell potential, positive half-cell potential and full cell voltage.
Figure 7.
E-I curve showing negative half-cell potential, positive half-cell potential and full cell voltage.

Figure 8.
(a) Fuel cell type design for the distribution of electrolyte through channel (b) Flow frame type architectural design.
Figure 8.
(a) Fuel cell type design for the distribution of electrolyte through channel (b) Flow frame type architectural design.

Figure 9.
Arrangement of the PCB in a cell for the measurement of local current or voltage (reproduced from ref [97]).
Figure 9.
Arrangement of the PCB in a cell for the measurement of local current or voltage (reproduced from ref [97]).

Figure 10.
Exploded view of half-cell components at the segmented side (reproduced from ref [101], with permission from Elsevier).
Figure 10.
Exploded view of half-cell components at the segmented side (reproduced from ref [101], with permission from Elsevier).

Figure 11.
Experimental set up (a), positive segment side with 16 cables with electrolyte inlet and outlet (b), arrangement of the segments showing electrolyte flow direction (c) arrangement of cell with 16 segmented and insulating frame on the flow frame (d) (reproduced from ref [101], with permission from Elsevier).

Figure 12.
Contour diagram of discharge voltage (flow direction from bottom to top).

Figure 13.
Contour diagram of OCV after terminating discharge (flow direction from bottom to top).

Figure 14.
Impedance data represented as Nyquist plot.

Figure 15.
Impedance data represented as Bode plot.

Figure 16.
Randles circuit and corresponding Nyquist plot.

Figure 17.
Pressure drop at negative and positive half-cell during the operation of a VRFB.

Figure 18.
Flow channel design on the porous electrode.

Figure 19.
Schematic diagram of on-line electroscopic monitoring system, 1, LED base; 2, heatsink; 3, objective; 4, tube; 5, inlets; 6, outlets; 7, cell frame; 8, quartz window; 9, cell holder; 10, light tube for spectrometer; 11, grating base; 12, exit tube light of spectrometer; D1, camera; D2, Line camera (reproduced from ref [160], with permission from Royal Society of Chemistry).

Figure 20.
Schematic diagram of in situ synchrotron XANES experiment on VRFB to collect the transmission spectra (adapted with permission from ref [163] American Chemical Society).
Figure 20.
Schematic diagram of in situ synchrotron XANES experiment on VRFB to collect the transmission spectra (adapted with permission from ref [163] American Chemical Society).


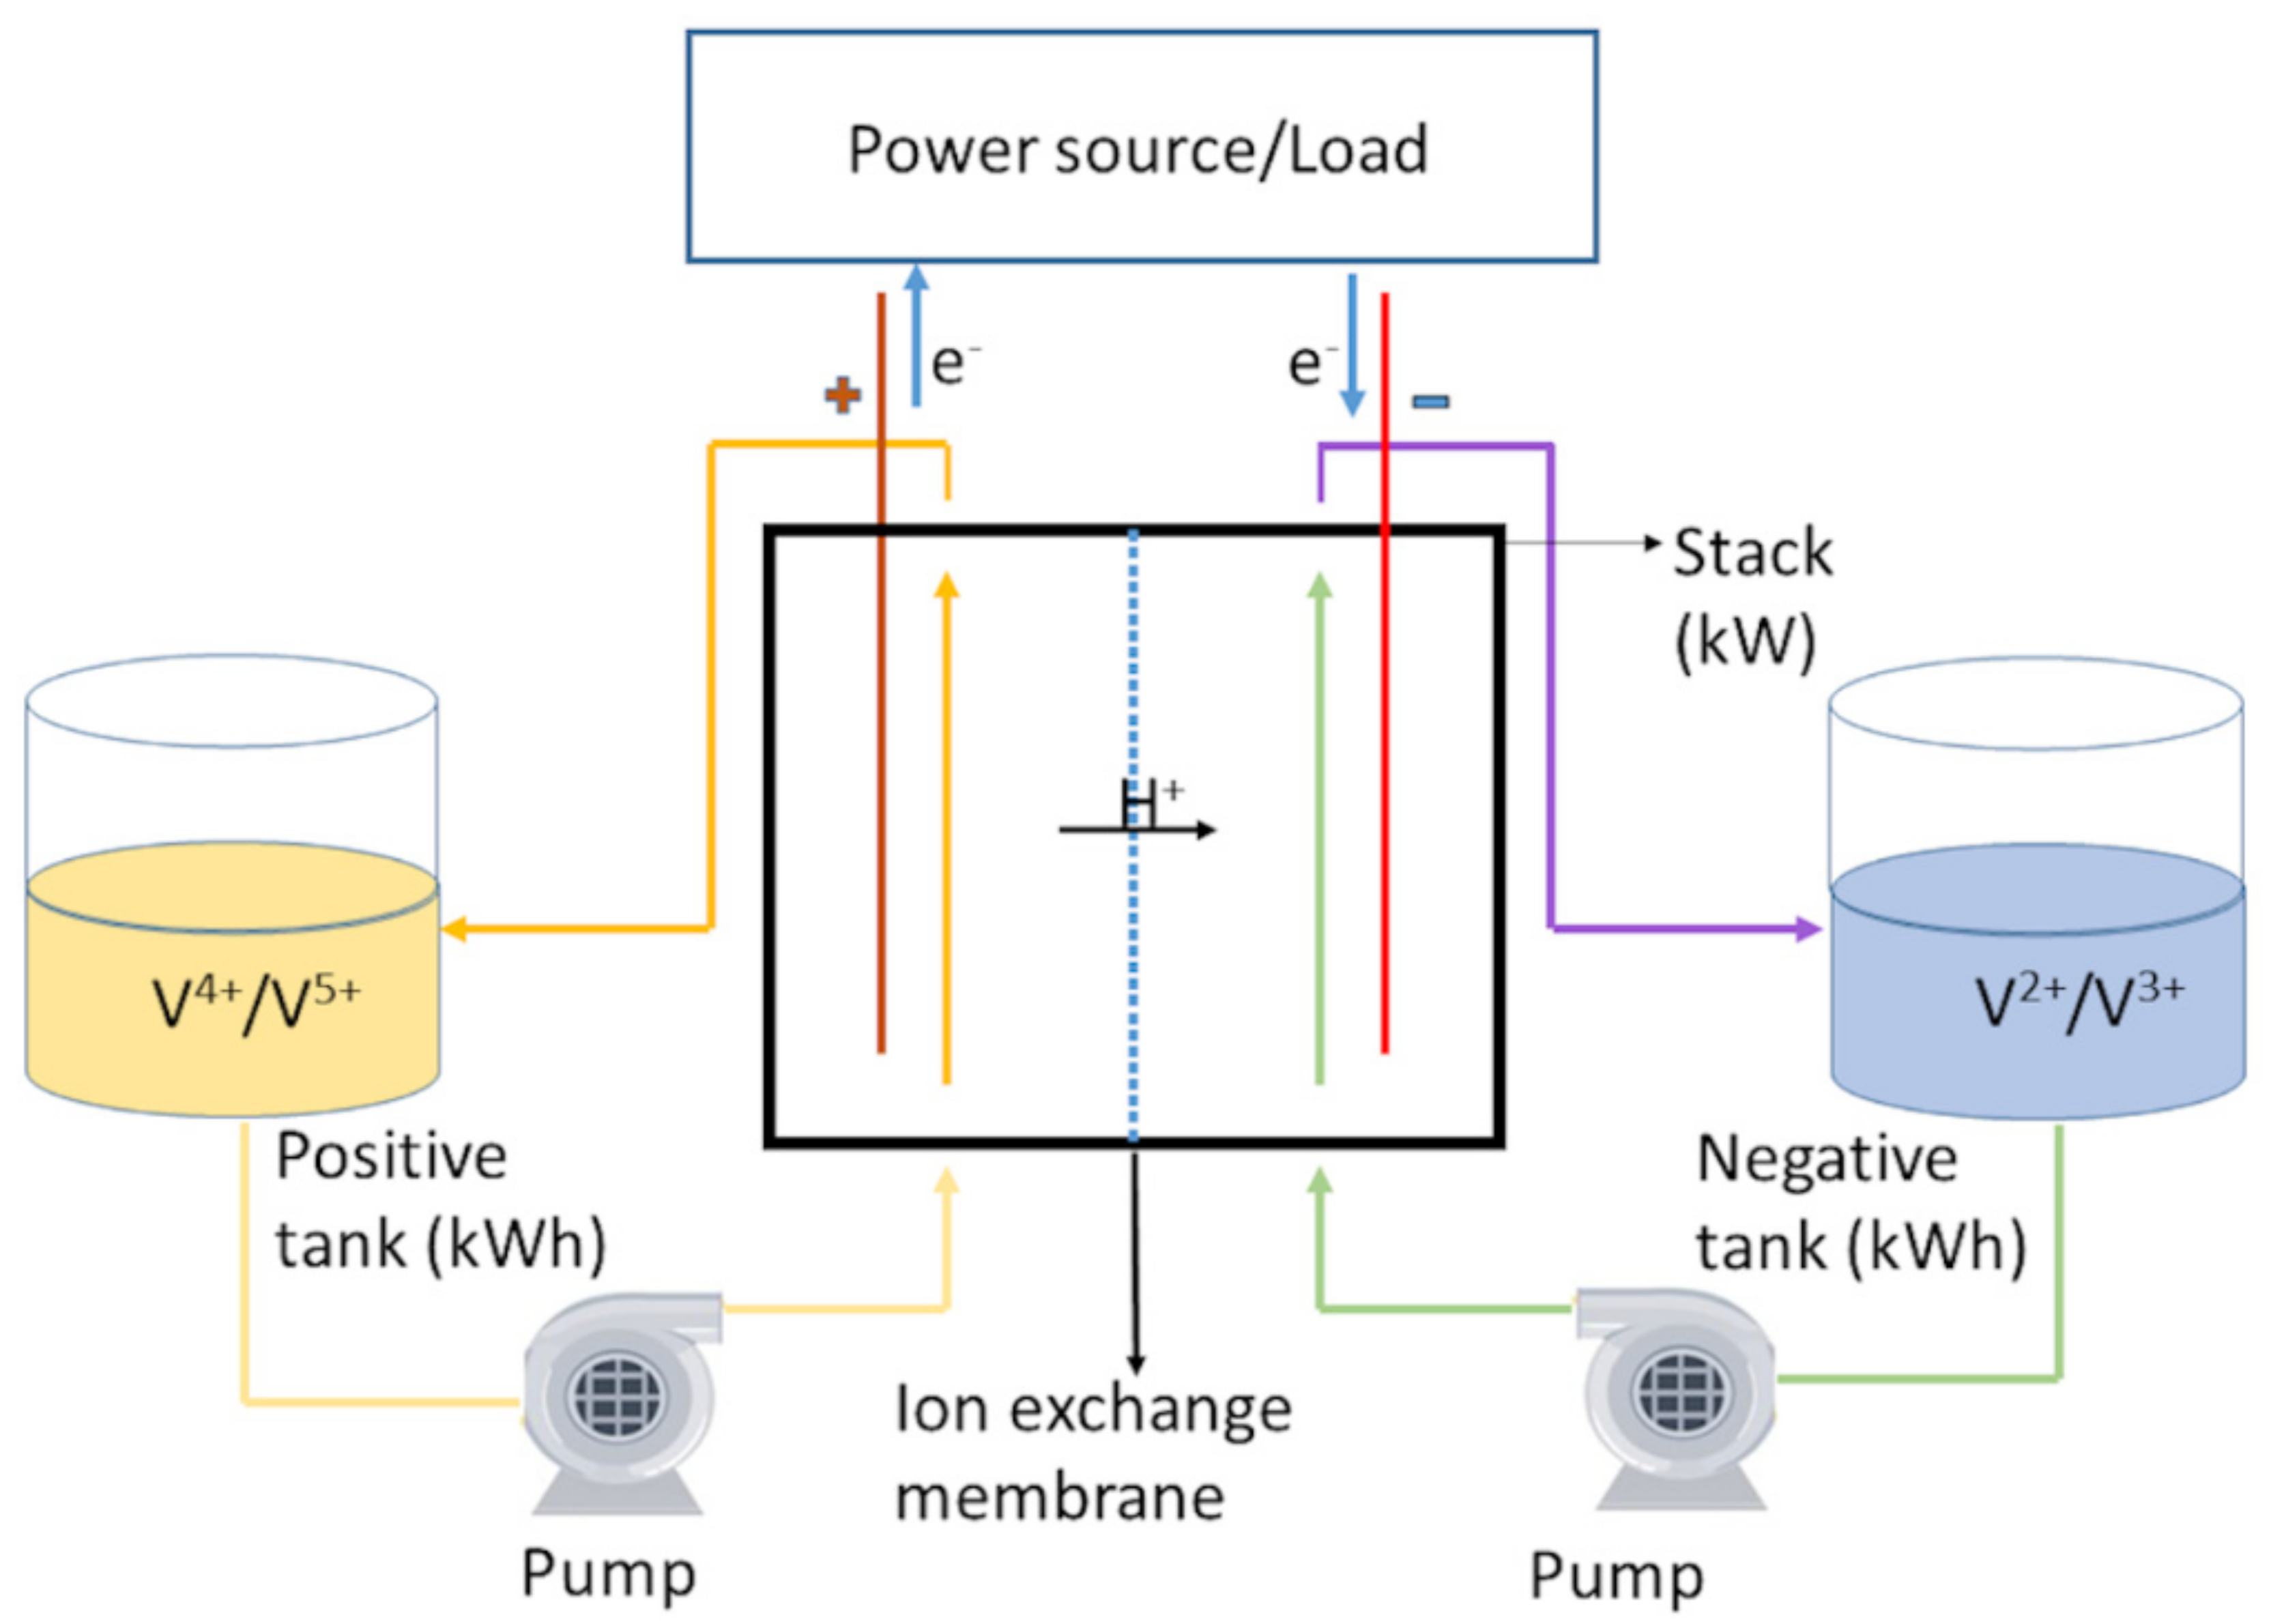
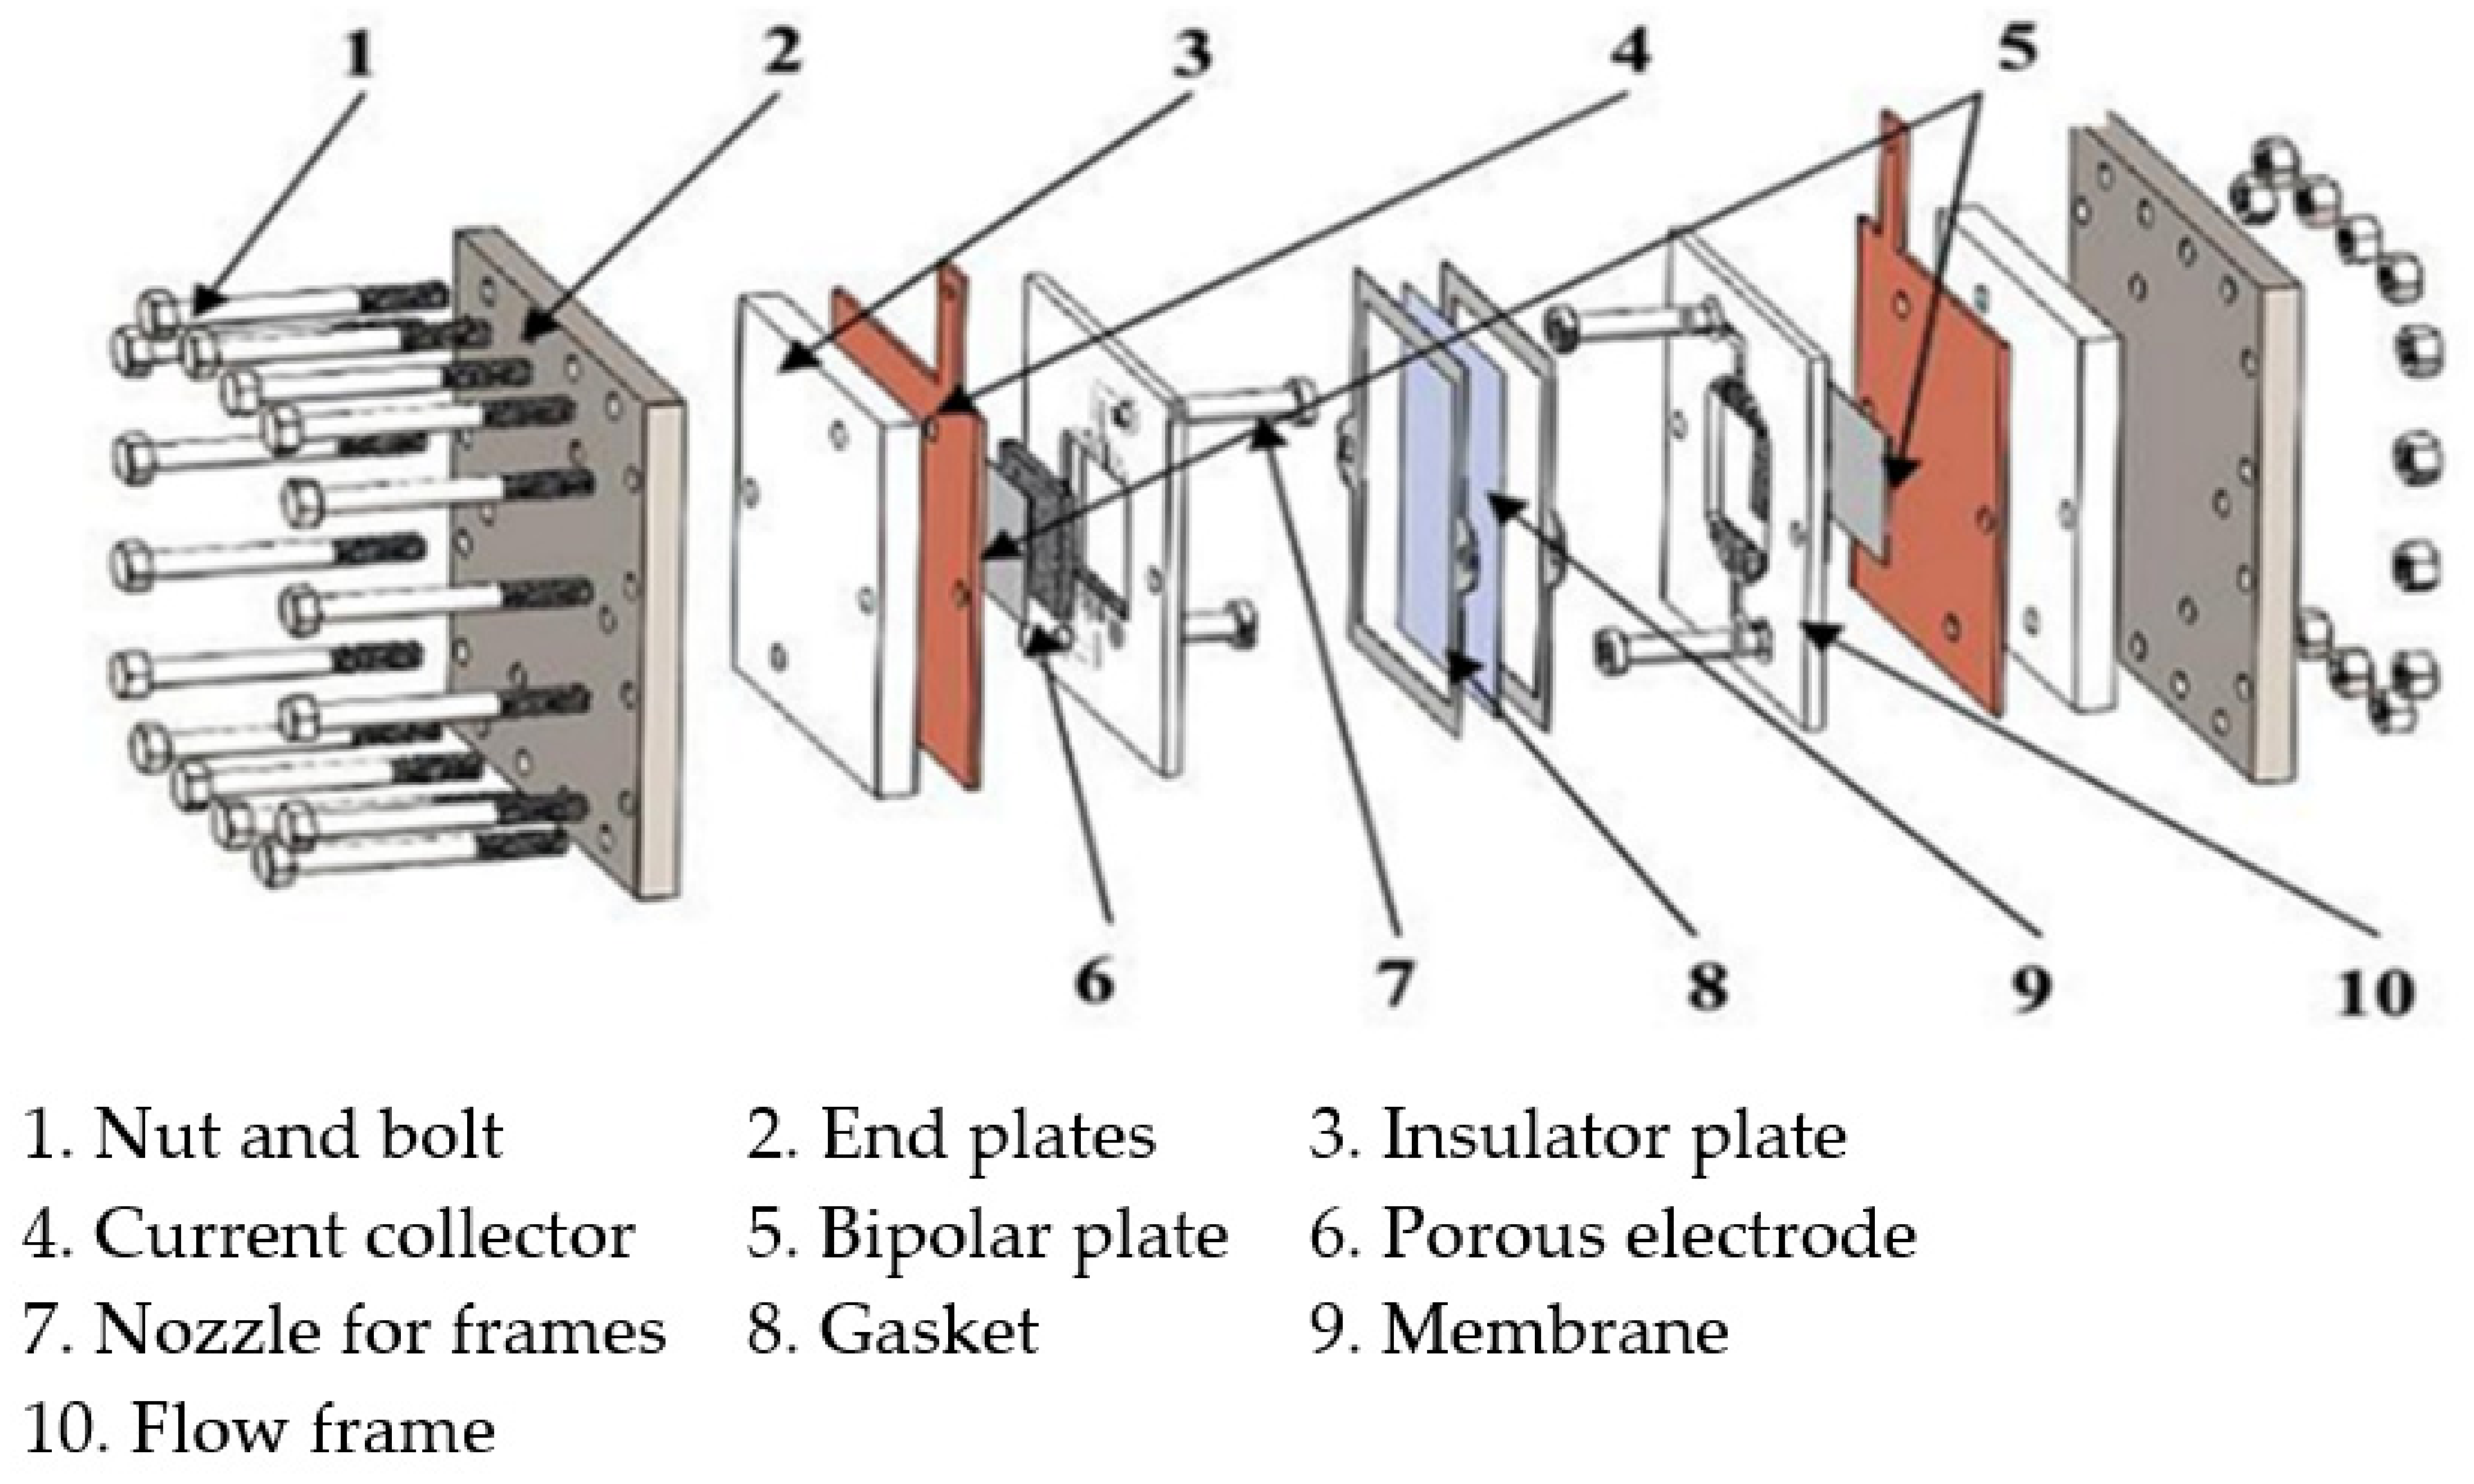
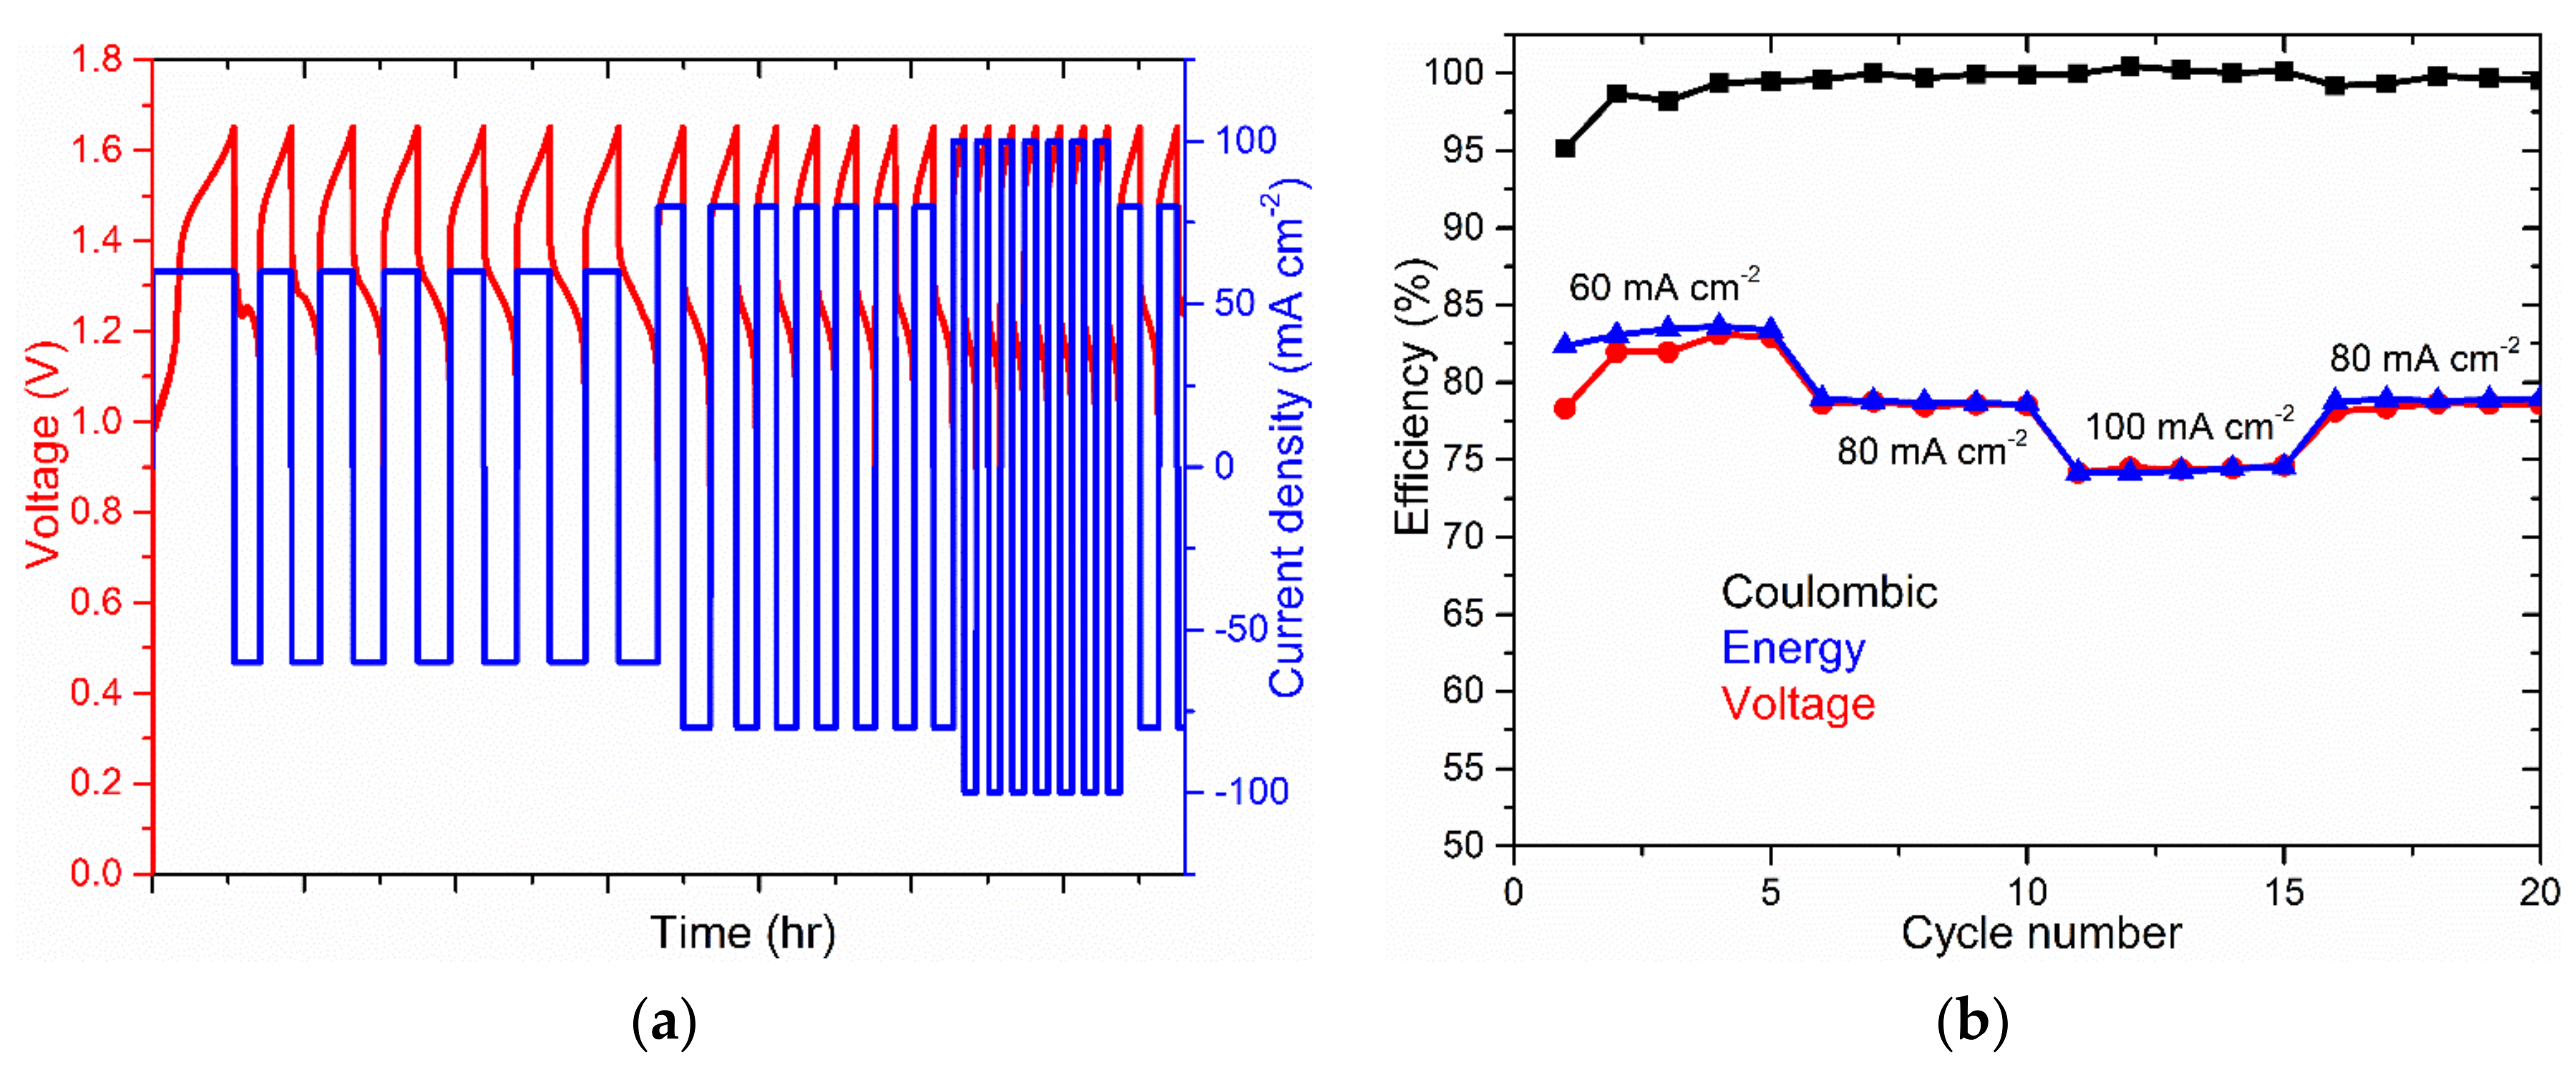
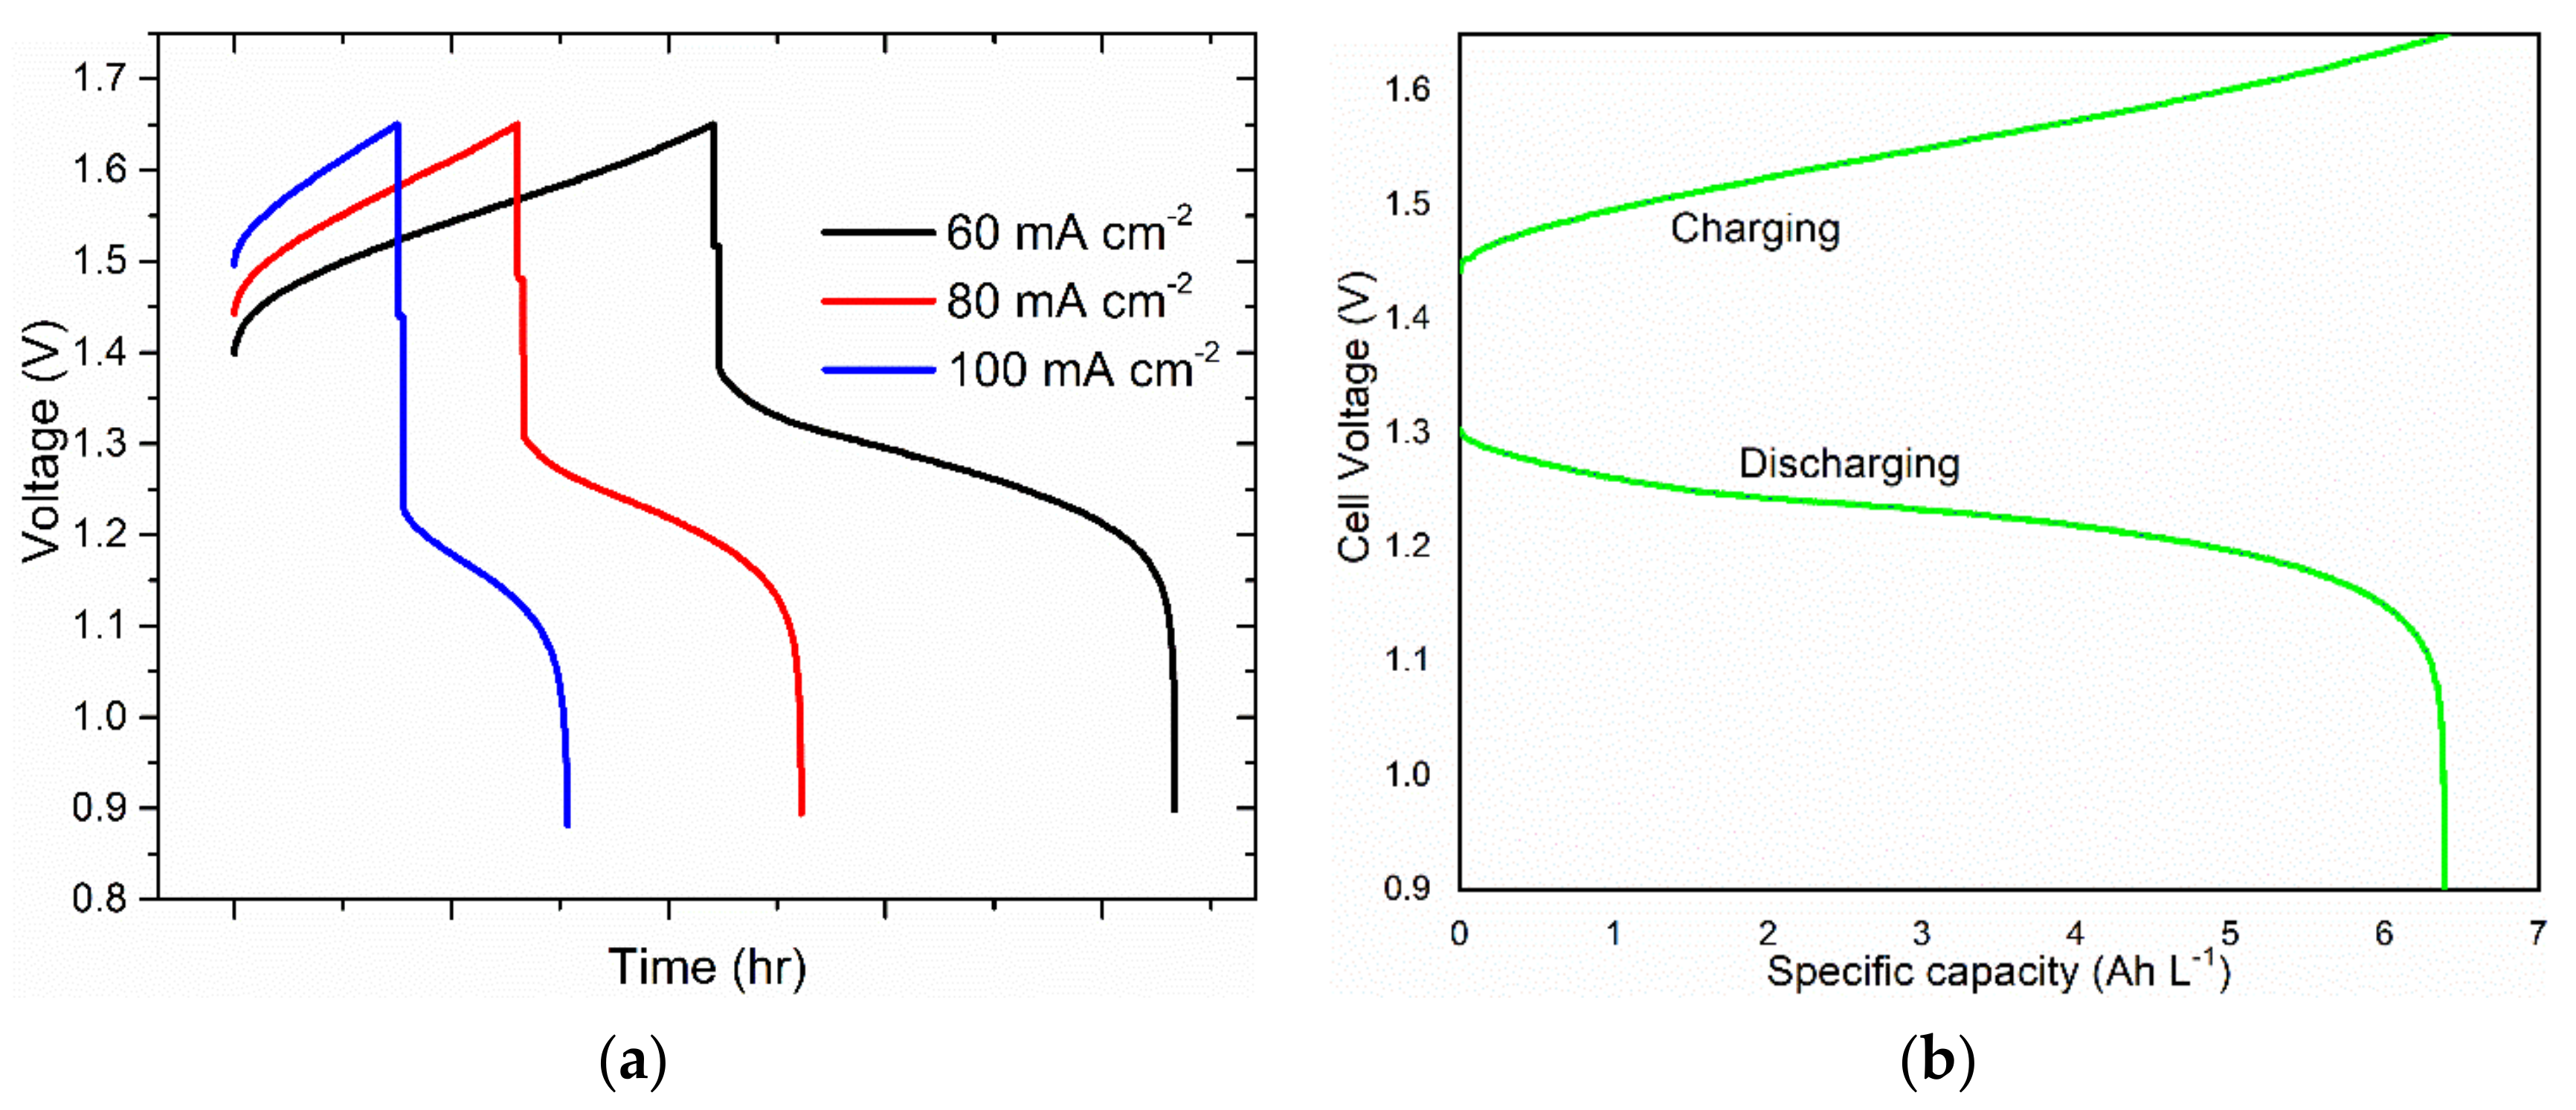
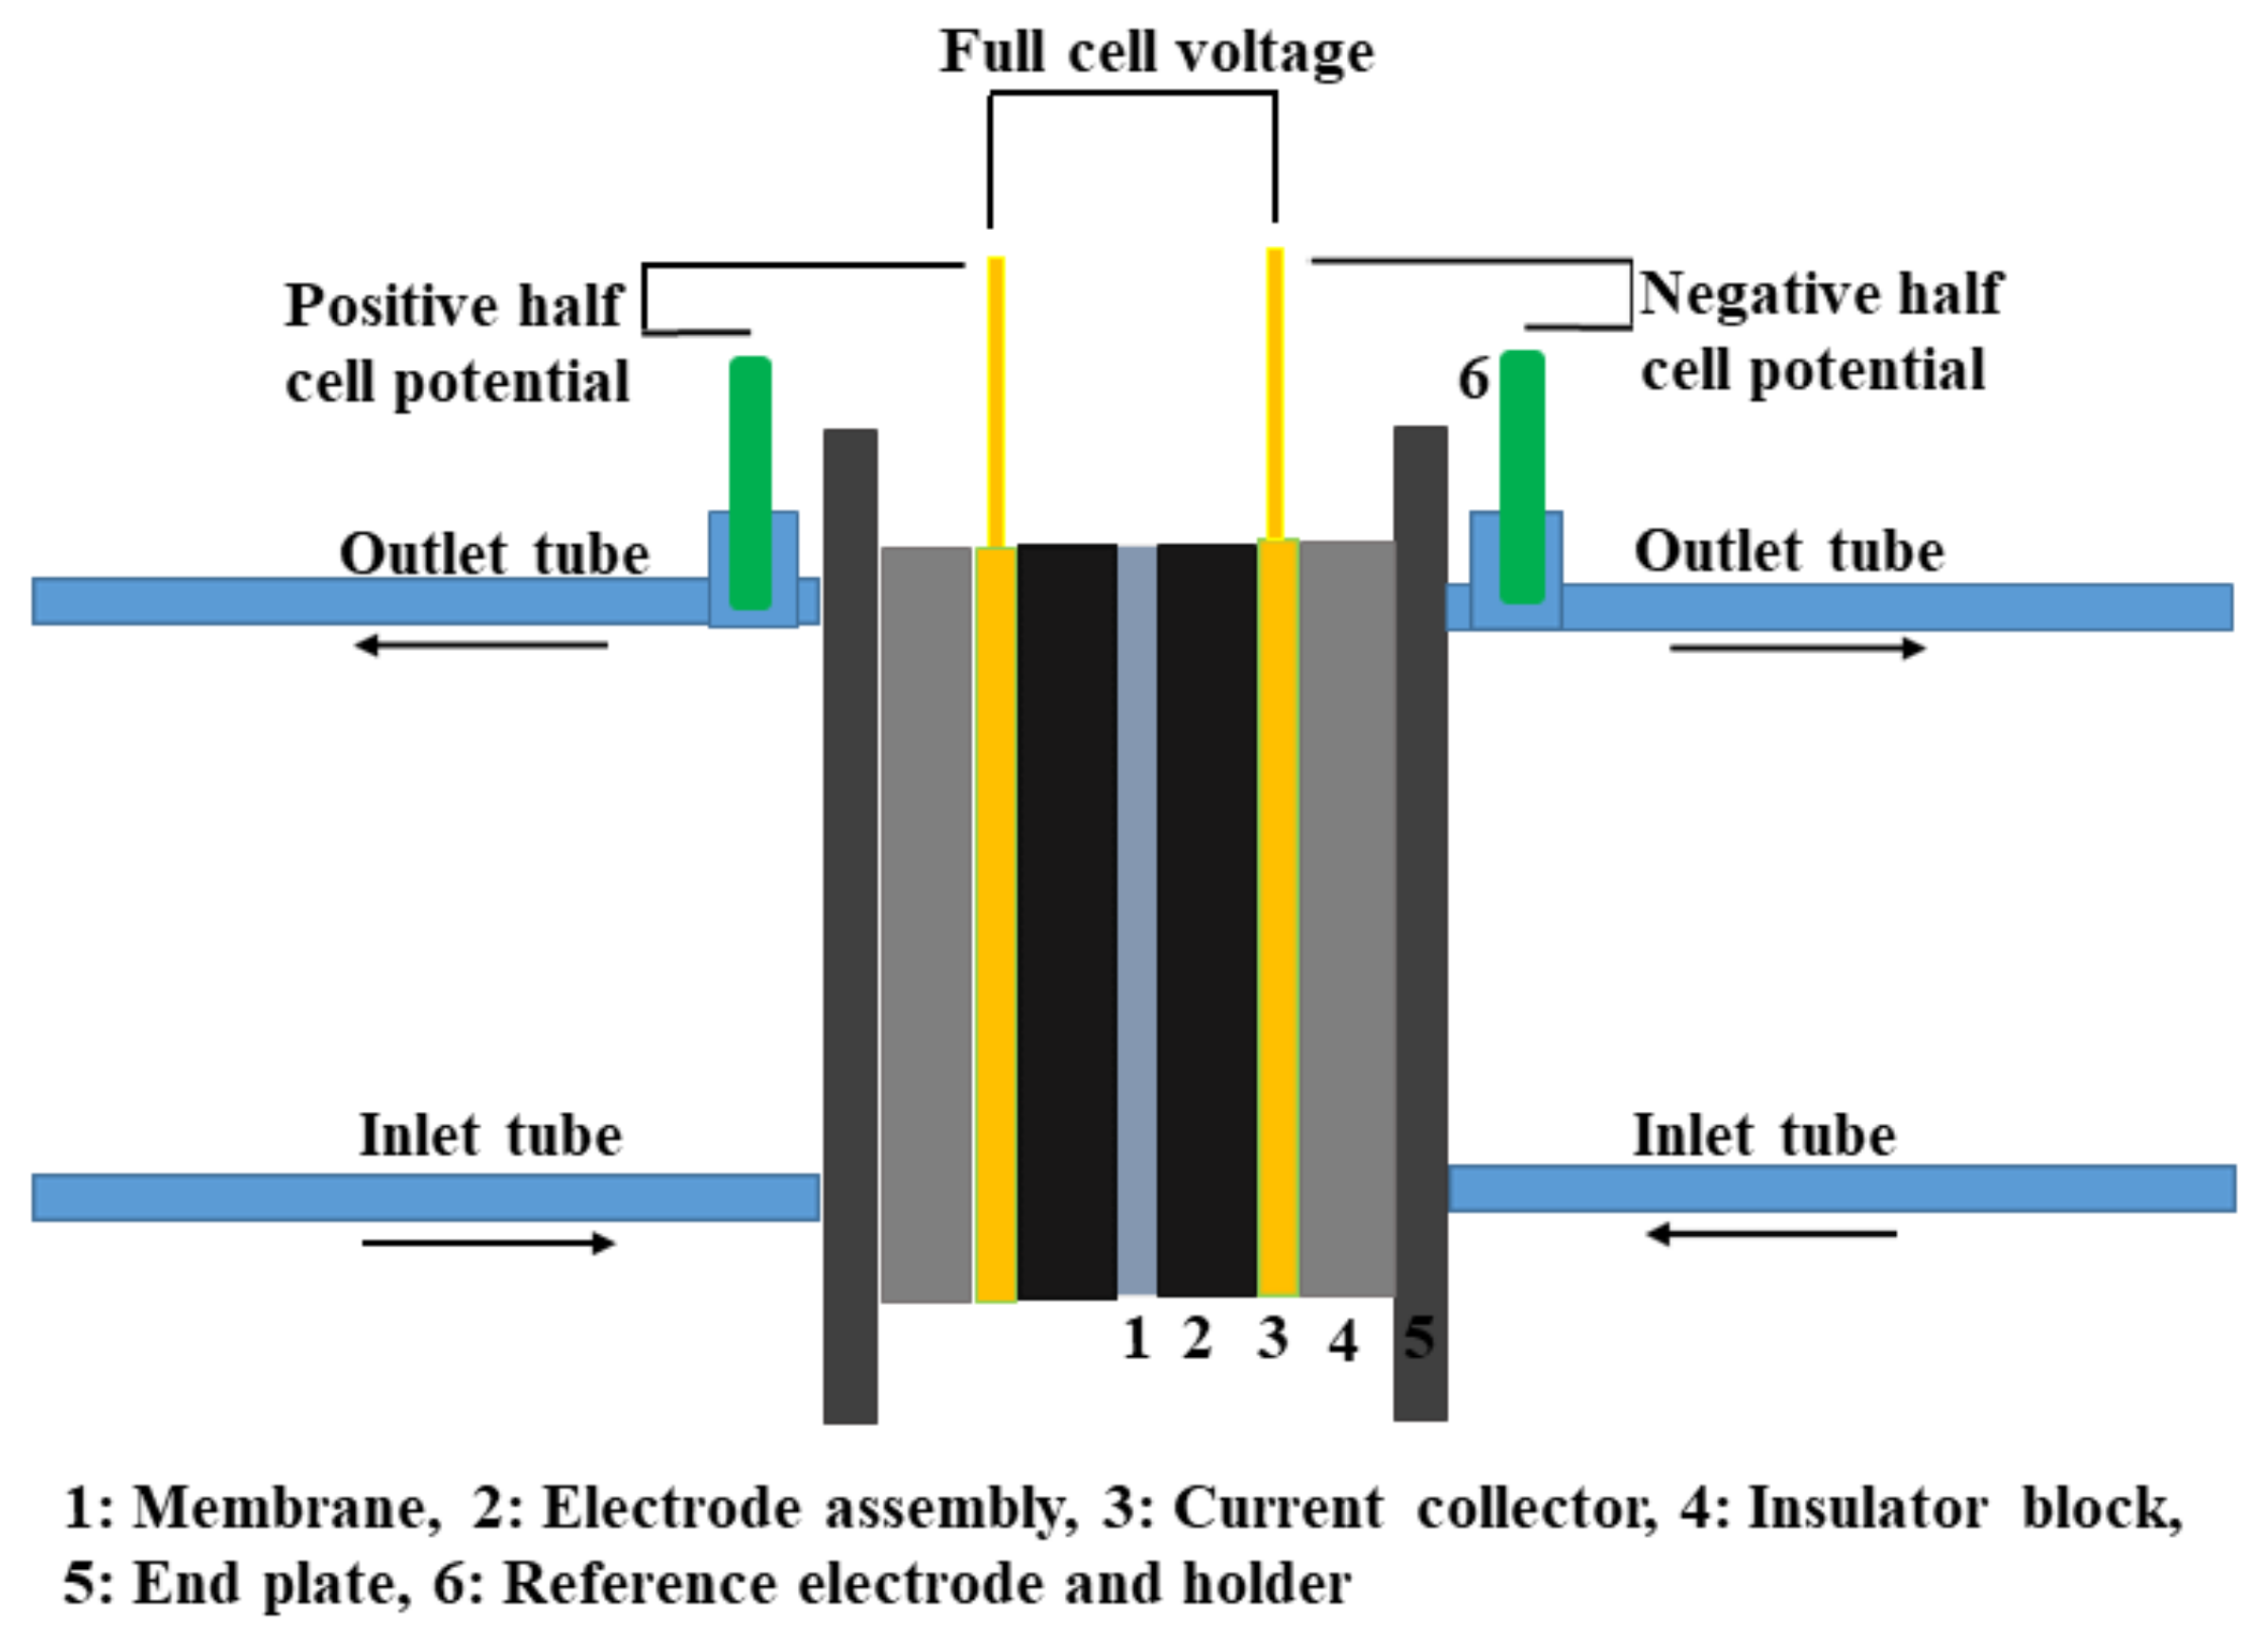
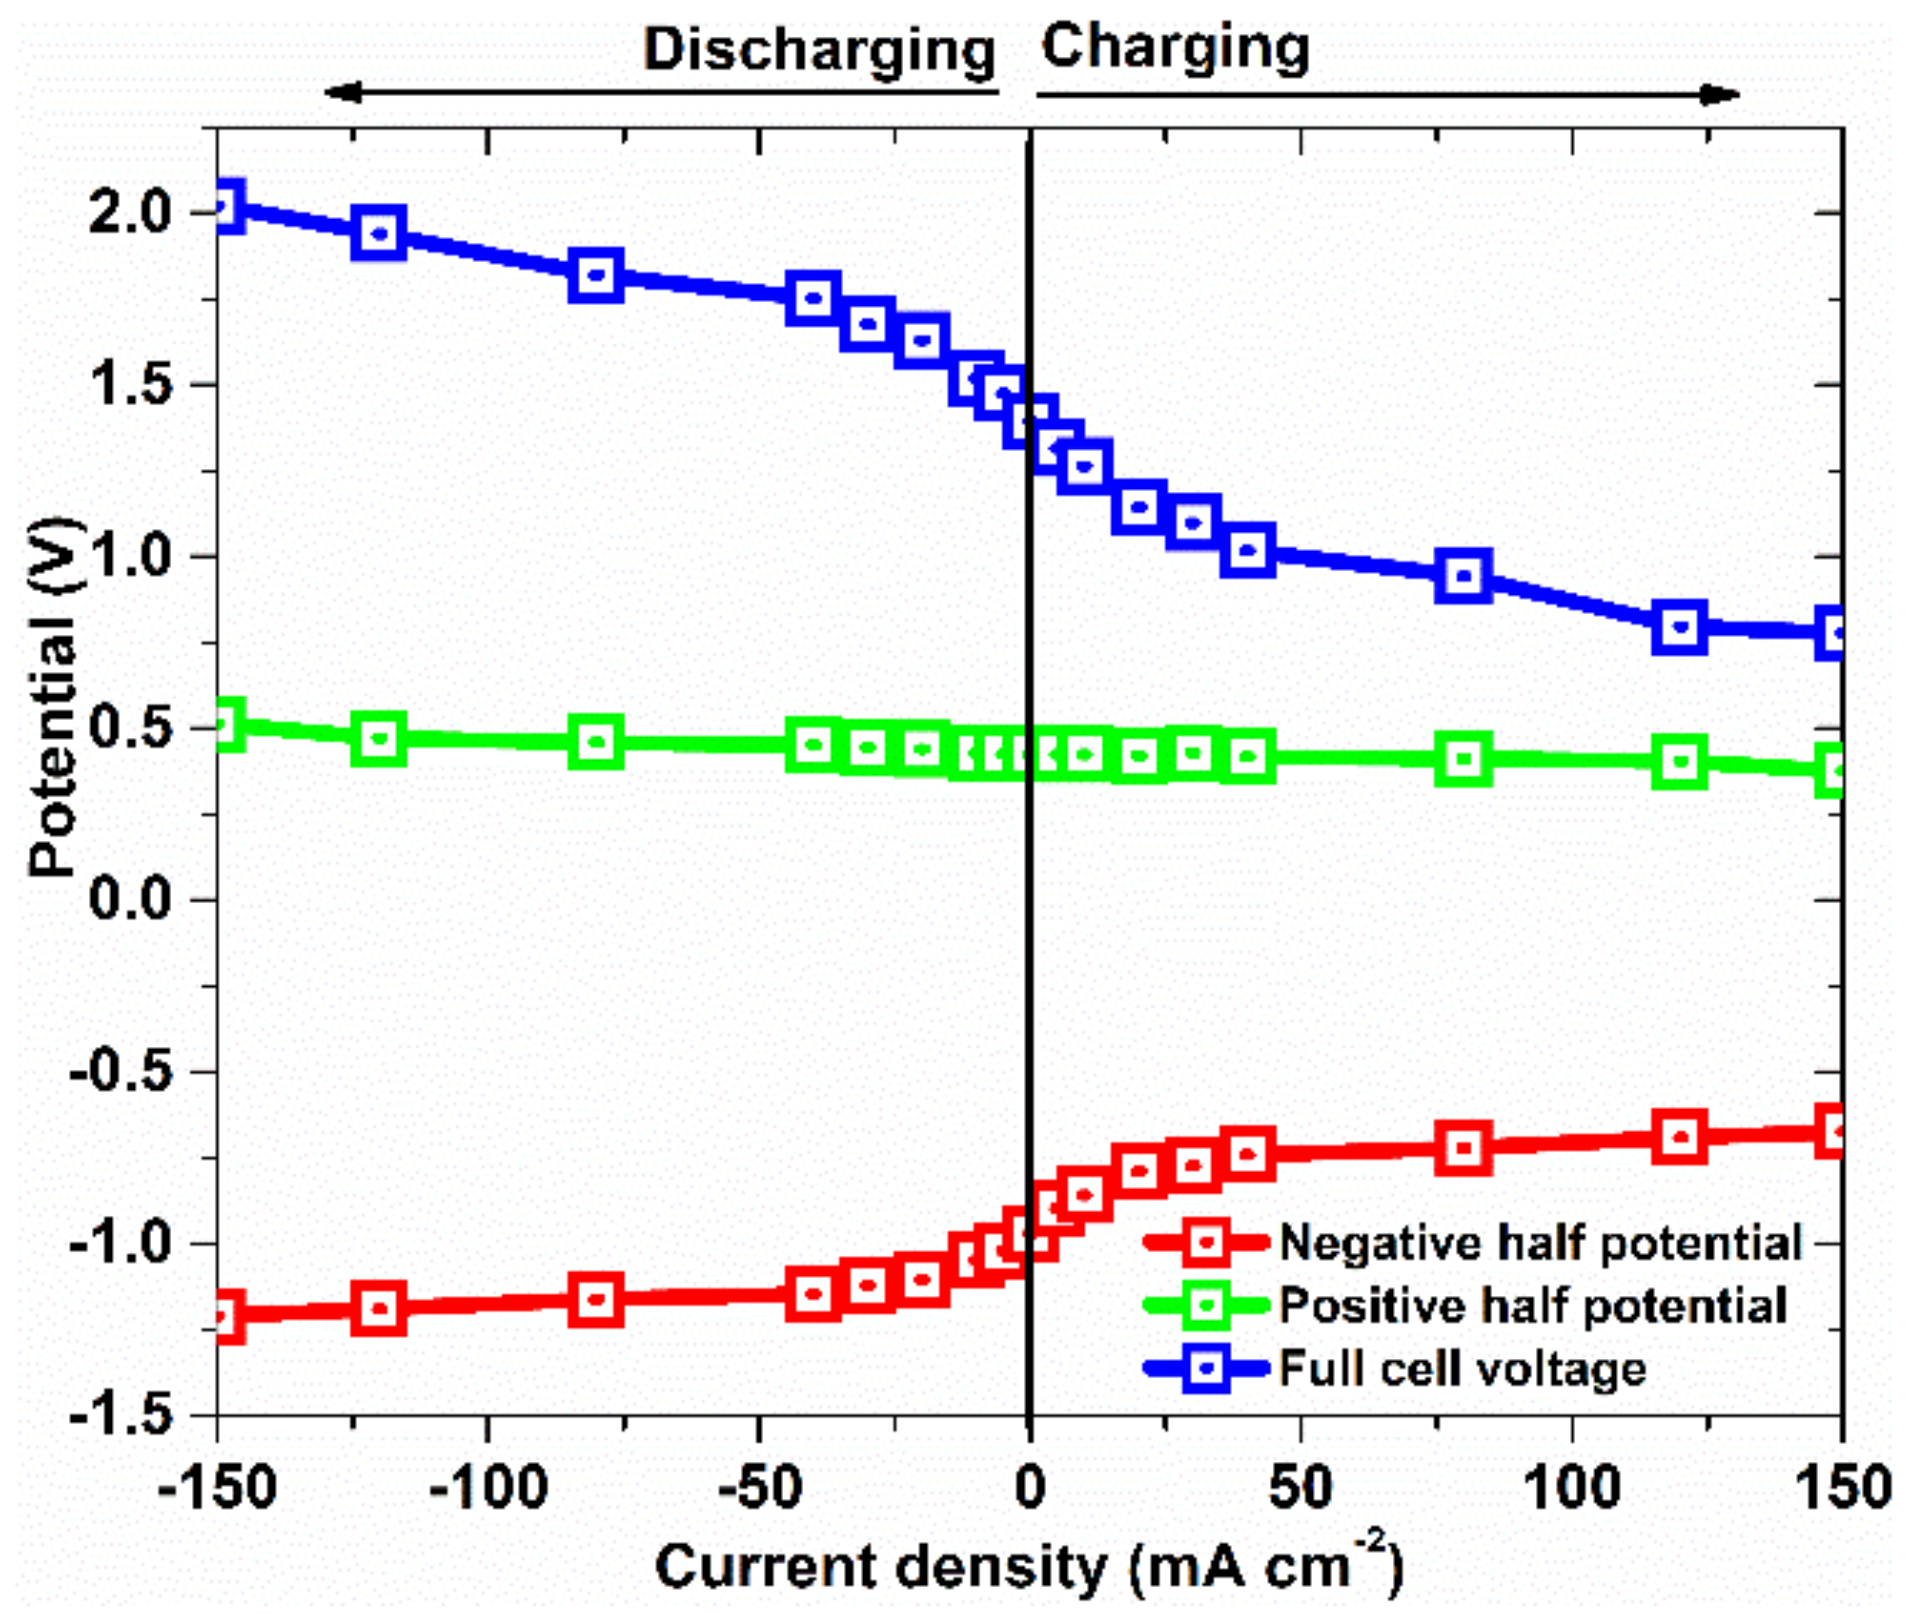
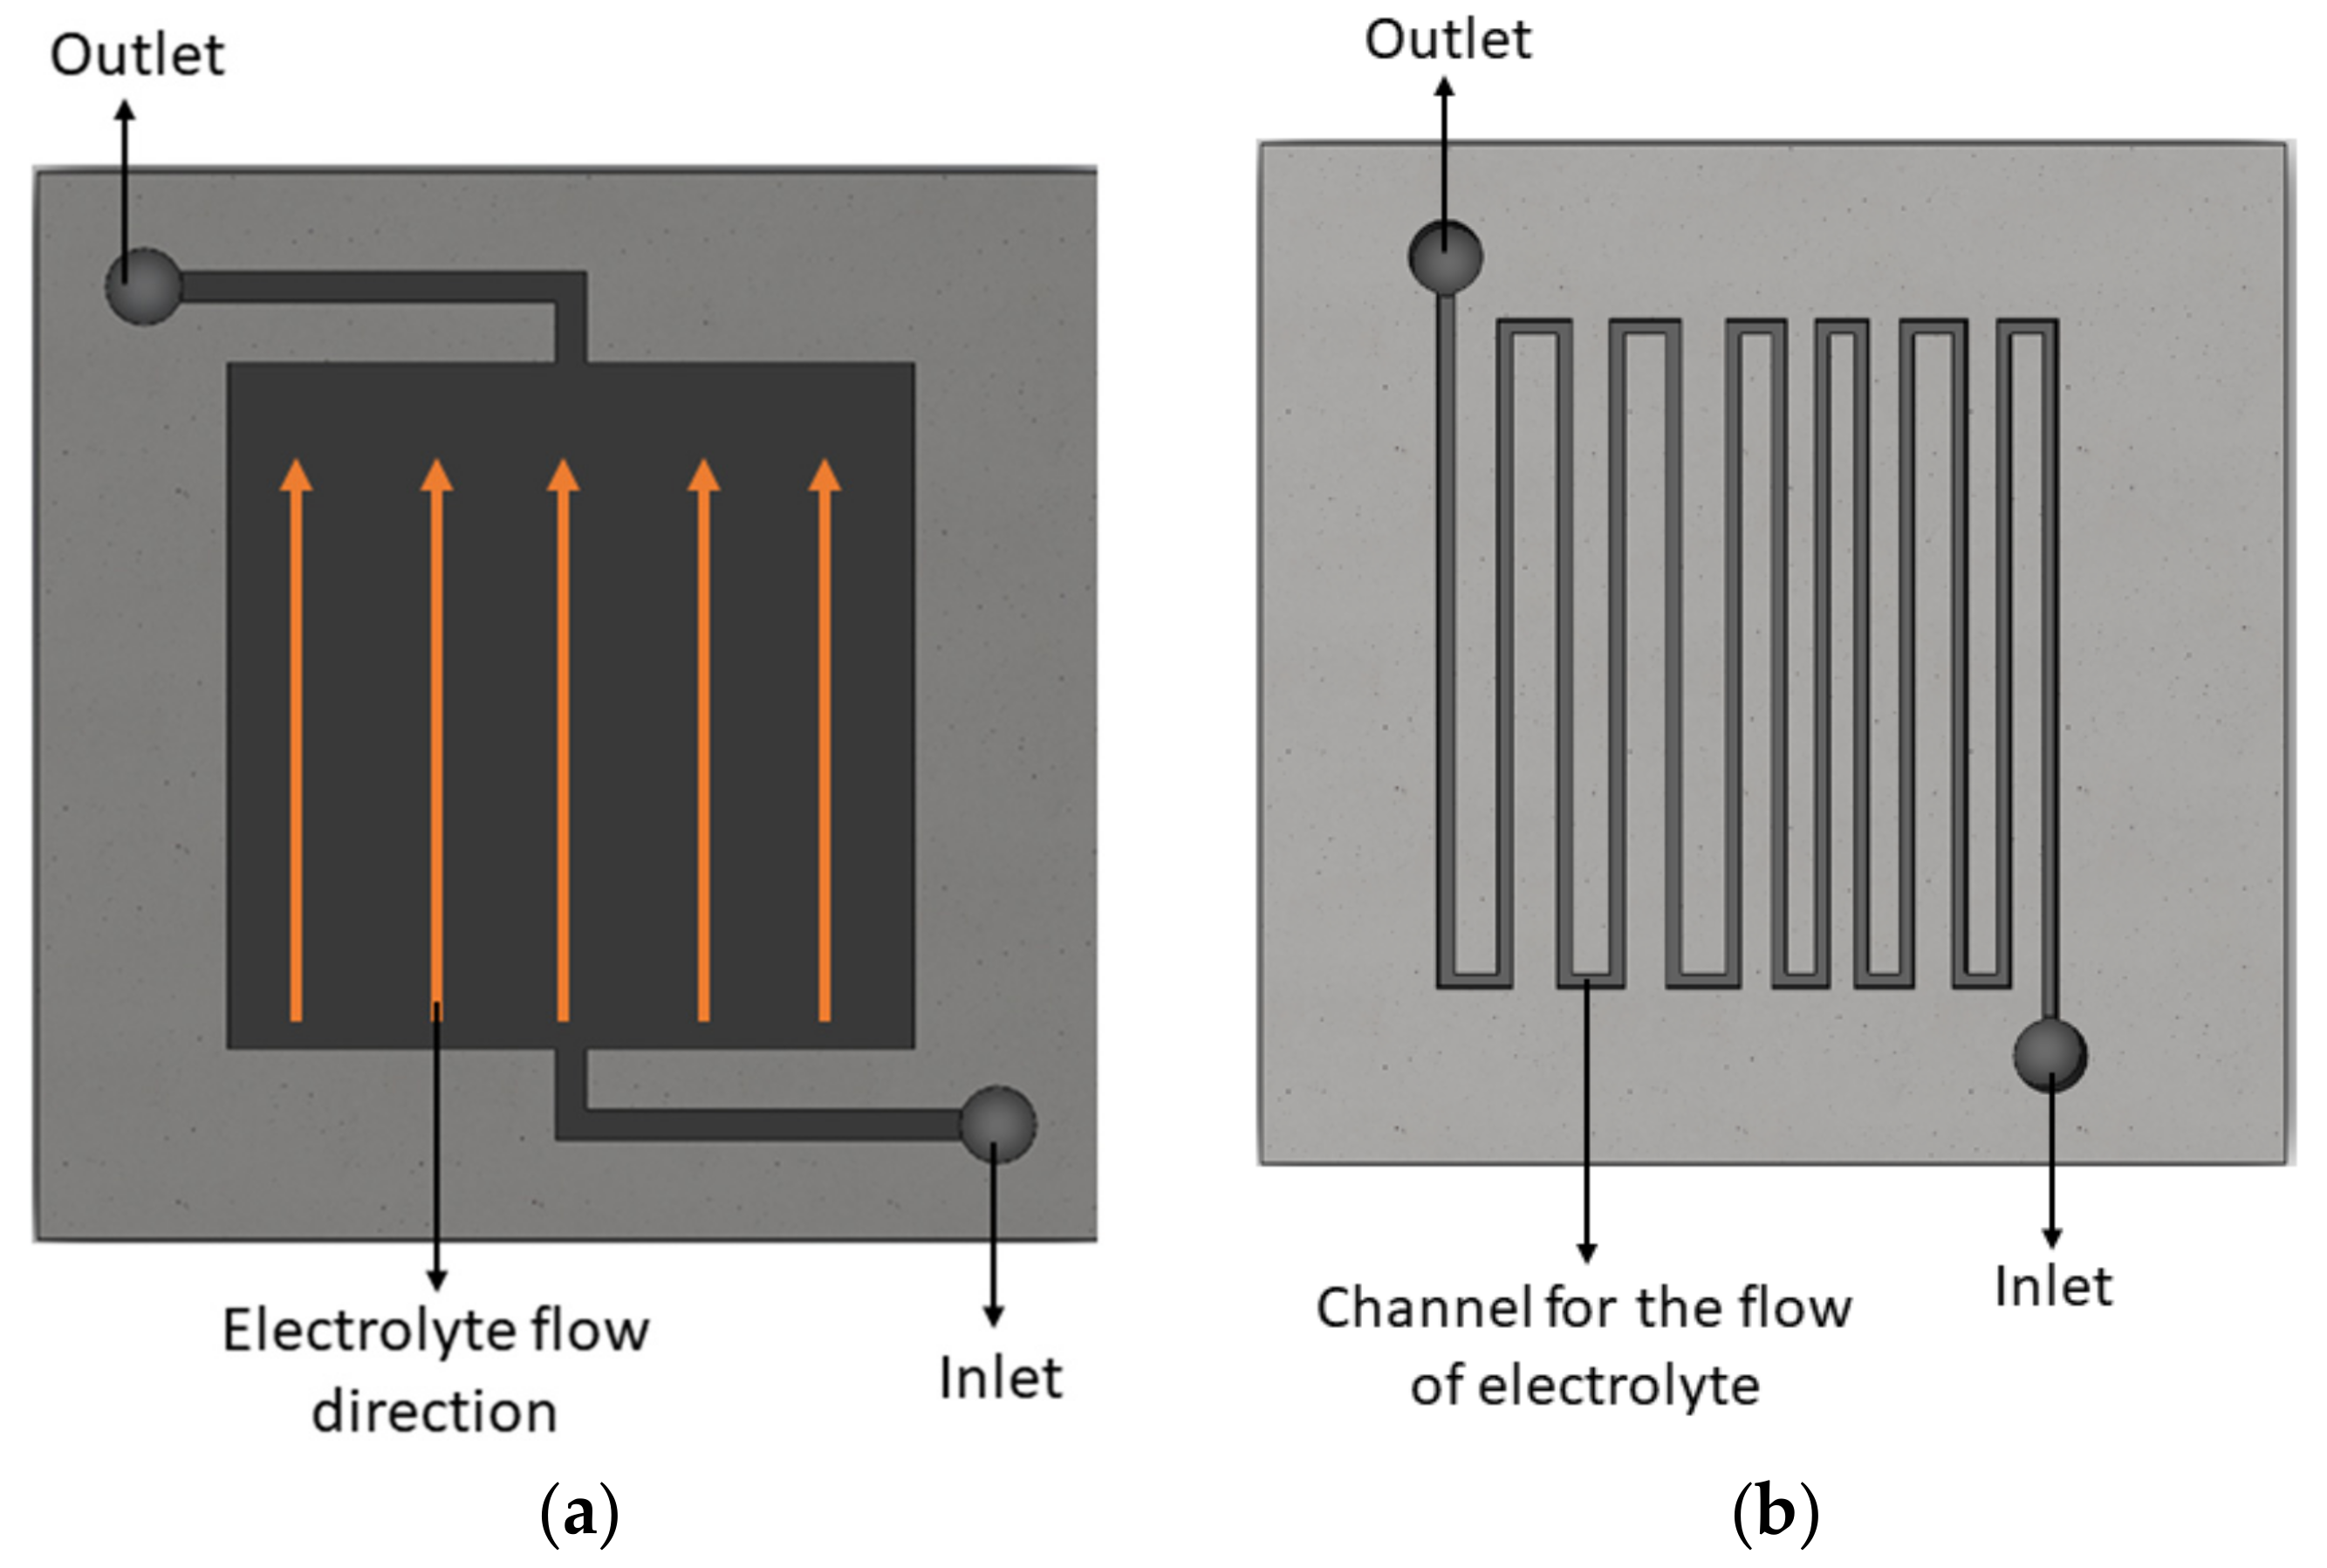
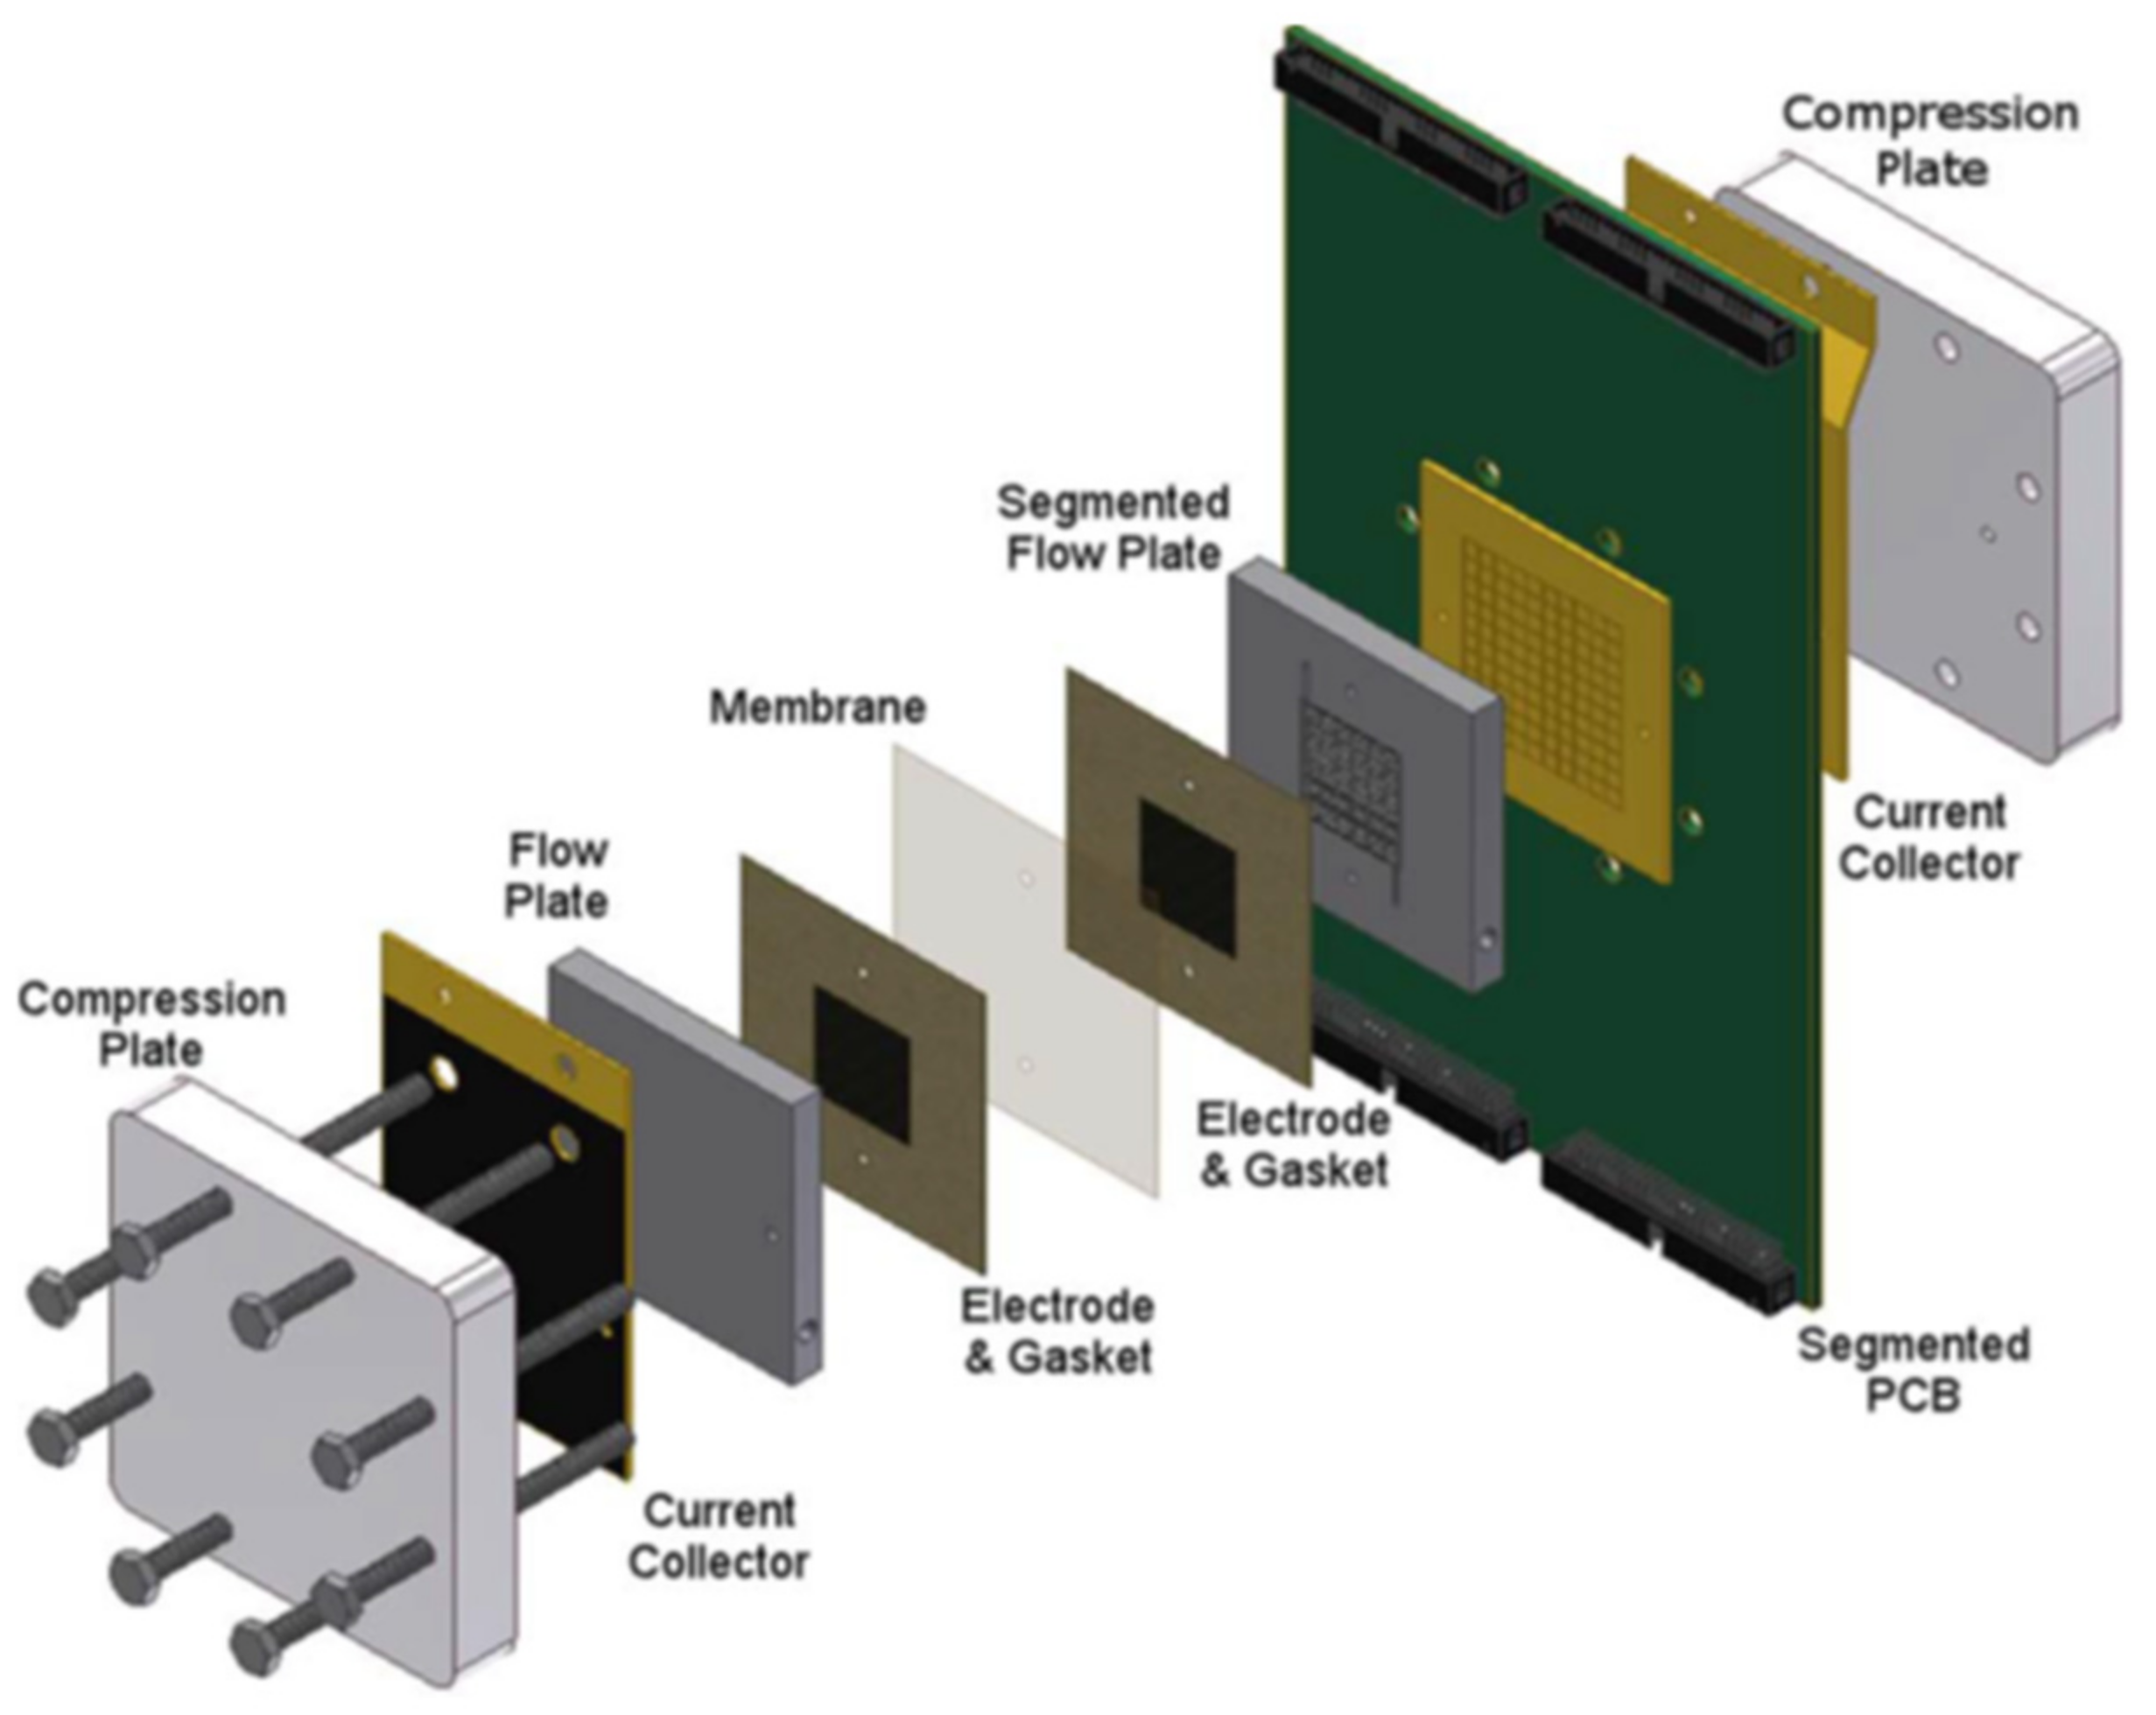
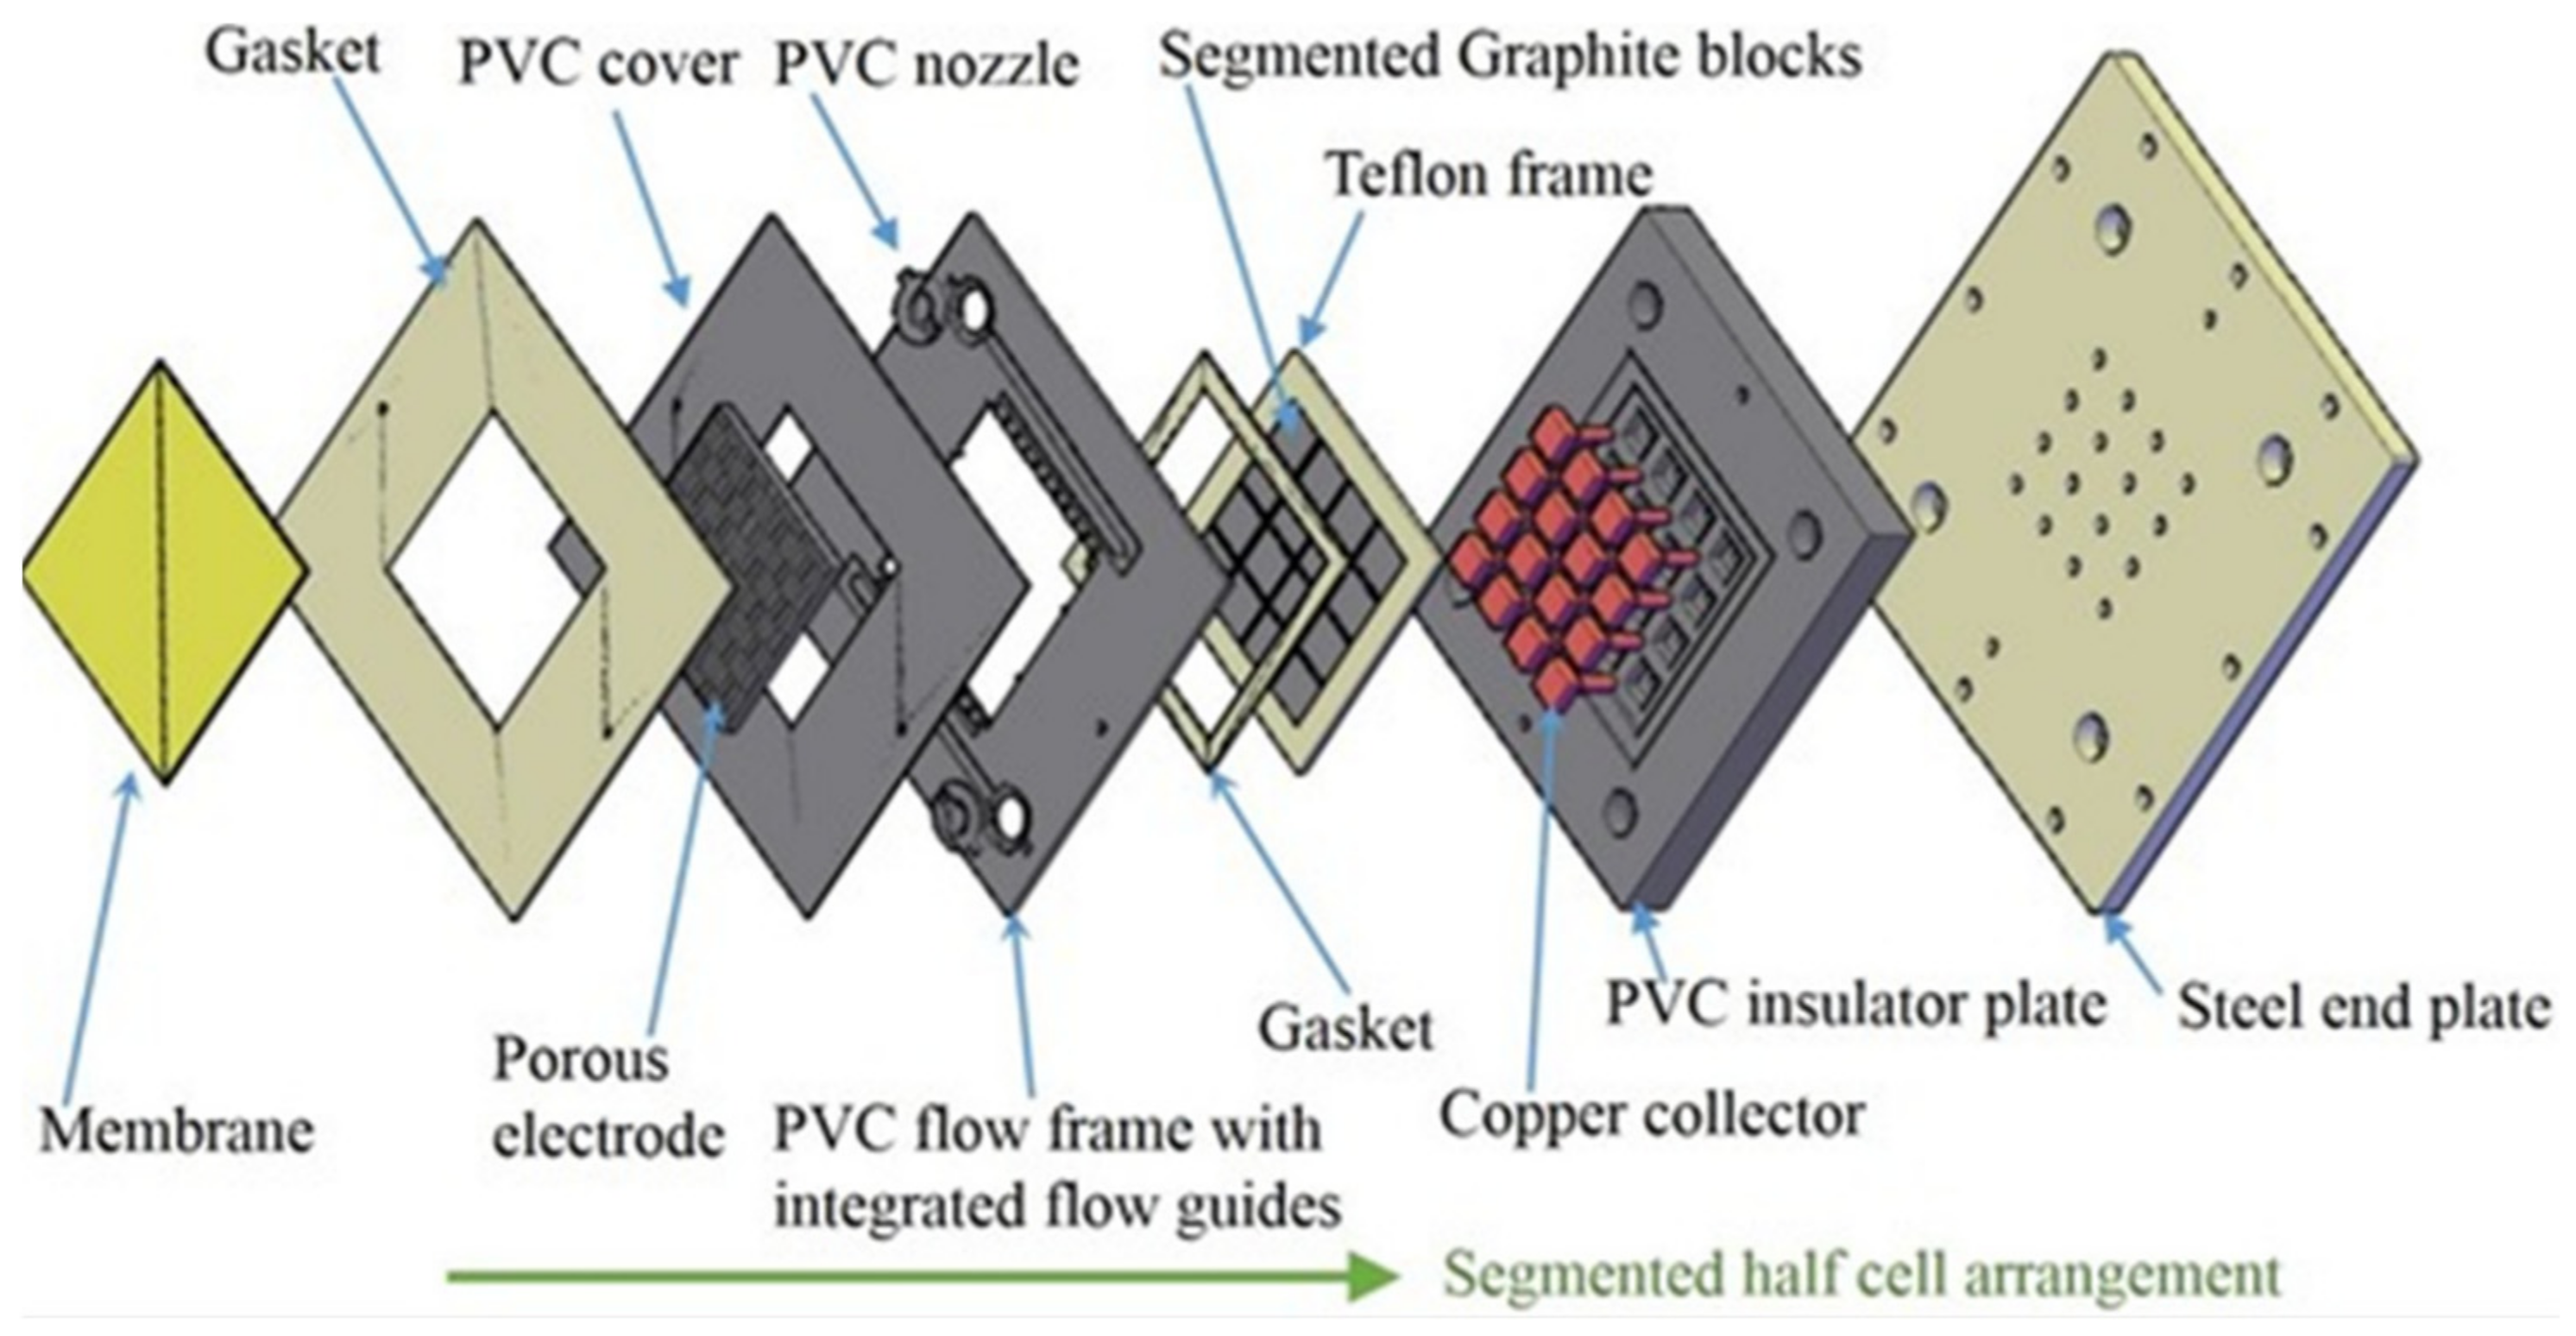
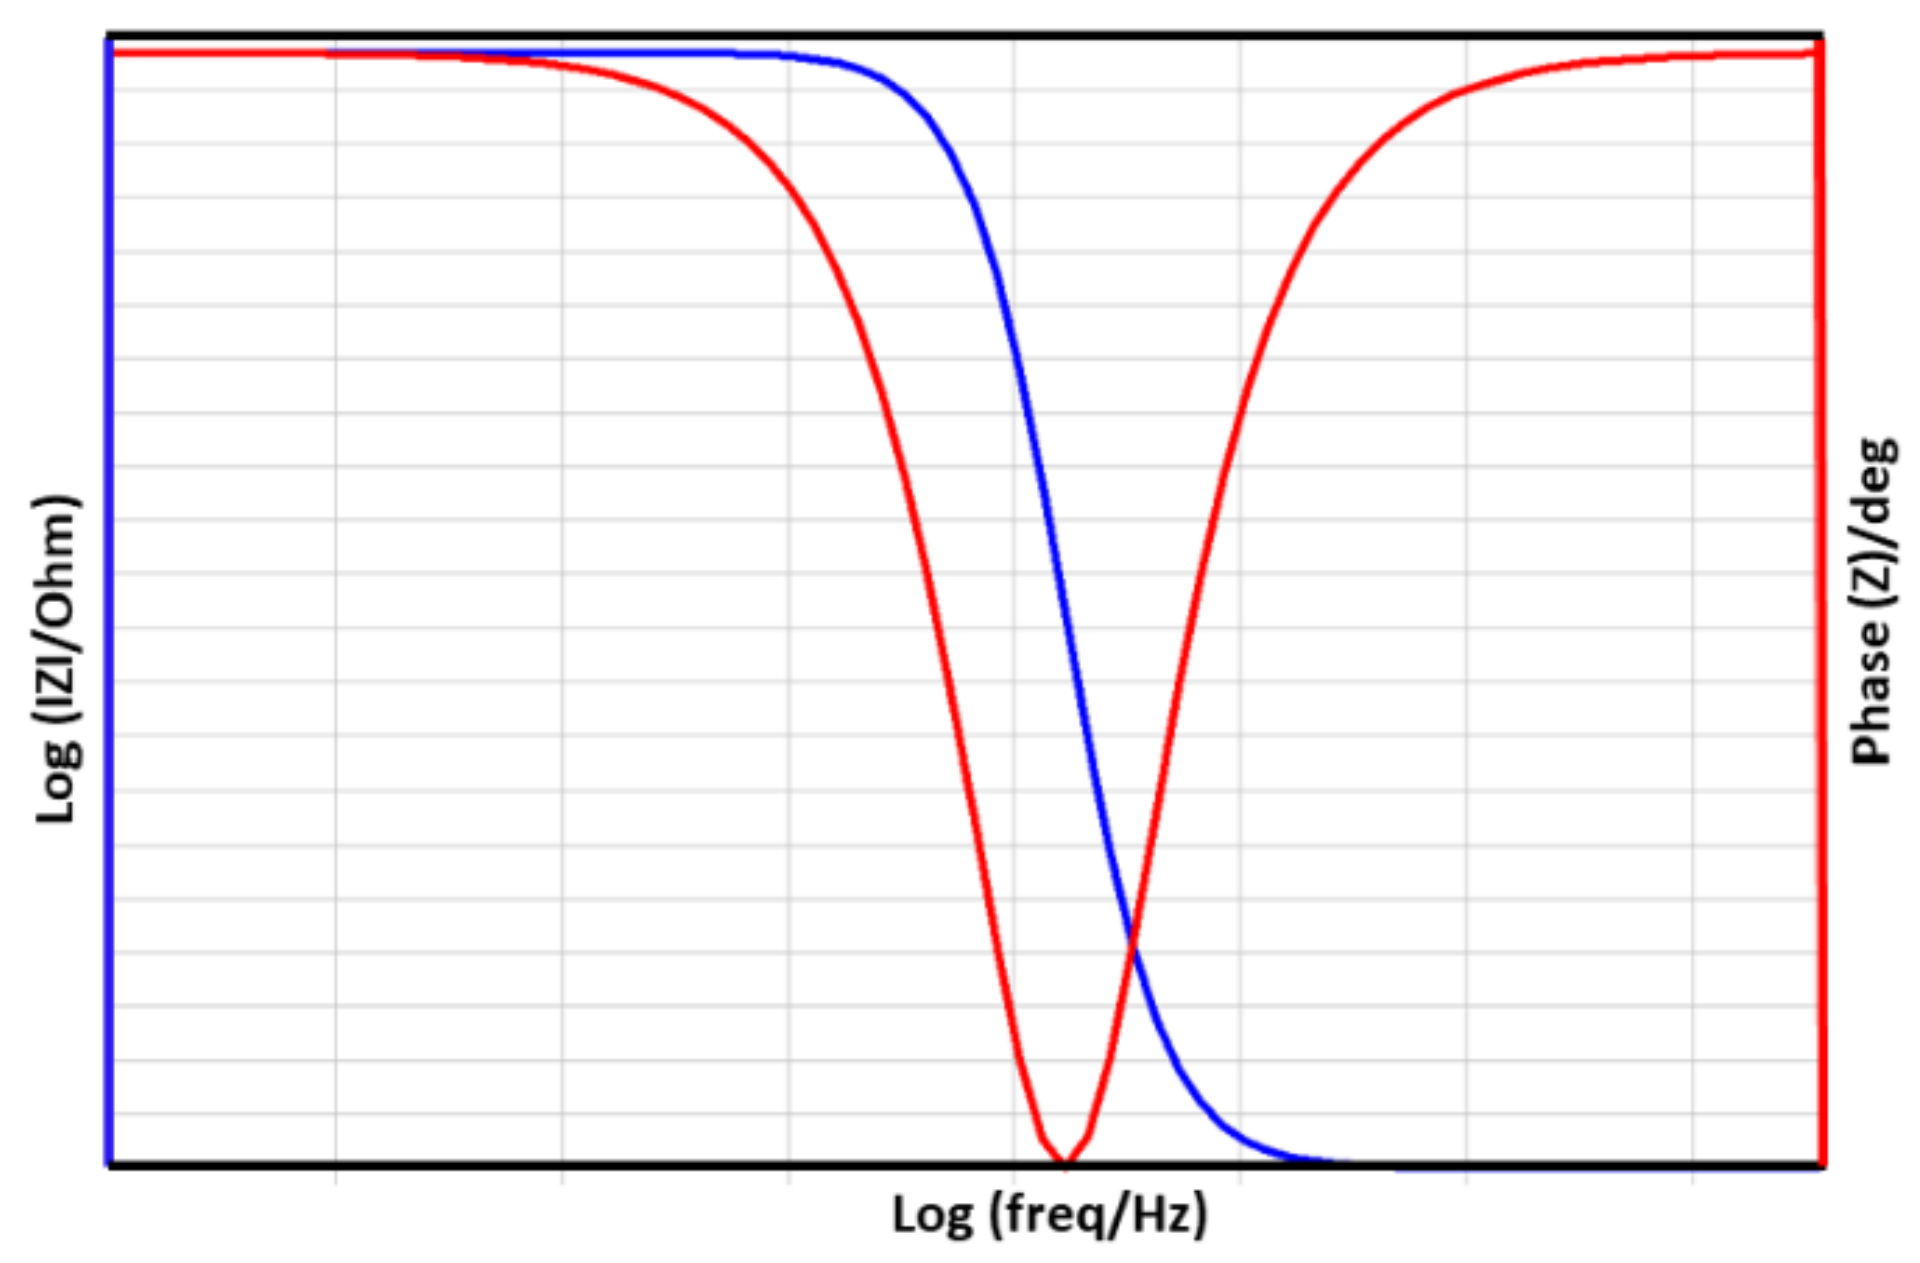
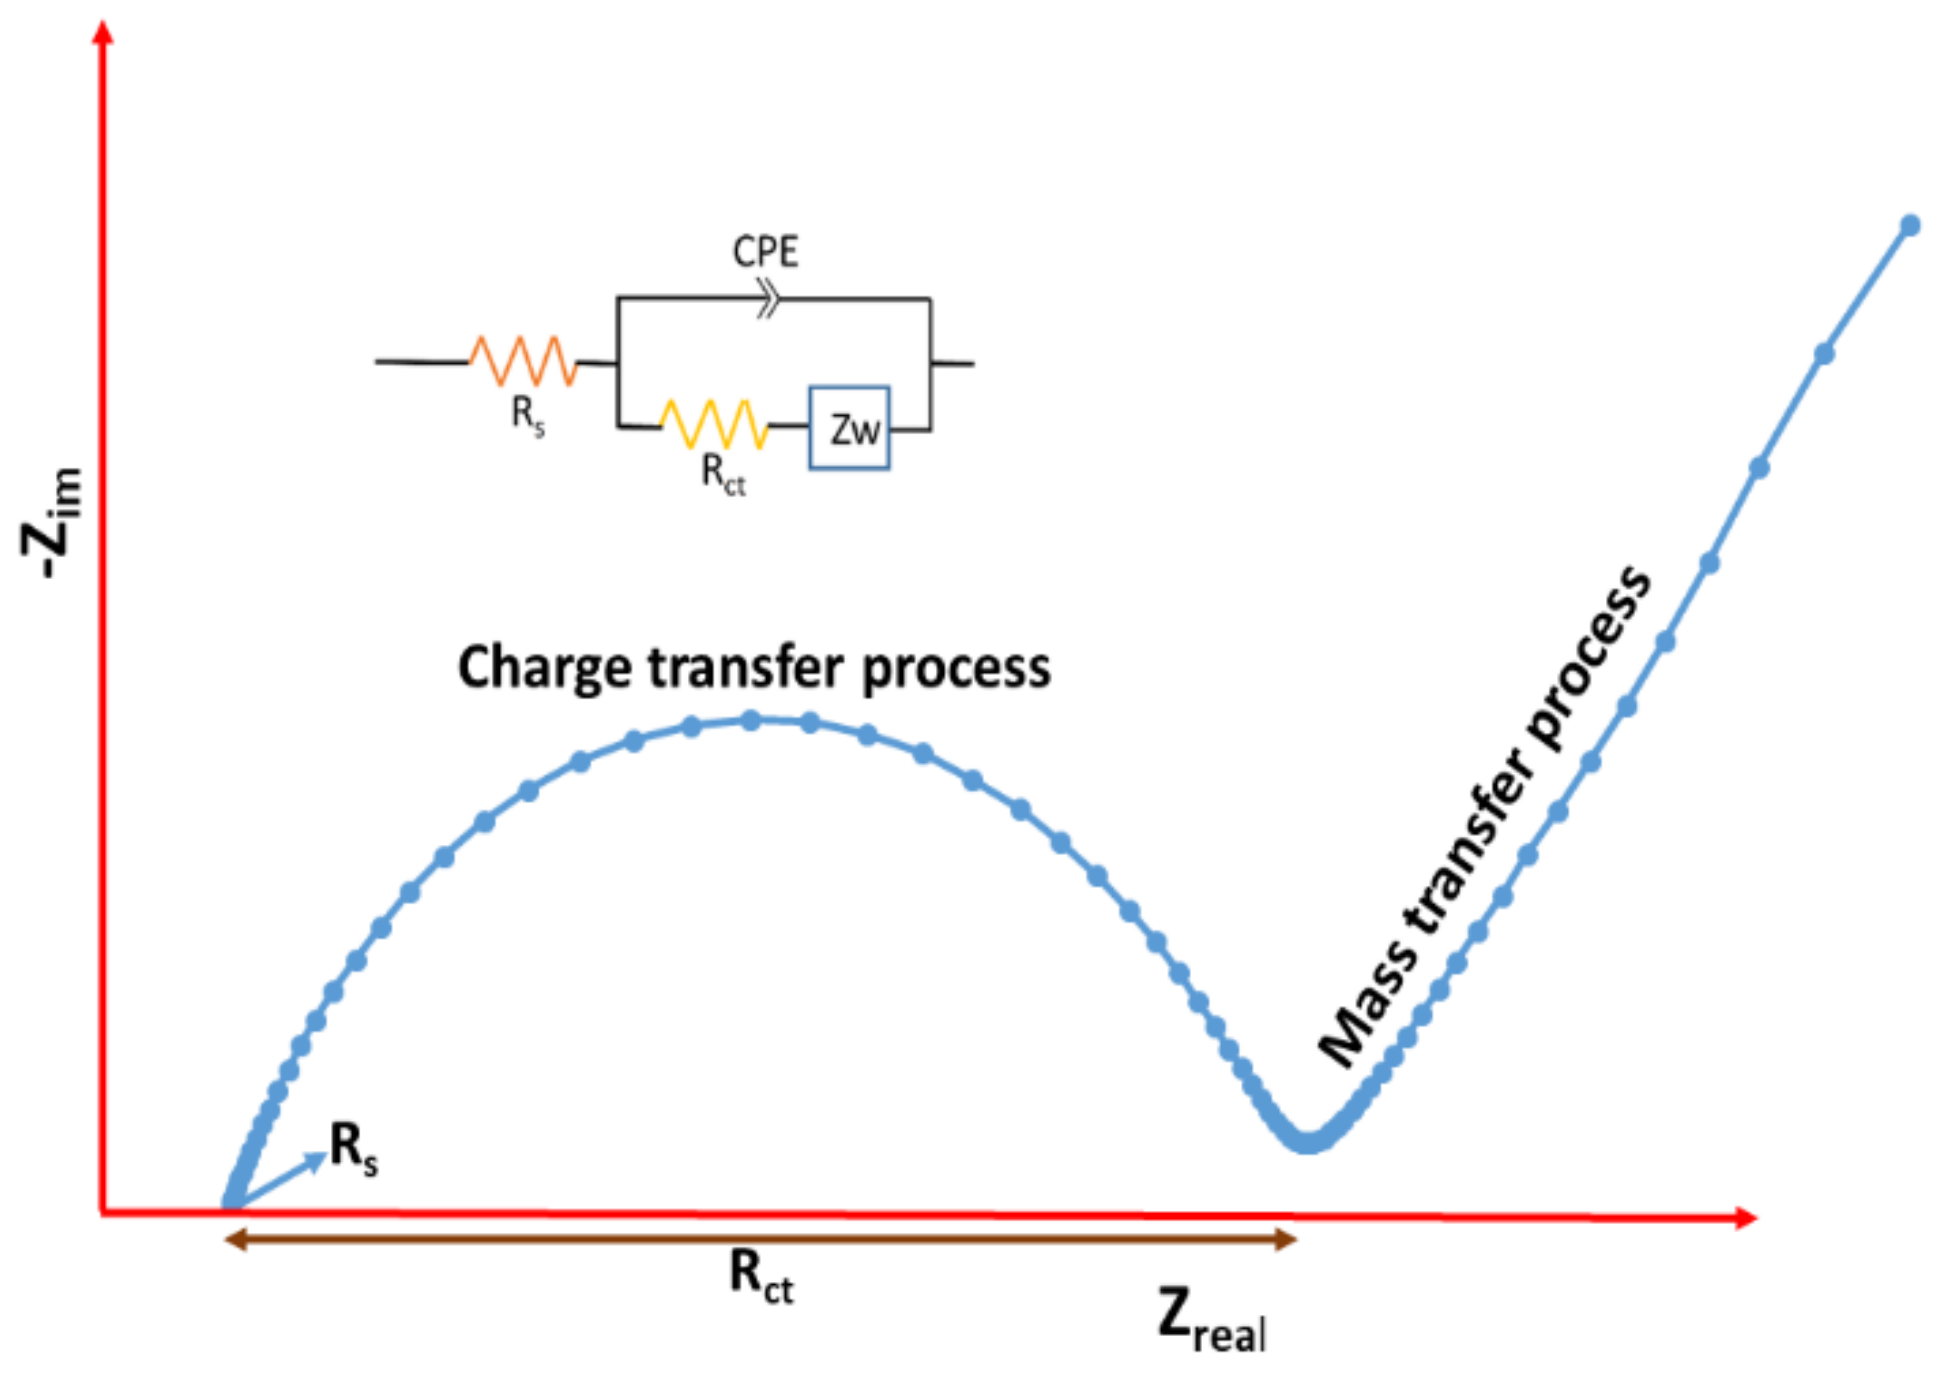
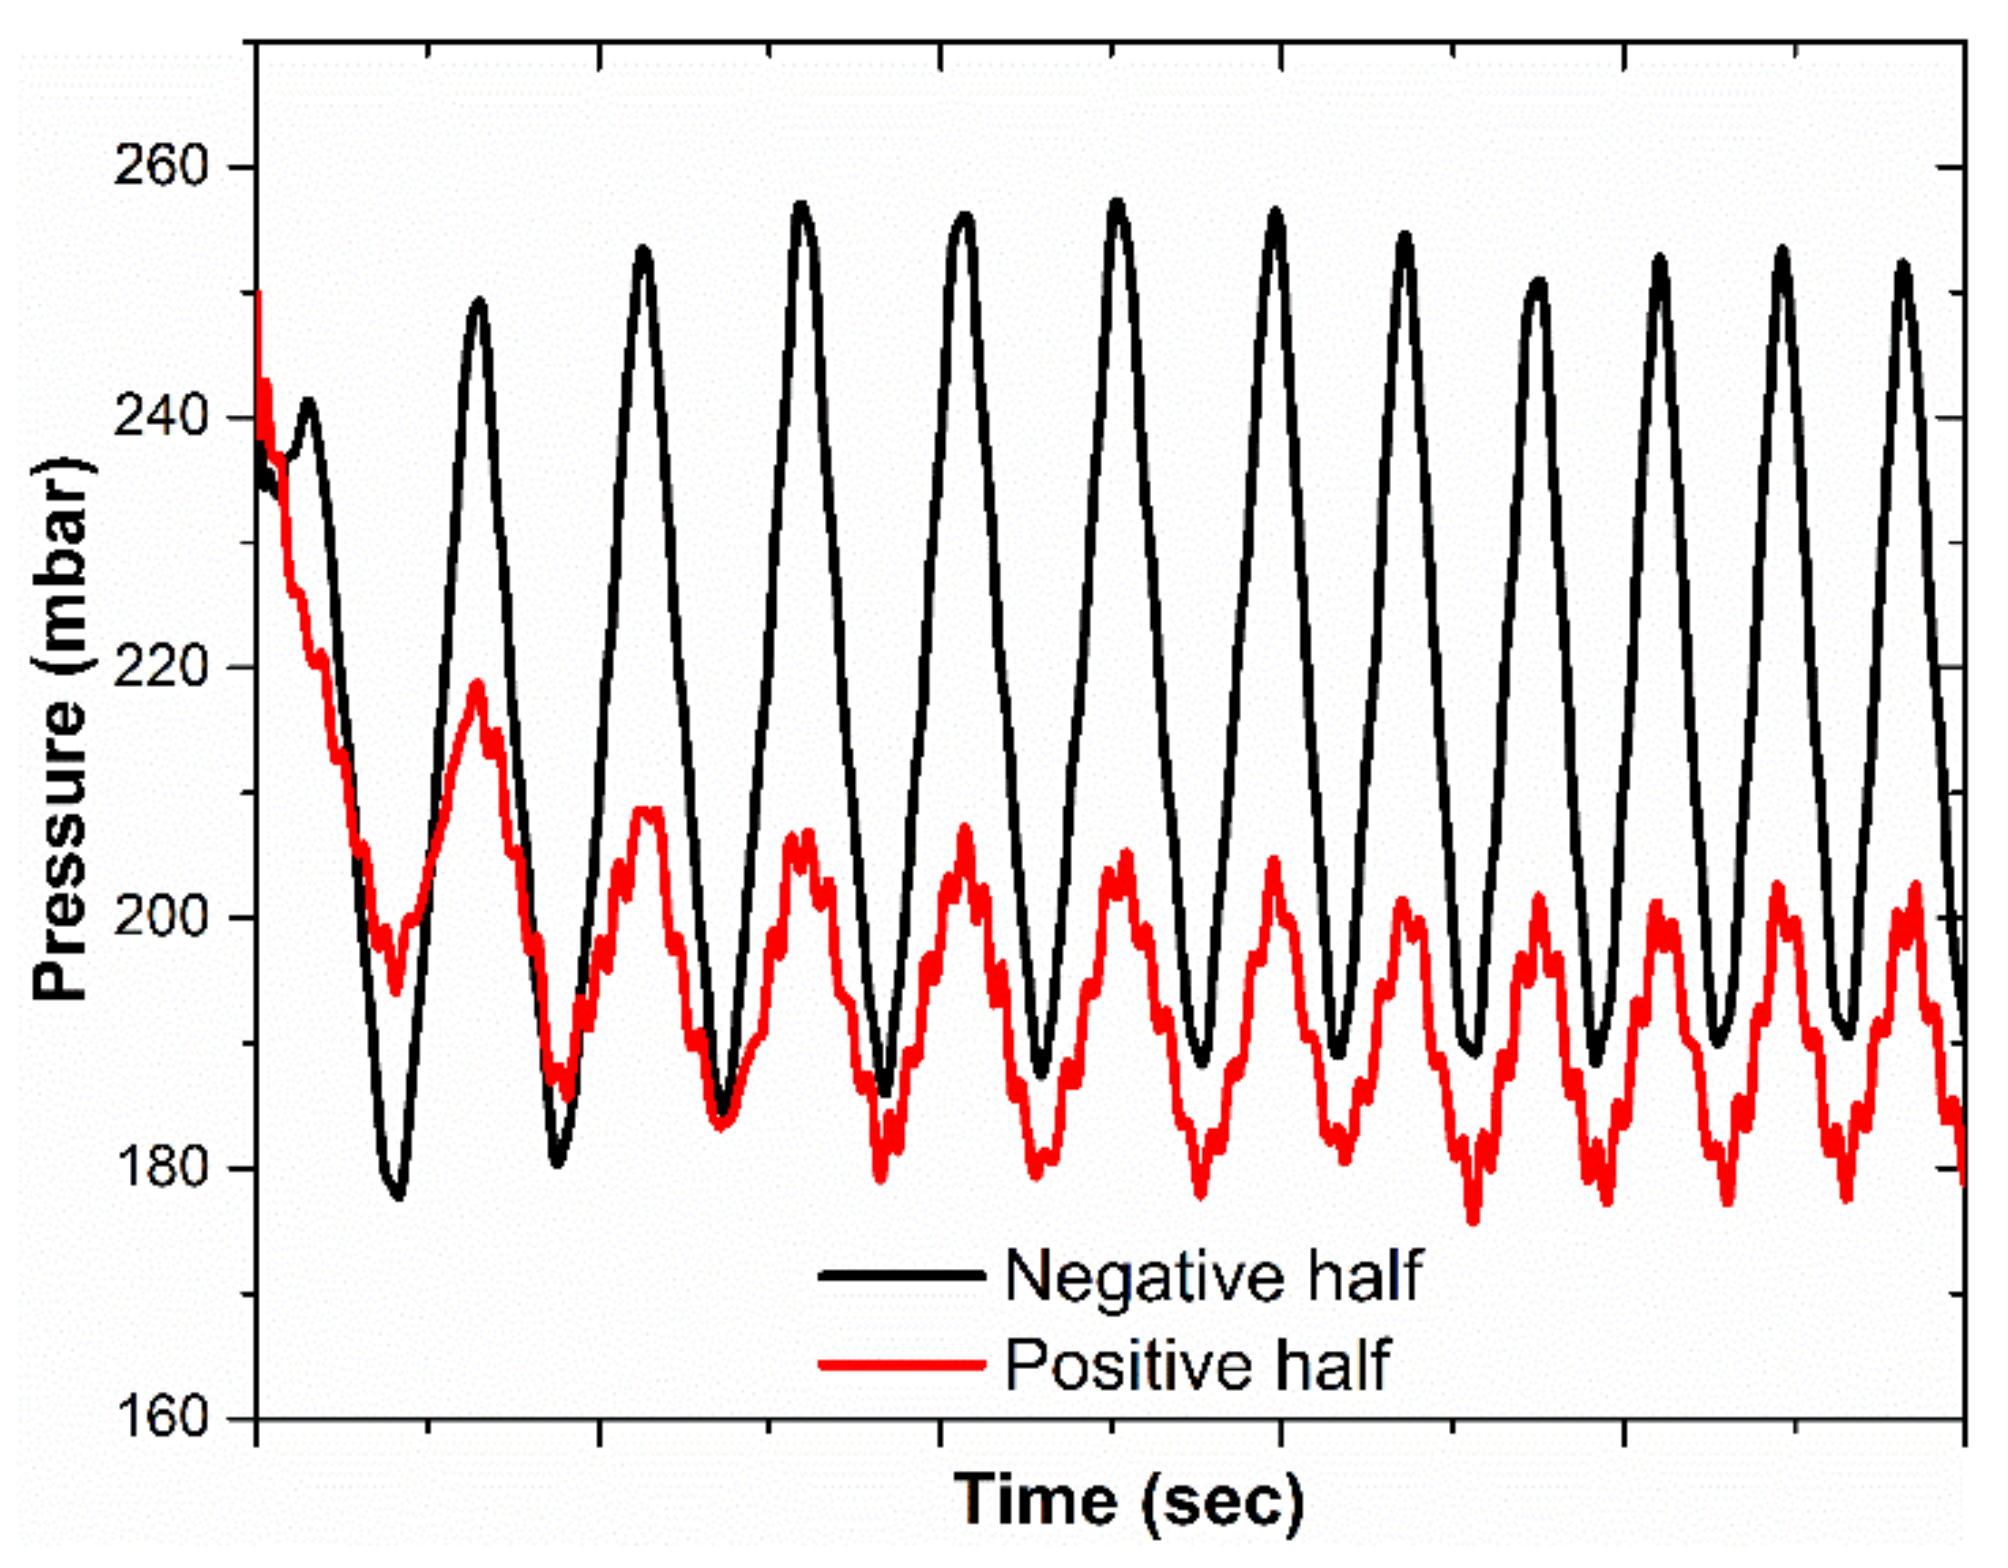
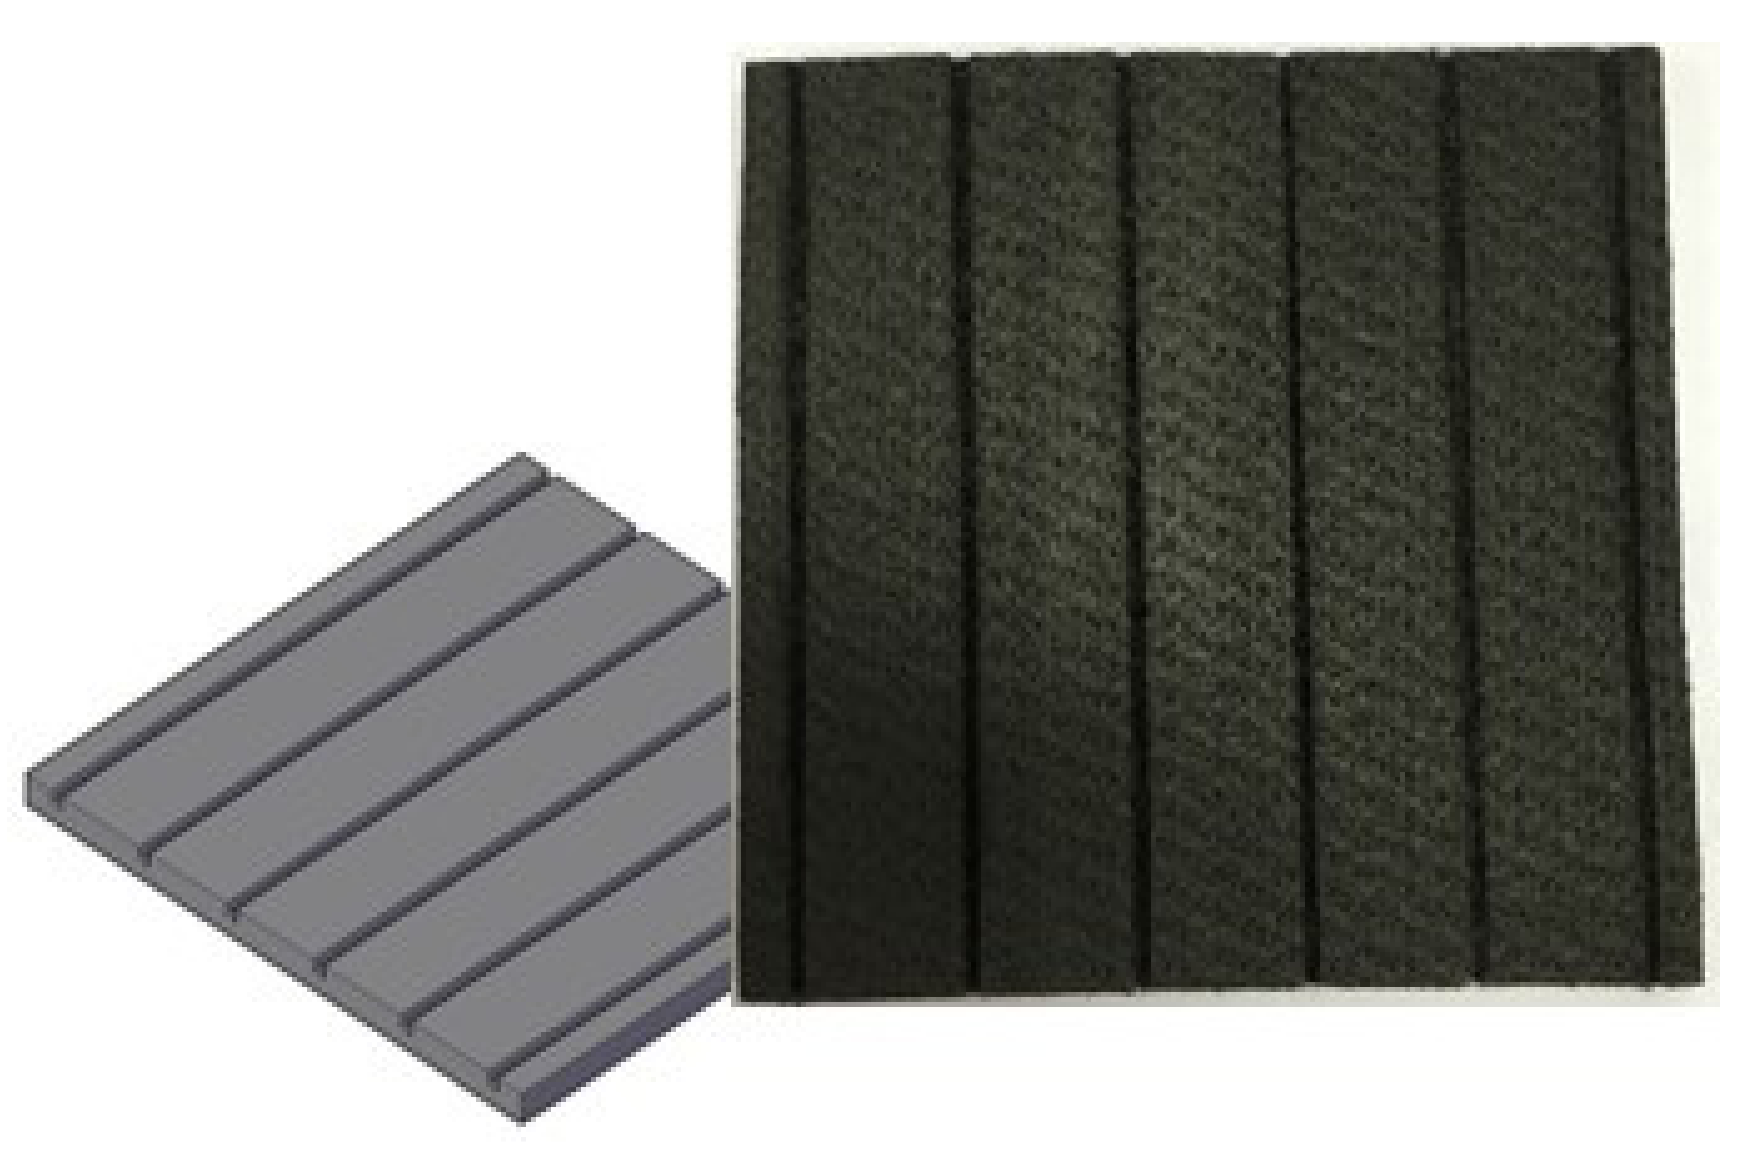
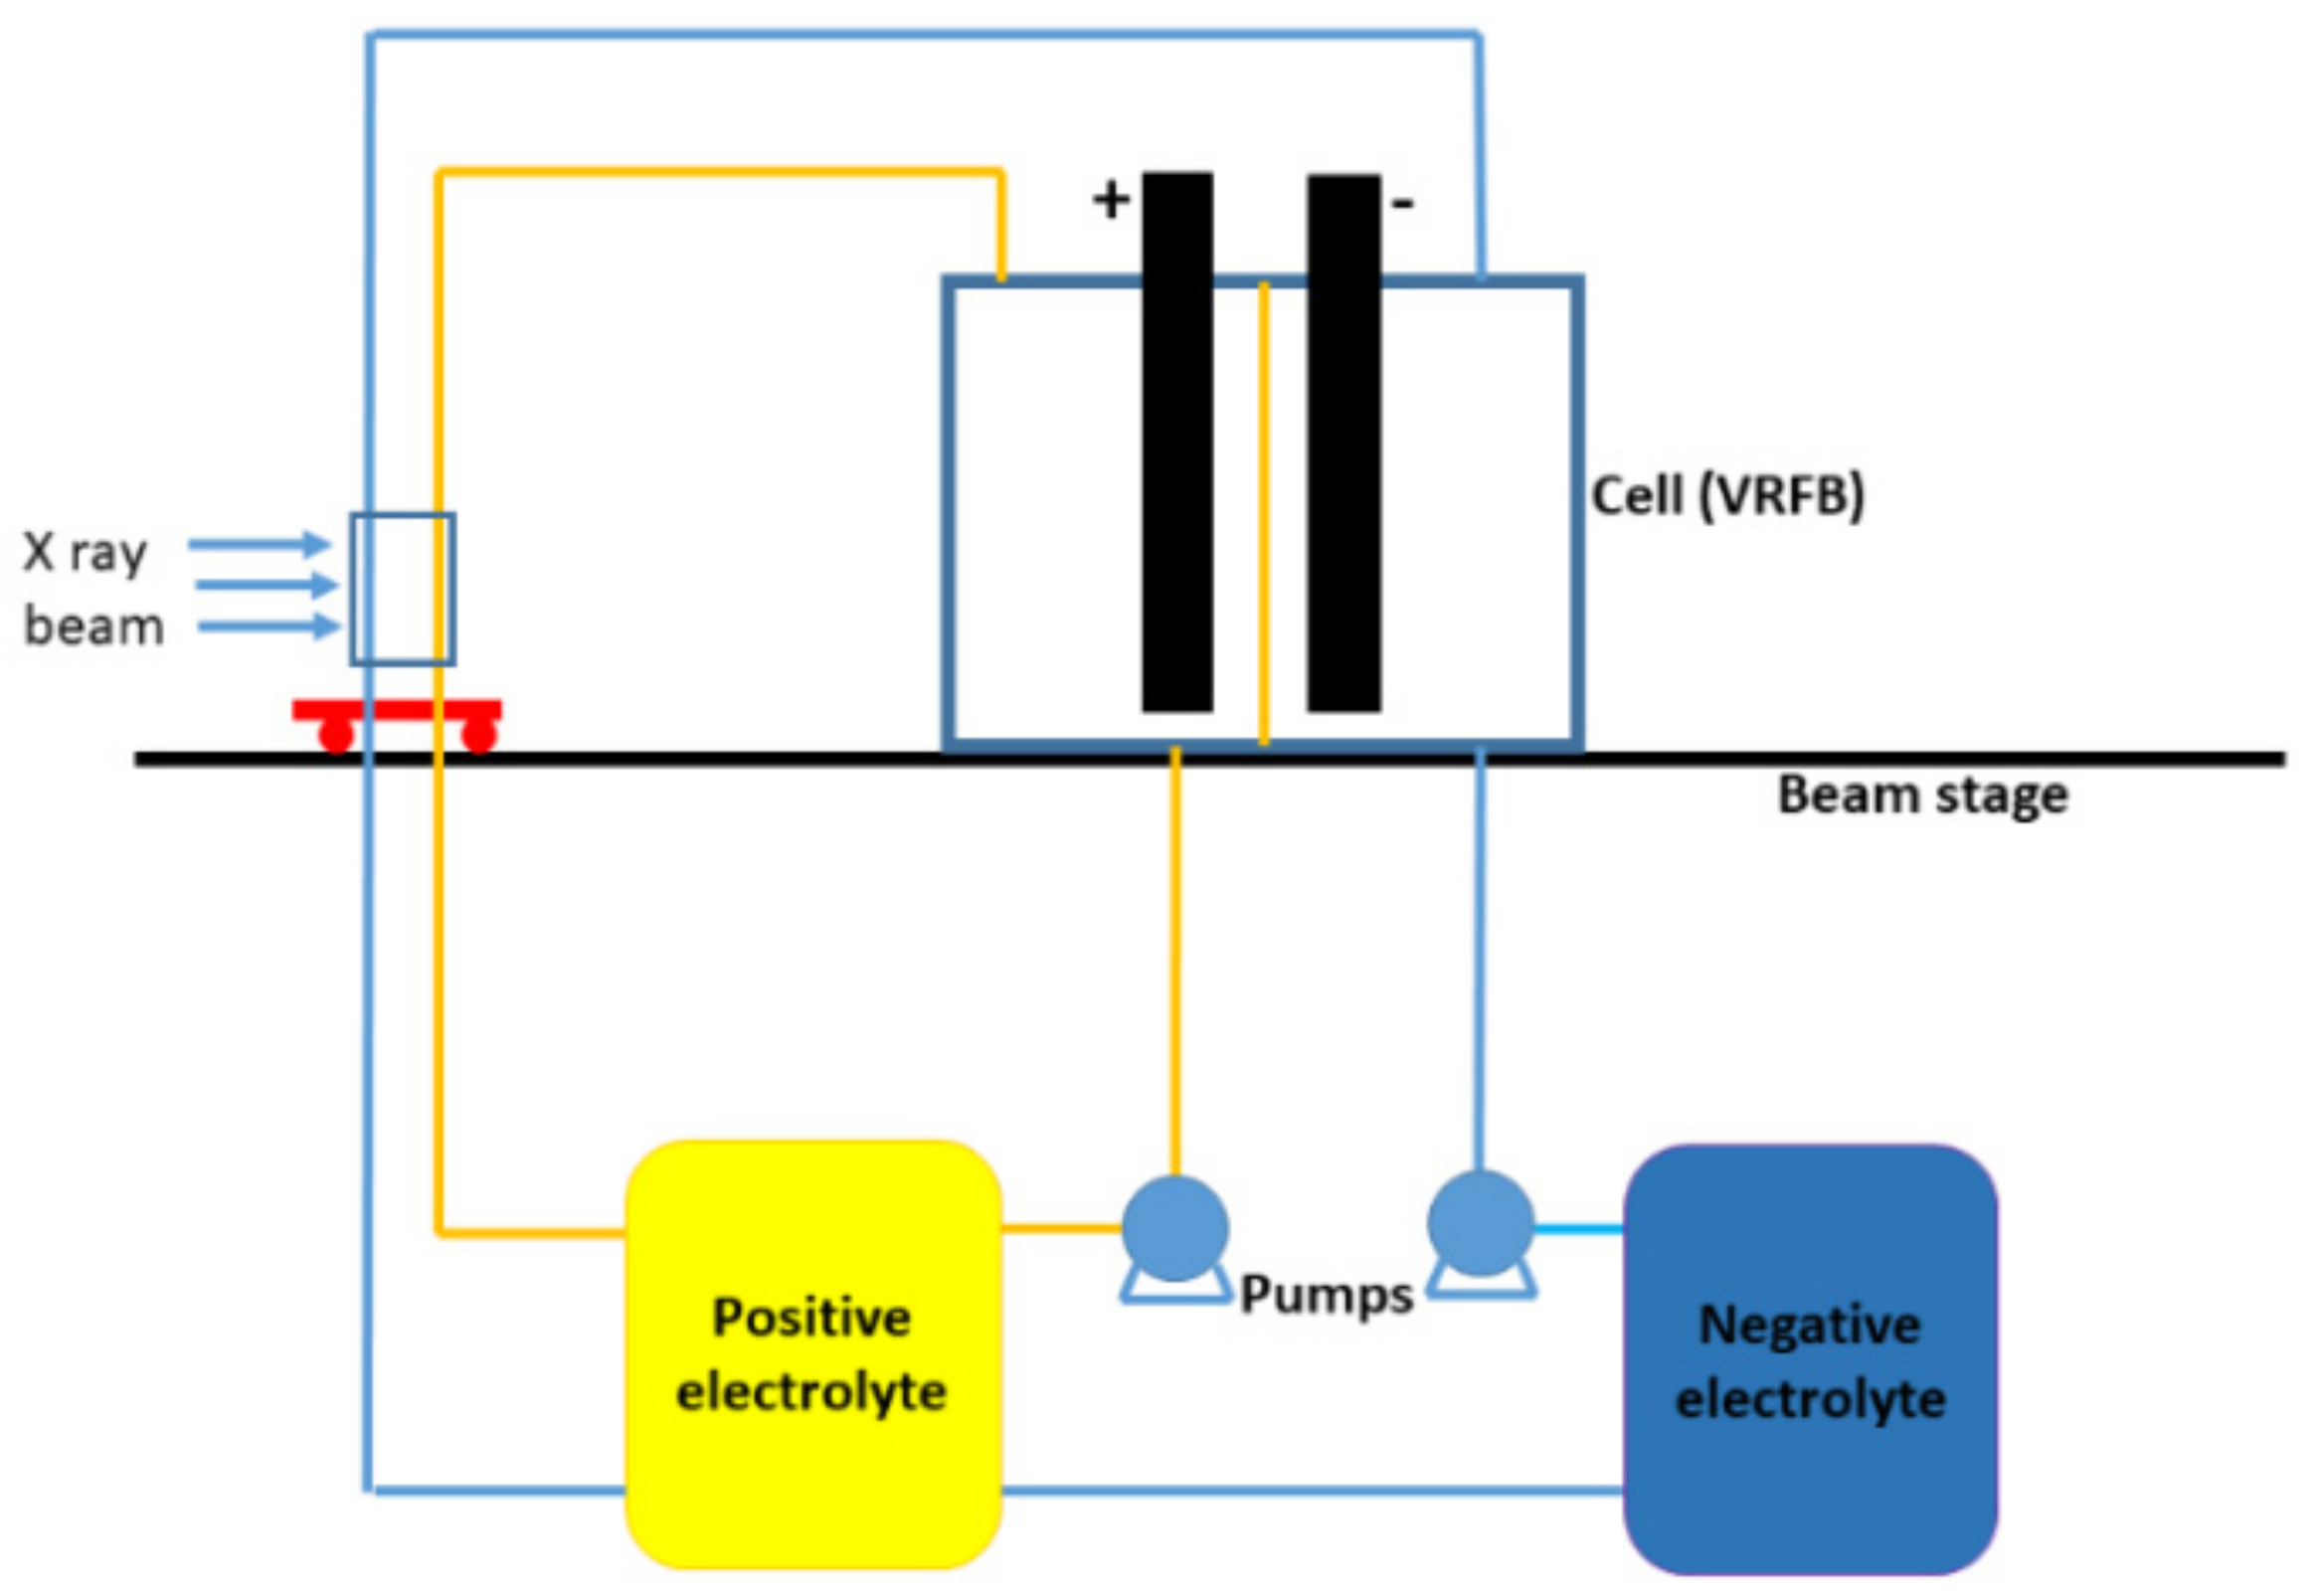
Table 1.
In situ diagnostic tools used in VRFBs.
| Electrochemical Technique | Physical and Spectroscopic |
|---|---|
| Cell charging and discharging | Reference electrode configuration |
| Polarization test | Current and voltage mapping |
| Electrochemical impendence spectroscopy | Pressure drop measurement |
| X-ray imaging | |
| Neutron imaging | |
| Scanning electrochemical microscopy | |
| X-ray near absorption spectroscopy |
Table 2.
Losses obtained from the polarization curve.
| Type of Loss | Origin | Dominant Region | Minimization Techniques |
|---|---|---|---|
| Activation | - Energy needed to overcome the activation energy associated with charge transfer process | - At low current density | - Electrode pre-treatment procedures (thermal, chemical, catalyst etc.) |
| Ohmic | - Voltage loss associated with ionic resistance of membrane, resistance of cell component and contact resistance | - Dominant in the linear portion of the curve | - Decrease in contact resistance by electrode compression - Use of thinner membranes - Binding of porous electrode with bipolar plates |
| Concentration | - associated with mass transport limitation i.e., insufficient supply of electrolyte at higher current | - At higher current | - Maintaining adequate flow rate of electrolyte |
Table 3.
Measurement technique for local current or voltage mapping.
| Technique | Mechanism | Hardware | Advantages and Limitations |
|---|---|---|---|
| Resistor | - Measurement of drop in voltage across the resistor | - Full segmentation of the flow field - Wired connection - Multi-channel potentiostat | - Simple implementation - Low spatial resolution - Higher contact resistance |
| Hall sensor | - Measurement of magnetic induction due to electric current to determine the local current density | - Fully segmented flow field required - Wired connection to each segment | - Measurement of high current possible - Size limits the units in given area |
| Printed circuit board | - Measurement of drop in voltage across shunt resistor | - Wireless connection - Connection build in PCB itself | - High resolution - Segmentation of flow field not required - Can be implement in various flow fields - Higher cost of production |
Table 4.
In situ diagnostic tools with advantages and limitations.
| Technique | Advantages | Limitations |
|---|---|---|
| Cell charging and discharging | - Straightforward and convenient - Information on efficiencies, capacity and current density | - No information on the type of losses - Cannot specifically provide information on loss mechanism with change in material type and parameter |
| Polarization test | - Interpretive tool - Information on type of losses and maximum current density | - No insight to the c efficiency, therefore used in combination with the cell cycling |
| Electrochemical impendence spectroscopy | - Provides information on electrochemical interphase | - Highly sensitive technique - To be carried out precisely - Challenging to get stable reference electrode - Interpretation of result is difficult |
| Reference electrode configuration | - Information on potential and overpotential in each half of the cell - Information on potential distribution | - Reference electrode adjustment is complicated - Stability of reference electrode over long run is questionable |
| Current and voltage mapping | - Information on electrolyte distribution, electrolyte utilization, SOC conversion, flow uniformity etc. | - Highly sophisticated technique requiring complex setup (segmented cell, multichannel potentiostat, electrical arrangement etc.) |
| Pressure drop measurement | - Simple and easy technique - Ensures the component are within given pressure range and quantification of pumping energy | - Clearly identifying the problem by itself is difficult - Transducers are sensitive to minor oscillations |
| Imaging technique | - Effectiveness depends upon the cell material compatibility | - Sophisticated technique to collect the high resolution of image |
| Spectroscopic measurement technique | - Quantitative determination of the concentration of electrolyte | - Complicated setup requiring customized setup for in-situ measurement |
Publisher’s Note: MDPI stays neutral with regard to jurisdictional claims in published maps and institutional affiliations. |
© 2021 by the authors. Licensee MDPI, Basel, Switzerland. This article is an open access article distributed under the terms and conditions of the Creative Commons Attribution (CC BY) license (https://creativecommons.org/licenses/by/4.0/).
Share and Cite
MDPI and ACS Style
Ghimire, P.C.; Bhattarai, A.; Lim, T.M.; Wai, N.; Skyllas-Kazacos, M.; Yan, Q. In-Situ Tools Used in Vanadium Redox Flow Battery Research—Review. Batteries 2021, 7, 53. https://0-doi-org.brum.beds.ac.uk/10.3390/batteries7030053
AMA Style
Ghimire PC, Bhattarai A, Lim TM, Wai N, Skyllas-Kazacos M, Yan Q. In-Situ Tools Used in Vanadium Redox Flow Battery Research—Review. Batteries. 2021; 7(3):53. https://0-doi-org.brum.beds.ac.uk/10.3390/batteries7030053
Chicago/Turabian StyleGhimire, Purna C., Arjun Bhattarai, Tuti M. Lim, Nyunt Wai, Maria Skyllas-Kazacos, and Qingyu Yan. 2021. "In-Situ Tools Used in Vanadium Redox Flow Battery Research—Review" Batteries 7, no. 3: 53. https://0-doi-org.brum.beds.ac.uk/10.3390/batteries7030053
Note that from the first issue of 2016, this journal uses article numbers instead of page numbers. See further details here.