
Life Cycle Modelling of Extraction and Processing of Battery Minerals—A Parametric Approach
by
 ,
,
Nelson Bunyui Manjong
1,2,*, 
Lorenzo Usai
1,2,
Odne Stokke Burheim
2 and
Anders Hammer Strømman
1,2,* 1
Industrial Ecology Programme, Norwegian University of Science and Technology, 7491 Trondheim, Norway
2
Department of Energy and Process Engineering, Faculty of Engineering, Norwegian University of Science and Technology, 7491 Trondheim, Norway
*
Authors to whom correspondence should be addressed.
Batteries 2021, 7(3), 57; https://0-doi-org.brum.beds.ac.uk/10.3390/batteries7030057
Submission received: 8 June 2021
/
Revised: 16 July 2021
/
Accepted: 9 August 2021
/
Published: 24 August 2021
(This article belongs to the Special Issue Circular Battery Technologies)
Abstract
:Sustainable battery production with low environmental footprints requires a systematic assessment of the entire value chain, from raw material extraction and processing to battery production and recycling. In order to explore and understand the variations observed in the reported footprints of raw battery materials, it is vital to re-assess the footprints of these material value chains. Identifying the causes of these variations by combining engineering and environmental system analysis expands our knowledge of the footprints of these battery materials. This article disaggregates the value chains of six raw battery materials (aluminum, copper, graphite, lithium carbonate, manganese, and nickel) and identifies the sources of variabilities (levers) for each process along each value chain. We developed a parametric attributional process-based life cycle model to explore the effect of these levers on the greenhouse gas (GHG) emissions of the value chains, expressed in kg of CO2e. The parametric life cycle inventory model is used to conduct distinct life cycle assessments (LCA) for each material value chain by varying the identified levers within defined engineering ranges. 570 distinct LCAs are conducted for the aluminum value chain, 450 for copper, 170 for graphite, 39 for lithium carbonate via spodumene, 20 for lithium carbonate via brine, 260 for manganese, and 440 for nickel. Three-dimensional representations of these results for each value chain in kg of CO2e are presented as contour plots with gradient lines illustrating the intensity of lever combinations on the GHG emissions. The results of this study convey multidimensional insights into how changes in the lever settings of value chains yield variations in the overall GHG emissions of the raw materials. Parameterization of these value chains forms a flexible and high-resolution backbone, leading towards a more reliable life cycle assessment of lithium-ion batteries (LIB).
1. Introduction
The growing need for electric vehicles (EVs) as a solution for the deep decarbonization of land transport systems and as a climate mitigation strategy has directly increased the demand for battery minerals [1,2,3]. In the wake of lowered prices for large cell EV batteries, grid storage, solar parks, and virtual grids are emerging as additional areas of battery storage applications [4,5,6,7], which further contributes to the increase in demand for battery minerals. This increase in demand has consequently raised concerns about the environmental burdens of the battery material value chains [7]. To ensure sustainability throughout the entire value chains of batteries, we must robustly evaluate all of the production steps of key materials and the production phases of batteries for EVs. Previously, the life cycle assessment (LCA) has been widely used to quantify the environmental impacts of batteries in order to avoid problem shifting (emission shifting) [8,9,10,11]. However, a significant variation has been observed in the results of several previous LCAs of lithium-ion batteries (LIB) [12]. These variations in the reported impacts are predominantly observed for the lithium nickel manganese cobalt oxide (NMC) chemistry but also involve other chemistries such as those for lithium nickel cobalt aluminum (NCA), lithium manganese oxide (LMO), and lithium iron phosphate (LFP). For an NMC battery pack, Ellingsen et al. [8] evaluated the cradle to gate lifecycle emissions at 172 kg of CO2e/kWh, while Majeau-Bettez et al. [13] evaluated this value at 200 kg of CO2e/kWh. Furthermore, the United States Environmental Protection Agency (USEPA) [14] evaluated this value for an NMC battery pack at 121 kg of CO2e/kWh battery. Other similar LCAs of LFP battery chemistries have evaluated life cycle emissions at 151 kg of CO2e/kWh [14], 156–266 kg of CO2e/kWh [9], and 250 kg of CO2e/kWh [13]. Ellingsen et al. [15] outlined in a comprehensive review some of the key factors responsible for this observed variation in greenhouse emissions (GHG). They further illustrated these variations for each phase of the battery value chain (from cell material supply chains to battery assembly). Dai et al. [16] carried out an LCA of an NMC battery pack with increased details on the bill of materials used in the cell. They found that approximately 80% of the total cell emissions of 72.9 kg of CO2e/kWh are allocated to cell materials. They concluded that the upstream production of battery materials consumes more energy and generates more environmental burdens than the cell production and pack assembly processes. They further highlighted that using different background databases produces variations in the overall impacts of the battery material supply chain and consequently the impacts of the battery. With the observed variations in the GHG emissions of batteries and the significant contributions of cell materials in the overall battery emissions [15,16,17], it is therefore important to re-assess the emissions of key raw material value chains.
There have been setbacks in the way raw battery materials have been modeled when conducting LCAs of LIB. The first significant challenge is the adoption of generic background processes from LCA databases [18]. These databases often use highly aggregated data, resulting in low-resolution inventories with substantial dilution in the data precision [19,20,21]. Furthermore, mineral extraction depends on process parameters and factors, whose variations in LCA modelling could potentially alter the results. For example, changes in material and resource quality (such as ore grade, ore hardness, and mine depth) could yield variations in the LCA results [22]. In addition, the approaches and assumptions adopted in the LCA study, including aspects pertaining to allocation methods for co-products, can produce different results [23]. These challenges are not often appropriately addressed in the LCA of LIB value chains.
To increase knowledge of the footprints of LIB material value chains, it is of utmost importance to disaggregate individual material value chains and identify sources of variations in them. This permits an understanding of the process parameters and production stages that affect the overall footprint of the raw battery materials. Through this knowledge, one can determine and implement the best possible strategies to reduce their environmental impacts. This paper aims to study the value chains of six (6) key battery minerals and to investigate the effect of levers on the overall GHG emissions measured in terms of kg CO2e. The six battery minerals are aluminum, copper, graphite, lithium, manganese, and nickel, which are typical elements found in a conventional NMC battery chemistry. The six battery materials modeled in this study are best covered in the existing scientific literature. Moreover, these selected battery minerals have energy and emission-intensive value chains [16] and play a pivotal role in battery manufacturing. Other battery materials such as cobalt, silicon, sulphur, phosphorous, and graphene, which are equally vital components in battery cell production, will be included in subsequent versions of the model. The underlying research questions prompting this study are as follows:
- What factors are responsible for variabilities in the impacts of battery raw materials?
- What is the degree of influence that these factors have on the footprints of these materials?
To provide a comprehensive response to these questions, we designed a parametric attributional process-based LCA model with the flexibility to fully harness the sources of variabilities throughout the value chain of primary (virgin) battery raw materials.
This article comprises five main sections, with this introduction making up Section 1. In Section 2, we review the literature to highlight the global warming potential (GWP) of the key material value chains studied in this paper as a precursor to a full understanding of the existing variabilities. Section 3 describes the value chains and their corresponding levers, followed by the parametric model and data sources. Then, in Section 4, we present key findings of our model and provide an analysis of these results. Finally, we discuss the results, limitations of the model and provide conclusions in Section 5.
2. Review of Variability in the Impacts of Battery Value Chains
Variability in LCA refers to the quantitative description in the range or spread of the impact potentials for a given functional unit [24]. Variability in LCA results can be spatial, temporal, and technological [25]. Discrepancies in environmental impacts of a given product system are sometimes linked to the inherent variabilities in the system or the parameter uncertainty that could arise in inventory analysis. Understanding variability in each product system creates a profound multidimensional view of the impacts of the product or system. Assessing variability in the footprints of raw battery materials has been an area of interest due to expectations to attain sustainable battery production systems as a climate mitigation strategy.
In the academic literature, several LCAs of each of these value chains of interest have been studied with each study producing different results, as will be reviewed in the following paragraphs.
Lui and Müller [26] carried out a critical review of the LCA of different phases of the aluminum value chain. They concluded that the LCA of aluminum depends on several factors, including allocation methods, system boundary definitions, and the quality of the inventory data. The review concluded that the GWP of primary aluminum product ranges from 5.92 kg of CO2e/kg of aluminum for the Greenfield Smelter in Iceland to 41.10 kg of CO2e/kg of aluminum for a smelter in the Middle East. In addition, Nunez and Jones [27] evaluated the cradle to gate GWP of global aluminum at 18.3 kg of CO2e/kg for the Søderberg technology and 16.3 kg of CO2e/kg for the prebake technology. Further, Olsen [28] carried out an LCA of six aluminum smelters in Norway using alumina imported from South America and found the GWP to range from 3.23 to 5.42 kg of CO2e/kg of primary aluminum produced. Nuss and Eckelman [29] evaluated the GWP at 8.1 kg of CO2e/kg aluminum while Norgate [30] evaluated this value at 22.4 kg of CO2e/kg aluminum.
Nilsson et al. [31] reviewed the variations in the GWP of copper and found that these values range from 1.1 to 8.5 kg of CO2e/kg of primary copper produced. They concluded that several factors such as the ore grades, the type of processing technology, and the fuel source for heating and electricity generation are significant drivers of the variations in the impacts. Nuss and Eckelman [29] also evaluated this GWP at 2.8 kg of CO2e/kg for copper. Norgate [30] evaluated this value at 3.3 kg of CO2e/kg for the pyrometallurgy route and 6.2 kg of CO2e/kg for the hydrometallurgical route involving heap leaching and solvent extraction and electrowinning (SX/EW). Norgate equally carried out sensitivity analysis on the effect of ore grades on the GWP and found that the GWP decreased exponentially as the ore grades increased. The International Copper Association [32] evaluated the GWP for a mix of pyrometallurgy, hydrometallurgy, and secondary copper production at 4.1 kg of CO2e/kg of copper.
Gao et al. [33] calculated the carbon emissions for anode material production in China using natural graphite and found this value to be 5.3 kg CO2e/kg of anode material. Their results indicate that the graphite mining and surface modification stages are significant drivers of the energy and, consequently, the emissions compared to the graphite beneficiation and purification stages. The ecoinvent database (v3.2) (Zurich, Switzerland) [34] evaluates the GWP of battery-grade natural graphite produced in China at 2.3 kg of CO2e/kg graphite. For synthetic graphite, Dunn et al. [35] have provided the most reliable life cycle inventory to produce synthetic graphite with details on the energy required for the graphitization stage. Minviro [36] argues that the use of carbon black as a proxy for battery-grade graphite excludes the footprints incurred during the graphitization stage. The impacts for natural graphite as reviewed by Minviro range from 1 to 5.56 kg of CO2e/kg of anode material [36]. For synthetic graphite, this range is from 2.34 kg of CO2e/kg [36] (when carbon black is used as a proxy for synthetic graphite) to 4.9 kg of CO2e/kg when graphitization stage is included based on life cycle inventory from Dunn et al. [35,36]. Minviro [36] concludes that there is a large data uncertainty on the life cycle inventory for natural and synthetic graphite manufacturing. Pell et al. [37] argues that the GWP for natural and synthetic graphite anode production in regions with coal-based electricity is, respectively, eight times and ten times higher than values reported in commercial databases. They further explained that natural graphite purification is the most emission-intensive stage for natural graphite anode production, while graphitization is the most emission-intensive stage in synthetic graphite production. However, the exact values of the impacts are not stated in their report, and the life cycle inventory that produced these conclusions is not publicly available.
Jiang et al. [38] used the CML impact method to conduct the LCA of rock-based and brine-based lithium carbonate. They found the GWP per kilogram of lithium carbonate equivalents (LCE) to be 15.69 kg of CO2e and 0.329 kg of CO2e for rock-based lithium and brine-based lithium, respectively. They also concluded that the leaching of the rocks is largely responsible for higher impacts of rock-based lithium carbonate production. Ambrose and Kendall [39] developed a temporally and spatially resolved model projecting the pathways of lithium carbonate production from various resources and the impacts attributed to these resources. For rock-based lithium carbonate, they found the GWP to range from 2.28 to 3.32 kg of CO2e/kg LCE, while for brine-based lithium the GWP ranged from 3.06 to 5.28 kg of CO2e/kg LCE. Stamp et al. [40] provided a detailed inventory of lithium carbonate production from brine, spodumene ores, and seawater. They found that the impacts from brine production are subject to variations in the brine quality.
Farjana et al. [41] evaluated the GWP for globally produced manganese using inventory data from ecoinvent at 4.51 kg of CO2e/kg Mn. Zhang et al. [42] assess this value at 9.6 kg of CO2/kg Mn for manganese produced in China. Peng et al. [43] carried out a comparative impact assessment of manganese produced in China and South Africa. Their results show that manganese produced in South Africa has a GWP of 2.6 kg of CO2e/kg Mn which is significantly lower than manganese produced in China with a GWP of 7.9 kg of CO2e/kg Mn.
Using a detailed life cycle inventory, the Nickel Institute [44,45] assessed the impacts of nickel products (nickel metal and ferronickel products) produced globally. Their assessments yield a GWP of nickel-metal at 13 kg of CO2e/kg Ni. In Wei et al. [46], the GWP for nickel-metal ranges from 7 to 16 kg of CO2e/kg Ni. Similar studies evaluate the GWP at 26.9 kg of CO2e/kg Ni for nickel produced in China [47] and 11.4–16.1 kg of CO2/kg Ni for nickel produced in Australia [48].
The variations observed within each value chain described above are significant. In this vein, this article intends to exploit the causes of the quantitative spread in the life cycle impacts of these battery value chains through a flexible parametric LCA model.
3. Materials and Methods
Raw material value chains play a critical role in the manufacturing process of LIB cells [49,50,51]. These raw materials have different functions in the battery cell depending on the cell chemistry. For example, for an NMC chemistry, copper and aluminum are, respectively, used as current collectors for the anode and cathode [8]. Graphite (battery-grade) is used as negative electrode active material, while the active cathode material is composed of manganese, nickel, lithium, and cobalt [8]. In addition to the active material, binder materials and small graphite particles are added to the electrodes to provide adhesion and conductivity of the porous layer. In this section, we lay out a summary description of the value chains of the materials for an NMC chemistry, followed by the formulation of the parametric model based on the parameters described in the value chains.
3.1. Value Chain Representation
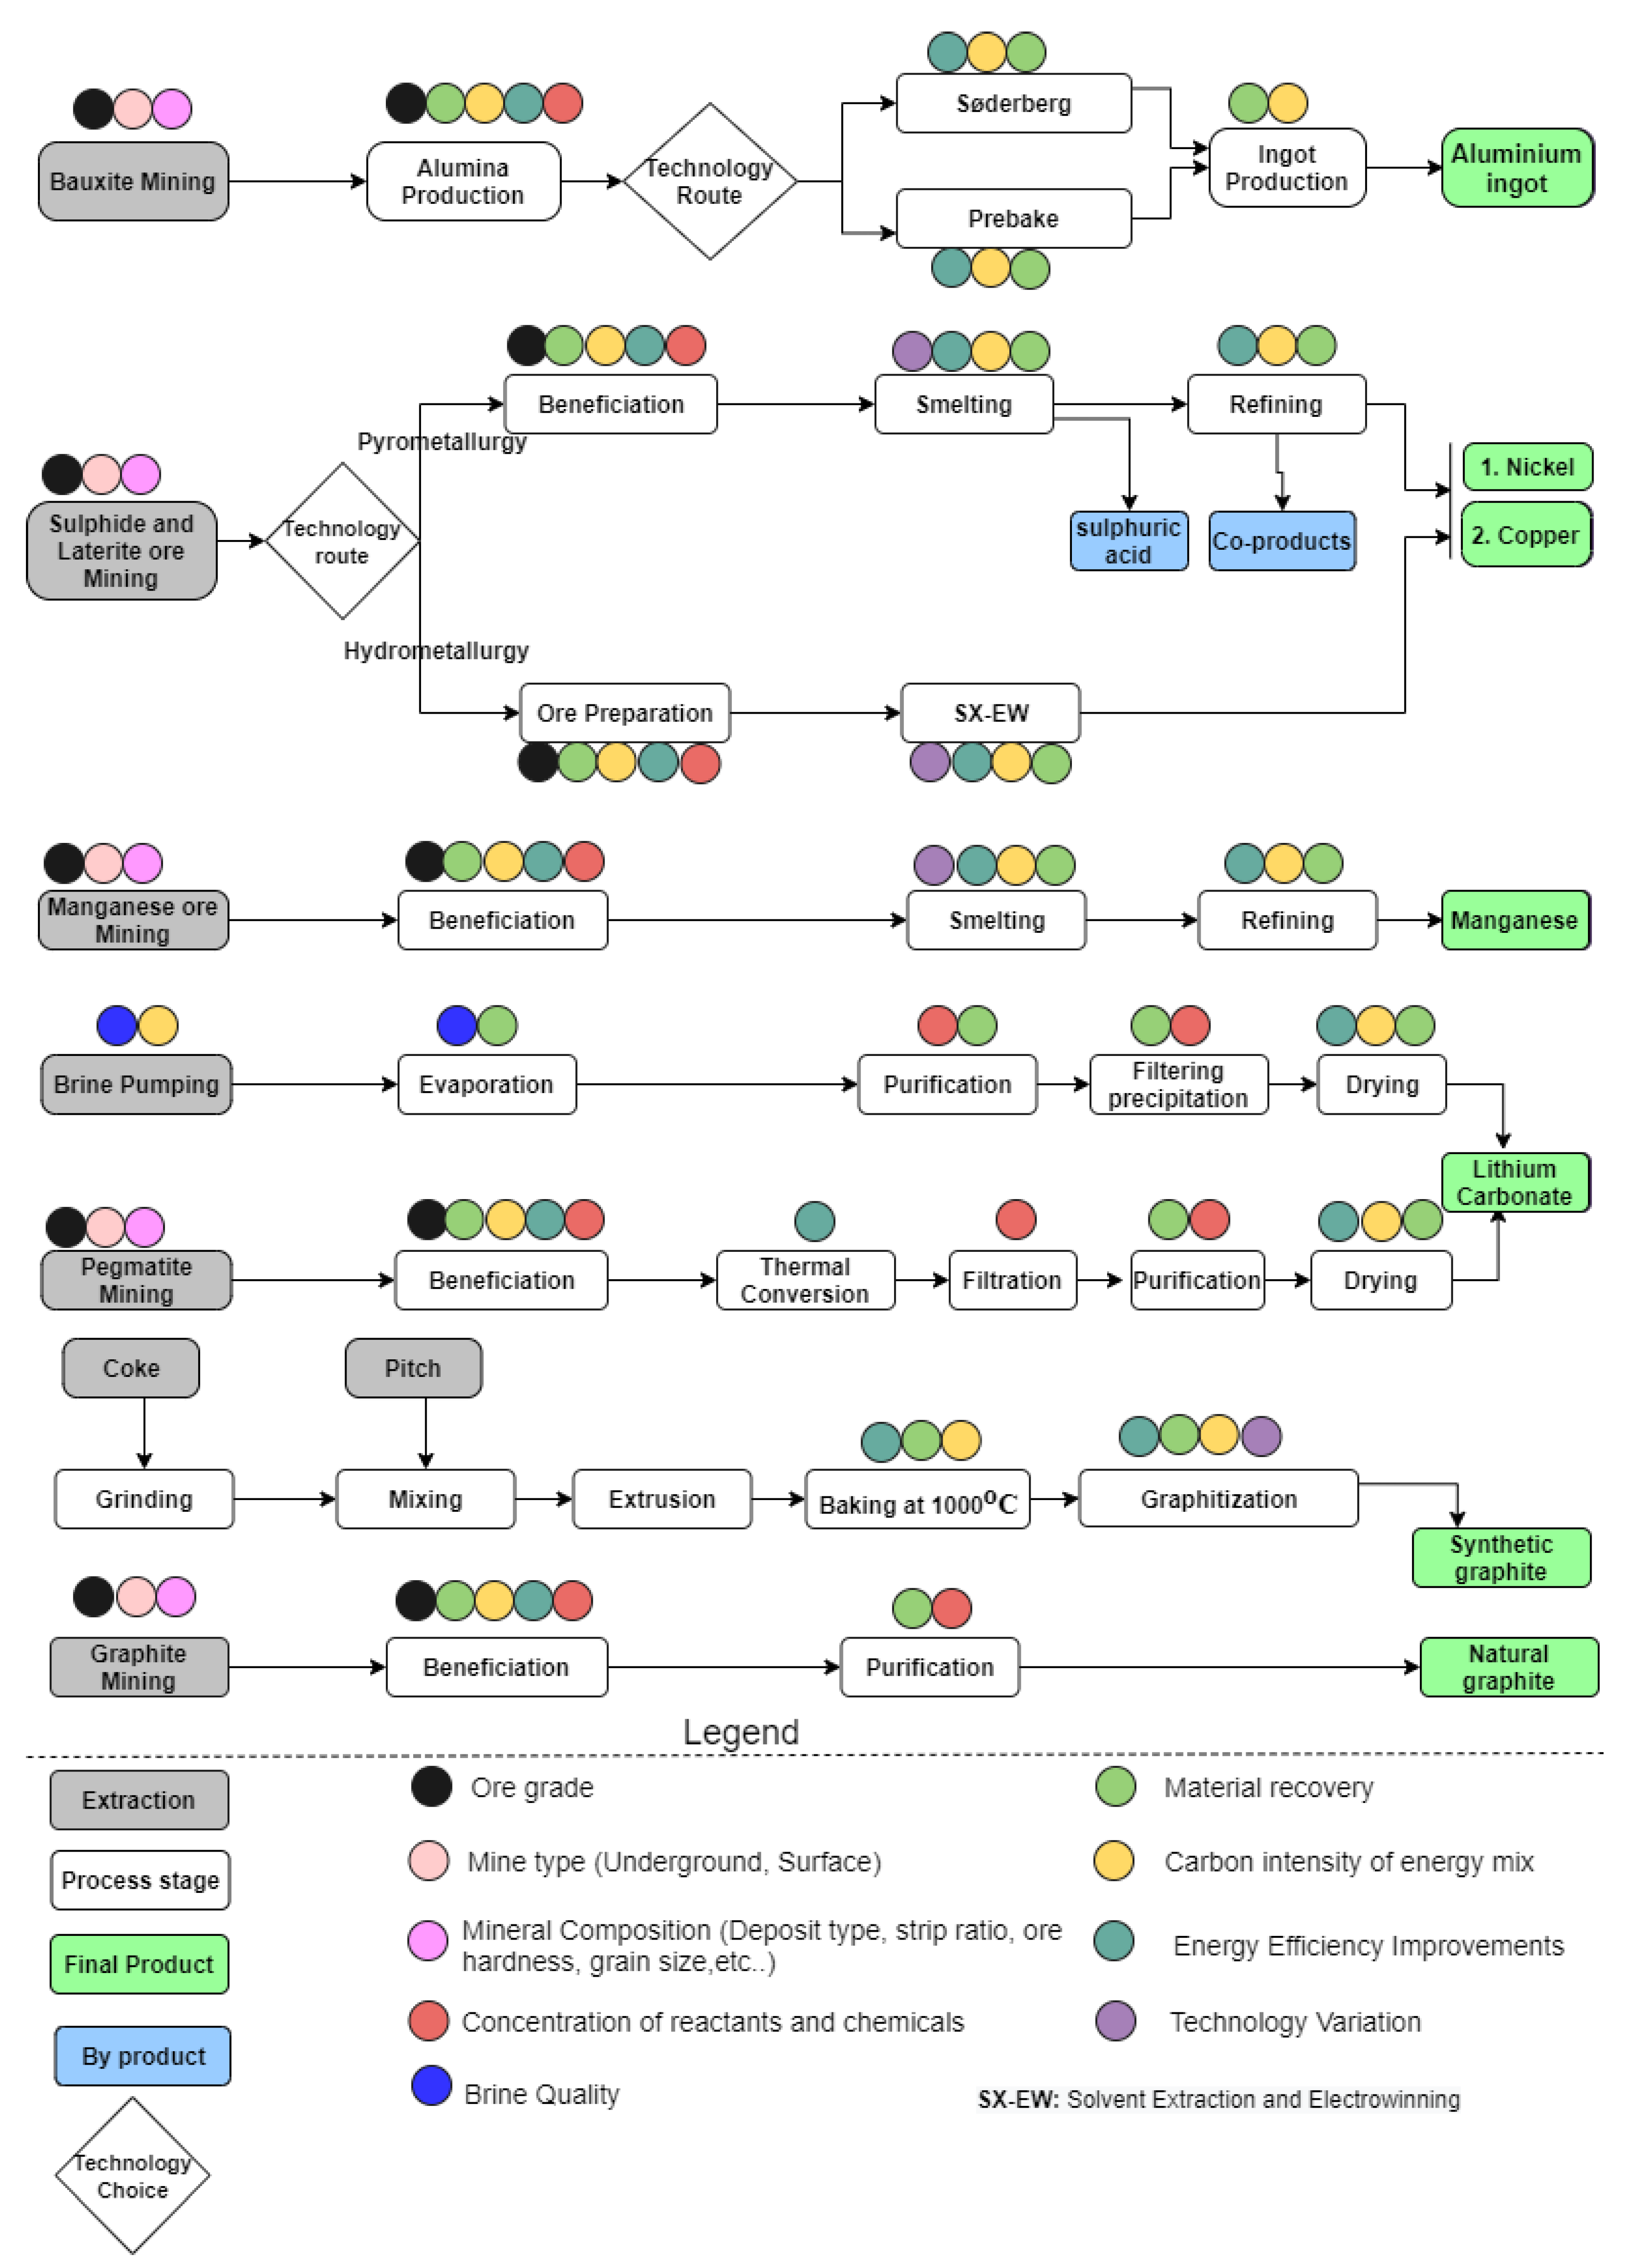
The material flow through LIB value chains with associated levers, which are susceptible to affect the overall environmental footprints, are illustrated in Figure 1. Grey boxes in Figure 1 represent the extraction stage of the ores/materials needed to produce the finished virgin raw material. The white boxes identify each process stage evaluated in the model. The colored circles above the white and grey boxes represent the process parameters that can be altered, in that stage, to evaluate the environmental impacts of each material assessed. The green boxes represent the finished product from the value chains, which will represent the functional units for this parametric LCA model. Figure 1 is a simplified flow of complex processes occurring within the value chain. These complex processes require substantial knowledge of diverse fields such as mineralogy, metallurgy, material science and process engineering. Moreover, the material flow between these value chains is sometimes dynamic and highly interrelated. However, we adopt this simplified material flow representation as a basis for developing the parametric LCA model.
Aluminum production is a three-stage process starting with bauxite mining. The bauxite is converted to alumina via the Bayer process [52]. The alumina is subsequently converted to primary liquid (aluminum) via the Hall–Heroult process, a process of electrolytic reduction in a molten bath of natural and synthetic cryolite [52]. There are two main types of aluminum smelting technologies, known as prebake and Søderberg. The main difference between these two smelting technologies is the type of anode used [53,54]. Nickel and copper are typically produced simultaneously via two possible routes, depending on the ore. The pyrometallurgical route is commonly used with sulphidic ores, and the hydrometallurgical route is mainly employed with laterite ores [30]. The pyrometallurgical route starts with ores which are beneficiated to concentrates. Beneficiation is also referred to as ore concentration. The concentrates are smelted to an intermediate product called matte which is further refined to pure metals [30]. Sulphuric acid is usually a by-product of this process. The hydrometallurgical route which is very practical for low-grade ores starts with the mining of laterite ores, followed by ore preparation, leaching, solvent extraction, and electrowinning to form pure metal [55]. Nickel products are usually grouped into class I nickel and class II. Class I nickel contains more than 99% nickel [56]. Class I nickel products are usually referred to as nickel metal, while class II include products such as ferronickel, nickel pig iron and nickel oxide sinter with lower nickel content [56]. Manganese is mainly from manganese ores which are beneficiated, sintered, and refined [57]. Lithium carbonate is produced either through evaporation and purification of brine or mining and beneficiation of mineral deposits (spodumene) [58,59]. Natural graphite is produced through mining, beneficiation, and purification of graphite ores [60], while petroleum coke and pitch are baked and graphitized in electric furnaces to form synthetic graphite [35,36,61].
Figure 1 illustrates a detailed representation of the levers affecting each value chain. For example, the levers affecting the mining stage through all of the value chains are predominantly resource quality subdivided into the ore grade, mineral composition (deposit type, ore hardness, grain size, etc.), and mine type (underground or open-cast) [18]. In addition, the beneficiation stage is affected by the grade of the ore beneficiated, the material recovery efficiency, improvements in energy efficiency, and carbon intensity of the electricity mix used in the beneficiation process. Some processes in the value chain depend on the technology deployed. Various smelting technologies with varying energy requirements are deployed in the case of the smelting of copper and nickel concentrate to matte [62]. Furthermore, several leaching technologies (heap leaching, pressure leaching, in situ leaching) with varying material and energy requirements are deployed for the hydrometallurgical route. In addition, the process of graphitizing baked carbon to form synthetic graphite depends on the type of graphitization furnace used. The Acheson and the Castner furnaces are the most used [61]. In lithium carbonate, the concentration of chemicals and reactants are key levers along the value chain.
These levers represented in Figure 1 provide a basis for understanding sources of variability along the value chain and act as a pivot upon which the parameterization of the inventories is carried out. Different levers have different effects on the life cycle inventories of mineral extractions and processing. Identifying these levers enables the development of a dynamic and comprehensive inventory, while paying close attention to the parameters that affect the inventory and consequently the life cycle impacts.
3.2. Model Description
We adopt parameterization within the LCA methodology [63] as a tool to increase flexibility in investigating multiple variations in the key parameters. These parameters are those that are identified to be of high importance to the inventories, as shown in Figure 1. Parameterization allows multiple variants of a base inventory model to be generated by varying key parameters or levers, which are usually external to the unit processes [64,65,66,67]. By doing so, we can assess the effect of parameter variation on the overall footprints of the value chains investigated. The parametric model developed for this study is built upon the first principles of LCA calculations. This involves a matrix formalism of inventory analysis compiled as a technology requirement matrix A with a common element and a stressor intensity matrix S with a common element [68,69]. The parametric function takes a base inventory of A and S and with the aid of appropriate mathematical relationships, vary coefficients of the matrix A and matrix S.
As described above, we denote the base technology requirement matrix as with common element and base stressor matrix as with common element . and represent a base life cycle inventory obtained from a reliable source. With these base technology and stressor matrices, a systematic approach is developed to generate multiple inventories in an automated manner depending on the specified set of input parameters.
The set of input parameters P, which are external to the unit processes, define a set of levers under investigation denoted as
where is the total number of parameters for the unit process stage in the value chain. In Figure 1, the colored circles above the grey and white boxes represent these parameters. These parameters are physical quantities, conversion efficiencies, and ratios whose range of values are within a technically acceptable interval. Parameters also include variants of the processing technologies used in the value chain and the carbon intensity of the fuel source for energy provision. For each LCA simulation, a set of parameters affecting the value chain are assigned values within this technically acceptable interval.
To get the total number of distinct LCA scenarios to be performed for each process stage in the value chain denoted m, we permutate all the possible set of parameters (within their technical ranges) to obtain an m × n matrix denoted with common element .
As every parameter doesn’t affect all the elements in the base technology and stressor matrices, a filter matrix denoted is applied where:
The parametric function denoted takes and and respectively transforms these to outputs with common element and with common element by combining matrix and filter matrix as follows:
and
where is the Hadarmard product.
The working principle of this model is fully demonstrated in Supplementary Material S1.
The parameterization of levers is done based on engineering and process relationships between the levers and the overall material and energy flow in the unit processes. Table S1 of Supplementary Material S2 shows the different levers and their ranges used for the parametric functions as well as the associated number of distinct LCA simulations carried for each process stage. Performing many distinct LCA calculations demands an intensive computation time. However, the payback is a better understanding of the levers along the value chain.
The function takes different forms such as linear, inverse, exponential, etc., depending on the relationship between the process parameter and the inventory element and . For example, ore grades relate to the energy use in mining and concentration based on inverse relationships provided in Sevillano [70], Calvo et al. [71], Valero and Valero [72], and Valero et al. [73]. Wei et al. [46] defined recovery efficiency is defined as the ratio between the element content in the ith process and the element content in the (i − 1)th process.
The life cycle impacts are evaluated using Arda, an NTNU Matlab-based LCA software (Trondheim, Norway) [74] coupled with an ecoinvent v3.2 background database [34]. In this study, our interest is the GWP midpoint impact category, measured in kg CO2e, evaluated using ReCiPe v1.12 as characterization method.
3.3. Parameterization of Value Chain Inventories
As earlier stated, parameterization aims to allow flexibility in generating multiple variants of a base inventory by varying specific vital levers. This section explains how the static base inventories are transformed into parametric inventories for each value chain modeled in this study. Generic parameters for all unit processes in the value chains include material recovery efficiencies between consecutive steps in the value chain. In addition, for all the unit processes, the carbon intensity of the electricity mix calculated in kg of CO2e/kWh and is also defined as a generic parameter. Unless explicitly mentioned, values of this carbon intensity of the electricity used are calculated using the medium voltage of major producing countries of the material based on the production statistics from the United States Geological Survey [75]. Details of the assumptions in developing the parametric functions for different unit processes in respective value chains are further explained in Supplementary Material S2 (Section S1 to Section S6).
3.3.1. Aluminum Value Chain
The base inventory for the parametric simulation of the aluminum value chain is obtained from the International Aluminum Institute (IAI) [54]. The total bauxite mined to produce a unit of alumina is calculated as a function of different parameters, which include bauxite ore grade (% content alumina), bauxite mine recovery, alumina refinery recovery, and overburden to bauxite ratio [76]. Similarly, material inputs and energy use for alumina production (Bayer process) are scaled to the ore grade based on an average global bauxite ore grade of 41% [77]. Energy and material use for Søderberg and prebake electrolysis are obtained from the International Aluminum Institute [54]. Improvements in energy efficiency in the electrolysis stage are obtained from Haraldsson and Johansson [78]. Values of the carbon intensity of the electricity (in kg CO2e/kWh) used for producing aluminum is calculated based on the classification from ecoinvent v3.2 [34].
3.3.2. Copper Value Chain
The parametric model developed in this study is limited to the pyrometallurgical route due to constraints in data requirements for the hydrometallurgical route. The inventory for copper mining and beneficiation is combined due to a lack of sufficient data to separate these processes and provide enough parameterization of each process stage. The ore grade-energy relationship is taken from Kuipers et al. [79] and Northey et al. [80], complemented by the mine depth-energy relationship provided by Koppelaar and Koppelaar [81]. Other inventories for mining and beneficiation stages are scaled as a function of ore grade based on regressed relationships from ecoinvent v3.2 [34]. Electricity and fuel used for the smelting processes are grouped according to the type of smelter used based on a classification provided in Coursol et al. [62]. Other inventories for smelting and electrolytic refining are taken from ecoinvent v3.2.
3.3.3. Graphite Value Chain
The need for a robust LCA of graphite is increasingly gaining attention due to its importance as battery anode material. However, the lack of detailed process data to effectively carry out graphite LCA has been a significant drawback [36,37]. The production of graphite occurs via two routes, namely either natural and synthetic [35]. The base inventory for natural graphite is obtained from Zhang et al. [33] and Gao et al. [82], while the inventory for synthetic graphite is provided by Dunn et al. [35]. We approximate the energy used in mining and concentration of natural graphite ores to follow an inverse relationship provided by Valero and Valero [72] and calibrated with data from Gao et al. [33] and Zhang et al. [82]. Due to low data resolution on converting graphite flakes into battery-grade, downstream processing of natural graphite flakes into battery-grade is excluded. Synthetic graphite inventory provided by Dunn et al. [36] is distinctly modeled with Acheson and Castner furnaces based on the energy requirements from Jager et al. [61].
3.3.4. Lithium Carbonate Value Chain
Lithium carbonate is produced via evaporation of brine or mining and beneficiation of pegmatite rocks (spodumene). Lithium carbonate via brine mainly occurs in Salar de Atacama in Chile [58], while production from pegmatite rocks occur in Australia, China, Portugal, Zimbabwe [75], and Finland [83]. For lithium produced via brine, additional heating requirements are supplied from natural gas [40] when solar evaporation is hindered. For this parametric model, brine produced solely via solar evaporation is termed “high grade”, while brine concentrated with added thermal energy requirements is termed “low grade”. The base inventory for parametric modelling of lithium carbonate via spodumene is obtained from Stamp et al. [40], while lithium carbonate via brine is jointly obtained from Stamp et al. [40] and Ambrose et al. [39]. The energy used to mine and concentrate spodumene rocks is obtained from Sevillano [70] and calibrated with the ore-energy relationship from Valero and Valero [72].
3.3.5. Manganese Value Chain
Ecoinvent v3.2 forms the base inventory for which the parametric modelling of the manganese value chain is conducted. The ore grade-energy relationship for the mining and beneficiation stages is obtained from Valero et al. [73]. Other material inventories for this stage from ecoinvent v3.2 are regressed to follow an inverse relationship with the ore grade using appropriate fitting coefficients like the ore grade-energy relationship from Valero and Valero [72]. Material recovery efficiency through the value chain is obtained from Westfall [84].
3.3.6. Nickel Value Chain
The base inventory for nickel mining and concentration uses life cycle inventories from the Nickel Institute [44,45], Wei et al. [46], and Eckelman [85]. We parameterize the energy for mining nickel ores as a function of the type of mine based on a calibrated value from Eckelman [85]. Further, we include the ore grade-energy relationship taken from Valero and Valero [72]. It is equally important to note that the parametric modelling described for the nickel value chain involves only the pyrometallurgical route. For nickel smelting and refining, inventories are obtained from the Nickel Institute [45] with modifications on the electricity for smelting obtained from Eckelman [85] and electricity for refining obtained from Wei et al. [46].
4. Results and Analysis
In this section, we present the results of our simulations. These simulations harness in detail the variability along different material value chains plotted as contour curves with corresponding lever settings on the x-y plane. Our simulation results do not point to a given value but capture how specific variations in the process parameters yield a spread in the GWP measured in kg CO2e. Contours represent the average GWP for numerous simulations for a given set of lever settings. These contours primarily summarize the effect of variations in the levers along the value chain. The gradients of the contour lines portray the degree of influence that the variables on the x-y plane have on the average GWP. In addition to the contour curves, we include further clarity boxplots, which effectively represent the absolute maximum and minimum GWP values for each simulated process. Only levers that significantly affect the GWP are presented in the results, while levers with little or no contribution are only discussed when deemed fit. We aggregate the results for mining and beneficiation for easy comprehension of the figures and the results for primary extraction (smelting) and refining. Absolute values of the results are presented in Supplementary Material S1.
4.1. Copper Value Chain
4.1.1. Mining and Ore Beneficiation
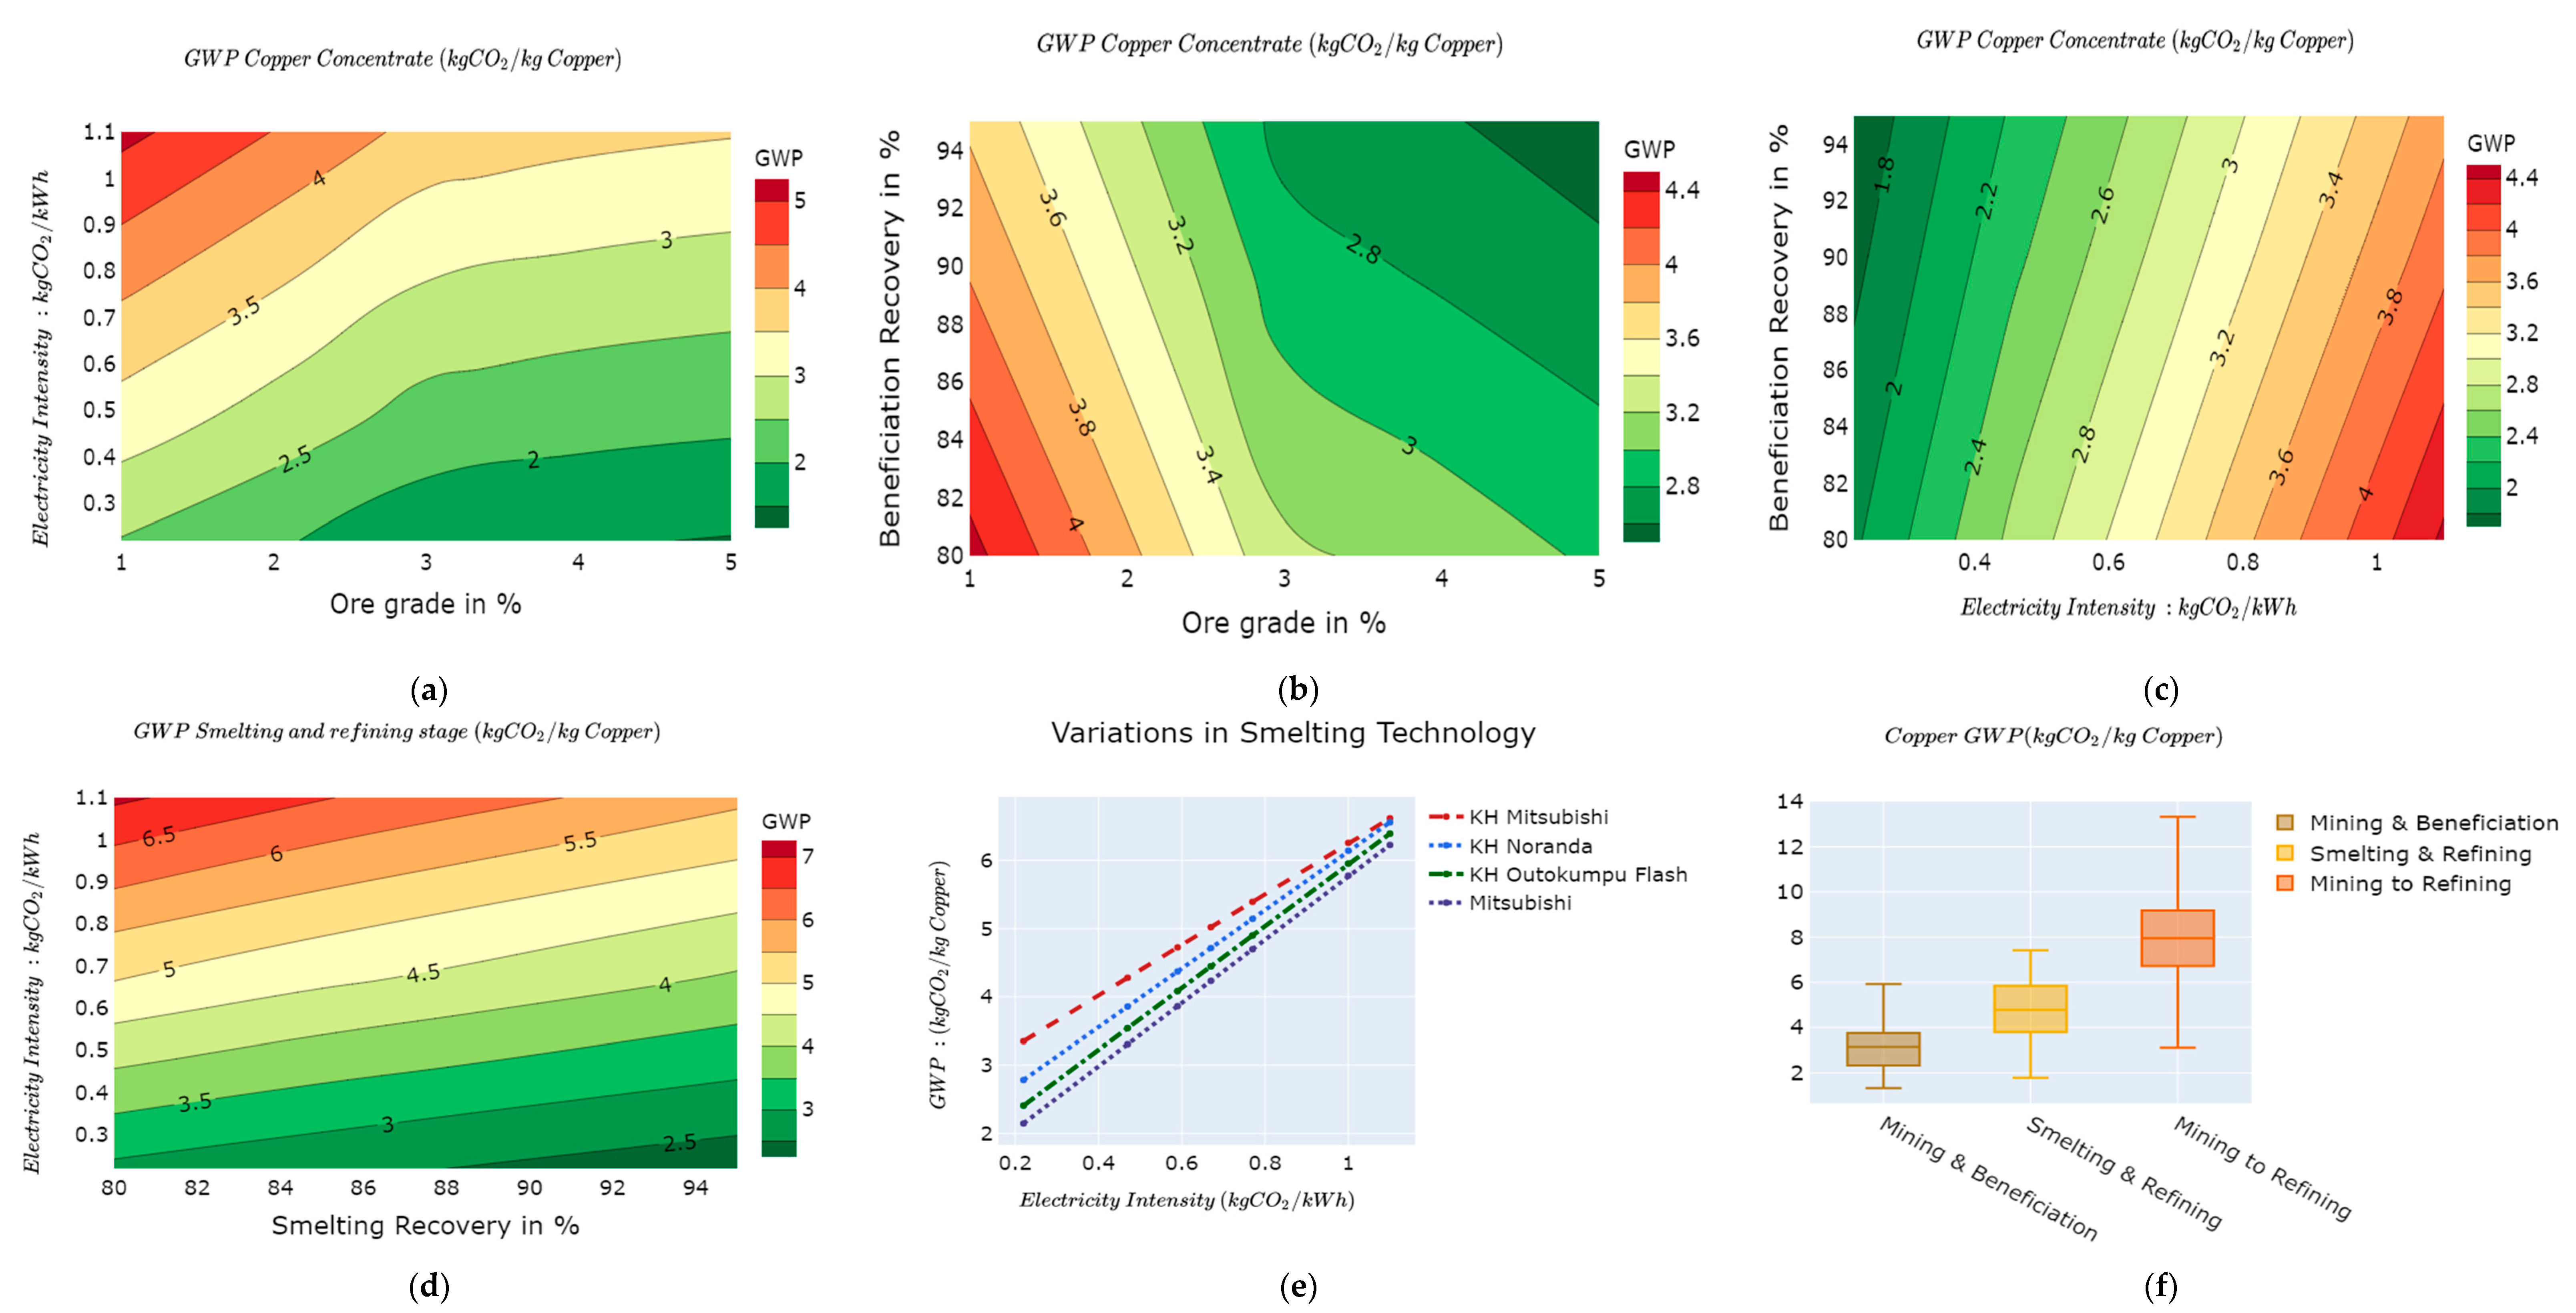
Amongst the key levers for the mining and beneficiation stages, ore grade, beneficiation recovery, and electricity mix intensity have significant effects on the GWP, as shown in Figure 2. Ore grade and beneficiation recovery depict an inverse relationship with the GWP, while carbon intensity of the electricity mix presents a direct relationship with the GWP. Figure 2a illustrates the average GWP as a function of ore grade and electricity intensity. The GWP varies between 1.3 kg of CO2e/kg Cu and 5 kg of CO2e/kg Cu. Similarly, in Figure 2b, ore grades and beneficiation recovery yield GWP contours, which vary between 1.5 kg of CO2e/kg Cu and 4.5 kg of CO2e/kg Cu. An increase in the ore grade from 1% to 5% reduces exponentially the amount of energy used in the mining and beneficiation process and the quantity of chemical reactants used in the beneficiation stage. Figure 2a,b show that, as the sulphidic ore grades exceed 3%, the gradients of the average GWP reduce considerably, signifying a remarkable reduction in the inventory, especially in the energy used for mining and beneficiation. In addition, Figure 2a,b are representative of the results obtained in [55]. Similarly, increasing the beneficiation recovery from 80% to 95% increases the total copper concentrate effectively recovered at the beneficiation process. Consequently, this reduces the total amount of material and energy needed to produce the extra amount of concentrate. In this light, the overall GWP for the mining and beneficiation stages reduces as beneficiation recovery increases from 80% to 98%, as illustrated in Figure 2c. As concerns the electricity mix, the GWP change is directly proportionally to the change in the carbon intensity of the energy mix. The absolute GWP of the copper mining and beneficiation stages varies between 1.3 kg of CO2e/kg Cu and 5.9 kg of CO2e/kg Cu, with a median value of 3.15 kg of CO2e/kg Cu, which theoretically represents the average global value as shown in Figure 2e. Results from ecoinvent 3.2 and ecoinvent v3.6 show that the GWP for the copper mining and beneficiation stages ranges from 0.72 to 4.2 kg of CO2e/kg Cu. In ecoinvent v3.7, the GWP ranges from 2 to 5.8 kg of CO2e/kg Cu with a global average of 4 kg of CO2e/kg Cu.
4.1.2. Smelting and Refining
For copper smelting and refining stages, three key value chain levers are worth considering: recovery efficiency, the intensity of the electricity mix, and smelting technology (as depicted in Figure 2d,e). The average GWP varies from 1.8 kg of CO2e/kg Cu to 7.4 kg of CO2e/kg Cu as shown in Figure 2f, with a median value of 4.6 kg of CO2e/kg Cu. We present in Figure 2e results for Mitsubishi and three variants of the Kellogg Henderson (KH) copper smelting technologies (namely KH Mitsubishi, KH Outokumpu Flash, and KH Noranda). The KH Mitsubishi presents a higher GWP than the other smelting technologies. This is due to the fact that compared to the three other smelting technologies, the KH Mitsubishi has a higher use of electricity and thermal energy provided by fossil fuels, resulting in an overall increase in its GWP relative to other smelting technologies.
Based on our model, the absolute GWP variation of the copper value chain from cradle to gate ranges from 3.1 to 13.3 kg of CO2e/kg Cu with a median value of 7.7 kg of CO2e/kg Cu (Figure 2f). The results from several studies evaluated the cradle to gate GWP of copper to vary from 1 to 9 kg of CO2e/kg Cu [31].
4.2. Aluminum Value Chain
4.2.1. Bauxite Mining and Alumina Production
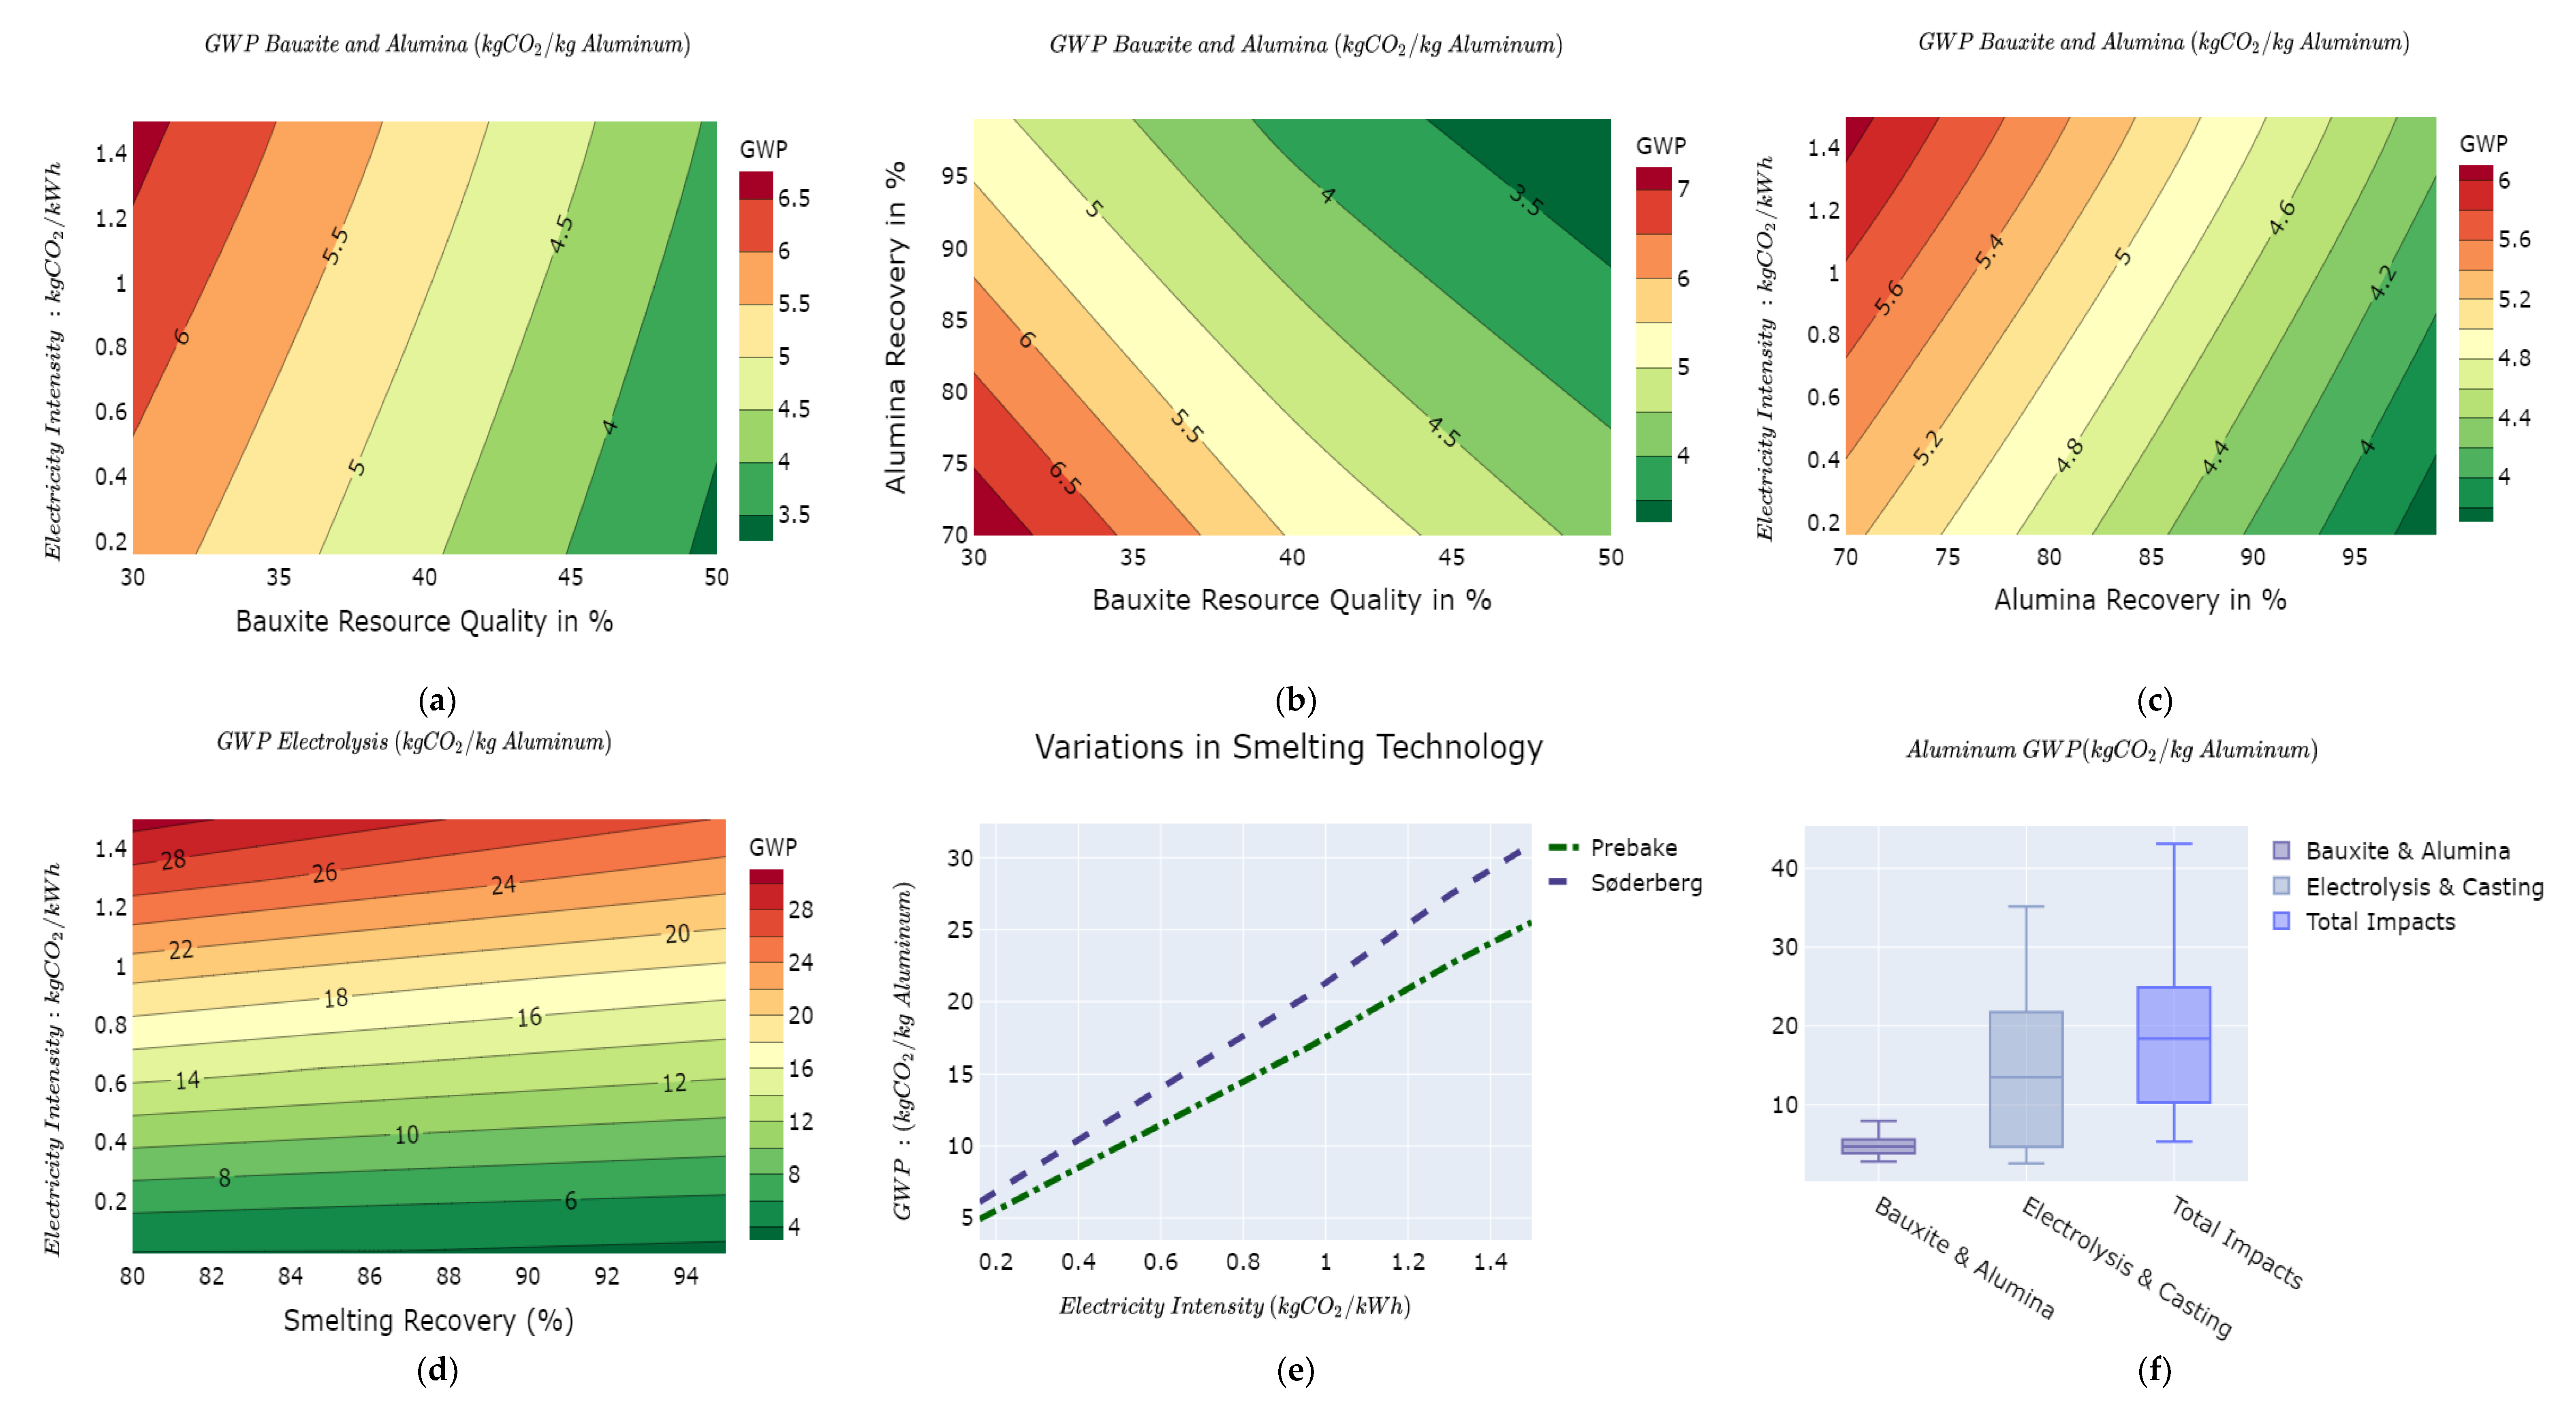
Results for the GWP for the bauxite mining and processing to alumina are displayed in Figure 3a–c. The GWP for bauxite mining and alumina production ranges from 2.8 kg of CO2e/kg Al to 8 kg of CO2e/kg Al for different lever settings of bauxite ore grade, alumina recovery efficiency, and carbon intensity of the electricity mix. The median GWP is 4.8 kg of CO2e/kg Al for the bauxite mining and alumina stages. The IAI evaluated the GWP for bauxite mining and alumina production at 3.4 kg of CO2e/kg Al [54]. It is equally observed that bauxite ore grade and alumina recovery efficiency are inversely proportional to the average GWP as opposed to the carbon intensity of the electricity mix. Increasing ore grades reduces to a lesser extent the amount of energy used in the mining stage and to a greater extent the amount of energy as well as the quantity of reactants, especially caustic soda used in the Bayer process for alumina production.
4.2.2. Electrolysis and Ingot Casting
In the electrolysis and ingot casting stage, we investigate the recovery efficiency, the intensity of the mix, the type of electrolysis technology used, and the energy efficiency improvements. It is important to note that the electrolysis stage is the most energy-intensive stage along the value chain [54]. The GWP for the electrolysis and ingot casting ranges from 2.5 kg of CO2e/kg Al to 35 kg of CO2e/kg Al with a median value of 13.5 kg of CO2e/kg Al based on various lever combinations as shown in Figure 3f. Our results show that shifting towards prebake technologies yields a comparatively lower GWP than the Søderberg, as illustrated in Figure 3e. This is due to the fact that the Søderberg technology is older and less energy-efficient than the newer prebake technology [27]. In Figure 3e, the GWP of Søderberg and the prebake technologies diverge progressively as the intensity of the electricity mix increases. This suggests that the choice of technology is more consequential at higher carbon intensities of the electricity use in the electrolysis process. Furthermore, increasing the metal recovery contributes to reducing the overall GWP due to the reduction in the resources needed to produce an extra amount of wasted metal.
The overall GWP from mining to ingot casting ranges from 5.3 kg to 43 kg of CO2e/kg Al with a median value of 18.4 kg of CO2e/kg Al for both technology routes. The mean cradle to gate GWP for both the prebake and Søderberg routes is reported at 15.3 kg of CO2e/kg Al [27]. The variations in the cradle to gate GWP of aluminum reported in the literature ranges from 5.92 kg of CO2e/kg Al for the Greenfield Smelter in Iceland to 41.1 kg of CO2e/kg Al for a smelter in the Middle East [26]. The results of our model conform to the variations in the GWP reported by [26].
4.3. Manganese
4.3.1. Mining and Beneficiation
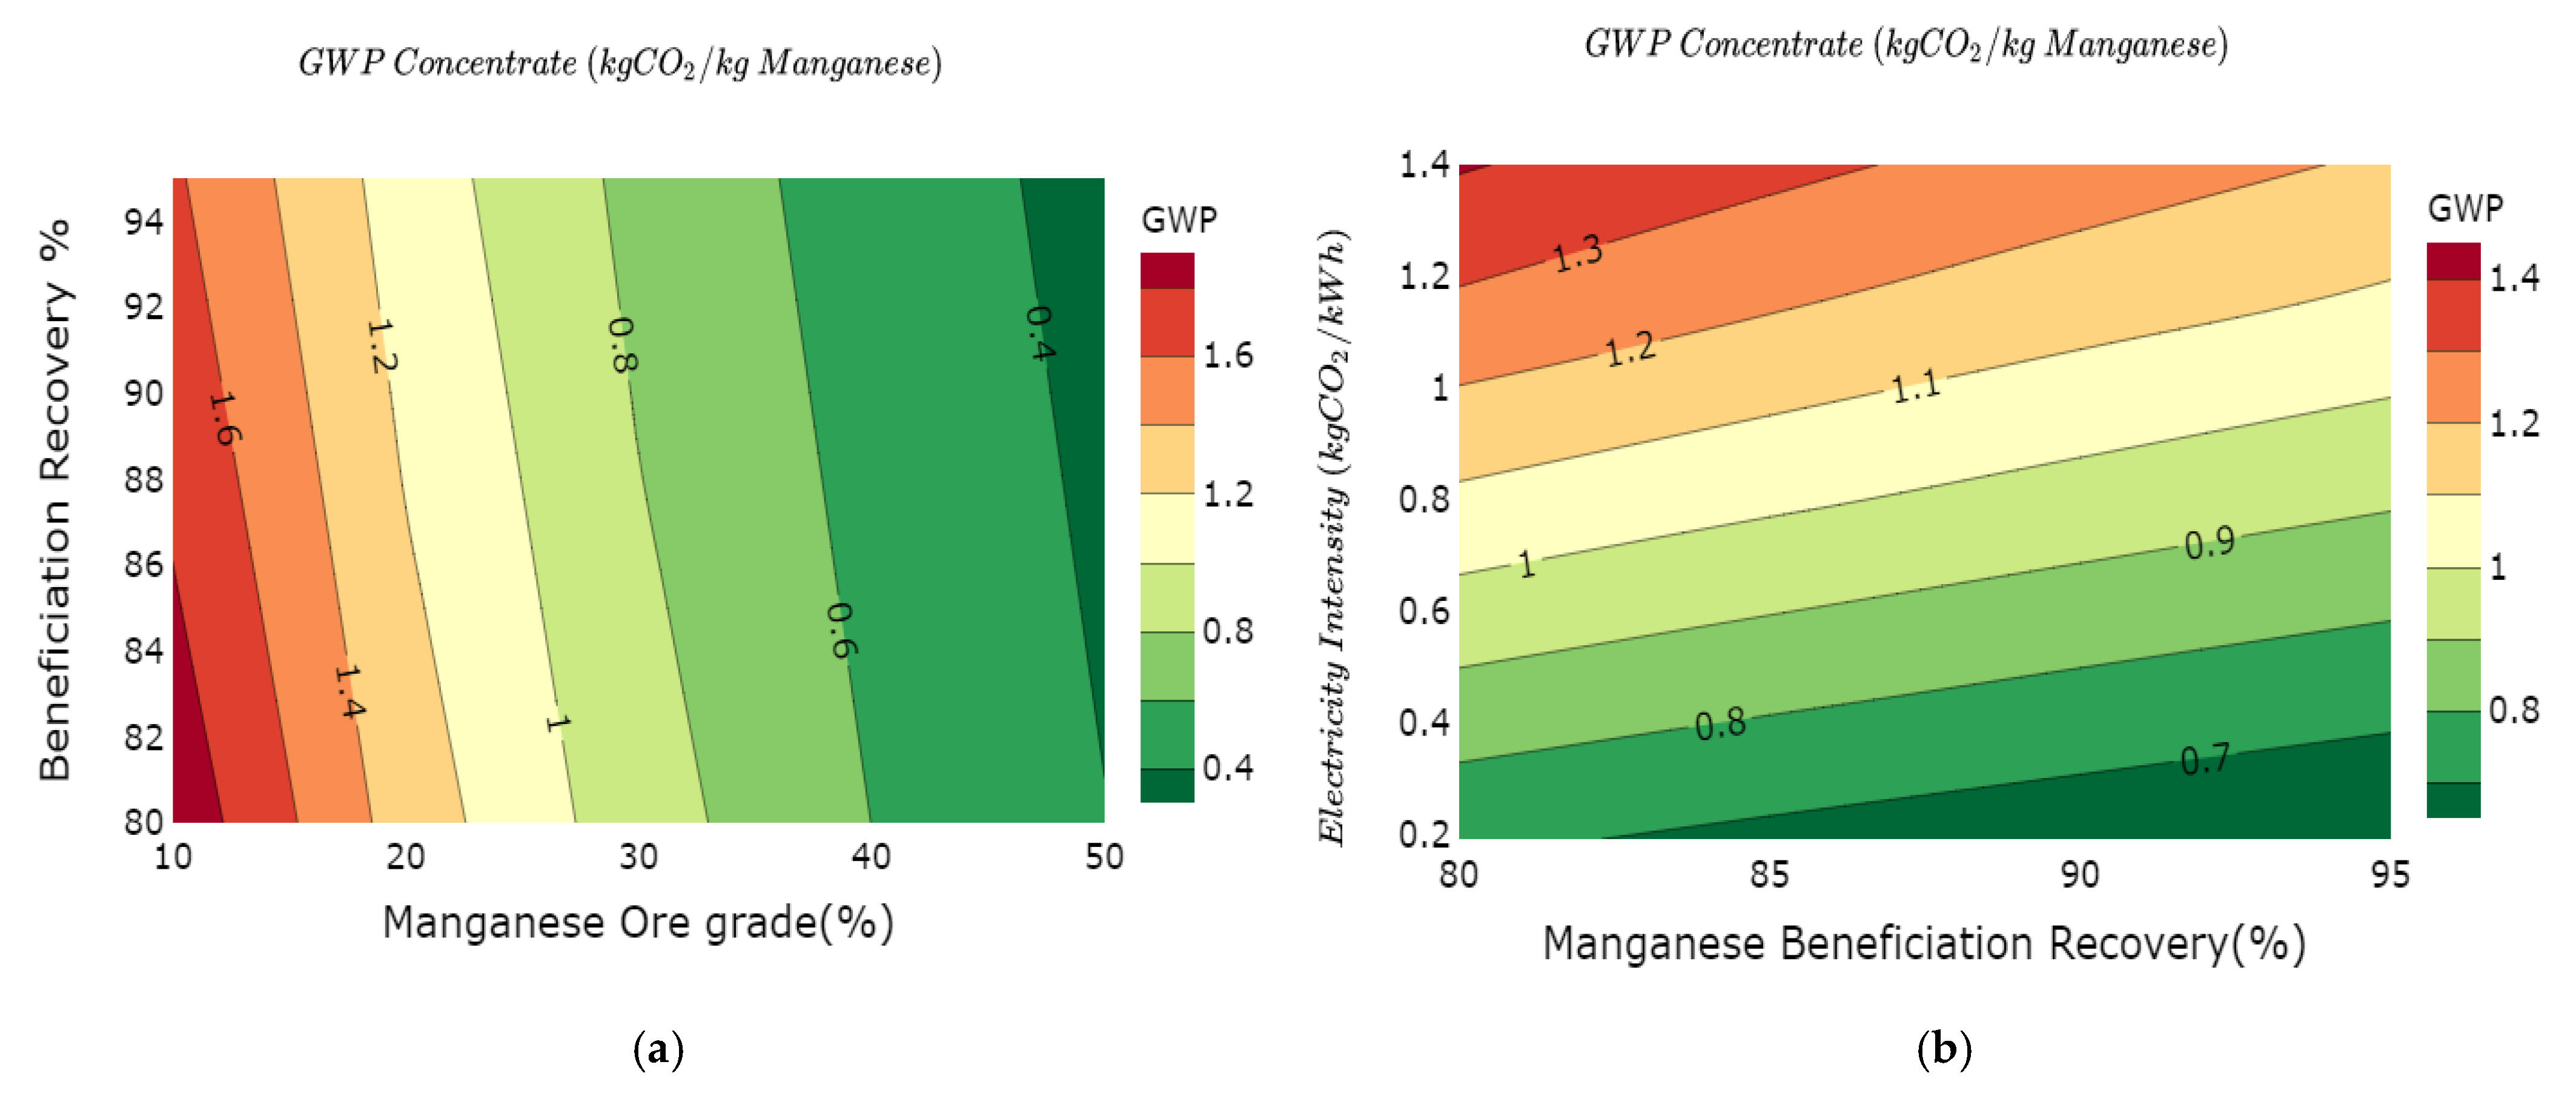
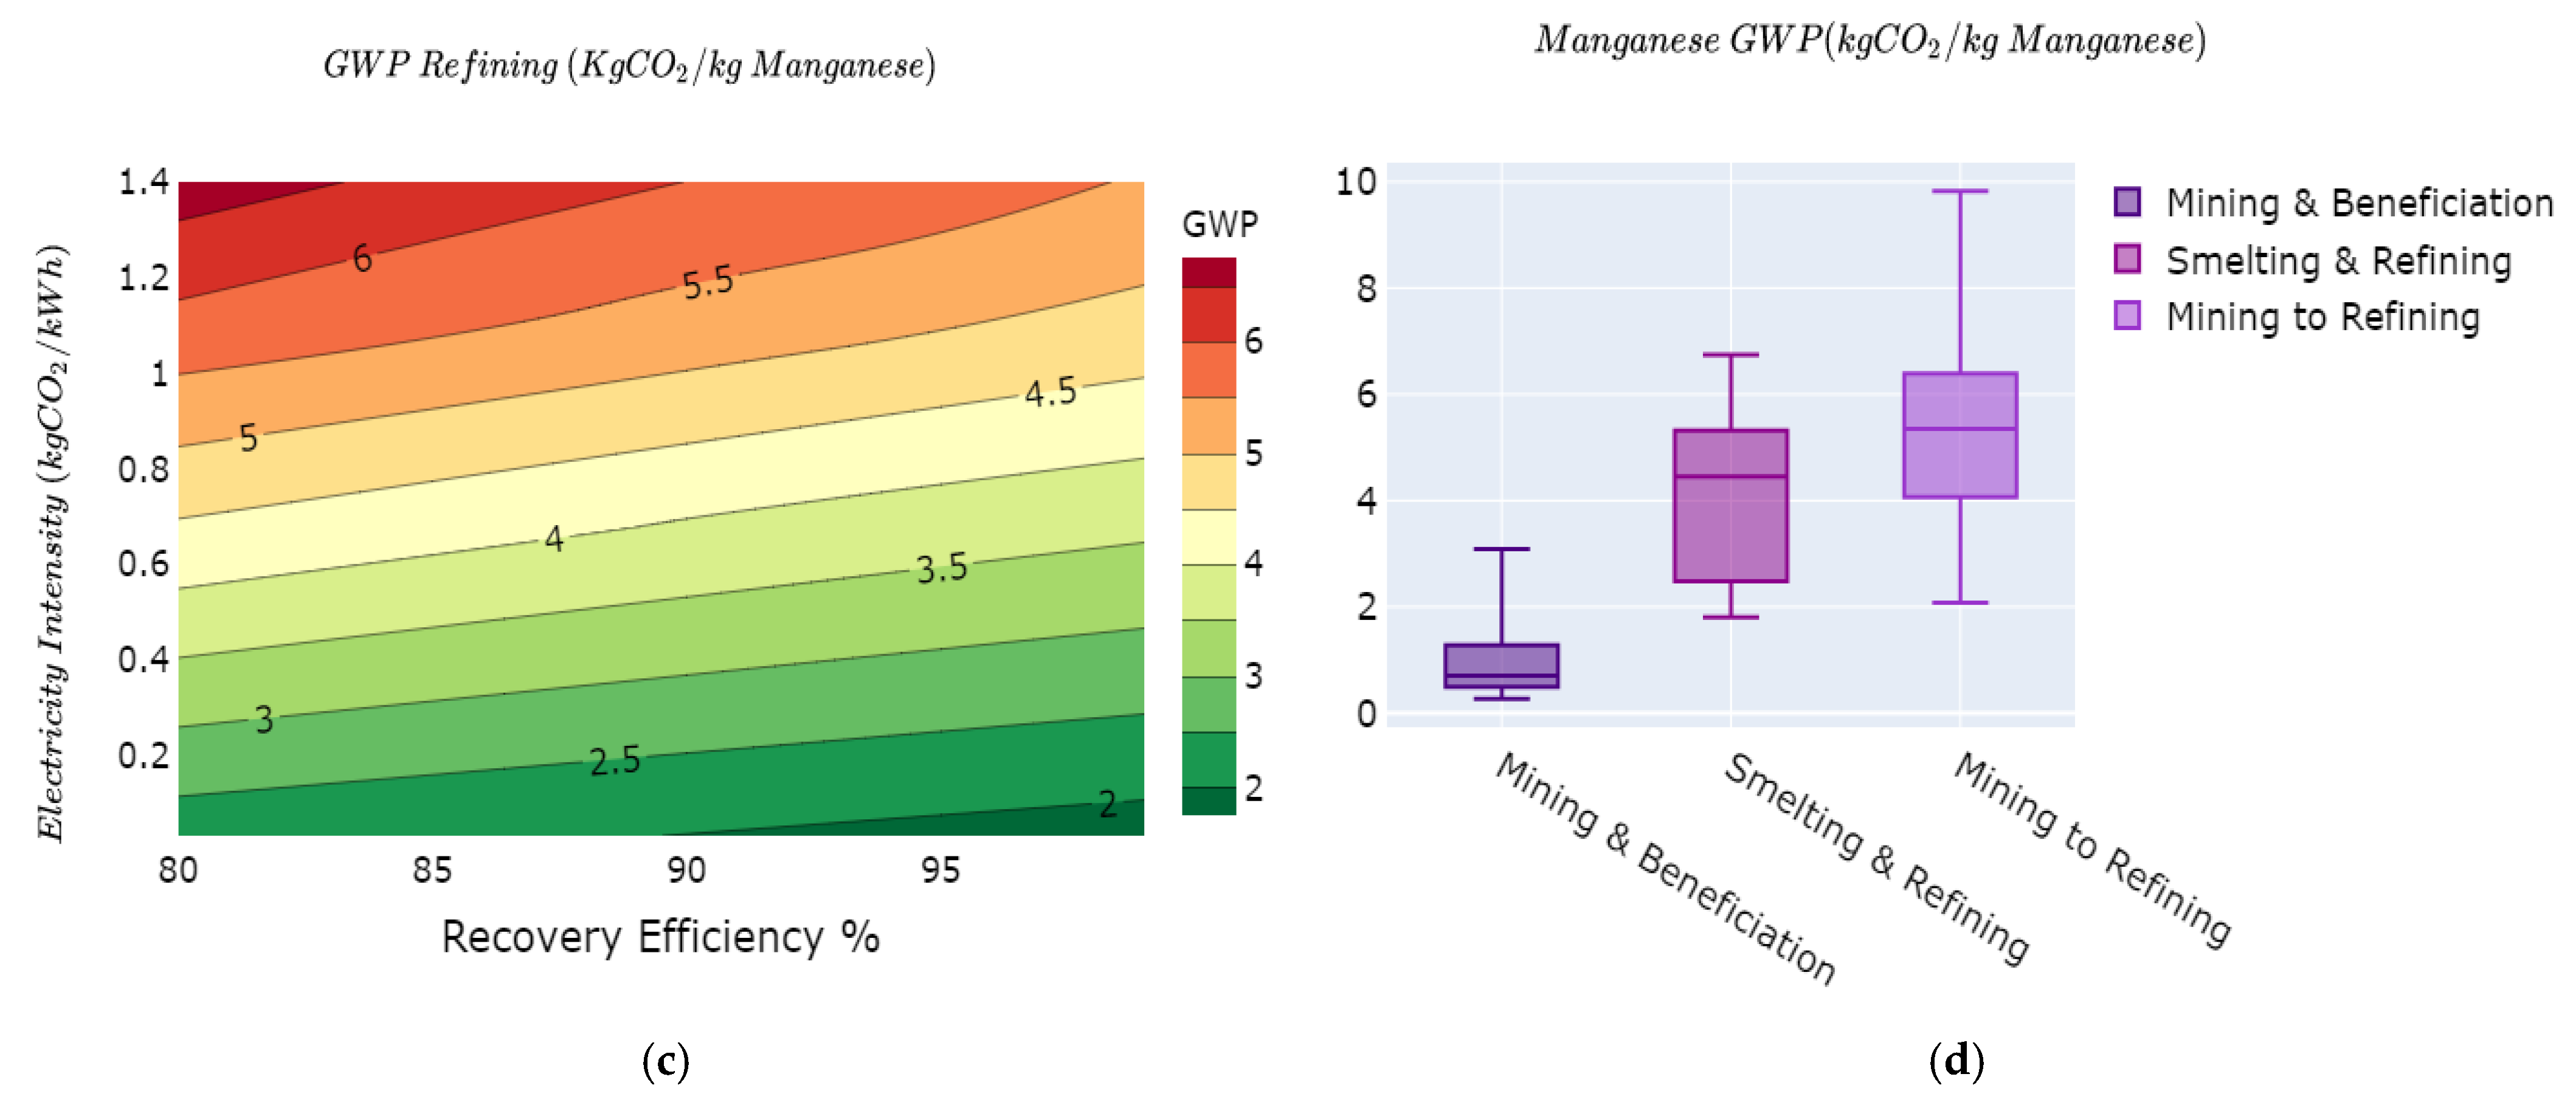
The overall minimum and maximum GWP for the mining and beneficiation stages of manganese production based on the results of the variability model are in the range between 0.2 kg of CO2e/kg Mn and 3.4 kg of CO2e/kg Mn. Figure 4a illustrates a change in the intensity of the gradients of the GWP curves per 10% change in Mn ore grade up to 40% Mn ore grade. Above 30% Mn ore grade, the GWP tend to vary less significantly with an increase in ore grade, while between 10% and 30%, the variations are much substantial. Below the 20% grade, the amount of energy used in the mining and beneficiation process for the Mn concentrate changes substantially with changing ore grade. Increasing the Mn recovery efficiency reduces the overall GWP, while the carbon intensity of the electricity mix correlates positively with the GWP Figure 4b. The GWP for mining and beneficiation stages of manganese production is reported at 0.48 kg of CO2e/kg FeMn [84] and 0.017 kg of CO2e/kg Mn for an average ore of 37.5% [41]. The results of the model harness the variability in much details in the mining and beneficiation of manganese.
4.3.2. Smelting and Refining
The two levers modeled in this process stage are recovery efficiency and the carbon intensity of the electricity mix, as shown in Figure 4c. Variations of the recovery efficiency between 80% and 98% and the carbon intensity of the electricity mix between 0.1 kg of CO2e/kWh and 1.4 kg of CO2e/kWh yield GWP that varies from 2 kg of CO2e/kg Mn to 6.8 kg of CO2e/kg Mn with a median value of 4.8 kg of CO2e/kg Mn. Other studies have measured the average GWP of this stage at 4.52 kg of CO2e/kg Mn [41] and 4.27 kg of CO2e/kg Mn [84].
4.4. Lithium
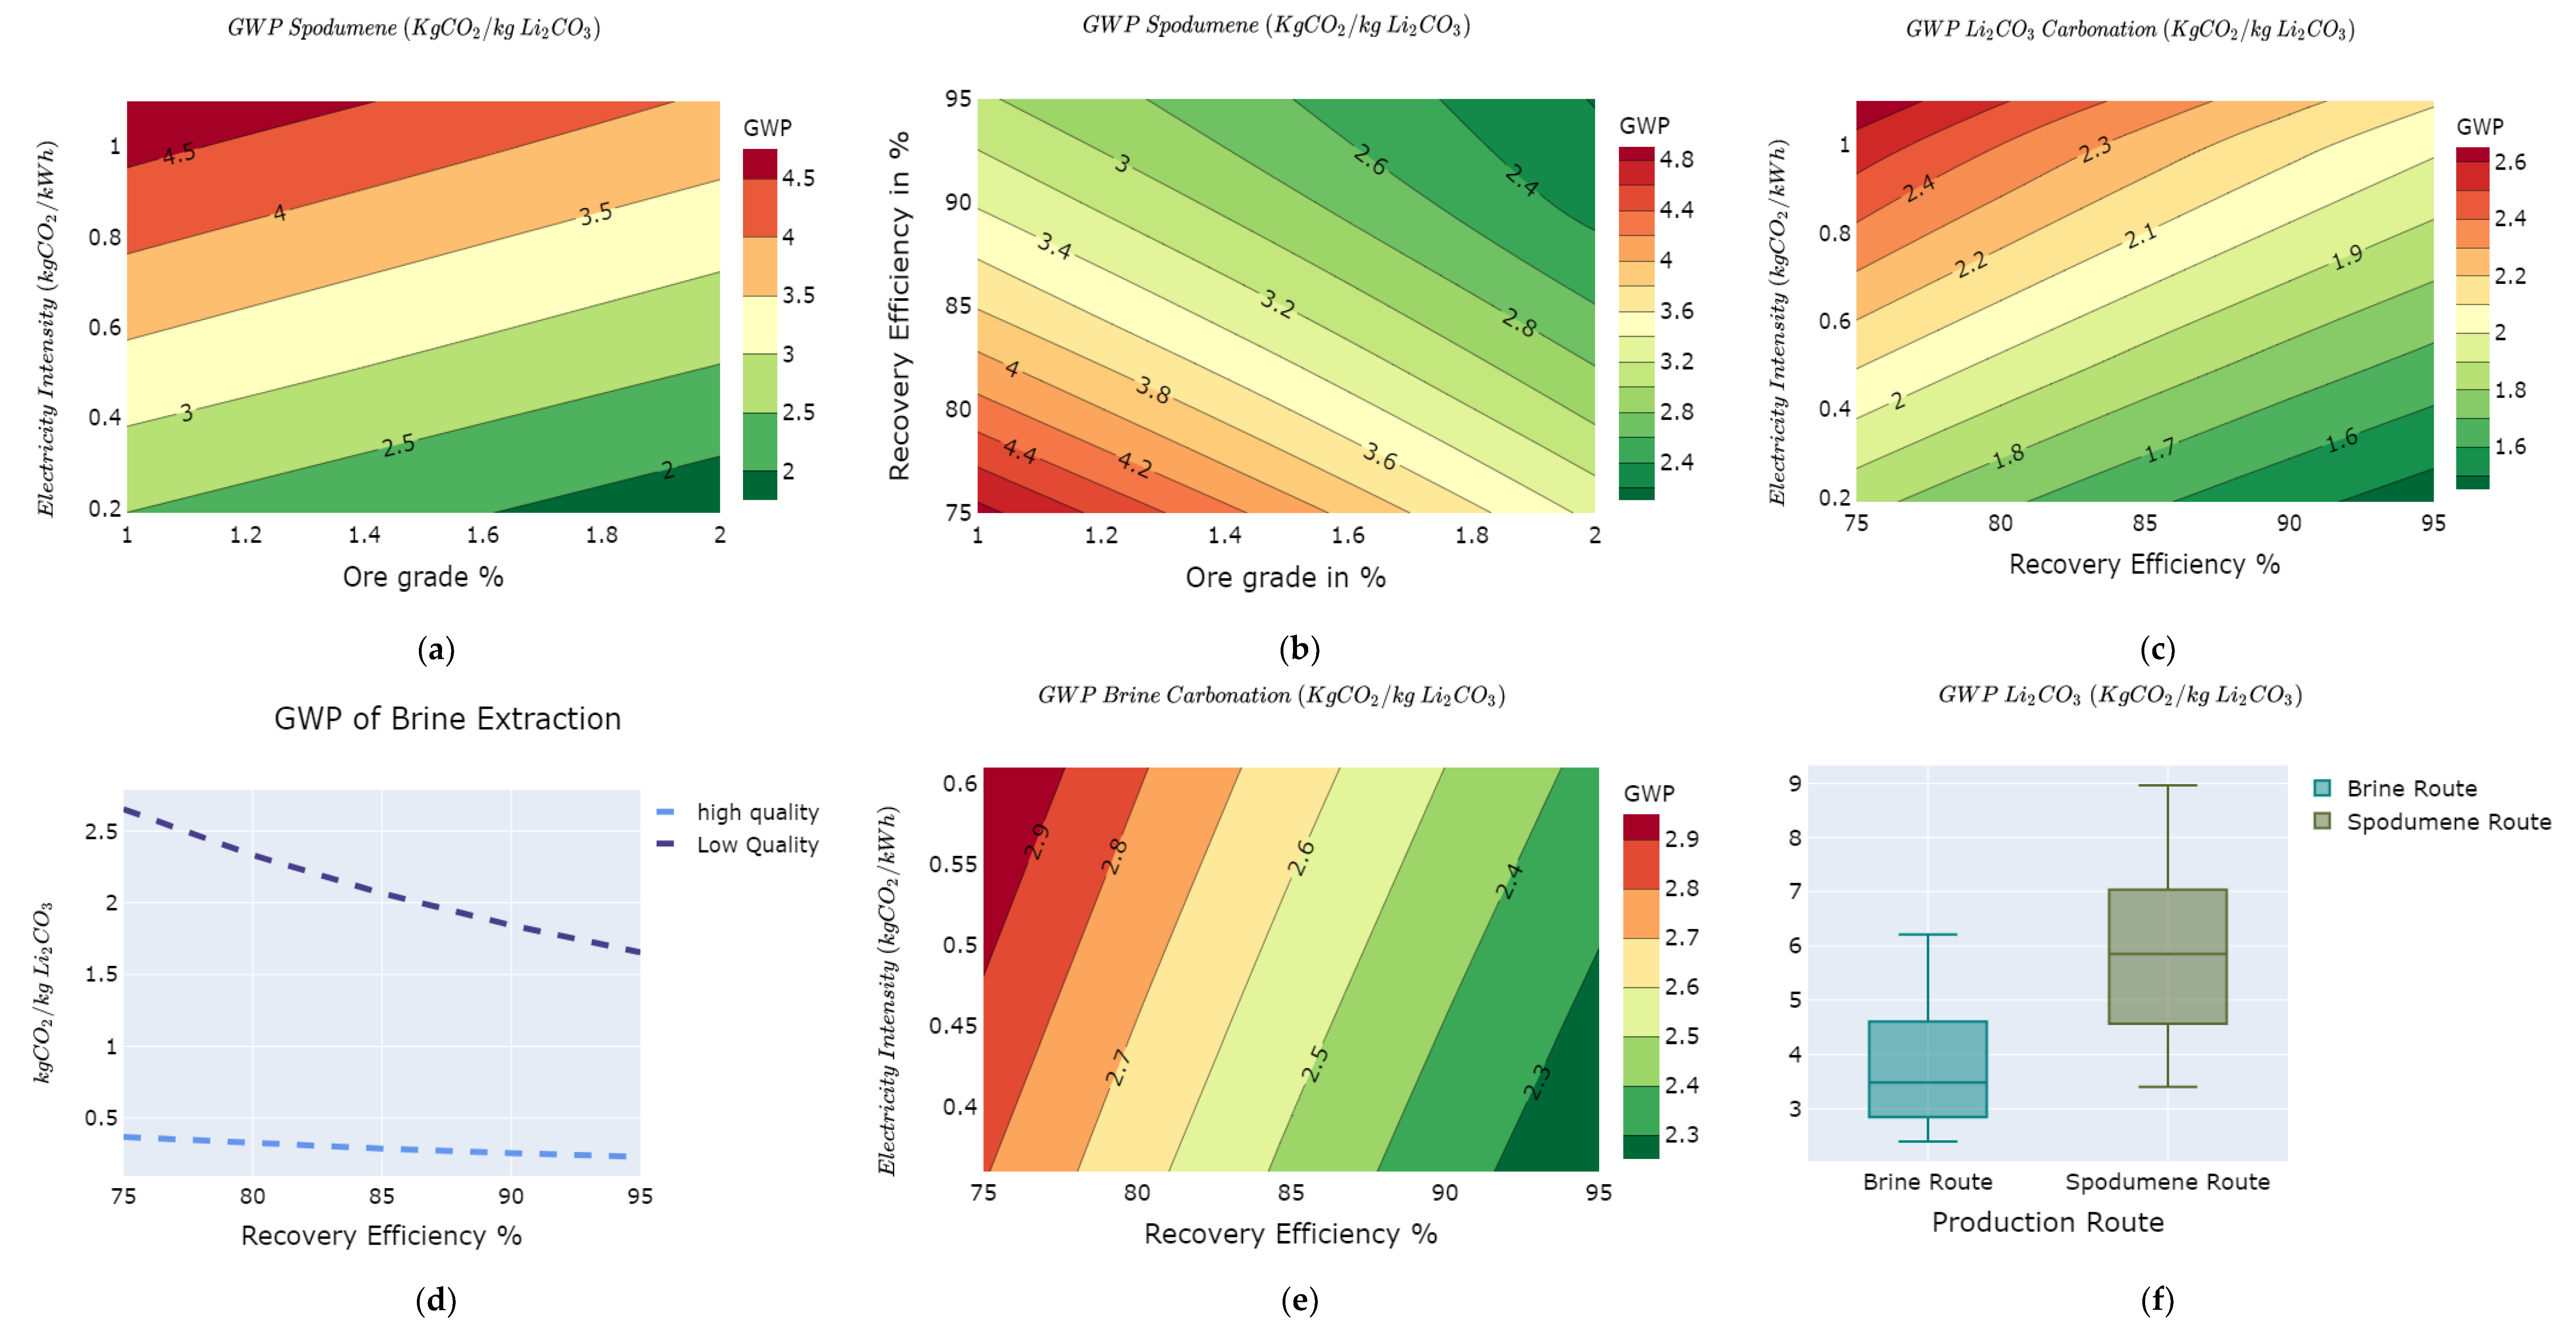
The variability results for lithium are expressed per unit LCE. Moreover, we present the results for brine and spodumene routes.
The GWP of lithium concentrates produced via spodumene is subject to ore grade variations, recovery efficiency, and electricity mix intensity. In Figure 5a,b, the variability of producing concentrates from spodumene rock is visualized. The variations in the GWP for concentrating spodumene ores are between 1.8 kg of CO2e/kg LCE and 4.9 kg of CO2e/kg LCE (Figure 5a,b). The GWP of spodumene concentrates negatively correlates with ore grades and recovery efficiency as increasing these parameters reduces the overall GWP. The GWP of the carbonation process ranges from 1.3 kg of CO2e/kg LCE to 2.7 kg of CO2e/kg LCE, as shown in Figure 5c.
In the case of LCE produced via brine, we investigated with the following set of conditions; low-quality brines and high-quality brines, recovery efficiency, and intensity of the energy mix used in the brine extraction process as shown in Figure 5d. High-quality brines are primarily evaporated using solar energy, while low-quality brines will require additional thermal energy to evaporate the brine [40]. The GWP of high-quality brines is significantly lower than low-quality brines as low-quality brines require extra natural gas for drying the aqueous brines in the worst-case scenarios [39].
Increasing the recovery efficiency reduces the overall GWP. The variations in the GWP of brine concentrate range from 0.3 kg of CO2e/kg LCE to 2.6 kg of CO2e/kg LCE for the different lever settings, as shown in Figure 5d,e.
The carbonation process yields similar GWP trends, ranging from 1.4 kg of CO2e/kg LCE to 2.6 kg of CO2e/kg LCE for LCE via spodumene route and 2.2 kg of CO2e/kg LCE to 2.9 kg of CO2e/kg LCE via brine routes as shown in Figure 5c,e respectively. The gradient lines in carbonation from brine (Figure 5e) are much stronger than those of spodumene (Figure 5c), suggesting that the recovery efficiency in lithium carbonate extraction from brine is a more critical factor than in lithium carbonate from spodumene.
The total cradle to gate impacts of LCE production via spodumene ranges from 3.5 kg of CO2e/kg LCE to 9 kg of CO2e/kg LCE, which is comparatively higher than that of the brine route. The brine route ranges from 2 kg of CO2e/kg LCE to 6.2 kg of CO2e/kg LCE, as shown in Figure 5f.
4.5. Graphite
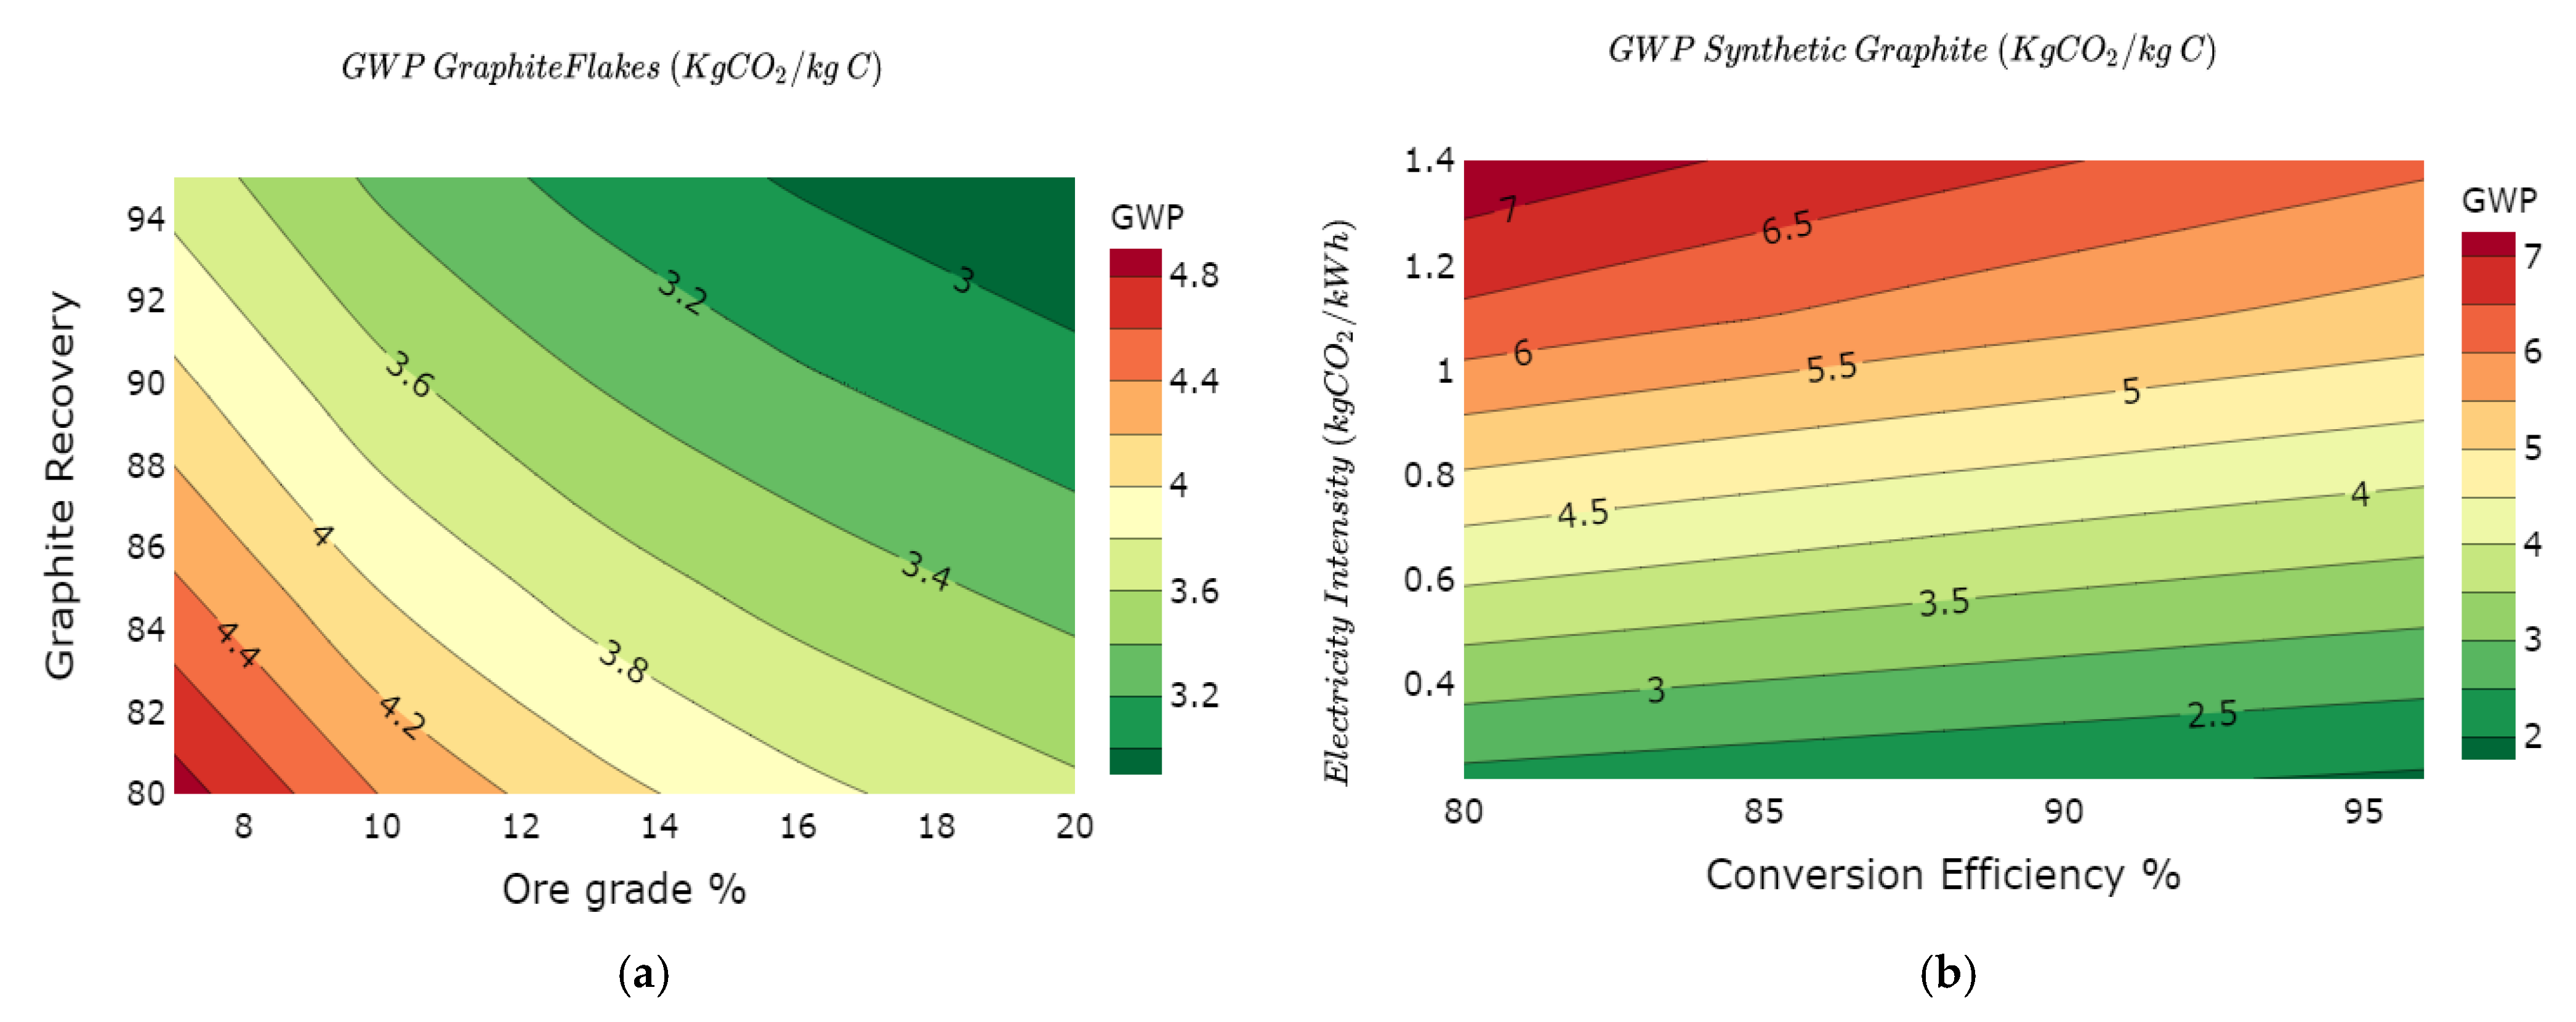
Graphite remains one of the battery raw materials with considerable uncertainty in the data requirements for effective quantification of the environmental impacts [36,37]. The results of our simulations for graphite are limited due to data uncertainty. However, we argue that it still provides a broader understanding of the spread in the GWP of graphite compared to current literature. We investigate synthetic graphite and natural graphite production routes to harness the variability of the GWP of these raw materials. The variability in natural and synthetic graphite is illustrated in Figure 6a,b, respectively.
The GWP of natural graphite varies from 2.3 to 6 kg of CO2e/kg C, while synthetic graphite varies from 1.8 to 8.2 kg of CO2e/kg C as shown in Figure 6d. Comparative results between natural and synthetic graphite show that synthetic graphite in some cases (lower carbon intensity and efficient furnace technologies) could have lower GWP than natural graphite. We investigate the effect of the Acheson and Castner electric furnaces on the overall GWP for synthetic graphite, as shown in Figure 6c. The Acheson furnace yields comparatively higher GWP than the Castner furnace for fixed carbon intensity of the electricity mix [61]. This is due to higher energy efficiency and reduced heat losses in the Castner furnace. The overall cradle to gate GWP for natural graphite and synthetic graphite are shown in Figure 6d with respective median values of 3.5 kg of CO2e/kg C and 4.2 kg of CO2e/kg C. The footprints displayed do not include the further particle processing into battery-grade graphite due to limited data availability. The impacts of graphite production reported in the literature range from 1 kg of CO2e/kg C to 5.59 kg of CO2e/kg C for natural graphite and 4.9 kg of CO2e/kg C for synthetic graphite [36].
4.6. Nickel
4.6.1. Mining and Beneficiation
An analysis of the mining and beneficiation of sulphidic ores reveal that the major levers responsible for variabilities in the GWP of this process stage are ore grade, mine type, mining and beneficiation recovery, and the carbon intensity of the electricity mix. The GWP varies from 2.8 kg of CO2e/kg Ni to 7.8 kg of CO2e/kg Ni for the mining and beneficiation stages, as shown in Figure 7a–c. A change in the grade of the ores affects the energy used in mining and concentration. For example, a 0.5% change in the ore grades produces a difference in the gradient of the average GWP as seen in Figure 7a. This is also in line with findings in [46]. Just as with mining and concentration of metals, recovery efficiency displays a negative correlation to the GWP. At the same time, the intensity of the electricity mix shows a positive correlation, as seen in Figure 7b. Figure 7c shows that above a given intensity of electricity mix used in mining operations (0.4 kg of CO2e/kWh), underground nickel mines tend to have a higher GWP than open-cast mines. This is due to the need for additional amounts of electricity for drilling, ventilation, lighting, and removal of rock surfaces from underground [85]. However, switching underground mining operations to low carbon solutions, especially renewables with significantly lower intensity of the electricity mix (in this case, less than 0.4 kg of CO2e/kWh), makes underground mines environmentally competitive with open-cast mines.
The range of the GWP for nickel mining and beneficiation is from 2.8 kg of CO2e/kg Ni to 13 kg of CO2e/kg Ni with a median value of 4.8 kg of CO2e/kg Ni. The Nickel Institute reports a GWP for mining and beneficiation stage of 2.1 kg of CO2e/kg Ni [44,86]. In comparison, Deng and colleagues reported a 10.7 kg of CO2e/kg Ni GWP for nickel mining and beneficiation in China [47]. These variabilities are effectively captured in the simulation results, as shown in Figure 7a–c.
4.6.2. Smelting and Refining
For the smelting and refining process, three major parameters are simulated to capture the variability in the GWP: carbon intensity of the electricity mix, recovery efficiency, and energy efficiency improvements (as illustrated in Figure 7d,e). A combination of the electricity mix intensity and recovery efficiency have intense effects on the GWP characterized by steep gradient lines as shown in Figure 7d with GWP lines ranging from 7.8 kg of CO2e/kg Ni to 18 kg of CO2e/kg Ni. In Figure 7e, the gradients of the GWP lines increase progressively with the carbon intensity of the electricity mix. This suggests that energy efficiency improvements are significant when a high carbon intensity mix is used than when a low carbon intensity mix is used. The overall GWP for the smelting and refining stages ranges from 6.8 kg of CO2e/kg Ni to 18 kg of CO2e/kg Ni as illustrated in Figure 7f.
The cradle to gate GWP for nickel production ranges from 9.6 kg of CO2e/kg Ni to 31 kg of CO2e/kg Ni as illustrated in Figure 7f. The cradle to gate impacts for nickel production are reported at 7.61 kg of CO2e/kg Ni [86], 13 kg of CO2e/kg Ni [47], 26.9 kg of CO2e/kg Ni [49], and 14 kg of CO2e/kg Ni [47].
5. Discussion and Conclusions
As the transition towards green mobility increases the demand for lithium-ion battery materials, it is essential to clarify the environmental implications of value chains to ensure their sustainability. In this study, we set out to identify levers that affect footprints in the battery value chain and explore the degree to which they do so. We identified resource-dependent, process dependent, and technology-dependent levers for the levers that affect the footprints. Resource-dependent levers are linked to the quality of the extracted resource (such as ore grades, brine quality). Process dependent levers characterize the efficiency of the production processes along the value chain, predominantly material and energy efficiency. Technology-dependent levers are conditioned by choice of the technology adopted along the value chain (such as carbon intensity of the electricity mix, smelting technologies, type of furnaces adopted, etc.). We developed a parametric attributional process-based LCA model to explore the degree to which these levers affect the footprints. This model aims to capture the quantitative spread in the GWP along the value chain of crucial battery materials and increase flexibility in thoroughly harnessing variability. For each value chain, levers identified from the engineering literature were varied between technically acceptable ranges, which generated multiple variants of life cycle inventories. These inventories were further analyzed using the LCA methodology. The parametric life cycle model yielded cradle to gate GWP results in the range from 3.1 to 13.3 kg of CO2e/kg Cu for copper and from 5.3 kg to 43 kg of CO2e/kg Al for aluminum which are used as current collectors for anode and cathode, respectively. For the cathode electrode base materials, the GWP ranges from 2 to 9 kg of CO2e/kg Mn for manganese, from 3.5 to 9 kg of CO2e/kg LCE for lithium carbonate via spodumene, from 2 to 6.2 kg of CO2e/kg LCE for lithium carbonate via brine, and from 9.6 to 31 kg of CO2e/kg Ni for nickel. For graphite, which is the anode base material, the results of the parametric model range from 2.3 to 6 kg of CO2e/kg C for natural graphite and from 1.8 to 8.2 kg of CO2e/kg C for synthetic graphite. Our model results concisely show variability for each value chain while also yielding results within acceptable ranges as reported in different LCAs of battery materials. The primary findings from this study indicate that various levers have substantial effects on the environmental impacts of mineral extraction and processing. Therefore, this is a significant consideration, especially for battery materials which are expected to grow exponentially during the transition to green mobility. As such, one could argue that all environmental assessments should analyze the sensitivities of these key levers on the environmental impacts, particularly those which have received little or no attention in most LCA studies. In addition, the results of this study also show that life cycle inventories are not static but dynamic and susceptible to changes based on variations in specific parameters in the unit processes for the modeled inventories. Therefore, a combination of engineering and LCA modeling approaches seems fruitful for an adequate understanding of the environmental footprints of battery material value chains.
This study indicates that focusing on one parameter along the value chain gives a partial understanding of its effect on environmental footprints. Consequently, mitigation strategies that focus on one specific parameter only bring a partial contribution to reducing the footprints of the battery materials. By combining two or more parameters, it is easy to clearly assess the effect that the changing parameters have on the overall footprints from the gradients of the contours. As such, mitigation strategies that take two or more parameters into consideration are more likely to have an impactful reduction in the overall emissions. In this vein, a question which arises is whether to prioritize energy efficiency or material efficiency as climate mitigation strategies [87,88]. For value chains, increasing the recovery efficiency directly reduces all material inputs and indirectly reduces the energy that would have been consumed in producing an extra amount of wasted material. In addition, increasing metal recovery efficiency also reduces all the emissions that would have otherwise been generated to produce the extra wasted material. However, energy efficiency only affects the energy consumption at a given process stage. Therefore, for a less carbon intensive electricity mix, increasing the recovery efficiency at a given process stage tends to significantly reduce the overall GWP rather than increasing the energy efficiency. This is observed in the case of nickel where the gradient lines are steeper in Figure 7d for material recovery efficiency than in Figure 7e for energy efficiency improvements. This observation is also true for other value chains investigated. The effects of improvements in energy efficiency are consequential when the carbon intensity of the fuel used is high. This type of analysis is important to be considered in the LCAs of various production systems to test sensitivities of mitigation strategies based on the process parameters affecting the production system.
Harnessing variability in battery value chains raises a profound understanding of how value chains’ impacts could likely evolve with time. In mineral extraction and processing, the variabilities in the processes tend to decrease down the value chain. This suggests that ore mining and beneficiation witness significant variabilities due to less standardized methods and resource quality than smelting and refining processes. One of the major levers that have been mentioned in many environmental assessments is the ore grade. As the ore grades decrease with time due to the depletion of best quality ores, the energy used in mining and beneficiation tends to increase, leading to higher footprints [71,89,90]. However, this increase in environmental footprints due to decreasing ore grades can be compensated by increasing recovery efficiencies, switching mining operations to low carbon energy solutions such as renewables, and adopting more energy-efficient smelting technologies down the value chain. In addition, emission abatement procedures and energy efficiency measures such as those described in the best available techniques (BATs) [91] and enforcement procedures elaborated in reference [92] provide a starting point towards policies that ensure sustainability in battery value chains.
The parametric model developed in this article has been able to produce results concisely and consistently. However, the first limitation to using this model is that it can be challenging to identify which levers to parameterize, as this requires a good blend of metallurgical process technology and environmental system analysis. The second limitation to this modelling approach is that some levers which affect the inventory are challenging to parameterize. Levers such as strip ratios, ore hardness, and deposit types [20], which affect the choice of the processing routes and the inventory of the value chain, are complicated to parameterize with mathematical relationships. Thirdly, only the pyrometallurgical routes are investigated for copper and nickel value chains due to the complexity in parameterizing hydrometallurgical value chains. Despite these limitations, the model is beneficial in relating how process parameters could potentially alter the GHG of raw materials used for battery manufacturing. Therefore, this model provides a consistent methodological approach towards a more detailed process based LCA modelling of battery material value chains. Increasing the robustness of the model through synergies between the mining and metallurgical communities and the LCA community is highly recommended.
Decarbonizing the transport sector through the use of battery electric vehicles requires a systematic understanding of the footprints of the whole value chain from raw material extraction to the final product. This paper focuses on raw material extraction and processing, addresses the need for robust considerations of the value chain levers when carrying out a life cycle assessment of batteries. By addressing variability through a parametric model developed in this article, we point to key levers that affect the value chains and the intensity to which they do so. Through the parametric model developed in this study, we have successfully harnessed the variabilities in the LCA results (GWP) reported in the literature by varying a set of lever settings. From the results obtained, we observed that the variations in the carbon footprints of these materials vary greatly depending on the lever settings. This substantial variability explicitly demonstrated in this work raises awareness of the requirements and expectations of high-resolution process-based metal inventories for LIB LCAs. Therefore, using generic processes or proxies from databases for mineral extraction and processing to perform LCAs of LIBs requires reconsideration and revision. Parametric life cycle inventories that can accommodate varying process parameters will increase understanding and accuracy in performing LCAs of LIBs. The model developed for these base materials forms a high-resolution backbone for performing LCAs of cathode and anode active materials. In addition, the model creates flexibility in testing the effects of resource, process, or technology-dependent conditions on the footprints of value chains. This flexibility expands the knowledge of mitigation strategies along the value chain. We therefore recommend using the parametric model developed in this study as a guiding rail to perform process based LCAs for cobalt, silicon, sulphur, phosphorous, graphene, and other novel materials developed during the transition to green mobility.
Parameterization of life cycle inventories in this study points towards blending engineering and environmental models. The approach seems suitable and highly beneficial in performing LCAs, especially along battery value chains. Therefore, it is also recommended that parametric life cycle modelling be extended to several product systems to exploit the quantitative spread in impacts as a function of key material and process parameters in their value chains.
Supplementary Materials
The following are available online at https://0-www-mdpi-com.brum.beds.ac.uk/article/10.3390/batteries7030057/s1. The working principle of the model is fully explained in Supplementary Material S1 while the model assumptions are found in Supplementary Materials S2. References [93,94,95,96,97,98,99,100,101,102,103,104,105,106] are cited in the supplementary materials.
Author Contributions
Conceptualization, N.B.M.; A.H.S.; L.U. and O.S.B.; methodology, N.B.M.; A.H.S. and L.U.; modeling and programming, N.B.M.; L.U.; formal analysis, N.B.M.; A.H.S. and L.U.; visualization, N.B.M.; writing—original draft preparation, N.B.M.; writing—review and editing, A.H.S.; L.U. and O.S.B.; supervision, A.H.S. and O.S.B.; project administration, A.H.S. and O.S.B.; funding acquisition, O.S.B. and A.H.S. All authors have read and agreed to the published version of the manuscript.
Funding
The authors acknowledge Freyr Battery AS, Norwegian University of Science and Technology (grant 90492503), EIT Innoenergy SE (grant 02-2019-IP172-FREYR), and SPIDER project (H2020 Grant Agreement n° 814389) for funding this research.
Institutional Review Board Statement
Not applicable.
Informed Consent Statement
Not applicable.
Data Availability Statement
The inventory used in this study is available upon request from the corresponding authors.
Acknowledgments
N.B.M. acknowledges technical support from Asanthi Jinasena (Postdoctoral Researcher at NTNU) and Christine Hung (Research Scientist at SINTEF) for their valuable technical insights during the model development.
Conflicts of Interest
The authors declare no conflict of interest. The funders had no role in the design of the study; in the collection, analyses, or interpretation of data; in the writing of the manuscript; or in the decision to publish the results.
References
- Jones, B.; Elliott, R.J.R.; Nguyen-Tien, V. The EV Revolution: The Road Ahead for Critical Raw Materials Demand. Appl. Energy 2020, 280, 115072. [Google Scholar] [CrossRef]
- Hensley, R.; Knupfer, S.; Pinner, D. Three Surprising Resource Implications from the Rise of Electric Vehicles. 2018. Available online: https://www.mckinsey.com/industries/automotive-and-assembly/our-insights/three-surprising-resource-implications-from-the-rise-of-electric-vehicles (accessed on 8 July 2021).
- Mo, J.Y.; Jeon, W. The Impact of Electric Vehicle Demand and Battery Recycling on Price Dynamics of Lithium-Ion Battery Cathode Materials: A Vector Error Correction Model (VECM) Analysis. Sustainability 2018, 10, 2870. [Google Scholar] [CrossRef] [Green Version]
- Tsiropoulos, I.; Tarvydas, D.; Lebedeva, N. Li-Ion Batteries for Mobility and Stationary Storage Applications—Scenarios for Costs and Market Growth; Publications Office of the European Union: Luxembourg, 2018. [Google Scholar]
- IRENA. Electricity Storage and Renewables: Costs and Markets to 2030; International Renewable Energy Agency: Abu Dhabi, United Arab Emirates, 2017; ISBN 978-92-9260-038-9. [Google Scholar]
- Prochaska, C.; Harsha, M.G.; Fitzsimmons, A.; Pesin, M.; Mann, M.; Babinec, S.; Putsche, V.; Hendrickson, S.; Ho, H.; Spitsen, P.; et al. Energy Storage Grand Challenge Roadmap; Technical; United States Department of Energy: Washington, DC, USA, 2020.
- Xu, C.; Dai, Q.; Gaines, L.; Hu, M.; Tukker, A.; Steubing, B. Future Material Demand for Automotive Lithium-Based Batteries. Commun. Mater. 2020, 1, 99. [Google Scholar] [CrossRef]
- Ellingsen, L.A.W.; Majeau-Bettez, G.; Singh, B.; Srivastava, A.K.; Valøen, L.O.; Strømman, A.H. Life Cycle Assessment of a Lithium-Ion Battery Vehicle Pack. J. Ind. Ecol. 2014, 18, 113–124. [Google Scholar] [CrossRef] [Green Version]
- Zackrisson, M.; Avellán, L.; Orlenius, J. Life Cycle Assessment of Lithium-Ion Batteries for Plug-in Hybrid Electric Vehicles-Critical Issues. J. Clean. Prod. 2010, 18, 1519–1529. [Google Scholar] [CrossRef]
- Liang, Y.; Su, J.; Xi, B.; Yu, Y.; Ji, D.; Sun, Y.; Cui, C.; Zhu, J. Life Cycle Assessment of Lithium-Ion Batteries for Greenhouse Gas Emissions. Resour. Conserv. Recycl. 2017, 117, 285–293. [Google Scholar] [CrossRef]
- Romare, M.; Dahllöf, L. The Life Cycle Energy Consumption and Greenhouse Gas Emissions from Lithium-Ion Batteries. IVL Swed. Environ. Res. Inst. 2017, 58, C243. [Google Scholar]
- Aichberger, C.; Jungmeier, G. Environmental Life Cycle Impacts of Automotive Batteries Based on a Literature Review. Energies 2020, 13, 6345. [Google Scholar] [CrossRef]
- Majeau-Bettez, G.; Hawkins, T.R.; Strømman, A.H. Life Cycle Environmental Assessment of Lithium-Ion and Nickel Metal Hydride Batteries for Plug-in Hybrid and Battery Electric Vehicles. Environ. Sci. Technol. 2011, 45, 5454. [Google Scholar] [CrossRef]
- Amarakoon, S.; Smith, J.; Segal, B. Application of Life-Cycle Assessment to Nanoscale Technology: Lithium-Ion Batteries for Electric Vehicles; USEPA: Washington, DC, USA, 2013.
- Ellingsen, L.A.W.; Hung, C.R.; Strømman, A.H. Identifying Key Assumptions and Differences in Life Cycle Assessment Studies of Lithium-Ion Traction Batteries with Focus on Greenhouse Gas Emissions. Transp. Res. Part D Transp. Environ. 2017, 55, 82–90. [Google Scholar] [CrossRef]
- Dai, Q.; Kelly, J.C.; Gaines, L.; Wang, M. Life Cycle Analysis of Lithium-Ion Batteries for Automotive Applications. Batteries 2019, 5, 48. [Google Scholar] [CrossRef] [Green Version]
- Dunn, J.B.; Gaines, L.; Kelly, J.C.; James, C.; Gallagher, K.G. The Significance of Li-Ion Batteries in Electric Vehicle Life-Cycle Energy and Emissions and Recycling’s Role in Its Reduction. Energy Environ. Sci. 2015, 8, 158–168. [Google Scholar] [CrossRef]
- Northey, S.; Haque, N.; Cooksey, M. Addressing Variability of Life Cycle Based Environmental Impacts of Metal Production. In Proceedings of the 7th Annual High Temperature Processing Symposium 2015, Hawthorn, Victoria, Australia, 2–3 February 2015; Swinburne University of Technology: Hawthorn, Australia, 2015; pp. 20–22. [Google Scholar]
- Pauer, E.; Wohner, B.; Tacker, M. The Influence of Database Selection on Environmental Impact Results. Life Cycle Assessment of Packaging Using Gabi, Ecoinvent 3.6, and the Environmental Footprint Database. Sustainability 2020, 12, 9948. [Google Scholar] [CrossRef]
- Corrado, S.; Castellani, V.; Zampori, L.; Sala, S. Systematic Analysis of Secondary Life Cycle Inventories When Modelling Agricultural Production: A Case Study for Arable Crops. J. Clean. Prod. 2018, 172, 3990–4000. [Google Scholar] [CrossRef]
- Lueddeckens, S.; Saling, P.; Guenther, E. Temporal Issues in Life Cycle Assessment—A Systematic Review. Int. J. Life Cycle Assess. 2020, 25, 1385–1401. [Google Scholar] [CrossRef]
- Sonderegger, T.; Berger, M.; Alvarenga, R.; Bach, V.; Cimprich, A.; Dewulf, J.; Frischknecht, R.; Guinée, J.; Helbig, C.; Huppertz, T.; et al. Mineral Resources in Life Cycle Impact Assessment—Part I: A Critical Review of Existing Methods. Int. J. Life Cycle Assess. 2020, 25, 784–797. [Google Scholar] [CrossRef]
- Yellishetty, M.; Ranjith, P.G.; Tharumarajah, A.; Bhosale, S. Life Cycle Assessment in the Minerals and Metals Sector: A Critical Review of Selected Issues and Challenges. Int. J. Life Cycle Assess. 2009, 14, 257–267. [Google Scholar] [CrossRef]
- Subramanian, V. Addressment of Uncertainty and Variability in Attributional Environmental Life Cycle Assessment. Ph.D. Thesis, Arizona State University, Tempe, AZ, USA, 2016. [Google Scholar]
- Huijbregts, M.A.J. Application of Uncertainty and Variability in LCA. Part I: A General Framework for the Analysis of Uncertainty and Variability in Life Cycle Assessment. Int. J. Life Cycle Assess. 1998, 3, 273–280. [Google Scholar] [CrossRef]
- Liu, G.; Müller, D.B. Addressing Sustainability in the Aluminum Industry: A Critical Review of Life Cycle Assessments. J. Clean. Prod. 2012, 35, 108–117. [Google Scholar] [CrossRef]
- Nunez, P.; Jones, S. Cradle to Gate: Life Cycle Impact of Primary Aluminum Production. Int. J. Life Cycle Assess. 2016, 21, 1594–1604. [Google Scholar] [CrossRef] [Green Version]
- Olsen, S.C.P. Environmental Impact of the Nordic Aluminum Value Chain; NTNU: Trondheim, Norway, 2020. [Google Scholar]
- Nuss, P.; Eckelman, M.J. Life Cycle Assessment of Metals: A Scientific Synthesis. PLoS ONE 2014, 9, e101298. [Google Scholar] [CrossRef]
- Norgate, T.E.; Jahanshahi, S.; Rankin, W.J. Assessing the Environmental Impact of Metal Production Processes. J. Clean. Prod. 2007, 15, 838–848. [Google Scholar] [CrossRef]
- Nilsson, A.E.; Aragonés, M.M.; Torralvo, F.A.; Dunon, V.; Angel, H.; Komnitsas, K.; Willquist, K. A Review of the Carbon Footprint of Cu and Zn Production from Primary and Secondary Sources. Minerals 2017, 7, 168. [Google Scholar] [CrossRef] [Green Version]
- Vaccari, A.; Tikana, L. Copper Environmental Profile; International Copper Alliance: Berlin, Germany, 2017. [Google Scholar]
- Gao, S.W.; Gong, X.Z.; Liu, Y.; Zhang, Q.Q. Energy Consumption and Carbon Emission Analysis of Natural Graphite Anode Material for Lithium Batteries. Mater. Sci. Forum 2018, 913, 985–990. [Google Scholar] [CrossRef]
- Wernet, G.; Bauer, C.; Steubing, B.; Reinhard, J.; Moreno-Ruiz, E.; Weidema, B. The Ecoinvent Database Version 3 (Part I): Overview and Methodology. Int. J. Life Cycle Assess. 2016, 21, 1218–1230. [Google Scholar] [CrossRef]
- Dunn, J.B.; James, C.; Gaines, L.; Gallagher, K.; Dai, Q.; Kelly, J.C. Material and Energy Flows in the Production of Cathode and Anode Materials for Lithium Ion Batteries; Argonne National Lab: Argonne, IL, USA, 2015.
- Minviro. Battery Grade Graphite. It’s Not All about Carbon; Minviro: London, UK, 2020; Available online: https://www.minviro.com/battery-grade-graphite-its-not-all-about-carbon/ (accessed on 10 May 2021).
- Pell, R.; Whattoff, P.; Lindsay, J. Climate Impact of Graphite Production; Minviro: London, UK, 2021. [Google Scholar]
- Jiang, S.; Zhang, L.; Li, F.; Hua, H.; Liu, X.; Yuan, Z.; Wu, H. Environmental Impacts of Lithium Production Showing the Importance of Primary Data of Upstream Process in Life-Cycle Assessment. J. Environ. Manag. 2020, 262, 110253. [Google Scholar] [CrossRef] [PubMed]
- Ambrose, H.; Kendall, A. Understanding the Future of Lithium: Part 2, Temporally and Spatially Resolved Life-Cycle Assessment Modeling. J. Ind. Ecol. 2020, 24, 90–100. [Google Scholar] [CrossRef]
- Stamp, A.; Lang, D.J.; Wäger, P.A. Environmental Impacts of a Transition toward E-Mobility: The Present and Future Role of Lithium Carbonate Production. J. Clean. Prod. 2012, 23, 104–112. [Google Scholar] [CrossRef]
- Farjana, S.H.; Huda, N.; Mahmud, M.A.P.; Lang, C. A Global Life Cycle Assessment of Manganese Mining Processes Based on EcoInvent Database. Sci. Total Environ. 2019, 688, 1102–1111. [Google Scholar] [CrossRef]
- Zhang, R.; Ma, X.; Shen, X.; Zhai, Y.; Zhang, T.; Ji, C.; Hong, J. Life Cycle Assessment of Electrolytic Manganese Metal Production. J. Clean. Prod. 2020, 253, 119951. [Google Scholar] [CrossRef]
- Peng, X.; Yu, H.; Wang, P.; Liu, Y.; Yang, L.; Dong, H.; Ren, Y.; Wang, H. Production Assessment in the Electrolytic Manganese Metal Industry in China. Rev. Metall. Cah. D’Informations Tech. 2011, 108, 437–442. [Google Scholar] [CrossRef]
- Gediga, J.; Sandilands, J.; Roomanay, N.; Boonzaier, S. Life Cycle Assessment of Nickel Products Commissioned by Nickel Institute; PE International AG: Leinfelden-Echterdingen, Germany, 2015. [Google Scholar]
- Boonzaier, S.; Gediga, J. Life Cycle Assessment of Nickel Products Commissioned by Nickel Institute; Sphera Solutions GmbH: Leinfelden-Echterdingen, Germany, 2020. [Google Scholar]
- Wei, W.; Samuelsson, P.B.; Tilliander, A.; Gyllenram, R.; Jönsson, P.G. Energy Consumption and Greenhouse Gas Emissions of Nickel Products. Energies 2020, 13, 5664. [Google Scholar] [CrossRef]
- Deng, S.Y.; Gong, X.Z. Life Cycle Assessment of Nickel Production in China. Mater. Sci. Forum 2018, 913, 1004–1010. [Google Scholar] [CrossRef]
- Norgate, T.; Rankin, W.J. Life Cycle Assessment of Copper and Nickel Production. In Proceedings of the International Congress on Mineral Processing and Extractive Metallurgy, Melbourne, Australia, 11–13 September 2000. [Google Scholar]
- Mancini, L.; Eslava, N.A.; Traverso, M.; Mathieux, F. Responsible and Sustainable Sourcing of Battery Raw Materials; Publications Office of the European Union: Luxembourg, 2020. [Google Scholar]
- Dühnen, S.; Betz, J.; Kolek, M.; Schmuch, R.; Winter, M.; Placke, T. Toward Green Battery Cells: Perspective on Materials and Technologies. Small Methods 2020, 4, 2000039. [Google Scholar] [CrossRef]
- Baars, J.; Domenech, T.; Bleischwitz, R.; Melin, H.E.; Heidrich, O. Circular Economy Strategies for Electric Vehicle Batteries Reduce Reliance on Raw Materials. Nat. Sustain. 2021, 4, 71–79. [Google Scholar] [CrossRef]
- Schwarz, H.-G. Aluminum Production and Energy. Encycl. Energy 2004, 1, 81–95. [Google Scholar]
- Bergsdal, H.; Strømman, A.H.; Hertwich, E.G. The Aluminum Industry: Environment, Technology and Production; NTNU: Trondheim, Norway, 2004. [Google Scholar]
- International Aluminum Institute. Life Cycle Inventory Data and Environmental Metrics for the Primary Aluminum Industry; International Aluminium Institute: London, UK, 2017. [Google Scholar]
- Norgate, T.; Jahanshahi, S. Low Grade Ores—Smelt, Leach or Concentrate? Miner. Eng. 2010, 23, 65–73. [Google Scholar] [CrossRef]
- Schmidt, T.; Buchert, M.; Schebek, L. Investigation of the Primary Production Routes of Nickel and Cobalt Products Used for Li-Ion Batteries. Resour. Conserv. Recycl. 2016, 112, 107–122. [Google Scholar] [CrossRef]
- International Manganese Institute. Manganese Life Cycle Assessment Results; International Manganese Institute: Paris, France, 2014. [Google Scholar]
- Vikström, H.; Davidsson, S.; Höök, M. Lithium Availability and Future Production Outlooks. Appl. Energy 2013, 110, 252–266. [Google Scholar] [CrossRef] [Green Version]
- Gruber, P.W.; Medina, P.A.; Keoleian, G.A.; Kesler, S.E.; Everson, M.P.; Wallington, T.J. Global Lithium Availability. J. Ind. Ecol. 2011, 15, 760–775. [Google Scholar] [CrossRef]
- Damm, S.; Qizhong, Z. Supply and Demand of Natural Graphite; Berlin, Germany, 2020; Available online: https://www.deutsche-rohstoffagentur.de/DERA/DE/Downloads/Studie%20Graphite%20eng%202020.pdf?__blob=publicationFile&v=3 (accessed on 10 July 2021).
- Jäger, H.; Frohs, W.; Banek, M.; Christ, M.; Daimer, J.; Fendt, F.; Friedrich, C.; Gojny, F.; Hiltmann, F.; Meyer zu Reckendorf, R.; et al. Industrial Carbons. In Ullmann’s Encyclopedia of Industrial Chemistry; Wiley-VCH Verlag GmbH & Co: Weinheim, Germany, 2010; Volume 6, pp. 732–770. [Google Scholar]
- Coursol, P.; Mackey, P.J. Energy Consumption in Copper Sulphide Smelting. In Proceedings of the Copper 2010, Hamburg, Germany, 6–10 June 2010; pp. 649–668. [Google Scholar]
- International Standard Organization. ISO 14040: Environmental Management–Life Cycle Assessment—Principles and Framework; International Standard Organization: Geneva, Switzerland, 2006. [Google Scholar]
- Nordelöf, A.; Alatalo, M.; Söderman, M.L. A Scalable Life Cycle Inventory of an Automotive Power Electronic Inverter Unit—Part I: Design and Composition. Int. J. Life Cycle Assess. 2019, 24, 78–92. [Google Scholar] [CrossRef] [Green Version]
- Nordelöf, A. A Scalable Life Cycle Inventory of an Automotive Power Electronic Inverter Unit—Part II: Manufacturing Processes. Int. J. Life Cycle Assess. 2019, 24, 694–711. [Google Scholar] [CrossRef] [Green Version]
- James Joyce, P. Lcopt—An Interactive Tool for Creating Fully Parameterised Life Cycle Assessment (LCA) Foreground Models. J. Open Source Softw. 2017, 2, 339. [Google Scholar] [CrossRef]
- Hollberg, A.; Kaushal, D.; Basic, S.; Galimshina, A.; Habert, G. A Data-Driven Parametric Tool for under-Specified LCA in the Design Phase. 2020 IOP Conf. Ser. Earth Environ. Sci. 2020, 588, 052018. [Google Scholar]
- Heijungs, R.; Sun, S. The Computational Structure of Life Cycle Assessment. Int. J. Life Cycle Assess. 2002, 7, 214–314. [Google Scholar] [CrossRef]
- Hawkins, T.R.; Singh, B.; Majeau-Bettez, G.; Strømman, A.H. Comparative Environmental Life Cycle Assessment of Conventional and Electric Vehicles. J. Ind. Ecol. 2013, 17, 53–64. [Google Scholar] [CrossRef]
- Sevillano, G.C. Exergy Assessment of Mineral Extraction, Trade and Depletion. Ph.D. Thesis, Universidad de Zaragoza, Zaragoza, Spain, 2016. [Google Scholar]
- Calvo, G.; Mudd, G.; Valero, A.; Valero, A. Decreasing Ore Grades in Global Metallic Mining: A Theoretical Issue or a Global Reality? Resources 2016, 5, 36. [Google Scholar] [CrossRef] [Green Version]
- Valero, A.; Valero, A. The exergy replacement cost of Mineral Wealth. In Thanatia: The Destiny Of The Earth’s Mineral Resources—A Thermodynamic Cradle-to-Cradle Assessment; World Scientific Publishing Co. Pte. Ltd.: Singapore, 2014; pp. 351–367. ISBN 9814273937. [Google Scholar]
- Valero, A.; Valero, A.; Domínguez, A. Trends of Exergy Costs and Ore Grade in Global Mining; Society for Mining, Metallurgy & Exploration: Littleton, CO, USA, 2011. [Google Scholar]
- Majeau-Bettez, G.; Strømman, A.H. Documentation for Arda Calculator; NTNU: Trondheim, Norway, 2016. [Google Scholar]
- U.S. Geological Survey. Mineral Commodity Summaries 2021; U.S. Geological Survey: Reston, VA, USA, 2021; p. 200. [CrossRef]
- Ter Weer, P.H. Sustainability and Bauxite Deposits. In Light Metals 2014; John, G., Ed.; Springer: Cham, Switzerland, 2014; pp. 149–154. ISBN 978-3-319-48143-2. [Google Scholar]
- Wagner, C.; IAI; BAC. Sustainable bauxite mining—A global perspective. In Essential Readings in Light Metals; Donaldson, D., Benny, R., Eds.; Springer: Cham, Switzerland, 2017; Volume 1, pp. 54–59. ISBN 9783319481760. [Google Scholar]
- Haraldsson, J.; Johansson, M.T. Review of Measures for Improved Energy Efficiency in Production-Related Processes in the Aluminum Industry—From Electrolysis to Recycling. Renew. Sustain. Energy Rev. 2018, 93, 525–548. [Google Scholar] [CrossRef] [Green Version]
- Kuipers, K.J.J.; van Oers, L.F.C.M.; Verboon, M.; van der Voet, E. Assessing Environmental Implications Associated with Global Copper Demand and Supply Scenarios from 2010 to 2050. Glob. Environ. Chang. 2018, 49, 106–115. [Google Scholar] [CrossRef]
- Northey, S.; Haque, N.; Mudd, G. Using Sustainability Reporting to Assess the Environmental Footprint of Copper Mining. J. Clean. Prod. 2013, 40, 118–128. [Google Scholar] [CrossRef]
- Koppelaar, R.H.E.M.; Koppelaar, H. The Ore Grade and Depth Influence on Copper Energy Inputs. Biophys. Econ. Resour. Qual. 2016, 1, 11. [Google Scholar] [CrossRef] [Green Version]
- Zhang, Q.Q.; Gong, X.Z.; Meng, X.C. Environment Impact Analysis of Natural Graphite Anode Material Production. Mater. Sci. Forum 2018, 913, 1011–1017. [Google Scholar] [CrossRef]
- Ahtola, T.; Kuusela, J.; Käpyaho, A.; Kontoniemi, O. Overview of Lithium Pegmatite Exploration in the Kaustinen Area in 2003–2012; Geological Survey of Finland: Espoo, Finland, 2015. [Google Scholar]
- Westfall, L.A.; Cramer, M.H.; Davourie, J.; Mcgough, D.; Ali, M. Life-Cycle Impacts and Costs of Manganese Losses and Recovery during Ferromanganese Production. In Proceedings of the the Fourteenth International Ferroalloys Congress, Kyiv, Ukraine, 1–4 June 2015; pp. 626–635. [Google Scholar]
- Eckelman, M.J. Facility-Level Energy and Greenhouse Gas Life-Cycle Assessment of the Global Nickel Industry. Resour. Conserv. Recycl. 2010, 54, 256–266. [Google Scholar] [CrossRef]
- Mistry, M.; Gediga, J.; Boonzaier, S. Life Cycle Assessment of Nickel Products. Int. J. Life Cycle Assess. 2016, 21, 1559–1572. [Google Scholar] [CrossRef] [Green Version]
- Gilbert, P.; Wilson, P.; Walsh, C.; Hodgson, P. The Role of Material Efficiency to Reduce CO2 Emissions during Ship Manufacture: A Life Cycle Approach. Mar. Policy 2017, 75, 227–237. [Google Scholar] [CrossRef]
- Ho, F.H.; Abdul-Rashid, S.H.; Ghazilla, R.A.R.; Sakundarini, N.; Woo, Y.L.; Ahmad, S.; Ghazali, I.; Haq, R.H.A. What Key Drivers Are Needed to Implement Material Efficiency Strategies? An Analysis of the Electrical and Electronic Industry in Malaysia and Its Implications to Practitioners. Sustainability 2021, 13, 2065. [Google Scholar] [CrossRef]
- Northey, S.; Mohr, S.; Mudd, G.M.; Weng, Z.; Giurco, D. Modelling Future Copper Ore Grade Decline Based on a Detailed Assessment of Copper Resources and Mining. Resour. Conserv. Recycl. 2014, 83, 190–201. [Google Scholar] [CrossRef]
- Mudd, G.M.; Jowitt, S.M. A Detailed Assessment of Global Nickel Resource Trends and Endowments. Econ. Geol. 2014, 109, 1163–1183. [Google Scholar] [CrossRef]
- Cusano, G.; Gonzalo, M.R.; Farrell, F.; Remus, R.; Roudier, S.; Sancho, L.D. Best Available Techniques (BAT) Reference Document for the Non-Ferrous Metals Industries; Publication Office of the European Union: Luxembourg, 2017. [Google Scholar]
- Mathieu, C. Green Batteries: A Competitive Advantage for Europe’s Electric Vehicle Value Chain? Études de l’Ifri: Paris, France, 2021. [Google Scholar]
- Basov, V. The World’s Top 10 Highest-Grade Copper Mines. Available online: https://www.mining.com/the-worlds-top-10-highest-grade-copper-mines/ (accessed on 10 October 2020).
- Azizi, A.; Masdarian, M.; Hassanzadeh, A.; Bahri, Z.; Niedoba, T.; Surowiak, A. Parametric Optimization in Rougher Flotation Performance of a Sulfidized Mixed Copper Ore. Minerals 2020, 10, 660. [Google Scholar] [CrossRef]
- Brininstool, M.; Flanagan, D.M. Copper. In USGS—2015 Minerals Yearbook; United States Geological Survey (USGS): Reston, VA, USA, 2017; p. 30. [Google Scholar]
- Kaußen, F.M.; Friedrich, B. Methods for Alkaline Recovery of Aluminum from Bauxite Residue. J. Sustain. Metall. 2016, 2, 353–364. [Google Scholar] [CrossRef] [Green Version]
- Bray, E.L. Bauxite and Alumina. In USGS—2017 Minerals Yearbook; United States Geological Survey (USGS): Reston, VA, USA, 2020; p. 14. [Google Scholar]
- Norgate, T.; Jahanshahi, S. Energy and Greenhouse Gas Implications of Deteriorating Quality Ore Reserves. In Proceedings of the 5th Australian Conference on Life Cycle Assessment, Melbourne, Australia, 22–24 November 2006; pp. 1–10. [Google Scholar]
- McRae, M.E. Nickel. In 2016 Minerals Yearbook; United States Geological Survey (USGS): Reston, VA, USA, 2016; p. 42. [Google Scholar]
- Kulczycka, J.; Lelek, Ł.; Lewandowska, A.; Wirth, H.; Bergesen, J.D. Environmental Impacts of Energy-Efficient Pyrometallurgical Copper Smelting Technologies: The Consequences of Technological Changes from 2010 to 2050. J. Ind. Ecol. 2016, 20, 304–316. [Google Scholar] [CrossRef] [Green Version]
- Singh, V.; Chakraborty, T.; Tripathy, S.K. A Review of Low Grade Manganese Ore Upgradation Processes. Miner. Process. Extr. Metall. Rev. 2020, 41, 417–438. [Google Scholar] [CrossRef]
- Robinson, G.R.; Hammarstrom, J.M.; Olson, D.W. Graphite. In Critical Mineral Resources of the United States—Economic and Environmental Geology and Prospects for Future Supply; United States Geological Survey (USGS): Reston, VA, USA, 2017. [Google Scholar]
- Jara, A.D.; Betemariam, A.; Woldetinsae, G.; Yong, J. International Journal of Mining Science and Technology Purification, Application and Current Market Trend of Natural Graphite: A Review. Int. J. Min. Sci. Technol. 2019, 29, 671–689. [Google Scholar] [CrossRef]
- SGS. Hard Rock Lithium Processing; 2010; Available online: https://www.sgs.com/~/media/Global/Documents/Flyers%20and%20Leaflets/SGS-MIN-WA109-Hard-Rock-Lithium-Processing-EN-11.pdf (accessed on 10 October 2020).
- Yaksic, A.; Tilton, J.E. Using the Cumulative Availability Curve to Assess the Threat of Mineral Depletion: The Case of Lithium. Resour. Policy 2009, 34, 185–194. [Google Scholar] [CrossRef]
- Steubing, B.; de Koning, D.; Haas, A.; Mutel, C.L. The Activity Browser—An Open Source LCA Software Building on Top of the Brightway Framework. Softw. Impacts 2020, 3, 100012. [Google Scholar] [CrossRef]
Figure 1.
Value chain description with levers.

Figure 2.
GWP variability along the copper value chain: (a) ore grade vs. electricity intensity for mining and beneficiation; (b) ore grade vs. beneficiation recovery for mining and beneficiation; (c) electricity intensity vs. beneficiation recovery for mining and beneficiation; (d) smelting recovery vs. electricity intensity for the smelting and refining stages; (e) smelting technology vs. electricity intensity for the smelting and refining stages; and (f) overall GWP variations along the copper value chain.

Figure 3.
GWP variability in the aluminum value chain as a function of: (a) bauxite ore grade vs. electricity mix; (b) bauxite ore grade vs. alumina recovery, (c) alumina recovery vs. electricity mix intensity, (d) smelting recovery vs. electricity mix intensity; (e) smelting technology vs. electricity mix intensity; and (f) overall GWP variations across aluminum value chain.

Figure 4.
GWP variability on the manganese value chain as functions of: (a) ore grade vs. electricity mix intensity; (b) recovery efficiency vs. electricity mix intensity; (c) smelting recovery efficiency vs. electricity mix intensity; and (d) overall GWP variations manganese value chain.
Figure 4.
GWP variability on the manganese value chain as functions of: (a) ore grade vs. electricity mix intensity; (b) recovery efficiency vs. electricity mix intensity; (c) smelting recovery efficiency vs. electricity mix intensity; and (d) overall GWP variations manganese value chain.


Figure 5.
GWP variability on the LCE value chain as functions of: (a) ore grade vs. electricity mix intensity for spodumene; (b) ore grade vs. recovery efficiency for spodumene; (c) recovery efficiency vs. electricity mix for carbonation via spodumene route; (d) brine grade vs. electricity mix intensity; (e) recovery efficiency vs. electricity mix for carbonation via brine route; and (f) overall GWP variations LCE value chain.

Figure 6.
GWP variability of graphite as a function of: (a) natural graphite ore grade vs. recovery; (b) conversion efficiency vs. electricity mix intensity of synthetic graphite; (c) graphitization furnace and electricity mix intensity; and (d) overall GWP variations graphite value chain.
Figure 6.
GWP variability of graphite as a function of: (a) natural graphite ore grade vs. recovery; (b) conversion efficiency vs. electricity mix intensity of synthetic graphite; (c) graphitization furnace and electricity mix intensity; and (d) overall GWP variations graphite value chain.


Figure 7.
GWP variability of the nickel value chain as a function of (a) ore grade vs. recovery efficiency for mining and concentration; (b) electricity mix intensity vs. recovery efficiency for mining and concentration; (c) electricity mix intensity vs. mine type; (d) smelting/refining recovery efficiency vs. electricity mix intensity; (e) energy efficiency improvements vs. electricity mix intensity; and (f) overall GWP variations nickel value chain.

Publisher’s Note: MDPI stays neutral with regard to jurisdictional claims in published maps and institutional affiliations. |
© 2021 by the authors. Licensee MDPI, Basel, Switzerland. This article is an open access article distributed under the terms and conditions of the Creative Commons Attribution (CC BY) license (https://creativecommons.org/licenses/by/4.0/).
Share and Cite
MDPI and ACS Style
Manjong, N.B.; Usai, L.; Burheim, O.S.; Strømman, A.H. Life Cycle Modelling of Extraction and Processing of Battery Minerals—A Parametric Approach. Batteries 2021, 7, 57. https://0-doi-org.brum.beds.ac.uk/10.3390/batteries7030057
AMA Style
Manjong NB, Usai L, Burheim OS, Strømman AH. Life Cycle Modelling of Extraction and Processing of Battery Minerals—A Parametric Approach. Batteries. 2021; 7(3):57. https://0-doi-org.brum.beds.ac.uk/10.3390/batteries7030057
Chicago/Turabian StyleManjong, Nelson Bunyui, Lorenzo Usai, Odne Stokke Burheim, and Anders Hammer Strømman. 2021. "Life Cycle Modelling of Extraction and Processing of Battery Minerals—A Parametric Approach" Batteries 7, no. 3: 57. https://0-doi-org.brum.beds.ac.uk/10.3390/batteries7030057
Note that from the first issue of 2016, this journal uses article numbers instead of page numbers. See further details here.