
Thermal Analysis of LMO/Graphite Batteries Using Equivalent Circuit Models


Centre d’Energétique et de Thermique de Lyon (CETHIL), UMR 5008, Centre National de la Recherche Scientifique (CNRS), Institut National des Sciences Appliquées de Lyon (INSA-Lyon), University of Lyon, F-69621 Villeurbanne, France
*
Author to whom correspondence should be addressed.
Batteries 2021, 7(3), 58; https://0-doi-org.brum.beds.ac.uk/10.3390/batteries7030058
Submission received: 7 March 2021
/
Revised: 15 June 2021
/
Accepted: 2 August 2021
/
Published: 27 August 2021
(This article belongs to the Special Issue Thermoelectricity and Energy Transfer)
Abstract
:An efficient thermal management system (TMS) of electric vehicles requires a high-fidelity battery model. The model should be able to predict the electro-thermal behavior of the battery, considering the operating conditions throughout the battery’s lifespan. In addition, the model should be easy to handle for the online monitoring and control of the TMS. Equivalent circuit models (ECMs) are widely used because of their simplicity and suitable performance. In this paper, the electro-thermal behavior of a prismatic 50 Ah LMO/Graphite cell is investigated. A dynamic model is adopted to describe the battery voltage, current, and heat generation. The battery model parameters are identified for a single cell, considering their evolution versus the state of charge and temperature. The needed experimental data are issued from the measurements carried out, thanks to a special custom electrical bench able to impose a predefined current evolution or driving cycles, controllable by serial interface. The proposed battery parameters, functions of state of charge (SOC), and temperature (T) constitute a set of interesting and complete data, not available in the literature, and suitable for further investigations. The thermal behavior and the dynamic models are validated using the New European Driving Cycle (NEDC), with a large operating time, higher than 3 h. The measurement and model prediction exhibit a temperature difference less than 1.2 °C and a voltage deviation less than 3%, showing that the proposed model accurately predicts current, voltage, and temperature. The combined effects of temperature and SOC provides a more efficient modeling of the cell behavior. Nevertheless, the simplified model with only temperature dependency remains acceptable. Hence, the present modeling constitutes a confident prediction and a real step for an online control of the complete thermal management of electrical vehicles.
1. Introduction
The climate warming effect is a great societal and social issue in the word. One of the major causes is the pollution induced by the fossil fuel resources used in transportation. As a feedback to this problem, focused interest on electric vehicles has increased in recent years [1]. The batteries are a key component in the development of the electric vehicles. Lithium-ion batteries represent the premium choice of the power source in hybrid electrical vehicles (HEV), plug-in hybrid vehicles (PHEV), and full electrical vehicles (FEV) due to their high energy density, high power density, and low self-discharge rate [2,3,4,5]. However, the development of Li-ion batteries technology is limited by safety restrictions because of their less tolerance to abuse [6,7]. In the case of FEV, a Li-ion battery provides high power and energy densities, but the potential risks of thermal runaway and ageing are omnipresent. For optimal performance, the battery must operate at a controlled temperature between 15 °C and 35 °C, and the temperature distribution in the cells must be as uniform as possible (5 °C variation) [1,7].
A primary concern in the design of TMS is to estimate the heat generation in the cell during driving cycles. Several models reported in the literature allow quantifying the heat generation in the battery cell using different more or less complicated approaches [2,7,8,9,10,11,12]. A battery model can be electrochemical/electrical and thermal coupled or decoupled [1]. The electrochemical models, first developed by Newman’s group [13,14], are one-dimensional physics-based model describing kinetics, transport phenomena, and energy dissipation of the cell. To predict the temperature within the cell, many researchers extend the one-dimensional electrochemical models to consider the multi-scale physics in lithium-ion battery [15]. These models are the most accurate and the closest to actual physics, but they involve nonlinear-coupled equations, leading to a heavy computational work, a large set of material physical properties, and a difficult implementation for an online control strategy. In addition, the cell architecture and components are required to be well known [15,16,17].
The equivalent circuit model (ECM) provides an easy formulation to apprehend the relationship between the inputs and outputs of the battery. It needs only typical electrical components, such as voltage sources, resistance, and capacitor. Common equivalent circuit models used for vehicle batteries are the Rint model (0-order), the Thevenin model (1st-order), and the double polarization model (2nd-order) [1,18,19]. The 0-order model consists of an ideal voltage source in series with a constant internal resistance. It does not include the dynamic behavior of the cell and is recommended for use in the early stage of battery design and sizing [1]. Otherwise, the 1st-order and the 2nd-order models consider the dynamic phenomena due to the transient electrochemical processes and other variables such as the state-of-charge (SOC). They introduce RC branches to simulate battery kinetics and polarization processes. The complexity of these equivalent circuit models can be increased by adding electric passive and nonlinear components able to reproduce battery runtime, transient effects, and nonlinear processes [1,18,19,20]. A huge amount of the literature is devoted to these considerations; a one or two RC block model without a parasitic branch is generally accepted for lithium cells [21], while the Thevenin model has been modified by a slight increase in the circuit elements to provide the Partnership for New Generation of Vehicles (PNGV) model [22].
The parameters of these models (ideal voltage source, resistances, and capacities) can be obtained through two types of experiment: frequency domain tests and time domain tests. The frequency domain tests (or electrical spectroscopy) are used to identify complex models with high accuracy. They allow the cell characterization over a wide frequency range, but they require expensive equipment (impedance analyzer) and are time consuming. However, the time-domain tests are less detailed, but they are more straightforward and can be carried out with conventional electrical measurement equipment [19,23,24,25,26,27,28].
Battery thermal modeling consists of a balance of heat accumulation, heat convection and conduction, and heat generation. The lumped thermal model is frequently used to represent the thermal behavior of batteries. It assumes that the battery is a lumped body with a uniform temperature distribution over the transient heat transfer [5]. The battery heating is generated as a result of activation, concentration, and ohmic losses [28,29]. To estimate the heat generation in the battery, Bernardi [30] formulated a model, balancing the thermodynamic energy in a single cell. This model was adapted early on for lithium-ion batteries [14].
In this work, the electro-thermal behavior of a prismatic 50 Ah LMO/Graphite cell is investigated. This cell is designed to be integrated into an independent 12-cell module, the global battery rack being composed of several modules. The main purpose of the work is the thermal analysis of the LMO/Graphite cell in order to contribute to the optimal sizing of the thermal management system. The methodology adopted is to perform time-domain tests in order to identify the ECM of the cell, use the Bernardi model to estimate the cell thermal load, and perform the thermal analysis.
A special experimental bench is developed to run the batteries under monitoring conditions (temperature, voltage current, and state of charge). The measured data are then introduced to identify the ECM parameters as a function of temperature and SOC; the ECMs of the 0-, 1st-, and 2nd-order have been obtained and compared. The identified ECMs have been validated over the whole range of SOC evolutions by repeating the New European Driving Cycle (NEDC). This allowed us to compare the ability of the three proposed models to describe the electrical behavior of the battery cell. The analysis is performed from the simplest model to the most complex one, and the role of both temperature alone and temperature coupled with the SOC are clearly quantified. The 1st-order model is chosen to perform the thermal analysis. Due to the limited knowledge on the cell internal structure, the cell is considered as a homogeneous body and the cell temperature is supposed to be uniform. The results given by the Bernardi model and the measurements are compared, and acceptable agreement is observed.
2. Model Description
2.1. Equivalent Circuit Model
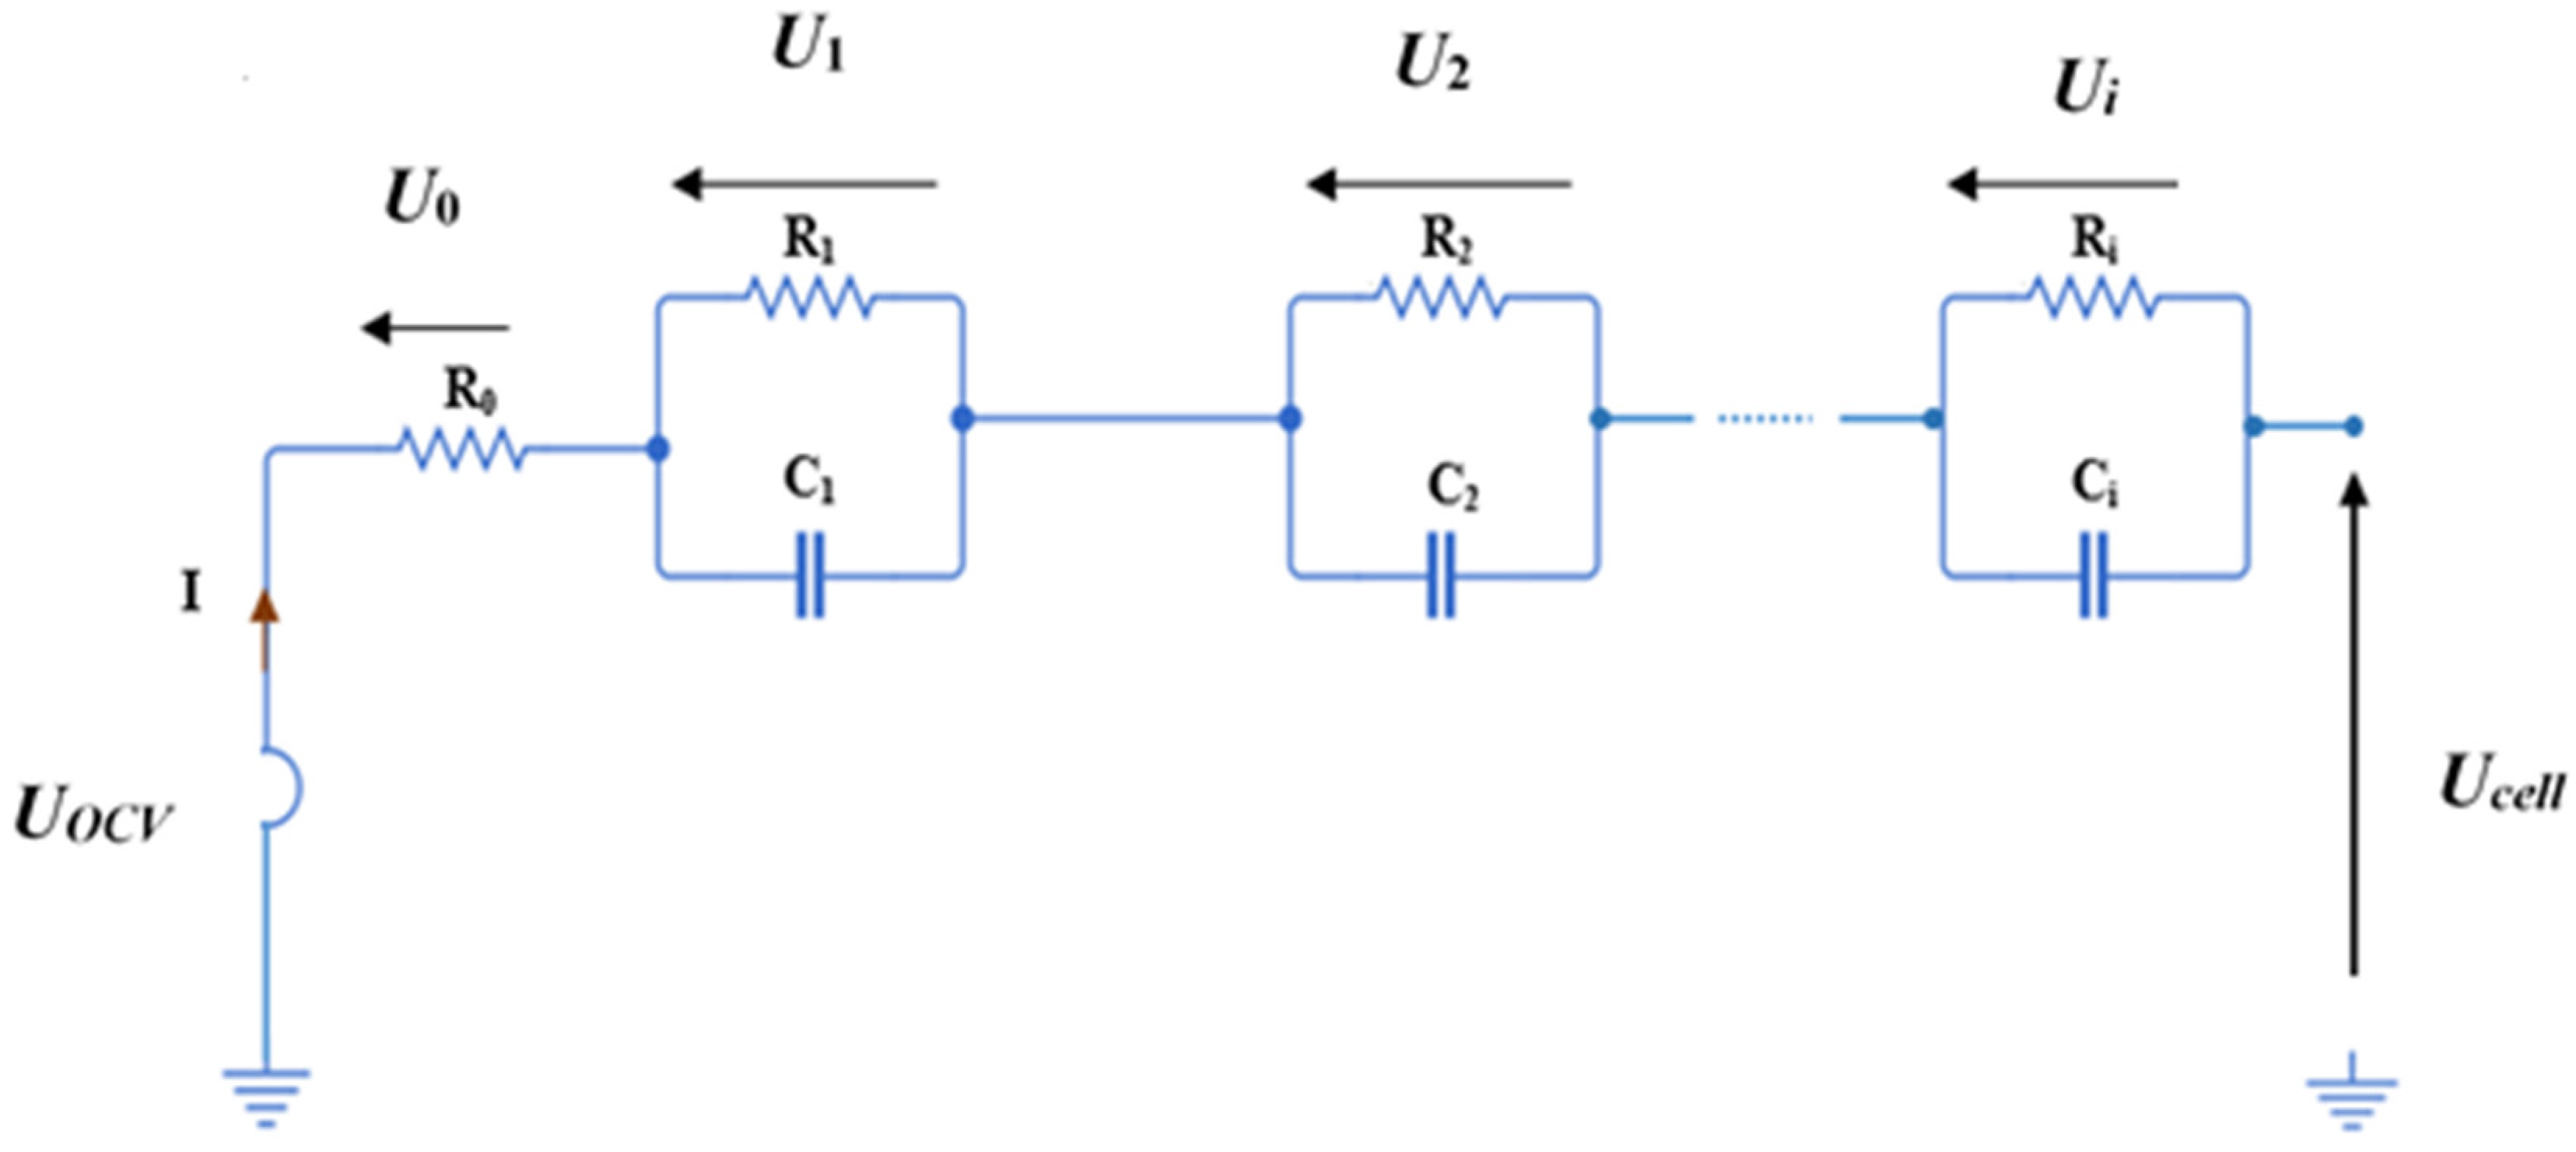
To examine the electro-thermal behavior of the battery, an ECM approach has been used. Several orders have been tested (0-, 1st-, and 2nd-order). Therefore, the ith order ECM diagram is represented in Figure 1. The open cell voltage, UOCV, is a function of SOC and it is given by the cell manufacturer (see Figure 2 for the data of an LMO/Graphite cell). However, the Ohmic resistance (R0) and the RC parallel network are highly dependent upon the SOC and temperature.
The electrical behavior of the battery can be expressed using the following equations. The voltage across R0 is:
where I is the load current. The voltage across the RC layer I is:
and the cell terminal voltage is:
The ECM parameters are R0, Ri, and Ci, and should be identified. The parameter identification process is the following:
- Cycling of the cell with current profiles (steps, pulses, complex cycles…);
- Measurement of the cell terminal voltage;
- Parameter identification: adjust parameters until a good fit between measurements and model response.
2.2. Thermal Model Formulation
Under solicitation, the heat is generated within the active material of the cell and the heat transfer is allowed between the external surface and enclosing medium. The temperature distribution inside the cell domain is described by the energy equation:
where t is the time, T is the cell temperature, ρ is the density, Cp is the heat capacity, k is the thermal conductivity, and q′ is the heat generation rate per unit volume. The thermo-physical properties of the battery (ρ, Cp, and k) have been identified experimentally [35]; in fact, they are only the equivalent properties because the battery cell is considered as a homogeneous body. Therefore, only the measured values are summarized, as follows: the thermal capacity is 817.5 J·kg−1·K−1 and the density is 2205 kg·m−3, the longitudinal thermal conductivity is 1.86 m−1·K−1, the transverse thermal conductivity is 3.14 W·m−1·K−1, and the high thermal conductivity is 1.14 W·m−1·K−1.
The heat transfer between the cell and its surrounding is controlled by the cell surface, S, and the heat transfer coefficient, h.
If the cell is supposed at the same temperature, there is no thermal gradient in the cell, and Equation (4) can be simplified into:
where V is the cell volume and Tamb is the ambient temperature.
The heat generation is assumed to be homogeneous in the active material (cell). It is given by the Bernardi model [30] and expressed as follows:
The irreversible term (q′irrev > 0) represents the cell polarization heat (Ohmic losses and reaction resistances) and it is given by:
The reversible term (q′rev > 0 or < 0) is the entropic heat that reflects the changes in the atomic arrangement of the electrode host materials as charge/discharge progresses:
where represents the entropic coefficient and is related to the electrode host materials.
3. Identification Procedure, ECMs, and Validation
3.1. Identification Procedure
To extract all the parameters in the proposed model, a battery test system and an experimental procedure were designed to measure battery behavior conveniently and efficiently.
As shown in Figure 3, an electric bench was developed in the laboratory in collaboration with EVE system company. The specific electric station allows charging and discharging the battery cell, simulating the real operation conditions and measuring the several parameters of the cell (cell voltage, SOC, positive terminal temperature …). Software was developed to ensure the data acquisition and also the test programming on the cells, via the electrical bench. Therefore, the software monitors battery temperature and samples battery voltage and current once per time step to obtain charge and discharge curves.
A LEV50N [31] Lithium Manganese Oxide (LMO/Graphite) battery was used to perform the electric circuit characterization; it has a nominal capacity of 50 Ah. The maximum allowable voltage is 4.2 V and the minimum is 3.4 V. The maximum charging current is 100 A (+2C) and the maximum discharging current is 150 A (−3C). It was tested at room temperature.
After testing various current profiles and the corresponding parameter identifications, the focus has been on a current profile consisting of charging (C, 2C), discharging (−3C, −2C, −C), and rest periods allowing relaxation of the cell chemistry (Figure 4). This profile discharges more of the cell than it charges it and is designed to discharge a fully charged cell to a SOC level of about 0.1 at the end of 10,000 s so as to cover the whole SOC range. In Figure 4a, due to the inertial response of the cells and the limitation of the changes in voltage tension (maximum is 4.2 V and minimum is 3.4 V) during charging or discharging, there is a delay in the response of the cells. Some imposed current steps are different from the measured cells. This cell’s behavior disappears with the battery cycling and SOC reduction (Figure 4b), while the gauge of the voltage tension is respected, as detailed in Table 1.
Note that some overshoots are observed when changing the current intensity. This is due to the response of the automatic controller (PID) used to cope with the voltage limitations in this study. Of course, it did not affect the identification parameters, as identifications are made with and without those overshoots, and finally they were avoided after processing.
For the final test performed to identify the ECMs, the cell is initially fully charged and the profile in Figure 4 is applied. In order to obtain the optimal values of the ECM parameters, the Nelder–Mead method [32,33], also called the simplex method, is used to estimate the parameters of each model. This simplex varies slowly with each parameter regarding the RMSD (cf. Equation (9)) between numerical and experimental results. A Matlab code has been elaborated to identify and optimize the values of the ECM parameters.
where and represent, respectivel, the theoretical values and the measured ones and n the number of the measurements.
The Nelder–Mead method is a nonlinear optimization algorithm that was published by J. Nelder and R. Mead in 1965 [32]. It is a numerical method that aims to minimize a continuous function in a space with several dimensions. In our case, this is the Root Mean Squared Difference (RMSD) between the measurement and the calculation of the voltage applied during the charging and discharging of the batteries.
Compared to other methods, such as neural networks or the Lavenberg–Macquardt method, this method has the advantage of being easy to implement, with faster calculation times. It applies to a continuous function without having to evaluate its derivatives and is therefore effective for a non-differentiable function or one with a lot of noise, even though it suffers from a drawback due to its sensitivity to local optimums, but this is generally easily solved by restarting the calculation from the last set of calculated parmeters until reaching the overall optimum. Details of this method can be found in [33]. It is often implemented as a preprogrammed function in a lot of software. In our case, it is thus used under the Matlab software.
As reported in Section 1, the parameters in the ECM models are multivariable functions of SOC, current, temperature, and number of cycles (ageing). This dependence provides a high nonlinearity in the model and make the model extraction hard and the test process long (i.e., hundreds of cycle measurements at various temperatures). Therefore, some auxiliary parameters are simplified or ignored because they have only slight effects in Li-ion batteries, this is the case for usable capacity dependence and number of cycles, as suggested in [20].
Cell temperature and SOC are important parameters; the ECM parameters dependent on the cell temperature and SOC are also identified. The SOC is calculated by Coulomb integration:
For a fully charged battery cell, is equal to 1 and the cell SOC decreases from 1 during the test.
After several identifications of parameters using different proposed models, it turns out that only R0 relies heavily on the cell temperature and that the SOC dependency is weak for almost all the parameters. Note that temperature inside the cell cannot be measured and that, using the assumption of a homogeneous temperature over the cell volume, the cell temperature evolution is measured through the positive electrical terminal.
3.2. Equivalent Circuit Models
As stated previously, in the following, the three identified ECM models with temperature dependent R0 will be presented (Rint model, Thevenin model, and DP model), and a fully temperature and SOC dependent ECM will be given in order to highlight the importance of the parameter’s temperature and SOC dependency in the models.
3.2.1. Temperature-Dependent ECMs
The Rint model (0-order) is the simplest model and involves a voltage source UOCV and an internal resistance R0 (Figure 5).
The internal resistance of the battery is the sum of the resistances across the solution and the insulation layers, which depends on temperature and SOC. The Ohmic resistance of the battery, depending on the cell temperature, can be determined experimentally using the procedure listed in [31]. The only parameter, R0, is identified by minimizing the RMSD and given by:
where T is in (K).
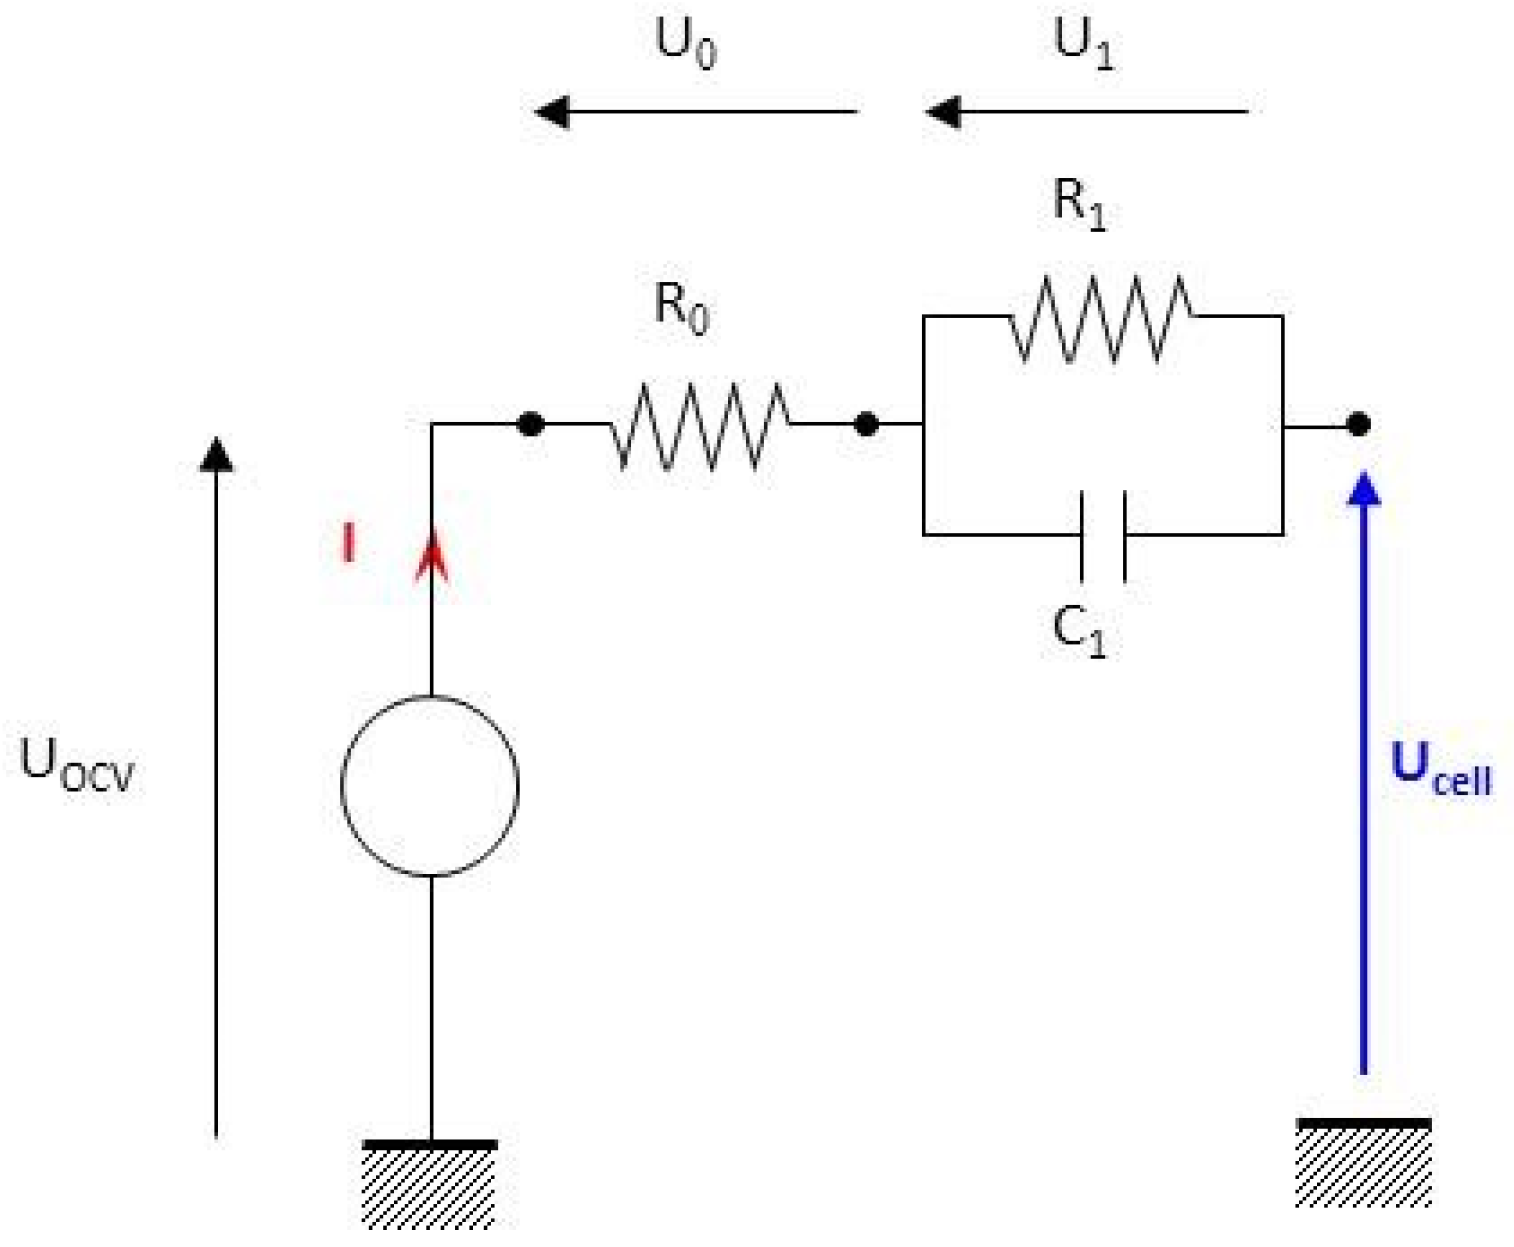
The Thevenin model is a 1st-order model that combines a source voltage and an internal resistance with an RC branch. The last one is added to better model the transient aspect during charging and discharging (Figure 6).
In this case, identifying more parameters and increasing the physical accuracy of the model leads to more calculation difficulties.
After a minimization procedure, the results obtained are:
where T is in (K).
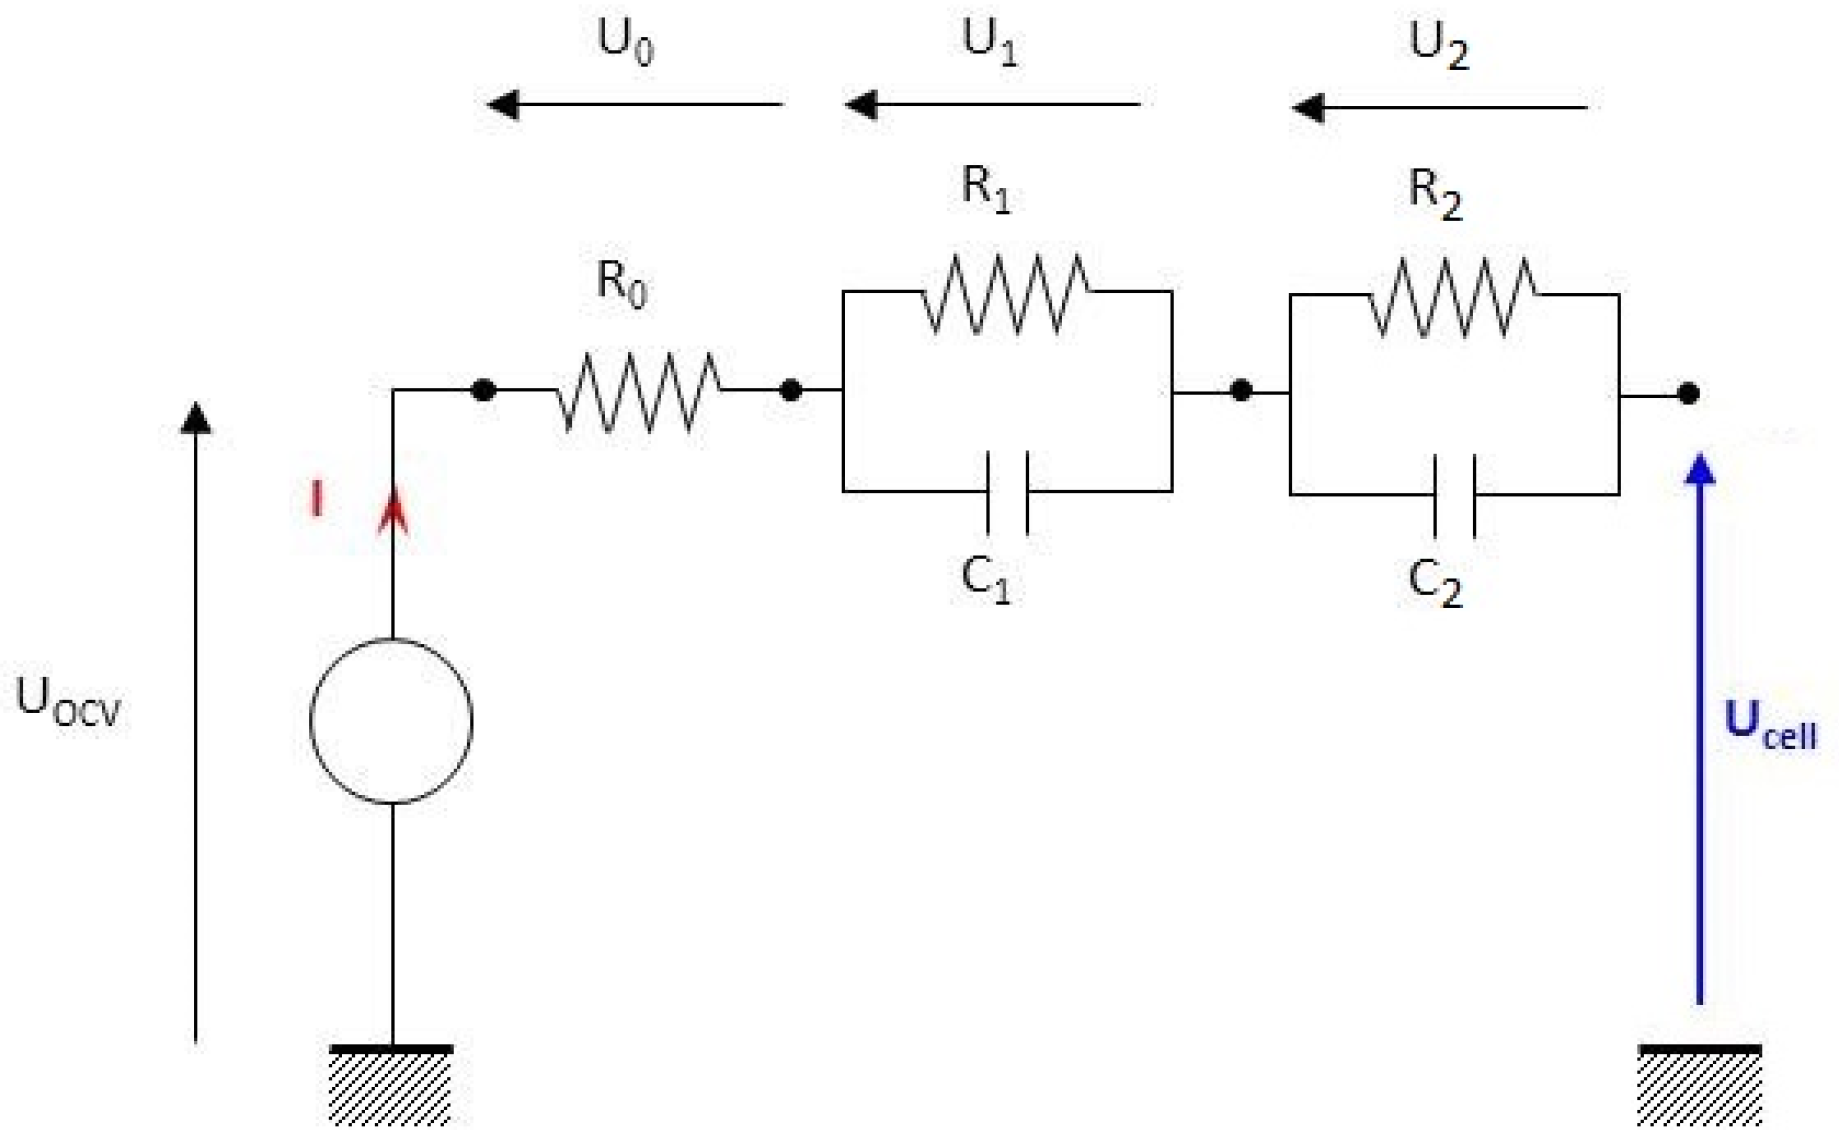
The dual polarization (DP)-model is a 2nd-order model and consists of one internal resistance and two parallel RC branches (Figure 7); it allows representation of the polarization phenomenon (activation and concentration polarization). With two RC branches, the accuracy of the model has been increased, but its complexity is also increased.
After identification, the parameters are given as follows:
where T is in (K).
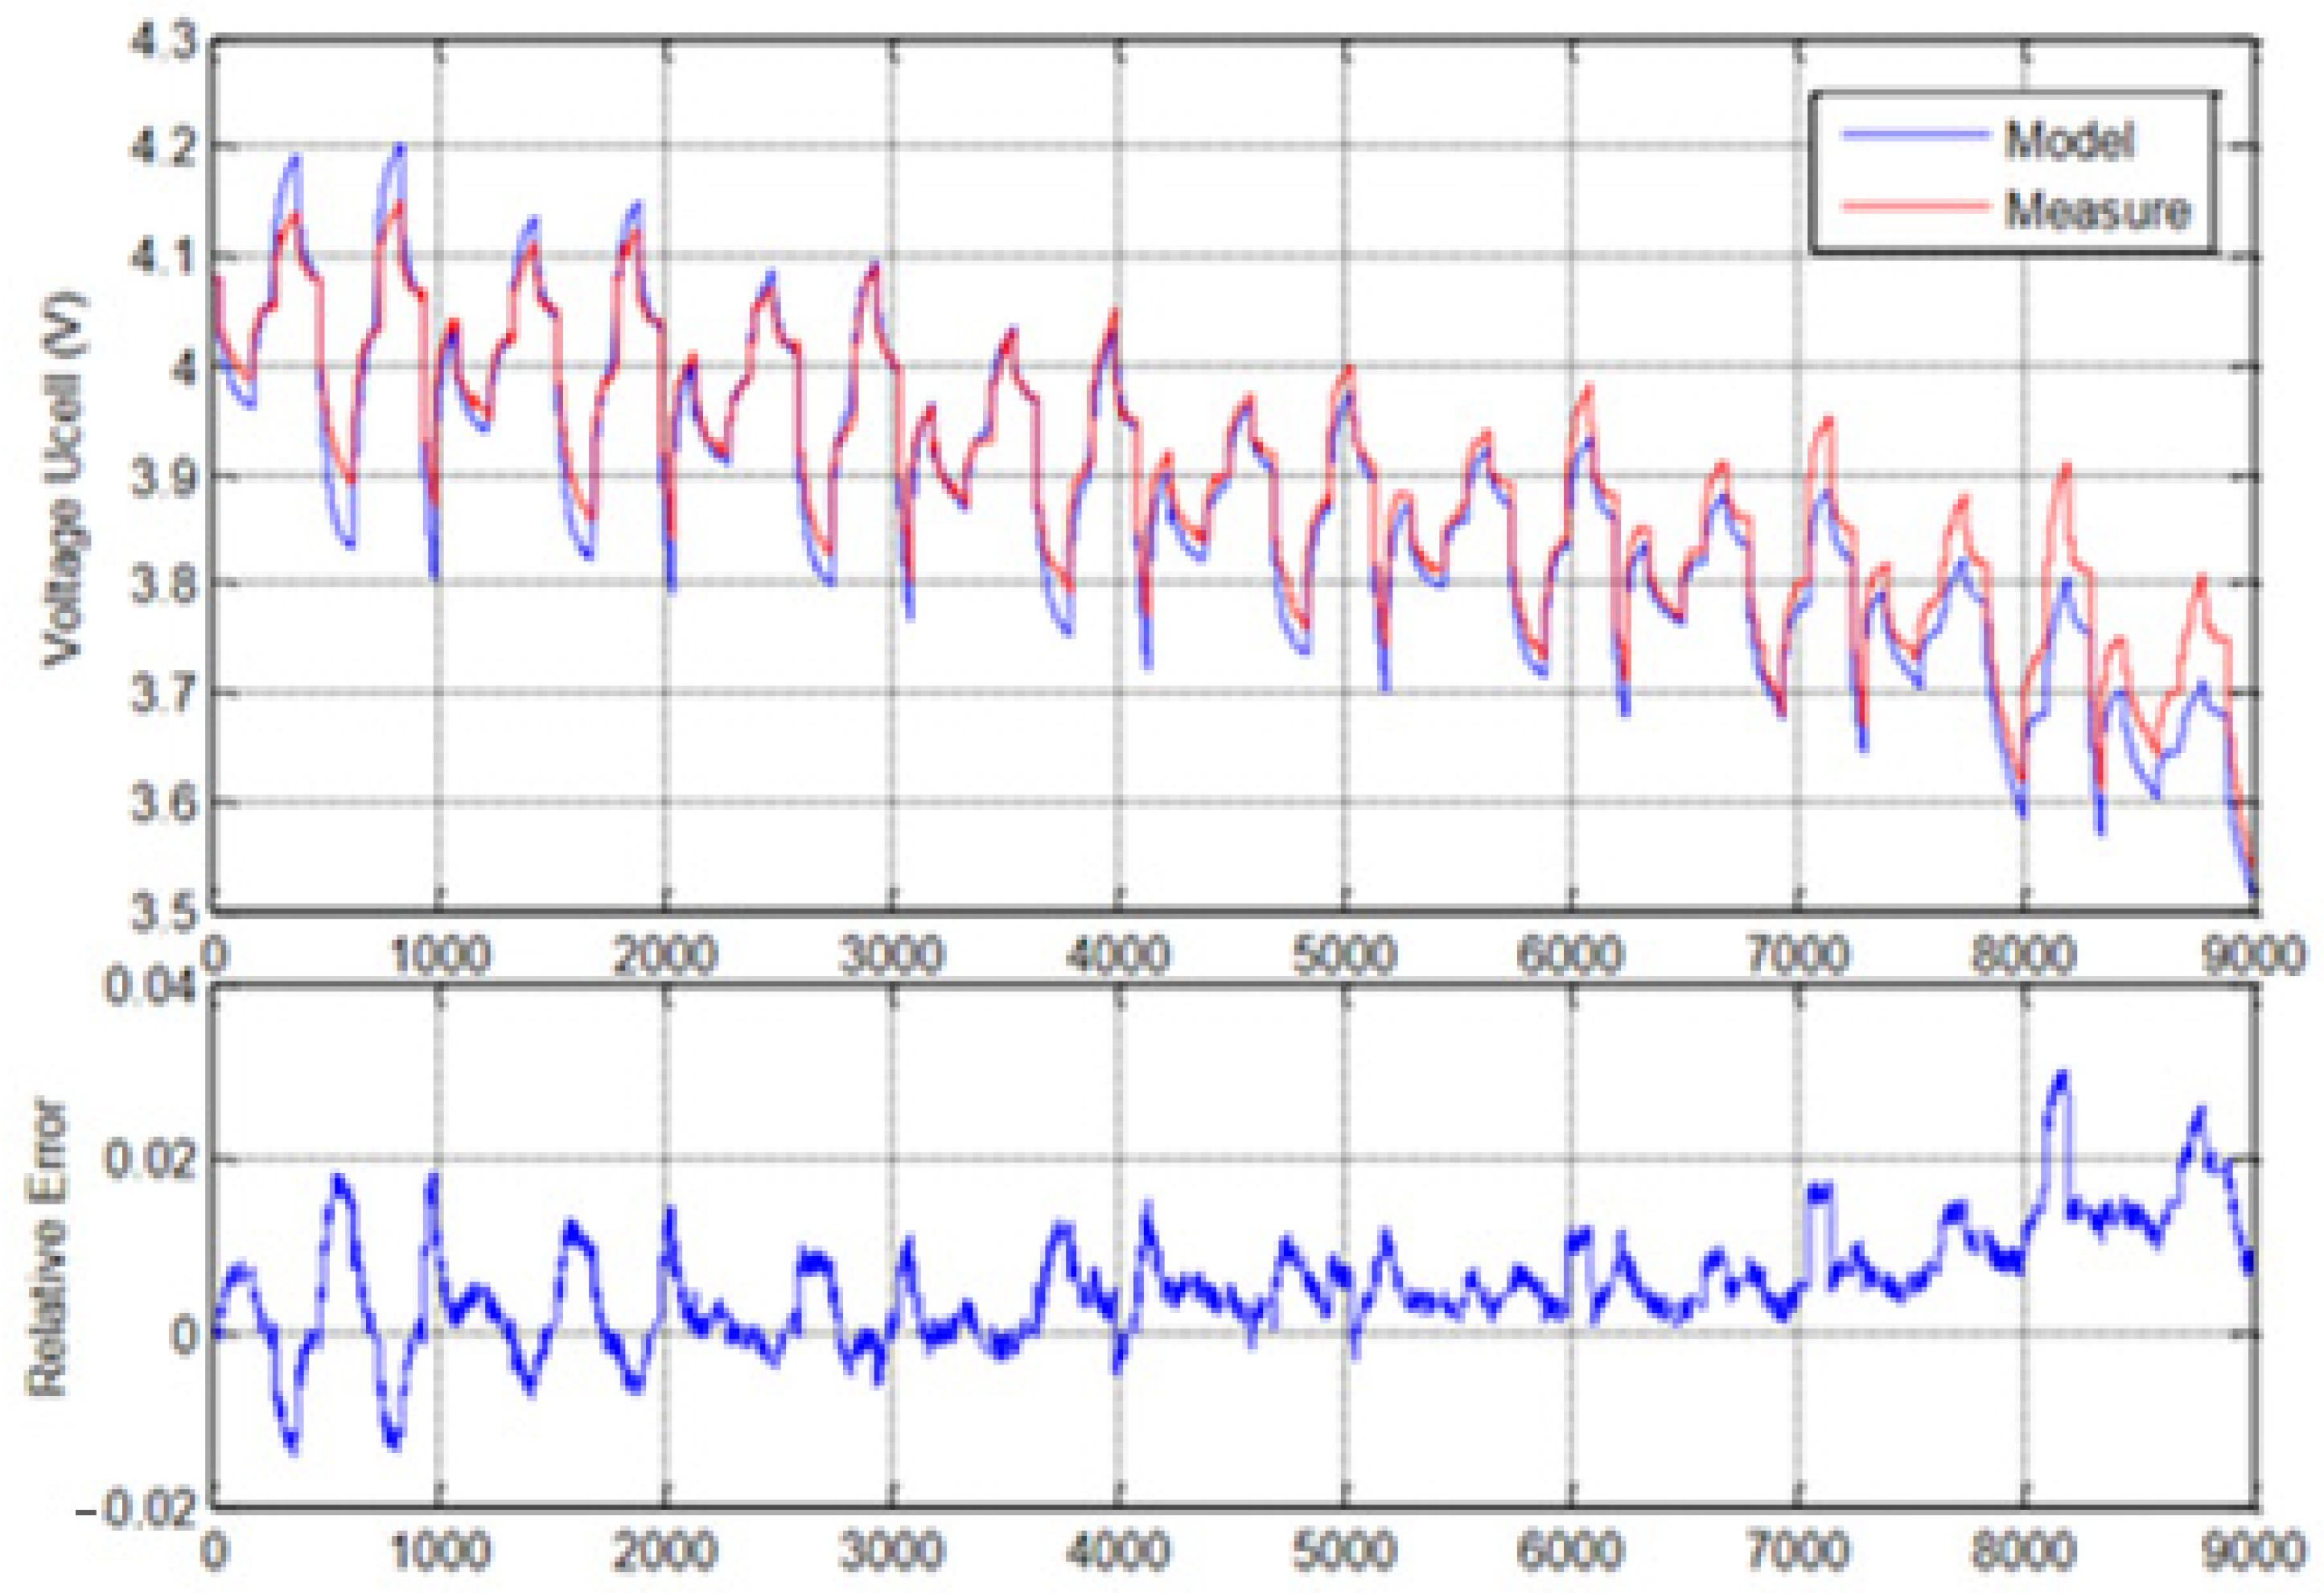
To give an idea of the quality of the obtained ECMs, the cell terminal voltage given by the Thevenin model obtained by using the current profile of Figure 4 is displayed in Figure 8, together with the measurement and the relative error of the Thevenin model. It can be seen that the peak (maximum) error of the identified Thevenin model is about 3%. The quality of the identified model is thus reasonable.
3.2.2. Temperature and SOC-Dependent ECM
After establishing the models with only one parameter R0 depending on temperature, it is possible to check the sensitivity of the ECM model regarding the SOC and temperature considered. For this purpose, a 1st-order model (Thevenin model) with an internal resistance and one RC branch is used, and its parameters are identified following the previous detailed method. Different dependencies on the temperature and SOC are studied, and finally only the linear dependency is kept. Furthermore, a distinction is made between the charging and discharging steps.
The minimization processes lead to the following parameters:
- Cell charging (I > 0):
- Cell discharging (I < 0):
It can be observed that simultaneously considering the effects of temperature and SOC provides a more complex model, which should provide a more faithful modeling. From the above expression, it can be seen that the dependence of R0 on the temperature is more important than that of R1 and C1, and that it is also more important than the dependence on SOC of all the parameters. This indicates that the leading order model, with a temperature dependence of only R0, is sufficient to describe the main behavior of these batteries and confirms the choice made for the temperature-dependent models.
3.3. Validation Tests
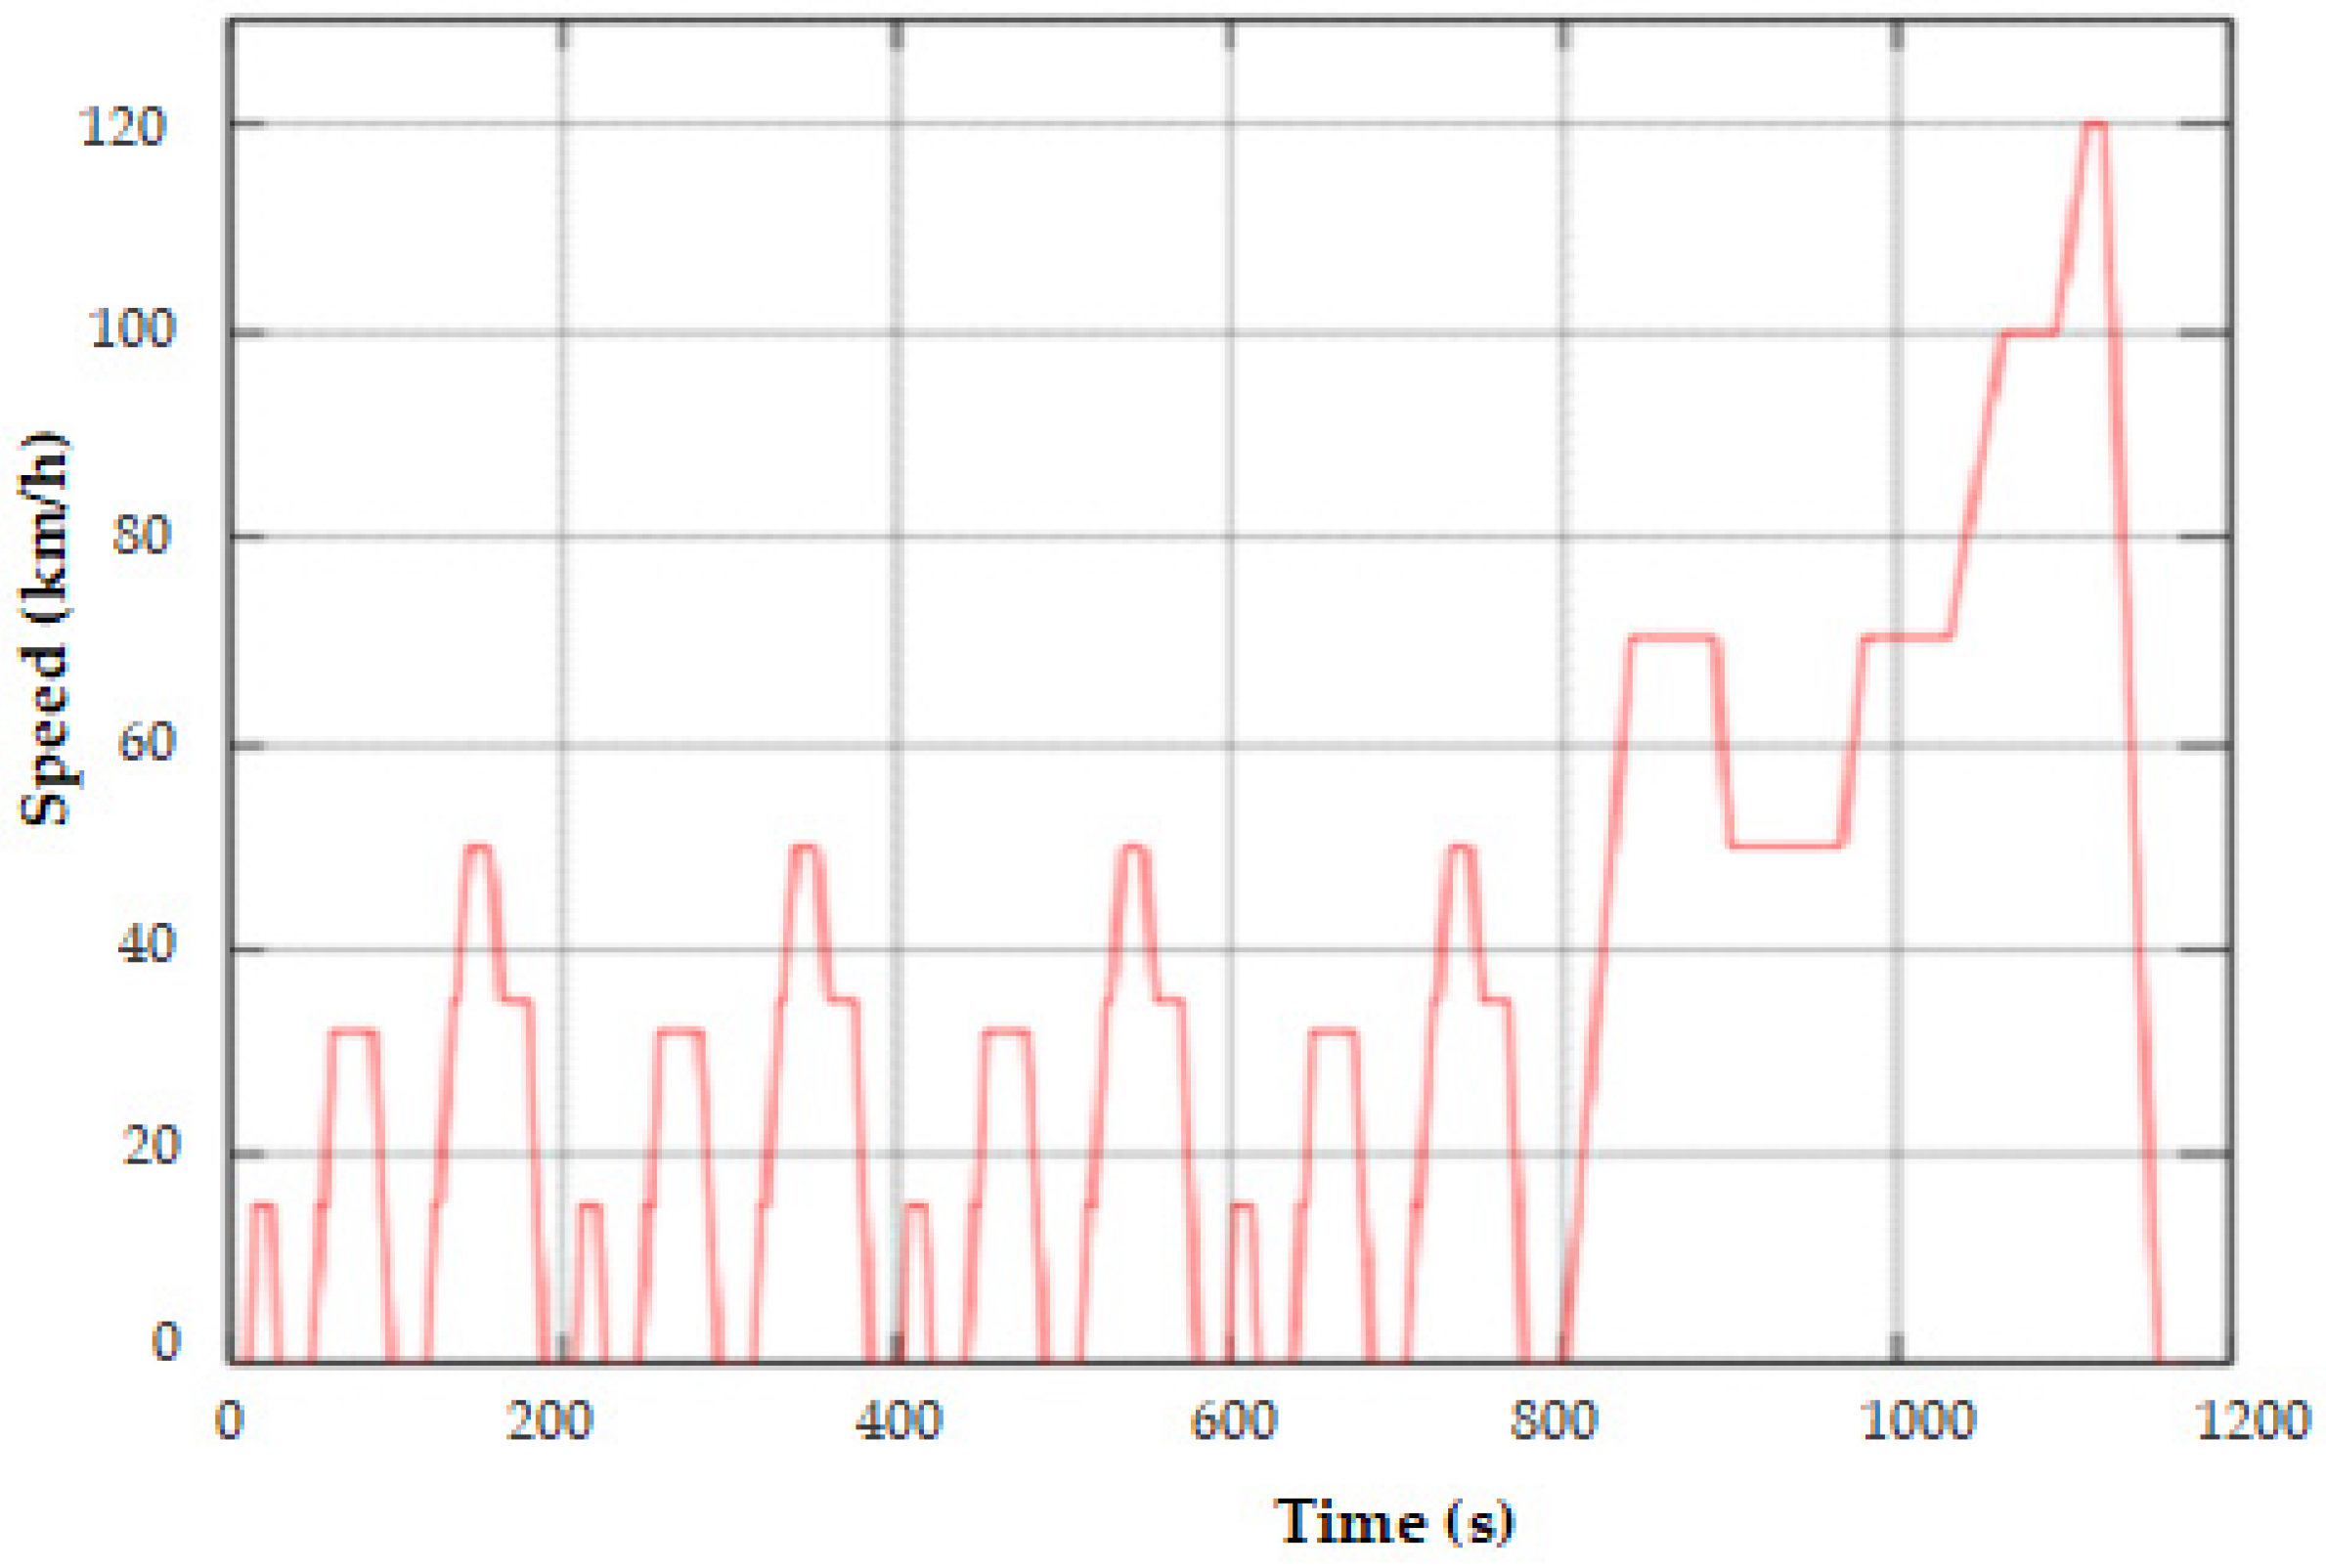
In order to show the validity of the identified ECMs, this study focuses on the New European Driving Cycle (NEDC) because its successive application allows one to work on a large SOC domain. The NEDC represents a typical driving cycle of a car in Europe, although it is not completely realistic. It consists of four repeated urban driving cycles and one extra-urban driving cycle, as is illustrated in Figure 9.
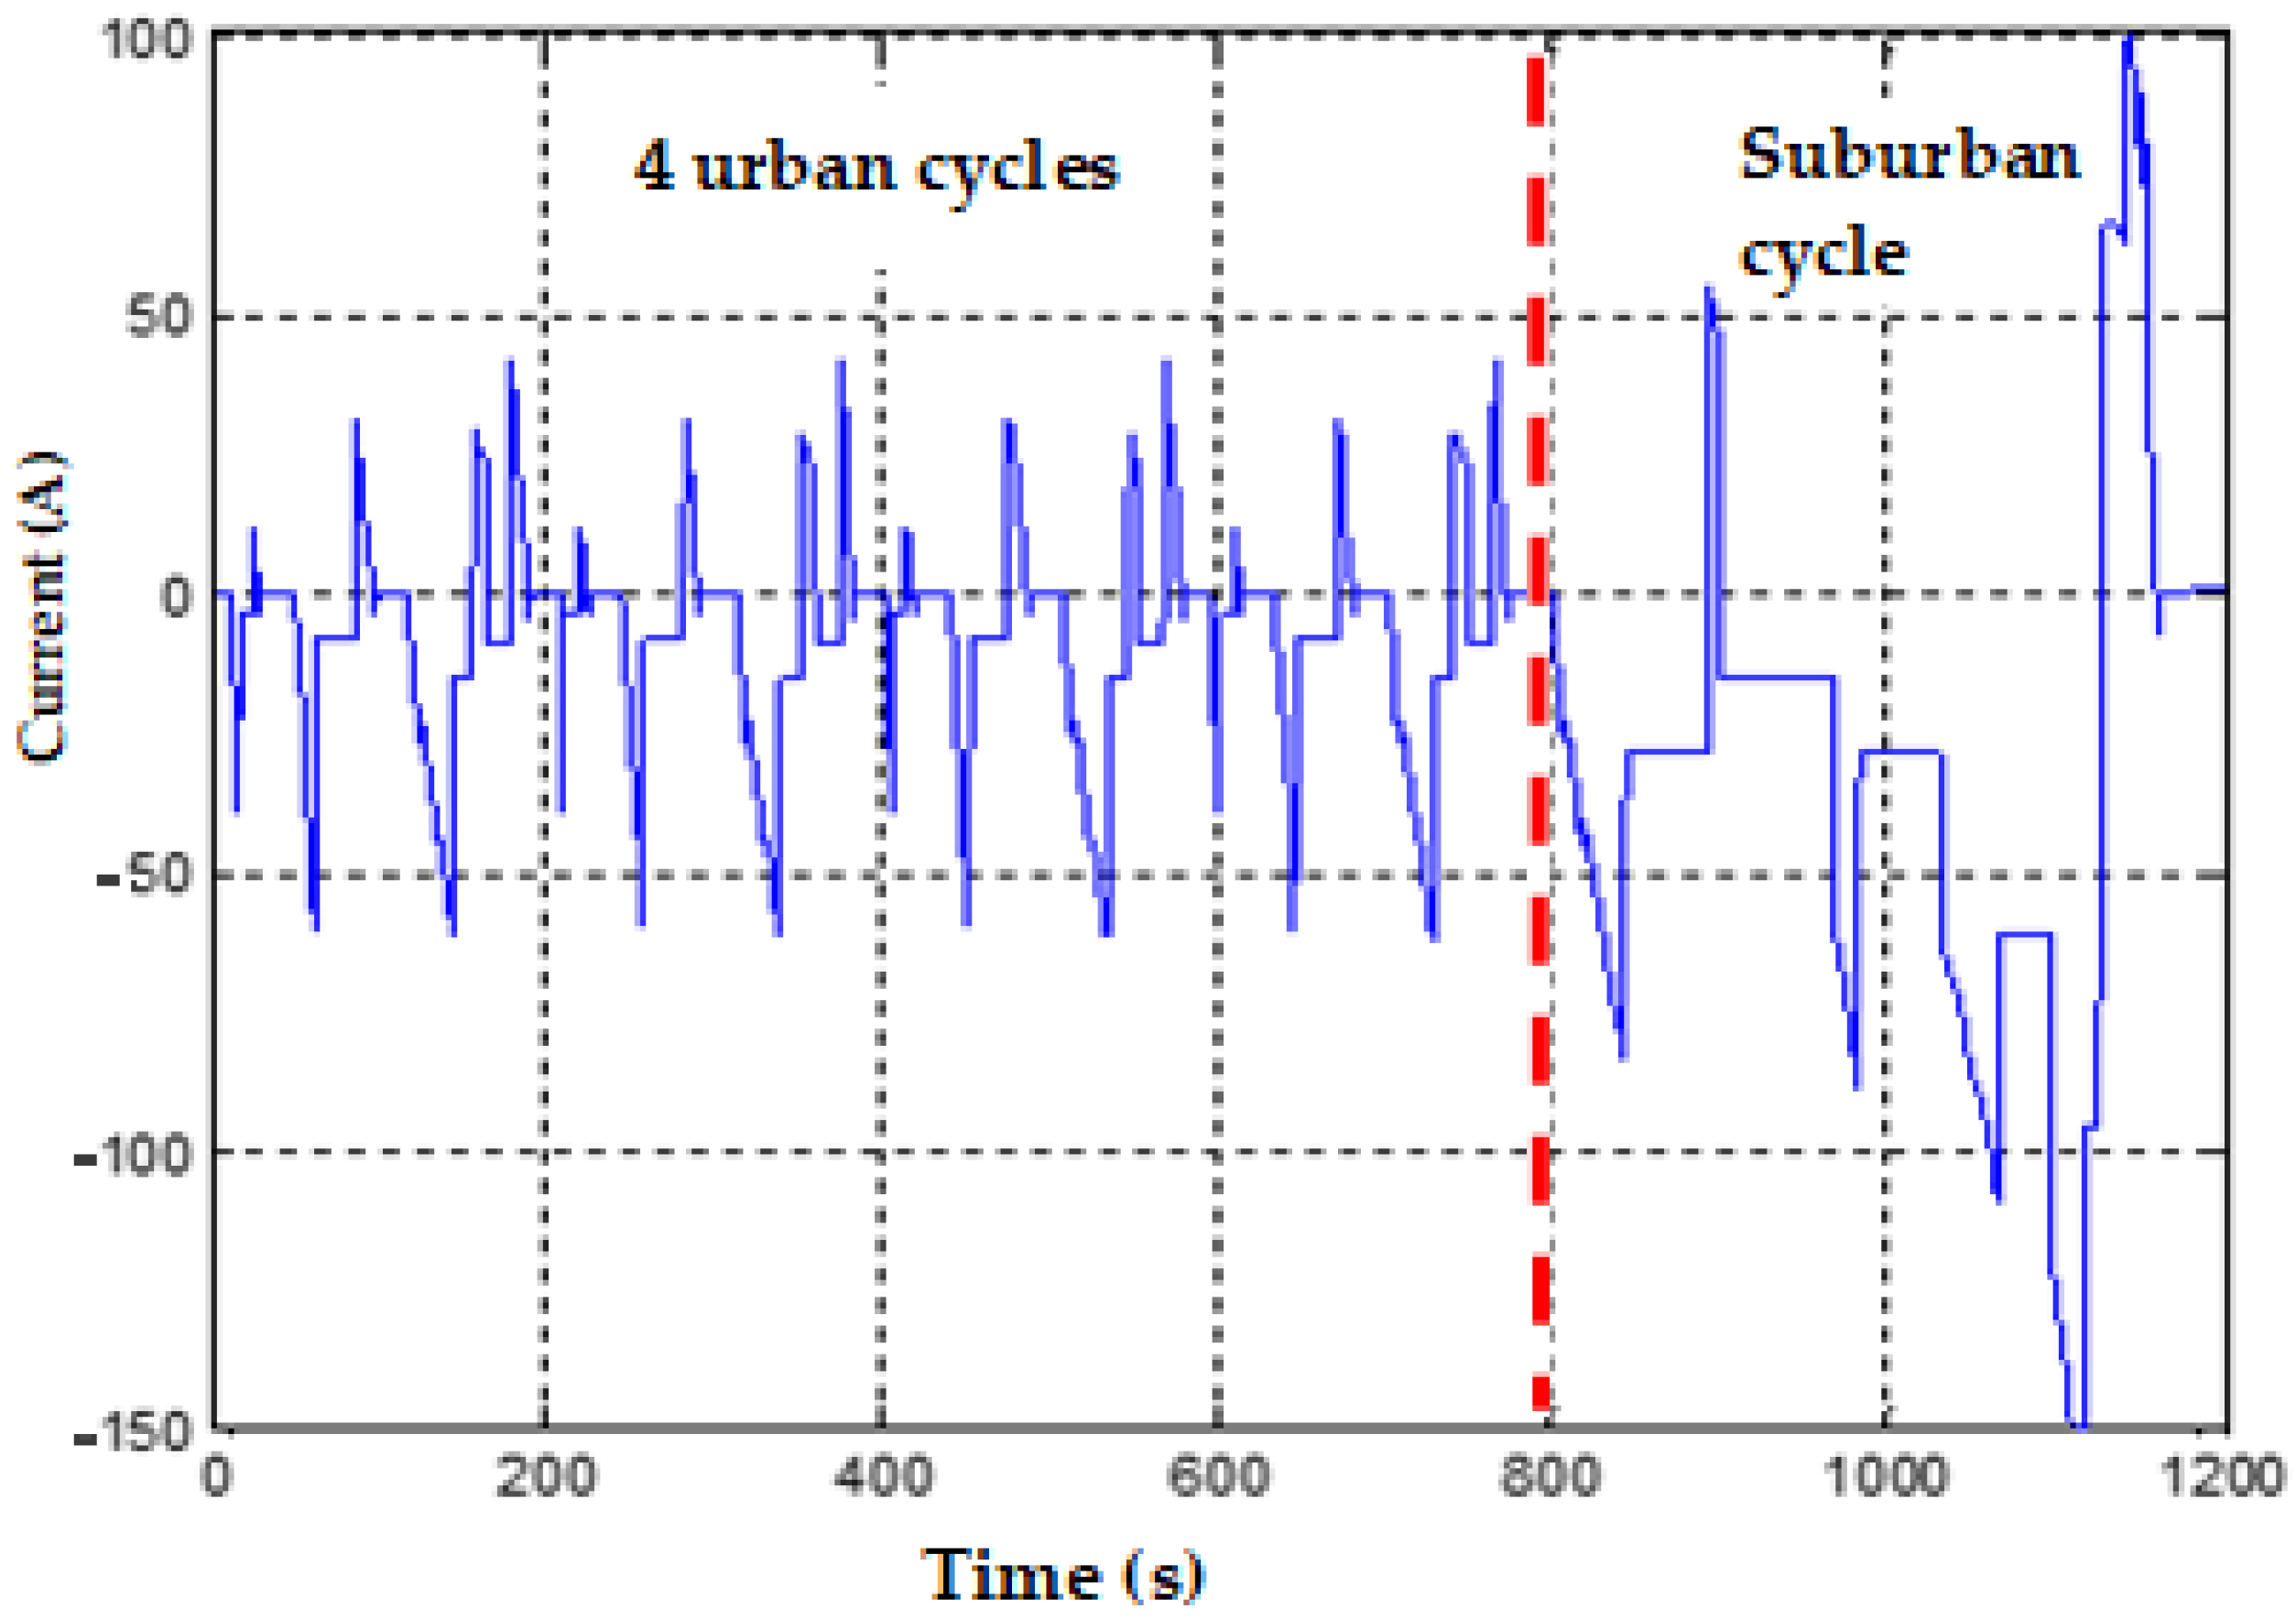
For the conversion from vehicle speed to battery current, the method consists of estimating the power decrease/increase for a step of time, giving the increase/decrease in kinetic energy. The power variation due to the vehicle acceleration/deceleration is a balance of the vehicle weight force, the rolling resistance, the drag resistance, and also the incline of the road. By dividing this power balance by the voltage, the equivalent current intensity is then obtained. For cell characterization, the kinetics energy due to the speed is directly converted to power versus time, and then to current evolution versus time; see [34] for more details.
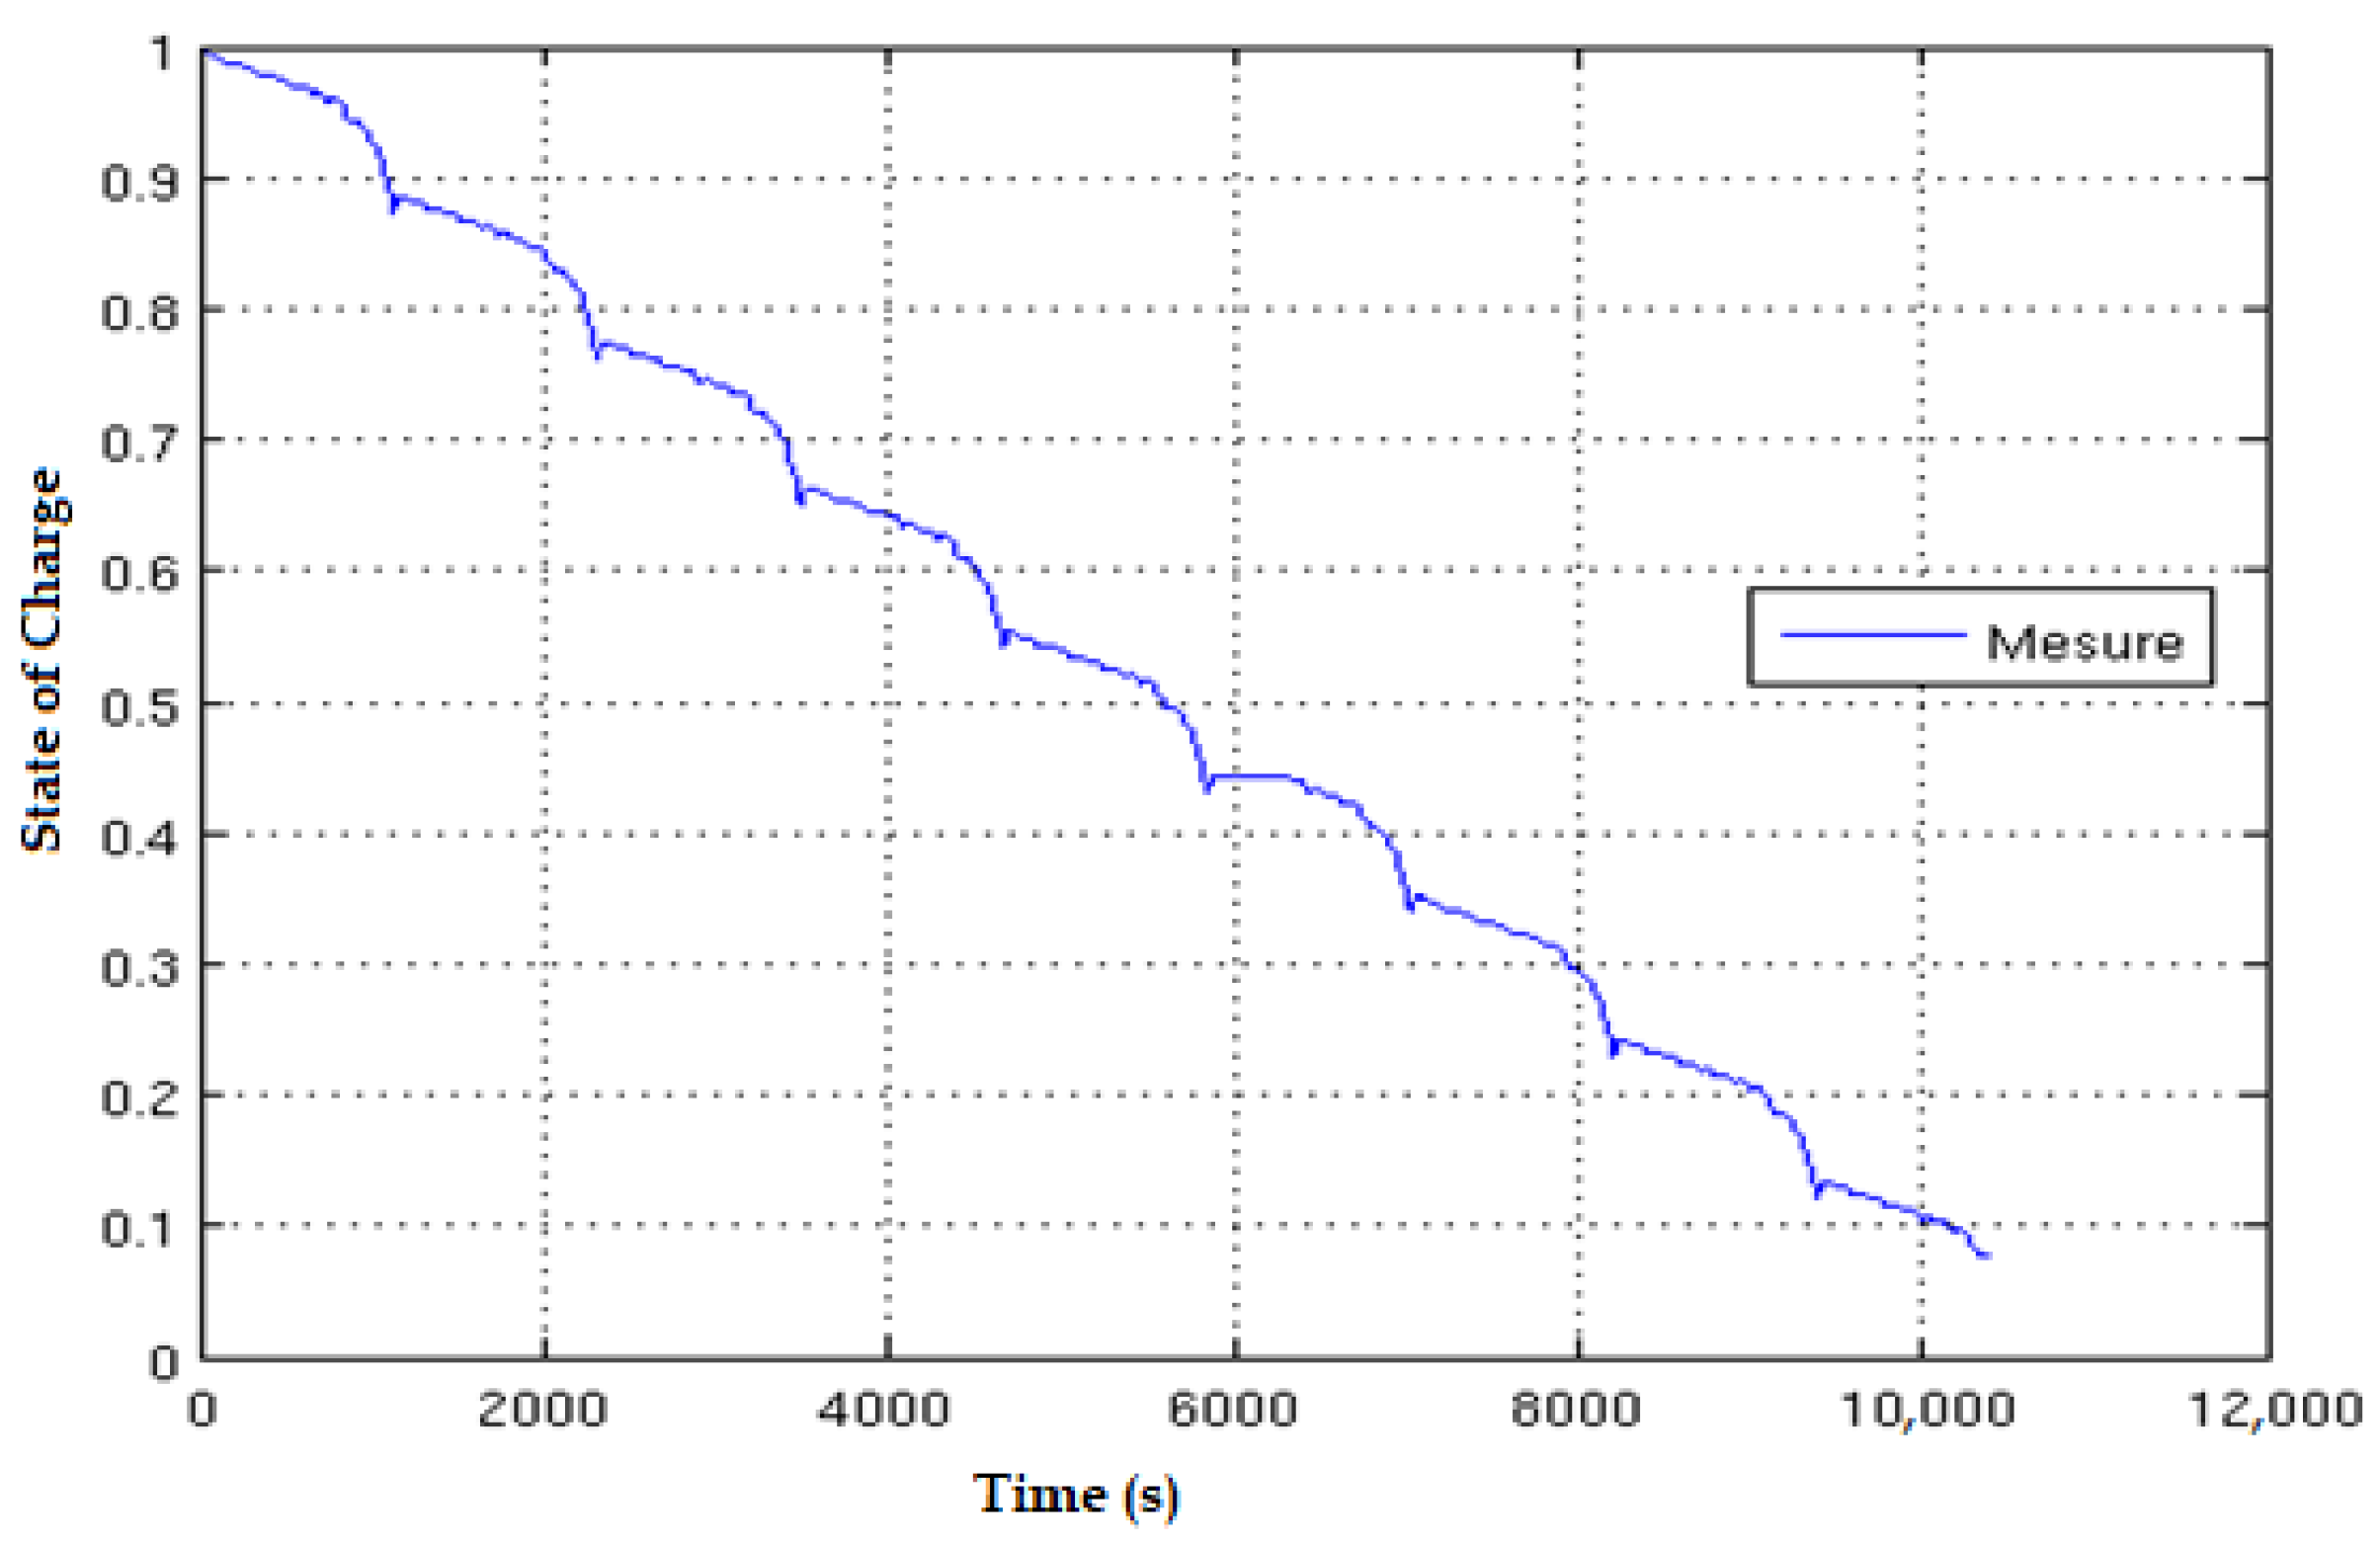
The translation of the NEDC speed chart into current steps is shown in Figure 10; it is possible to observe an altering of the current steps and the resting periods, allowing relaxation of the cell chemistry. Eight successive NEDC cycles are applied to a fully charged cell, and the corresponding SOC evolution is represented in Figure 11. The SOC ranges from 1 at the beginning to 0.08 at the end of the 8 NEDC cycles; it covers almost the whole SOC range.
The ECMs identified above are applied to the 8 NEDC cycles to estimate the cell terminal voltage. Figure 12 displays the estimated terminal voltage by applying the Rint model and compares it with the measured terminal voltage. The relative error shown in the same figure displays a peak error of 4%. Despite its simplicity, the prediction of the simplest model with an internal resistance remains acceptable.
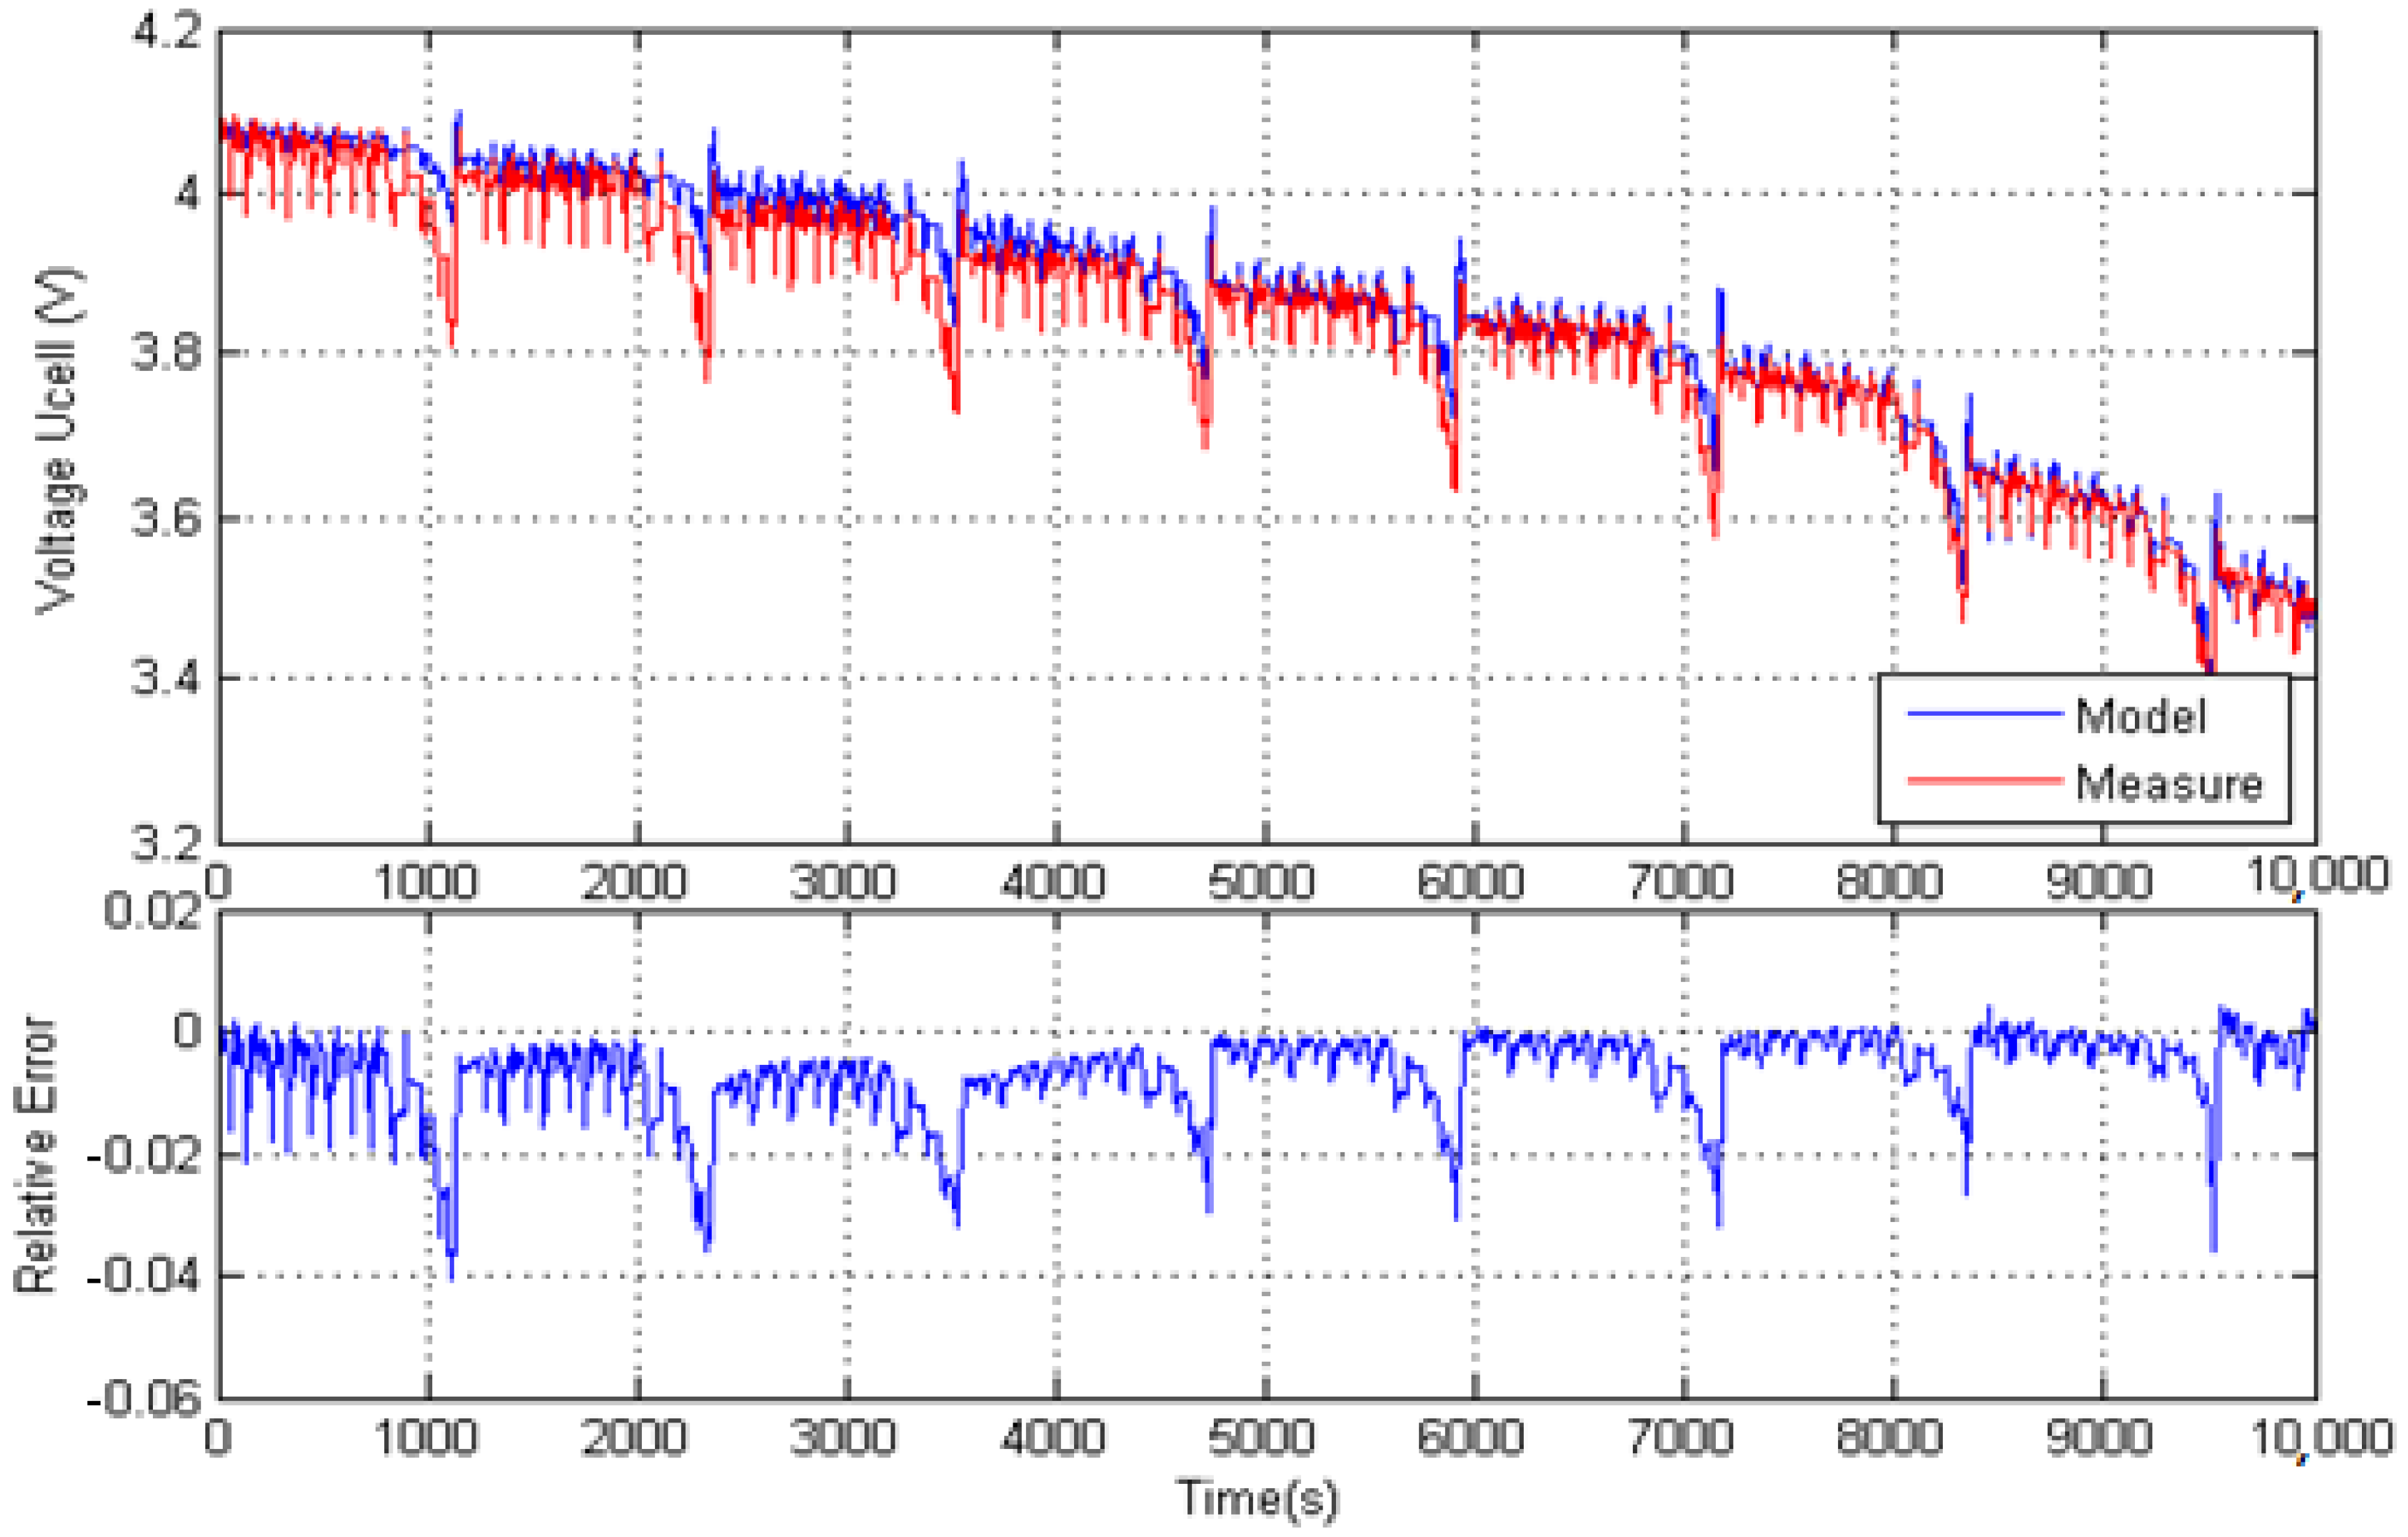
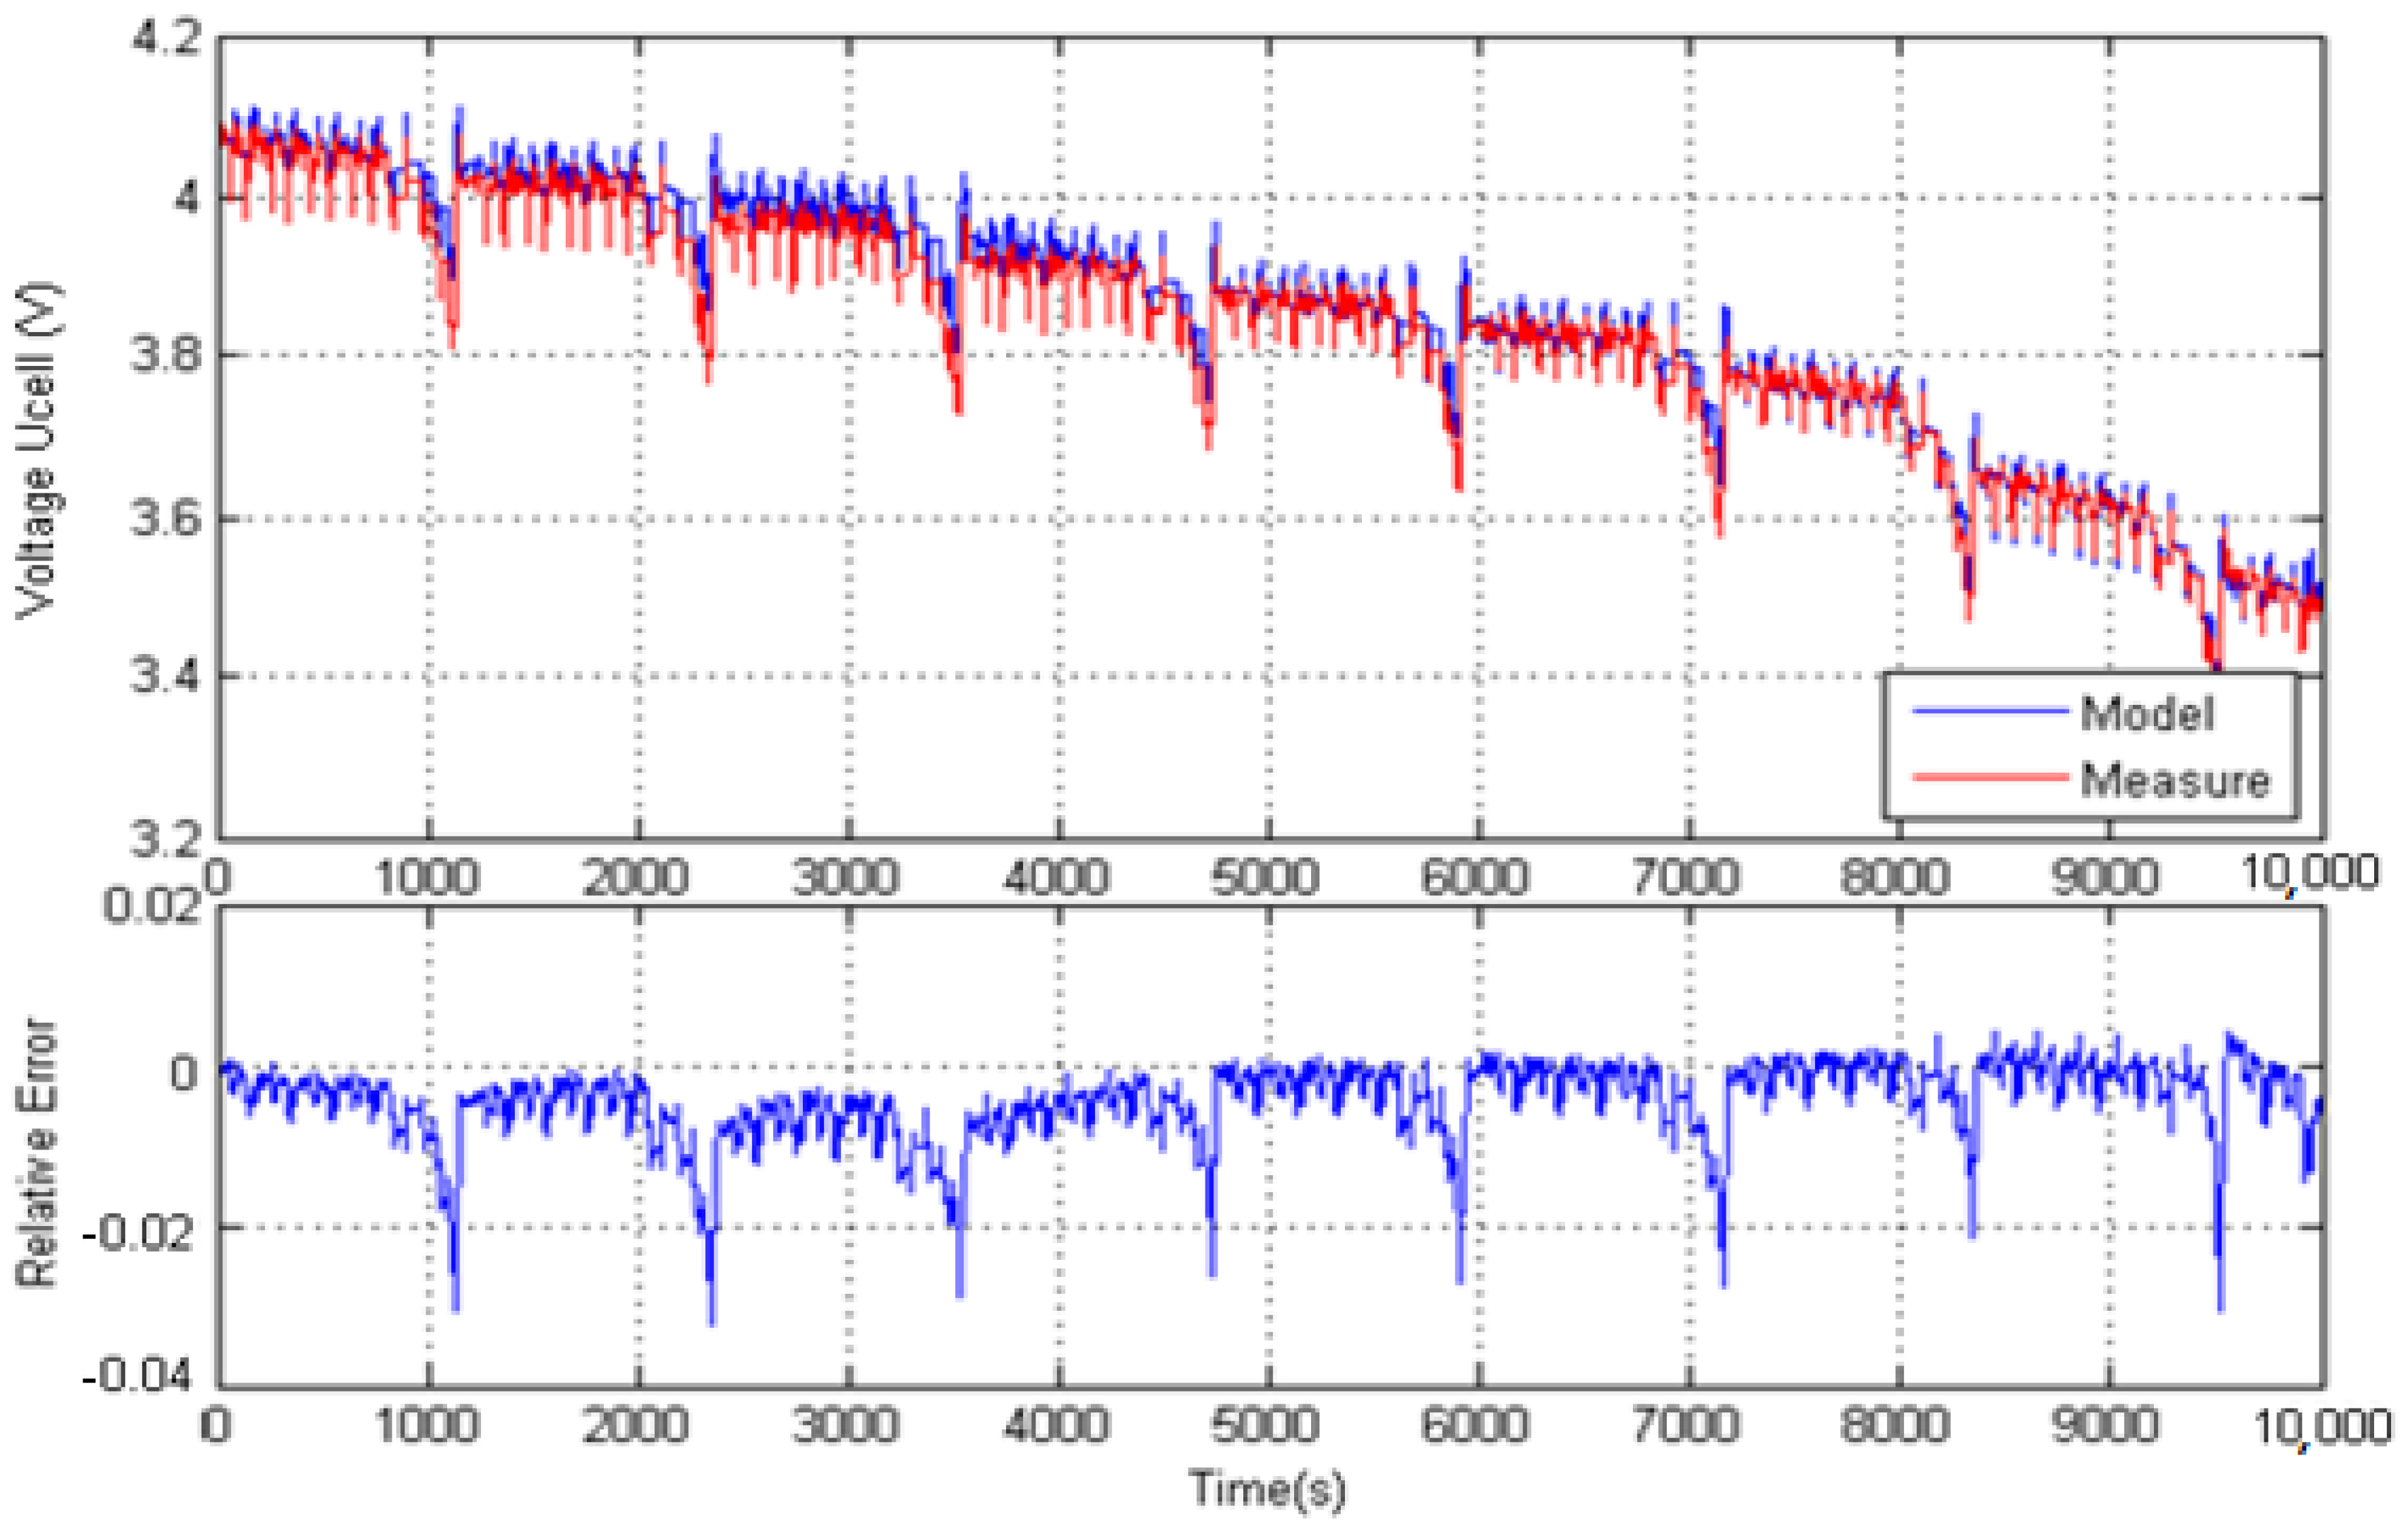
Concerning the application of the Thevenin model, Figure 13 shows the measured and predicted cell voltages and the corresponding relative error; the peak error reaches only 3.4%. This peak value should be compared with the value of 3% observed in the identification process: they are almost the same and show the validation of the identified Thevenin model.
Moreover, by analyzing the frequency and intensity of the mean RMS, it can be noticed that the response of Thevenin’s model is more precise and faster than that of the Rint model, which makes it more robust. Peak errors are faster and are reduced over time, which constitutes a further improvement.
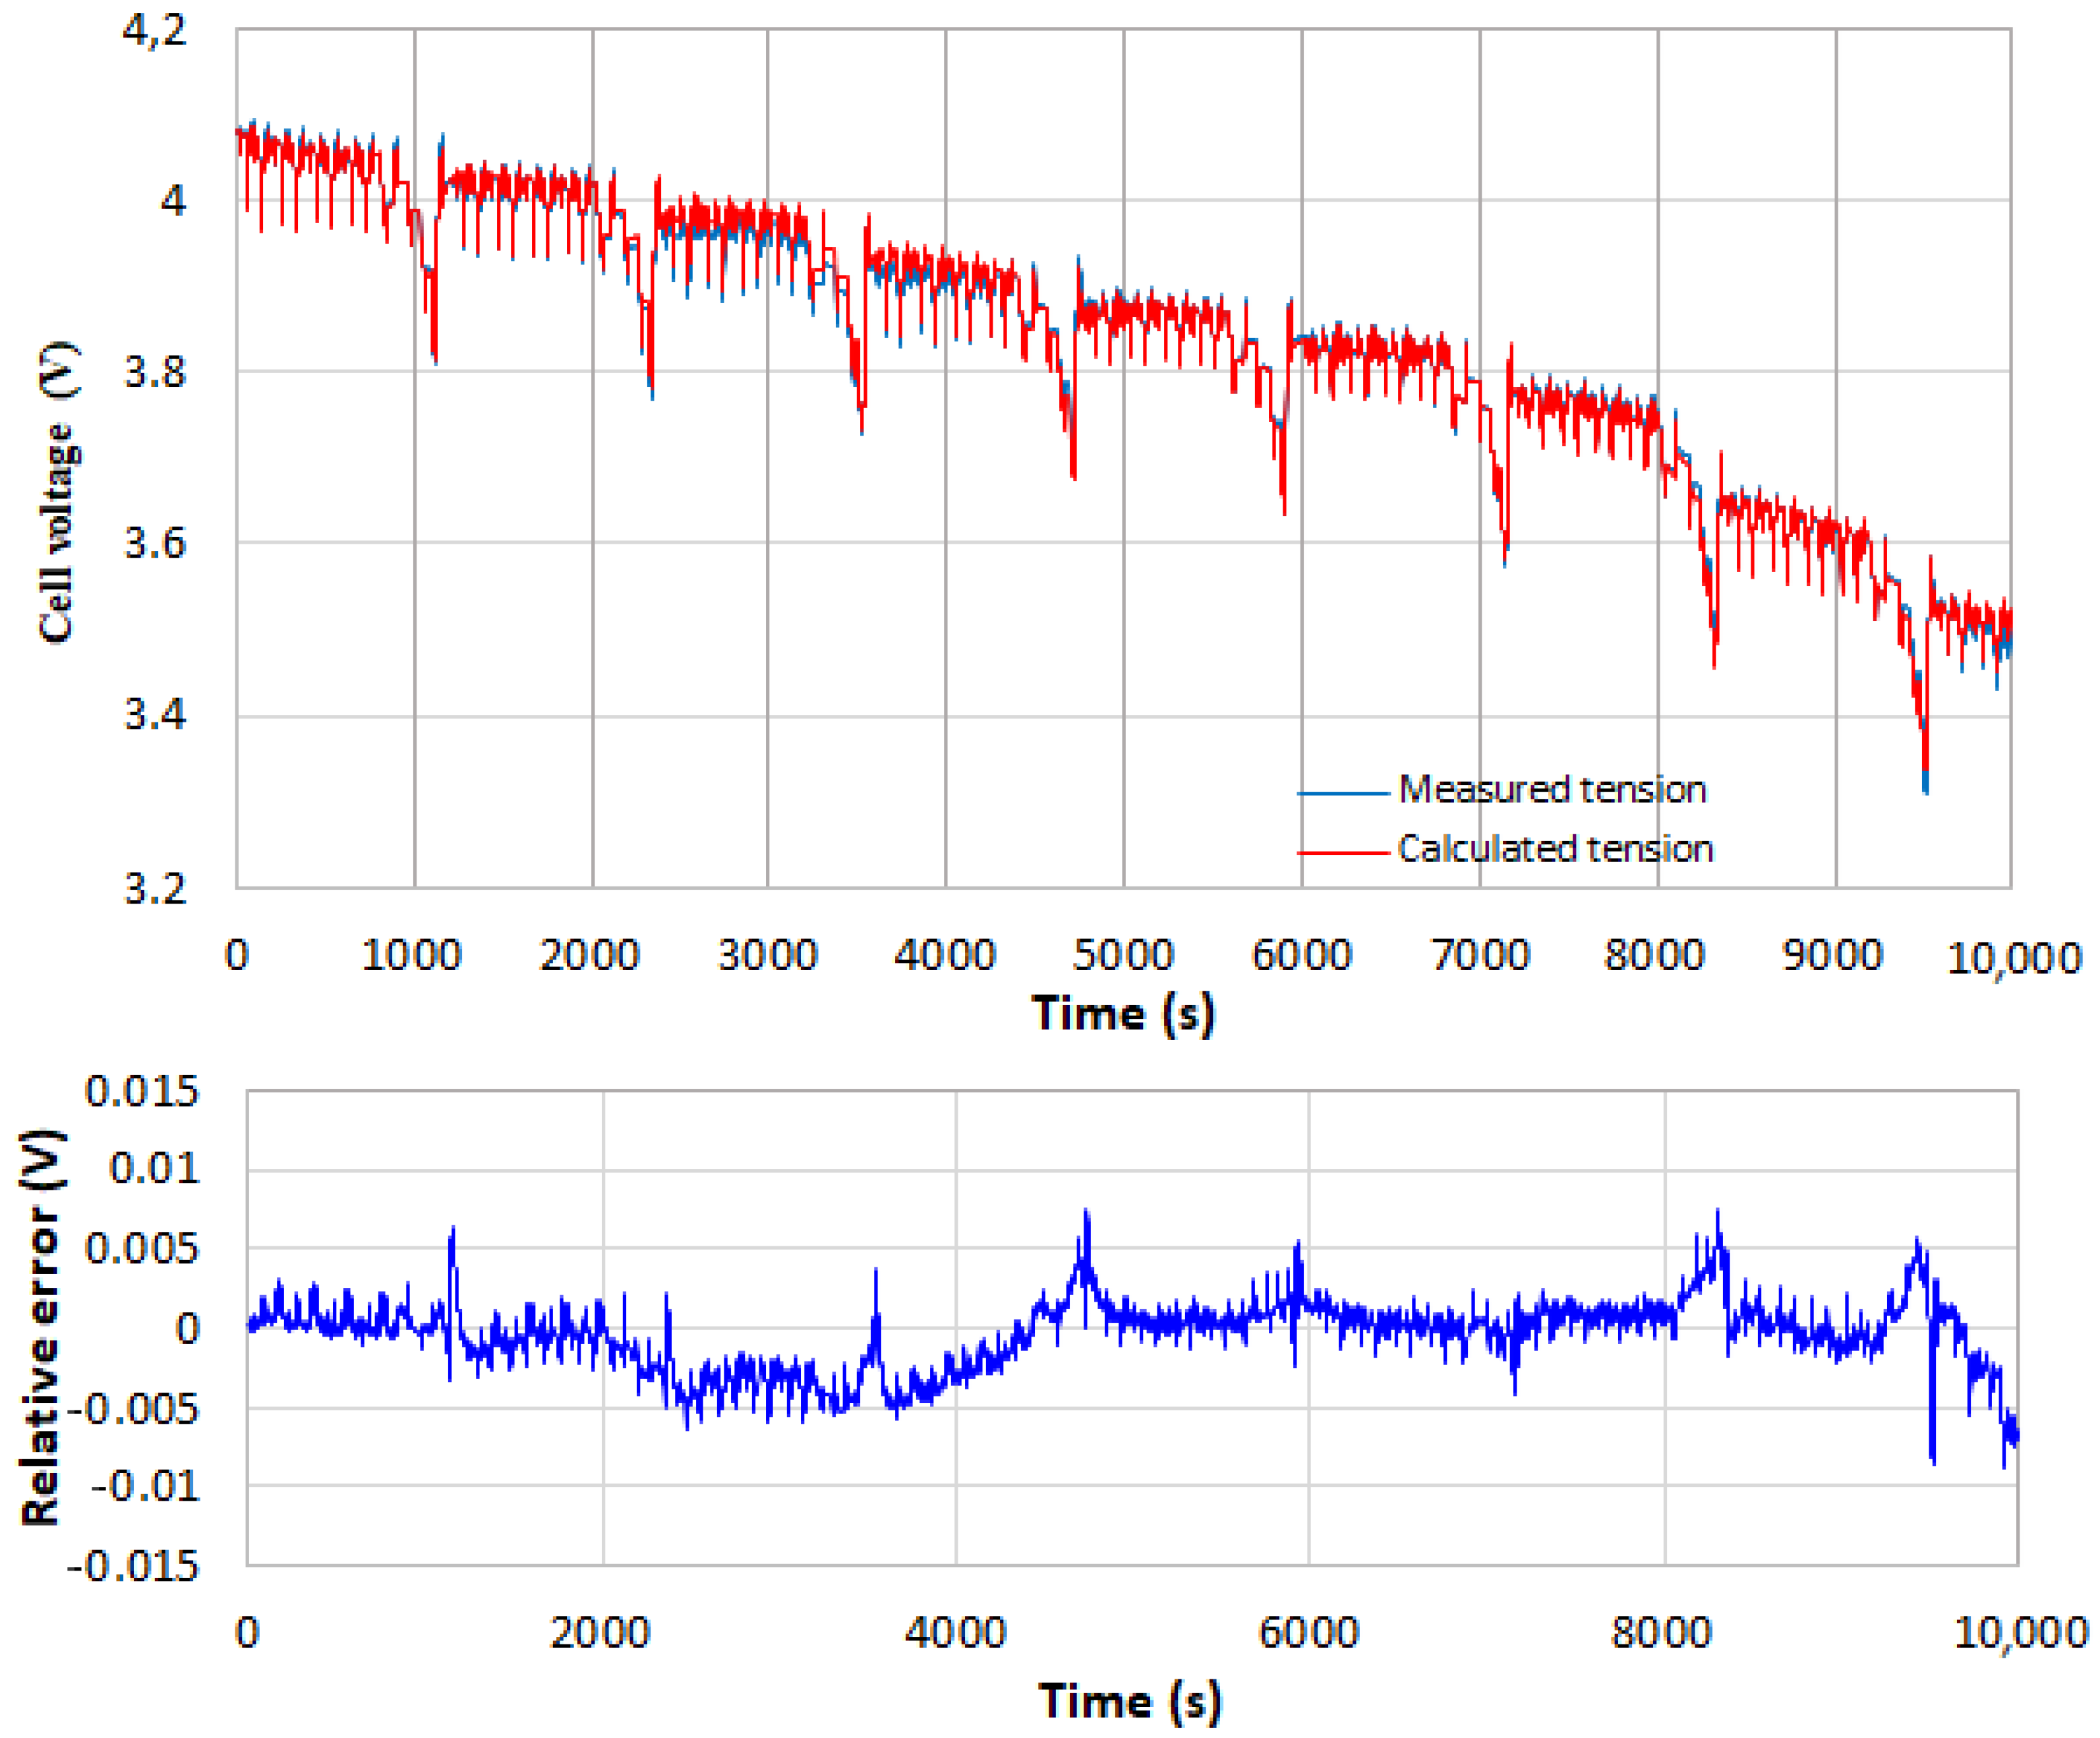
The DP (2nd-order) model described by Equations (15)–(19) and the temperature- and SOC-dependent Thevenin model described by Equations (20)–(25) are also applied to the 8 NEDC cycles for validation. Figure 14 and Figure 15 display similar results to those shown in Figure 12 and Figure 13. The prediction of the DP model shows a peak error of 3%, while the temperature and SOC-dependent Thevenin model, corresponding to the fourth tested model represented by Equations (20)–(25), exhibits a peak error less than 1%. Figure 15 clearly demonstrates that the model with parameters depending on both SOC and temperature induces a real improvement in the prediction of the cell behavior.
Therefore, the higher the order of the model, the better the accuracy of its predictions. Nevertheless, the predictions of all the identified models remain of good quality. Note that the temperature-dependent DP model only slightly improves the prediction accuracy compared to the temperature-dependent Thevenin model and that the temperature and SOC dependent Thevenin model, which is the most complex model used in the present work and also the most difficult to be identified, provides the best prediction as the peak error is divided by more than 2.
As the validation case covers the SOC range from 5% to 98%, the identified ECMs are thus valid for the whole range of SOC.
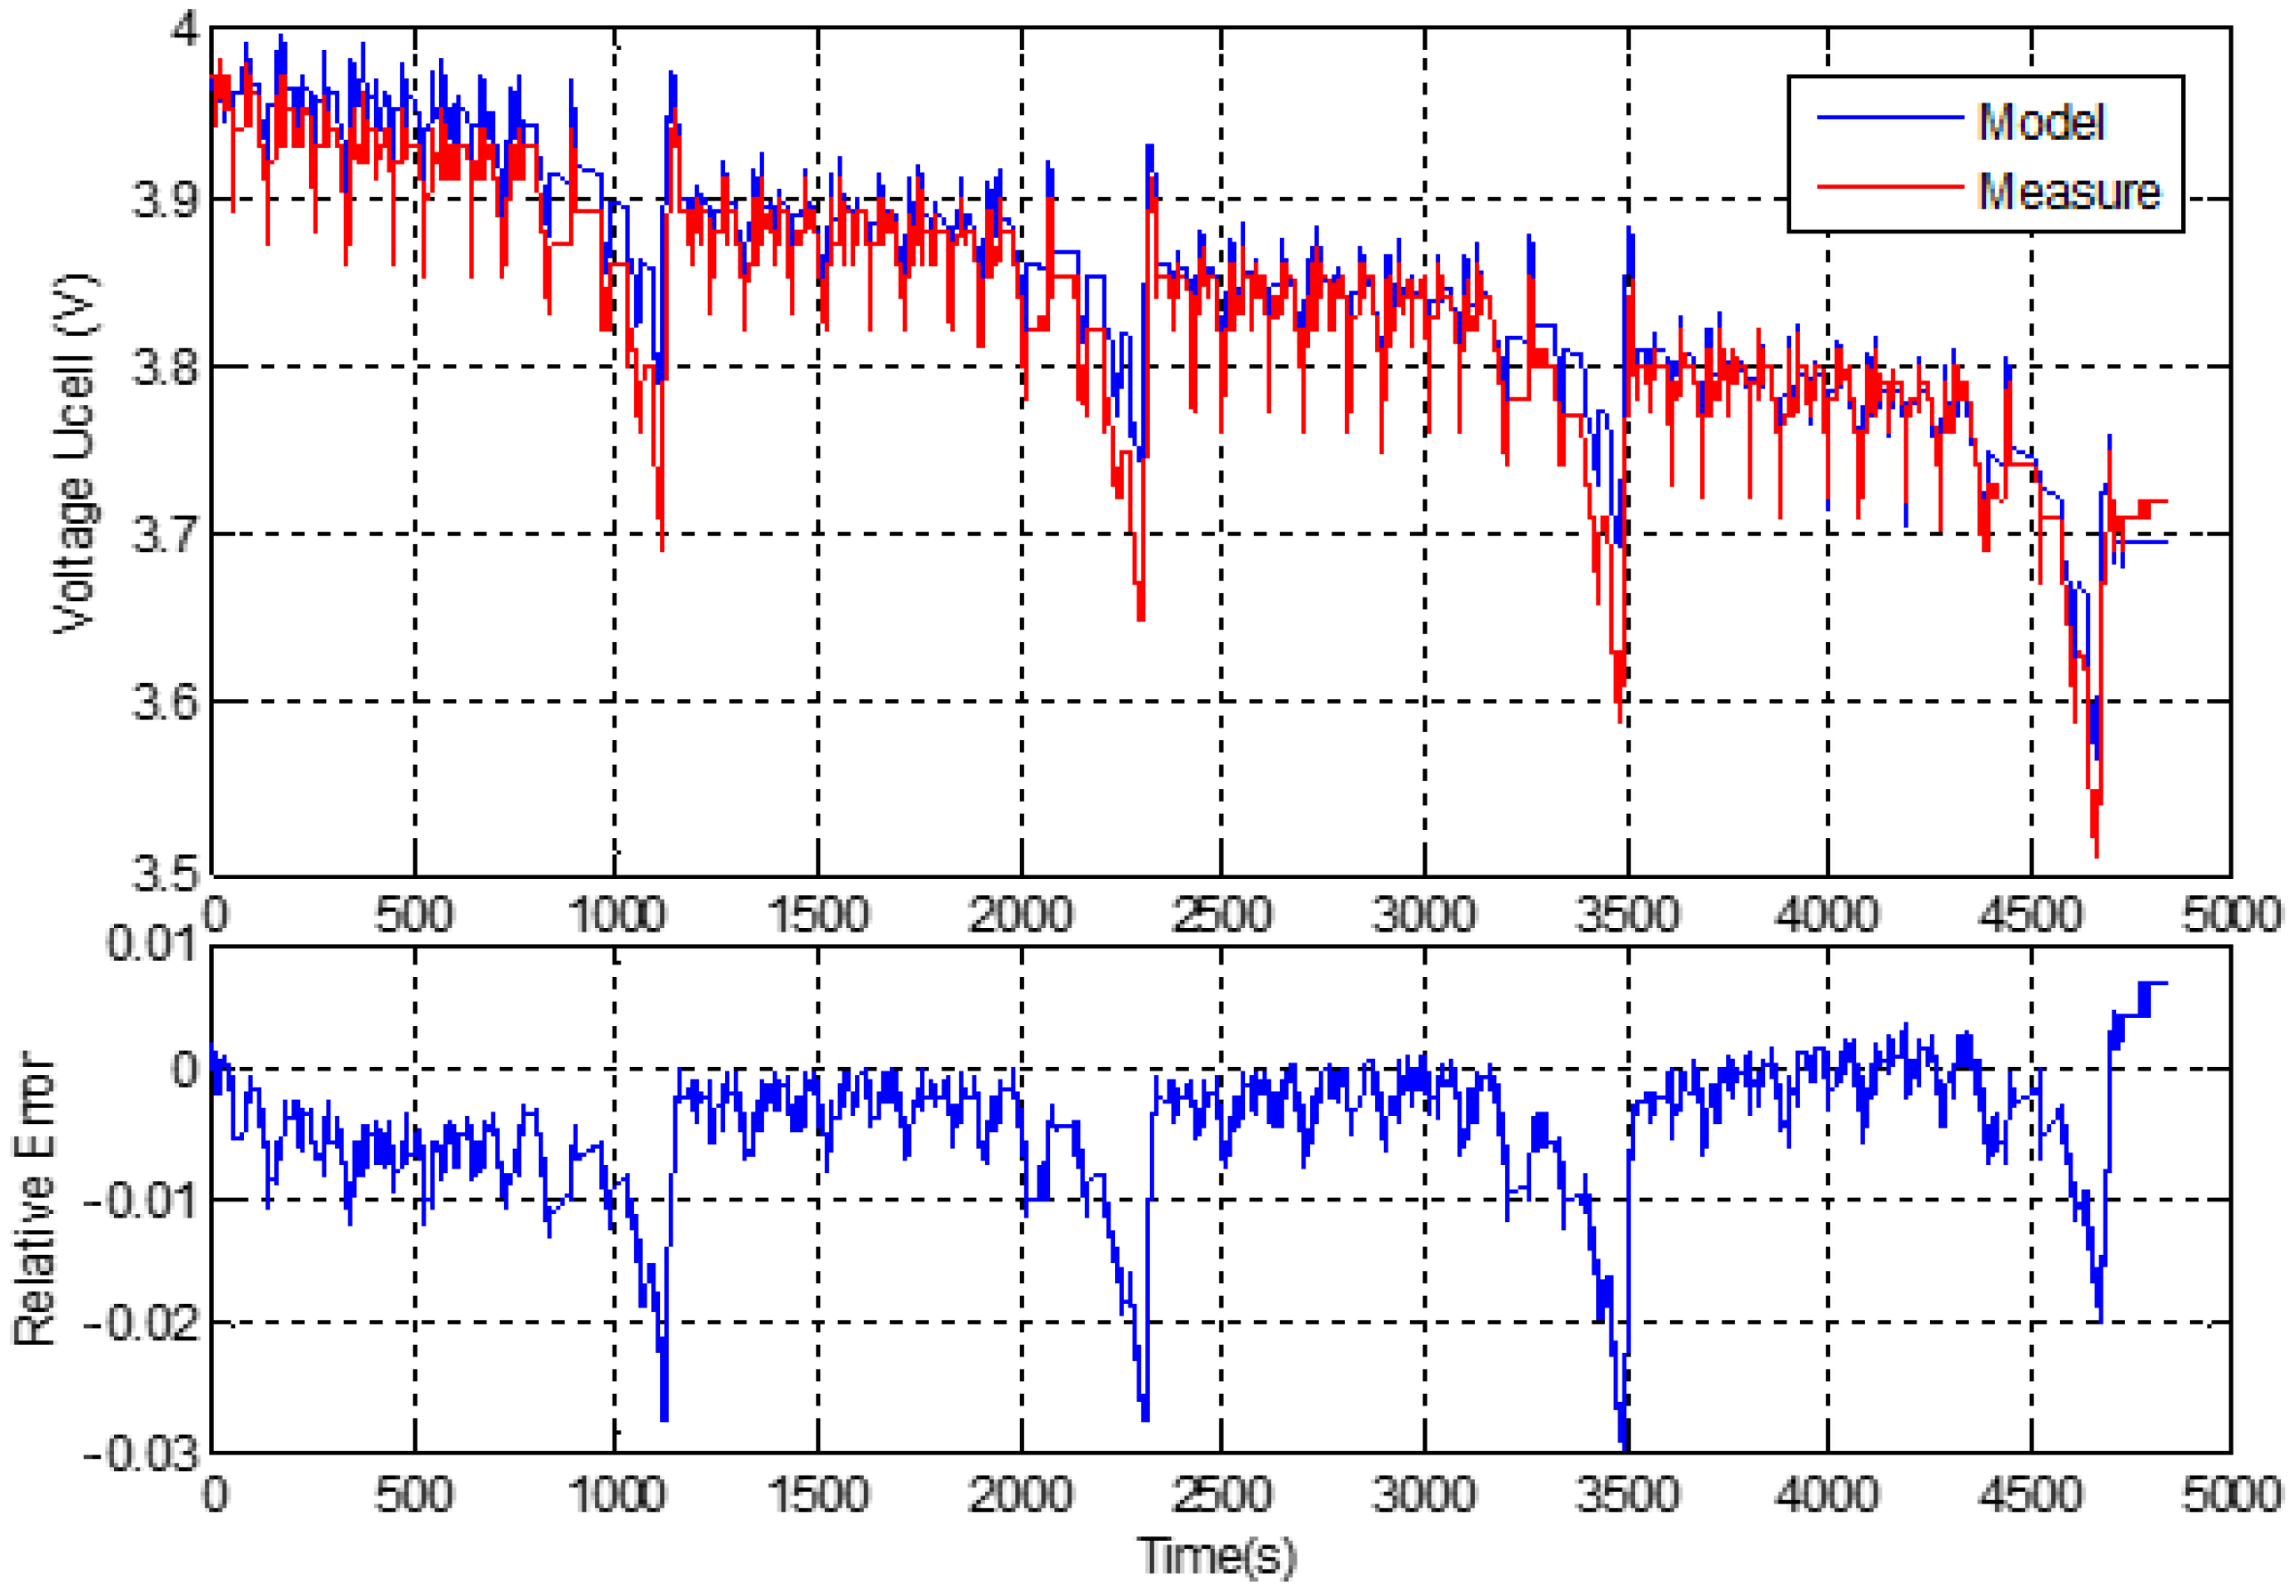
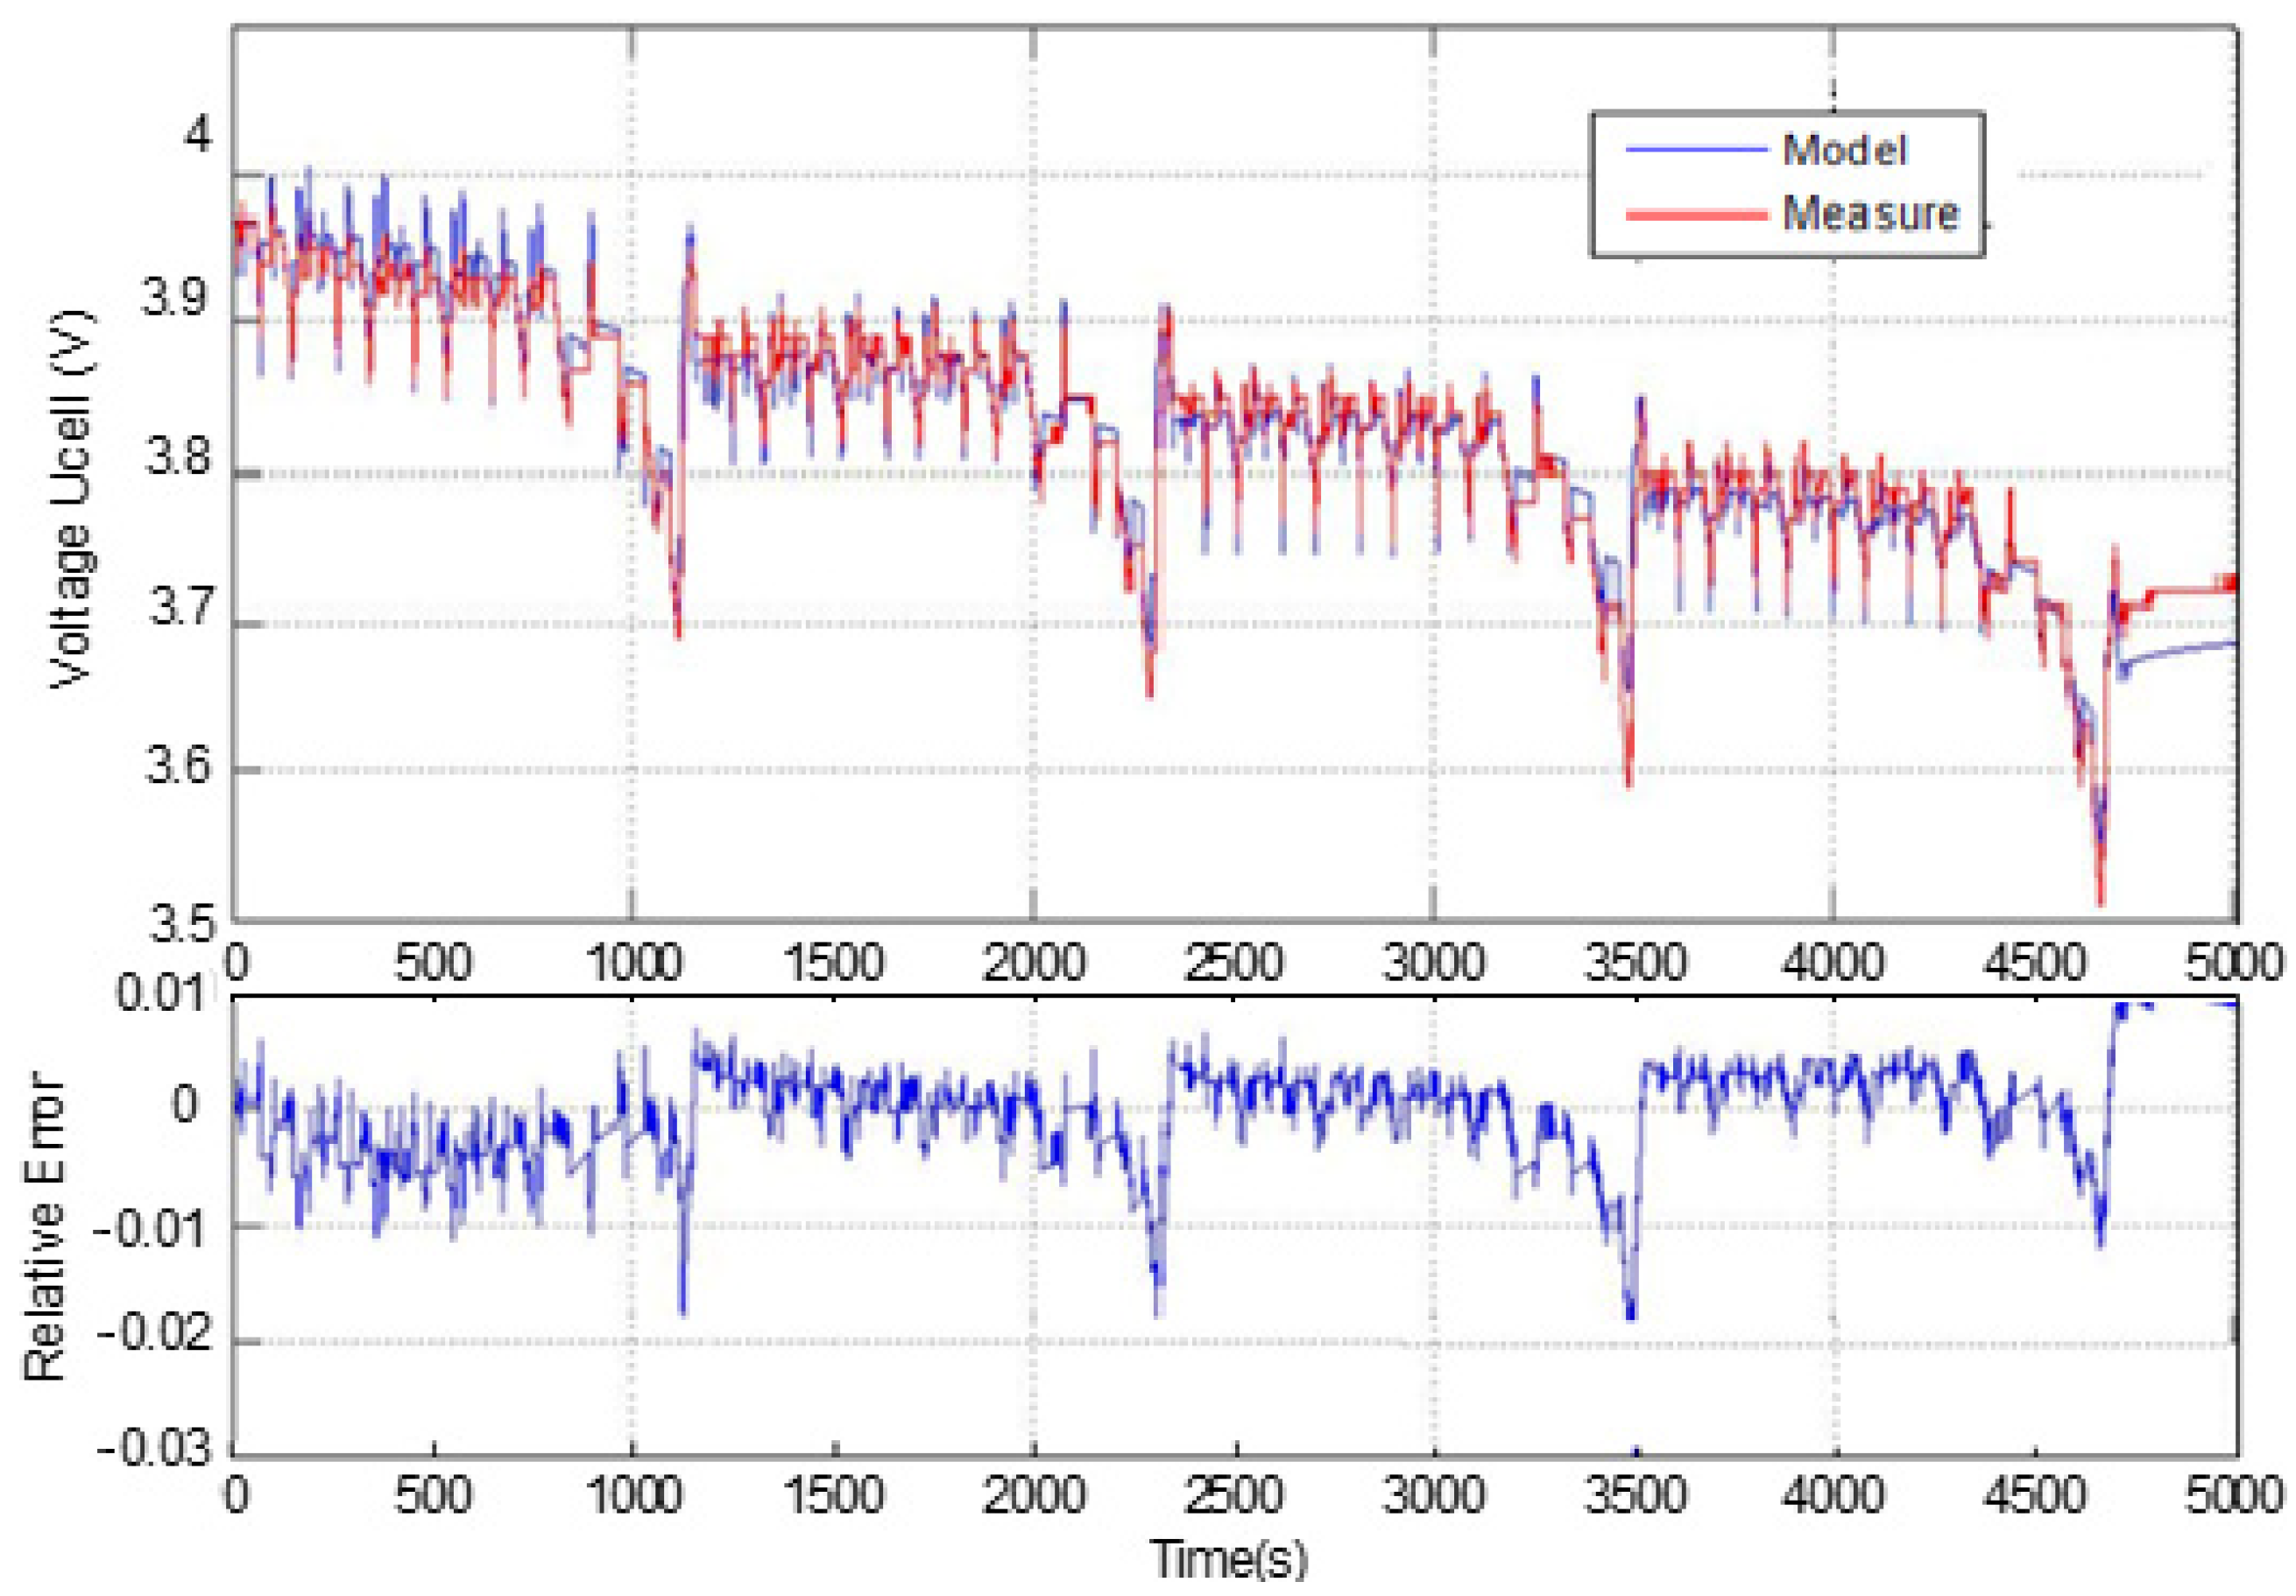
Validation work has also been carried out for a not fully charged cell; starting at a certain SOC level, 4 NEDC is applied. The 0- and 2nd-order models are applied to the test configurations and the corresponding results, and the relative errors are shown, respectively, in Figure 16 and Figure 17. These verification tests confirm that the ECMs proposed are valid for the whole SOC range and at least at ambient temperature.
Despite the temperature dependency of the proposed ECMs, note that, because the present work was performed at ambient temperature, the validation temperature domain may not be large enough. Therefore, their extensive use should be done cautiously.
4. Thermal Results and Analysis
The heat generated by the cell is predicted using the Bernardi model. This model has been coupled with the electrical models presented in the previous sections (0-, 1st-, and 2nd-order models). Only the results of the 1st-order model are discussed in this section. The same analysis is valid for other models.
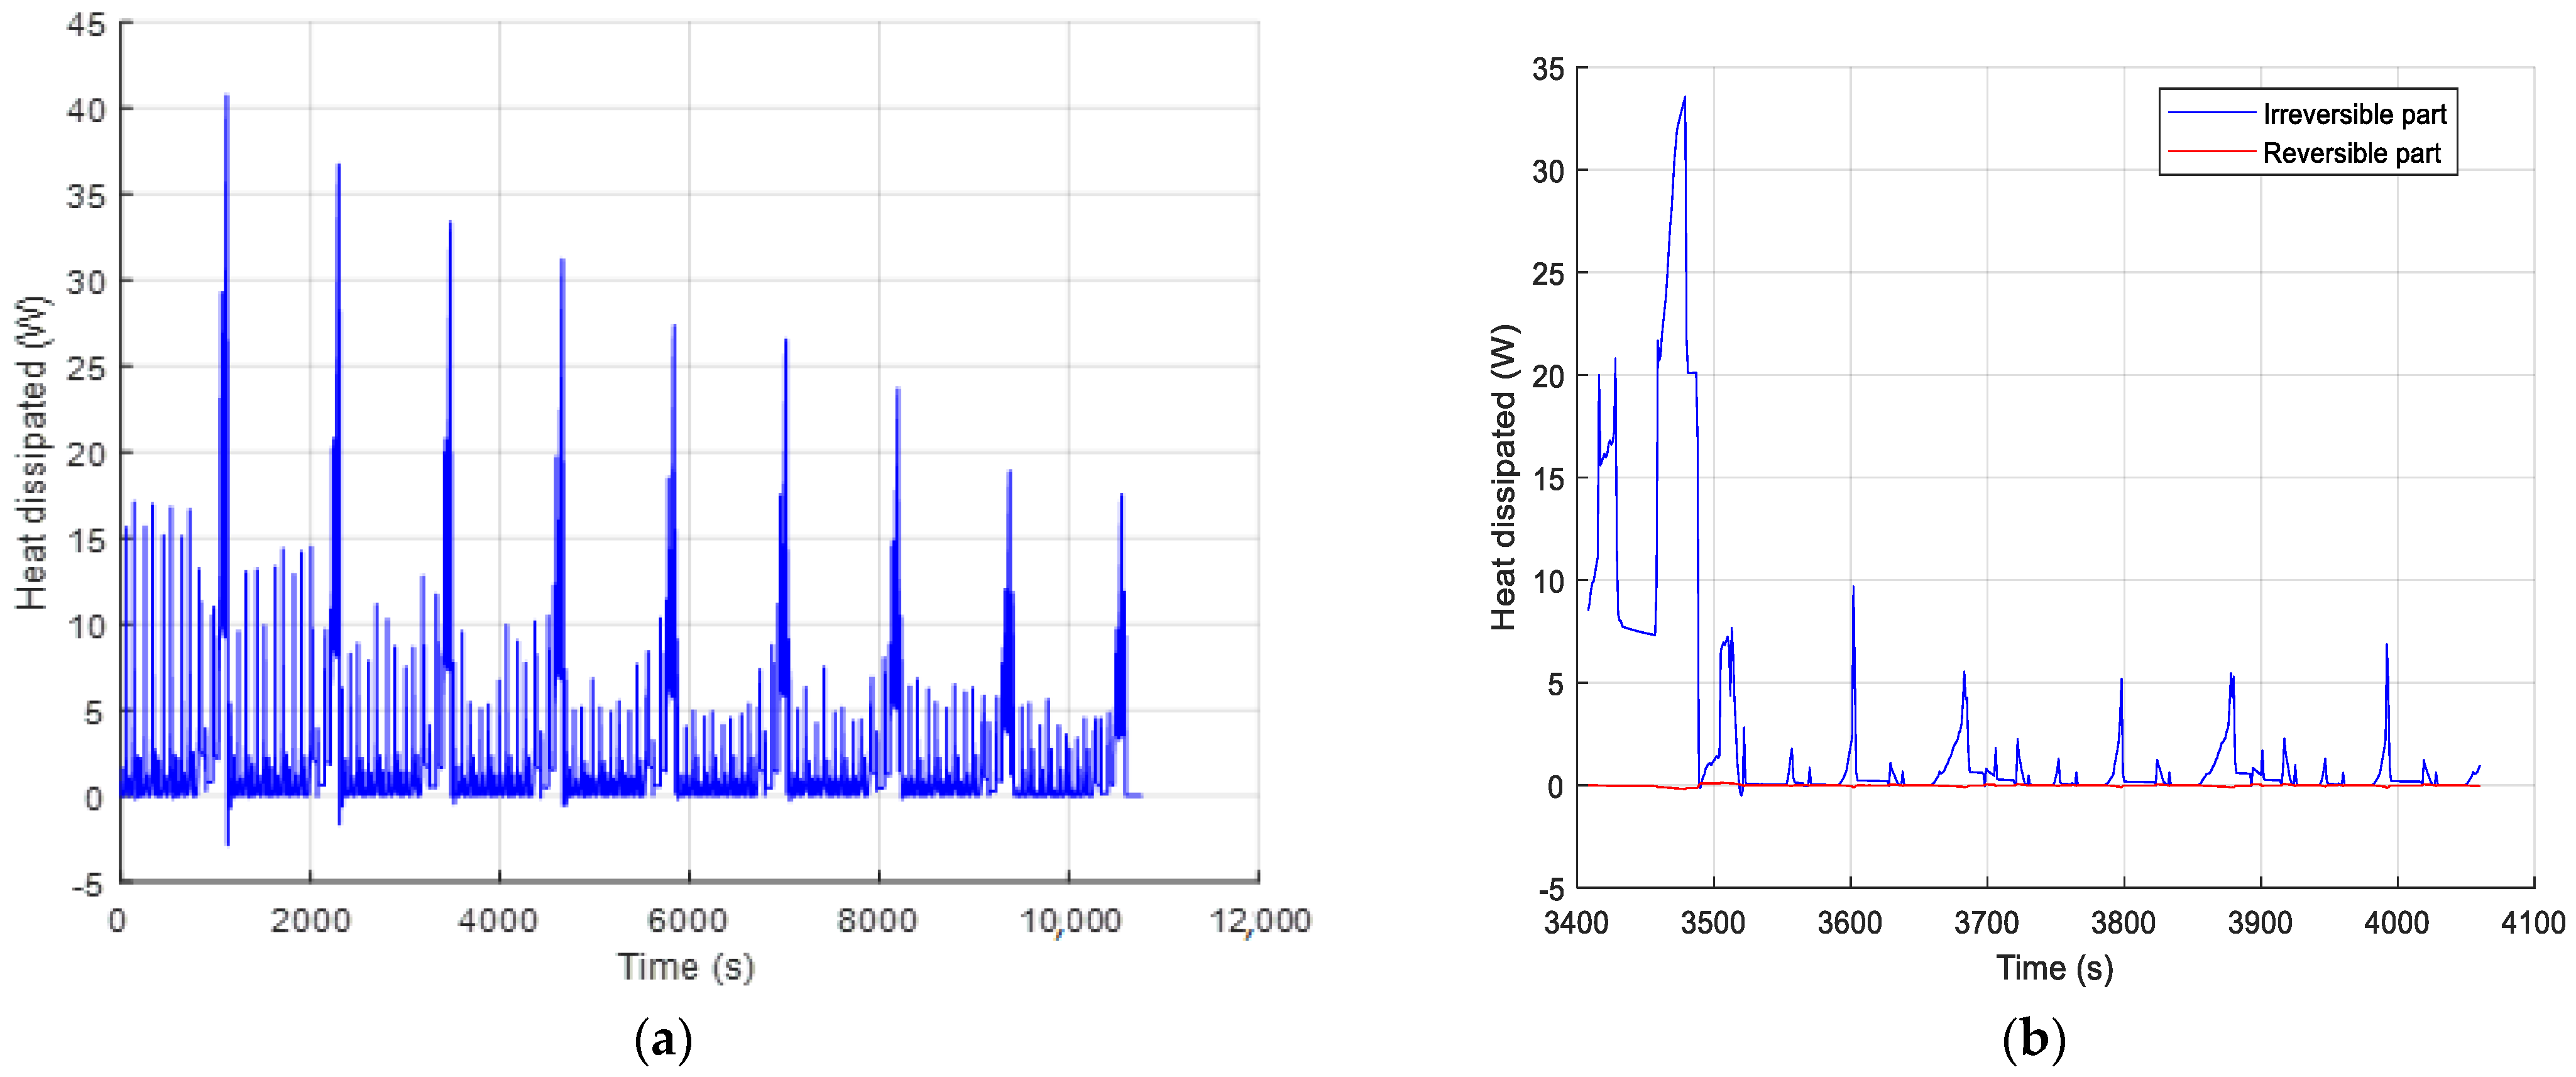
During the driving cycles (charge/discharge), large variations of the heat generation is observed (from −5 W to 40 W) in Figure 18a. These variations are strongly caused by the electrical losses. This can be highlighted by plotting the dissipated heats, estimated thanks to Equations (7) and (8) (Figure 18b). These figures present the total heat generation and both reversible (entropic heat) and irreversible (electrical losses) parts, predicted by the Bernardi model. It can be seen that the reversible term represents less than 5% of the total dissipated heat in accordance to the proposition of Bernardi in [30], where the reversible term of the dissipated heat could be neglected when operating at low temperature. This typical behavior of LMO batteries is also confirmed in [28,29]. Lithium-ion batteries are very sensitive to temperature and have to operate between 20 °C and 40 °C. The distribution of the heat dissipation shows large peaks in the last part of each NEDC cycle. This maximum corresponds to the final acceleration from 50 km/h to 120 km/h. However, during all the urban driving times, the power dissipated oscillates around a median value for the whole range of the SOC (about 14 W for the 1st cycle). The average dissipated power for the eight NEDC cycles is 2 W, and the energy dissipated during one cycle is 20 kJ (5.5 Wh).
The heat dissipation shown in Figure 18 indicates periods of the cycle where the power dissipated is negative. These results seem to be non-physical and are due to the reversible part of the Bernardi model (Equation (8)), which is not compensated by the irreversible part of the model. This phenomenon can be explained by the relaxation time; when no current is applied to the battery, the irreversible part is null but the cell is still charging or discharging for a while. This induces a small variation of the SOC, and thus the reversible part of the dissipated power is not zero.
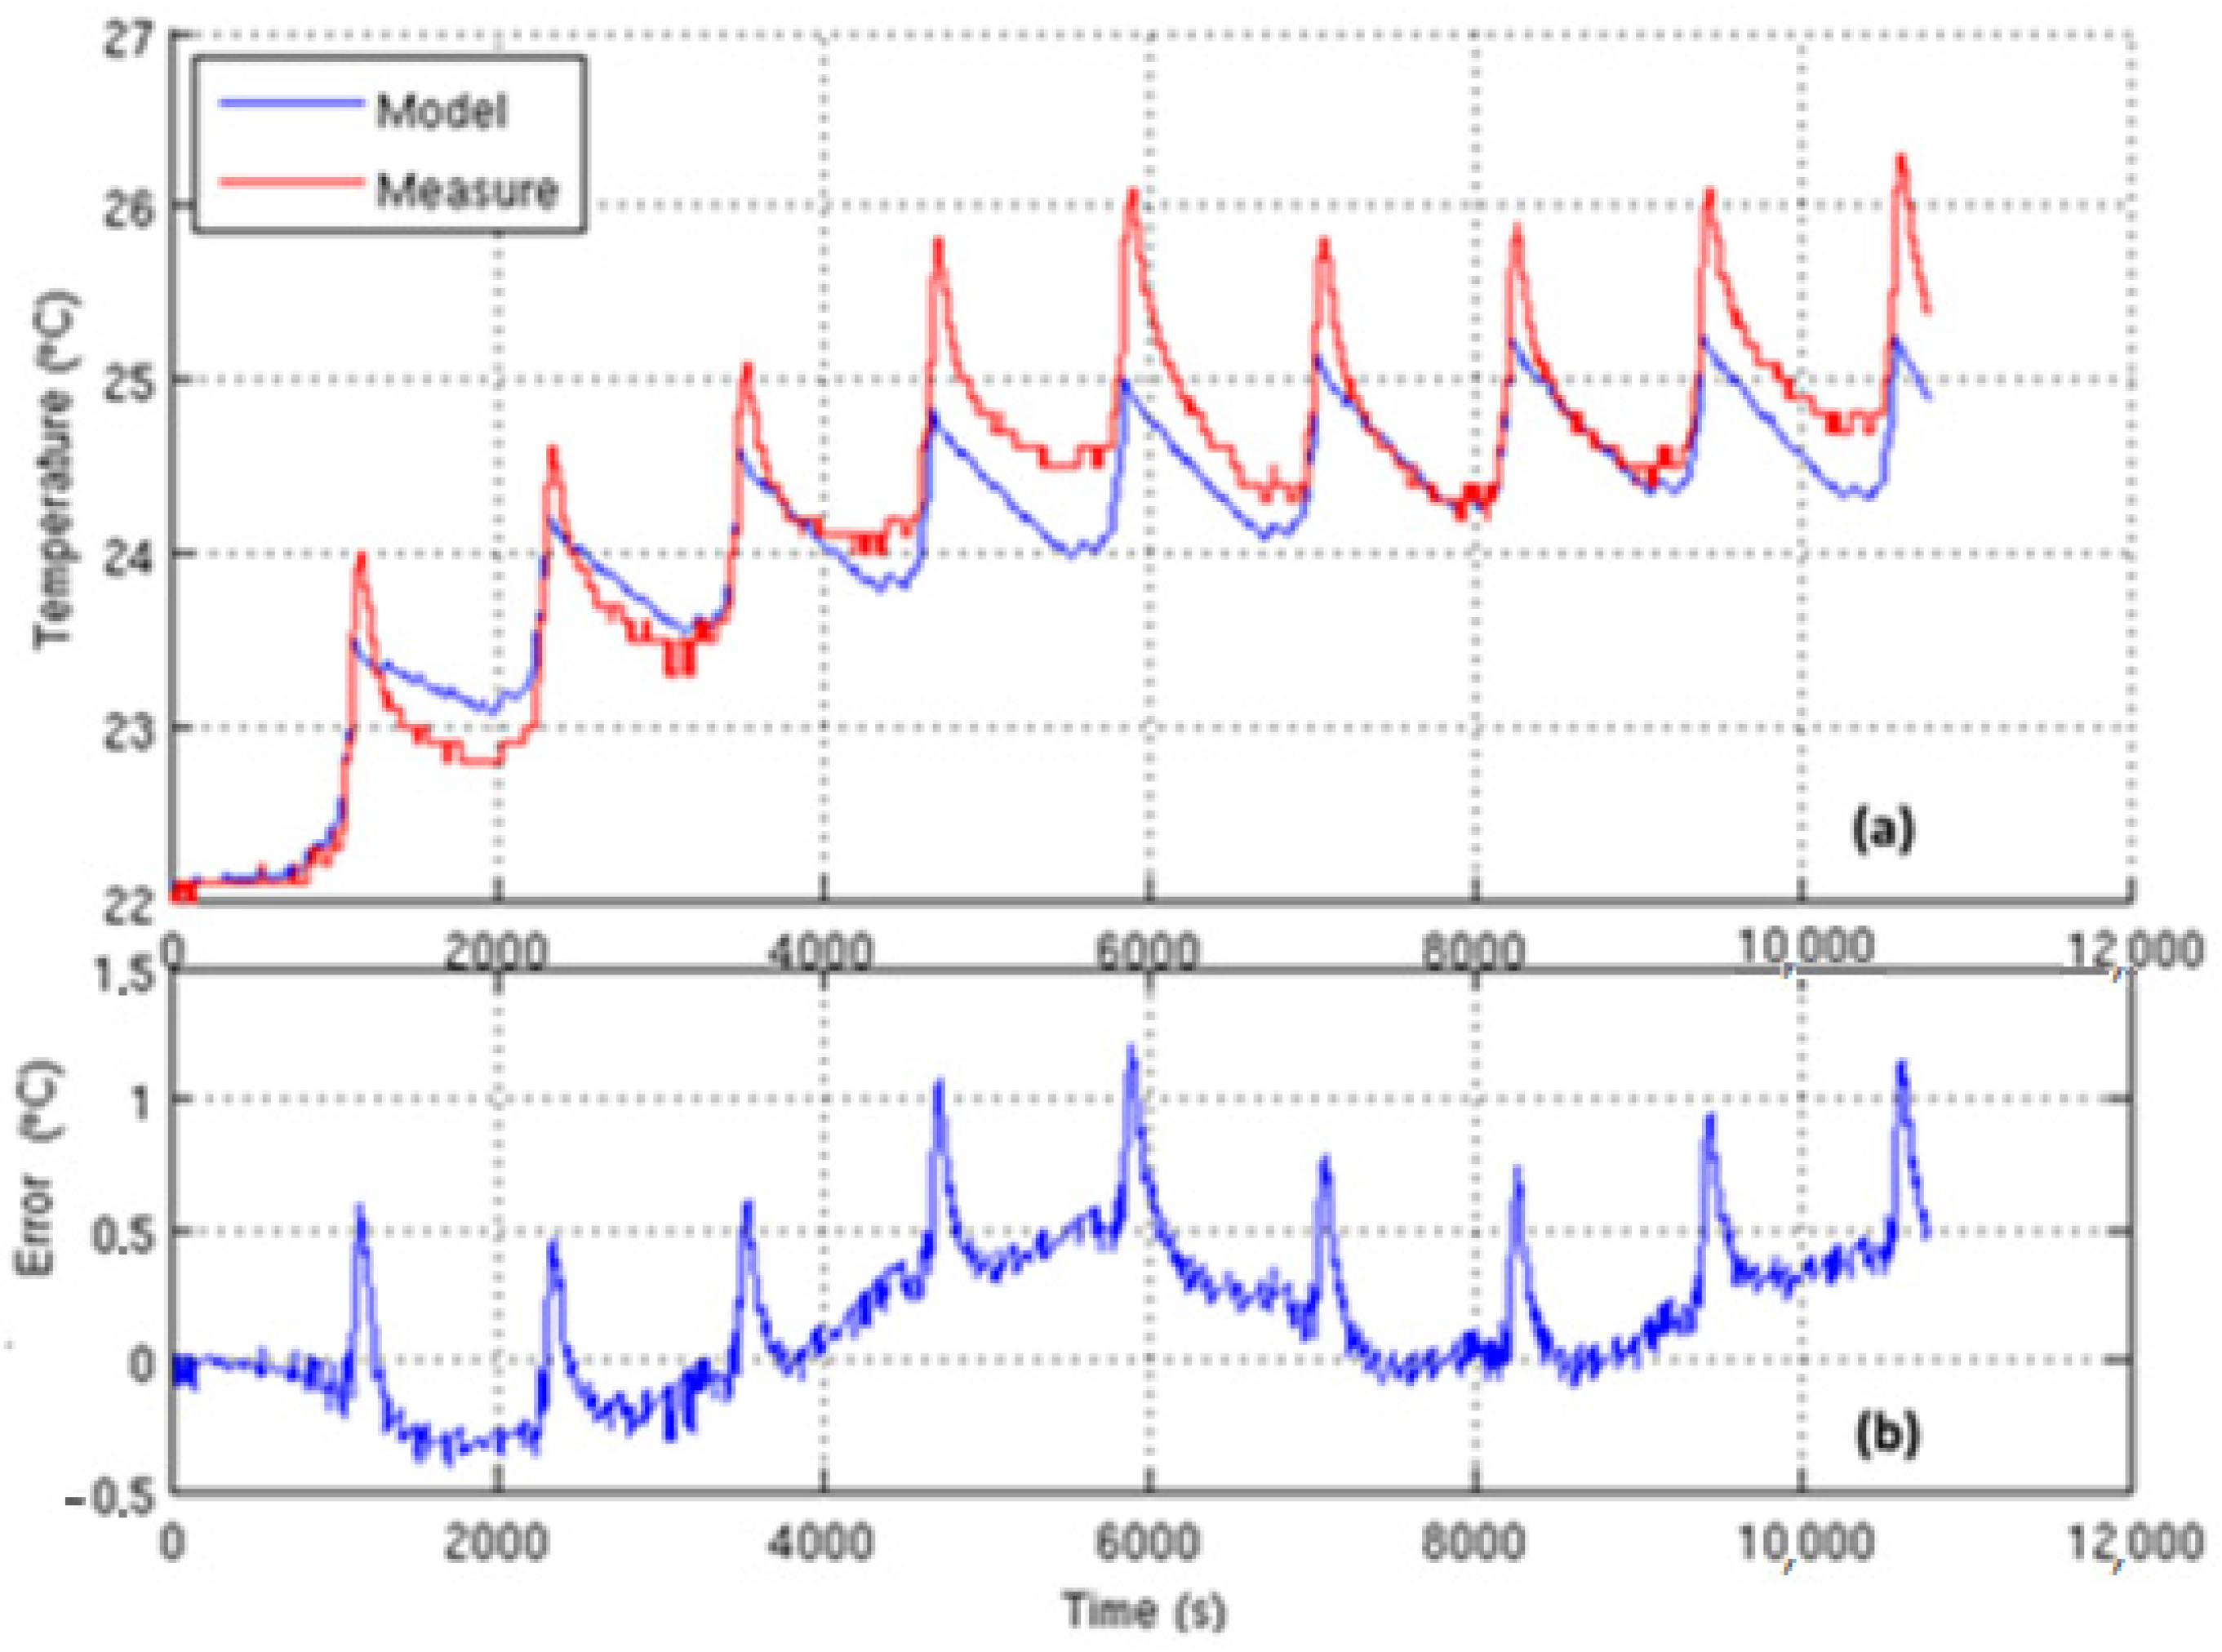
As heat dissipation leads to an increase of the cell temperature, the energy balance equation is used to estimate the cell temperature evolution. The mean cell temperature evaluated by solving Equation (9) is then compared to the temperature measured at the positive terminal, as shown in Figure 19. The tests have been carried out at ambient temperature (20 °C), air forced convection (h = 20 W·m−2·K−1), and NEDC solicitation. The cycling affect is clearly represented by the modelling and the measurement. The temperature profiles obtained from the experiment and modeling are in good agreement for the whole range of SOC.
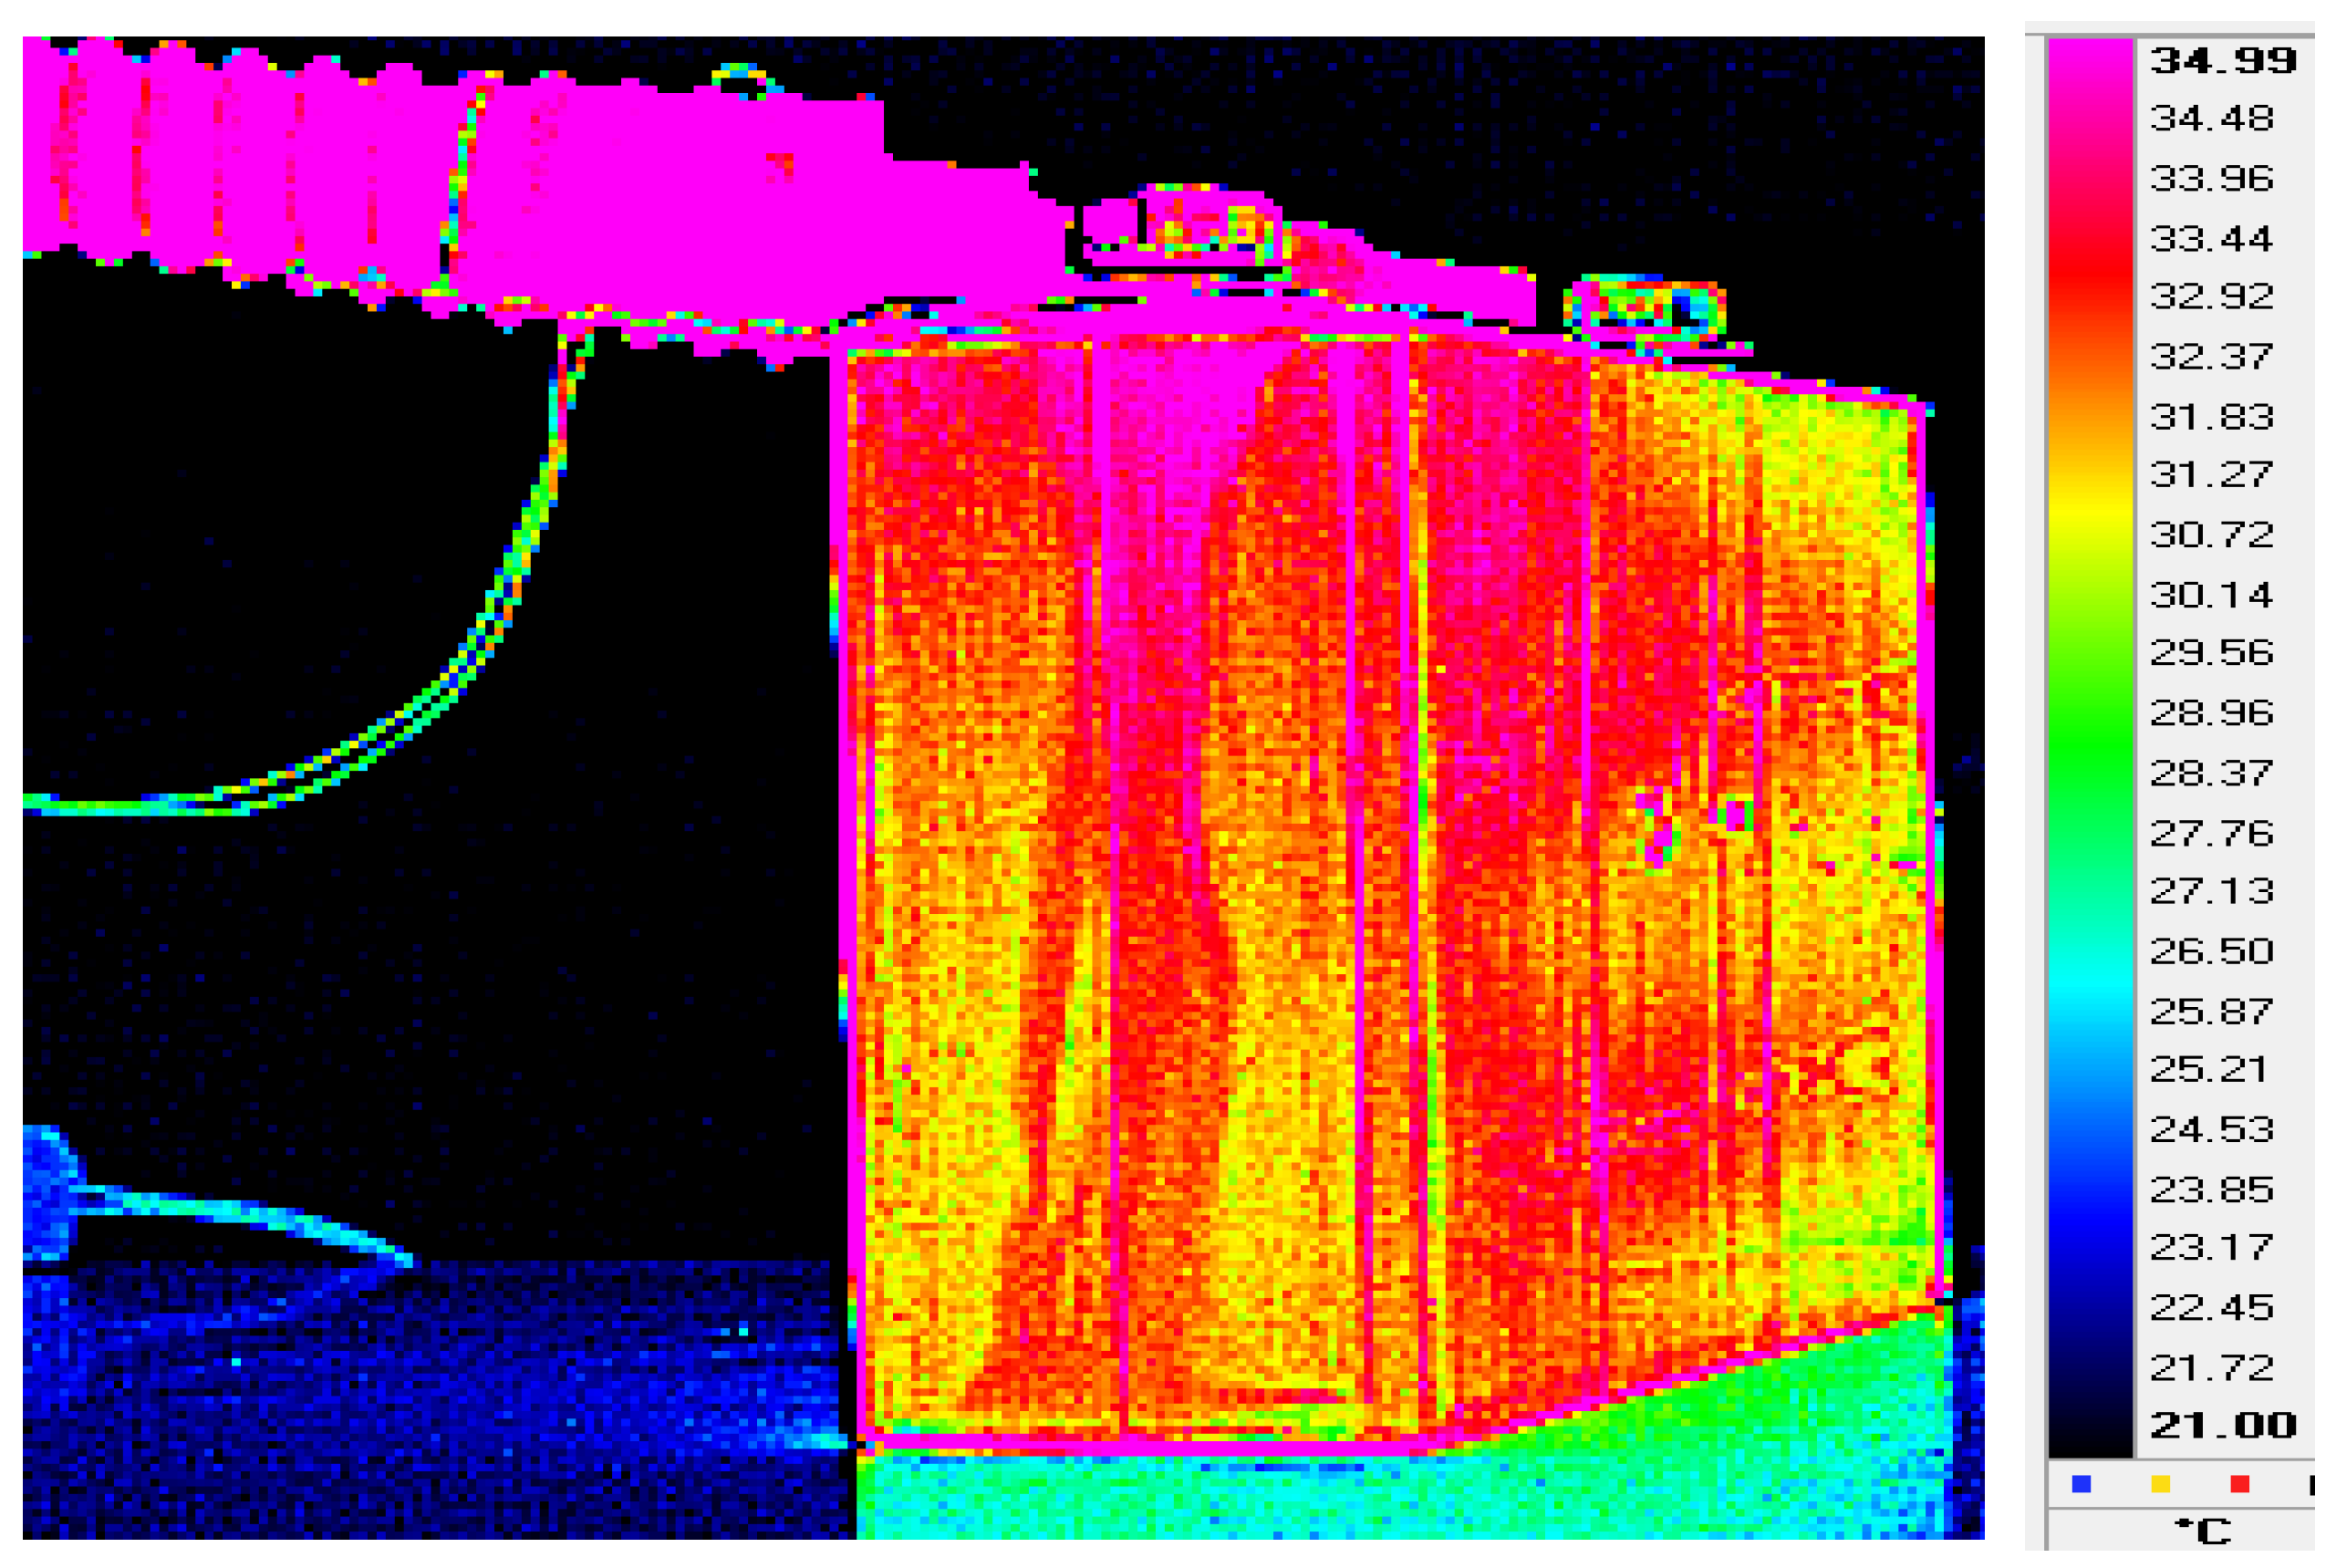
Figure 19a shows that the Thevenin model is able to predict the thermal behavior of the battery. The temperature gap between the measured and estimated temperature remains lower than 1.2 °C during a driving period of about 3 h (Figure 19b). This result is very interesting in the field of battery monitoring, because the objective of the available sensor nowadays is to get an accuracy around 5 °C. These sensors are soldered into the electronic board, far away from the battery pack and in a place where the Joule effect is very important. This gap between the measured and estimated temperatures is due to the fact that the electrical conductivity of the positive terminal is much higher than that of the active material (cell), while the cell is considered as a single block of homogeneous material with constant conductivity and temperature. In addition, the measurement is located on the positive terminal, while the model considers a homogeneous mean temperature of the cell, as shown in Figure 20, where the temperature distribution in a cell is measured using an infrared camera.
Globally, the cell surface temperature is homogeneously distributed in the total surface, with weak gradients appearing near the electrodes because of their higher thermal diffusivity, but it remains less than 3 °C over the battery surface. This supports the assumption that an equivalent homogeneous temperature in a cell is representative of the thermal behavior of batteries, and hence it simplifies the complex modeling of the temperature gradient in the cells and encourages one to propose this model as an alternative for online thermal management and control during vehicle driving. The model developed in this work could be implemented into light software to predict the battery temperature evolution and control the load before reaching the temperature limitation. This software could command the fans to optimize the cooling of the battery rack and thus increase the lifetime of the battery and the autonomy of the electric car.
Nevertheless, it should be noted that, due to the very high thermal conductivity of the positive electrode, the assumption of a homogeneous cell and a homogeneous temperature is strong, and it would be more realistic to solve Equation (4), which can be solved easily nowadays. However, neither the internal structure of a battery cell and the materials used in it nor the corresponding thermo-physical properties are available; this means that using a more detailed model, such as Equation (4), is not easy at the moment. Equation (4) needs the density, ρ, the heat capacity, Cp, and the thermal conductivity, k, of each constitutive material used and its dimension. Although past work [36] allowed one to obtain the density, ρ, the heat capacity, Cp, and the thermal conductivity, k, of a LMO/Graphite cell, they are only the equivalent quantities of the cell, and it is not possible to go into more details. Based on this information, various numerical tests unfortunately yielded results more or less similar to those in Figure 20. Much more efforts are still needed to go further into thermal analysis.
5. Conclusions Summary and Conclusions
The paper was aimed at modeling the electro-thermal behavior of an LMO/Graphite battery cell in order to estimate the heat generated within the cell during electrical charging and discharging. An equivalent circuit model (ECM), was adopted, and different orders of the model have been tested (Rint, Thevenin, DP model). The second aim was also to provide data from the real characterizations of cells; electrical and thermophysical data were measured or identified, and they constitute real and helpful information for academic studies.
A special bench was built to control the operating conditions (current profile) and to measure the electro-thermal response of the cell (voltage, temperature). The testing data have been used to identify the ECM parameters (resistances and capacitances), considering their evolution versus the SOC and the temperature, providing a complete and original set of data, which constitutes one of the contributions of this work. To check the validity of the proposed model, a testing cases was simulated using the New European Driving Cycle (NEDC). The measurements and the simulations were compared and validated for a long driving time (3 h).
The sensitivity of the model to the state of charge and the temperature has been explored. Considering both temperature and state of charge allows a good modeling performance and an error less than 1%. In addition, this analysis has been validated for the whole range of the SOC variation, from full charging to complete discharging. A temperature-dependent Thevenin model (1st-order) was found to be a good compromise between complexity and performance. Of course, simultaneously considering the effect of the temperature and the SOC makes the models more faithful to the behavior of the batteries, but without major advantage as regards the thermal management of the batteries during the driving of vehicles, which means that rapid calculations are required, and therefore simplified models.
This balanced model (simplicity and accuracy) is then used for thermal analysis; the temperature measurements and predictions are compared under longtime operating conditions. The excellent agreement obtained allows us to propose that this approach is adopted for the online thermal management of battery packs during the driving of electrical vehicle. The association between realistic assumptions to reduce the modeling complexity and the experimental measurement using a specially built bench leads to confidence in the thermal predictions of this approach; it constitutes a second original part of the study. However, it should be note that the proposed models in the present work are only valid at an ambient temperature of 20 °C and that difficulties are encountered in performing more detailed thermal analysis due to the lack of information on the materials used and the internal structure of the battery cell.
Further work will consist in the analysis of the different materials of the cell in order to propose an equivalent global material able to represent the thermal behavior of the battery cell under more extreme operating temperatures, especially very low temperature, and to test the model on a battery pack while considering the convective heat transfers in a real driving situation. This will be the confirmation step for online thermal control and then, eventually, for energy harvesting in the whole electrical vehicle.
Author Contributions
N.M. carried out the experiments, built the electro-thermal cell model, conducted data analysis, and prepared the manuscript. S.B. assisted in building the experimental set-up and carrying out data analysis. M.B. and S.X. helped provide the research direction along with assistance in solving problems associated with the modeling and experimental sections, manuscript reduction and results analysis. All authors have read and agreed to the published version of the manuscript.
Funding
This research was funded by the European Commission and Region AURA, in the framework of the project “InnoTherMS”. The project cooperates between German and French partners under the international cooperation Alliance for Innovative Mobility Technologies (AllFraTech).
Institutional Review Board Statement
Not applicable.
Informed Consent Statement
Not applicable.
Data Availability Statement
Not applicable.
Acknowledgments
The authors would like to acknowledge Eric Mathieu from CETHIL for his assistance in designing the experimental bench and the acquisition software.
Conflicts of Interest
The authors declare no conflict of interest.
References
- Wang, Q.; Jiang, B.; Li, B.; Yan, Y. A critical review of thermal management models and solutions of lithium-Ion batteries for the development of pure electric vehicles. Renew. Sust. Energ. Rev. 2016, 64, 106–128. [Google Scholar] [CrossRef]
- Sawa, L.H.; Taya, A.A.O.; Zhang, L.W. Thermal Management of Lithium-ion Battery Pack with Liquid Cooling. In Proceedings of the 31st Semi-Therm Symposium, San Jose, CA, USA, 15–19 March 2015. [Google Scholar]
- Ahmed, R.; Gazzarri, J.; Onori, S.; Habibi, S.; Jackey, R.; Rzemien, K.; Tjong, J.; LeSage, J. Model-Based Parameter Identification of Healthy and Aged Li-ion Batteries for Electric Vehicle Applications. SAE Int. J. Alt. Power 2015, 4, 233–247. [Google Scholar] [CrossRef] [Green Version]
- Mahamud, R.; Park, C. Reciprocating air flow for Li-ion battery thermal management to improve temperature uniformity. J. Power Sources 2011, 196, 5685–5696. [Google Scholar] [CrossRef]
- Mathew, M.; Mastali, M.; Catton, J.; Samadani, E.; Janhunen, S.; Fowler, M. Development of an Electro-Thermal Model for Electric Vehicles Using a Design of Experiments Approach. Batteries 2018, 4, 29. [Google Scholar] [CrossRef] [Green Version]
- Mauger, A.; Julien, C.M. Critical review on lithium-ion batteries: Are they safe? Sustainable. Ionics 2017, 23, 1933–1947. [Google Scholar] [CrossRef] [Green Version]
- Abada, S.; Marlairb, G.; Lecocq, A.; Petit, M.; Moynot, V.S.; Huet, F. Safety focused modeling of lithium-ion batteries: A review. J. Power Sources 2016, 306, 178–192. [Google Scholar] [CrossRef]
- Kantharaj, R.; Marconnet, A.M. Heat Generation and Thermal Transport in Lithium-Ion Batteries: A Scale-Bridging Perspective. Nanoscale Microscale Thermophys. Eng. 2019, 23, 128–156. [Google Scholar] [CrossRef]
- Christen, R.; Rizzo, G.; Gadola, A.; Stöck, M. Test Method for Thermal Characterization of Li-Ion Cells and Verification of Cooling Concepts. Batteries 2017, 3, 3. [Google Scholar] [CrossRef] [Green Version]
- Neupane, S.; Alipanah, M.; Barnes, D.; Li, X. Heat Generation Characteristics of LiFePO4 Pouch Cells with Passive Thermal Management. Energies 2018, 11, 1243. [Google Scholar] [CrossRef] [Green Version]
- Abdul-Quadir, Y.; Laurila, T.; Karppinen, J.; Jalkanen, K.; Vuorilehto, K.; Skogstrom, L.; Krockel, M.P. Heat generation in high power prismatic Li-ion batterycell with LiMnNiCoO2 cathode material. Int. J. Energy Res. 2014, 38, 1424–1437. [Google Scholar] [CrossRef]
- Marcicki, J.; Yang, Z.X.G. Model-Based Estimation of Reversible Heat Generation in Lithium-Ion Cells. J. Electrochem. Soc. 2014, 161, 1794–1800. [Google Scholar] [CrossRef]
- Doyle, M.; Fuller, T.F.; Newman, J. Modeling of galvanostatic charge and discharge of the lithium/polymer/insertion cell. J. Electrochem. Soc. 1993, 140, 1526–1533. [Google Scholar] [CrossRef]
- Fuller, T.F.; Doyle, M.; Newman, J. Simulation and optimization of the dual lithium Ion insertion cell. J. Electrochem. Soc. 1994, 141, 1–10. [Google Scholar] [CrossRef] [Green Version]
- Gu, W.B.; Wang, C.Y. Thermal-electrochemical modeling of battery systems. J. Electrochem. Soc. 2000, 47, 2910–2922. [Google Scholar] [CrossRef]
- Song, L.; Evans, J.W. Measurements of the thermal conductivity of lithium polymer battery composite cathode. J. Electrochem. Soc. 1999, 146, 869–887. [Google Scholar] [CrossRef]
- Hu, X.; Li, S.; Peng, H. A comparative study of equivalent circuit models for Li-Ion batterie. J. Power Sources 2012, 198, 359–367. [Google Scholar] [CrossRef]
- Manoj, M.; Mastali, M.; Catton, J.; Samadani, E.; Janhunen, S.; Fowler, M. Thermal modeling appreoaches for LiCoO2 Liyhium-ion battery A comparative study with experimental validation. Batteries 2020, 6, 40. [Google Scholar]
- He, H.; Xiong, R.; Fan, J. Evaluation of Lithium-Ion Battery Equivalent Circuit Models for State of Charge Estimation by an Experimental Approach. Energies 2011, 4, 582–598. [Google Scholar] [CrossRef]
- Linden, D.; Reddy, T.B. Handbook of Batteries, 3rd ed.; McGraw-Hill: New York, NY, USA, 2002. [Google Scholar]
- Huria, T.; Ceraolo, M.; Gazzarri, J.; Jackey, R. High fidelity electrical model with thermal dependence for characterization and simulation of high-power lithium battery cells. In Proceedings of the 2012 IEEE International Electric Vehicle Conference, Greenville, SC, USA, 4–8 March 2012. [Google Scholar]
- Feng, J.; Yongling, H.; Guofo, W. Comparison study of equivalent circuit model of li- Ion battery for electrical vehicles. Res. J. Appl. Sci. 2013, 6, 3756–3759. [Google Scholar]
- Hussein, A.A. Experimental modeling and analysis of lithium-ion battery temperature dependence. In Proceedings of the IEEE Applied Power Electronics Conference and Exposition, Charlotte, NC, USA, 15–19 March 2015. [Google Scholar]
- Barai, A.; Chouchelamane, G.H.; Guo, Y.; McGordon, A.; Jennings, P. A study on the impact of lithium-Ion cell relaxation on electrochemical impedance spectroscopy. J. Power Sources 2015, 280, 74–80. [Google Scholar] [CrossRef]
- Schweiger, H.G.; Obeidi, O.; Komesker, O.; Raschke, A.; Schiemann, M.; Zehner, C.; Gehnen, M.; Keller, M.; Birke, P. Comparison of several methods for determining the internal resistance of lithium ion cells. Sensors 2010, 10, 5604–5625. [Google Scholar] [CrossRef] [Green Version]
- Ratnakumar, B.; Smart, M.; Whitcanack, L.; Ewell, R. The impedance characteristics of mars exploration rover Li-Ion batteries. J. Power Sources 2006, 159, 1428–1439. [Google Scholar] [CrossRef]
- Olofsson, Y.; Groot, J.; Katrasnik, T.; Tavcar, G. Impedance spectroscopy characterisation of automotive NMC/Graphite Li-Ion cells aged with realistic phev load profile. In Proceedings of the IEEE Electric Vehicle Conference Proceeding, Florence, Italy, 17–19 December 2014. [Google Scholar]
- Andre, D.; Meiler, M.; Steiner, K.; Walz, H.; Soczka-Guth, T.; Sauer, D.U. Characterization of high-power lithium-ion batteries by electrochemical impedance spectroscopy. II: Modelling. J. Power Sources 2011, 196, 5349–5356. [Google Scholar] [CrossRef]
- Bandhauer, T.M.; Garimella, S.; Fuller, T.F. A Critical Review of Thermal Issues in Lithium-Ion Batteries. J. Electrochem. Soc. 2011, 158, R1–R25. [Google Scholar] [CrossRef]
- Bernardi, D.; Pawlikowski, E.; Newman, J.A. general energy balance for battery systems. J. Electrochem. Soc. 1985, 132, 5–12. [Google Scholar] [CrossRef] [Green Version]
- LEV50N, Technical Information; Lithium Energy Japan: Ritto, Japan, 2012.
- Marquardt, D.W. An algorithm for least-squares estimation of nonlinear parameters. J. Soc. Ind. Appl. Math. 1963, 11, 431–441. [Google Scholar] [CrossRef]
- Nelder, J.; Mead, A.R.A. Simplex method for function minimization. Comput. J. 1965, 7, 308–313. [Google Scholar] [CrossRef]
- Fuh, C.C.; Tsai, H.H. Parameter identification using the Nelder-Mead simplex algorithm for low signal to noise ration systems in a frequency domain. J. Mar. Sci. Technol. 2009, 27, 332–342. [Google Scholar] [CrossRef]
- Trigui, R.; Jeanneret, B.; Badin, F. Modélisation systémique de véhicules hybrides en vue de la prédiction de leurs performances énergétiques et dynamiques. Construction de la bibliothèque de modèles VEHLIB. Rech. Transp. Sécurité 2004, 21, 29–150. [Google Scholar] [CrossRef]
- Boutaous, M.; Zinet, M.; Mathieu, E.; Buathier, S.; Xin, S. Identification of the equivalent electrical model parameters and thermal properties of a LMO/Graphite battery cell for full electric vehicle. In Proceedings of the 10th International Conference on Ecological Vehicles and Renewable Energies Proceeding, Monte Carlo, Monaco, 31 March–2 April 2015. [Google Scholar]
Figure 1.
Diagram of the i-order RC battery model.

Figure 2.
Manufacturer’s data of the open circuit voltage versus SOC [31].
Figure 2.
Manufacturer’s data of the open circuit voltage versus SOC [31].

Figure 3.
Experimental setup.

Figure 4.
Current profiles used to cycle the battery cell (a) (imposed current: red, measured current: blue) and State of Charge evolution (b). The charging and discharging periods are separated by rest periods, and globally the profile discharges the cell.
Figure 4.
Current profiles used to cycle the battery cell (a) (imposed current: red, measured current: blue) and State of Charge evolution (b). The charging and discharging periods are separated by rest periods, and globally the profile discharges the cell.

Figure 5.
Diagram of the 0-order battery electrical model.

Figure 6.
Diagram of the 1st-order battery electrical model.

Figure 7.
Diagram of the 2nd-order battery electrical model.

Figure 8.
Cell voltages of the measurement and the identified Thevenin model and relative error.

Figure 9.
Speed profile of the New European Driving Cycle versus time.

Figure 10.
Current profile equivalent to a NEDC cycle.

Figure 11.
SOC evolution within the 8 NEDC cycles.

Figure 12.
Cell voltages (measurement and Rint model) and relative error during the 8 NEDC.

Figure 13.
Comparison between measurement and Thevenin model prediction.

Figure 14.
Comparison between cell voltage response and battery model (DP model).

Figure 15.
Comparison of the measured and calculated cell voltages. The Thevenin model used depends not only on the cell temperature but also on its SOC.
Figure 15.
Comparison of the measured and calculated cell voltages. The Thevenin model used depends not only on the cell temperature but also on its SOC.

Figure 16.
Verification test performed using 4 NEDC; comparison of the Rint model prediction with the experimental data and relative error is at the same level as in Figure 12.
Figure 16.
Verification test performed using 4 NEDC; comparison of the Rint model prediction with the experimental data and relative error is at the same level as in Figure 12.

Figure 17.
Verification test performed using 4 NEDC; comparison of the Thevenin model prediction with the experimental data and relative error is even at a lower level than in Figure 12.
Figure 17.
Verification test performed using 4 NEDC; comparison of the Thevenin model prediction with the experimental data and relative error is even at a lower level than in Figure 12.

Figure 18.
Heat generation predicted with Bernardi model: (a) Total heat, (b) Reversible and irreversible parts.
Figure 18.
Heat generation predicted with Bernardi model: (a) Total heat, (b) Reversible and irreversible parts.

Figure 19.
Comparison of cell temperature between experimental and numerical results: (a) measured and calculated cell temperatures, (b) absolute error.
Figure 19.
Comparison of cell temperature between experimental and numerical results: (a) measured and calculated cell temperatures, (b) absolute error.

Figure 20.
Infrared temperature measurement on a cell surface during NEDC cycling.


Table 1.
Detailed specification of a full pulse.
| Time Step (s) | I Measured (A) | I Imposed (A) | SOC Reduction | Umax, Umin (V) |
|---|---|---|---|---|
| 50 | 0 | 0 | 0.975 | 4.08 |
| 150 | −54 to −50 | −50 | 0.975 to 0.934 | 4.08 to 3.99 |
| 100 | 0 | 0 | 0.9337 | 3.99 to 4.06 |
| 100 | +50 | +50 | 0.9337 to 0.9661 | 4.06 to 4.14 |
| 100 | 0 | 0 | 0.9661 to 9615 | 4.14 to 4.08 |
| 150 | −119 to −107 | −100 | 0.9615 to 0.871 | 4.08 to 3.89 |
| 100 | 0 | 0 | 0.871 to 0.869 | 3.89 to 4.03 |
| 100 | 80 to 73 | 100 | 0.869 to 0.911 | 4.03 to 4.15 |
| 100 | 0 | 0 | 0.911 to 0.910 | 4.15 to 4.05 |
| 50 | −150 | −150 | 0.910 to 0.870 | 4.05 to 3.87 |
| 100 | 0 | 0 | 0.870 | 3.87 to 4.04 |
| … | … | … | … | … |
| 0.1 | 3.49 |
Publisher’s Note: MDPI stays neutral with regard to jurisdictional claims in published maps and institutional affiliations. |
© 2021 by the authors. Licensee MDPI, Basel, Switzerland. This article is an open access article distributed under the terms and conditions of the Creative Commons Attribution (CC BY) license (https://creativecommons.org/licenses/by/4.0/).
Share and Cite
MDPI and ACS Style
Mahfoudi, N.; Boutaous, M.; Xin, S.; Buathier, S. Thermal Analysis of LMO/Graphite Batteries Using Equivalent Circuit Models. Batteries 2021, 7, 58. https://0-doi-org.brum.beds.ac.uk/10.3390/batteries7030058
AMA Style
Mahfoudi N, Boutaous M, Xin S, Buathier S. Thermal Analysis of LMO/Graphite Batteries Using Equivalent Circuit Models. Batteries. 2021; 7(3):58. https://0-doi-org.brum.beds.ac.uk/10.3390/batteries7030058
Chicago/Turabian StyleMahfoudi, Nadjiba, M’hamed Boutaous, Shihe Xin, and Serge Buathier. 2021. "Thermal Analysis of LMO/Graphite Batteries Using Equivalent Circuit Models" Batteries 7, no. 3: 58. https://0-doi-org.brum.beds.ac.uk/10.3390/batteries7030058
Note that from the first issue of 2016, this journal uses article numbers instead of page numbers. See further details here.