Article

High-Potential Test for Quality Control of Separator Defects in Battery Cell Production

1
Elenia Institute for High Voltage Technology and Power Systems, Technische Universität Braunschweig, Schleinitzstraße 23, 38106 Braunschweig, Germany
2
Battery LabFactory Braunschweig, Technische Universität Braunschweig, Langer Kamp 19, 38106 Braunschweig, Germany
3
Keysight Labs Linz, Keysight Technologies Austria GmbH, Gruberstrasse 40, 4020 Linz, Austria
4
Institute of Machine Tools and Production Technology (IWF), Technische Universität Braunschweig, Langer Kamp 19b, 38106 Braunschweig, Germany
*
Authors to whom correspondence should be addressed.
Submission received: 9 July 2021 / Revised: 1 August 2021 / Accepted: 17 September 2021 / Published: 24 September 2021

Abstract

:
Lithium-ion batteries are a key technology for electromobility; thus, quality control in cell production is a central aspect for the success of electric vehicles. The detection of defects and poor insulation behavior of the separator is essential for high-quality batteries. Optical quality control methods in cell production are unable to detect small but still relevant defects in the separator layer, e.g., pinholes or particle contaminations. This gap can be closed by executing high-potential testing to analyze the insulation performance of the electrically insulating separator layer in a pouch cell. Here, we present an experimental study to identify different separator defects on dry cell stacks on the basis of electric voltage stress and mechanical pressure. In addition, finite element modeling (FEM) is used to generate physical insights into the partial discharge by examining the defect structures and the corresponding electric fields, including topographical electrode roughness, impurity particles, and voids in the separator. The test results show that hard discharges are associated with significant separator defects. Based on the study, a voltage of 350 to 450 V and a pressure of 0.3 to 0.6 N/mm2 are identified as optimum ranges for the test methodology, resulting in failure detection rates of up to 85%.

1. Introduction

Lithium-ion batteries (LIBs) are used in mobile consumer devices (e.g., smartphones, tablets, and laptops) and also in the electrification of powertrains in passenger cars and commercial vehicles. [1] Compared to other battery technologies, LIBs represent a key technology due to their favorable properties such as the high specific energy density (160–180 Wh/kg) as well as the good long-term stability (SOH over 80% after more than 2000 cycles) [1,2,3,4,5,6,7]. For the success of electromobility, it is therefore imperative to produce high-quality batteries and to keep production costs as low as possible. Electrolyte filling and forming are relatively cost-intensive process steps at the end of the production chain due to high material costs and long process time [8]. Thus, precise, fast, and nondestructive quality tests on the dry cell stack contribute to early failure identification and consequently, to cost savings. Besides investigating electrodes, quality tests are also applied to examine the separator quality. The separator is a polymeric membrane, coated with ceramic materials for some applications, that allows the transport of lithium ions while impeding short-cuts between anode and cathode [9]. Consequently, the separator is functionally crucial for the battery cell, and separator defects may result in a local hot spot as well as lead to a thermal runaway of the cell [10]. Therefore, quality control as well as detection of defects and poor insulation performance of the separator are essential and have a significant influence on costs, service life, and safety of cells [11,12].
In addition to standard quality control done by the materials manufacturers, the separator and the electrodes are typically subject to optical quality control in the cell assembly process [1,13,14]. Most of the approaches are based on online scan camera systems. This enables the detection of defects in the range of a few hundred micrometers in the components and a reliable sorting out of defects outside acceptable ranges. Because of the huge variety of separators, the implementation of vision systems in the production processes causes high manual adaptation efforts. Similarly, defects introduced during the assembly and the production process cannot be identified. For example, melting particles can be generated during the laser cutting process and accumulate on the electrodes. This can result in an electrical short circuit and is, therefore, a safety-critical condition of the battery cell. In this case, the applied optical defect detection is limited due to the different sizes and materials of the particles [15]. Other nondestructive methods for inspecting the separator for holes and particles are based on ultrasound or airflow [16,17]. The ultrasound inspection allows to locate and visualize the defects in flat and thin battery cells, e.g., pouch-cell. However, an ultrasound measurement currently still takes several minutes [14]. The nondestructive method based on the airflow resistance of a separator can identify holes and cracks since defects have a negative influence on the airflow resistance and enable the air to pass through the separator. This measurement can also be used to identify the quantity and size of the defects. However, it does not cover the electrical insulation performance of the separator [17].
Partial discharge (PD) is a known process within electrical insulation layers when high-potential stress is applied to the insulating material. Partial discharges are electrical discharges in only a partial area of the insulation. They do not immediately lead to breakdown, but to erosion and aging. PDs increasingly deteriorate the insulation [18]. It usually starts with voids, cracks, or inclusions and can eventually lead to a complete breakdown of the insulation capacity. While partial discharge is commonly used to inspect electrical equipment, it can be potentially used as an electrical nondestructive test of battery cells to detect defects in the separator layer, e.g., pinholes and particle contamination. Within the dielectric separator material, small air-filled voids can lead to an increased electrical field due to the smaller dielectric constant of air compared with the separator material. If this local electric field strength around the air void surpasses the corona inception voltage, partial discharge is initiated, and high-frequency transient current pulses will appear. Thereby, defects in the separator layer weaken the insulation performance and reduce the electrical voltage where breakdowns occur. As such, partial discharge can be potentially used to test the insulation resistance of the separator. If no breakdown occurs at a preselected voltage, the test is passed [19]. Nevertheless, there are no standards or legal requirements for carrying out the test, but the insulation must have a dielectric strength specified in the standard [20]. Various institutions and safety agencies demand a HiPot Test with a voltage of 500 V, so that consumers are not endangered by the products they use.
In summary, no fast and reliable nondestructive electrical quality test for the detection of pinholes and particles deposition is available for battery cell production. To close this gap, we aim to provide an early detection method of separator defects in the battery production and evaluate high-potential tests. For that, partial discharge was measured with a high-potential test on dry battery cell stacks consisting of anode, separator, and cathode layers. The methodology as well as the test requirements and conditions are discussed in Section 2. Clean reference cell stacks with no particle contamination were compared with cell stacks including metal particles and holes. The failure rate detection was evaluated for both the clean reference cell stacks and the contaminated cell stacks. Various experimental parameters, including the mechanical pressure of the cell stack, were investigated, and an equivalent circuit model was established. Moreover, finite element modeling was developed to analyze the local electrical field strengths of air voids and particles, with the dielectric constant of the separator measured by an accurate electrical probe kit, as described in Section 3. On this basis, recommendations for the establishment of the high-potential test as a quality test for separators in battery cell production are derived.

2. Material and Methods

A description of the developed methods and test environment as well as cell specifications are the subject of this chapter.

2.1. Discharge Measurement Setup and Electric Circuitry Model

Figure 1a shows the electrical schematic of the measurement setup using the Keysight B2985A current-meter connected to the cell under test (CUT). The B2985A has a built-in high-voltage source that can be set to any voltage in the range of 0 V to 1 kV. The current is limited to a maximum of 1 mA, and an additional interlock circuit ensures electric safety. The source is connected to the CUT through a 20 MΩ series resistor. The current-meter provides several current ranges from femto amps to mili amps and sample rates from 100 µs to seconds. Here, we used the 200 µA current range, which has a dynamic range to fully cover a short circuit, estimated by 1 kV/20 MΩ = 50 µA. In addition, the noise floor was low (<10 nA) for precise CUT measurements. The sample rate was 10 kS/s, corresponding to a time resolution of 100 µs. Figure 1b shows a conceptual sketch of a dielectric separator between two electrodes. The arrangement forms a parallel-plate capacitor with a capacity, C, given by Equation (1), where e0 is the permittivity of vacuum, er is the relative permittivity of the separator, and A is the area of the electrodes with distance d:
C = e 0   ×   e r   ×   A/d
The relative permittivity, er, has been determined by independent measurements using a Keysight parallel-plate capacitor fixture at frequencies from 100 Hz to 100 kHz (Keysight 16451B). Figure 1c shows a SPICE simulation model with a voltage source connected through a 20 MΩ series resistance to the CUT, which is represented by its equivalent capacitance. For the specific experimental conditions (er = 3, A = 16 cm2, d = 23 µm), the capacitance was calculated to be 1.6 nF. To model the discharge process, a voltage-controlled switch was added to the circuit. During its off-state, the switch acts as a perfect isolator, and during its on-state, it behaves like a 1 Ω resistor, allowing a high-current fast discharge. The switch is controlled by a pulse voltage source that supplies a short pulse (1 ms duration) after 0.5 s.
The resulting voltage waveform is shown in Figure 1d. The transient simulation was started from a defined initial condition with Vcell = 0 V and time t = 0, with Vcell charging up exponentially in the beginning. The exponential time constant is given by Equation (2), with R being the series resistance and C being the equivalent cell capacitance (see inset of Figure 1d).
τ   =   R   ×   C
At 0.5 s, the discharge pulse occurred and the voltage immediately dropped to zero and started again to rise exponentially with τ = 32 ms.

2.2. Cell Stack Specifications

In this work, cell stacks designed at the Battery LabFactory Braunschweig (BLB) consisting of electrodes and separators without pouch foil housings were investigated. The cell stacks were manufactured in the dry rooms of BLB (room temperature 20 °C and dew point of circulating air −45 °C) to ensure shielding from foreign and unwanted particles. The anode was larger than the cathode to guarantee complete coverage of the cathode area, otherwise inhomogeneous current density distribution and consequent dendrite growth could occur [21]. The anode consisted of surface-modified graphite as active material, as well as carbon black, conductive graphite, and binder. Transition metal mixed oxides (NMC 622) were used as the active material for the cathode. The dimensions of the anode and cathode were 50 × 70 mm and 45.5 × 65 mm, respectively (BLB1 format). The commercially available separator FS 3011 23 from Freudenberg Performance Materials was used. The separator presented an overall thickness of 23 µm and consisted of polyester fibers coated with ceramic.

2.3. Pressure Chamber

A pressing device was developed to clamp the cell stack consisting of cathode, separator, and anode at different pressures (Figure 2). By pressing the multilayer cell stack close together, the amount of ambient air is reduced and reproducible electrical discharge measurements are achieved. The device was manufactured in-house in the mechanical laboratory of the elenia Institute for High-Voltage Technology and Energy Systems. It consists of three aluminum plates, two plastic plates, two threaded rods for mounting, and an M8 screw. The upper aluminum plate serves as a holder for the M8 screw. The force generated when the screw is tightened acts downward on the plates below. The middle metal plate distributes the force acting on it over the entire surface so that the ambient air is forced out of the test specimen.
The separator with cathode, anode, and current collectors is placed between the two 2 cm thick plastic plates, used to insulate the layers from interfering capacitances. The lower metal plate serves as the base of the press. In order to set a certain pressure on the sample, a torque M is applied to the screw. To calculate the pressure for different torques, Equation (5) is used, which results from substituting the Equation (3) into Equation (4) [22]:
p = F/A
M   =   F   ×     ( 0.159   ×   P + µ   ×   0.577   ×   d )
p   =   M / A   ×   ( 0.159   ×   P   +   µ   ×   0.577   ×   d )
Here, p is the pressure, F the effective force, A the area of the sample, M the torque, P the thread pitch (1.25 mm), µ the friction coefficient (depending on the material, here 0.16), 0.159 and 0.577 are defined by pitch and friction angles, and d is the average screw parameter (8.0 mm).

2.4. Discharge Measurement Procedure and Mechanical Pressure

In addition to the forced defects of particle contaminations and the placement of holes in the separator, the external test parameters of pressure, voltage, and duration were varied, and their influence on the electrical discharge rate investigated. The series of measurements started with the lowest adjustable voltage of 10 V to exclude a possible short circuit due to an electrical contact of the electrodes. Then, the voltage was set to 250 V and successively increased in 50 V steps up to 500 V. The test duration was set between 1 and 10 s. To keep the impact on the separator caused by the electric fields low, a test duration of one second was initially selected and the measurement was repeated 10 times. The cell stack was put into the pressure device (see Figure 2), which reduces the effect of air gaps and air enclosures in the stack. The device allowed reproducible measurements at different pressures, which were determined from the different torques used with the chamber (0, 1, 2, and 10 Nm) and the weight pressure of the plates (see Equation (5)). With the relatively larger anode area of the BLB1 format of 3500 mm2, pressure loads of pI = 0.0014, pII = 0.3, pIII = 0.6, and pIV = 3.0 N/mm2 were achieved. For pI, no torque was applied and the pressure was achieved only by the metal plates weight acting on the cell stack [23]. Each series of measurements was carried out with 10 cell stacks each. The electrical discharge test was considered failed if the examined cell stack showed a short circuit or abnormalities that indicated a macroscopic damaged separator. Furthermore, random optical and electron microscopy examinations were performed using a scanning electron microscope (SEM; Phenom ProX Desktop SEM from Phenom World).

2.5. Finite Element Modeling of Defect Structures

Finite element modeling (FEM) was carried out with Comsol Multiphysics 5.5 including 2D, AC/DC module, and electric currents that resemble the experimental conditions of the cell stack. A 23 µm thin dielectric layer with a fixed dielectric permittivity of er = 3 was placed between two conductive electrodes. On the upper electrode, a voltage of 450 V was set, while the bottom electrode was set to ground. Air voids in the separator layer were modeled as spheres with er = 1. The roughness of the electrode interface was considered by a sinusoidal electrode shape of increasing periodicity l/λ and half-sphere radius R. The electric field strength, E, was then calculated and displayed in color codes.

3. Results and Discussion

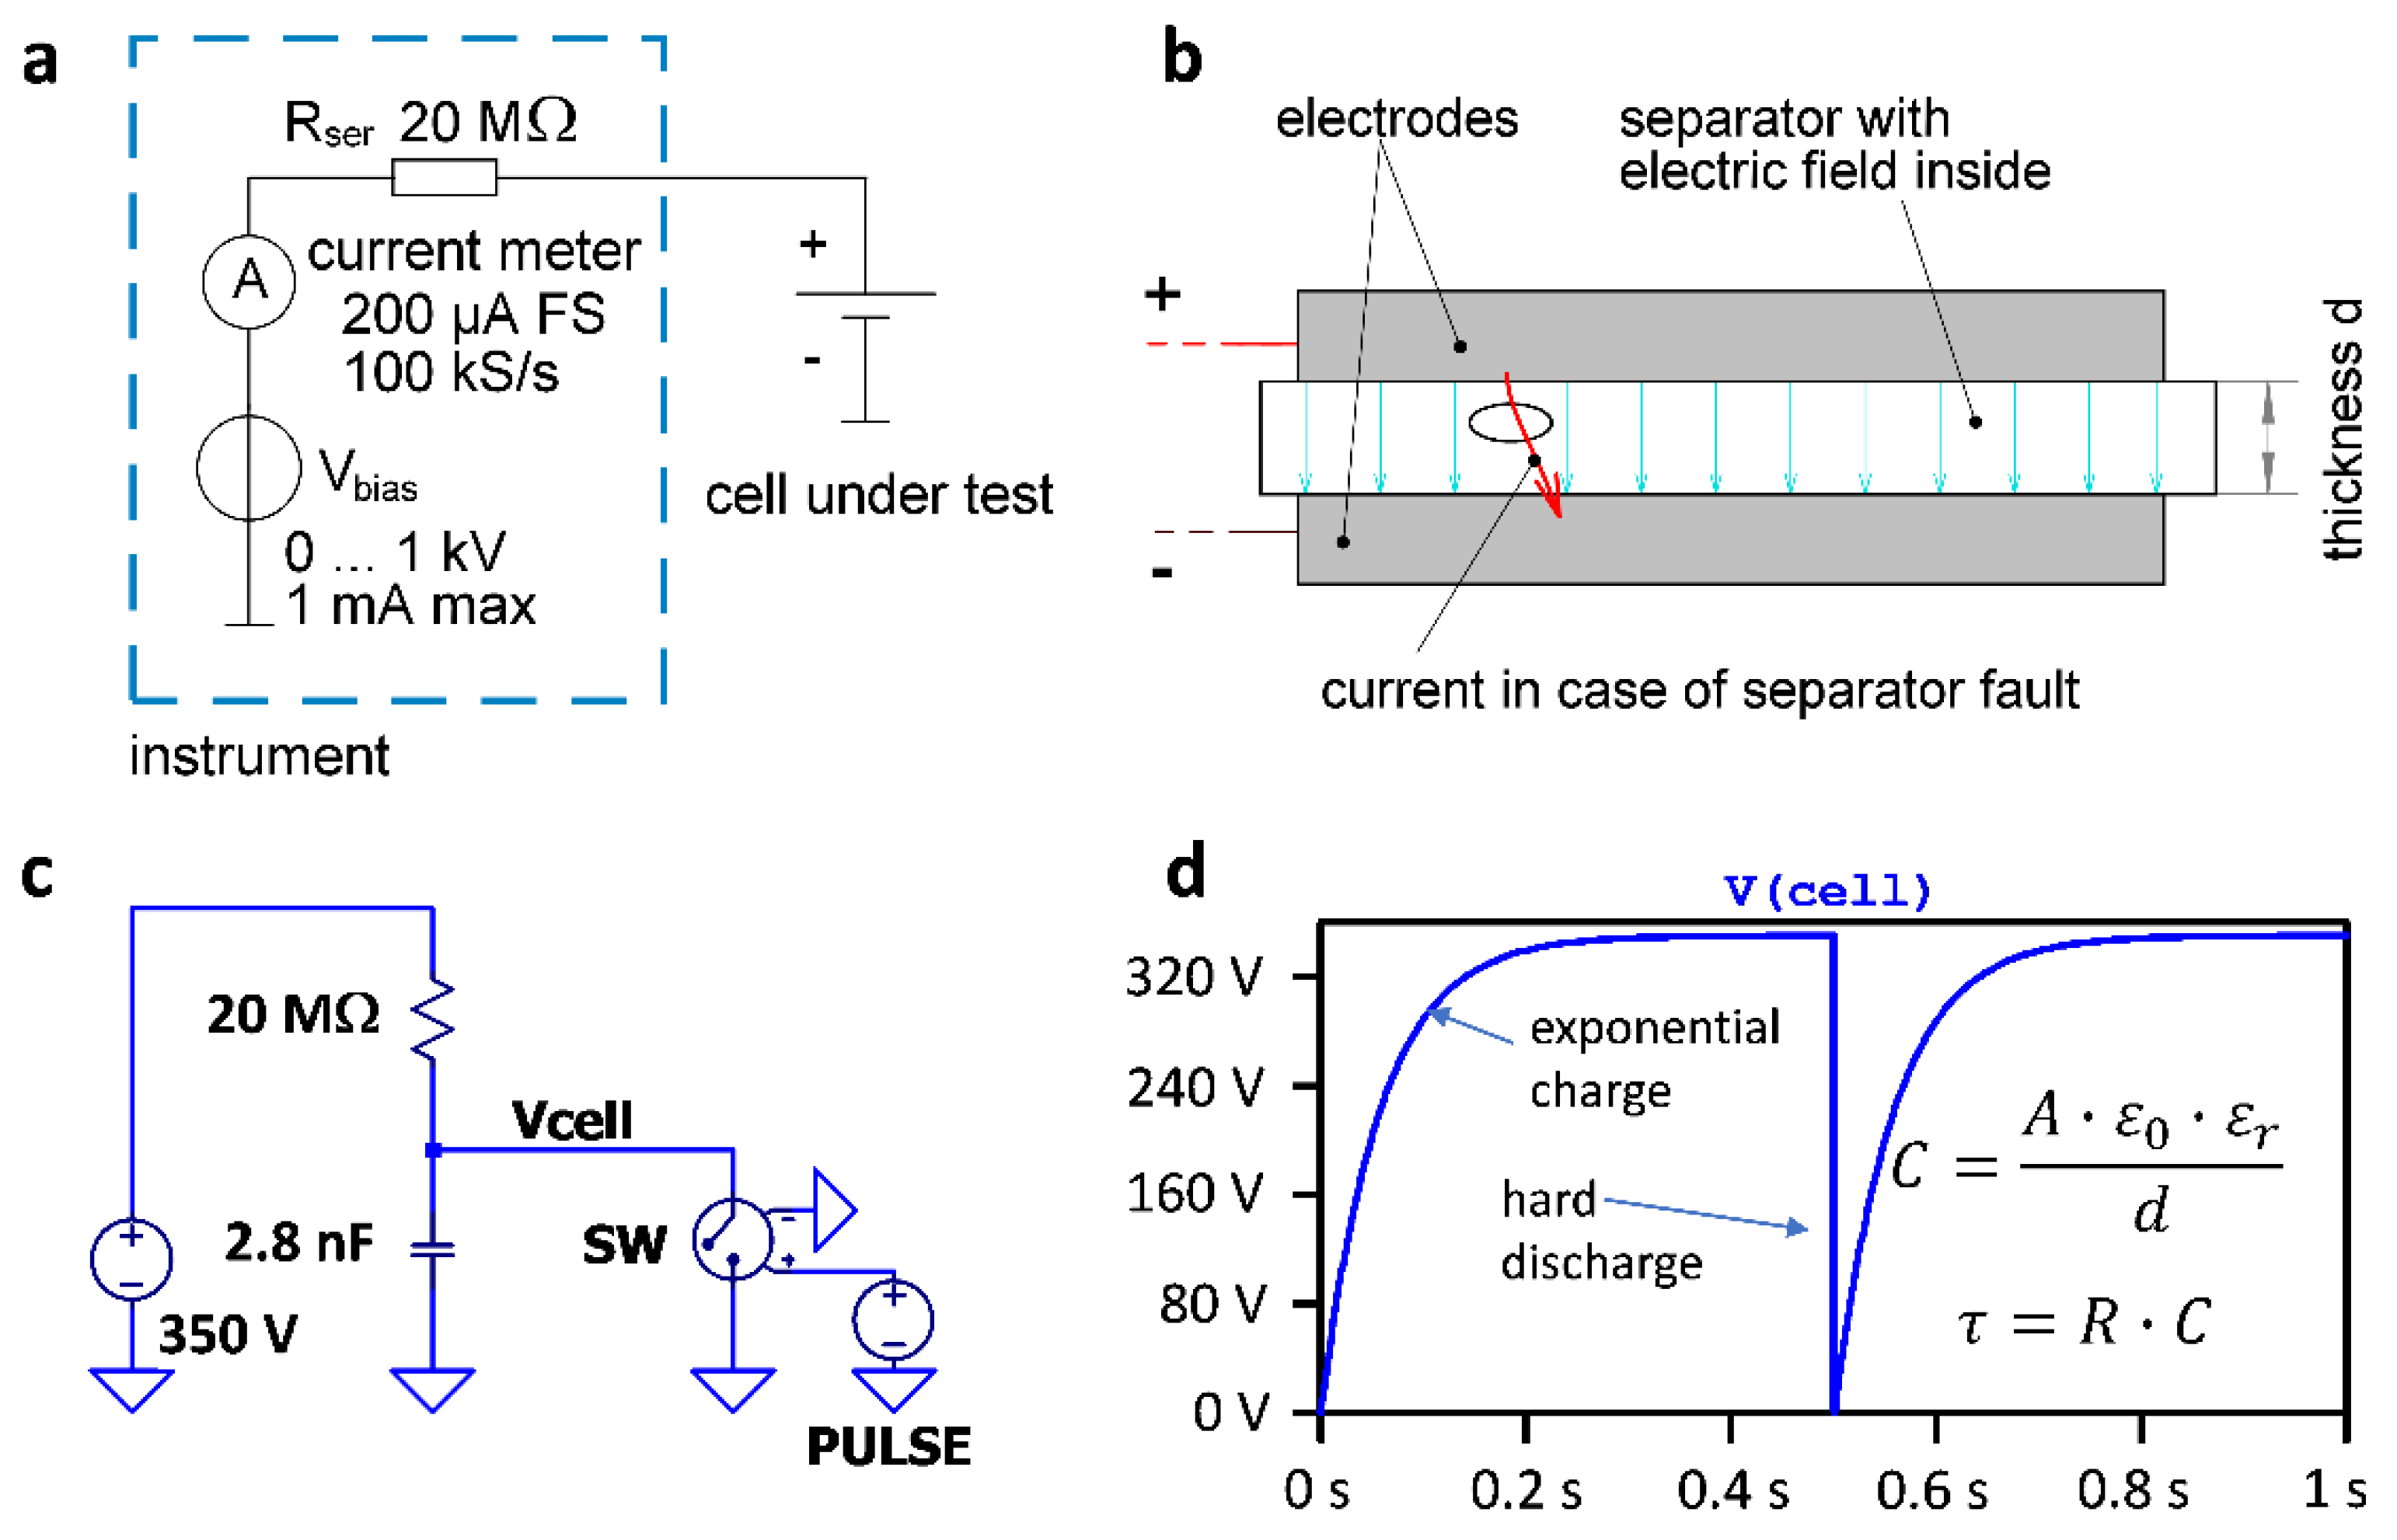
Figure 1a shows the electrical schematic of the measurement setup with a conceptual sketch of the cell stack including a dielectric separator sandwiched between two metallic electrodes and insulation layers (Figure 1b). The electrodes are highly conductive and form equipotential planes according to the applied voltage, V. The distance, d, of the electrodes is given by the separator thickness, and the electric field strength, E, in volts per meter in the separator is calculated by Equation (6):
E = V/d
In case of a separator insulation defect, a local current path through the separator is created that connects the positive and the negative electrodes. This results in an abrupt discharge of the cell capacitance with a high-current pulse, which is flowing locally in the cell and is not accessible from outside. The current-meter measures the external current on the electrode terminals, which is also flowing through the insulation defect. Figure 1c shows a SPICE simulation model used to study the transient process of a separator discharge. In the beginning, Vcell charges up exponentially. At a certain time, the discharge pulse occurs and the voltage immediately drops to zero and starts again to rise exponentially with a time constant of τ = 32 ms.
For the experimental discharge measurements, clean cell stacks with defect-free separators and electrodes as well as cell stacks with forced defects were used. We focused on two forced defects that typically can occur also during cell production to determine their effects on the electrical discharge behavior. Firstly, particle contaminations between the separator and the electrodes were introduced. For this, after the clean cell stack was manufactured in the dry room, particles varying from 10 to 20 µm diameter were deposited by hand with laboratory tweezers on the separator and the electrodes [1,24]. Secondly, micrometer-sized holes were investigated that arise from particles squeezed between the electrodes and the separator. 
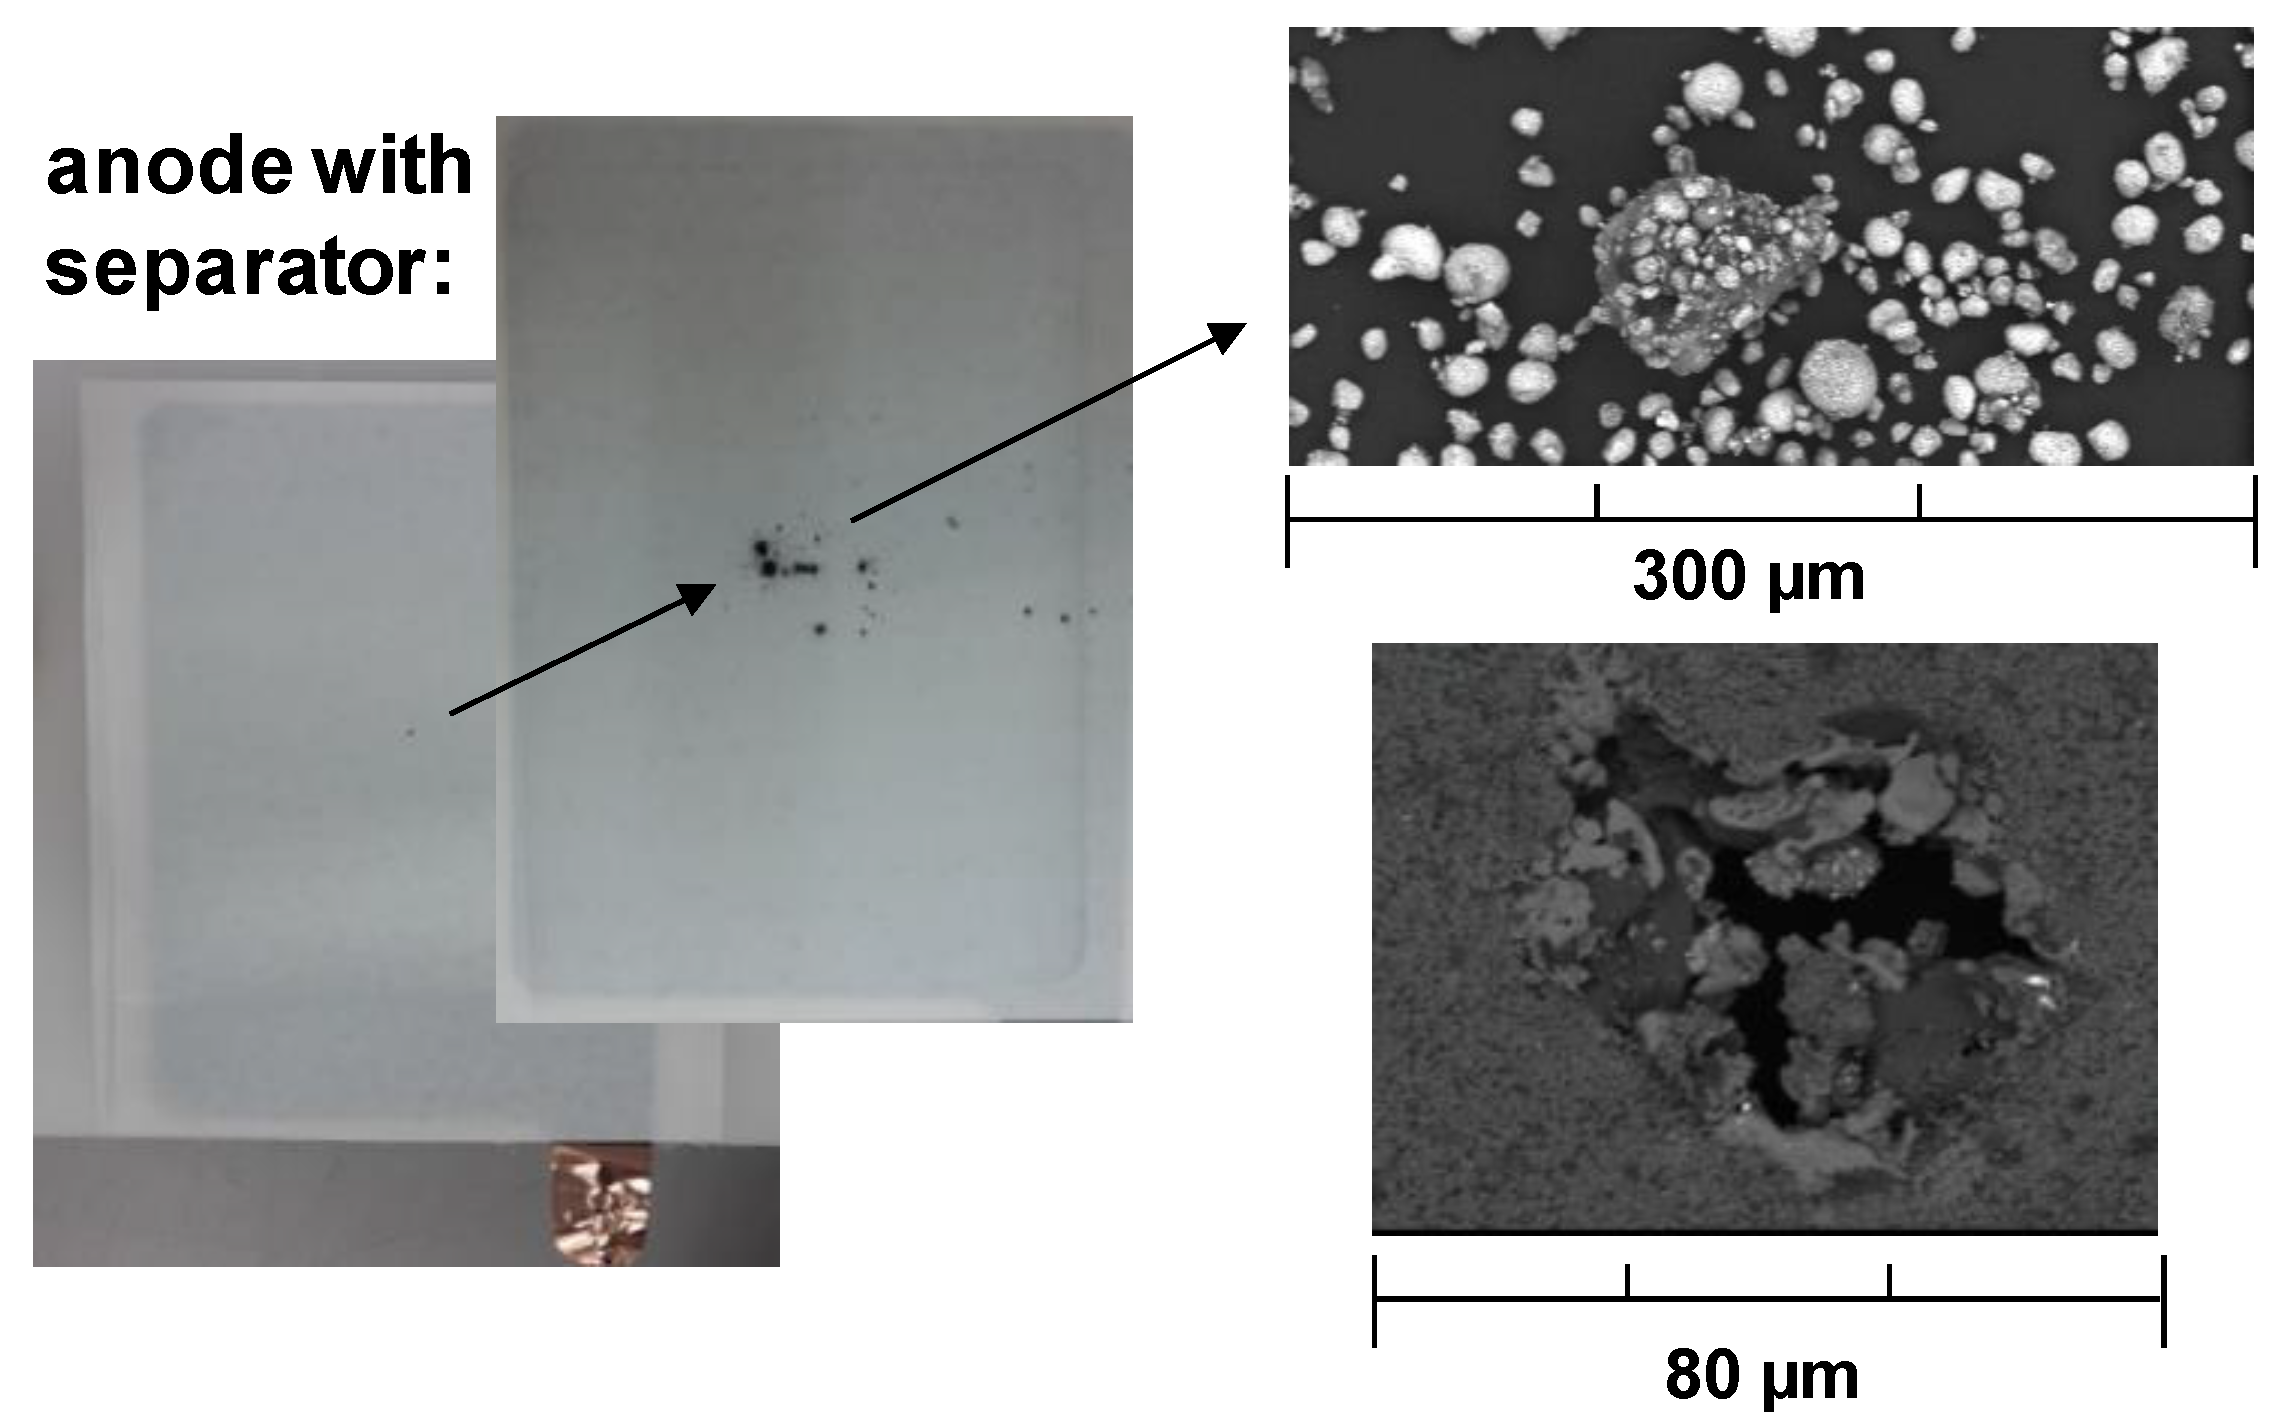
Figure 3 shows optical images (left) and SEM images (right) of the two defect categories before and after the electrical discharge measurements.
The upper right panel in Figure 3 shows a mixture of small particles (~10–20 µm diameter) and a single large agglomerated particle (~80 µm diameter) placed on the separator and imaged before the discharge measurement. The particles were derived from laser cutting of cathode material. The lower right panel in Figure 3 shows a hole with a diameter of ~50 µm created during the measurement of cell stacks with particles. In the manufacturing pilot lines, the main process responsible for small-particle contamination is usually the cutting of electrode sheets. When the electrode sheets are cut with a laser, melt splashes can remain on the electrodes or the evaporated collector material can deposit in the form of metal spots. In addition, during punching, chipped particles and burrs can deposit on the electrode [1]. The particles can then penetrate the separator during cell production and cause electrical contact of the electrodes, causing electrical discharge and shortcuts. Furthermore, small microscopic damages in the separator can develop into larger holes due to the so-called “running mesh effect” caused by mechanical stresses during subsequent manufacturing process steps [25].
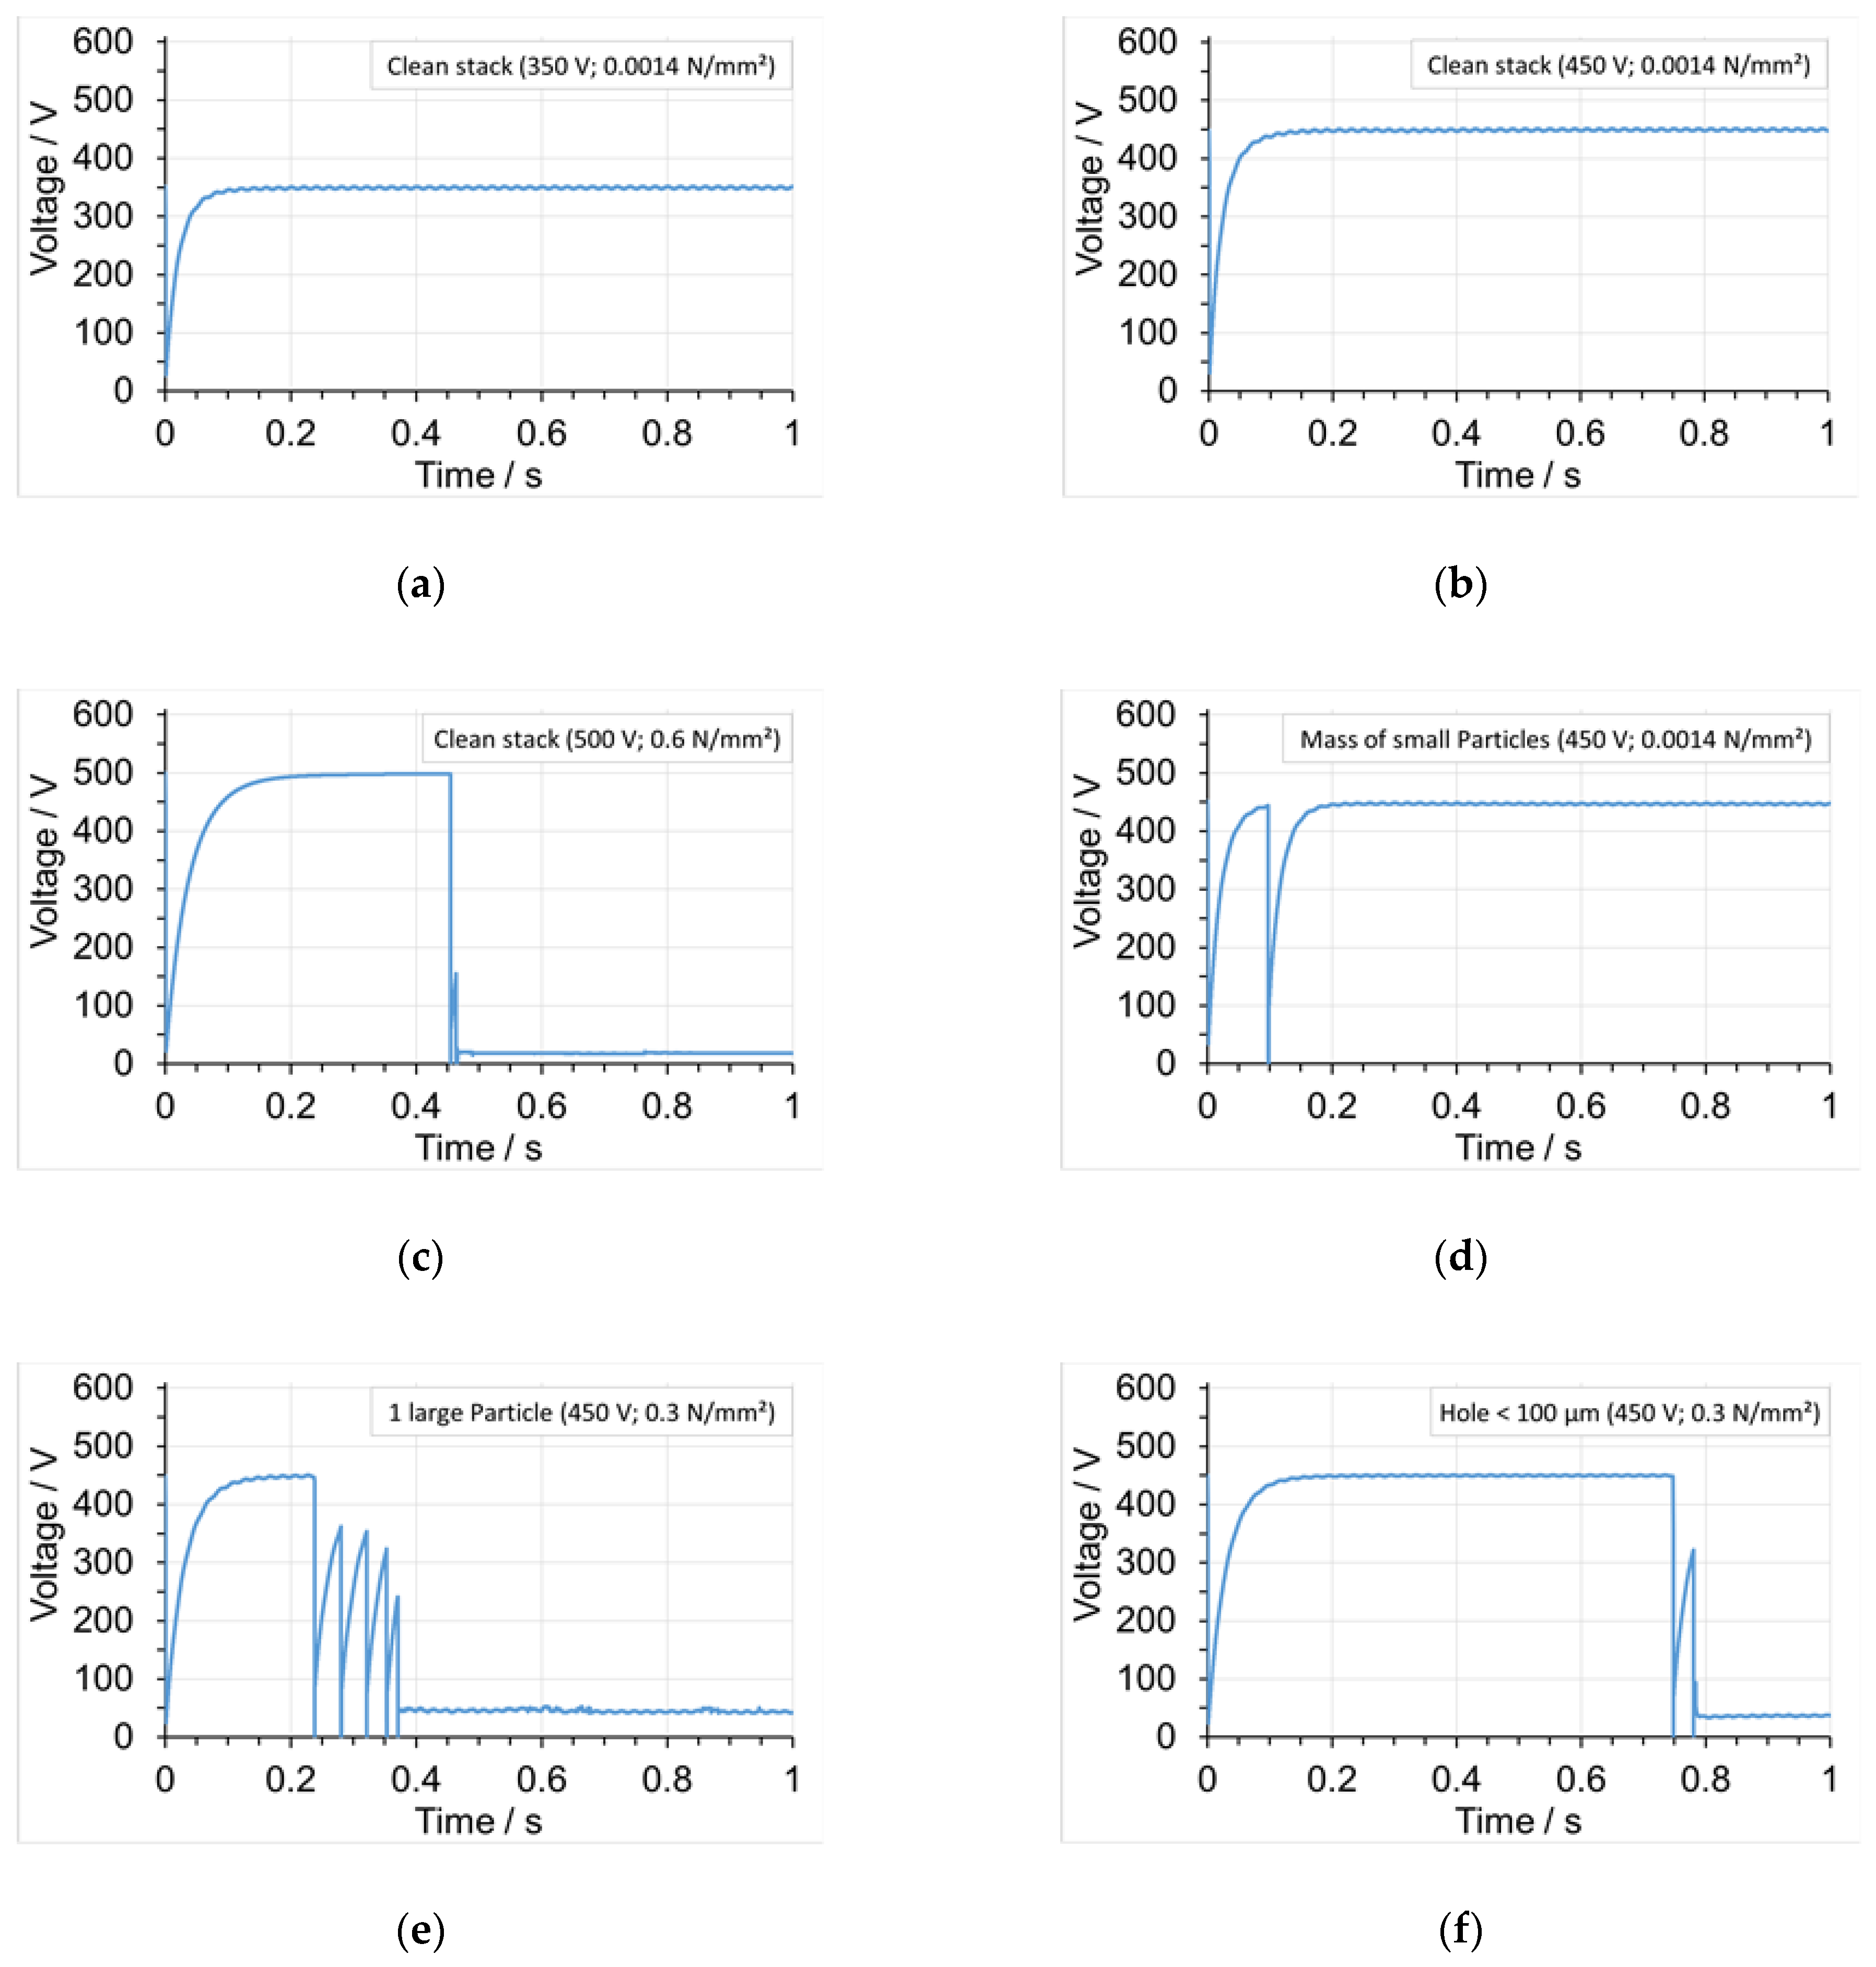
Figure 4 shows different types of electrical discharges measurements on reference cell stacks with no contamination Figure 4a–c in comparison with cell stacks that have forced defects (particles and holes) at different mechanical pressures and voltages Figure 4d–f. The forced defects were distinguished between a mass of small particles with 10–20 µm diameter, a single large particle with approximately 80 µm diameter, and holes with diameters of 10–100 µm. The voltage curves of clean cell stacks showed no breakdown at 350 V and 450 V (Figure 4a,b), while hard discharge (HD) occurred only above 500 V. Figure 4c shows a clean stack with HD at 500 V and 0.6 N/mm2 that led to a permanent loss of the electrical insulation performance and no voltage recovery. For cell stacks with forced defects, the breakdown voltage is lower than 500 V. Figure 4d shows an HD at 450 V with full recovery in a cell stack with a mass of small particles. Here, the cell voltage charged exponentially up to 450 V and, after an HD at 0.1 s, it dropped momentarily to 0 V and the local current in the defect structure increased abruptly (current data not shown).
In full recoveries, the high current leads to a destructive change of the material and, consequently, to a physical disconnection of the defect from the rest of the cell, thereby allowing the cell voltage to recover, in this case, to the original value of 450 V. As such, the hard discharge caused by the defect was only transient and local, while the rest of the cell stack stayed functional. This is similar to the effect of self-healing known for metallic capacitors that can clear a faulty area when a momentary electrical short occurs due to dielectric breakdown under voltage [26]. Figure 4e shows a more complex HD spectrum arising from a cell stack with a single large particle that was charged up to 450 V. Here, the single large particle led to a series of different defects in the electrode–separator composite that unfold subsequently in various discharge events. The voltage recovery from the individual discharge events occurred only partially, and recharging was possible only up to roughly 350 V in the first three events and 250 V in the last event, before it dropped irreversibly to 50 V. This indicates that several small defects in the separator have led, in the beginning, to minor electrical contacts between the electrodes and the separator, while in the end, the electrical insulation performance was lost to a large extent. In Figure 4f, an HD is shown arising from a hole when charged up to 450 V. Only briefly was a partial voltage recovery observed, which quickly and irreversibly fell to the remaining small voltage of <50 V, indicating a significant failure in the separator, which caused a major electrical shortcut and complete loss of the insulation performance. After the electrical discharge experiments, some defects were analyzed in detail under SEM, and melt products from the separator material and the NMC cathode materials were identified. Typically, a contamination with a mass of small particles showed more HD events with recovery, whereas cell stacks with holes mostly showed no recovery. For cell stacks with contamination by a single large particle, both types of HD events were observed and statistically, no trend of a defect type was identified.
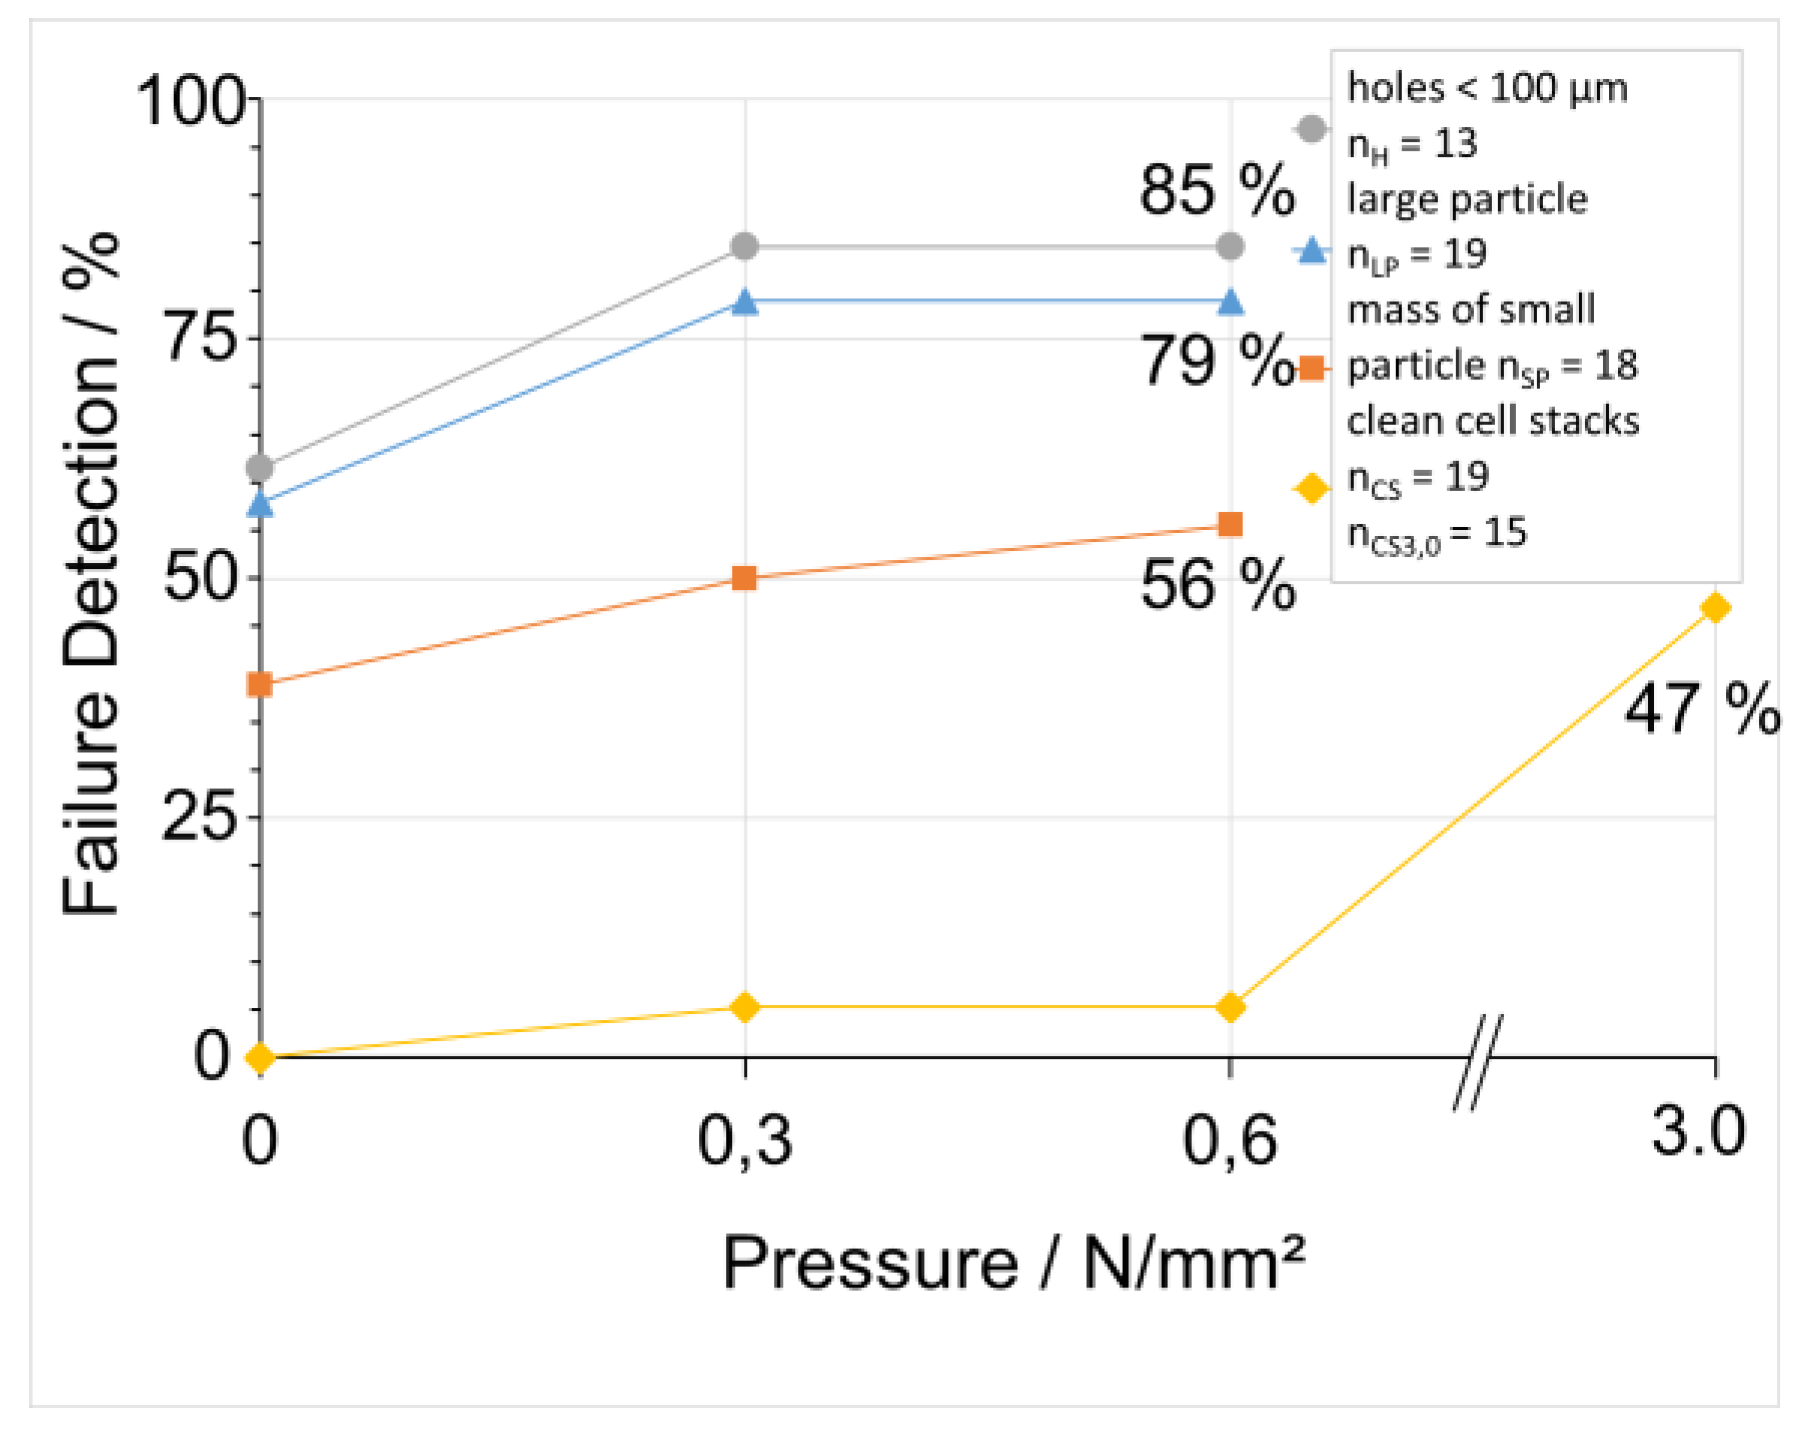
A quantitative assignment of the defect detection rate with respect to the different fault mechanisms and the various mechanical pressures is shown in Figure 5. The defect detection rate was defined as the probability of observing an individual HD event in a voltage curve, independent of the type of HD. We compared the defect detection rate of clean cell stacks with contaminated cell stacks, including contamination with one large particle, a mass of small particles, and holes. Various cell stacks were prepared, and the number of cell stacks that were used for the experiments is given as inset. For instance, to evaluate the defect detection rate of a clean cell stack, 19 different clean cell stacks were assembled and measured at no pressure, pI (0.0014 N/mm2), at pressure pII (0.3 N/mm2), at pressure pIII (0.6 N/mm2), and at pressure pIV (3 N/mm2). In the unpressed state, pI, the failure detection rate was 0% for the clean cell stacks, while it was 40–60% for the cell stacks with defects, with the exact value of the defect detection rate depending on the type of contamination. Typically, the cell stacks with a large particle and holes showed the highest failure detection rates compared to the cell stacks with a mass of small particles. With an increase in the pressure to pII, an increase in the defect detection rate to 50–85% was observed for all contaminations. Additionally, clean cell stacks showed a slightly increased defect rate of 5% at pII. At a pressure of pIII, no major change in the defect detection rate was observed, for the contaminated cell stacks or for the clean cell stacks. As expected, for clean cell stacks, the defect detection rate was very low, and only when the pressure load was highly increased to pIV. Moreover, a significant part (47%) of the clean reference cells showed HD and were damaged. Almost all contaminated cell stacks were damaged at this high pressure (data not shown). Accordingly, a high pressure of 3 N/mm2 is not recommended for using this method as quality test because also clean cell stacks are destroyed.
A pressure ranging from 0.3 to 0.6 N/mm2 seems to be ideal for detecting contaminations without damaging clean cell stacks, leading therefore to a nondestructive investigation method. There was also a slight variation of the breakdown voltage where HD occurs with respect to the different mechanical pressures, and at 0.3 N/mm2, the mean breakdown voltage was around 420 V. For the test duration and data acquisition time, an optimum of 1 s was identified to keep the stress on the separator lowest. For instance, when repetitive measurements were done, the fault detection rate increased slightly because the stress on the cell stack accumulated.
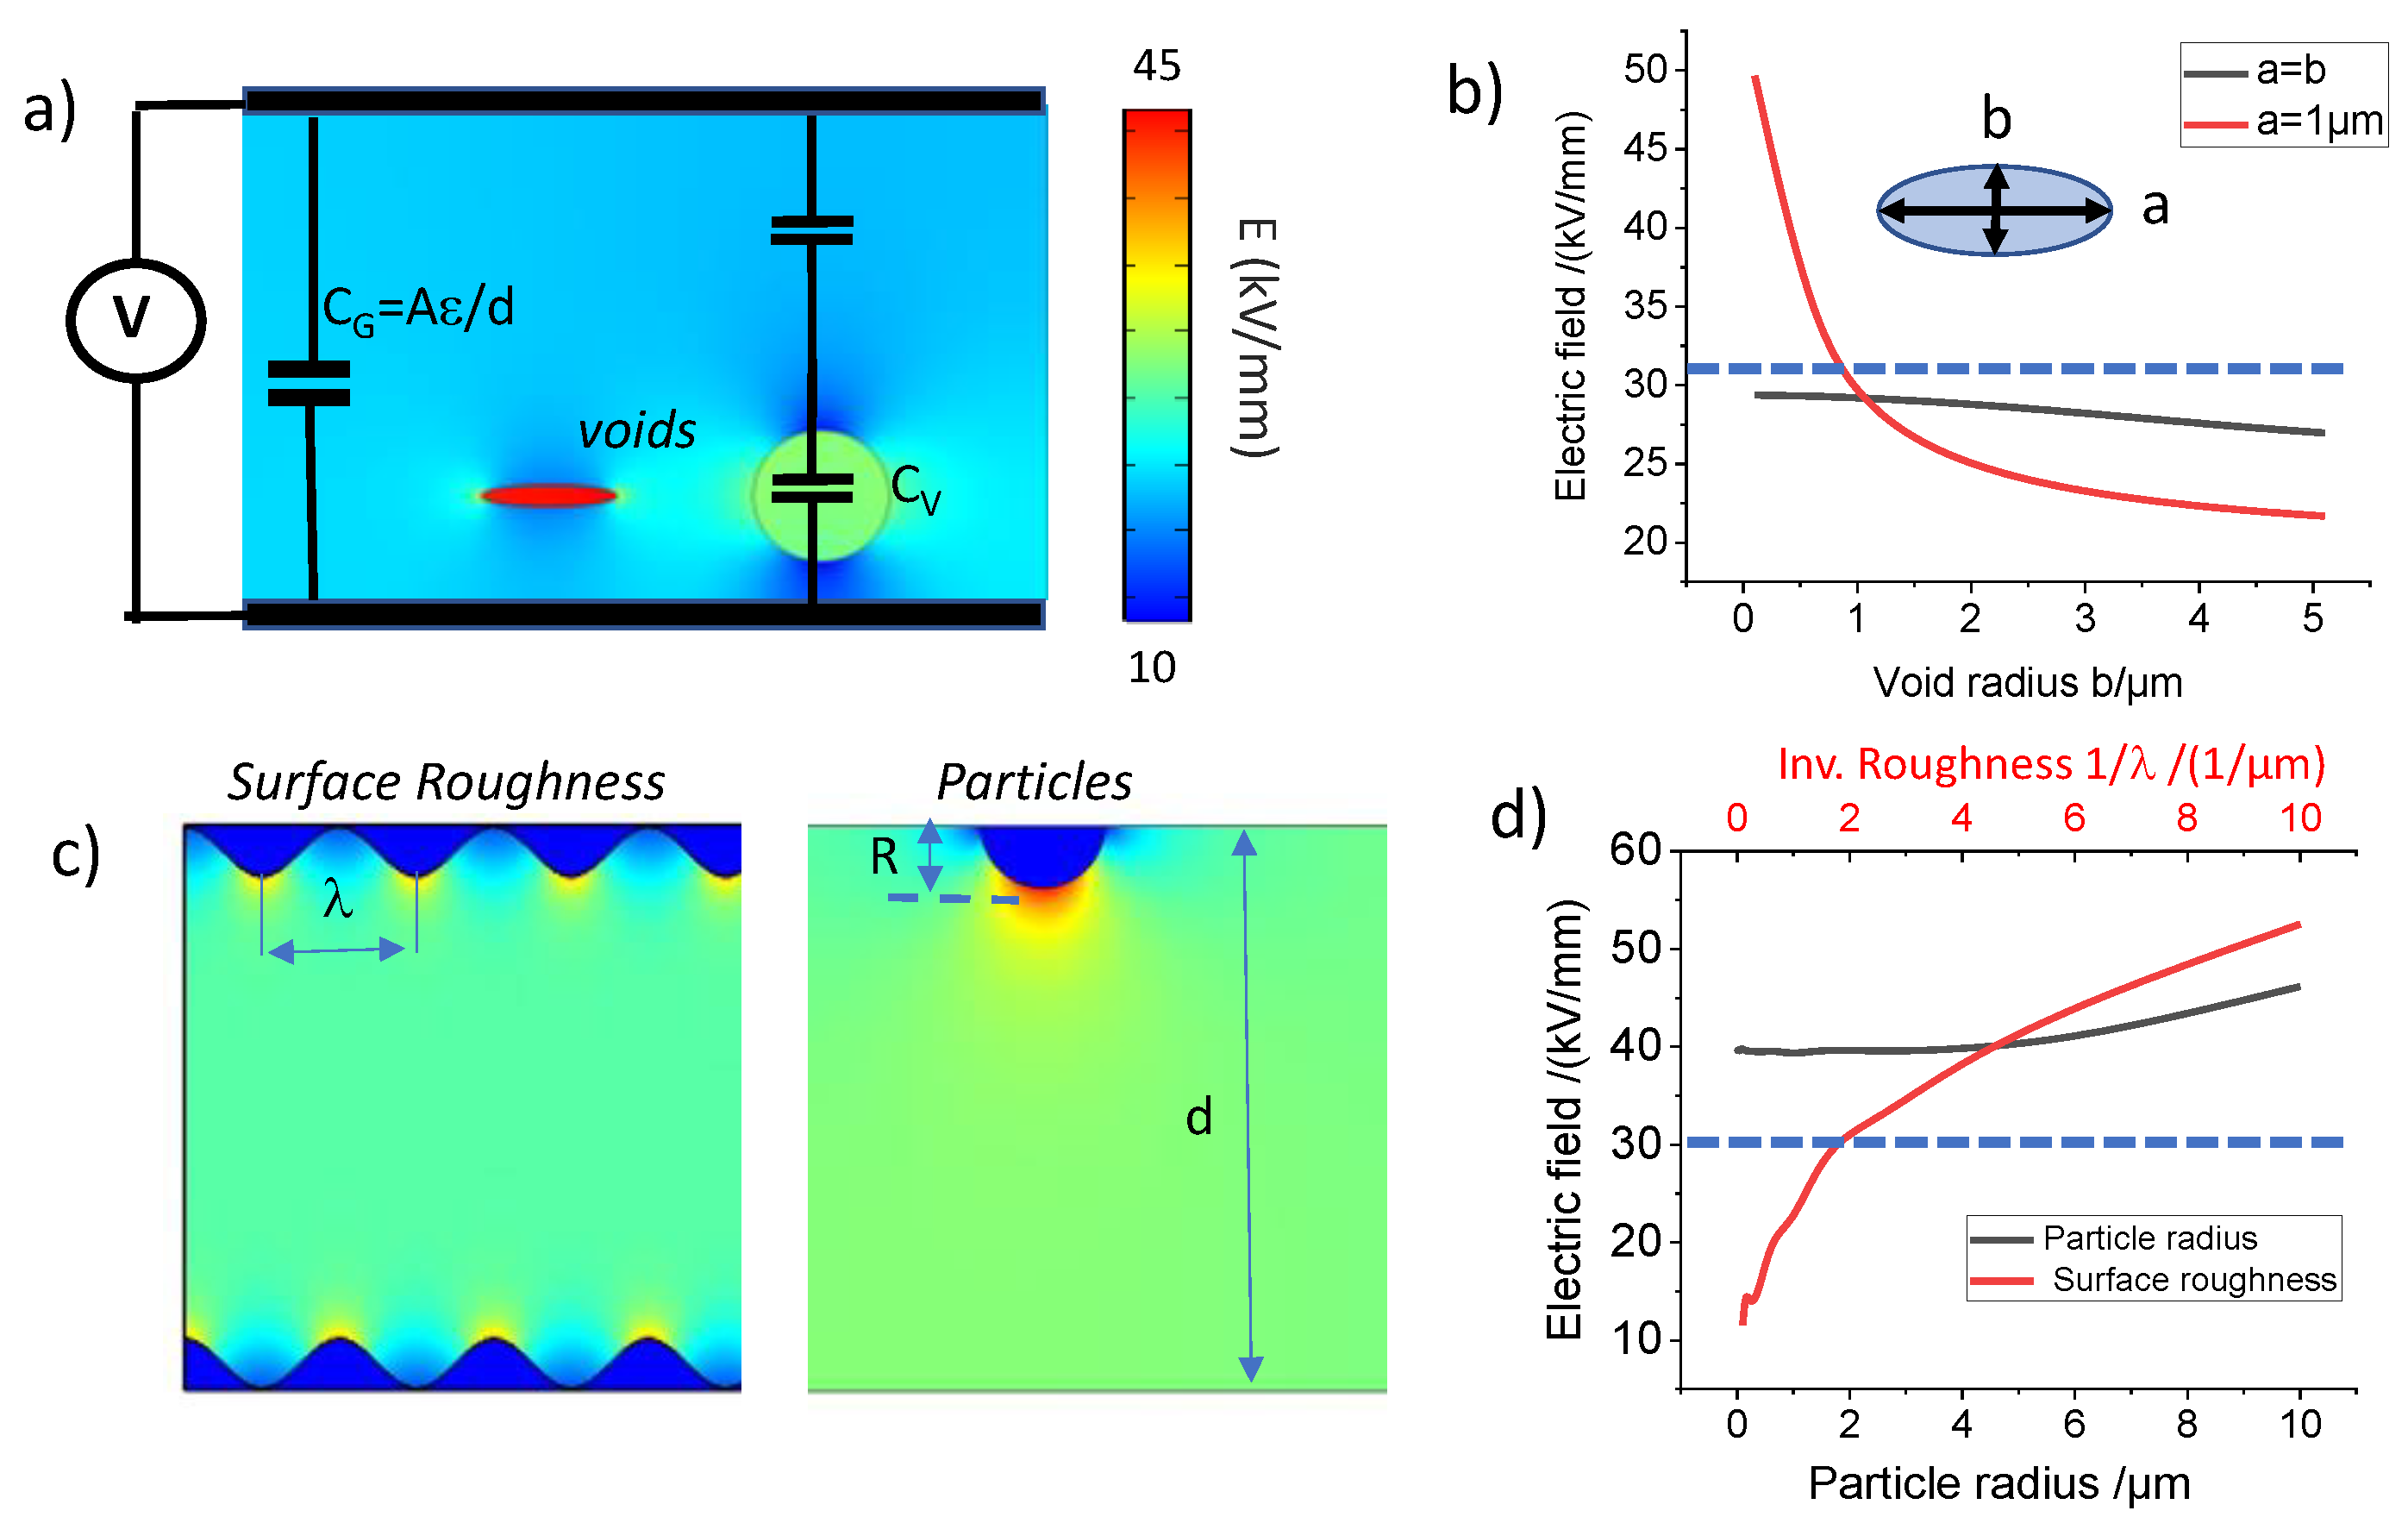
In order to obtain additional physical insights into the HD process, we conducted finite element modeling (FEM) of the defect structures and the corresponding electric fields (E-fields) (Figure 6). According to the electrostatic fields within the cell stack, the probability of electric discharge is a function of the E-field strength between the two electrodes (Figure 6a). The total cell stack capacitance (CG) is described via an ideal parallel-plate capacitor model, CG = A × er/d, with A the electrode area, er = 3 the dielectric constant of the separator, and d the thickness of the separator. The separator dielectric constant was measured using the parallel-plate dielectric probe kit [26]. The voids in the separator, filled with air, decrease locally the dielectric permittivity (eair = 1) and reduce the overall capacitance (CV). Figure 6a shows the calculated E-field distribution in a separator containing air voids, which led to locally increased E-field strengths of up to 20–50 kV/mm. Both the size and the ellipticity of the voids have an influence on the maximum E-field in the separator (Figure 6b). For instance, the smaller and more elliptic the voids are, the higher is the E-field. A similar effect was observed for the surface roughness of the electrode–separator interface (Figure 6c, left). The rougher the surface (i.e., the smaller the wavelength λ), the bigger is the E-field strength at the interface (Figure 6d). Figure 6c, right panel, shows the influence of a single contamination particle with radius R on the E-fields.
An increasing particle size leads to an effective decrease of the electrode separation distance and therefore, at a certain point, to an increase of the E-field (Figure 6d). At a certain E-field strength, the probability of an electric breakdown in the separator rises nonlinearly, leading to an abrupt discharge event as observed in the experiments. For polyester thin films, this so-called “dielectric strength” is typically in the range of 20–50 kV/mm [27]. The FEM results of air voids, electrode surface roughness, and contamination particles lead to E-fields in this range of 20–50 kV/mm, which is similar to the dielectric strength of the separator material used in this study, corroborating the observed failure detection rates of the various contaminated cell stacks.

4. Conclusions and Outlook

Within the scope of this work, we evaluated a high-potential test for early detection of separator defects in the battery production chain. For this, partial discharge was measured on dry battery cell stacks consisting of anode, separator, and cathode layers. Clean reference cell stacks with no contamination were compared with cell stacks that have forced defects, and the failure detection rate was evaluated for a statistically relevant set of cells. We investigated the failure detection rate with respect to the mechanical pressure, the voltage, the test duration, and the repetition on the considered BLB1 pouch cell format. Optimal results for the high-potential tests were achieved with a pressure around 0.3 to 0.6 N/mm2 since the defect detection rate could be increased by this pressure and invasive effects on clean cell stacks can be largely excluded. The test voltage should be around 350–450 V, and due to the high failure detection rate, a measurement time of 1s is sufficient without major repetitions. Physical insights were gained by the SEM analysis of the defect structures, including the size of contamination particles and the diameter of holes in the separator. From FEM, we gained insights into the E-field strengths around spherical and elliptical void geometries. Moreover, different particle diameters were modeled, and the influence of the topographical surface roughness on the E-field strength was analyzed. From this analysis, a semiquantitative relation was achieved between defect structures, the resulting E-fields, and the probability of hard discharge when the dielectric strength of a separator layer is considered. This high-potential test can now be considered for an inline application and quality control within a battery production pilot line, thereby increasing the efficiency of battery production and reducing waste and materials drop-out due to an early detection of cell defects.

Author Contributions

L.H.: conceptualization, investigations, data analysis, and writing of the original draft. M.K. (Manuel Kasper): modeling, discussion, and writing of the original draft. M.K. (Maik Kahn): experimental execution, data analysis, discussion, and writing—review and editing. G.G.: modeling and discussion. G.V.S.: discussion and writing—review and editing. C.H.: discussion and supervision. M.K. (Michael Kurrat): discussion and supervision. F.K.: conceptualization, writing of the original draft, discussion, and project administration. All authors have read and agreed to the published version of the manuscript.

Funding

This work was funded in part by the European Union’s Horizon 2020 research and innovation program NMBP “NanoBat” under grant agreement no. 861962. Furthermore we acknowledge support by the German Research Foundation and the Open Access Publication Funds of Technische Universität Braunschweig.

Institutional Review Board Statement

Not applicable, as studies on humans and animals are not involved.

Informed Consent Statement

Not applicable, as studies on humans are not involved.

Data Availability Statement

The data are not publicly available due to the data required to reproduce these findings forms part of an ongoing study.

Acknowledgments

The authors would like to thank the Battery LabFactory Braunschweig, which provided the measurement infrastructure to carry out the investigations. The authors extend their gratitude to their colleagues from the BLB-team for producing battery electrodes (Institute for Particle Technology), cell stacks (Institute of Machine Tools and Production Technology), and for supporting in the experimental measurement setup (Steffen Masuch). Furthermore, thanks to Amin Moradpour from Keysight Linz for the HiPot software GUI.

Conflicts of Interest

The authors declare no conflict of interest.

References

  1. Leuthner, S.; Korthauer, R. Handbuch Lithium-Ionen-Batterien; Springer: Berlin/Heidelberg, Germany, 2013. [Google Scholar]
  2. Schmuch, R.; Wagner, R.; Hörpel, G.; Placke, T.; Winter, M. Performance and cost of materials for lithium-based rechargeable automotive batteries. Nat. Energy 2018, 3, 267. [Google Scholar] [CrossRef]
  3. Wagner, R.; Preschitschek, N.; Passerini, S.; Leker, J.; Winter, M. Current research trends and prospects among the various materials and designs used in lithium-based batteries. J. Appl. Electrochem. 2013, 43, 481. [Google Scholar] [CrossRef]
  4. Lu, L.; Han, X.; Li, J.; Hua, J.; Ouyang, M. A review on the key issues for lithium-ion battery management in electric vehicles. J. Power Sour. 2013, 226, 272–288. [Google Scholar] [CrossRef]
  5. Thielmann, A.; Sauer, A.; Isenmann, R.; Wietschel, M.; Plotz, P. Produkt-Roadmap Lithium-Ionen-Batterien 2030; Fraunhofer ISI: Karlsruhe, Germany, 2012. [Google Scholar]
  6. Michaelis, S. VDMA: Roadmap Batterie-Produktionsmittel 2030—Update 2020; VDMA Batterieproduktion: Frankfurt am Main, Germany, 2020. [Google Scholar]
  7. Hoffmann, L.; Grathwol, J.-K.; Haselrieder, W.; Leithoff, R.; Jansen, T.; Dilger, K.; Dröder, K.; Kwade, A.; Kurrat, M. Capacity Distribution of Large Lithium-Ion Battery Pouch Cells in Context with Pilot Production Processes. Energy Technol. 2019, 8, 1900196. [Google Scholar] [CrossRef]
  8. Wood, D.L.; Li, J.; Daniel, C. Prospects for reducing the processing cost of lithium ion batteries. J. Power Sour. 2015, 275, 234–242. [Google Scholar] [CrossRef] [Green Version]
  9. Lagadec, M.F.; Zahn, R.; Wood, V. Characterization and performance evaluation of lithium-ion battery separators. Nat. Energy 2019, 4, 16–25. [Google Scholar] [CrossRef] [Green Version]
  10. Nazri, G.-A.; Pistoia, G. Lithium Batteries; Springer: New York, NY, USA, 2009. [Google Scholar]
  11. Orendorff, C.J. The Role of Separators in Lithium-Ion Cell Safety. Electrochem. Soc. Interface 2012, 21, 61. [Google Scholar] [CrossRef]
  12. Nestler, T.; Schmid, R.; Münchgesang, W.; Bezahenov, V. Separators-Technology review: Ceramic based separators for secondary batteries. AIP Conf. Proc. 2014, 1597, 155. [Google Scholar]
  13. Schnell, J.; Reinhart, G. Quality Management for Battery Production: A Quality Gate Concept. Procedia CIRP 2016, 57, 568–573. [Google Scholar] [CrossRef]
  14. Adams, C.W.; Landes, S.C.; Robertson, D.G.; Ferebee, M.W. Continuous Web Inline Testing Apparatus, Defect Mapping System and Related Methods (WO/2015/061543). World Intellectual Property Organization. U.S. Patent Application No. 14/521,747, 30 April 2015. Available online: https://patentscope.wipo.int/search/en/detail.jsf?docId=WO2015061543 (accessed on 7 April 2021).
  15. Huber, J.; Tammer, C.; Krotil, S.; Waidmann, S.; Hao, X.; Seider, C.; Reinhart, G. Method for classification of battery separator defects using optical inspection. Procedia CIRP 2016, 57, 585–590. [Google Scholar] [CrossRef]
  16. Pitta Bauermann, L.; Mesquita, L.V.; Bischoff, C.; Drews, M.; Fitz, O.; Heuer, A.; Biro, D. Scanning acoustic microscopy as a non-destructive imaging tool to localize defects inside battery cells. J. Power Sour. Adv. 2020, 6, 100035. [Google Scholar] [CrossRef]
  17. Li, Y.; Fu, X.; Wang, Y.; Zhong, W.-H.; Li, R. See the invisibles: Inspecting battery separator defects via pressure drop. Energy Storage Mater. 2019, 16, 589–596. [Google Scholar] [CrossRef]
  18. DIN EN 60270 VDE 0434:2016-11. Hochspannungs-Prüftechnik – Teilentladungsmessungen, Berlin, 11-2016. Available online: https://www.beuth.de/de/norm/din-en-60270/257713236 (accessed on 9 November 2020).
  19. DIN. Drehende Elektrische Maschinen—Teil 1: Bemessung und Betriebsverhalten, Berlin, 02-2011. Available online: https://www.beuth.de/de/norm/din-en-60034-1/136748421 (accessed on 9 November 2020).
  20. Perkins, P.E. What Does Your Touch Current Look Like? Making Proper Touch Current Measurements. In Proceedings of the 2014 IEEE Symposium on Product Compliance Engineering (ISPCE), San Jose, CA, USA, 5–7 May 2014. [Google Scholar]
  21. Schmitt, J. Untersuchungen zum Herstellungsprozess des Elektrode-Separator-Verbunds für Lithium-Ionen Batteriezellen. Ph.D. Thesis, Universität Essen, Essen, Germany, 2015. [Google Scholar]
  22. Grote, K.-H.; Feldhusen, J. Taschenbuch für den Maschinenbau, 24th ed.; Springer: Berlin/Heidelberg, Germany, 2014. [Google Scholar]
  23. Cannarella, J.; Arnold, C.B. Stress evolution and capacity fade in constrained lithium-ion pouch cells. J. Power Sour. 2014, 245, 745–751. [Google Scholar] [CrossRef]
  24. Weber, C.J.; Geiger, S.; Falusi, S.; Roth, M. Material Review of Li Ion Battery Separators; AIP Publishing LLC: Melville, SK, Canada, 2014; pp. 66–81. [Google Scholar]
  25. Buser, M.; Mähliß, J. Lithiumbatterien—Brandgefahren und Sicherheitsrisiken: Effektive Schadenverhütung und Wirksame Brandbekämpfung; Battery University: Nürnberg, Germany, 2016. [Google Scholar]
  26. Basics of Measuring the Dielectric Properties of Materials, Keysight Application Note, Literature Number 5989-2589EN. 2020. Available online: https://www.keysight.com/cn/zh/assets/7018-01284/application-notes/5989-2589.pdf (accessed on 9 November 2020).
  27. Professional Plastics; Electrical Properties of Plastic Materials. Available online: https://www.professionalplastics.com/professionalplastics/ElectricalPropertiesofPlastics.pdf (accessed on 14 June 2021).
Figure 1. Measurement scheme and electric circuitry modeling. (a) Electrical scheme of the current-meter connected to the cell under test (CUT). (b) Sketch of the separator sandwiched between two conducting electrodes. (c) SPICE simulation circuitry with a voltage-controlled switch for the fast discharge. (d) Modeled exponential rise of the voltage over time with an abrupt discharge at 0.5 s.
Batteries 07 00064 g001
Figure 2. Pressure device (right) for the cell stack (left) consisting of a separator sandwiched with the cathode and the anode, as well as insulation layers on both sides.
Batteries 07 00064 g002
Figure 3. Cell stack including current collector, anode, and separator with forced defect structures. Optical images (left) and SEM images (right) of the forced defects in the separator, including agglomerates of molten cathode particles from laser cutting before the high-potential test (upper right), and the resulting separator defect holes after the high-potential test (lower right).
Batteries 07 00064 g003
Figure 4. Voltage curves of clean cell stacks (ac) and cell stacks with defect structures (df). Clean stacks at (a) 350 V, (b) 450 V, and (c) 500 V, the latter with a hard-discharge (HD) and no recovery. Cell stacks with defect structures charged up to 450 V: (d) mass of small particles with HD and full recovery; (e) one large particle with several HD events and partial recovery; (f) hole with HD and no recovery. The mechanical pressures are given in the insets.
Batteries 07 00064 g004
Figure 5. Defect detection rates of the clean reference cell stacks without forced defects (yellow curve; nCS = 19; nCS3,0 = 15) are compared with defect detection rates of cell stacks that had various particle contaminations, including one large particle (blue curve; nLP= 19), mass of small particles (red curve; nSP = 18), and holes (gray curve; nH = 13).
Batteries 07 00064 g005
Figure 6. Finite element modeling of the defect structures and electrical fields, including the electrode roughness, contamination particles, and air voids in the separator. (a) Electric field strength in a solid 23 µm thick separator (er = 3) with air voids (eair = 1) of different ellipticity. The total capacitance (CG) and the capacitance of the voids (CV) are indicated. (b) Maximum field strength as a function of the void radii and ellipticity. (c) Electric field strength for a rough electrode surface and presence of conductive particles at the electrode–separator interface. (d) Maximum electrical field strength as a function of electrode surface roughness (upper axis) and conductive particle radius (lower axis).
Batteries 07 00064 g006
Publisher’s Note: MDPI stays neutral with regard to jurisdictional claims in published maps and institutional affiliations.

