
Numerical and Experimental Evaluation of a Battery Cell under Impact Load


Department of Mechanical Engineering, Faculty of Automotive, Mechatronics and Mechanical Engineering, Technical University of Cluj-Napoca, 103-105 Muncii Boulevard, 400641 Cluj-Napoca, Romania
*
Author to whom correspondence should be addressed.
Batteries 2022, 8(5), 48; https://0-doi-org.brum.beds.ac.uk/10.3390/batteries8050048
Submission received: 3 April 2022
/
Revised: 17 May 2022
/
Accepted: 18 May 2022
/
Published: 20 May 2022
(This article belongs to the Topic Safety of Lithium-Ion Batteries)
Abstract
:Impact damage is one of the most critical scenarios for the lithium-ion battery pack of an electrical vehicle, as it involves mechanical abusive loads with serious consequences on electrical and thermal stability. The development of a numerical model for an explicit dynamic simulation of a Li-ion battery pack under impact implies a significant computational effort if detailed models of a single battery cell are employed. The present paper presents a homogenized finite element model of a battery cell, validated by experimental tests of individual materials and an impact test of an entire cell. The macro model is composed of shell elements representing outside casing and elements with a homogenized and isotropic material for the jelly roll. The displacements and deformed shape of the numerical model of the battery cell were compared with those measured on real test specimens; full-field optical scanning was employed to reconstruct the 3D shape of the deformed battery. The overall deformation of the simulation and experimental results are comparable with a deviation of the maximum intrusion of 14.8% for impact direction and 19.5% for the perpendicular direction considering the cumulative effects of simplifying hypotheses of the numerical model and experimental side effects. The results are a starting point for future analyses of a battery pack and its protection systems under impact. The model presented in this paper, considering the low computing power needed for calculation and acceptable mesh size for crash, should be able to be used in bigger resources consuming crash simulation models. In this way, the cells’ deformation and behavior can be tracked more easily for safety management and diagnosis of the crashworthiness of the packs or car batteries.
1. Introduction
Lithium-ion battery (LiB) cells are presenting increased interest due to their higher energy density and electrification trend in automotive engineering. Widely used in consumer electronics, the lithium-ion batteries’ failures are due to an internal short-circuit occurring during normal use. Operational abuse such as overcharging by poorly designed charge systems, or manufacturing defects such as metallic contaminants or electrode misalignment are just a few examples of failure. Simulations of the internal short circuit (ISC) due to mechanical intrusion of a cell, such as through nail penetration, a small indentation, or a controlled pinch test [1,2,3], have also been used to investigate the development of an internal short circuit. Nail penetration will lead to damage of the cell and shorting of multiple electrode layers, which are brought into electrical contact with one other, as well as through the nail. Macroscopic damage to the electrodes, such as large cracks through the electrode jelly roll or delamination of electrode layers were found [4] to be the failure modes of lithium-ion battery cells subjected to hemispherical punch, lateral indentation by a cylindrical rod, compression between two flat plates, and three-point bending. Commercially available cells were tested in [5] using the mechanical blunt rod testing method, as well as sharp nail penetration; these test conditions were carried out on different cell constructions as well. Although much research has been done over time to develop the most appropriate test methods, no consensus has been reached on methods for initiating internal short circuits. Because of this, many testing laboratories continue to use mechanical methods as a substitute for a wide range of tests related to the internal short circuit of batteries [6,7,8]. In addition, the conditions under which lithium-ion batteries are used are constantly evolving. Sales of electric vehicles (EVs) have increased recently, and lithium-ion batteries are considered to be promising alternative energy sources for use in electric vehicles [9]. It has been demonstrated that even in static situations (without external mechanical loading), during the normal charging and discharging of LiBs, diffusion-induced stresses are generated, which lead to the deformation of electrode materials [10,11]. The external mechanical loading exerted during the normal usage of electric vehicles (e.g, continuously running on rough road surfaces) can lead to the premature mechanical failure of LiBs after certain cycles. One of the main reasons for this could be due to the enlarged stresses and deformation generated in the electrode materials caused by the external mechanical loading, which can result in short circuits that render electrode active materials incapable of storing Li-ions [12].
Battery safety has become one of the main issues when it comes to passenger safety [13]. Battery thermal management (BTM) is generally used to prevent overheating [14], but a short circuit can produce a significant amount of heat, which can cause thermal instability [15]. Studies have shown [1,15] that the thermal instability of a single cell in a battery pack is more likely to cause thermal instability of the entire battery pack when the initiator cell is in contact with other cells and is close to the pack wall. The operational safety of electric vehicle batteries requires electrical and thermal monitoring in addition to structural protection against impact or other types of accidental stresses while running in order to avoid a short circuit under the action of mechanical stresses. Battery systems in electric vehicles are protected against deformation by metal structural elements to comply with legal impact regulations, consumer impact tests, and other requirements [16].
Computational models were developed for simulations of Li-ion battery cells mainly based on representative volume element (RVE) specimens subjected to in-plane constrained compression tests [17,18], various loading conditions [19,20], thermo-mechanical loadings [21], or coupled mechanical-electrical-thermal simulations [22]. The proposed approaches are a micro approach (a detailed model) and a macro approach (less detailed model). In the detailed model, the battery cell is modeled as a layered composite [23] or an RVE with nominal stress-strain response materials obtained based on the properties of the cell components of layered anodes, cathodes, separators, and cover sheets [18,19]. Macro models [4] are composed of shell elements representing the outside casing and solid elements with a homogenized and isotropic material for the jelly roll. The homogenous model does not account for the effect of structural anisotropy caused by the layered nature of the jelly roll, but the correlation between this type of numerical model and experimental tests in terms of displacements was reported as very good [4].
Establishing a complex concept of a battery protection system against deformation by structural elements to comply with impact regulations and standards can begin by using simplified but accurate numerical models of a battery cell. Using a detailed model (micro approach) in the case of an impact analysis requires significant computational effort. Therefore, the present paper proposed a macro-homogenized material model of the battery cell and the jelly roll of a commercially available lithium-ion cylindrical cell. Material models of individual components of a battery cell were experimentally determined by tensile tests of samples extracted from the cell. A finite element model of the cell was developed, experimentally calibrated, and validated against impact load. The displacements and deformed shape of the numerical model was compared with those measured on real test specimens. Optical scanning was employed to reconstruct the 3D shape of the deformed battery. Agreement between the numerical and experimental values of the deformations produced by the impact is good considering the cumulative effects of simplifying the hypotheses of the numerical model and the side effects during the experimental impact test. In fact, when the cells are placed in a battery box, the developed FE model serves as a starting point for future analyses of a battery pack, including cells and protection systems under impact. The development of a reliable protection system of a battery pack cannot be done without considering simplified and accurate models of single-battery cells.
2. Materials and Methods
2.1. Model Build-Up
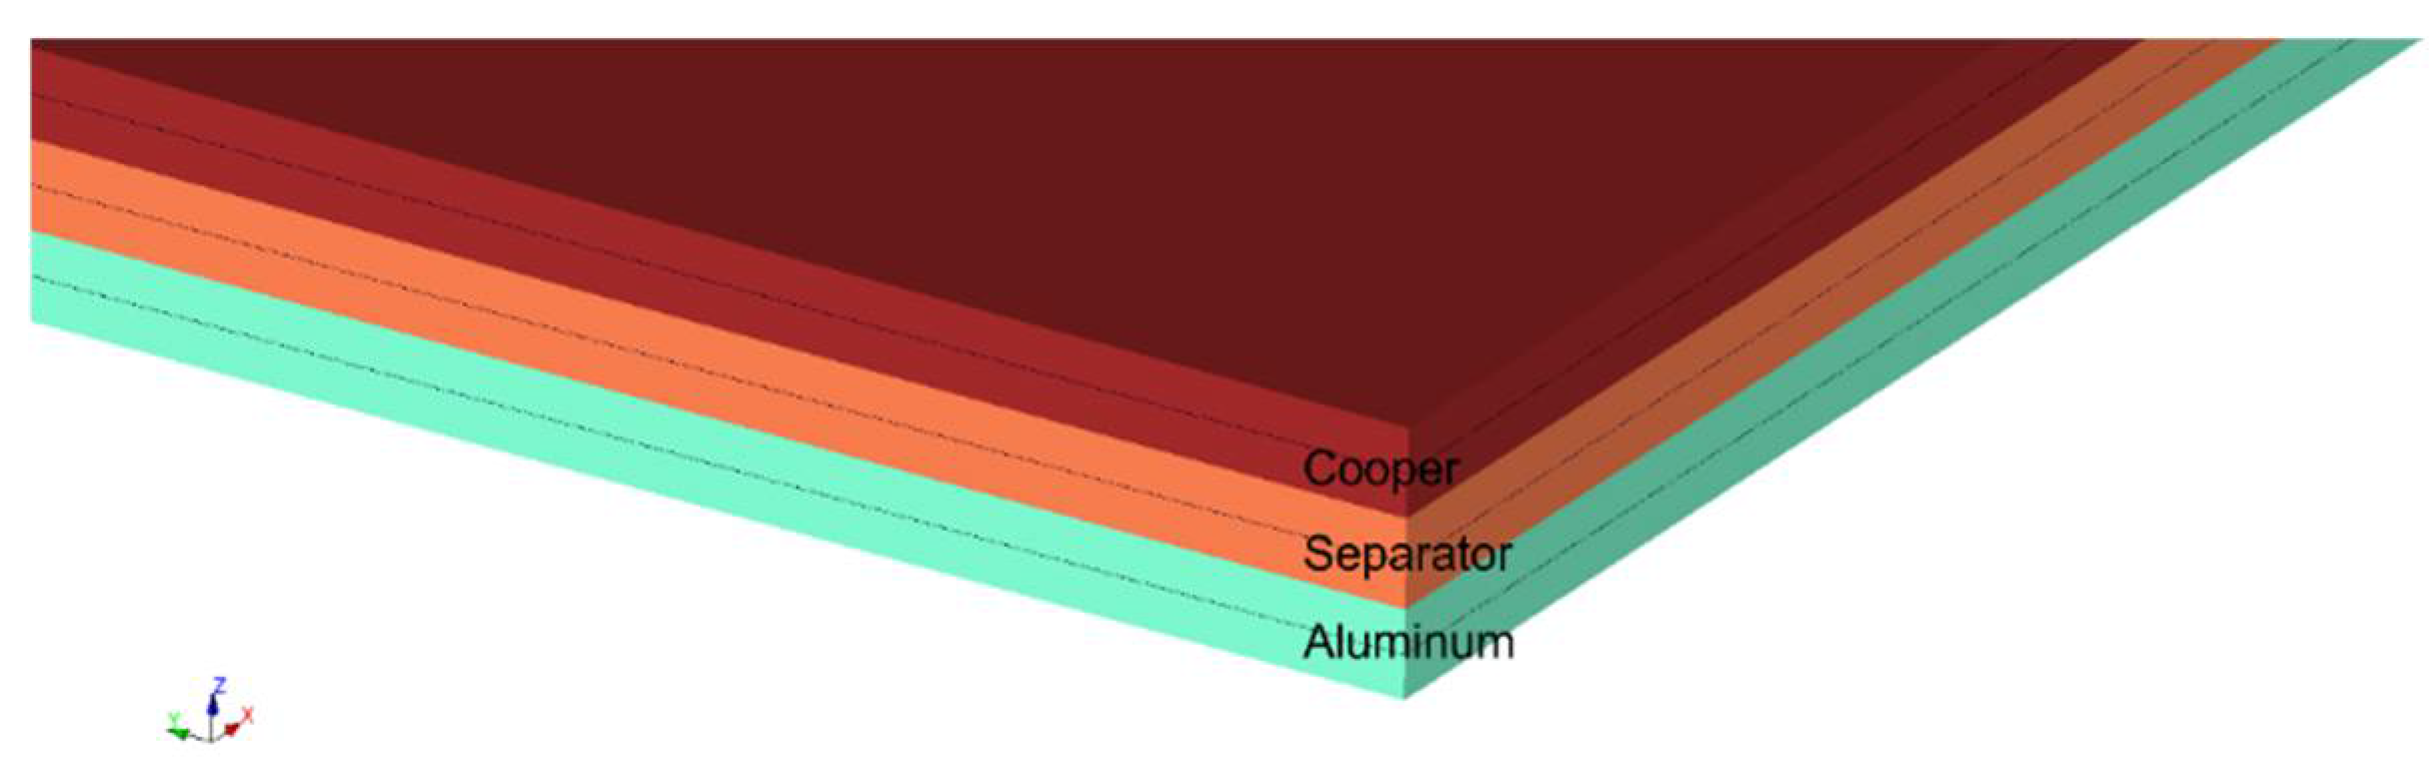
The active material of standard lithium-ion battery cells is multi-layered: a copper foil (anode) coated with a carbon-based material, an aluminum foil (cathode) coated with lithium-metal oxides, and a polymeric membrane that electrically insulates the anode from the cathode (separator). A mixture of organic solvent and lithium salt (electrolyte) provides an ionic conductive medium for the transfer of Li+ ions between the anode and the cathode during charging/discharging. The separator is made of a single layer of polyethylene (PE) or three layers of polypropylene, polyethylene, and polypropylene (PP/PE/PP).
For this paper, the lithium-ion cylindrical battery type 18650 was used. An explicit dynamic numerical simulation presumes definition of the material models with identified material constants and coefficients, or when the software allows direct import of experimental stress-strain curves. In both variants, a reverse engineering process is necessary to obtain a proper geometrical model and to obtain samples for the mechanical characterization of different materials that form a battery cell. Thus, the battery was cut open to identify the geometrical elements, as well as make samples for material testing.
The exterior dimensions of the battery were, as seen in the name, an 18 mm radius and a 65 mm body length. The main relevant components taken into consideration for our test were the galvanized steel case and the jelly roll found inside, made up of three main materials: copper, aluminum, and polyethylene, as seen in Table 1.
Many experimental tests presented in the literature are compressive tests of an entire battery or only of the inner sandwich structure of the cell (jelly roll) to determine the mechanical characteristics of an equivalent homogenized material. In this paper, we tried to validate a numerical model by performing tensile tests, which can be done more easily and are available for many other materials that have potential to be used in battery cell fabrication. The assumption of similar tensile-compressive behavior can be accepted if the plastic deformations are small. Individual tensile tests of each component and the sandwich structure were performed, and based on the obtained values, a proper numerical model of the jelly roll was calibrated. The proposed methodology is a combination of experimental tests and numerical simulations, and represents an element of originality of the work.
The tensile test samples cut out of these materials had a length of 100 mm and a width of 7 mm. The thickness of the individual specimens was measured with a micrometer by washing away the active coating using a solvent. The measurement was done both individually and as a stack and by dividing the stack height by the number of specimens. The measured thicknesses of the samples are presented in Table 1. All the samples were tensile tested using an Instron 3366 (10 kN) machine according to standard procedure. For each of the components, five samples were made, and after testing, the median values were chosen and used for numerical simulations. The stress-strain results obtained from the tests are engineering values.
2.2. Tensile Test of Battery Components
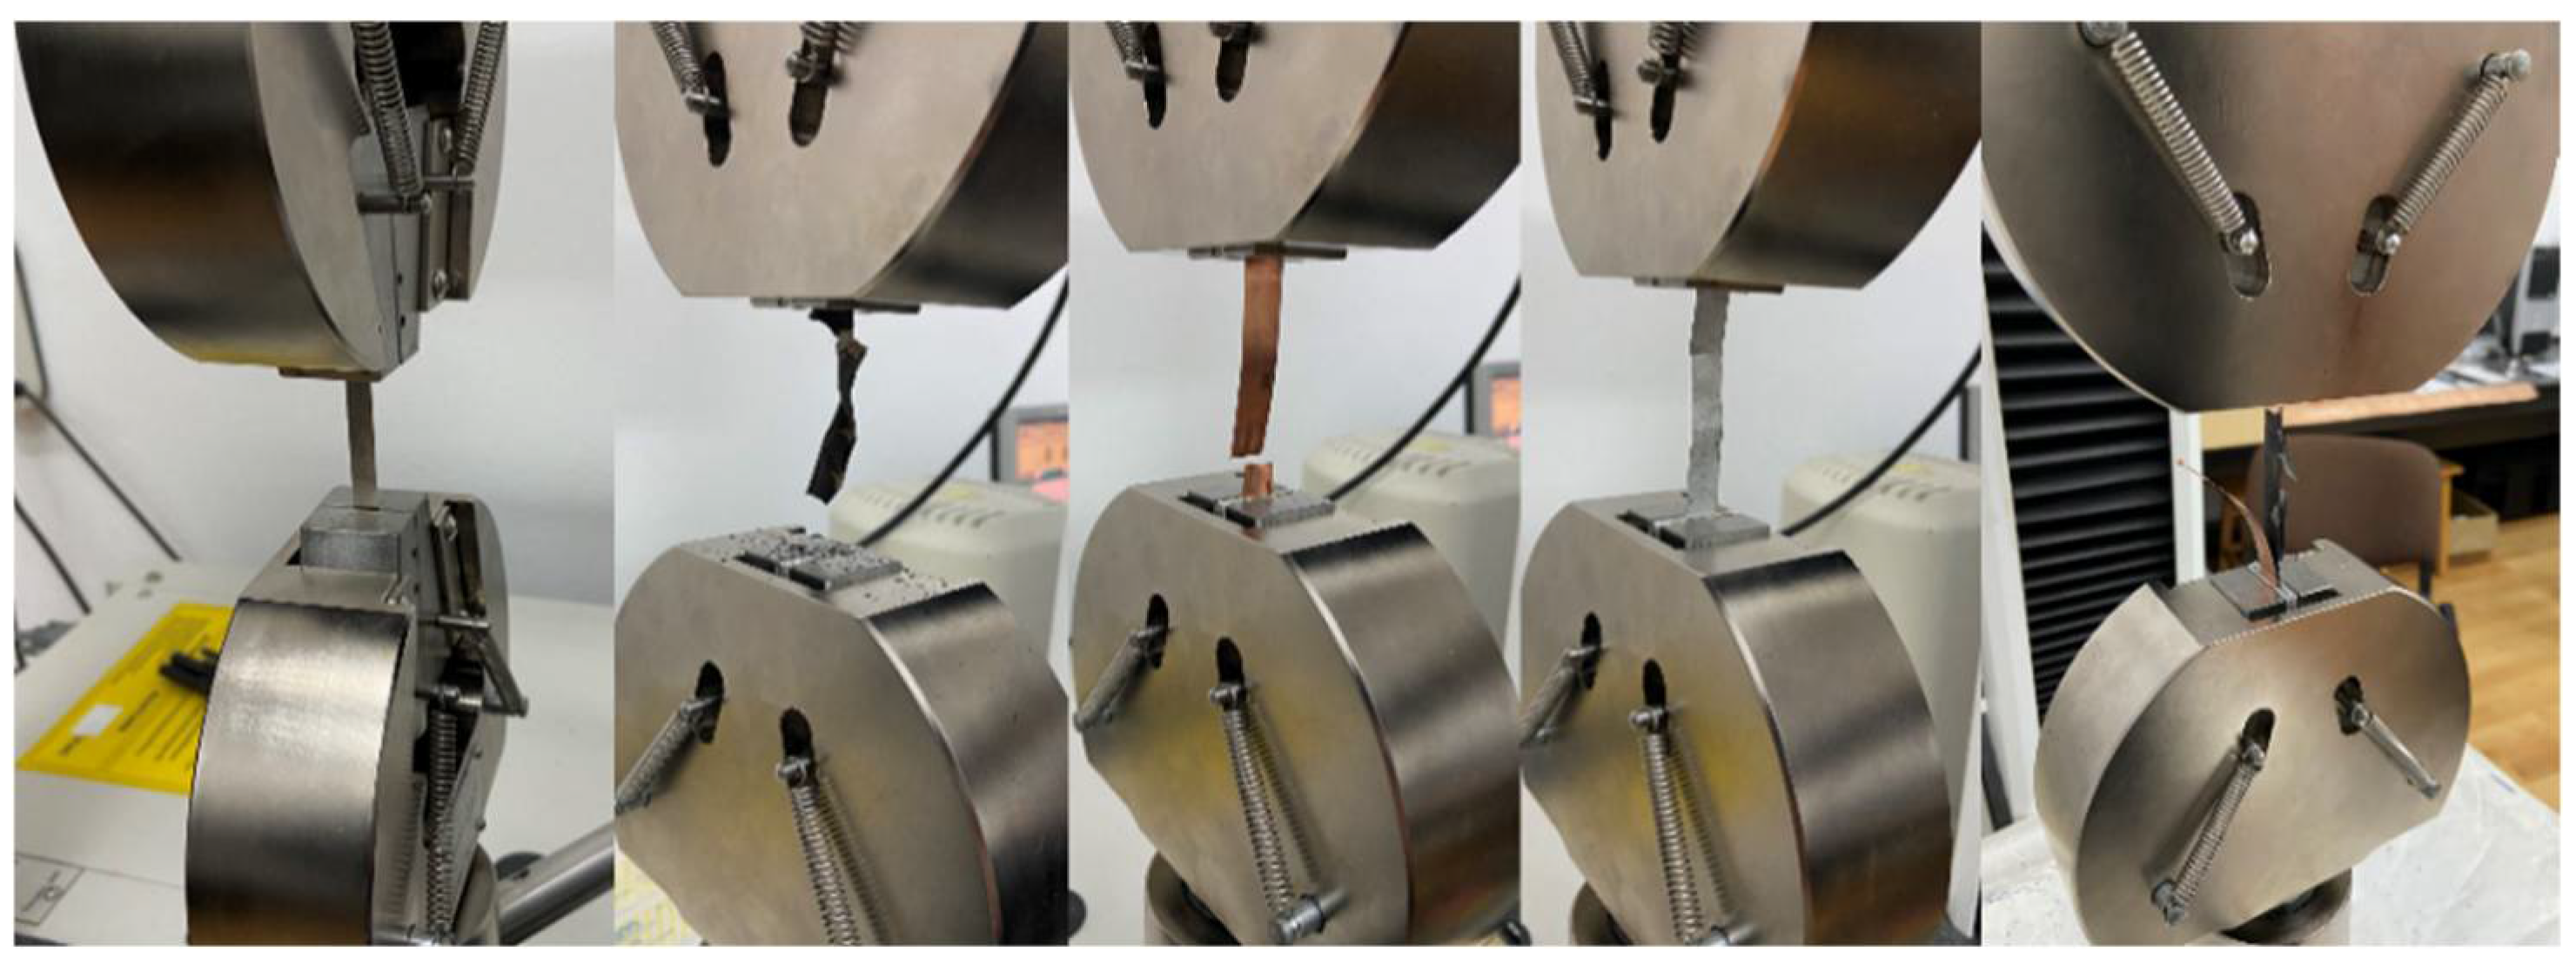
For the steel case samples, the tensile test was performed with a 1 mm/min crosshead speed corresponding to a strain rate of 4.6 × 10⁻⁴ s−1 at room temperature of 18 °C. The jelly roll elements were tested together in a sandwich layout and individually: aluminum and copper at a crosshead speed of 2 mm/min (resulting strain rates of 5.9 × 10⁻⁴ s−1 for aluminum and 5.8 × 10⁻⁴ s−1 for copper), and the separator layer at 10 mm/min (29.1 × 10⁻⁴ s−1 strain rate) at the same temperature as the case samples. Figure 1 presents the specimens of different materials at the end of the tensile test. Jelly roll testing as a layered structure is affected by the individual sample dimensions, as shown by their alignment with respect to the tensile direction and the existence of an equal pretension in each individual layer of material—a fact that is difficult to achieve in practice.
2.3. Validation of Numerical Models
The development of a macro-scale numerical model of a cell implies the existence of material parameters that describe the mechanical behavior. The producers of batteries have data privacy rights regarding the materials used in their products. For this reason, we used experimental materials data, which was first employed in a tensile test simulation. The comparison of experimental and numerical tensile load-displacement curves will increase the confidence of the proper material’s model used in simulations of the entire battery cell.
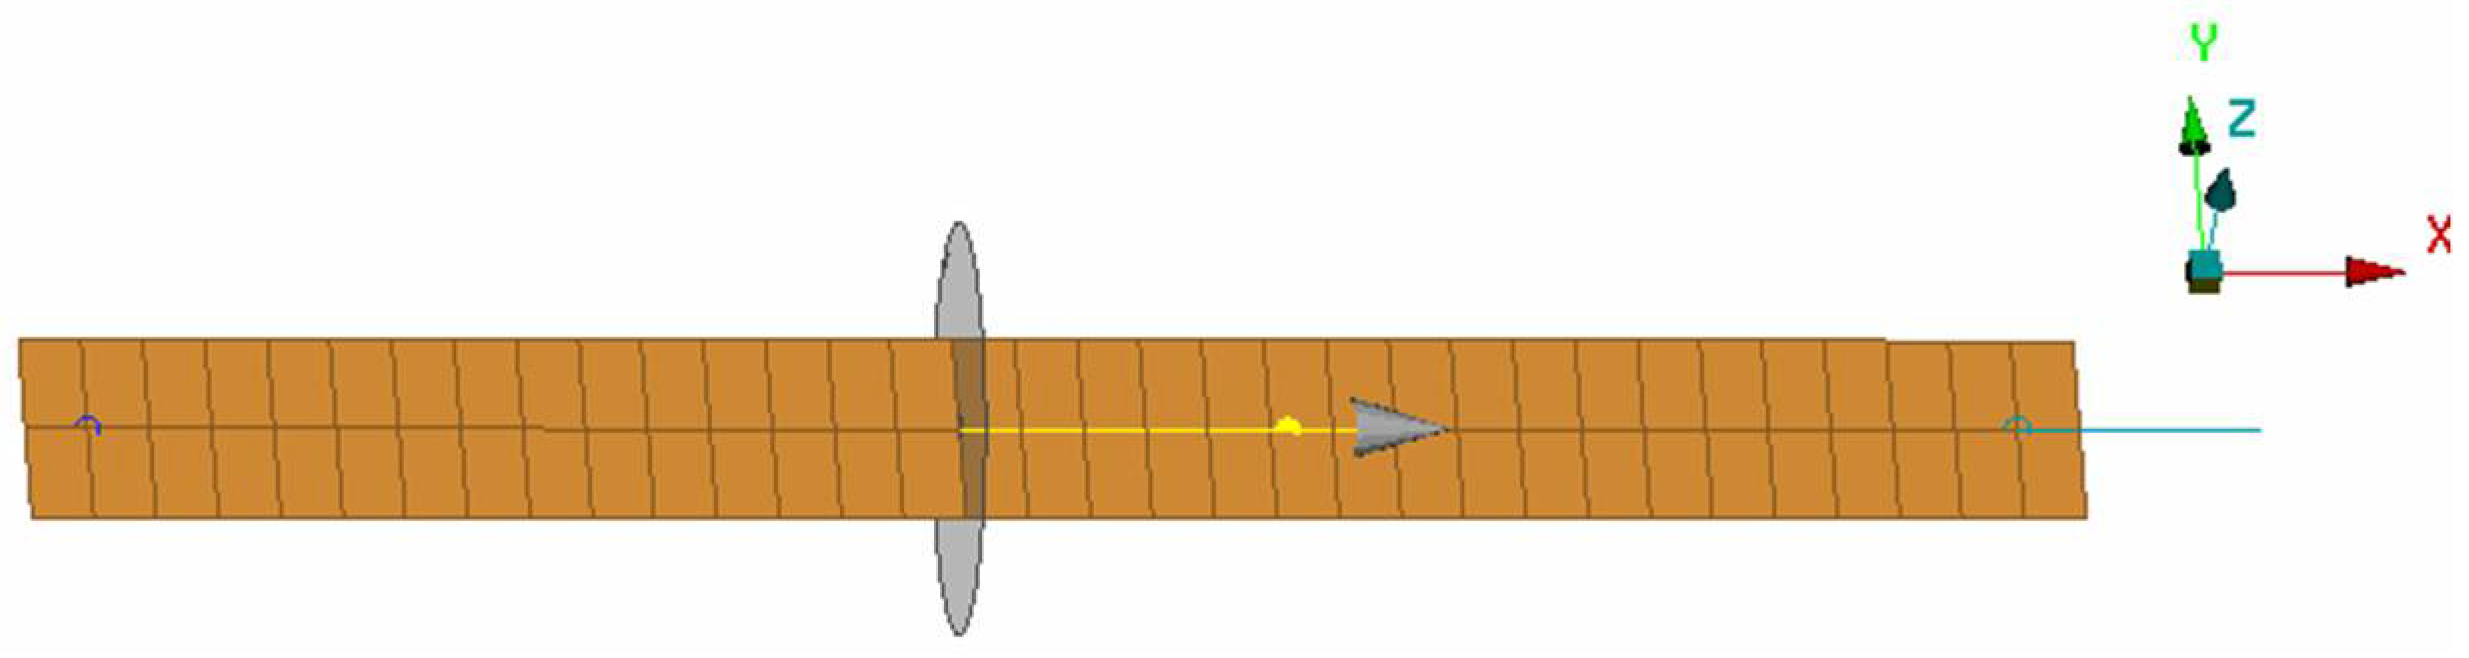
From the physical test results, five materials were defined in the LS Dyna environment based on the E-modulus, the material stress-strain curve, and the maximum plastic strain failure parameter. Each sample was modeled with the same length, thickness, and similar tensile test conditions, as shown in Figure 3. The model was meshed with hexa elements with a medium size of 3 mm. The force analysis in LS Dyna was conducted with the help of the functions provided by the solver called via specific commands. The ones used in this model were section–force type, which determine interior forces and moments at a cross-section. A cross-section, in LS Dyna, is defined with the help of a node set, which defines the cutting surface, and a shell set containing deformable elements. In our case, the maximum force until the breaking point was measured with a section–force type analysis defined on a cross-section transverse on the sample model. The numeric shell model represents the middle surface of the real sample, with the thickness as a partial parameter, so the measure is analogous to internal force measurement in the cross-sectional area of the specimen.
As for the boundaries, the model has two rigid bodies defined on the sample’s end elements: one with all the freedom degrees blocked, and the second one with the displacement defined on the axial direction.
The validation of the material models was done with the comparison of the maximum load before breaking, obtained by numerical simulations and experimental testing, as seen in Table 3.
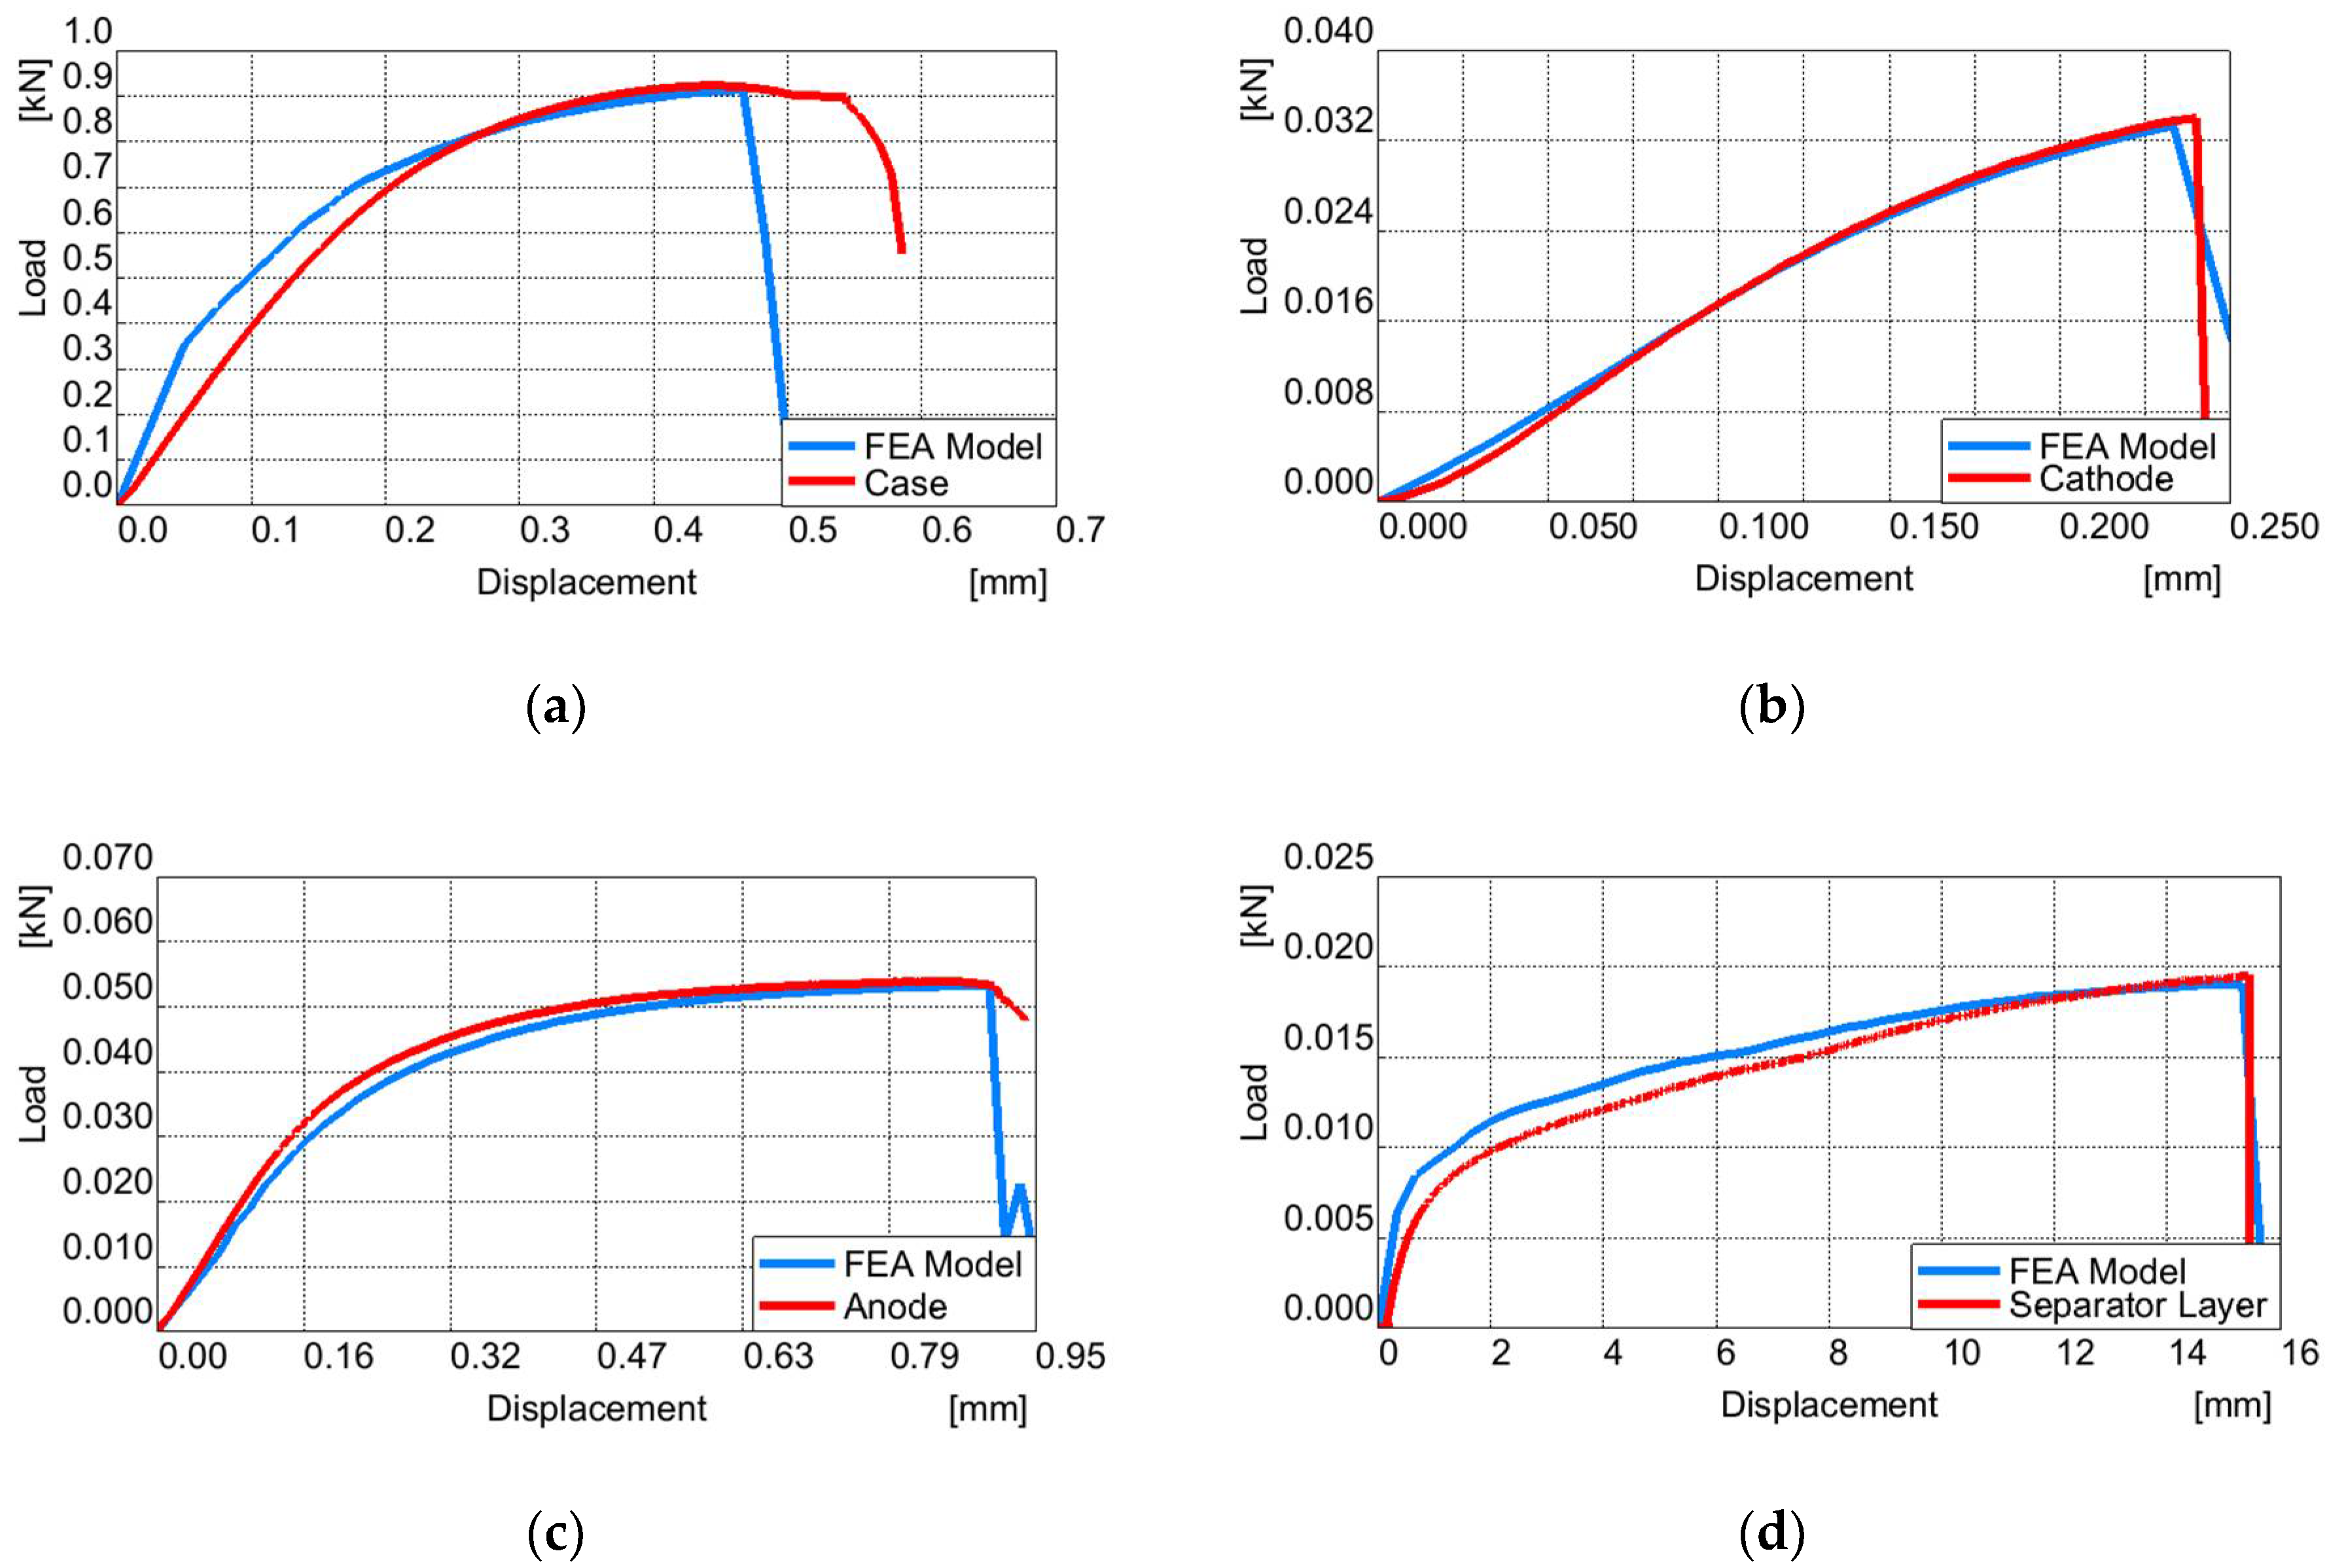
Figure 4 presents a comparison between the force-displacement curve of each individual material of a battery cell, obtained by an experimental tensile test and numerical simulation. Similarities shown in these results improve the confidence of the simulation results.
2.4. Jelly Roll Simulation
In this paper, a homogenized model of the jelly roll is considered in which all components of the inner-layered structure of the battery are grouped together into a single type of material. It is considered that compressive and tensile properties of this material are the same, but at the same time, it is recognized that compressive and tensile properties of this material are different. From previous modeling of lithium-ion cells [17,18,19], it is understood that the jelly roll material behaves like compressible foam until densification, and its crushing strength is much less than that of the steel case. Similar assumptions presented by Liu et al. [20] that ignore the differences of mechanical behavior between tension and compression lead to numerical results that are in good agreement with the measured data. The error introduced by the assumption of similar tensile-compressive behavior can be accepted only for a simplified model; the contribution of individual components of the jelly roll in the impact test is not quantified.
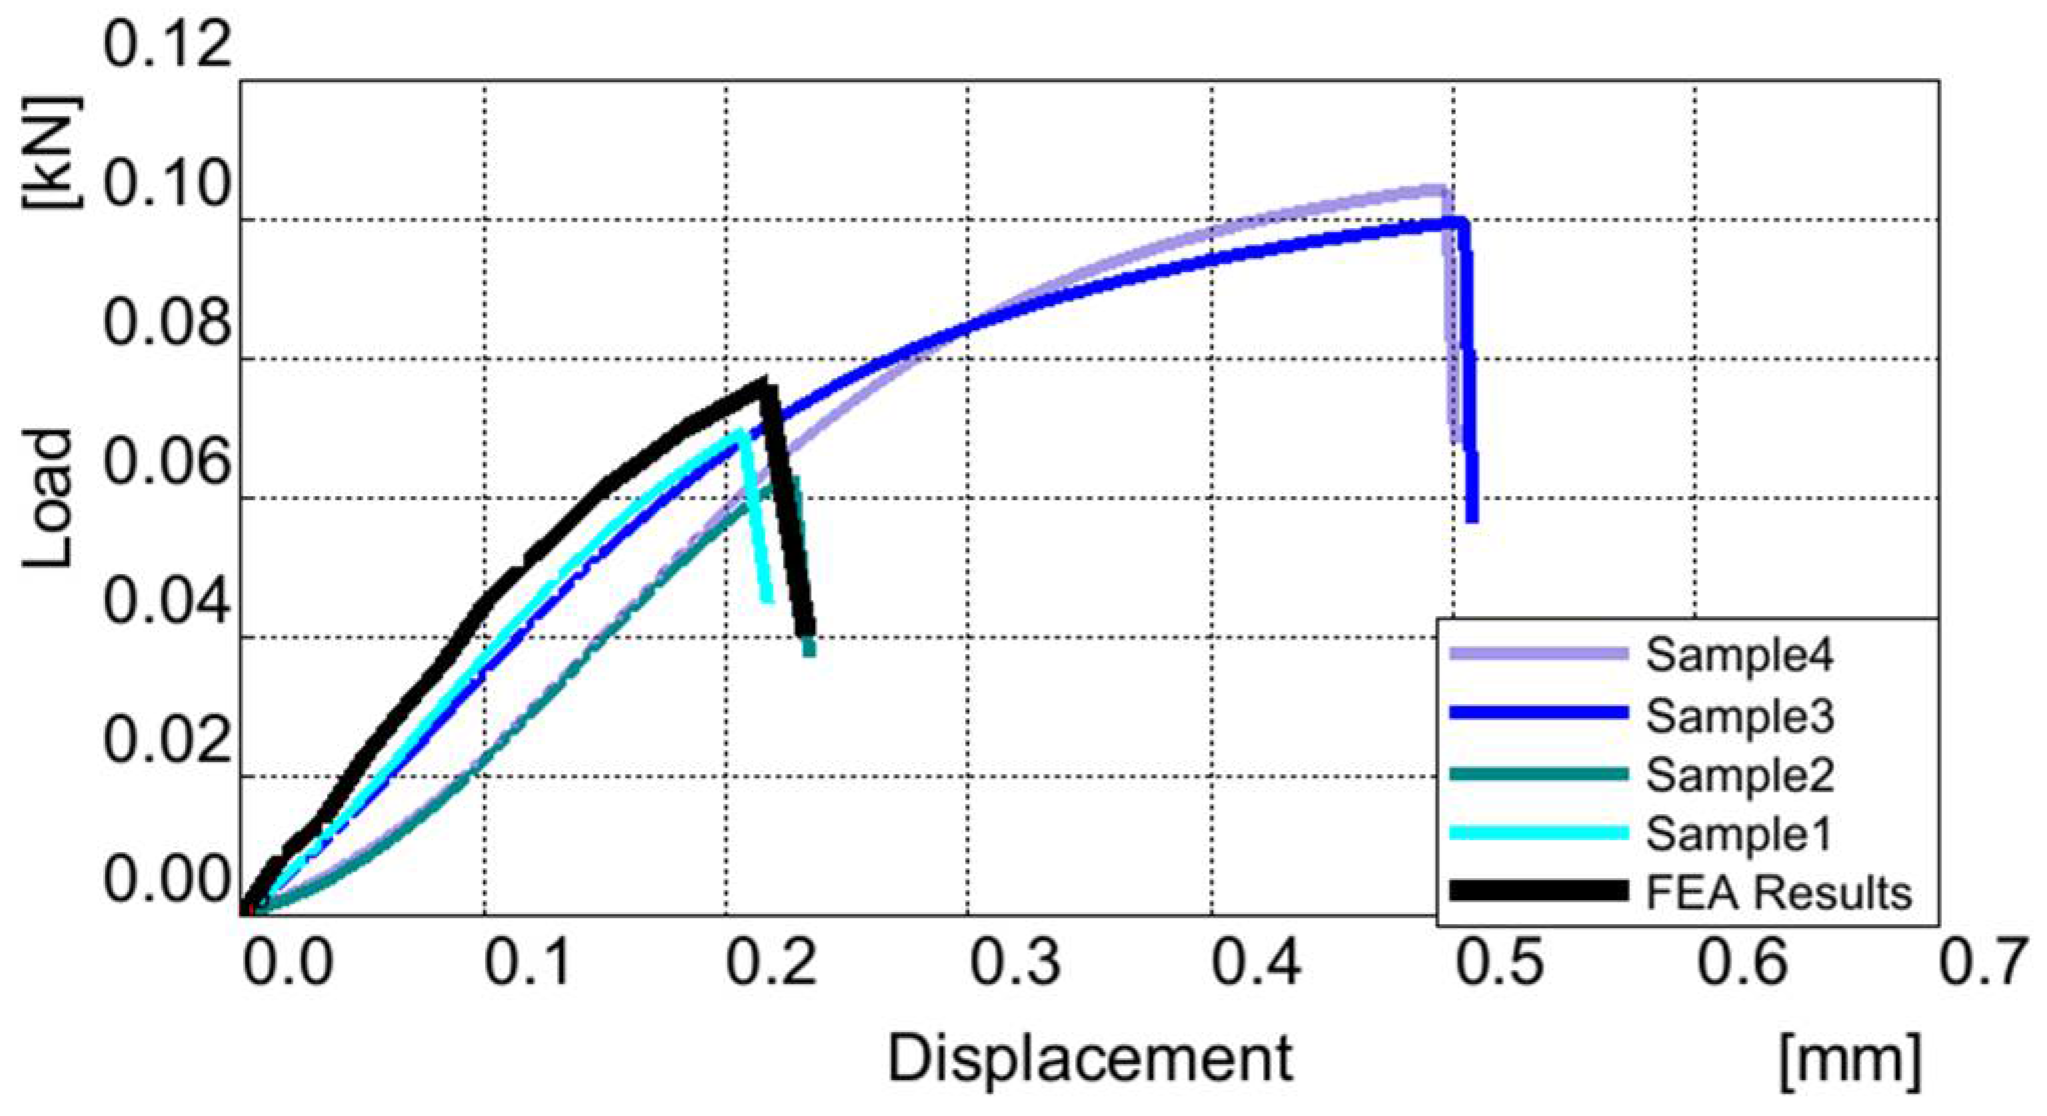
The samples cut off from the jelly roll were tested individually and together as a layered specimen. Testing a specimen made of the three different samples (aluminum, copper, and polyethylene) layered together as a single element was, as mentioned before, problematic and caused a scattering in the results (Figure 5): two of them had a force peak of around 70 N, while the other two measured around 100 N. This can be explained by uneven loading of individual layers due to initial misalignment and the existence of an unequal pretension in each individual layer of material. The problem can be overcome in two ways: first, by testing a considerable number of specimens and building a statistically relevant mean value, or second, by performing a numerical simulation of the jelly roll based on the individual material model (validated above) and comparing it with the experimental results. We chose the variant of numerical simulation, and an FEM sandwich model was created, as shown in Figure 6. The FE model was similar in dimensions and boundary conditions as the real specimen. The result of the FEM sandwich model (depicted in Figure 5) was the main factor in choosing the right results for defining the jelly roll material.
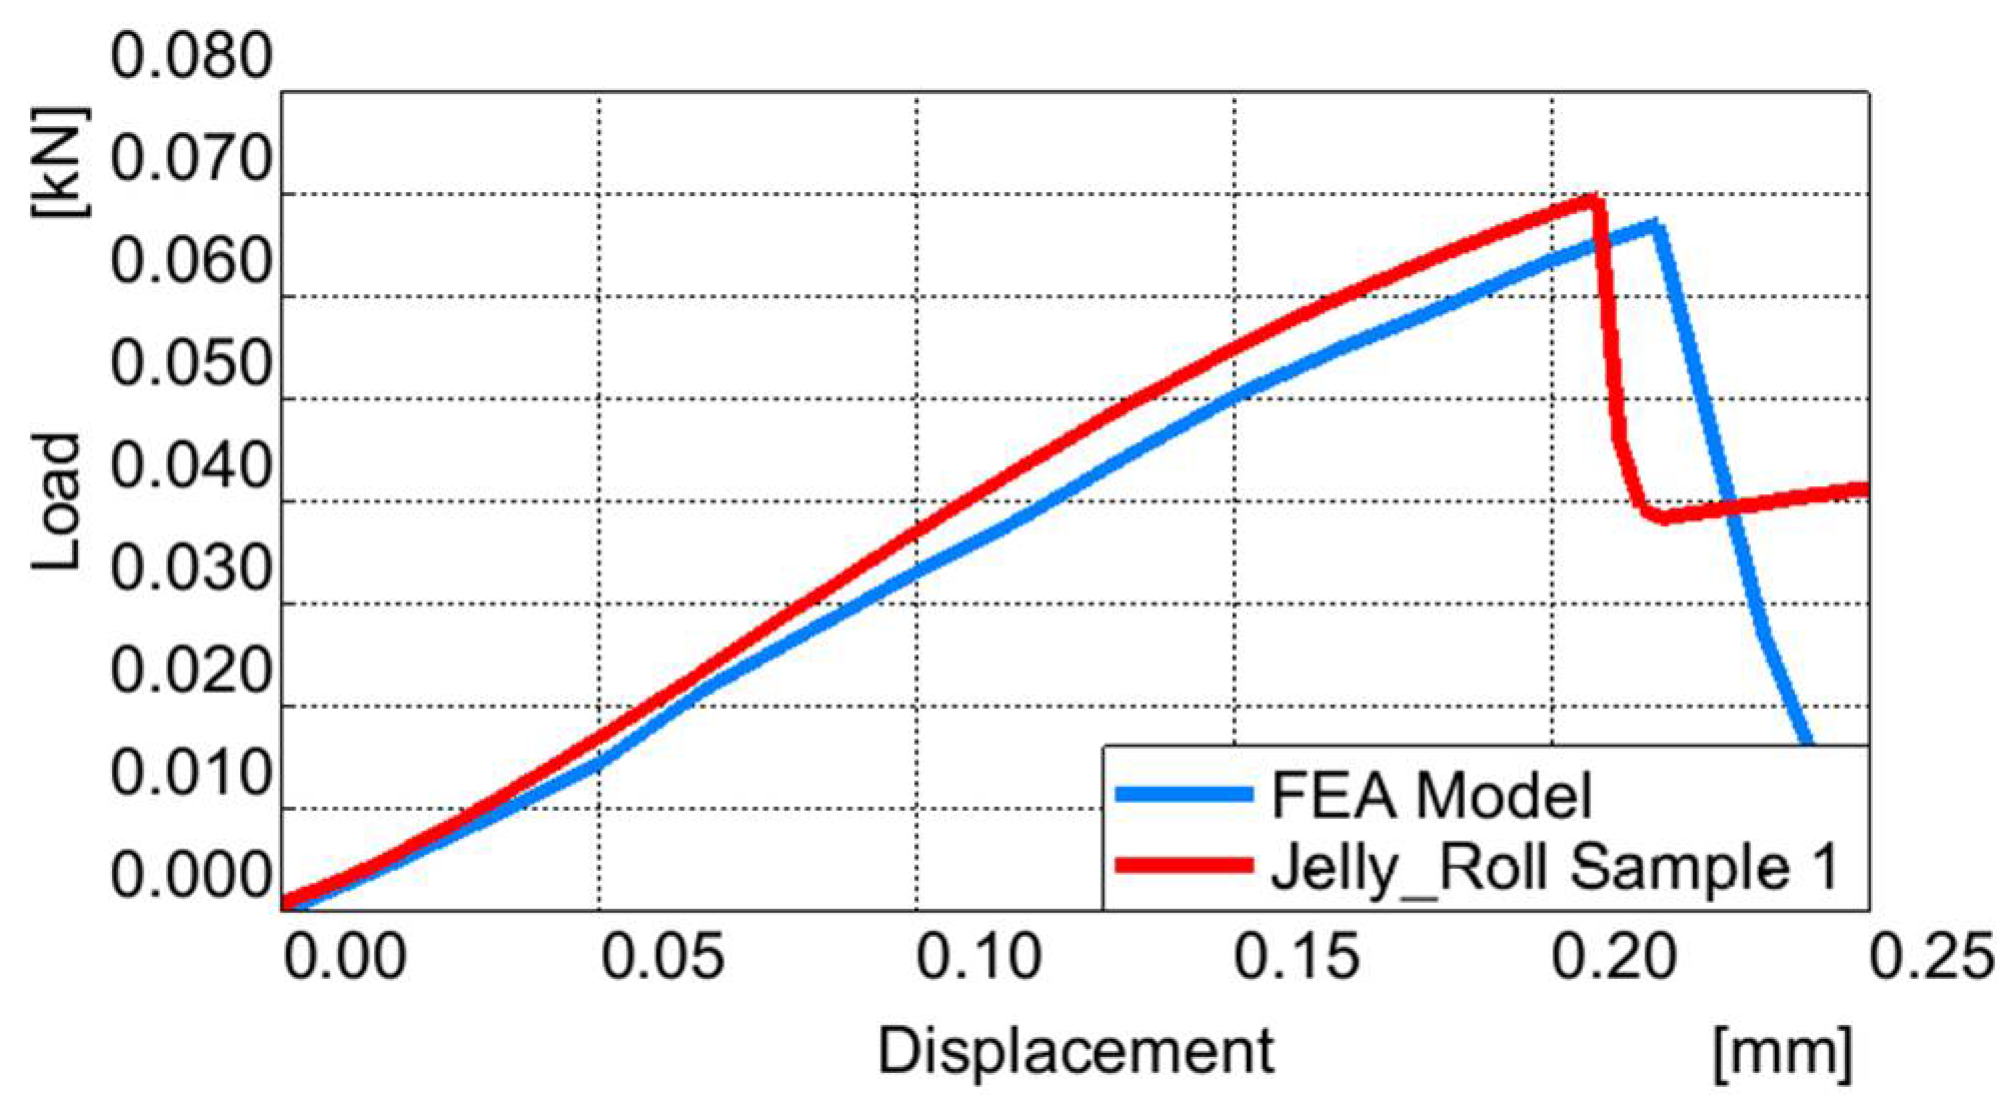
After comparing the load-displacement curves, one material sample was chosen for the jelly roll material definition (Sample 1). The simulation showed a maximum force of 68 N compared with the real sample of 69 N, as seen in detail in Figure 7.
After validating the individual material models of the battery components and establishing the jelly roll proprieties, the next step was the explicit dynamic simulation of a battery cell under impact.
3. Impact Testing and Simulation
3.1. Experimental Setup
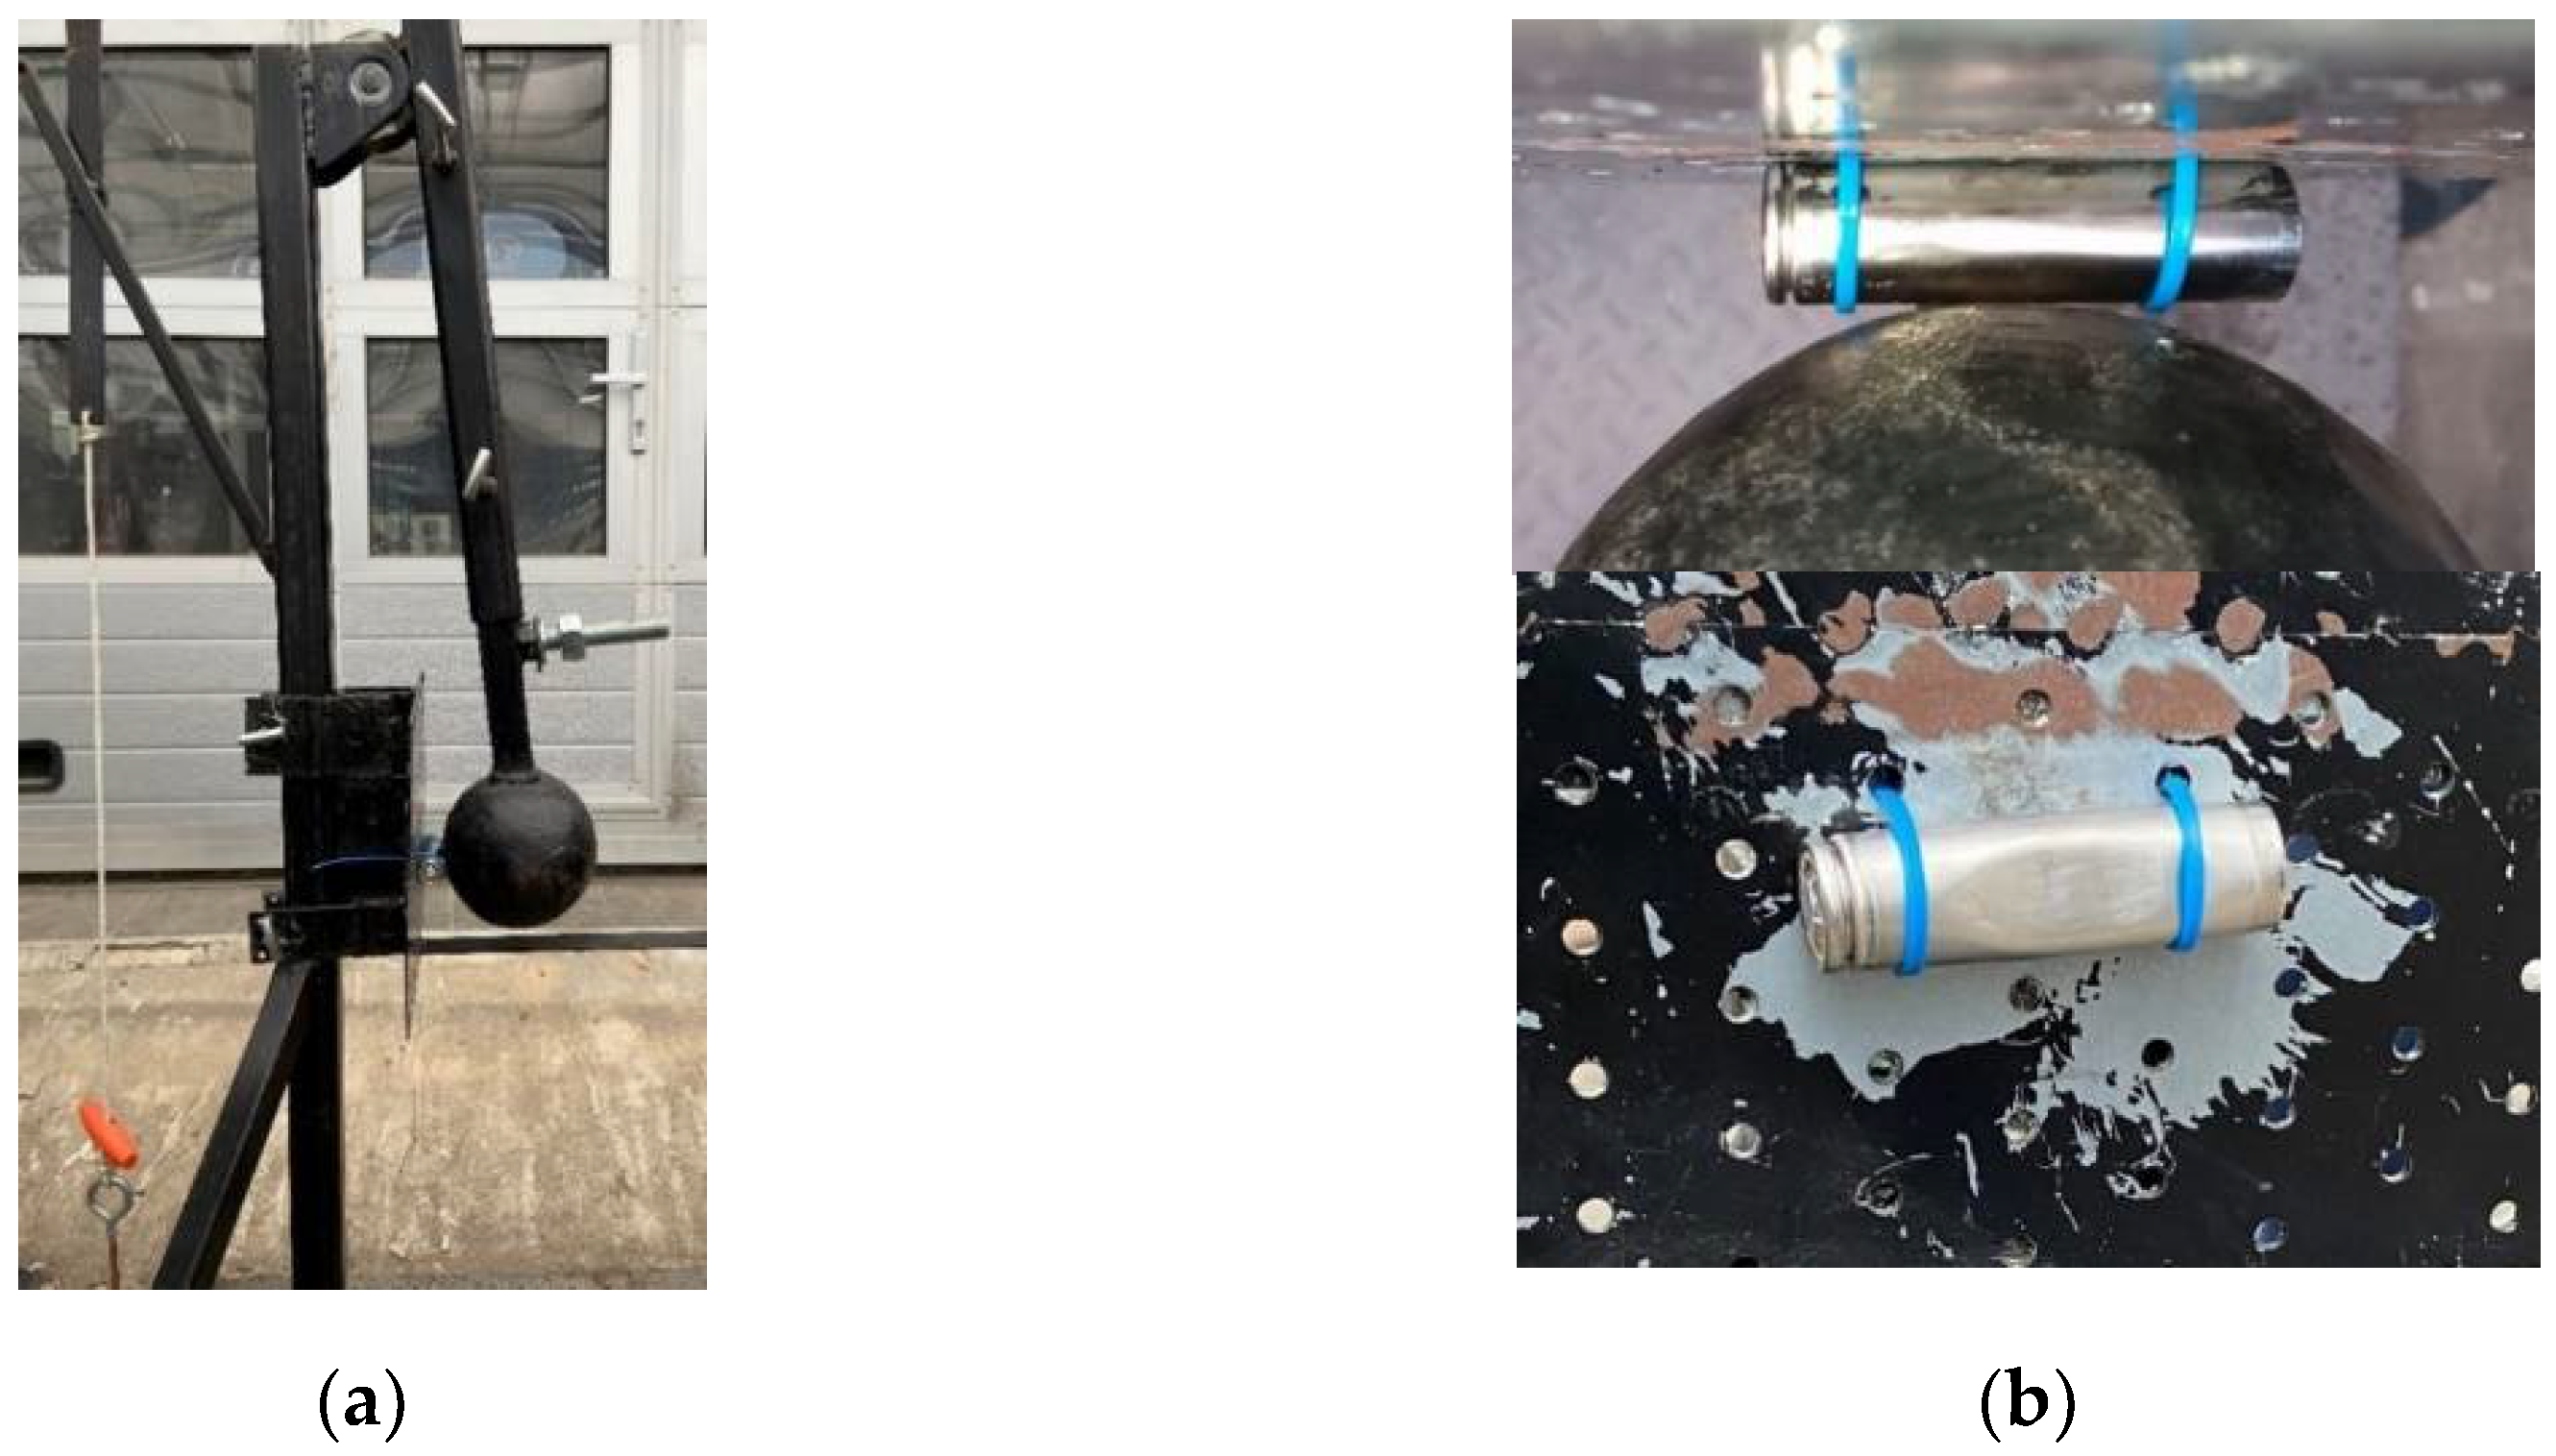
The experimental setup consisted of a gravitational pendulum with a 9 kg ball and 60 mm radius hitting the battery fixed on a metal plate (Figure 8). The pendulum arm was 620 mm long and the dropping angle was 83°. The whole system had a relatively little movement when the impact was produced, so a small error in the results was expected. The experimental system setup did not have the aim of causing a strong impact that produced a deformation leading to battery failure. If the battery cell is enclosed in a battery pack with a protection system, the impact should affect it in a small measure, avoiding its failure.
The kinetic energy can be calculated with the formula:
in which: Ek represents the kinetic energy; m—mass; and v—impact velocity;
in which: g—gravitational acceleration; L—pendulum arm length; and a°—pendulum arm drop angle.
Ek = 0.5 mv2
In our case, considering the above formulas, the calculated impact velocity equaled 3.26 m/s and the kinetic energy was 48 J. The mass of the connection bar between the ball and pin support, as well as the energy loss by friction in the bearing, were neglected. After impact, the battery did not crack, nor were there significant thermal effects observed by measurement with a thermal imaging camera.
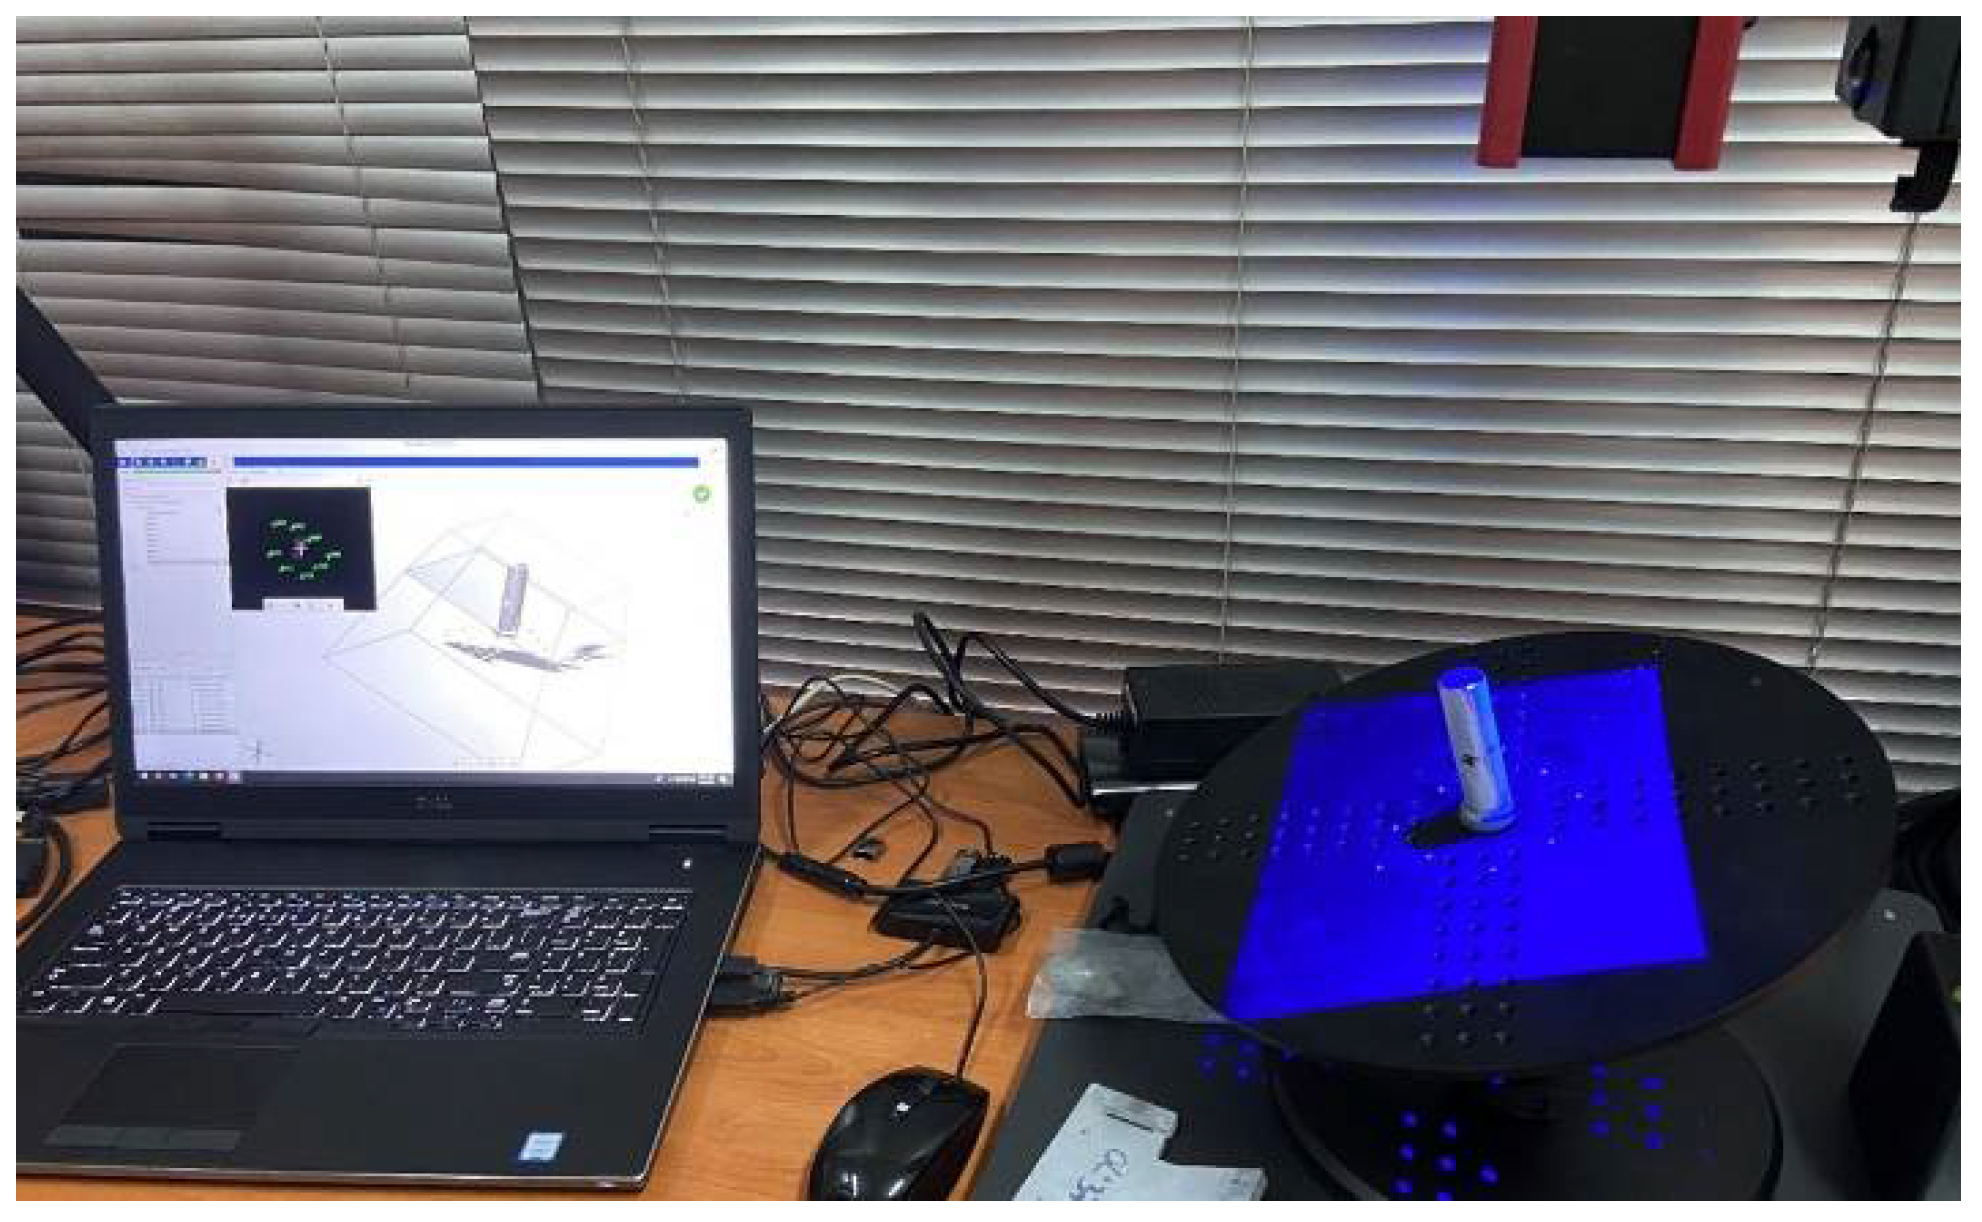
The crushing strength of a battery cell comes from both the strength of the outer shell casing and the crush-resistance of the jelly roll. The process of getting the deformed shape of the battery after impact and the highest deformation [24] was done in our case by an optical 3D-scanning procedure. The system used was an Atos Core optical sensor from the GOM Company (Braunsweig, Germany) based on fringe projection technology and the principle of triangulation (Figure 9). A fringe pattern of different widths is projected by the sensor unit onto the object to be measured, and two CCD cameras observe and record the changes of sinusoidal offset phase light intensity reflected by the object. The sensor applies multiple phases of offset according to the principle of heterodyne light interference to reach the best sub-pixel accuracy. All the 3D coordinates belonging to camera pixels are calculated automatically within seconds and with high accuracy by the computer based on transformation equations of optical imaging. More independent measurements from different views are needed to digitize the whole surface of a battery.
This method measures very precisely (around 2 µm according to the producer) the deformation of the battery by obtaining a skin mesh after the complete surface scan. A major advantage of the measuring system is the possibility to compare the measured data with 3D CAD data of the battery. A special software, GOM Inspection, is used for scanning and inspection with built-in functions like pre-alignment of the mesh on CAD, surface comparisons, and section cuts.
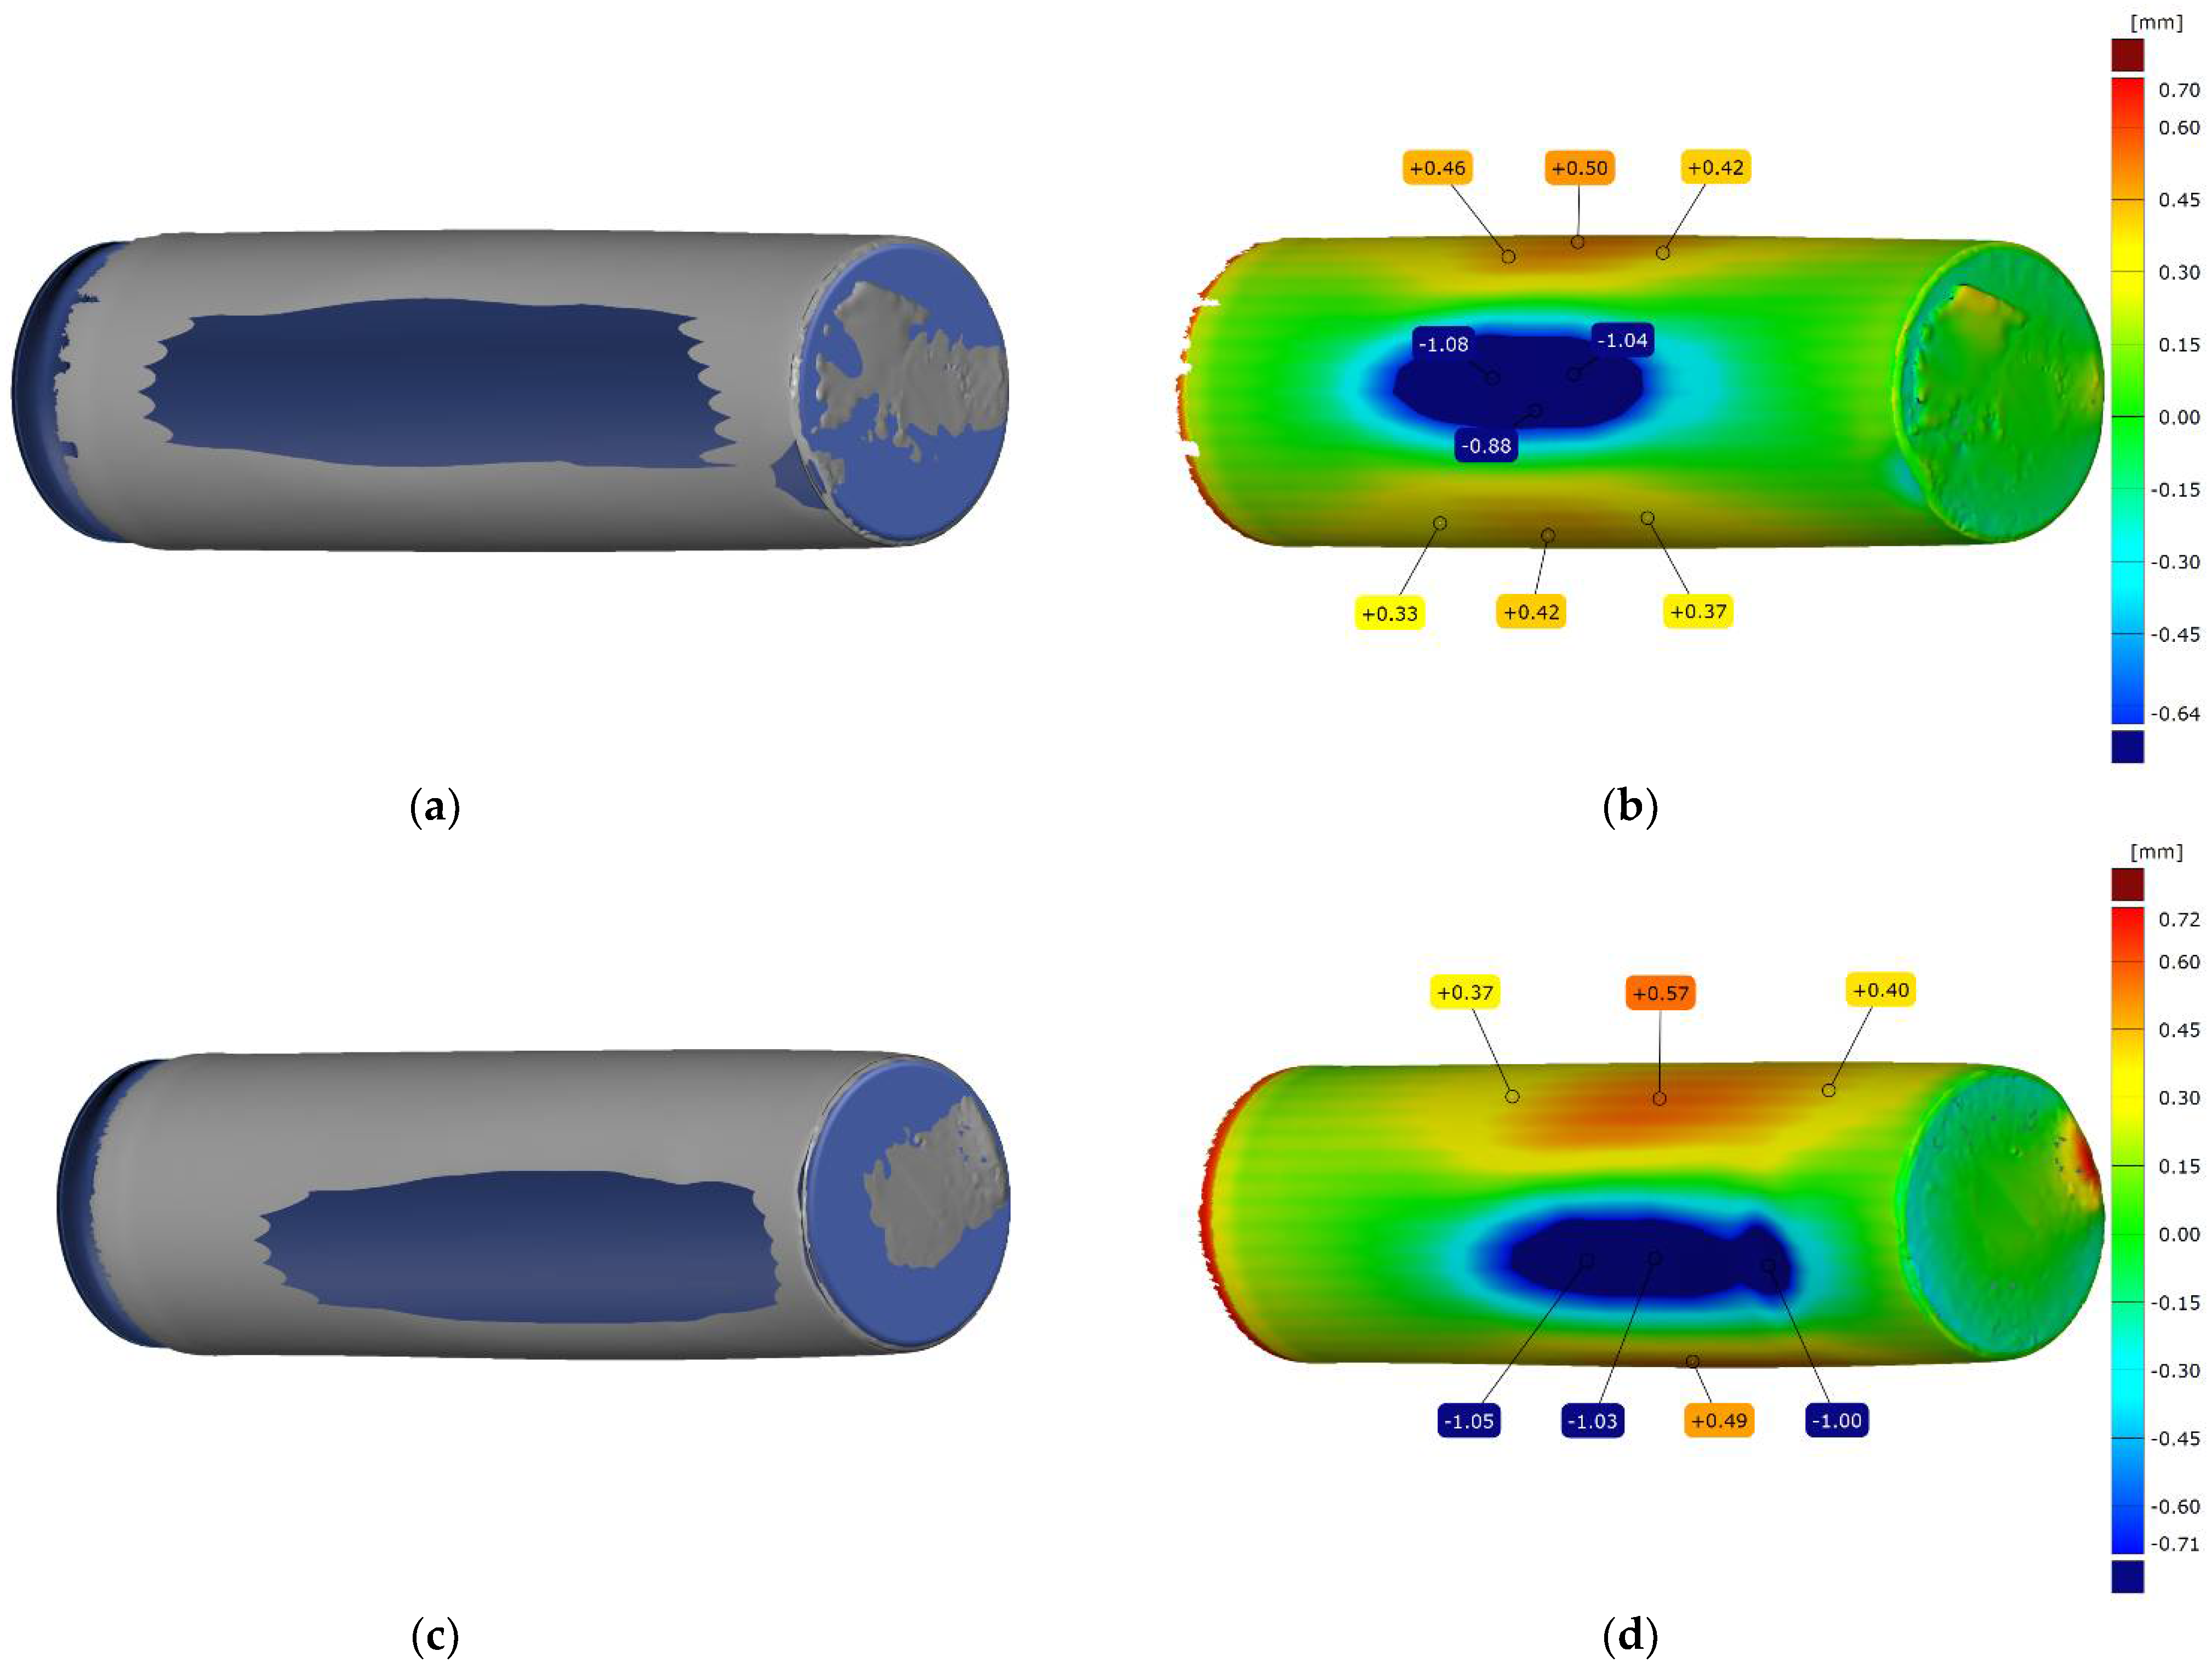
In total, five batteries were impacted, most of which were eliminated from the analysis as failed tests; only the first specimen from Figure 10 and Figure 11 was used for validation. Considering the cylindrical surface of the specimens, the ball impactor and the plastic fixtures that allowed the battery to have slight movement during the impact, positioning the battery in just the right spot for impact created a problem. The position of the impact was not satisfactory most of the time, as we can see in the second specimen shown in Figure 10. Considering these conditions, we selected only one battery, which was hit the most diametrically.
The results are represented as a surface (Figure 10) and as a section (Figure 11) comparison with the CAD data of the battery. The CAD data were generated based on outside dimension measurements of the battery before the impact test and represent the initial deflection of each measured point. The biggest intrusion measured on the battery is 1.08 mm in the impact direction, and a maximum deformation of 0.5 mm in a perpendicular direction, as seen in the Figure 10. It can also be noticed that the deformation is more localized on the area where the ball hits the battery.
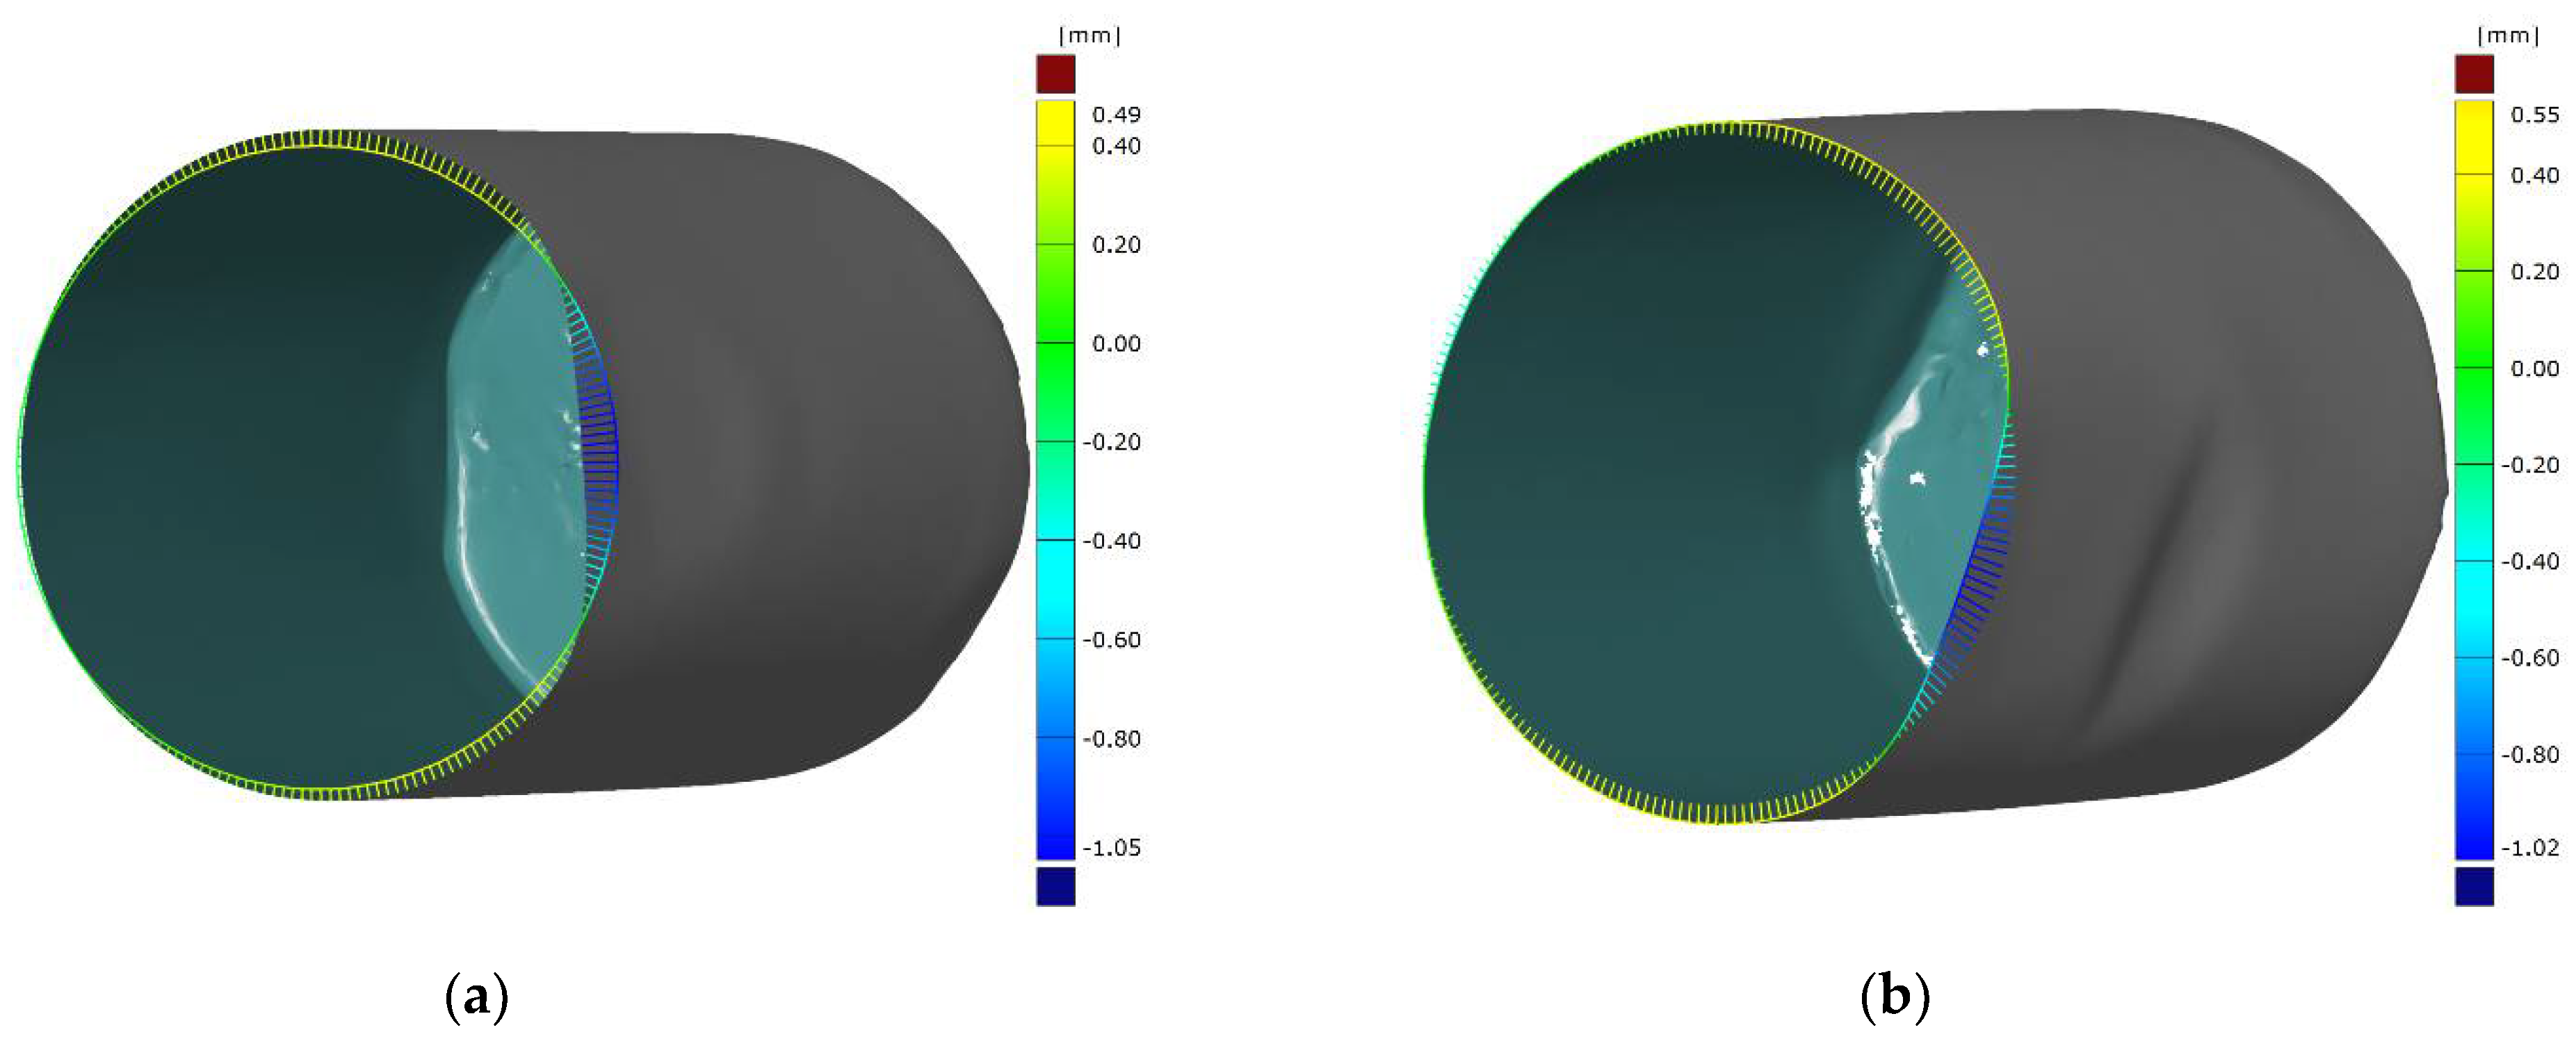
A detail of the cross-section in the impact zone in comparison with the initial circular cross-section is depicted in Figure 11. It can be seen that the impacted zone is strongly deformed towards the inside of the battery (negative values), and in a perpendicular plane, the steel case is deflected to the outside of the battery (positive values). The ratio between these deflections is about 2.14.
3.2. FE Model Build Up and Simulation Results
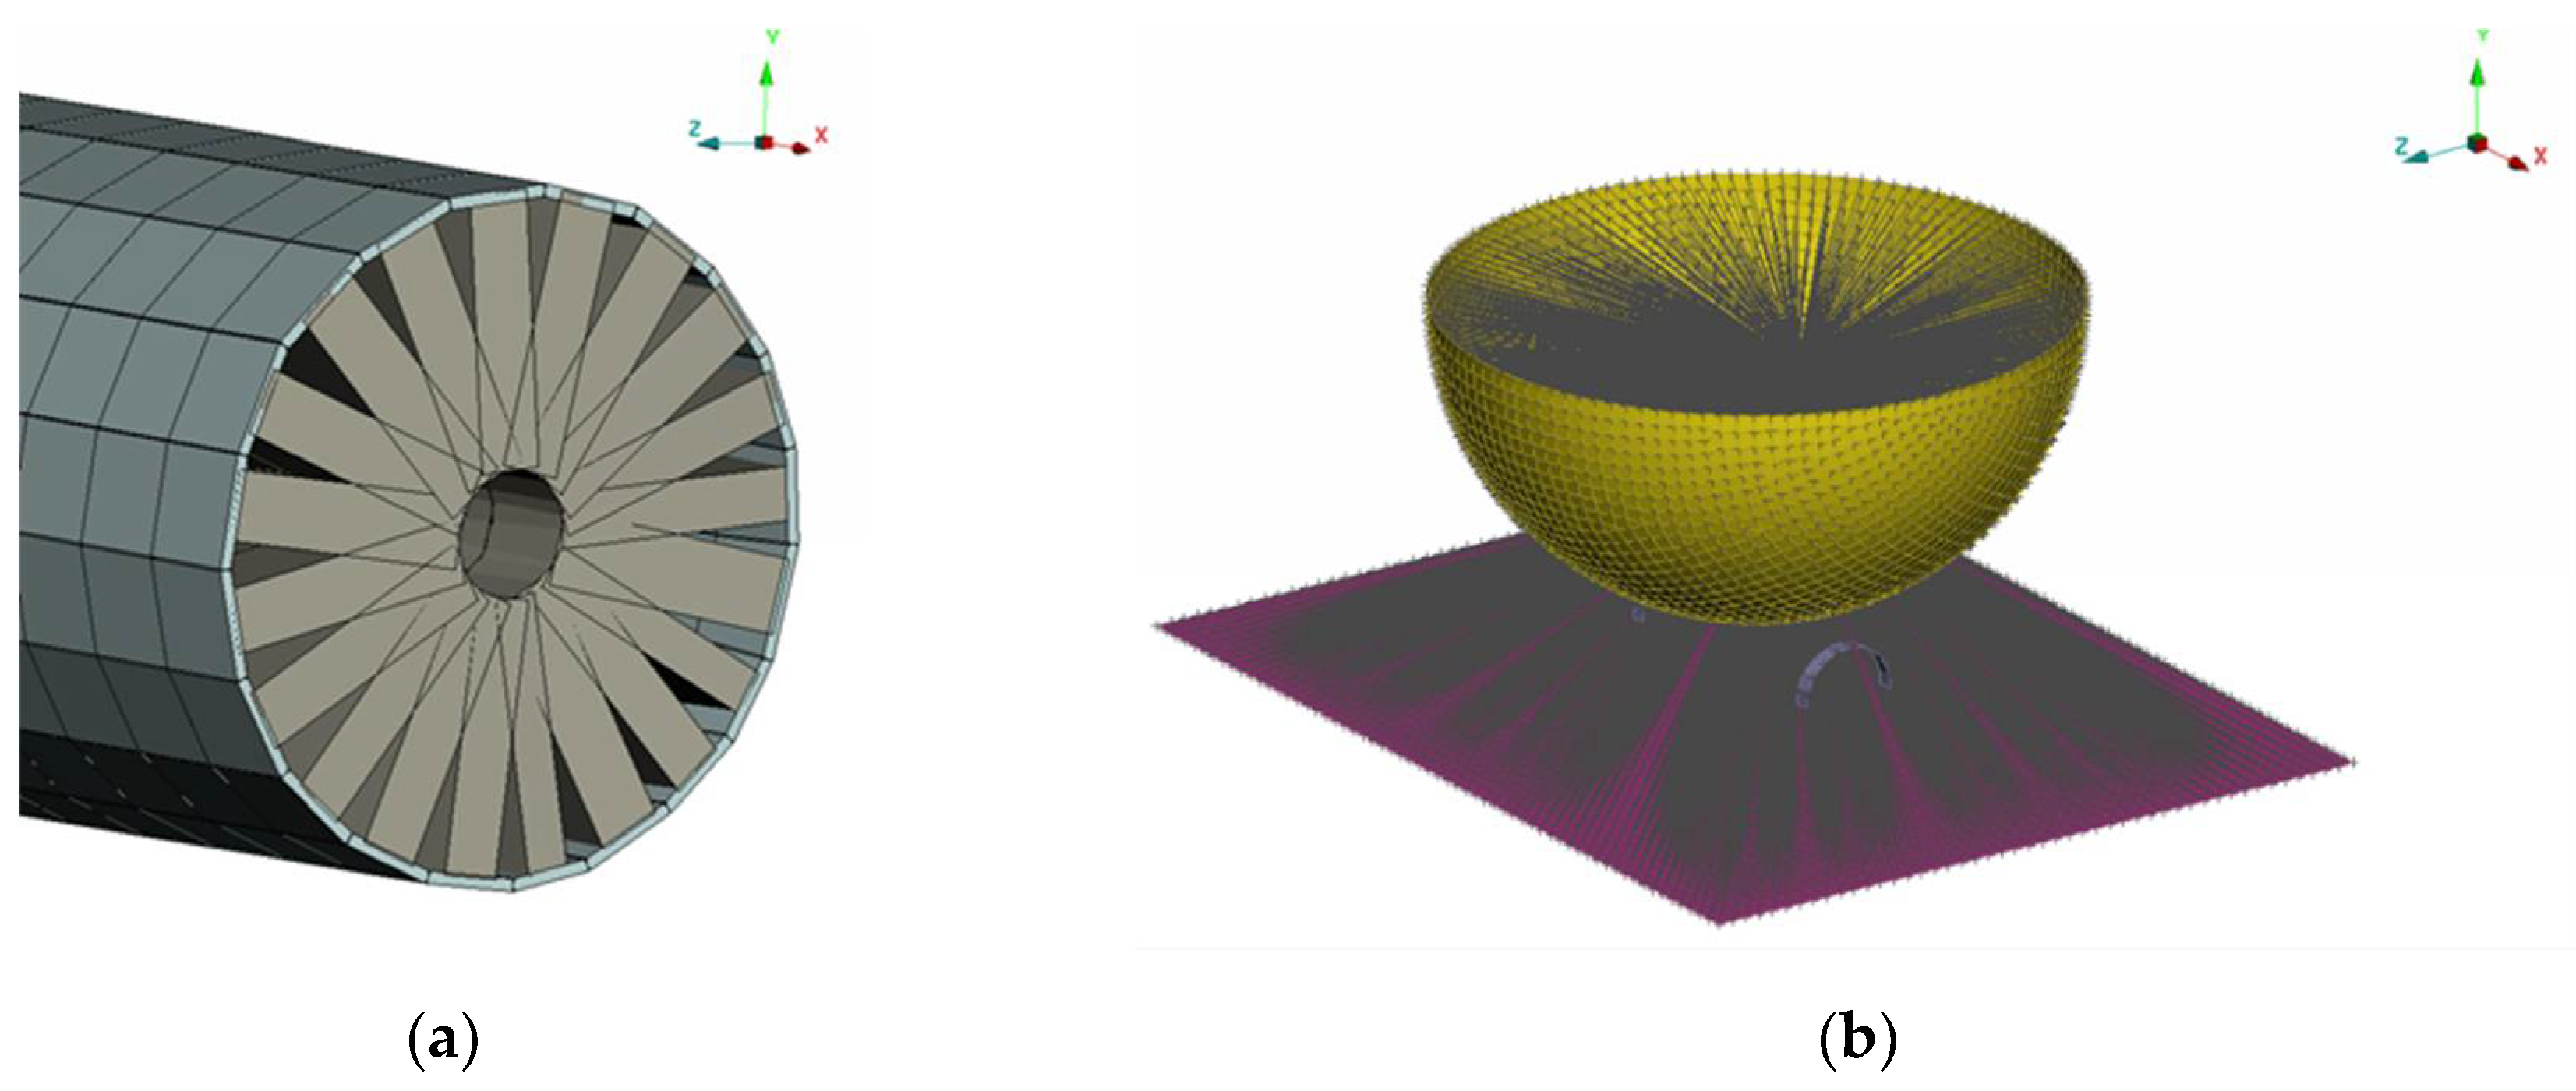
The simulation of the model was performed with the LS DYNA solver and is presented in Figure 12. The battery model has two parts: one shell for the case, and one for the interior with the above presented materials. These shells are made of elements with a medium size of 3 mm. The size is important to keep the time step low without adding mass to the model; in this case, close to 0 mass was added. Time step is influenced by the size of the element and the density of the element material. The part of the battery contained 465 hexa (94.7%) and 26 tria (5.3%) elements. For the jelly roll shell, the numbers were 422 hexa (97.25%) and 14 tria (2.75%) elements.
The pendulum ball was modeled out of rigid shells. In this case, the plate in the model was considered un-deformable, as it was also made by ideal rigid shells. This method of modeling was chosen due to the complexity of measuring the real stiffness of the place where the battery was fixed, which was in the middle of the plate in the front of the pillar that sustained the plate.
The ball had a defined mass of 9 kg and an initial velocity of 3.26 m/s at contact with the battery. The contact between the battery and the plastic bands was defined in LS DYNA as tied contact with a specific maximum force from which it comes undone as in the real test.
The simulation had a total time of 2 ms with a printing output of 0.2 ms, enough for the battery to reach the maximum deformation.
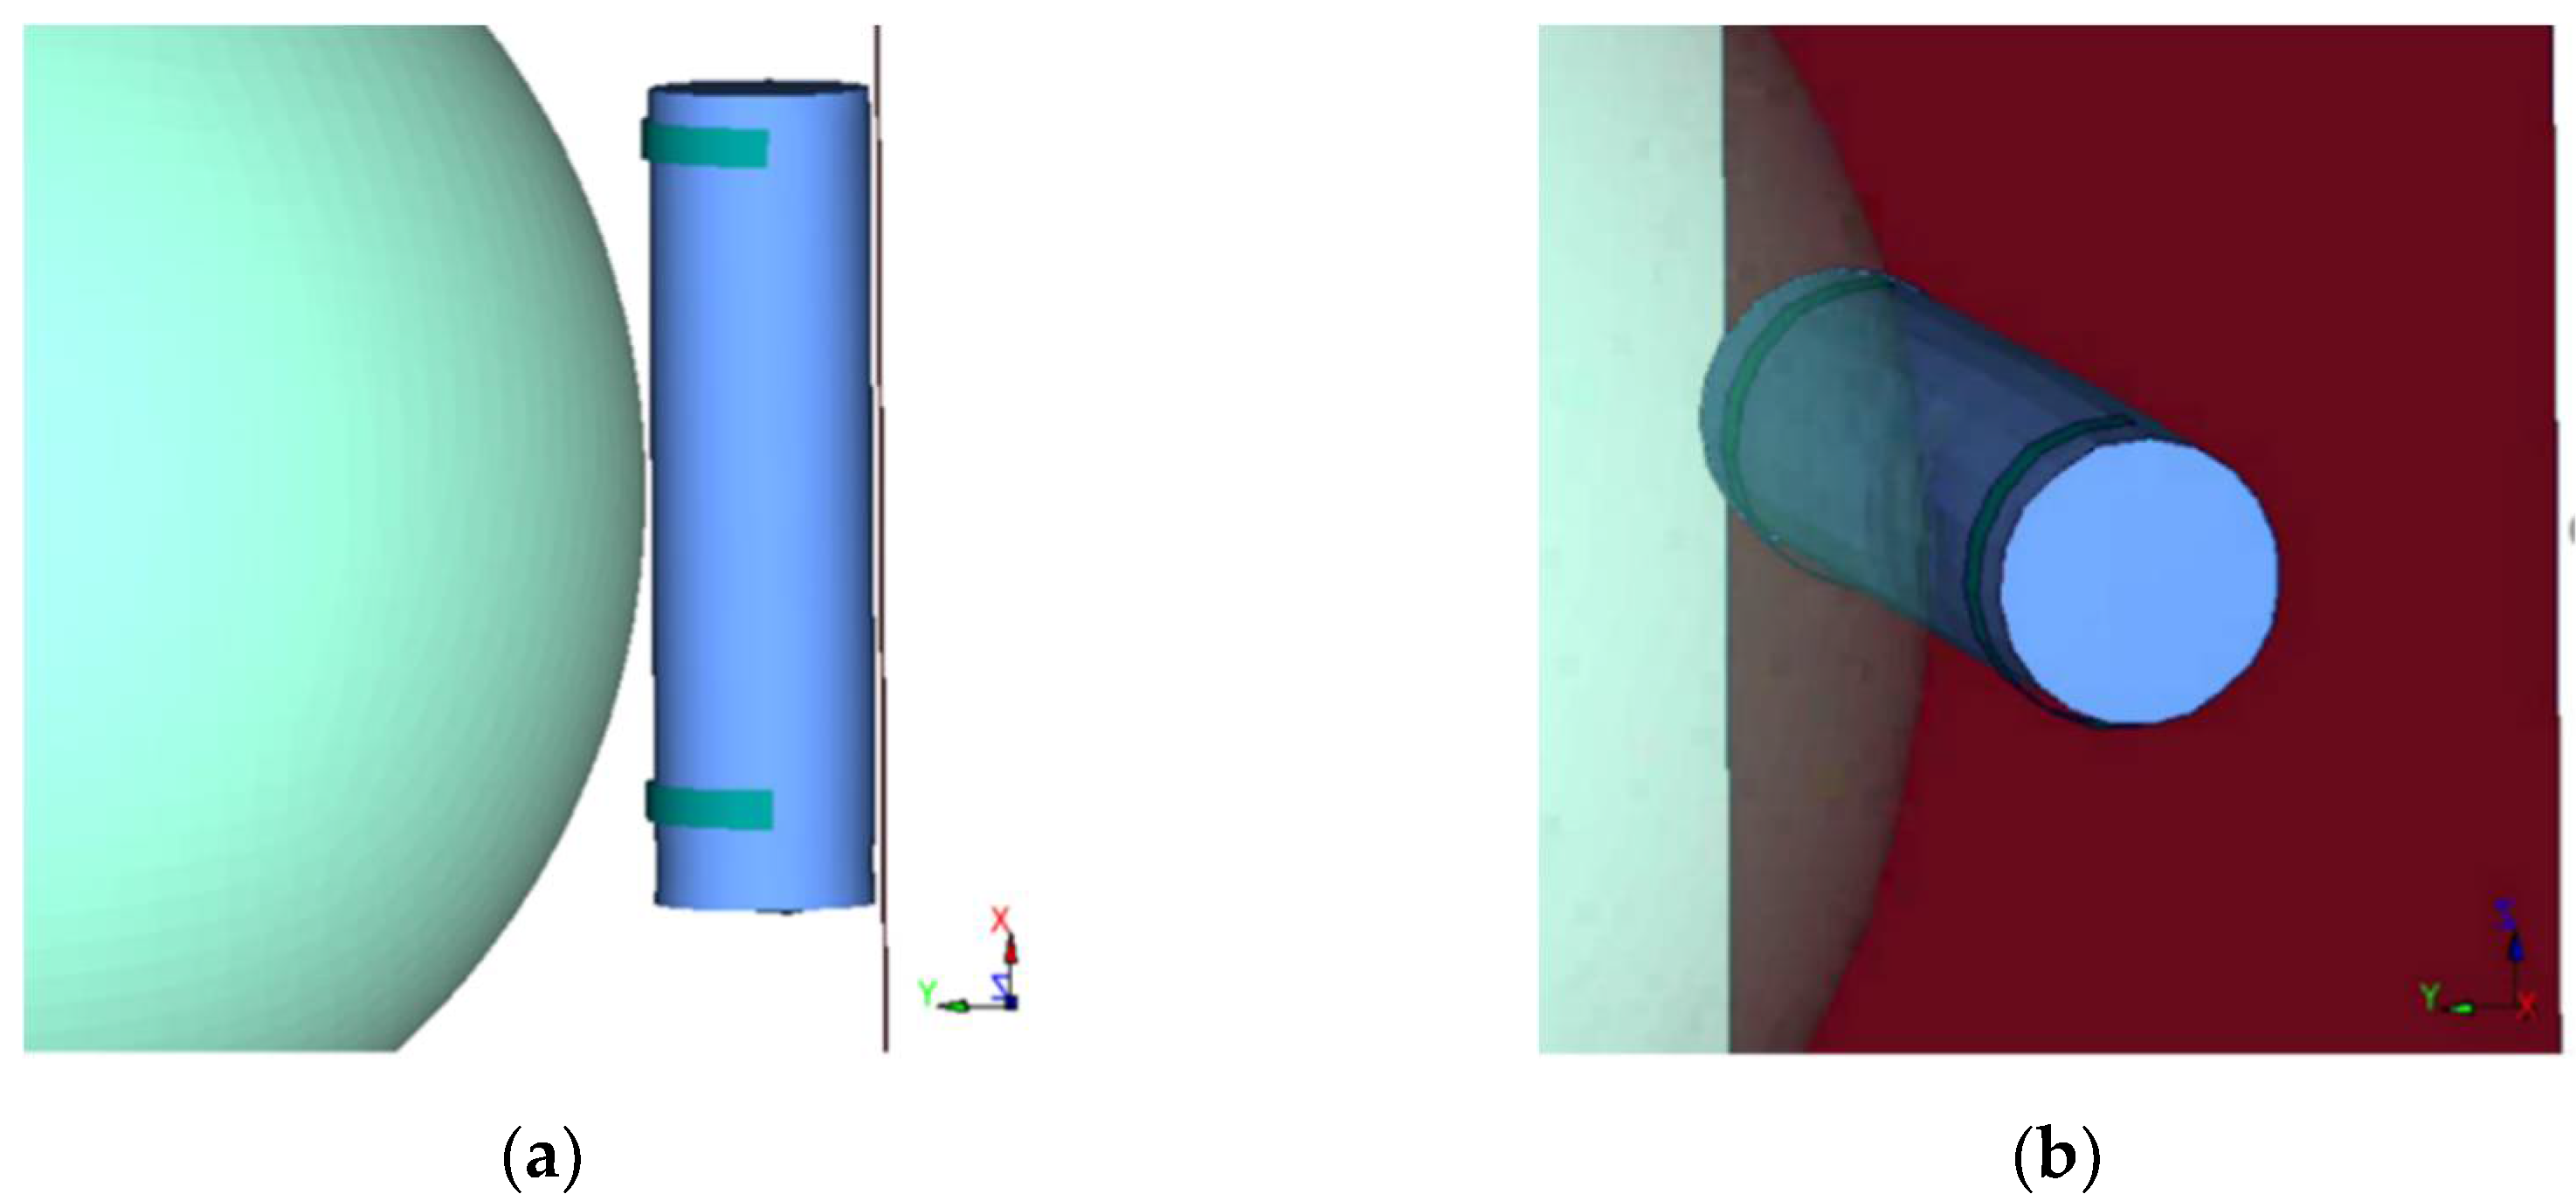
Figure 13 shows two stages of the explicit dynamic simulation, namely before and after the impact. For accurate simulation, the two bent strips that keep the battery in position before impact visible in Figure 8 were also modeled.
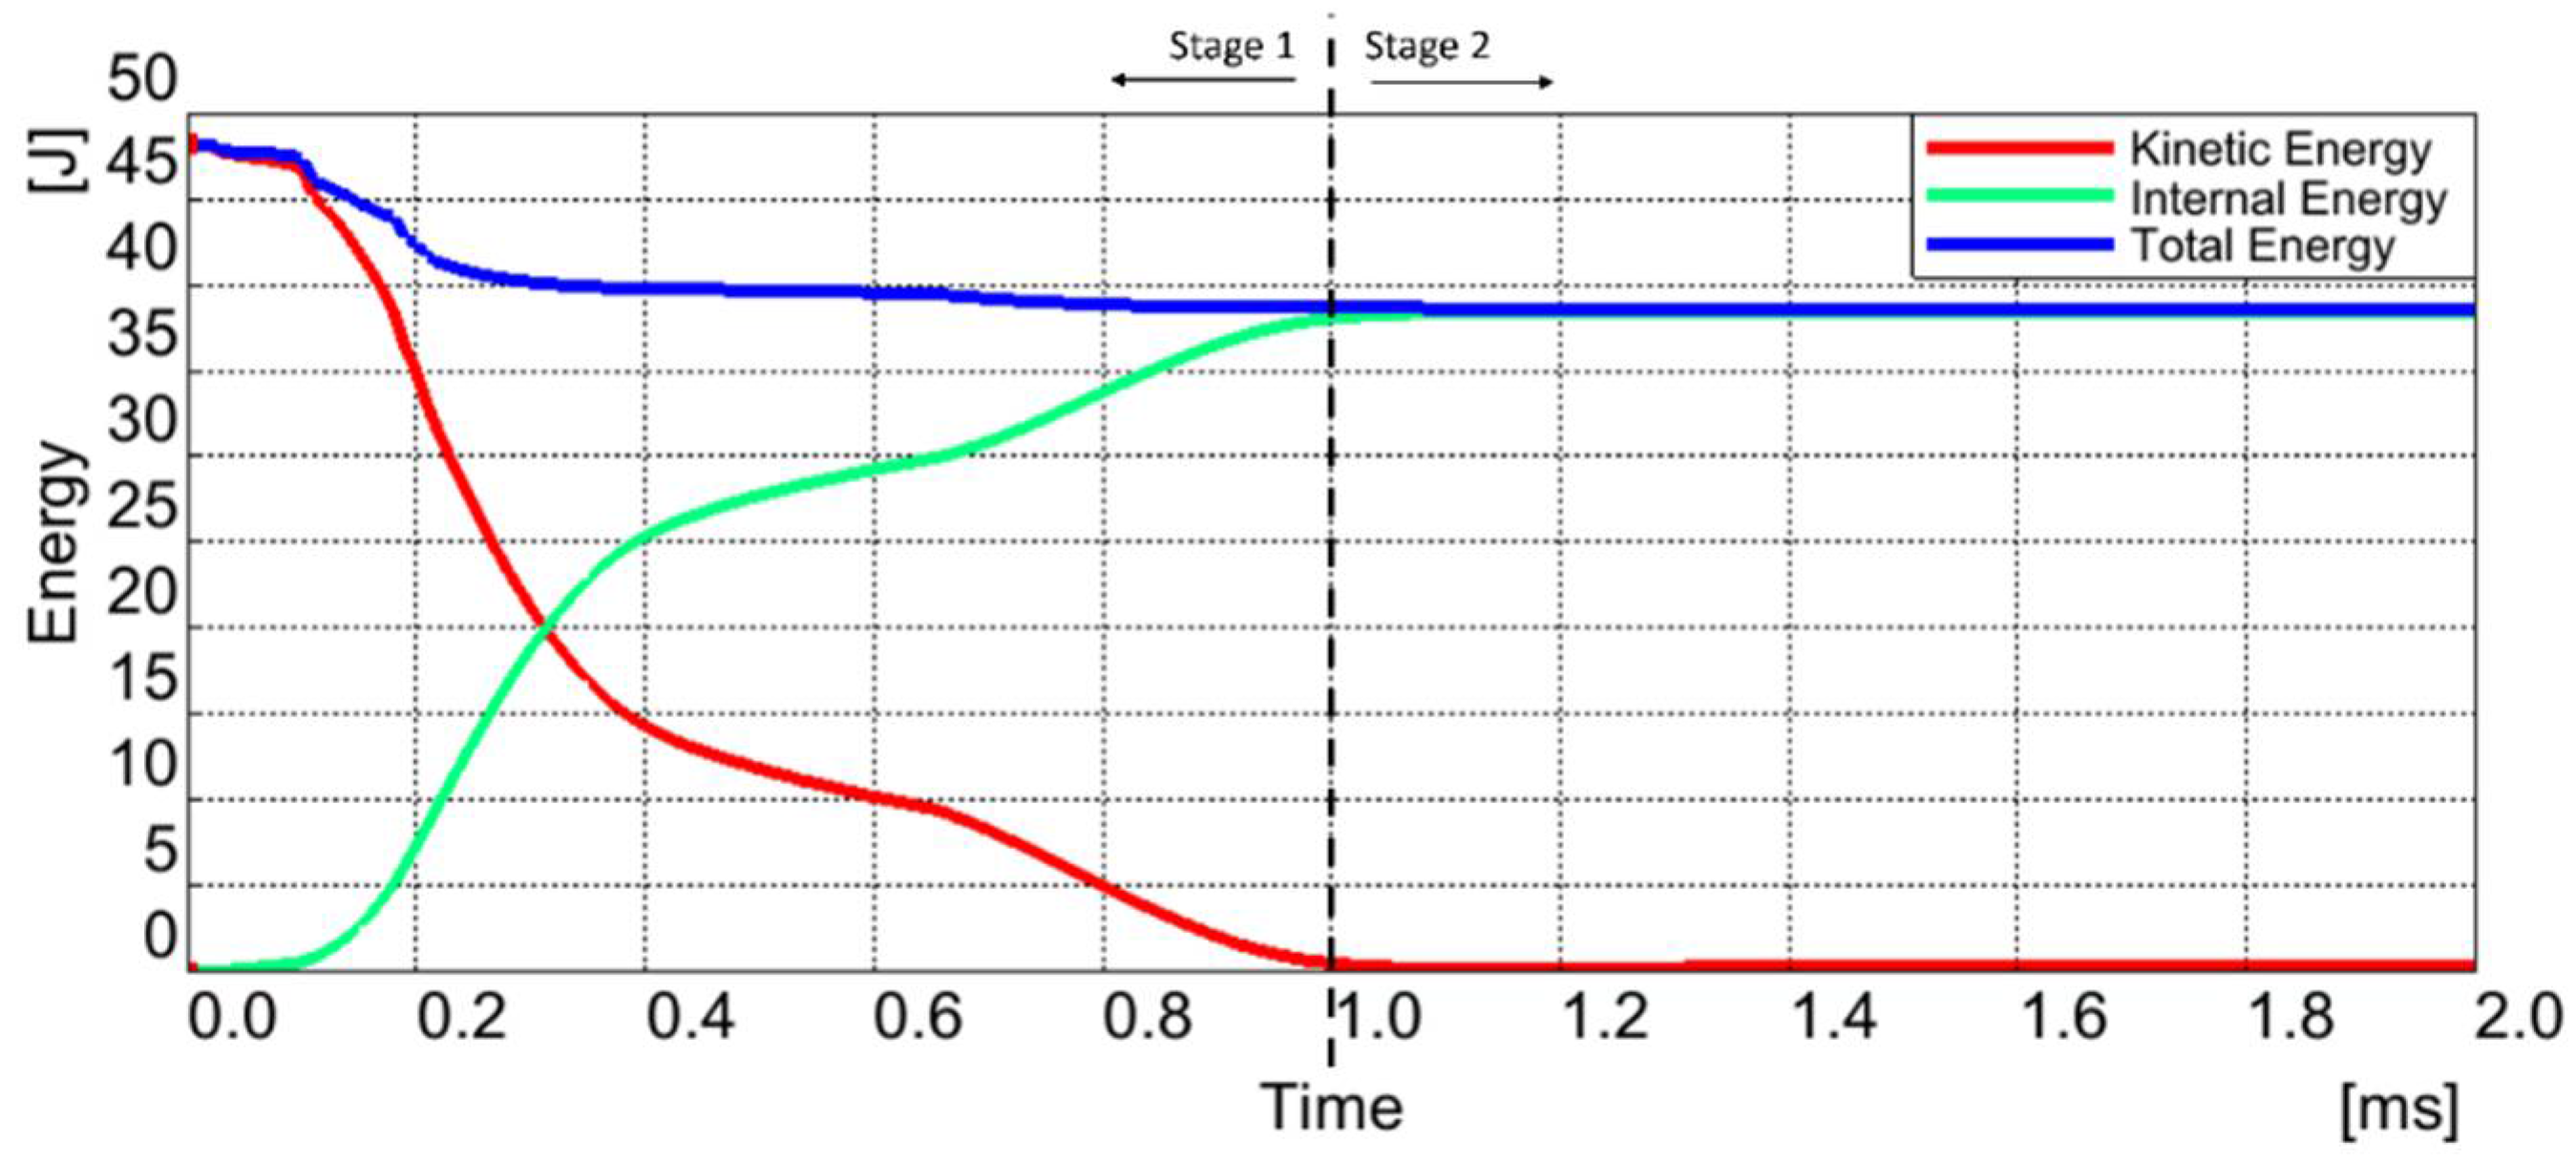
In an explicit simulation, the important energy check is related to the variation of the kinetic, internal, and total energy. Figure 14 represents the energy variations across the simulation time, during which the kinetic energy value at the beginning of simulation was 48 J, the same as the kinetic energy of the real test calculated in the second paragraph. We can also see in stage 1, before 1 ms, how the kinetic energy is changing in internal energy as the ball hits and the battery is deforming. The internal energy is calculated as the sum between these energies (kinetic and internal), so it remains constant during the simulation. In stage 2 of the simulation, after 1 ms, the ball has lost all the kinetic energy, so the battery reached the maximum deformation due to impact, so it confirms that 2 ms of simulation is enough for this load case.
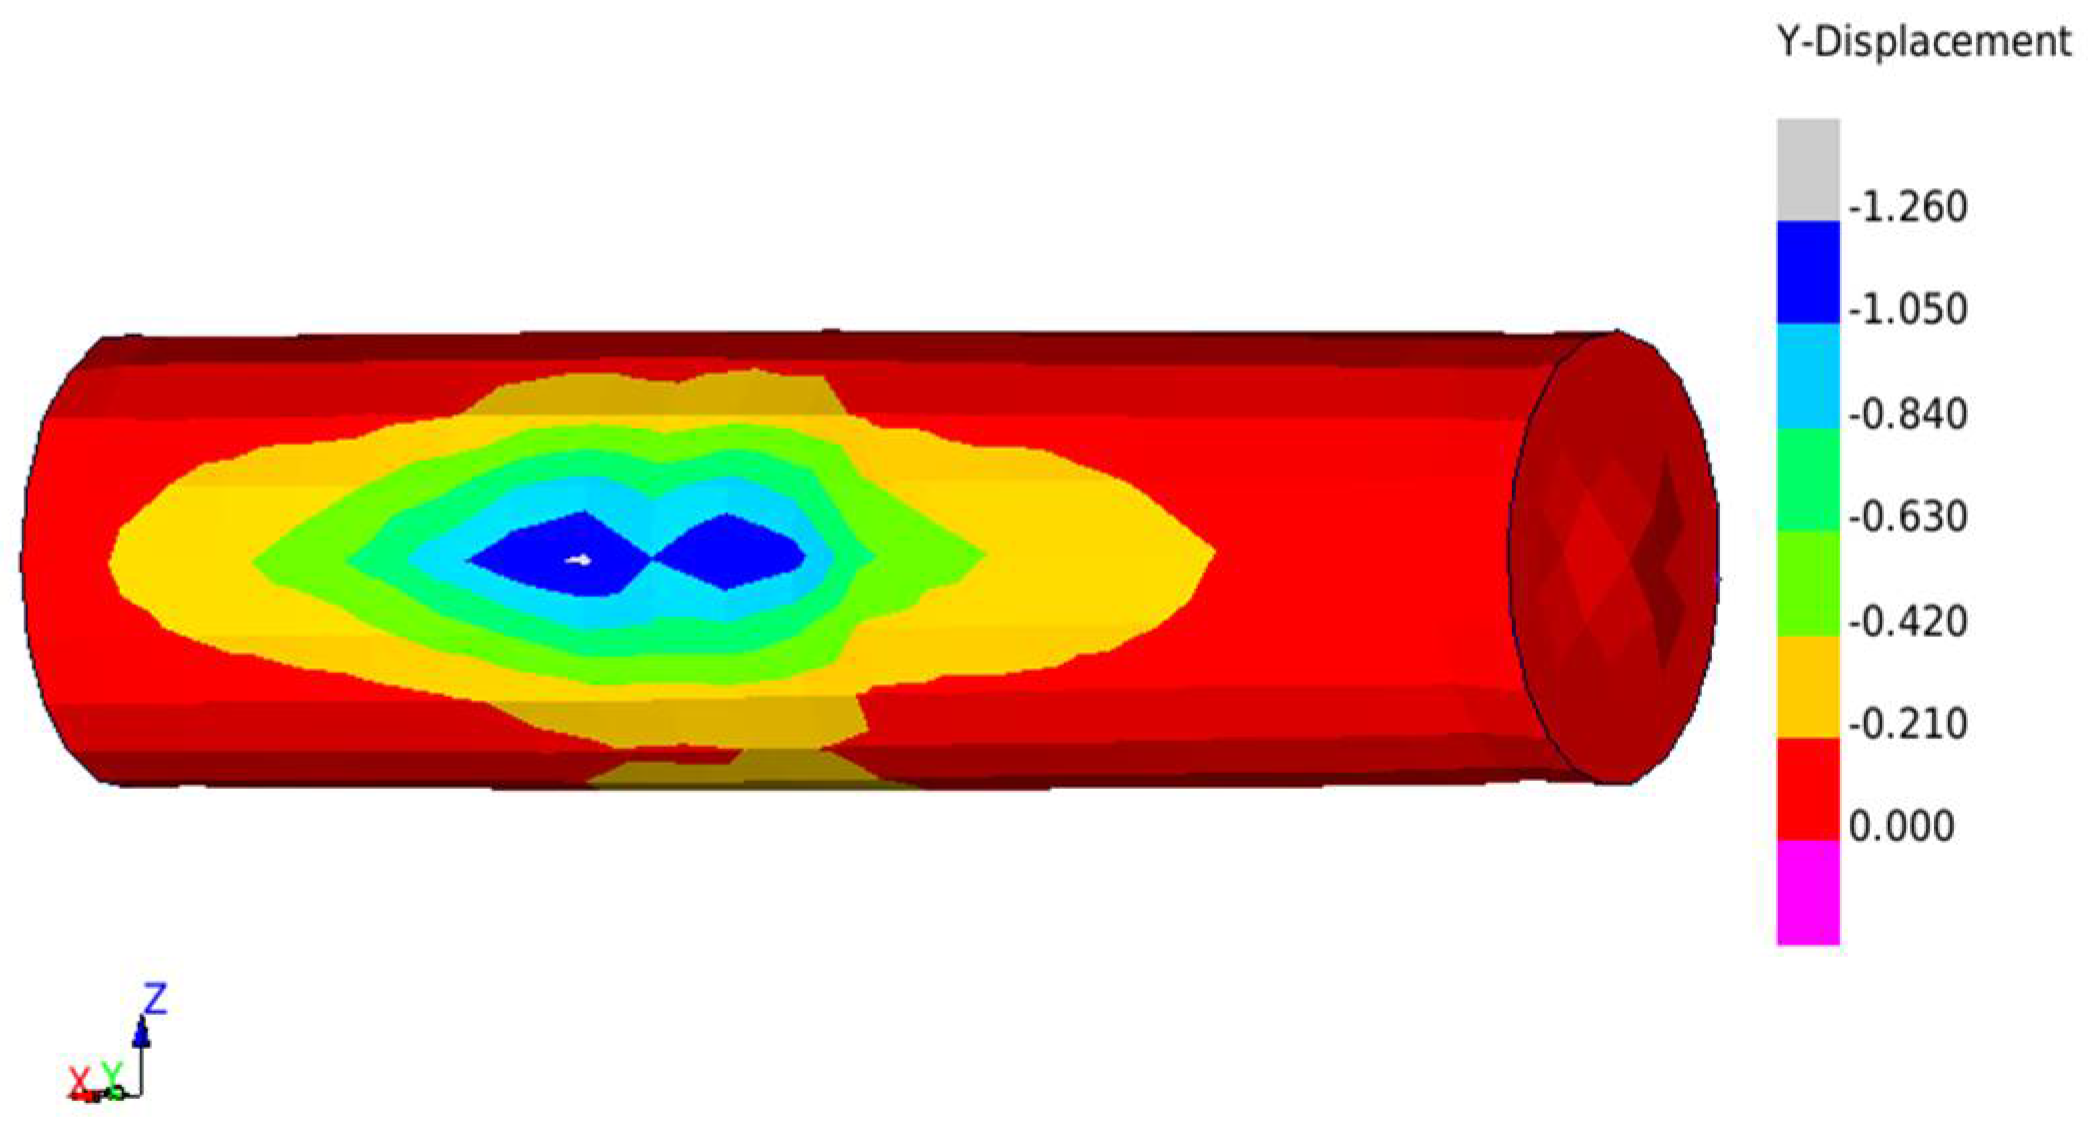
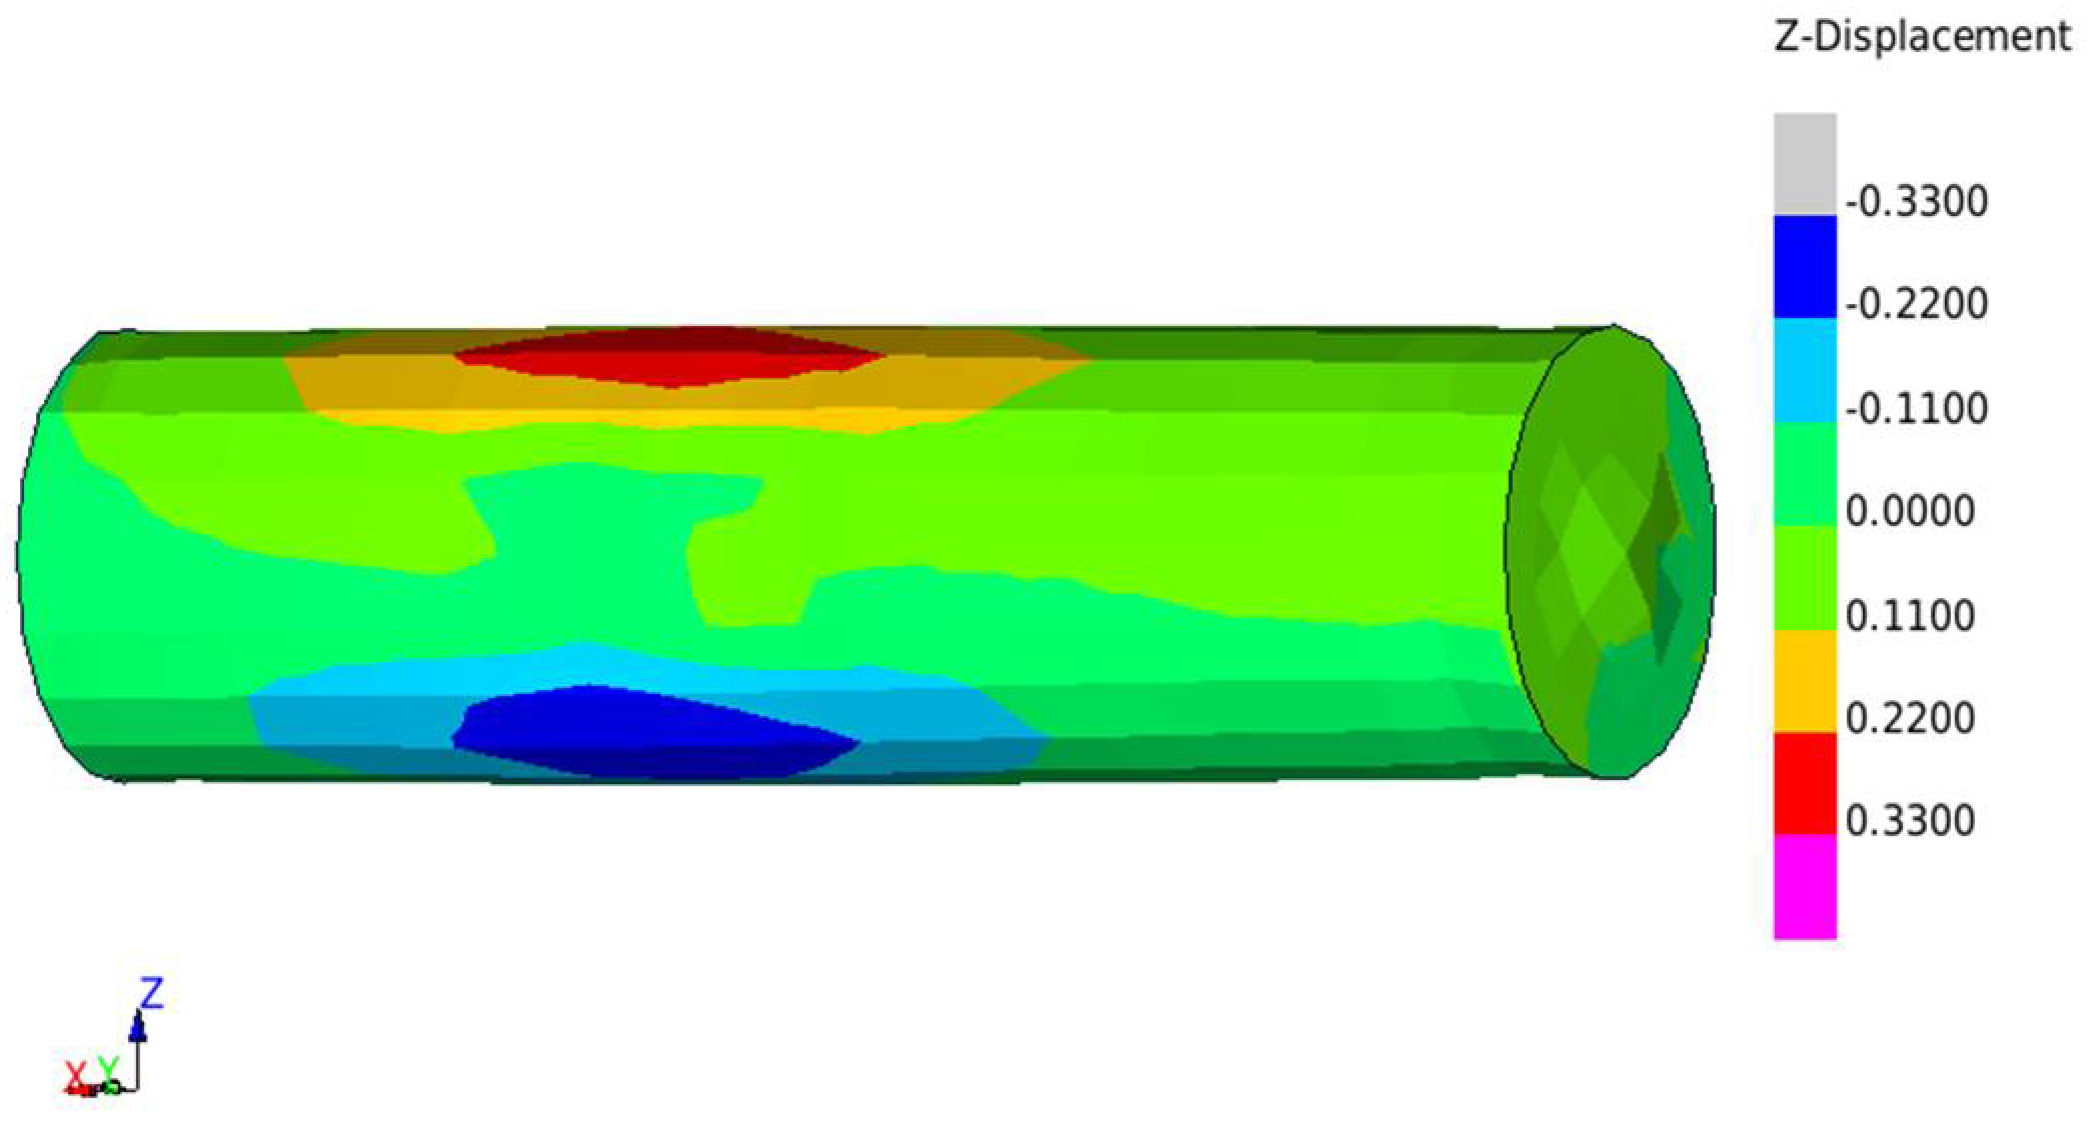
The simulation results are presented in color-coded images in Figure 15 and Figure 16, and are represented by the maximum deformation of the battery, where the Y displacement represents the deformation on the direction of the ball impact, and the Z displacement is the deformation of the battery in the perpendicular direction of the impact. The maximum Y and Z displacement values are 1.24 mm and 0.33 mm, respectively. The overall values are comparable with the real test result shown above in Section 3.1, having a deviation of 14.8% for impact direction (Y) and 19.5% for deformations in a perpendicular direction (Z) due to energy loss in the system movement and the fixing plate’s small elastic deformation—variables which are not present in the simulation model.
4. Conclusions
One of the most critical scenarios during the impact of an electrical vehicle is the damage of the battery pack. Mechanical abusive loads acting on several cells can have serious consequences on the electrical and thermal stability of the battery pack, affecting passengers’ safety and neighborhood vehicles. The development of a numerical model for an explicit dynamic simulation of a Li-ion battery pack under impact implies a significant computational effort if detailed models of a single battery cell are employed. Establishing a complex concept of a battery protection system against deformation by structural elements to comply with legal impact regulations, consumer impact tests, and other requirements can begin by using simplified but accurate numerical models of a battery cell.
A mechanical impact test on commercial cylindrical lithium-ion batteries was carried out in order to assess the deformation level of the cell. A combination of experiments and numerical simulations were used to investigate a battery cell impacted with a spherical object.
A macro-mechanical finite element model of the cell, suitable for standard crash simulations, was set up using an element mesh size of approximately 3 mm. The material model properties for the individual battery constituents were obtained from standard tensile tests. The material properties for the jelly roll were calibrated from a combination of experimental and numerical simulations of individual and layered specimens.
The precise measurement of the plastic deformation of the battery after impact was performed by a 3D, full-field optical scanning system with a precision micrometer level. This method allows for full-field shape information and, by comparison with the initial geometry of the battery, the deflection of any point can be evaluated. The full-field information obtained after post-processing of the scanning process can be directly compared with the finite element simulation results.
Agreement between the numerical and experimental values of the deformations produced by the impact is good considering the cumulative effects of the battery support, the friction moment of the pendulum, and the stiffness of the experimental setup on experimental results.
Considering the low computing power needed for calculations and the acceptable mesh size for crashes, the model presented in this paper can be used in bigger resources consuming crash simulation models. In this way, the cell deformation and behavior can be tracked more easily for safety management and diagnosis of the crashworthiness of the packs or car batteries.
The findings presented in this paper allow the following overall conclusions to be drawn:
- Building a numerical model of a battery cell is reliable if material models of its individual components, especially the homogenized model of the jelly roll, are experimentally calibrated;
- Ensuring the correct evaluation of an experimental impact test implies a full-field reconstruction of the deformed geometry of a battery cell, a proper method being proposed in the paper;
- The use of a simplified numerical model of a single cell is suited to evaluate the impact behavior of a battery pack and the corresponding battery protection system subjected to impact loads.
Despite the deviations that were documented between the simulation and experimental results, the findings provide researchers with a useful experimental and simulation workflow. These research findings indicate new possibilities for using a simplified numerical model of a battery cell to validate a complex explicit dynamic model of an entire battery pack and its corresponding protection system.
Author Contributions
Conceptualization: A.D.M. and M.C.D.; methodology: M.C.D.; software: A.D.M.; validation: A.D.M. and M.C.D.; formal analysis: M.C.D.; investigation: A.D.M. and M.C.D.; resources: A.D.M. and M.C.D.; data curation: M.C.D.; writing—original draft preparation: A.D.M.; writing—review and editing: M.C.D.; visualization: A.D.M.; supervision: M.C.D. All authors have read and agreed to the published version of the manuscript.
Funding
This research received no external funding.
Institutional Review Board Statement
Not applicable.
Informed Consent Statement
Not applicable.
Data Availability Statement
The data presented in this study are available in this manuscript.
Conflicts of Interest
The authors declare no conflict of interest.
References
- Maleki, H.; Howard, J.N. Internal short circuit in Li-ion cells. J. Power Sources 2019, 191, 568–574. [Google Scholar] [CrossRef]
- Cai, W.; Wang, H.; Maleki, H.; Howard, J.; Lara-Curzio, E. Experimental simulation of internal short circuit in Li-ion and Li-ion-polymer cells. J. Power Sources 2011, 196, 7779–7783. [Google Scholar] [CrossRef]
- Loud, J.; Nilsson, S.; Du, Y. On the testing methods of simulating a cell internal short circuit for lithium ion batteries. In Proceedings of the Seventeenth Annual Battery Conference on Applications and Advances, Proceedings of Conference (Cat. No.02TH8576), Long Beach, CA, USA, 18 January 2002; pp. 205–208. [Google Scholar] [CrossRef]
- Sahraei, E.; Campbell, J.; Wierzbicki, T. Modeling and short circuit detection of 18650 Li-ion cells under mechanical abuse conditions. J. Power Sources 2012, 220, 360–372. [Google Scholar] [CrossRef]
- Lamb, J.; Orendorff, C.J. Evaluation of mechanical abuse techniques in lithium ion batteries. J. Power Sources 2014, 247, 189–196. [Google Scholar] [CrossRef]
- Sahraei, E.; Hill, R.L.; Wierzbicki, T. Modeling of lithium-ion cylindrical batteries for mechanical integrity: Experiments, calibrations, and validation. In Proceedings of the Battery Congress, Detroit, MI, USA, 11–12 April 2011; pp. 11–12. [Google Scholar]
- Greve, L.; Fehrenbach, C. Mechanical testing and macro-mechanical finite element simulation of the deformation, fracture, and short circuit initiation of cylindrical Lithium ion battery cells. J. Power Sources 2012, 214, 377–385. [Google Scholar] [CrossRef]
- Zhang, X.; Sahraei, E.; Wang, K. Deformation and failure characteristics of four types of lithium-ion battery separators. J. Power Sources 2016, 327, 693–701. [Google Scholar] [CrossRef]
- Wang, C.Y.; Zhang, G.; Ge, S.; Xu, T.; Ji, Y.; Yang, X.G.; Leng, Y. Lithium-ion battery structure that self-heats at low temperatures. Nature 2016, 529, 515–518. [Google Scholar] [CrossRef] [PubMed]
- Zhou, W.; Hao, F.; Fang, D. The effects of elastic stiffening on the evolution of the stress field within a spherical electrode particle of lithium-ion batteries. Int. J. Appl. Mech. 2013, 5, 1350040. [Google Scholar] [CrossRef]
- Newman, J.; Thomas, K.E.; Hafezi, H.; Wheeler, D.R. Modeling of lithium-ion batteries. J. Power Sources 2003, 119, 838–843. [Google Scholar] [CrossRef]
- Zhou, W. Effects of external mechanical loading on stress generation during lithiation in Li-ion battery electrodes. Electrochim. Acta 2015, 185, 28–33. [Google Scholar] [CrossRef] [Green Version]
- Feng, X.; Weng, C.; Ouyang, M.; Sun, J. Online internal short circuit detection for a large format lithium ion battery. Appl. Energy 2016, 161, 168–180. [Google Scholar] [CrossRef] [Green Version]
- Rao, Z.; Wang, Q.; Huang, C. Investigation of the thermal performance of phase change material/mini-channel coupled battery thermal management system. Appl. Energy 2016, 164, 659–669. [Google Scholar] [CrossRef]
- Feng, X.; He, X.; Ouyang, M.; Lu, L.; Wu, P.; Kulp, C.; Prasser, S. Thermal runaway propagation model for designing a safer battery pack with 25 Ah LiNixCoyMnzO2 large format lithium ion battery. Appl. Energy 2015, 154, 74–91. [Google Scholar] [CrossRef]
- J2464; Electric and Hybrid Electric Vehicle Rechargeable Energy Storage System Safety and Abuse Testing. SAE: Warrendale, PA, USA, 2009.
- Sahraei, E.; Hill, R.; Wierzbicki, T. Calibration and finite element simulation of pouch lithium-ion batteries for mechanical integrity. J. Power Sources 2012, 201, 307–321. [Google Scholar] [CrossRef]
- Ali, M.Y.; Lai, W.J.; Pan, J. Computational models for simulations of lithium-ion battery cells under constrained compression tests. J. Power Sources 2013, 242, 325–340. [Google Scholar] [CrossRef]
- Lai, W.J.; Ali, M.Y.; Pan, J. Mechanical behavior of representative volume elements of lithium-ion battery modules under various loading conditions. J. Power Sources 2014, 248, 789–808. [Google Scholar] [CrossRef]
- Liu, B.; Yin, S.; Xu, J. Integrated computation model of lithium-ion battery subject to nail penetration. Appl. Energy 2016, 183, 278–289. [Google Scholar] [CrossRef] [Green Version]
- Hill, R.L., Sr. Development of a Representative Volume Element of Lithium-Ion Batteries for Thermo-Mechanical Integrity. Ph.D. Thesis, Massachusetts Institute of Technology, Cambridge, MA, USA, 2011. [Google Scholar]
- Zhang, C.; Santhanagopalan, S.; Sprague, M.A.; Pesaran, A.A. A representative-sandwich model for simultaneously coupled mechanical-electrical-thermal simulation of a lithium-ion cell under quasi-static indentation tests. J. Power Sources 2015, 298, 309–321. [Google Scholar] [CrossRef] [Green Version]
- Zhu, J.; Zhang, X.; Sahraei, E.; Wierzbicki, T. Deformation and failure mechanisms of 18650 battery cells under axial compression. J. Power Sources 2016, 336, 332–340. [Google Scholar] [CrossRef]
- Szalai, S.; Szürke, S.K.; Harangozó, D.; Fischer, S. Investigation of deformations of a lithium polymer cell using the Digital Image Correlation Method (DICM). Rep. Mech. Eng. 2022, 3, 206–224. [Google Scholar] [CrossRef]
Figure 1.
Tensile test of battery materials as individual or sandwich samples.

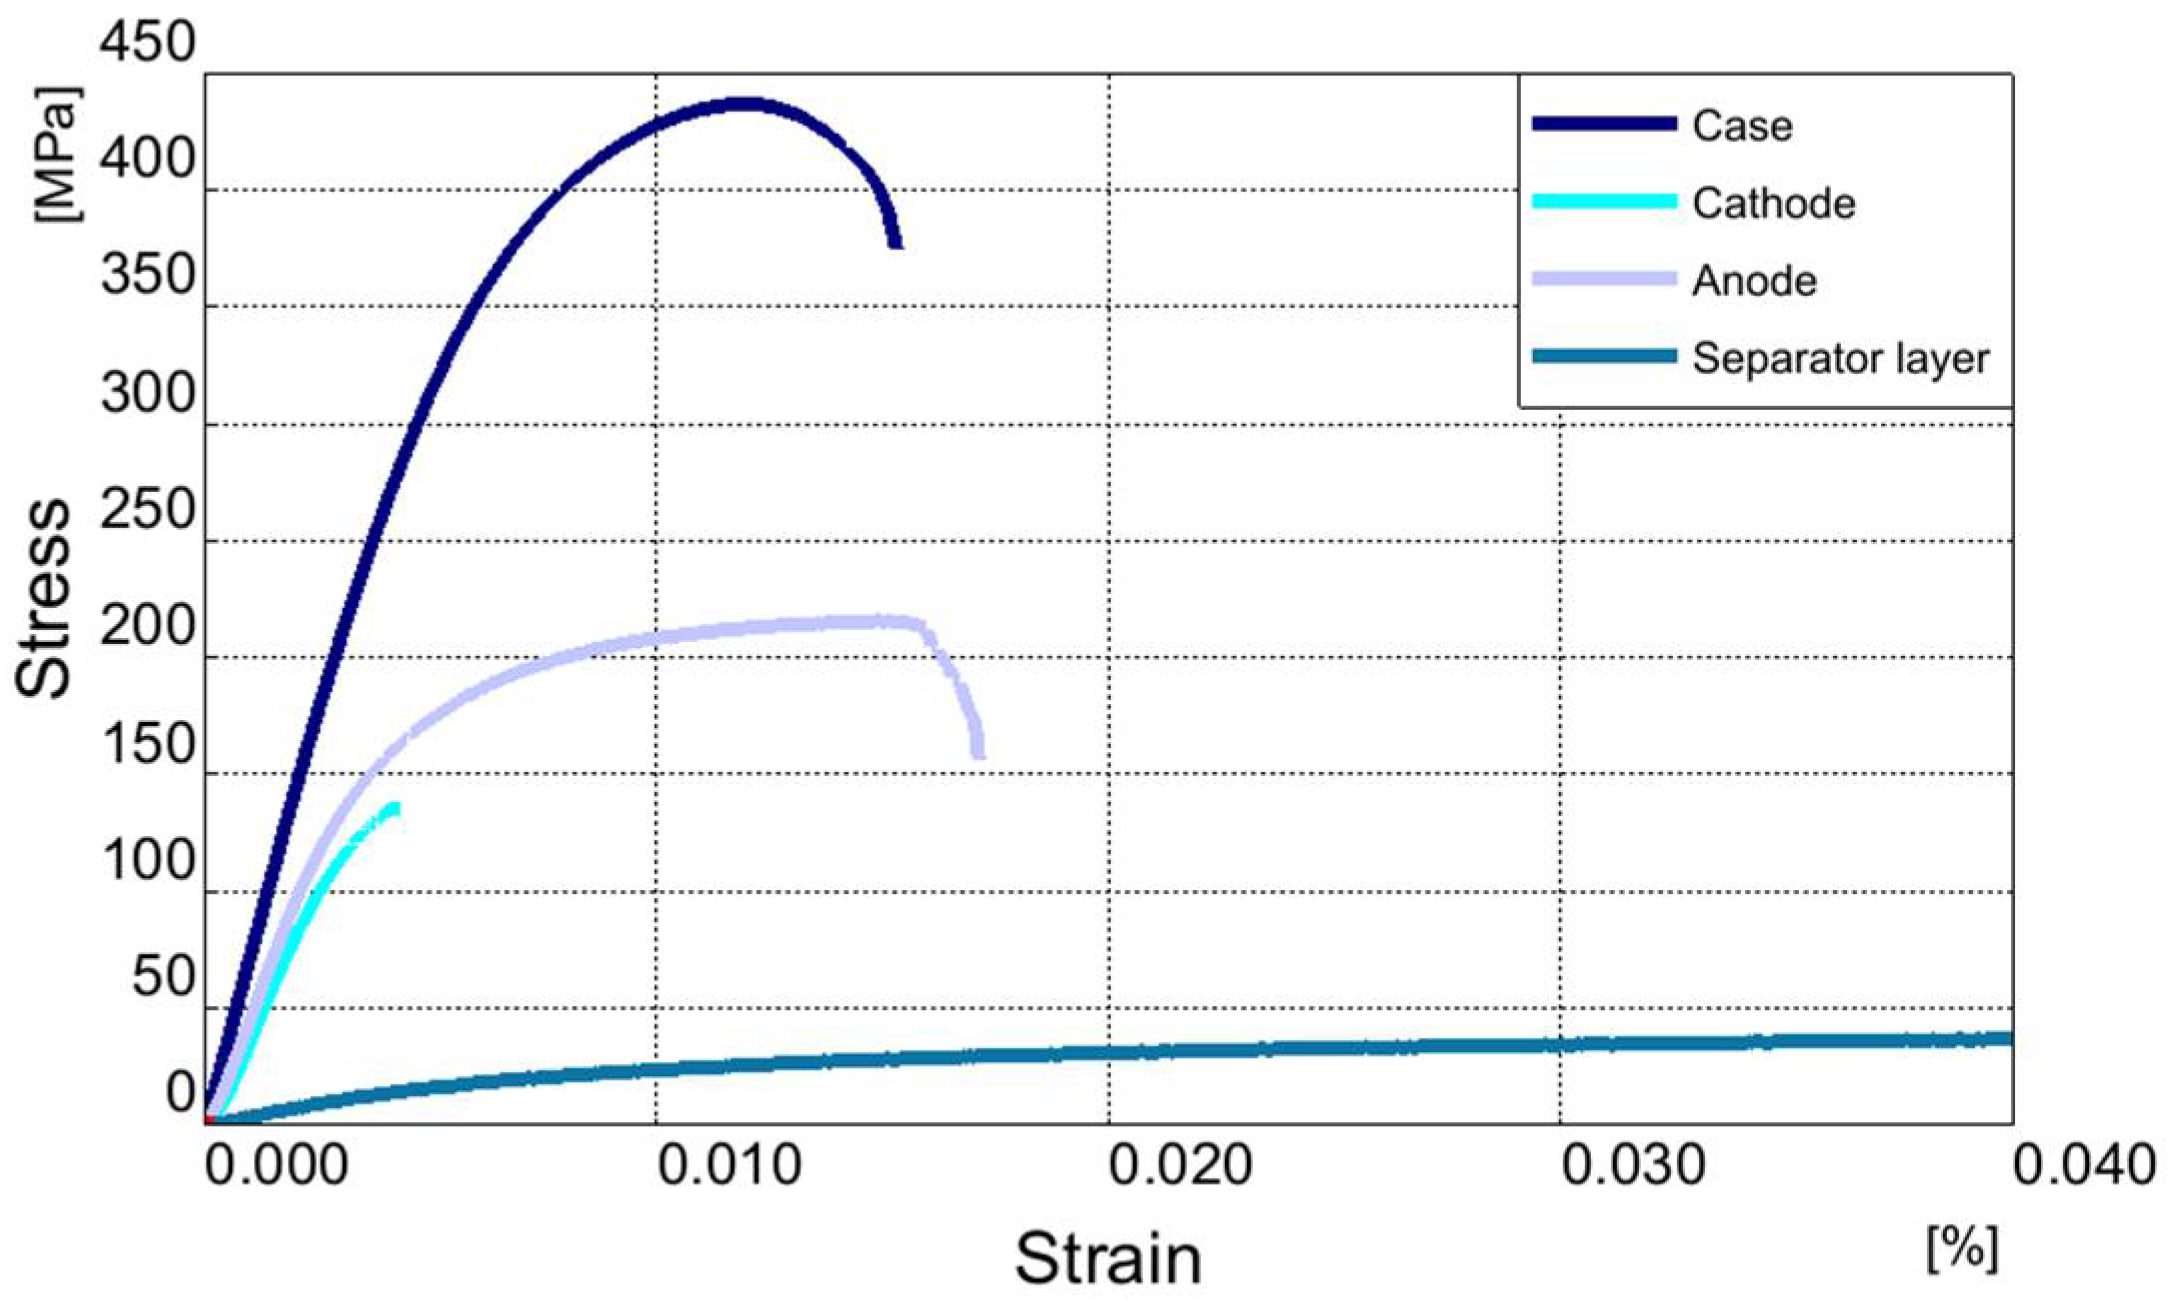
Figure 2.
Stress-strain curves of individual materials of the battery.

Figure 3.
Finite element model of the tensile specimen.

Figure 4.
Comparison of experimental and numerical tensile load-displacement curve (a) case material; (b) cathode; (c) anode; and (d) separator.
Figure 4.
Comparison of experimental and numerical tensile load-displacement curve (a) case material; (b) cathode; (c) anode; and (d) separator.

Figure 5.
Comparison of experimental and numerical (FE) load-displacement curve of jelly roll samples.
Figure 5.
Comparison of experimental and numerical (FE) load-displacement curve of jelly roll samples.

Figure 6.
Numerical jelly roll model subjected to tensile test.

Figure 7.
Load-displacement curve for FE model and experimental specimen.

Figure 8.
Battery impact test: (a) impact pendulum; (b) impact ball and battery before and after impact.
Figure 8.
Battery impact test: (a) impact pendulum; (b) impact ball and battery before and after impact.

Figure 9.
Optical 3D-scanning procedure of the impacted battery.

Figure 10.
Surface comparison scanned deformed battery vs CAD data (a) first specimen alignment of the scanned mesh on the CAD; (b) first specimen deformation results; (c) second specimen alignment of the scanned mesh on the CAD; and (d) second specimen deformation results.
Figure 10.
Surface comparison scanned deformed battery vs CAD data (a) first specimen alignment of the scanned mesh on the CAD; (b) first specimen deformation results; (c) second specimen alignment of the scanned mesh on the CAD; and (d) second specimen deformation results.

Figure 11.
Section comparison scanned deformed battery vs. CAD data (a) first specimen section results and (b) second specimen section results.
Figure 11.
Section comparison scanned deformed battery vs. CAD data (a) first specimen section results and (b) second specimen section results.

Figure 12.
Finite element model of impacted battery: (a) model of a cell with case and jelly roll elements and (b) impact ball and metal plate models.
Figure 12.
Finite element model of impacted battery: (a) model of a cell with case and jelly roll elements and (b) impact ball and metal plate models.

Figure 13.
Simulation of the battery: (a) layout side view of the initial state and (b) last state of the simulation.
Figure 13.
Simulation of the battery: (a) layout side view of the initial state and (b) last state of the simulation.

Figure 14.
Energy variations during the simulation time.

Figure 15.
Simulation of the battery deformation on impact direction.

Figure 16.
Simulation of the battery deformation on perpendicular impact direction.


Table 1.
Mechanically relevant battery components.
| Component | Material | Thickness (mm) |
|---|---|---|
| Case | Steel | 0.32 |
| Anode | Copper | 0.025 |
| Cathode | Aluminum | 0.025 |
| Separator | Polyethylene | 0.025 |
Table 2.
Case samples—Tensile test results.
| Sample | Maximum Load (N) | Tensile Stress at Maximum Load (MPa) | Tensile train at Maximum Load (%) | E-Modulus (MPa) |
|---|---|---|---|---|
| Case | 912 ± 7.4 | 429 ± 3.6 | 1.24 ± 6.6 | 72,611 ± 30 |
| Cathode | 34 ± 10 | 136 ± 10 | 0.42 ± 30 | 47,645 ± 8.4 |
| Anode | 53 ± 4.7 | 215 ± 4.7 | 1.49 ± 20 | 48,907 ± 25 |
| Separator layer | 19.6 ± 7.7 | 78 ± 7.7 | 26.8 ± 2 | 2296 ± 40 |
Table 3.
Comparison of the numerical and experimental tensile test results.
| Sample | Tensile Test Maximum Load (N) | Simulation Maximum Load (N) |
|---|---|---|
| Case | 912 | 914 |
| Cathode | 34 | 33 |
| Anode | 53 | 53 |
| Separator layer | 19.6 | 19 |
Publisher’s Note: MDPI stays neutral with regard to jurisdictional claims in published maps and institutional affiliations. |
© 2022 by the authors. Licensee MDPI, Basel, Switzerland. This article is an open access article distributed under the terms and conditions of the Creative Commons Attribution (CC BY) license (https://creativecommons.org/licenses/by/4.0/).
Share and Cite
MDPI and ACS Style
Muresanu, A.D.; Dudescu, M.C. Numerical and Experimental Evaluation of a Battery Cell under Impact Load. Batteries 2022, 8, 48. https://0-doi-org.brum.beds.ac.uk/10.3390/batteries8050048
AMA Style
Muresanu AD, Dudescu MC. Numerical and Experimental Evaluation of a Battery Cell under Impact Load. Batteries. 2022; 8(5):48. https://0-doi-org.brum.beds.ac.uk/10.3390/batteries8050048
Chicago/Turabian StyleMuresanu, Adrian Daniel, and Mircea Cristian Dudescu. 2022. "Numerical and Experimental Evaluation of a Battery Cell under Impact Load" Batteries 8, no. 5: 48. https://0-doi-org.brum.beds.ac.uk/10.3390/batteries8050048
Note that from the first issue of 2016, this journal uses article numbers instead of page numbers. See further details here.