The Influence of User-Adapted, Instructive Information on Participation in a Recycling Scheme: A Case Study in a Medium-Sized Swedish City


Abstract
:1. Introduction
2. Materials and Methods
2.1. Study Area
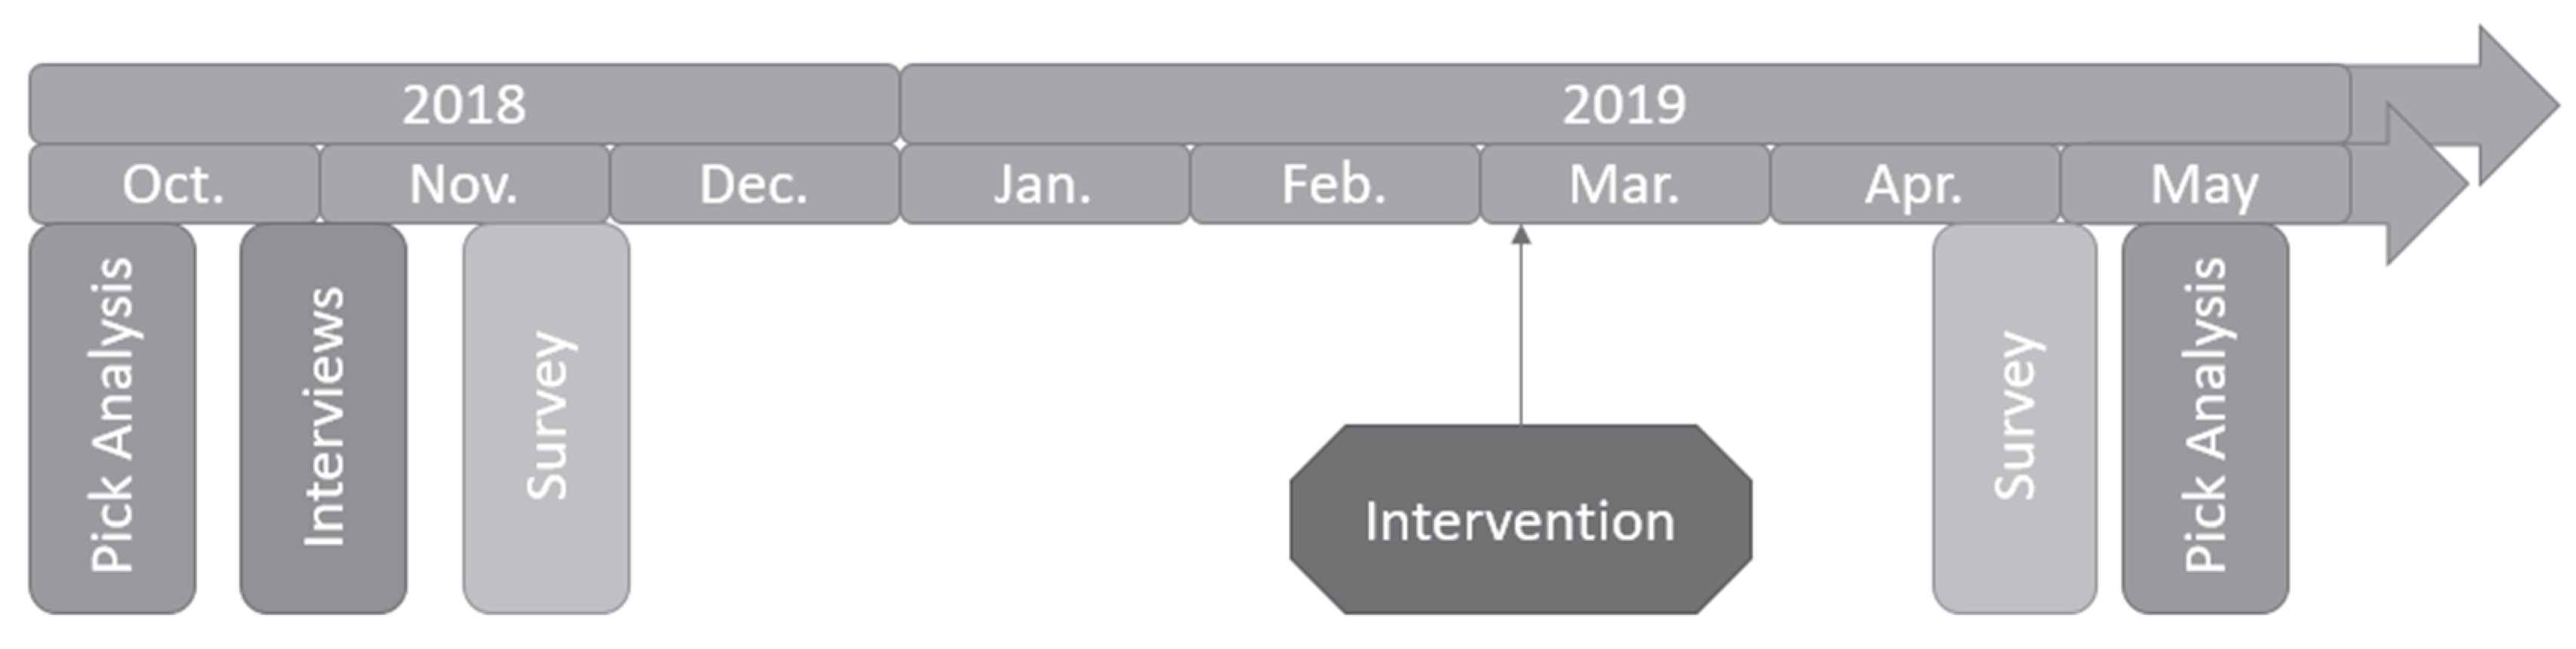
2.2. Design of the Study
2.3. Pick Analyses
2.4. Semistructured Interviews
2.5. Survey
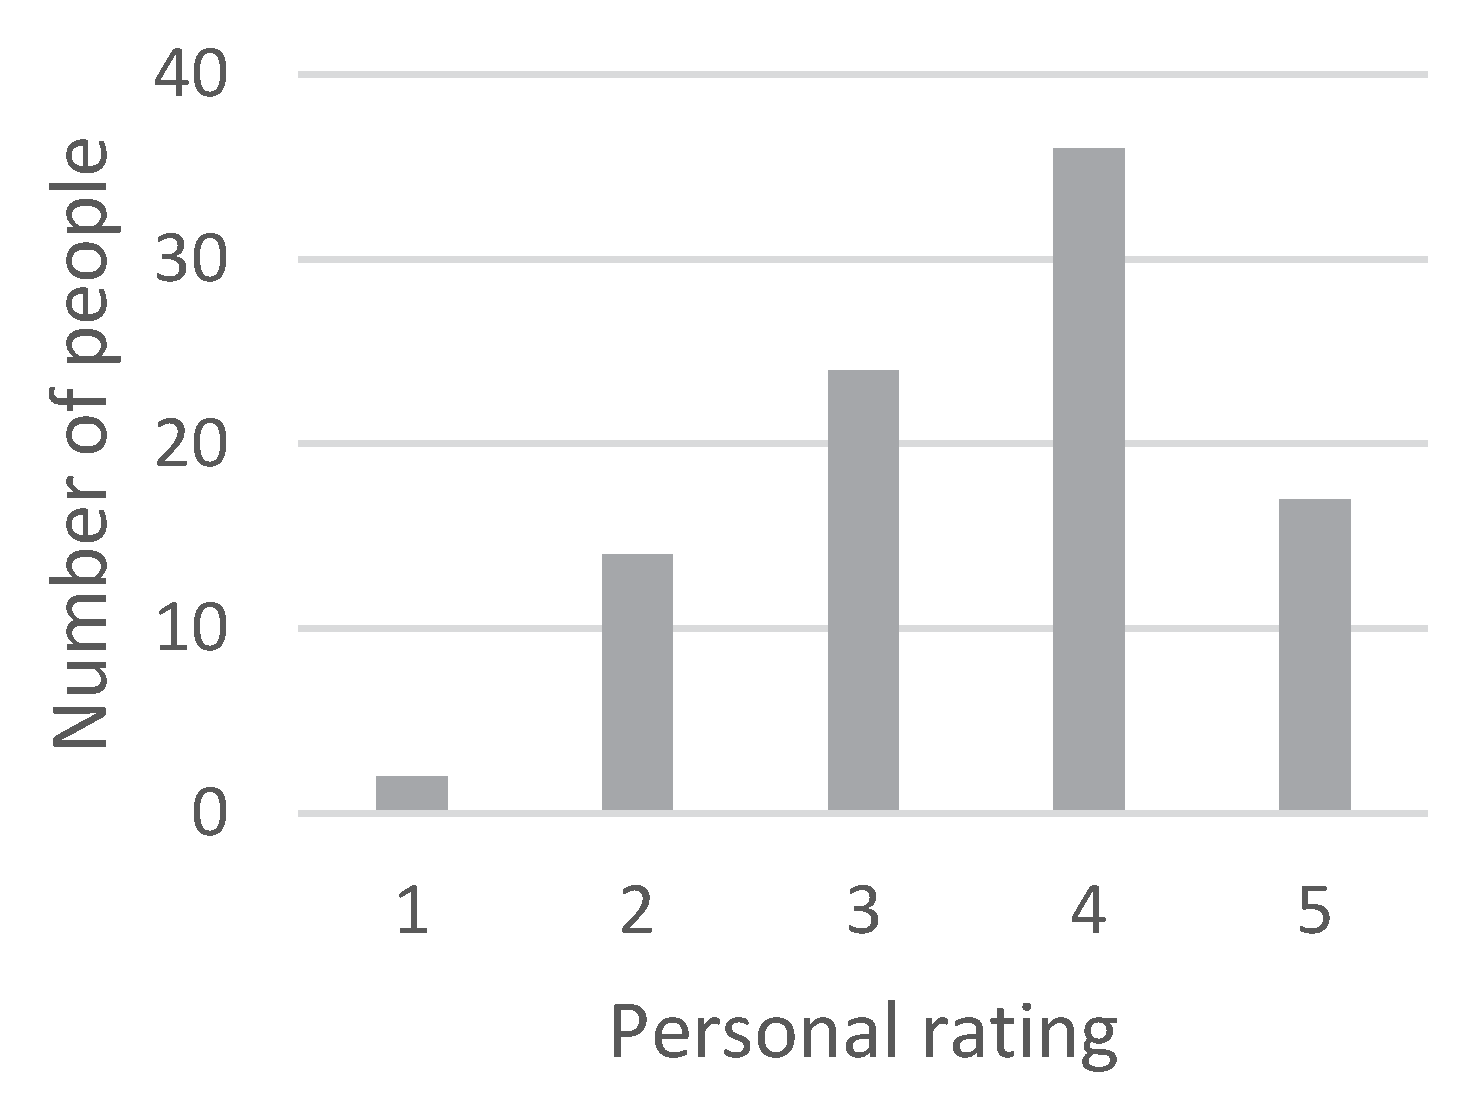
- Q.A
- (perceived behavior): How well do you sort your waste here in Borås? (5-grade)
- Q.B
- (perceived knowledge): How well do you know how the sorting system in Borås works? (5-grade)
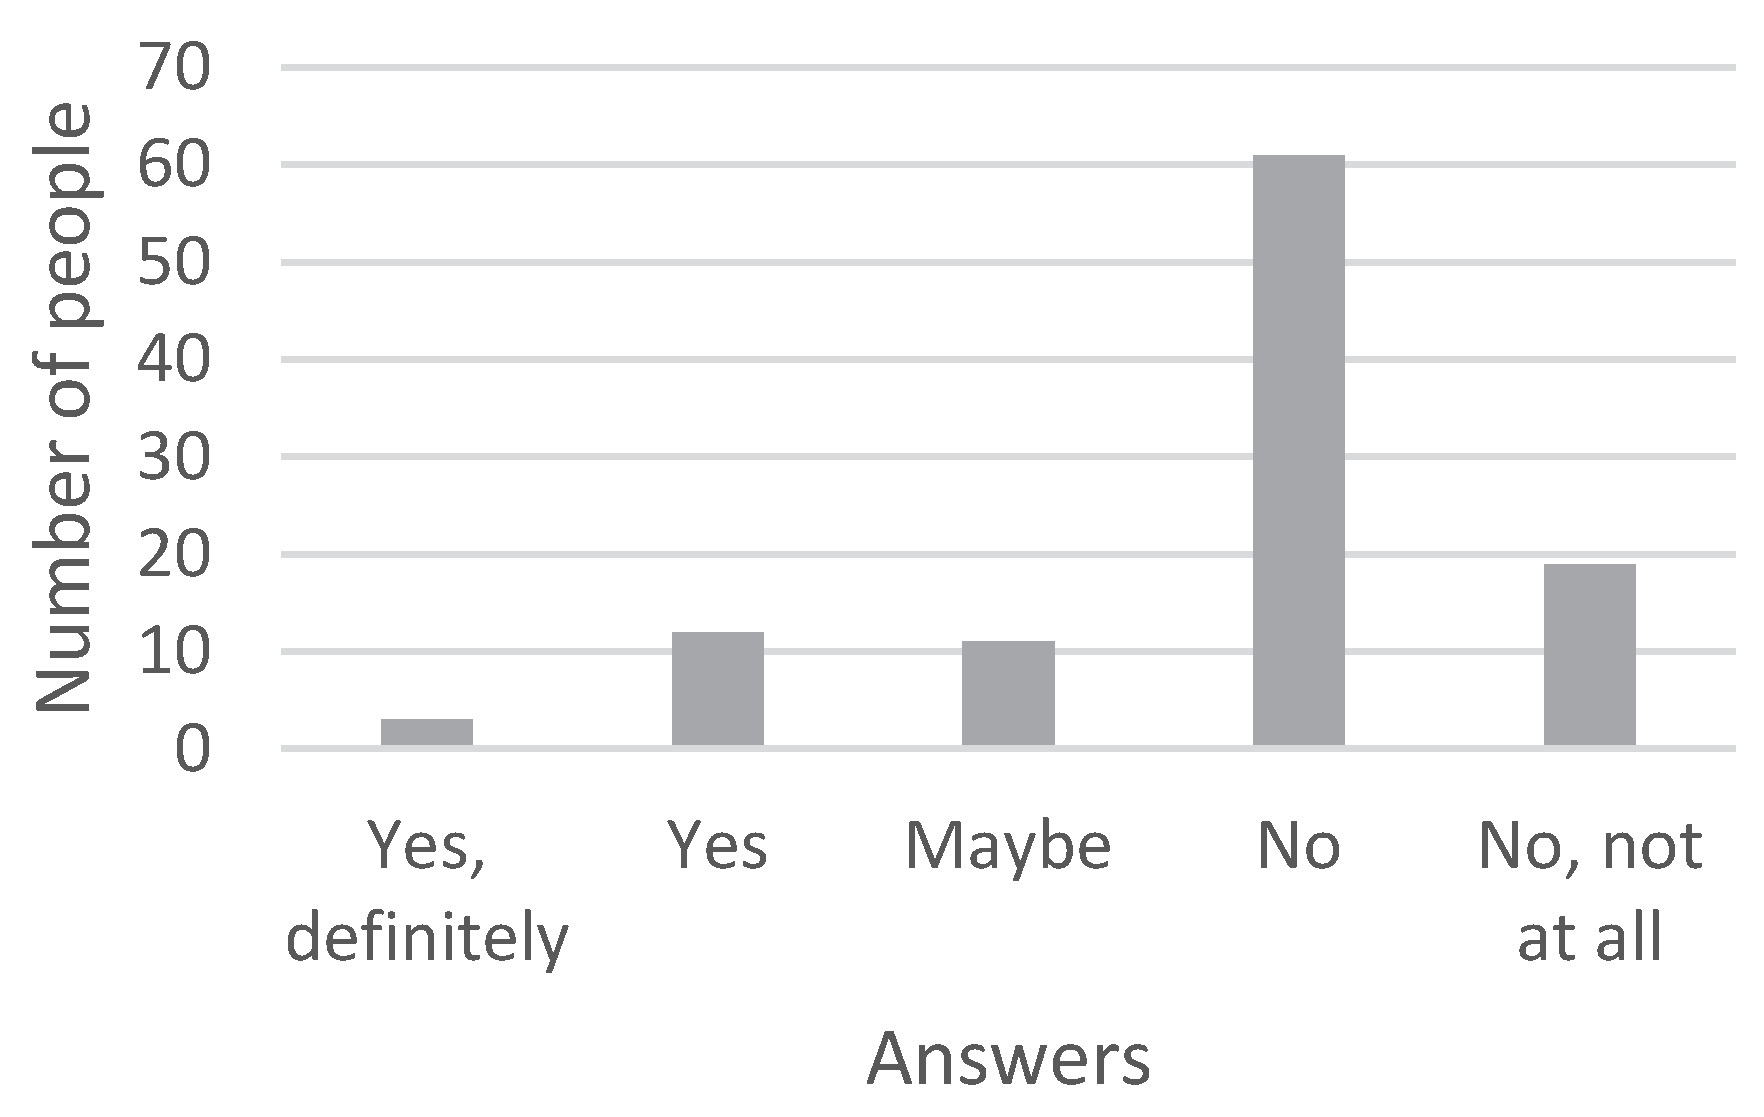
- Q.C
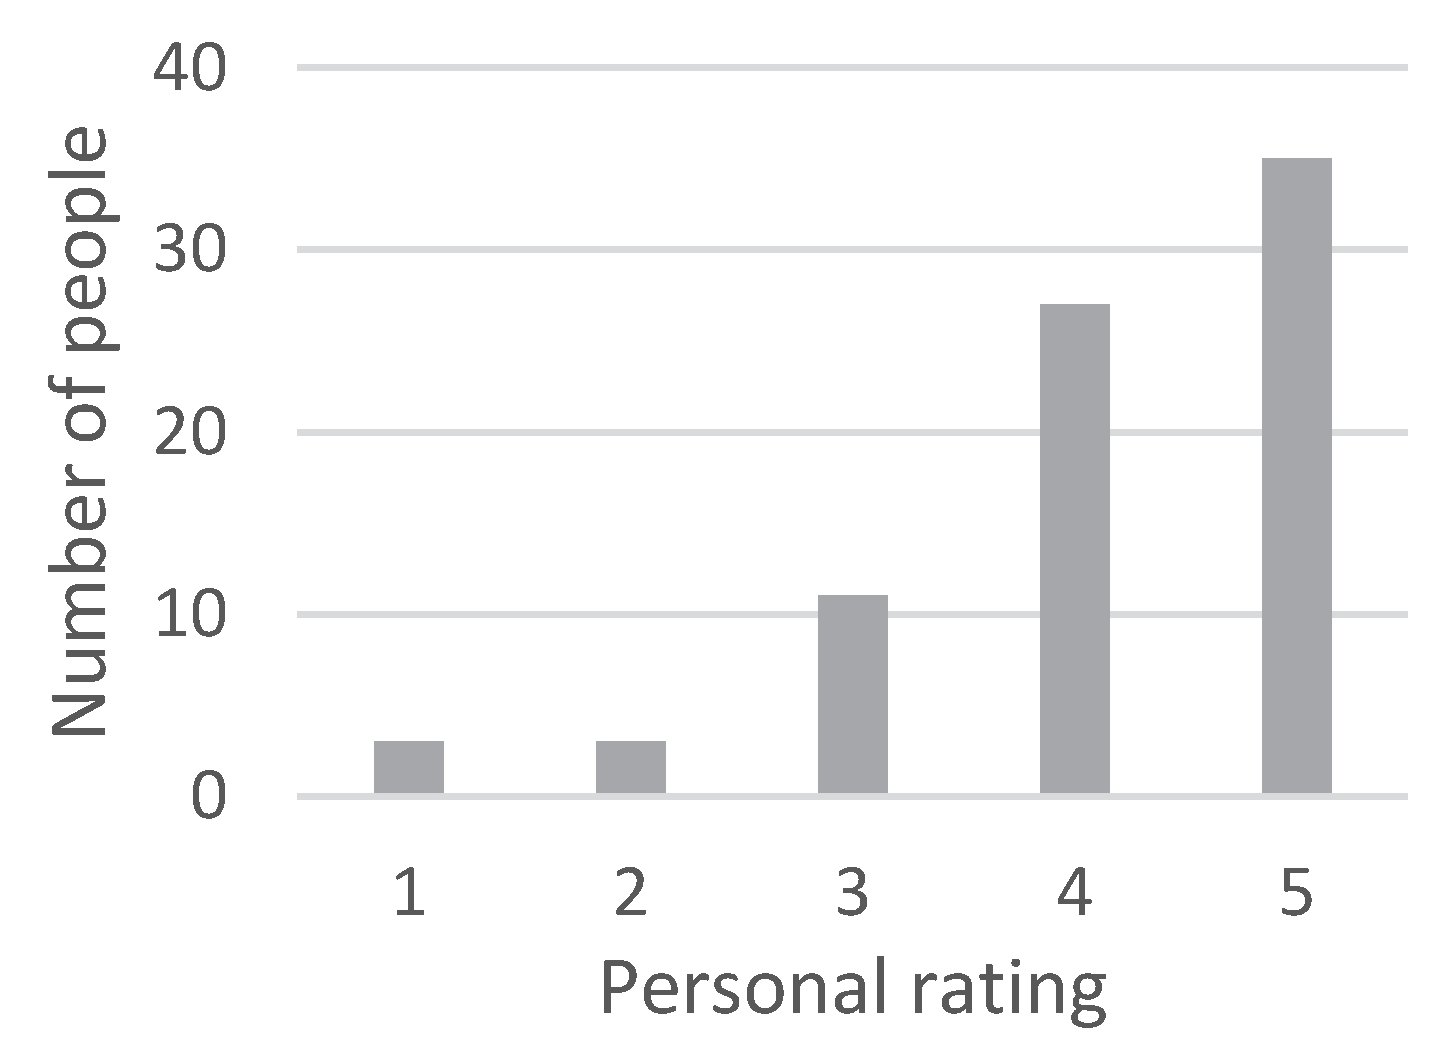
- (tested behavior): Where would you put the following waste objects? (4-grade)
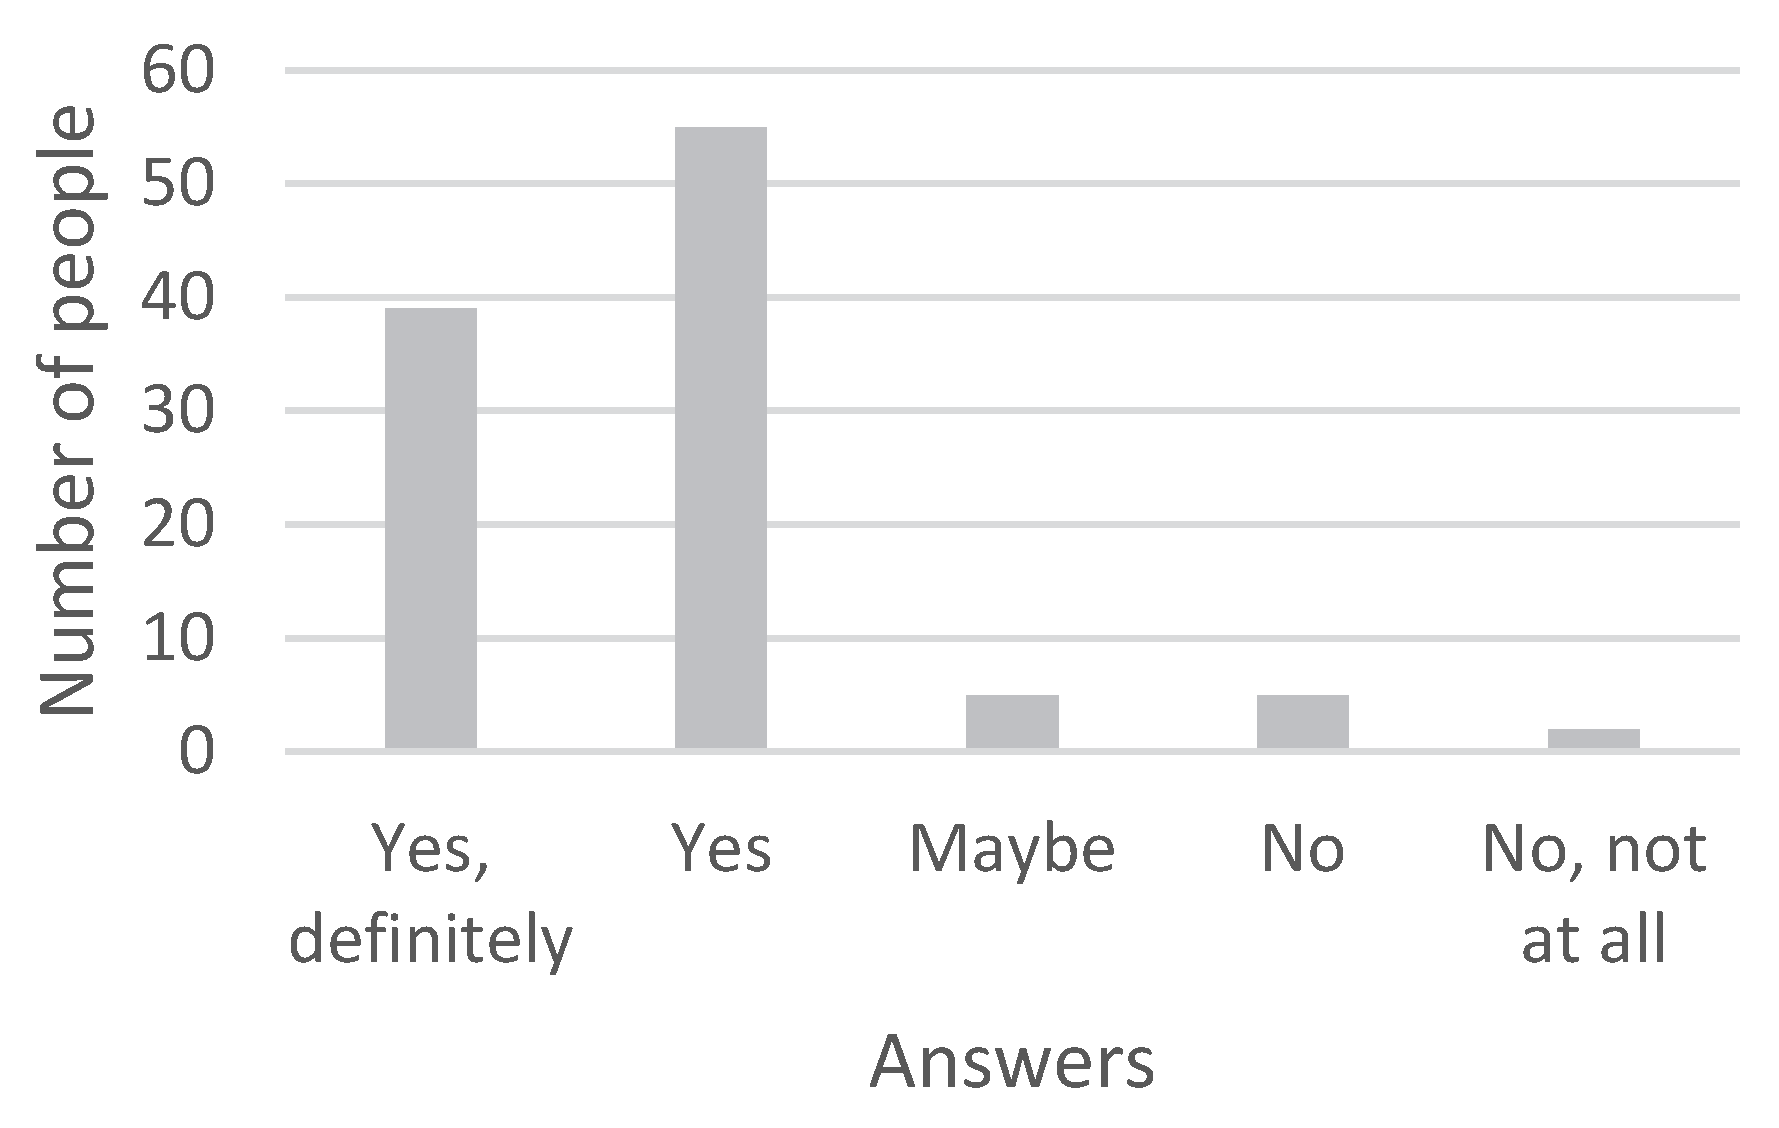
- Q.D
- (perception of information): Do you think it* was sufficient information to participate/sort? (5-grade)
- * Question D refers to the previous question (see Appendix A and Appendix B), which asks how the interviewees had learned about correct waste sorting in the local recycling scheme (see Appendix A and Appendix B). In case the answer did not contain the term ‘information’, an additional question was asked about whether the interviewee had received any information.
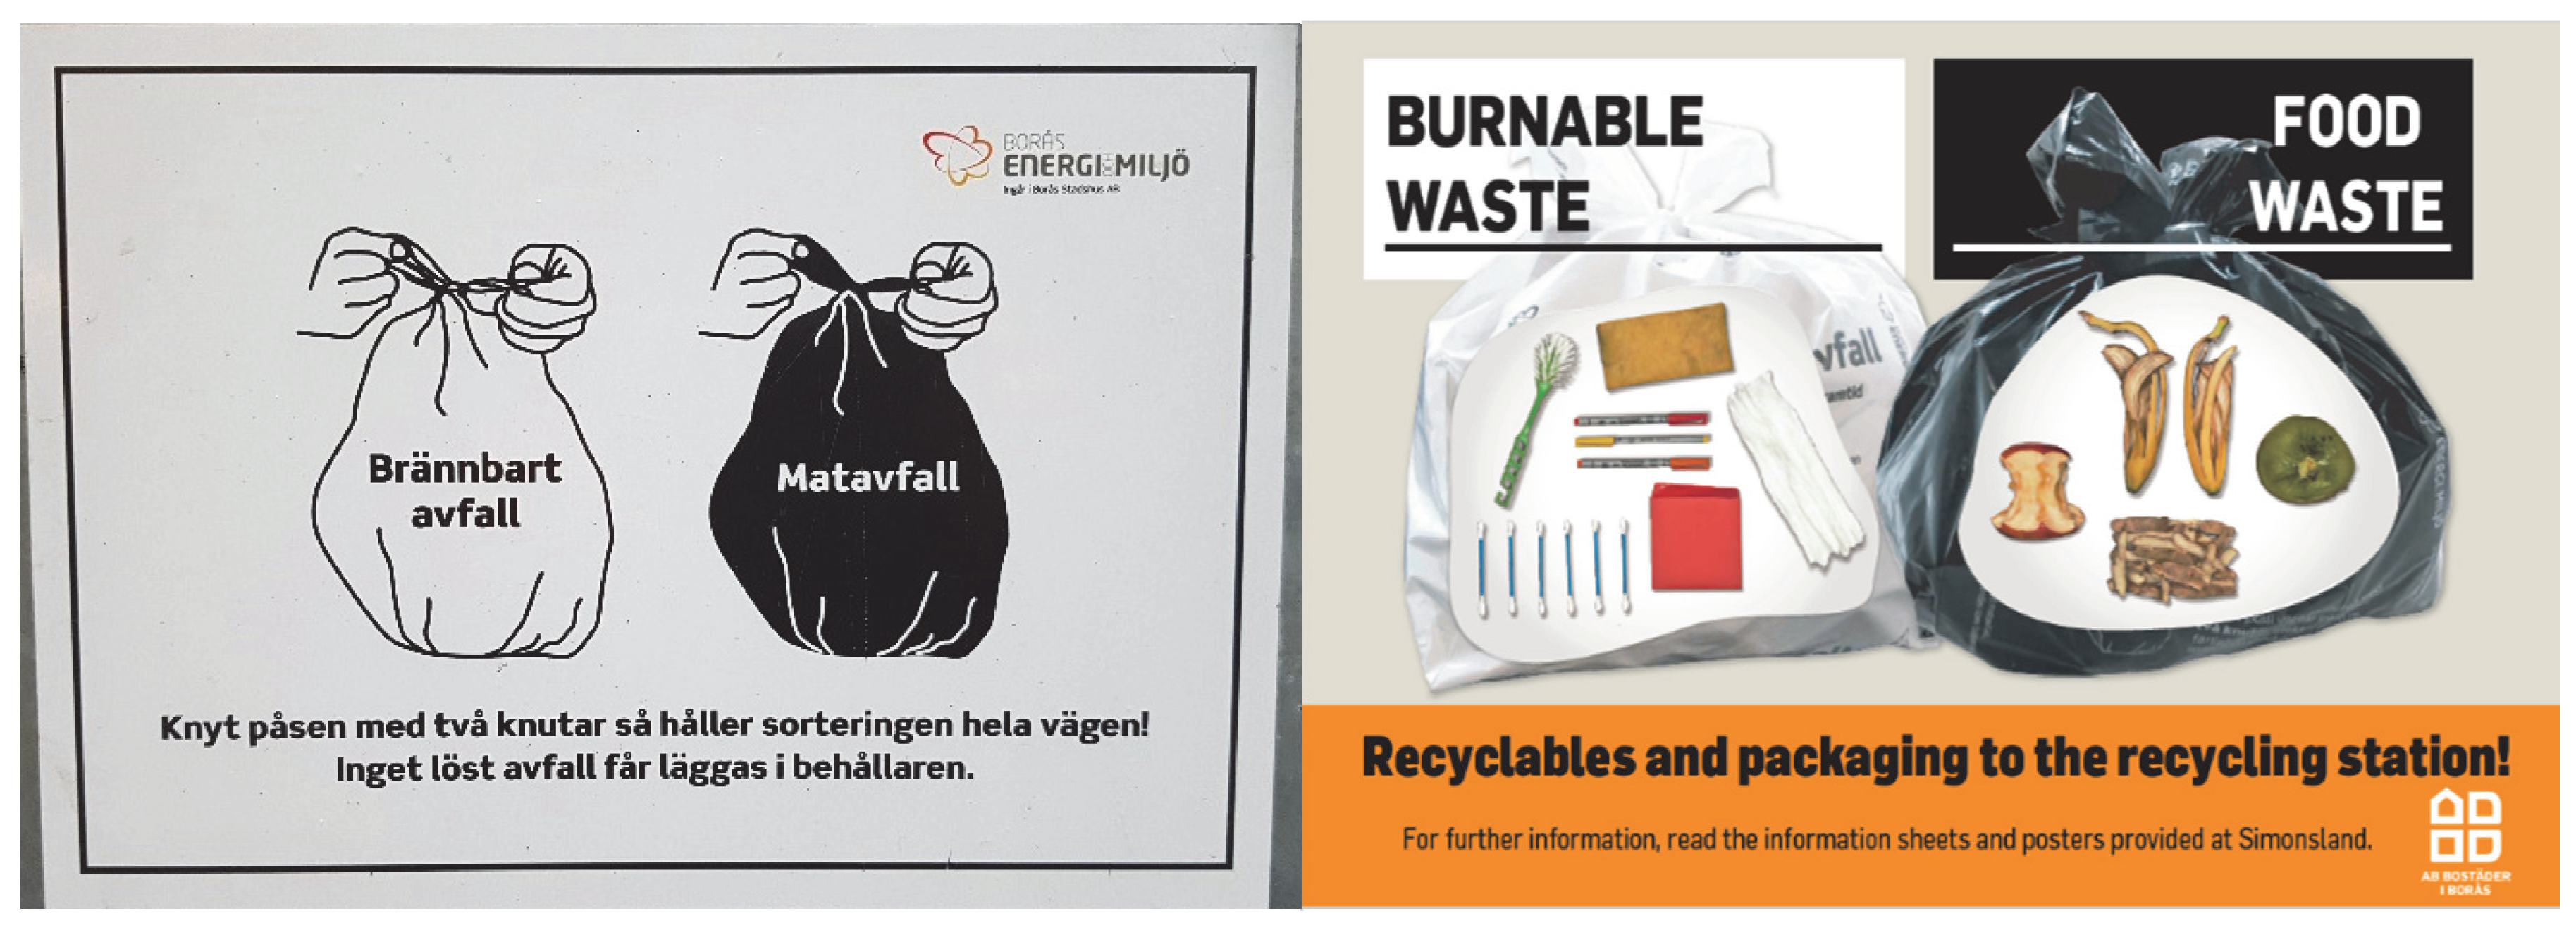
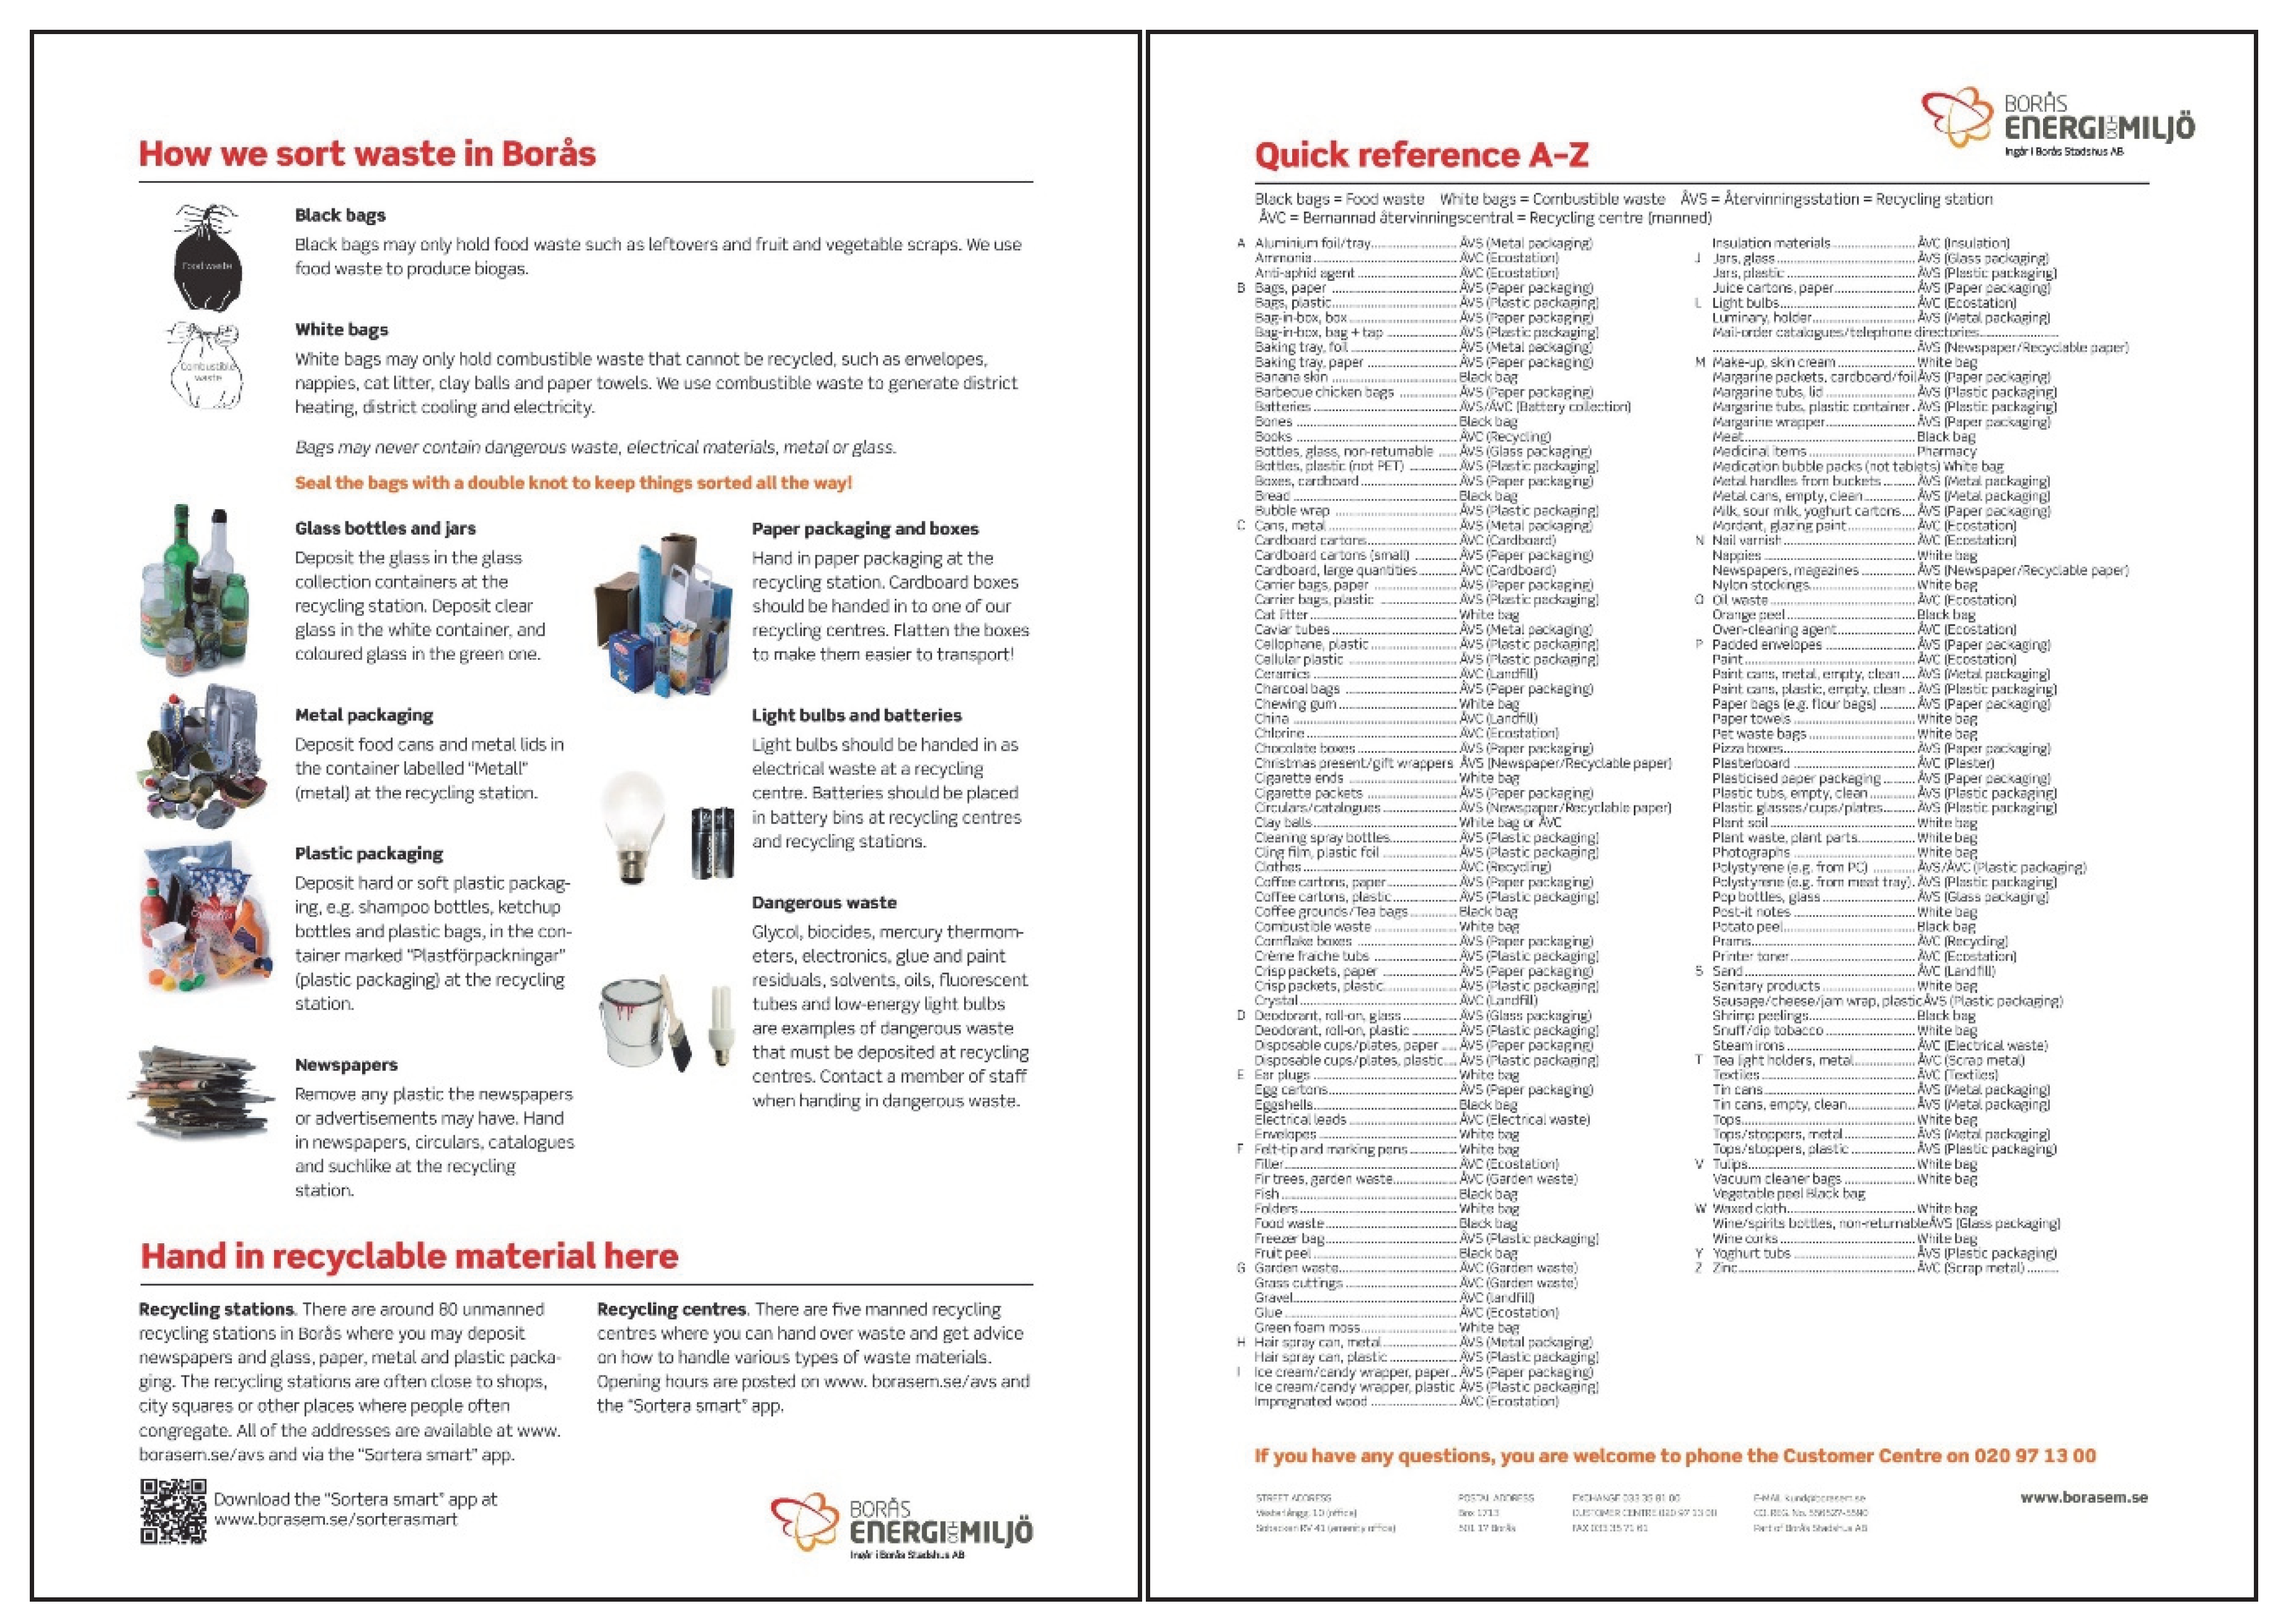
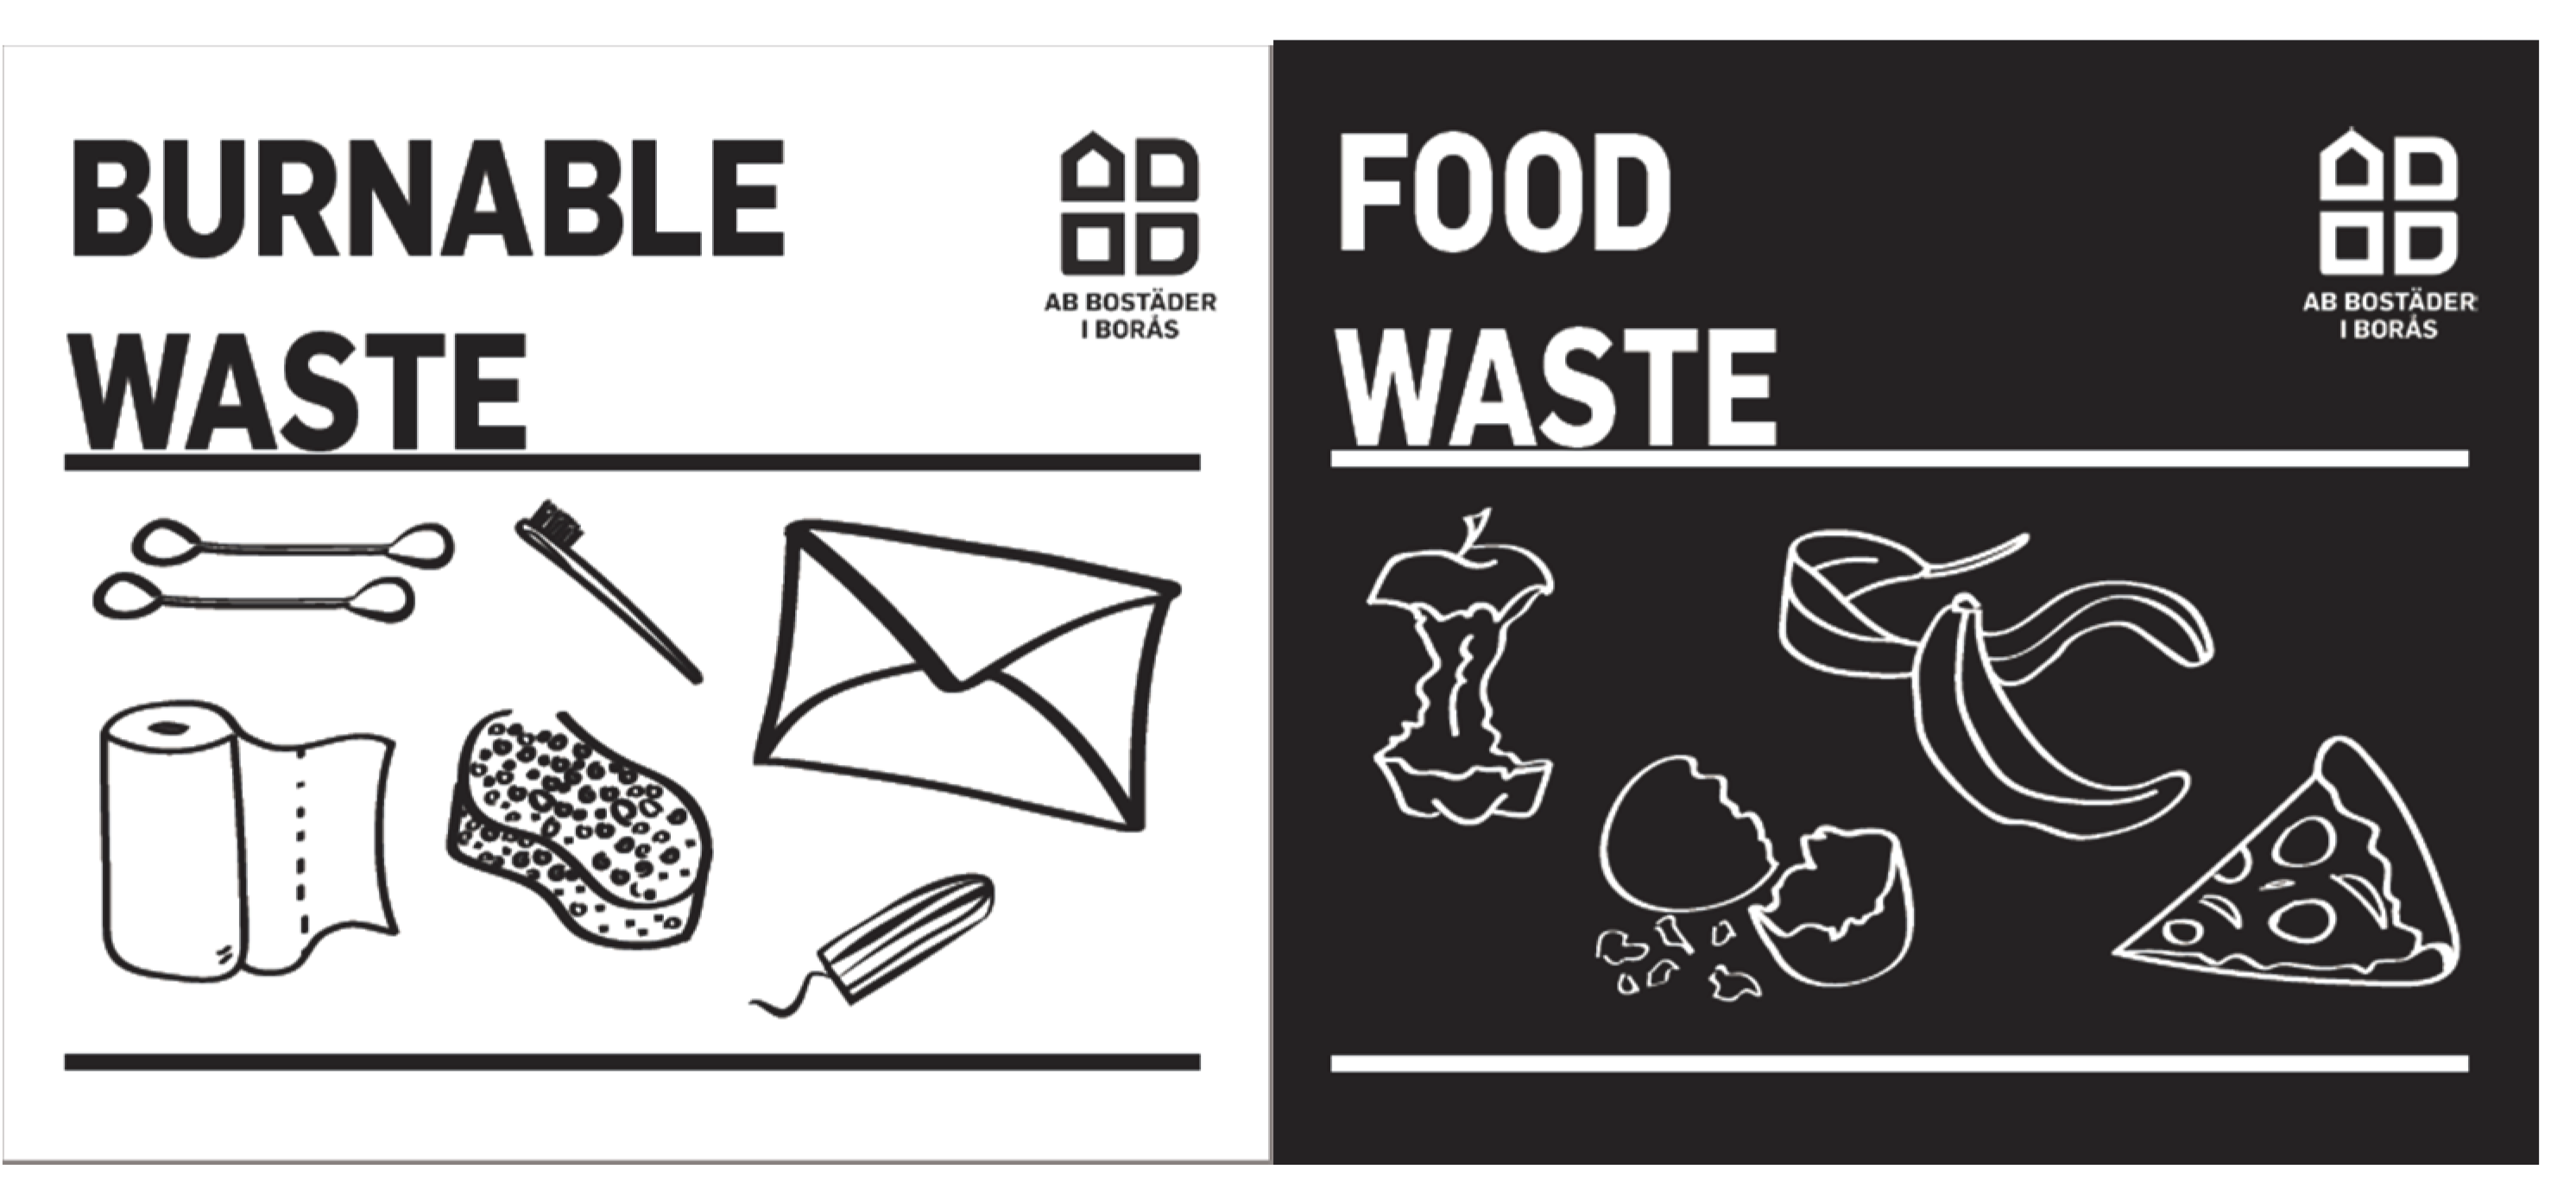
2.6. Intervention
3. Results
3.1. Pick Analyses
3.2. Surveys
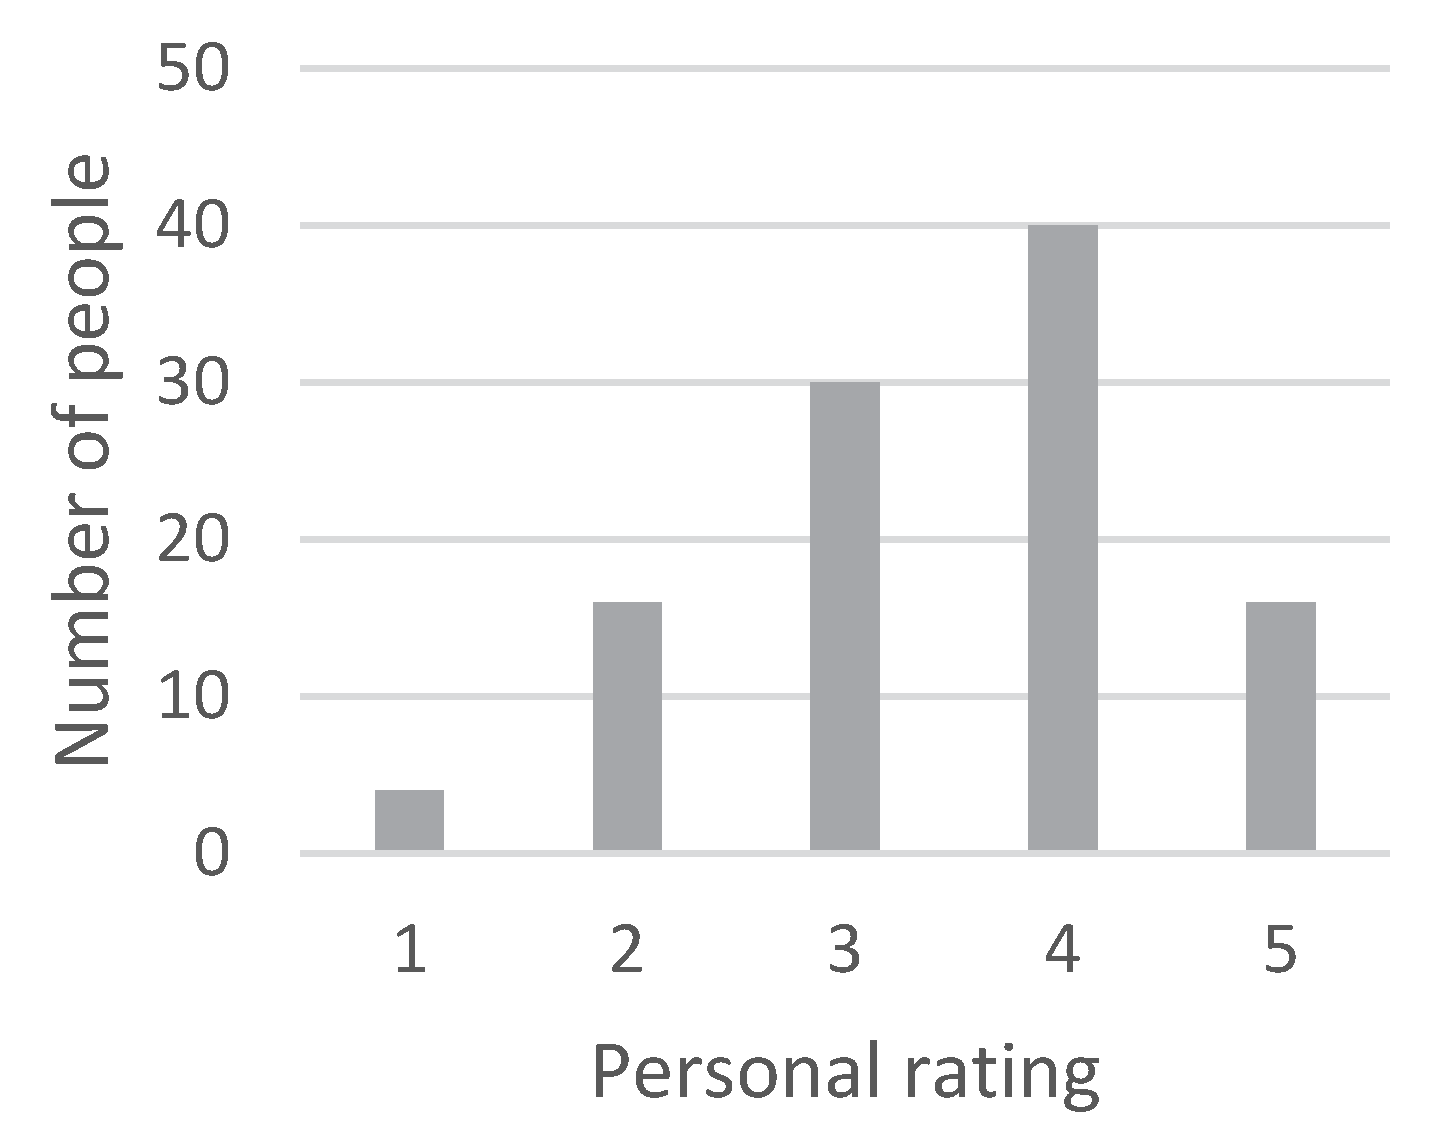
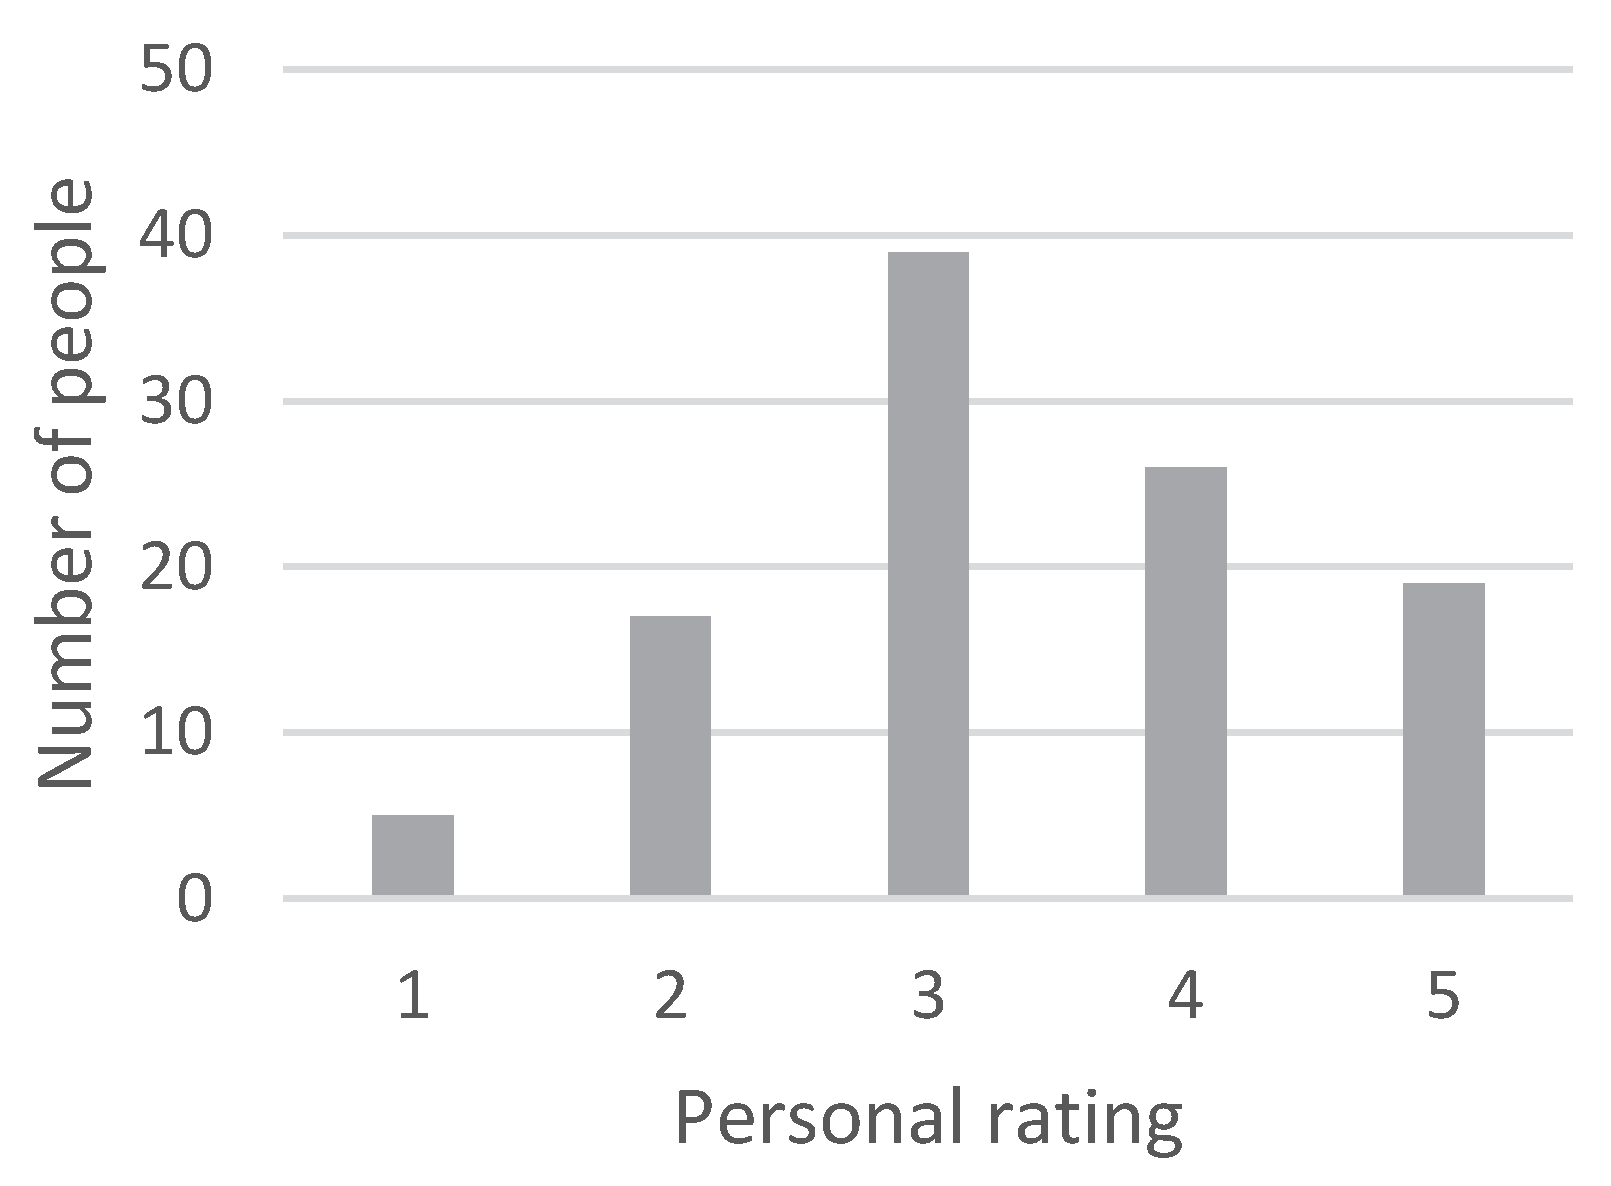
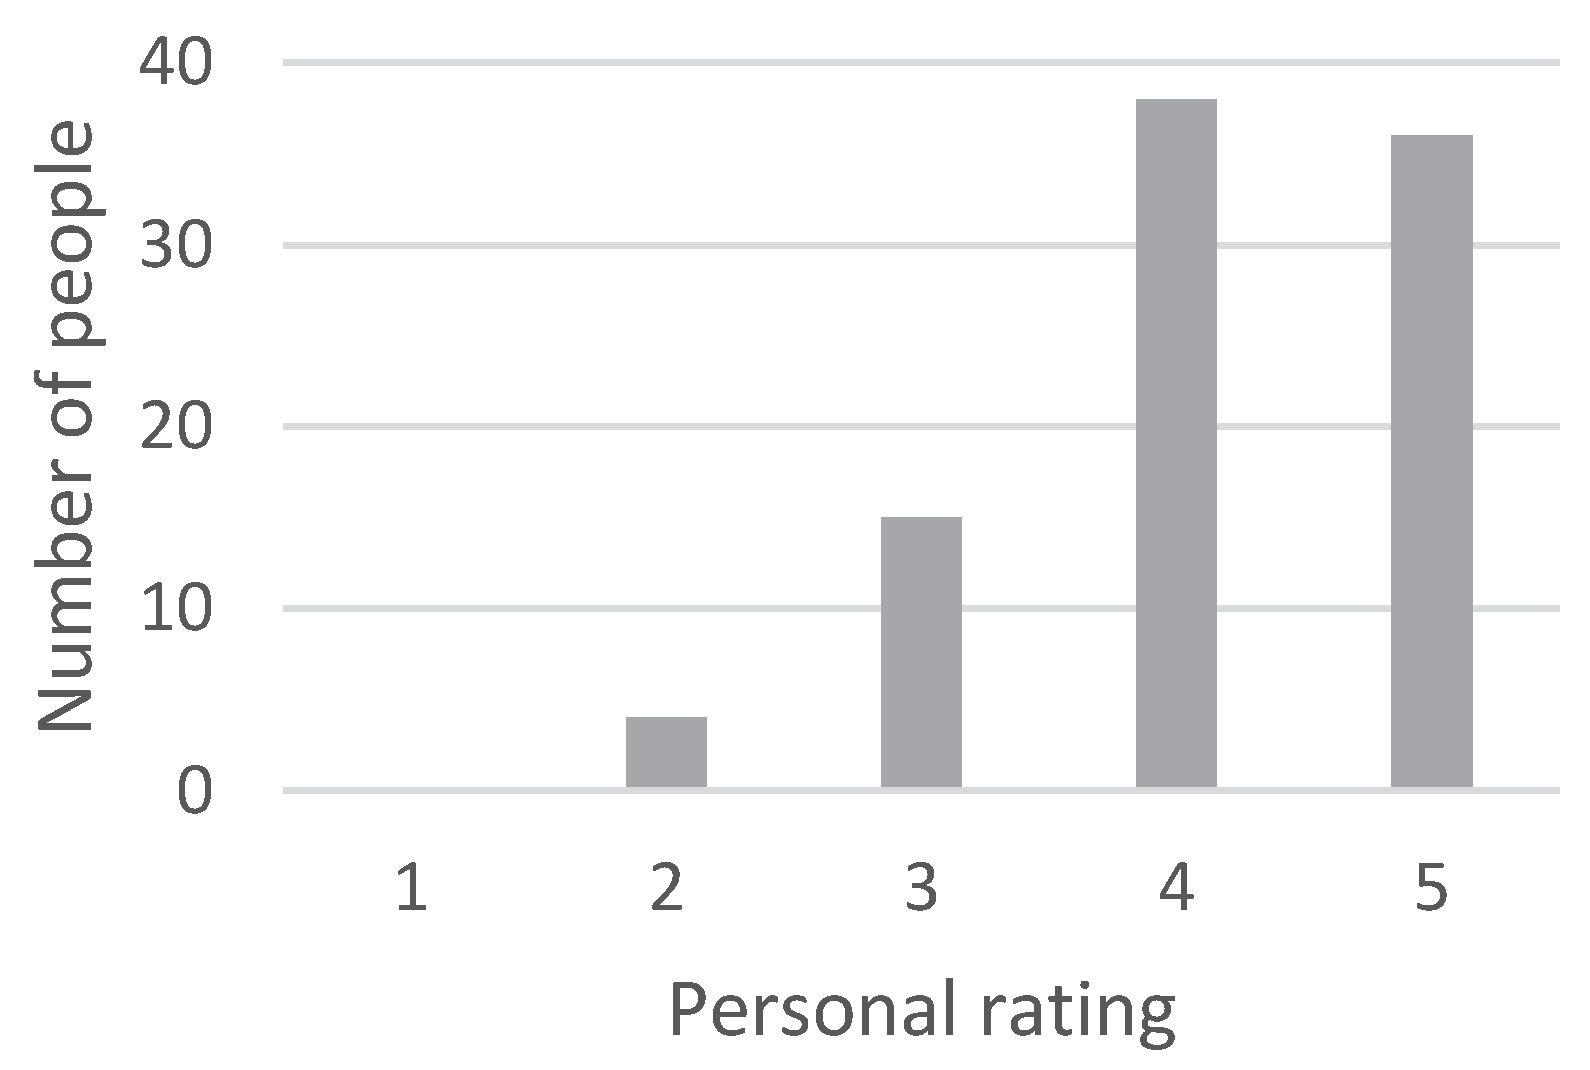
- Q.A
- (perceived behavior): How well do you sort your waste here in Borås? (5-grade)
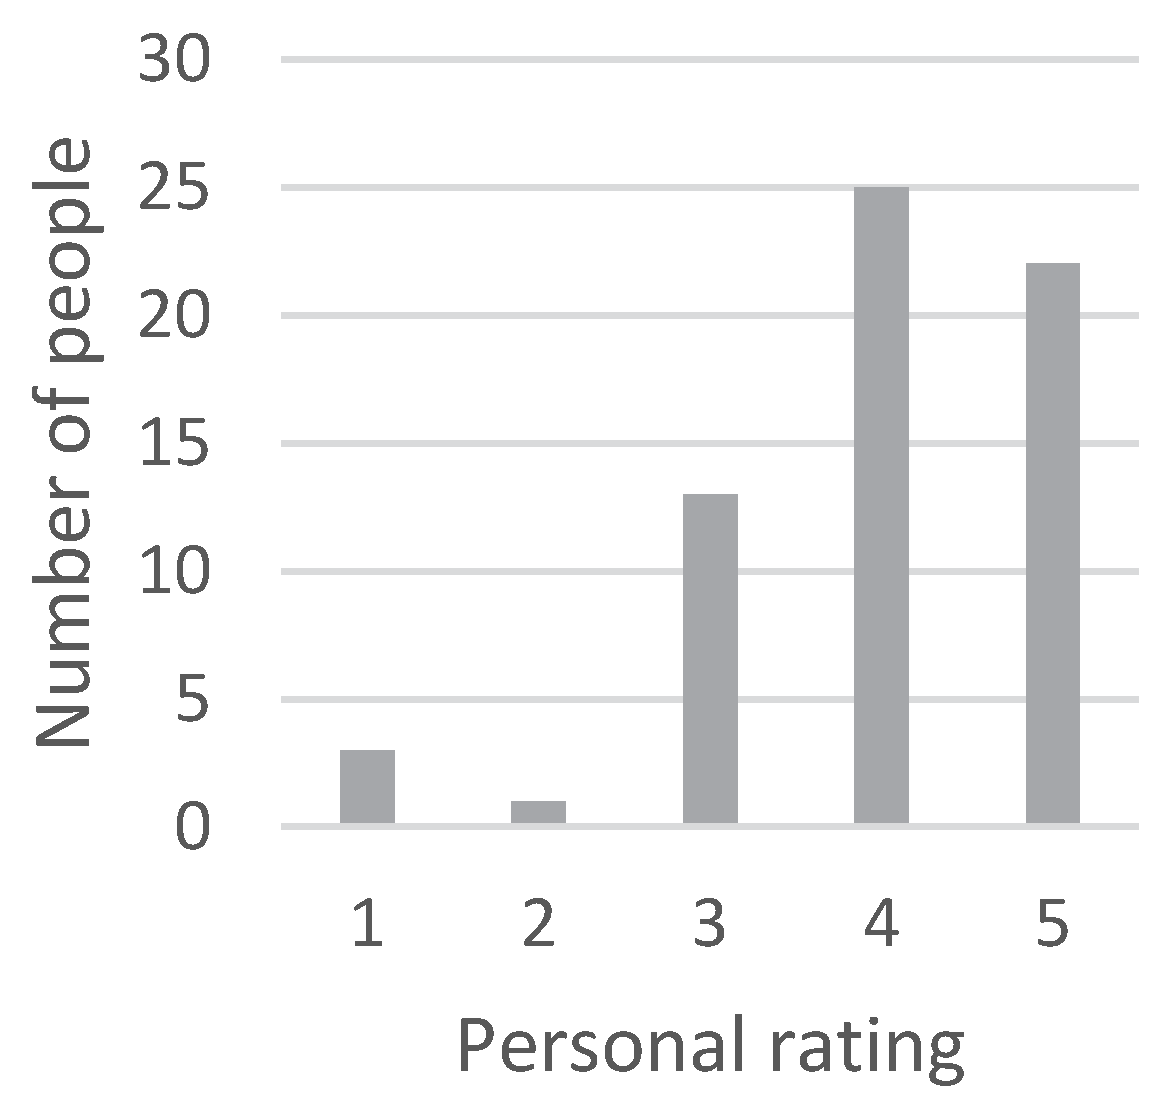
- Q.B
- (perceived knowledge): How well do you know how the sorting system in Borås works? (5-grade)
- Q.C
- (tested behavior): Where would you put the following waste objects? (4-grade)
- Q.D
- (perception of information): Do you think it was sufficient information to participate/sort? (5-grade)
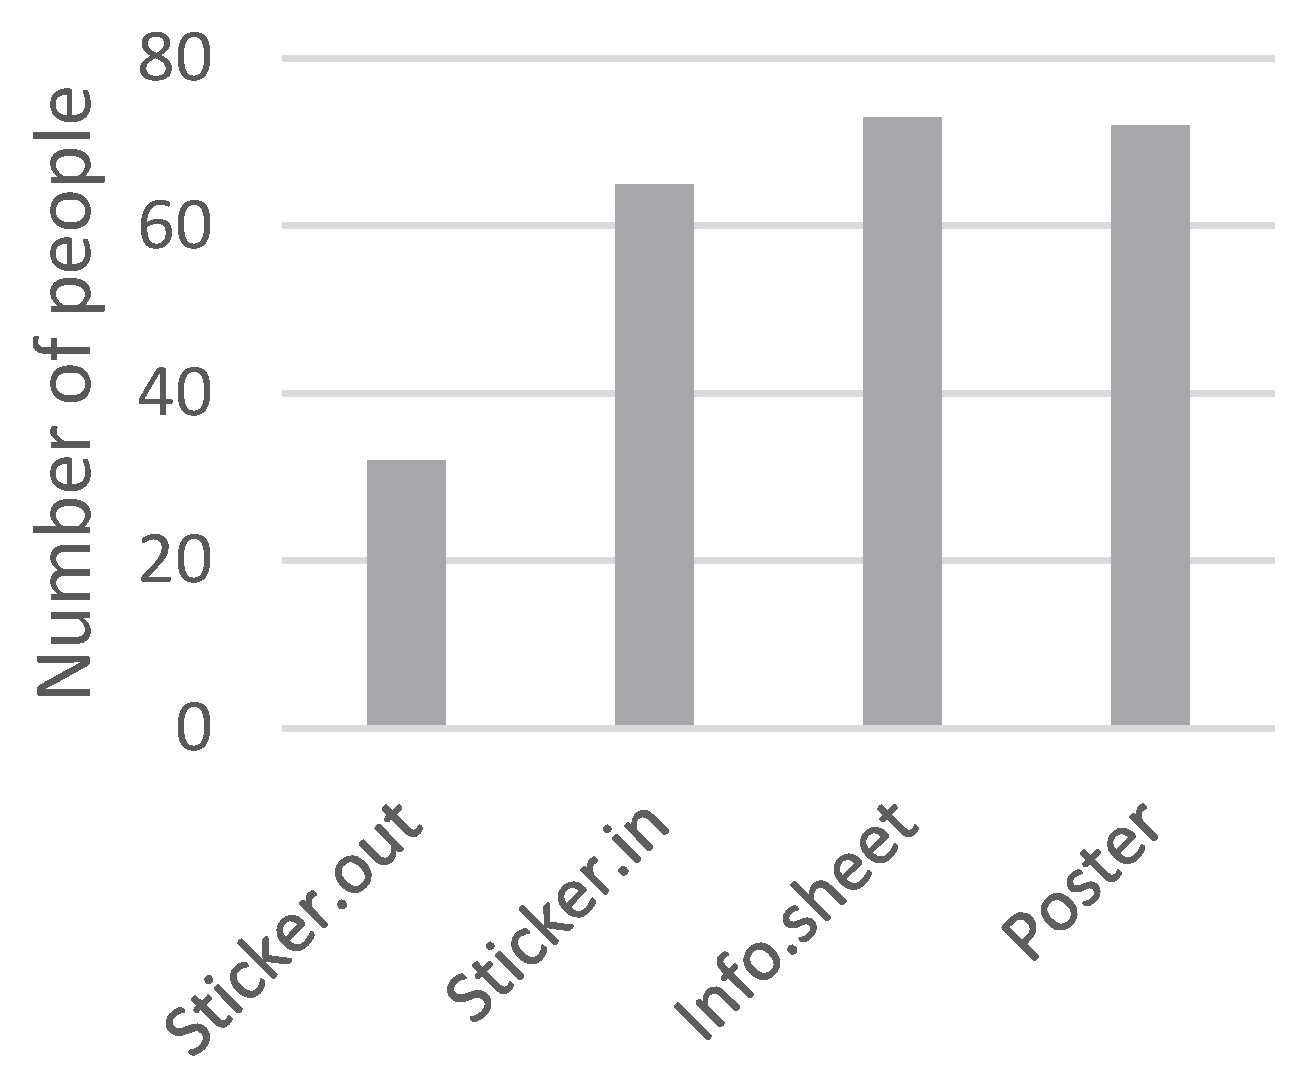
3.3. Evaluation of the Intervention
4. Discussion
4.1. Discussion of the Results
4.2. Discussion of the Theoretical Context
4.3. Limitations
5. Conclusions
Author Contributions
Funding
Acknowledgments
Conflicts of Interest
Appendix A


Appendix B


Appendix C


References
- Rousta, K. Household waste sorting at the source: A procedure for improvement. Available online: www.diva-portal.org/smash/get/diva2:1148055/FULLTEXT01.pdf (accessed on 1 January 2018).
- Rousta, K.; Ekström, K. Assessing incorrect household waste sorting in a medium-sized Swedish city. Sustainability 2013, 5, 4349–4361. [Google Scholar] [CrossRef] [Green Version]
- Swedish Waste Management 2018. Available online: www.avfallsverige.se/fileadmin/user_upload/Publikationer/Avfallshantering_2018_EN.pdf (accessed on 10 March 2020).
- Ölander, F.; Thøgersen, J. Understanding of consumer behaviour as a prerequisite for environmental protection. J. Consum. Policy 1995, 18, 345–385. [Google Scholar] [CrossRef]
- Tucker, P. Understanding recycling behaviour. Pap. Technol. 2001, 42, 51–54. [Google Scholar]
- Barr, S. Household Waste in Social Perspective: Values, Attitudes, Situation and Behavior; Routledge: London, UK, 2017. [Google Scholar]
- Rousta, K.; Ordoñez, I.; Bolton, K.; Dahlén, L. Support for designing waste sorting systems: A mini review. Waste Manag. Res. 2017, 35, 1099–1111. [Google Scholar] [CrossRef]
- Bernstad, A. Household food waste separation behavior and the importance of convenience. Waste Manag. 2014, 34, 1317–1323. [Google Scholar] [CrossRef]
- Schultz, P.W. Changing behavior with normative feedback interventions: A field experiment on curbside recycling. Basic Appl. Soc. Psychol. 1999, 21, 25–36. [Google Scholar] [CrossRef]
- Porter, B.E.; Leeming, F.C.; Dwyer, W.O. Solid waste recovery: A review of behavioral programs to increase recycling. Environ. Behav. 1995, 27, 122–152. [Google Scholar] [CrossRef]
- Thøgersen, J. A model of recycling behaviour, with evidence from Danish source separation programmes. Int. J. Res. Mark. 1994, 11, 145–163. [Google Scholar] [CrossRef]
- Varotto, A.; Spagnolli, A. Psychological strategies to promote household recycling. A systematic review with meta-analysis of validated field interventions. J. Environ. Psychol. 2017, 51, 168–188. [Google Scholar] [CrossRef]
- Huang, Y.; Tamas, P.; Harder, M. Information with a smile–Does it increase recycling? J. Clean. Prod. 2018, 178, 947–953. [Google Scholar] [CrossRef]
- Salhofer, S.; Isaac, N.A. Importance of public relations in recycling strategies: Principles and case studies. Environ. Manag. 2002, 30, 68–76. [Google Scholar] [CrossRef] [PubMed]
- Coggins, C. Waste prevention—An issue of shared responsibility for UK producers and consumers: Policy options and measurement. Resour. Conserv. Recycl. 2001, 32, 181–190. [Google Scholar] [CrossRef]
- Rousta, K.; Bolton, K.; Dahlén, L. A procedure to transform recycling behavior for source separation of household waste. Recycling 2016, 1, 147. [Google Scholar] [CrossRef] [Green Version]
- Hage, O.; Sandberg, K.; Söderholm, P.; Berglund, C. The regional heterogeneity of household recycling: A spatial-econometric analysis of Swedish plastic packing waste. Lett. Spat. Resour. Sci. 2018, 11, 245–267. [Google Scholar] [CrossRef] [Green Version]
- Borås. Snabba siffror och fakta. Available online: https://www.boras.se/kommunochpolitik/omboras/borasisiffror/snabbasiffrorochfakta (accessed on 6 December 2019).
- Dahlén, L.; Lagerkvist, A. Methods for household waste composition studies. Waste Manag. 2008, 28, 1100–1112. [Google Scholar] [CrossRef]
- Tucker, P.; Speirs, D. Count me as doing my bit: An appraisal of the accuracy of waste attitude/behaviour surveys. CIWM Sci. Tech. Rev 2003, 4, 2003. [Google Scholar]
- Manual for Pick Analysis of Household Food and Residual Waste. Available online: https://www.avfallsverige.se/kunskapsbanken/rapporter/rapportera/article/manual-for-plockanalys-av-hushallens-mat-och-restavfall/ (accessed on 1 January 2017).
- Rousta, K.; Bolton, K.; Lundin, M.; Dahlén, L. Quantitative assessment of distance to collection point and improved sorting information on source separation of household waste. Waste Manag. 2015, 40, 22–30. [Google Scholar] [CrossRef]
- Kelley, K.; Clark, B.; Brown, V.; Sitzia, J. Good practice in the conduct and reporting of survey research. Int. J. Qual. Health Care 2003, 15, 261–266. [Google Scholar] [CrossRef] [Green Version]
- Sitzia, J.; Wood, N. Response rate in patient satisfaction research: An analysis of 210 published studies. Int. J. Qual. Health Care 1998, 10, 311–317. [Google Scholar] [CrossRef] [Green Version]
- Zhang, X.; Kuchinke, L.; Woud, M.L.; Velten, J.; Margraf, J. Survey method matters: Online/offline questionnaires and face-to-face or telephone interviews differ. Comput. Hum. Behav. 2017, 71, 172–180. [Google Scholar] [CrossRef]
- Martin, M.; Williams, I.D.; Clark, M. Social, cultural and structural influences on household waste recycling: A case study. Resour. Conserv. Recycl. 2006, 48, 357–395. [Google Scholar] [CrossRef]
- Hellwig, C.; Häggblom-Kronlöf, G.; Bolton, K.; Rousta, K. Household Waste Sorting and Engagement in Everyday Life Occupations after Migration—A Scoping Review. Sustainability 2019, 11, 4701. [Google Scholar] [CrossRef] [Green Version]
- Miafodzyeva, S.; Brandt, N.; Andersson, M. Recycling behaviour of householders living in multicultural urban area: A case study of Järva, Stockholm, Sweden. Waste Manag. Res. 2013, 31, 447–457. [Google Scholar] [CrossRef] [PubMed]
- Hage, O. The Swedish producer responsibility for paper packaging: An effective waste management policy? Resour. Conserv. Recycl. 2007, 51, 314–344. [Google Scholar] [CrossRef]
- Ghani, W.A.W.A.K.; Rusli, I.F.; Biak, D.R.A.; Idris, A. An application of the theory of planned behaviour to study the influencing factors of participation in source separation of food waste. Waste Manag. 2013, 33, 1276–1281. [Google Scholar] [CrossRef] [PubMed]
- Nomura, H.; Takahashi, Y.; Yabe, M. Psychological driving forces behind households’ behaviors toward municipal organic waste separation at source in Vietnam: A structural equation modeling approach. J. Mater. Cycles Waste Manag. 2017, 19, 1052–1060. [Google Scholar]
- Nguyen, T.T.P.; Zhu, D.; Le, N.P. Factors influencing waste separation intention of residential households in a developing country: Evidence from Hanoi, Vietnam. Habitat Int. 2015, 48, 169–176. [Google Scholar] [CrossRef]
- Tang, Z.; Chen, X.; Luo, J. Determining socio-psychological drivers for rural household recycling behavior in developing countries: A case study from Wugan, Hunan, China. Environ. Behav. 2011, 43, 848–877. [Google Scholar] [CrossRef]
- Yuan, Y.; Nomura, H.; Takahashi, Y.; Yabe, M. Model of Chinese household kitchen waste separation behavior: A case study in Beijing city. Sustainability 2016, 8, 1083. [Google Scholar] [CrossRef] [Green Version]
- Chu, P.Y.; Chiu, J.F. Factors influencing household waste recycling behavior: Test of an integrated model 1. J. Appl. Soc. Psychol. 2003, 33, 604–626. [Google Scholar] [CrossRef]
- Jekria, N.; Daud, S. Environmental concern and recycling behaviour. Procedia Econ. Financ. 2016, 35, 667–673. [Google Scholar] [CrossRef] [Green Version]
- Chen, M.-F.; Tung, P.-J. The moderating effect of perceived lack of facilities on consumers’ recycling intentions. Environ. Behav. 2010, 42, 824–844. [Google Scholar] [CrossRef]
- Mosler, H.-J.; Tamas, A.; Tobias, R.; Rodríguez, T.C.; Miranda, O.G. Deriving interventions on the basis of factors influencing behavioral intentions for waste recycling, composting, and reuse in Cuba. Environ. Behav. 2008, 40, 522–544. [Google Scholar] [CrossRef]
- Pakpour, A.H.; Zeidi, I.M.; Emamjomeh, M.M.; Asefzadeh, S.; Pearson, H. Household waste behaviours among a community sample in Iran: An application of the theory of planned behaviour. Waste Manag. 2014, 34, 980–986. [Google Scholar] [CrossRef] [PubMed]
- Tamas, A.; Mosler, H.-J.; Tobias, R.; Rodríguez, T.C.; Miranda, O.G. Factors determining the intentions to reuse, separate and compost household waste in the city of Santiago De Cuba. Waste Soc. Context 2005, 2005, 736–744. [Google Scholar]
- Corral-Verdugo, V.c. Dual ‘realities’ of conservation behavior: Self-reports vs. observations of re-use and recycling behavior. J. Environ. Psychol. 1997, 17, 135–145. [Google Scholar] [CrossRef]
- Singhirunnusorn, W.; Donlakorn, K.; Kaewhanin, W. Contextual factors influencing household recycling behaviours: A case of waste bank project in Mahasarakham municipality. Procedia-Soc. Behav. Sci. 2012, 36, 688–697. [Google Scholar] [CrossRef] [Green Version]
- Strydom, W. Highlights of a recycling behaviour study in South Africa’s large urban areas. In Proceedings of the 4th CSIR Biennial Conference: Real problems relevant solutions, Pretoria, South Africa, 9–10 October 2012. [Google Scholar]
- Barr, S. Household Waste in Social Perspective; Values, Attitudes, Situation and Behaviour; Ashgate: Burlington, UK, 2002. [Google Scholar]
- Strydom, W. Barriers to household waste recycling: Empirical evidence from South Africa. Recycling 2018, 3, 41. [Google Scholar] [CrossRef] [Green Version]
- Omran, A.; Schiopu, A.-M. Reasons for non-participation in recycling of solid waste in northern Malaysia: A case study. Environ. Eng. Manag. J. (EEMJ) 2015, 14, 233–243. [Google Scholar] [CrossRef]
- Tadesse, T.; Ruijs, A.; Hagos, F. Household waste disposal in Mekelle city, Northern Ethiopia. Waste Manag. 2008, 28, 2003–2012. [Google Scholar] [CrossRef]
- De Young, R. Recycling as appropriate behavior: A review of survey data from selected recycling education programs in Michigan. Resour. Conserv. Recycl. 1990, 3, 253–266. [Google Scholar] [CrossRef] [Green Version]
- Vicente, P.; Reis, E. Factors influencing households’ participation in recycling. Waste Manag. Res. 2008, 26, 140–146. [Google Scholar] [CrossRef] [PubMed]
- Chen, F.; Chen, H.; Yang, J.; Long, R.; Li, W. Impact of regulatory focus on express packaging waste recycling behavior: Moderating role of psychological empowerment perception. Environ. Sci. Pollut. Res. 2019, 26, 8862–8874. [Google Scholar] [CrossRef] [PubMed]


| First Analysis | Second Analysis | |
|---|---|---|
| Mass analyzed | 211.5 kg | 208.3 kg |
| Total estimated mass | 282.0 kg | 231.4 kg |
| Mis-sorted recyclables | 38.6% | 36.3% |
| Plastic Packaging | Paper Packaging | Newsprint | Metal Packaging | Glass Packaging | ||
|---|---|---|---|---|---|---|
| Study area | First analysis (kg/p/w) | 0.189 | 0.164 | 0.012 | 0.038 | 0.075 |
| Second analysis (kg/p/w) | 0.166 | 0.141 | 0.027 | 0.023 | 0.081 | |
| Change (%) | −12 | −14 | 115 | −40 | 7 | |
| Reference area | First analysis (kg/p/w) | 0.205 | 0.200 | 0.026 | 0.025 | 0.037 |
| Second analysis (kg/p/w) | 0.272 | 0.297 | 0.136 | 0.035 | 0.182 | |
| Change (%) | 33 | 49 | 430 | 40 | 390 | |
| Mean value | M.W.t | ||
|---|---|---|---|
| Survey 1 | Survey 2 | ||
| Perceived Behavior (Q.A) | 3.45 | 3.56 | 0.489 |
| Perceived Knowledge (Q.B) | 3.35 | 4.14 | 0.000 *** |
| Tested Behavior (Q.C) | 2.58 | 2.92 | 0.026 * |
| Perception of Information (Q.D) | 3.39 | 3.97 | 0.002 ** |
© 2020 by the authors. Licensee MDPI, Basel, Switzerland. This article is an open access article distributed under the terms and conditions of the Creative Commons Attribution (CC BY) license (http://creativecommons.org/licenses/by/4.0/).
Share and Cite
Mehner, E.; Naidoo, A.; Hellwig, C.; Bolton, K.; Rousta, K. The Influence of User-Adapted, Instructive Information on Participation in a Recycling Scheme: A Case Study in a Medium-Sized Swedish City. Recycling 2020, 5, 7. https://0-doi-org.brum.beds.ac.uk/10.3390/recycling5020007
Mehner E, Naidoo A, Hellwig C, Bolton K, Rousta K. The Influence of User-Adapted, Instructive Information on Participation in a Recycling Scheme: A Case Study in a Medium-Sized Swedish City. Recycling. 2020; 5(2):7. https://0-doi-org.brum.beds.ac.uk/10.3390/recycling5020007
Chicago/Turabian StyleMehner, Eric, Adeel Naidoo, Coralie Hellwig, Kim Bolton, and Kamran Rousta. 2020. "The Influence of User-Adapted, Instructive Information on Participation in a Recycling Scheme: A Case Study in a Medium-Sized Swedish City" Recycling 5, no. 2: 7. https://0-doi-org.brum.beds.ac.uk/10.3390/recycling5020007