Article

Characterizing the Urban Mine—Simulation-Based Optimization of Sampling Approaches for Built-in Batteries in WEEE

by
Paul Martin Mählitz
1,*,
Nathalie Korf
1,
Kristine Sperlich
1,2,
Olivier Münch
1,
Matthias Rösslein
3 and
Vera Susanne Rotter
1,*
1
Chair of Circular Economy and Recycling Technology, Technische Universität Berlin, Straße des 17. Juni 135, 10623 Berlin, Germany
2
German Environment Agency, Wörlitzer Platz 1, 06844 Dessau-Roßlau, Germany
3
Empa, Swiss Federal Laboratories for Materials Science and Technology, Particles-Biology Interactions Laboratory, CH-9014 St. Gallen, Switzerland
*
Authors to whom correspondence should be addressed.
Submission received: 13 August 2020 / Revised: 1 September 2020 / Accepted: 2 September 2020 / Published: 4 September 2020

Abstract

:
Comprehensive knowledge of built-in batteries in waste electrical and electronic equipment (WEEE) is required for sound and save WEEE management. However, representative sampling is challenging due to the constantly changing composition of WEEE flows and battery systems. Necessary knowledge, such as methodologically uniform procedures and recommendations for the determination of minimum sample sizes (MSS) for representative results, is missing. The direct consequences are increased sampling efforts, lack of quality-assured data, gaps in the monitoring of battery losses in complementary flows, and impeded quality control of depollution during WEEE treatment. In this study, we provide detailed data sets on built-in batteries in WEEE and propose a non-parametric approach (NPA) to determine MSS. For the pilot dataset, more than 23 Mg WEEE (6500 devices) were sampled, examined for built-in batteries, and classified according to product-specific keys (UNUkeys and BATTkeys). The results show that 21% of the devices had battery compartments, distributed over almost all UNUkeys considered and that only about every third battery was removed prior to treatment. Moreover, the characterization of battery masses (BM) and battery mass shares (BMS) using descriptive statistical analysis showed that neither product- nor battery-specific characteristics are given and that the assumption of (log-)normally distributed data is not generally applicable. Consequently, parametric approaches (PA) to determine the MSS for representative sampling are prone to be biased. The presented NPA for MSS using data-driven simulation (bootstrapping) shows its applicability despite small sample sizes and inconclusive data distribution. If consistently applied, the method presented can be used to optimize future sampling and thus reduce sampling costs and efforts while increasing data quality.

Graphical Abstract

1. Introduction

Electrical and electronic equipment (EEE) is one of the key product value chains of the New Circular Economy Action Plan [1]. Besides their design and durability, there is a focus upon sound collection and treatment. One of the challenges of a sound collection and treatment of waste electrical and electronic equipment (WEEE) are batteries still remaining in the WEEE when being discarded. These built-in batteries in WEEE are of increasing interest in recycling as they exist in a large variety with rapidly changing contents of economically, environmentally, and health-related relevant substances. Furthermore, safety aspects due to the high energy content of Li-batteries are gaining importance. To avoid the release of hazardous substances such as Pb and Cd (health, environment) or their entry into fractions for recycling (contamination decreases the quality of secondary raw materials) and to reduce the risk of fire from damaged Li-batteries, sound collection and treatment of WEEE containing batteries is crucial. Both digitalization and the intensified mobile use of EEE sharply boost the number of portable batteries placed on the market (POM) in recent years [2]. In 2015, 15% of the single charge (primary) and 80% of the rechargeable (secondary) batteries were embedded in EEE when placed on the market [3].
At their end-of-life, these batteries must be directed to the dedicated collection, treatment, and recycling paths in order to produce secondary raw materials (SRM). However, the collection rate of portable batteries throughout European Union (EU) member states is low and stagnating between 25 and 45% [3] caused by, among others, hibernation in the ‘urban mine’ [2] and disposal via complementary waste streams such as residual waste [4,5,6,7,8,9,10,11,12,13]. Furthermore, batteries still contained in WEEE might not be separated prior to or during WEEE treatment [13,14,15,16,17,18,19,20] and will accordingly not be sent to an adequate battery treatment. In particular, built-in batteries can only be separated with great effort. Since the collection of built-in batteries within WEEE is permitted in some EU member states like Germany [21], the separation of batteries during processing is mandatory [22] to prevent resource loss, contamination of subsequent material streams, and to fulfill legal reporting and collection obligations [22,23]. Moreover, the specification for depollution [24] prepared by the European Committee for Electrotechnical Standardization (CENELEC) sets a target value of 1.8 kg batteries per Mg of small WEEE appliances to be separated.
Nonetheless, batteries often remain in WEEE products when discarded [14] due to the challenging identification of battery-powered devices in mixed WEEE flows and their impeded removability [14] as a result of varying size, shape, and assembly type. Consequently, the removal rate of batteries from WEEE is estimated to be 7% on average, ranging from 1 to 20% for the 19 EU countries investigated [3]. Thus, the knowledge of quantity and composition of WEEE batteries is fundamental to improve waste management concepts for the identification and separate collection of batteries, as well as to set up reasonable treatment requirements. One strategy to determine these characteristics of WEEE batteries involves methods for recycling-oriented characterization of waste flows, products, components, and materials [25,26,27,28,29].
The basis for the development of waste management concepts is a comprehensive urban mine knowledge database with harmonized and comparable data with a defined statistical validity (i.e., robustness [30]), which allows inferring information regarding the entire data population. To accomplish the generation of such data, representative sampling [31,32,33] is necessary. Regarding the latter, no legally binding methodologies exist for the sampling of solid waste, although the Waste Framework Directive (2008/98/EC, Article 28) does require the development of waste management plans. Several non-binding guidelines have been developed on the European and regional level. However, these guidelines focused on domestic residual waste and were not adapted for WEEE and built-in batteries.
In addition to the extraction of the sample, sampling comprises the determination of an adequate sampling unit and sample size to achieve representative results with reasonable (economic) effort [31,33]. In general, two approaches for the determination of minimum sample sizes (MSS) are practiced in waste sampling [34]: (1) a fixed percentage of the population or lot (empirical, non-statistics-based sampling) [35,36,37,38] or (2) statistical sampling [31,34,39,40]. However, determining the MSS through statistical procedures [33,40,41,42,43,44,45,46,47,48,49] is dependent on a priori knowledge and thus, due to lack of data, not readily transferable for built-in batteries in WEEE. For sampling of domestic residual waste, the recommended sampling unit is often defined as one collection container, e.g., 1.1 m3 containers [33]. However, WEEE and built-in batteries are more challenging due to their high (product) heterogeneity, locally different collection groups, inconsistent nomenclature, unharmonized classifications, as well as various influencing factors on the composition, such as short innovation cycles and varying product lifetime.
Therefore, the application of statistical approaches to determine MSS requires the provision of a priori knowledge in the form of harmonized raw data sets using uniform and consistent as well as spatially unified classifications for batteries and WEEE. Moreover, the statistical analysis of data sets regarding distribution patterns is a pre-requisite to apply parametric approaches assuming a normal distribution. Furthermore, recommendations are required for dealing with unknown or inconclusive distribution patterns caused by, e.g., data sets that are too small or inappropriate nomenclature.
This article aims to improve representative sampling of built-in batteries in WEEE. For this, we provide both detailed and harmonized pilot data sets on mass and mass shares of built-in batteries in WEEE and investigate an alternative approach to determine the MSS. The results will help to improve both (a) the recycling-oriented product characterization enabling to identify and separate battery-containing WEEE prior to subsequent treatment as well as (b) the availability of harmonized data sets for statistical analysis and simulations to derive recommendations on circular economy measures. For instance, the results can complement previous studies on modeling and assessing the share of batteries in WEEE and related resource losses in WEEE treatment [19]. Specifically, this study addresses the following recycling-oriented and methodological objectives on the sampling of built-in batteries in WEEE:
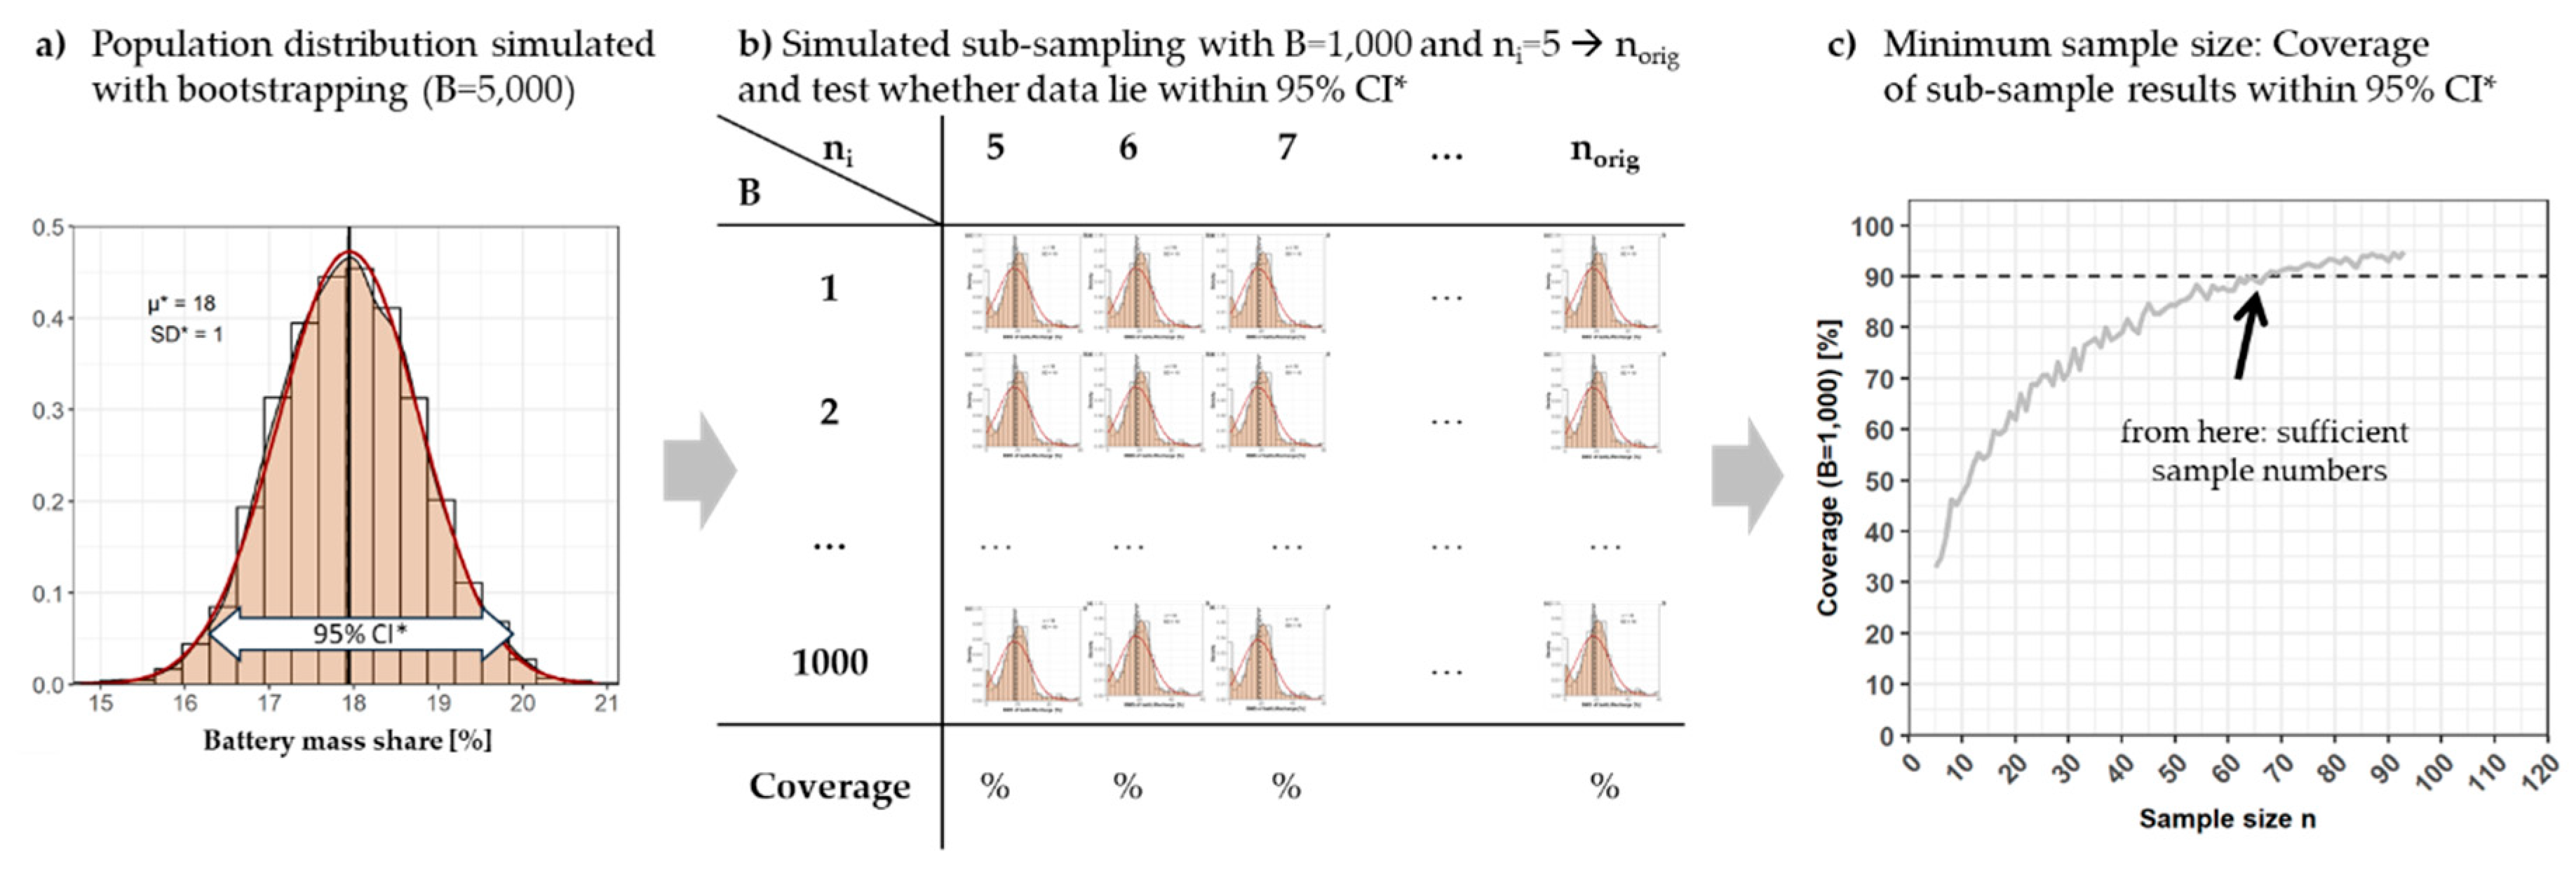
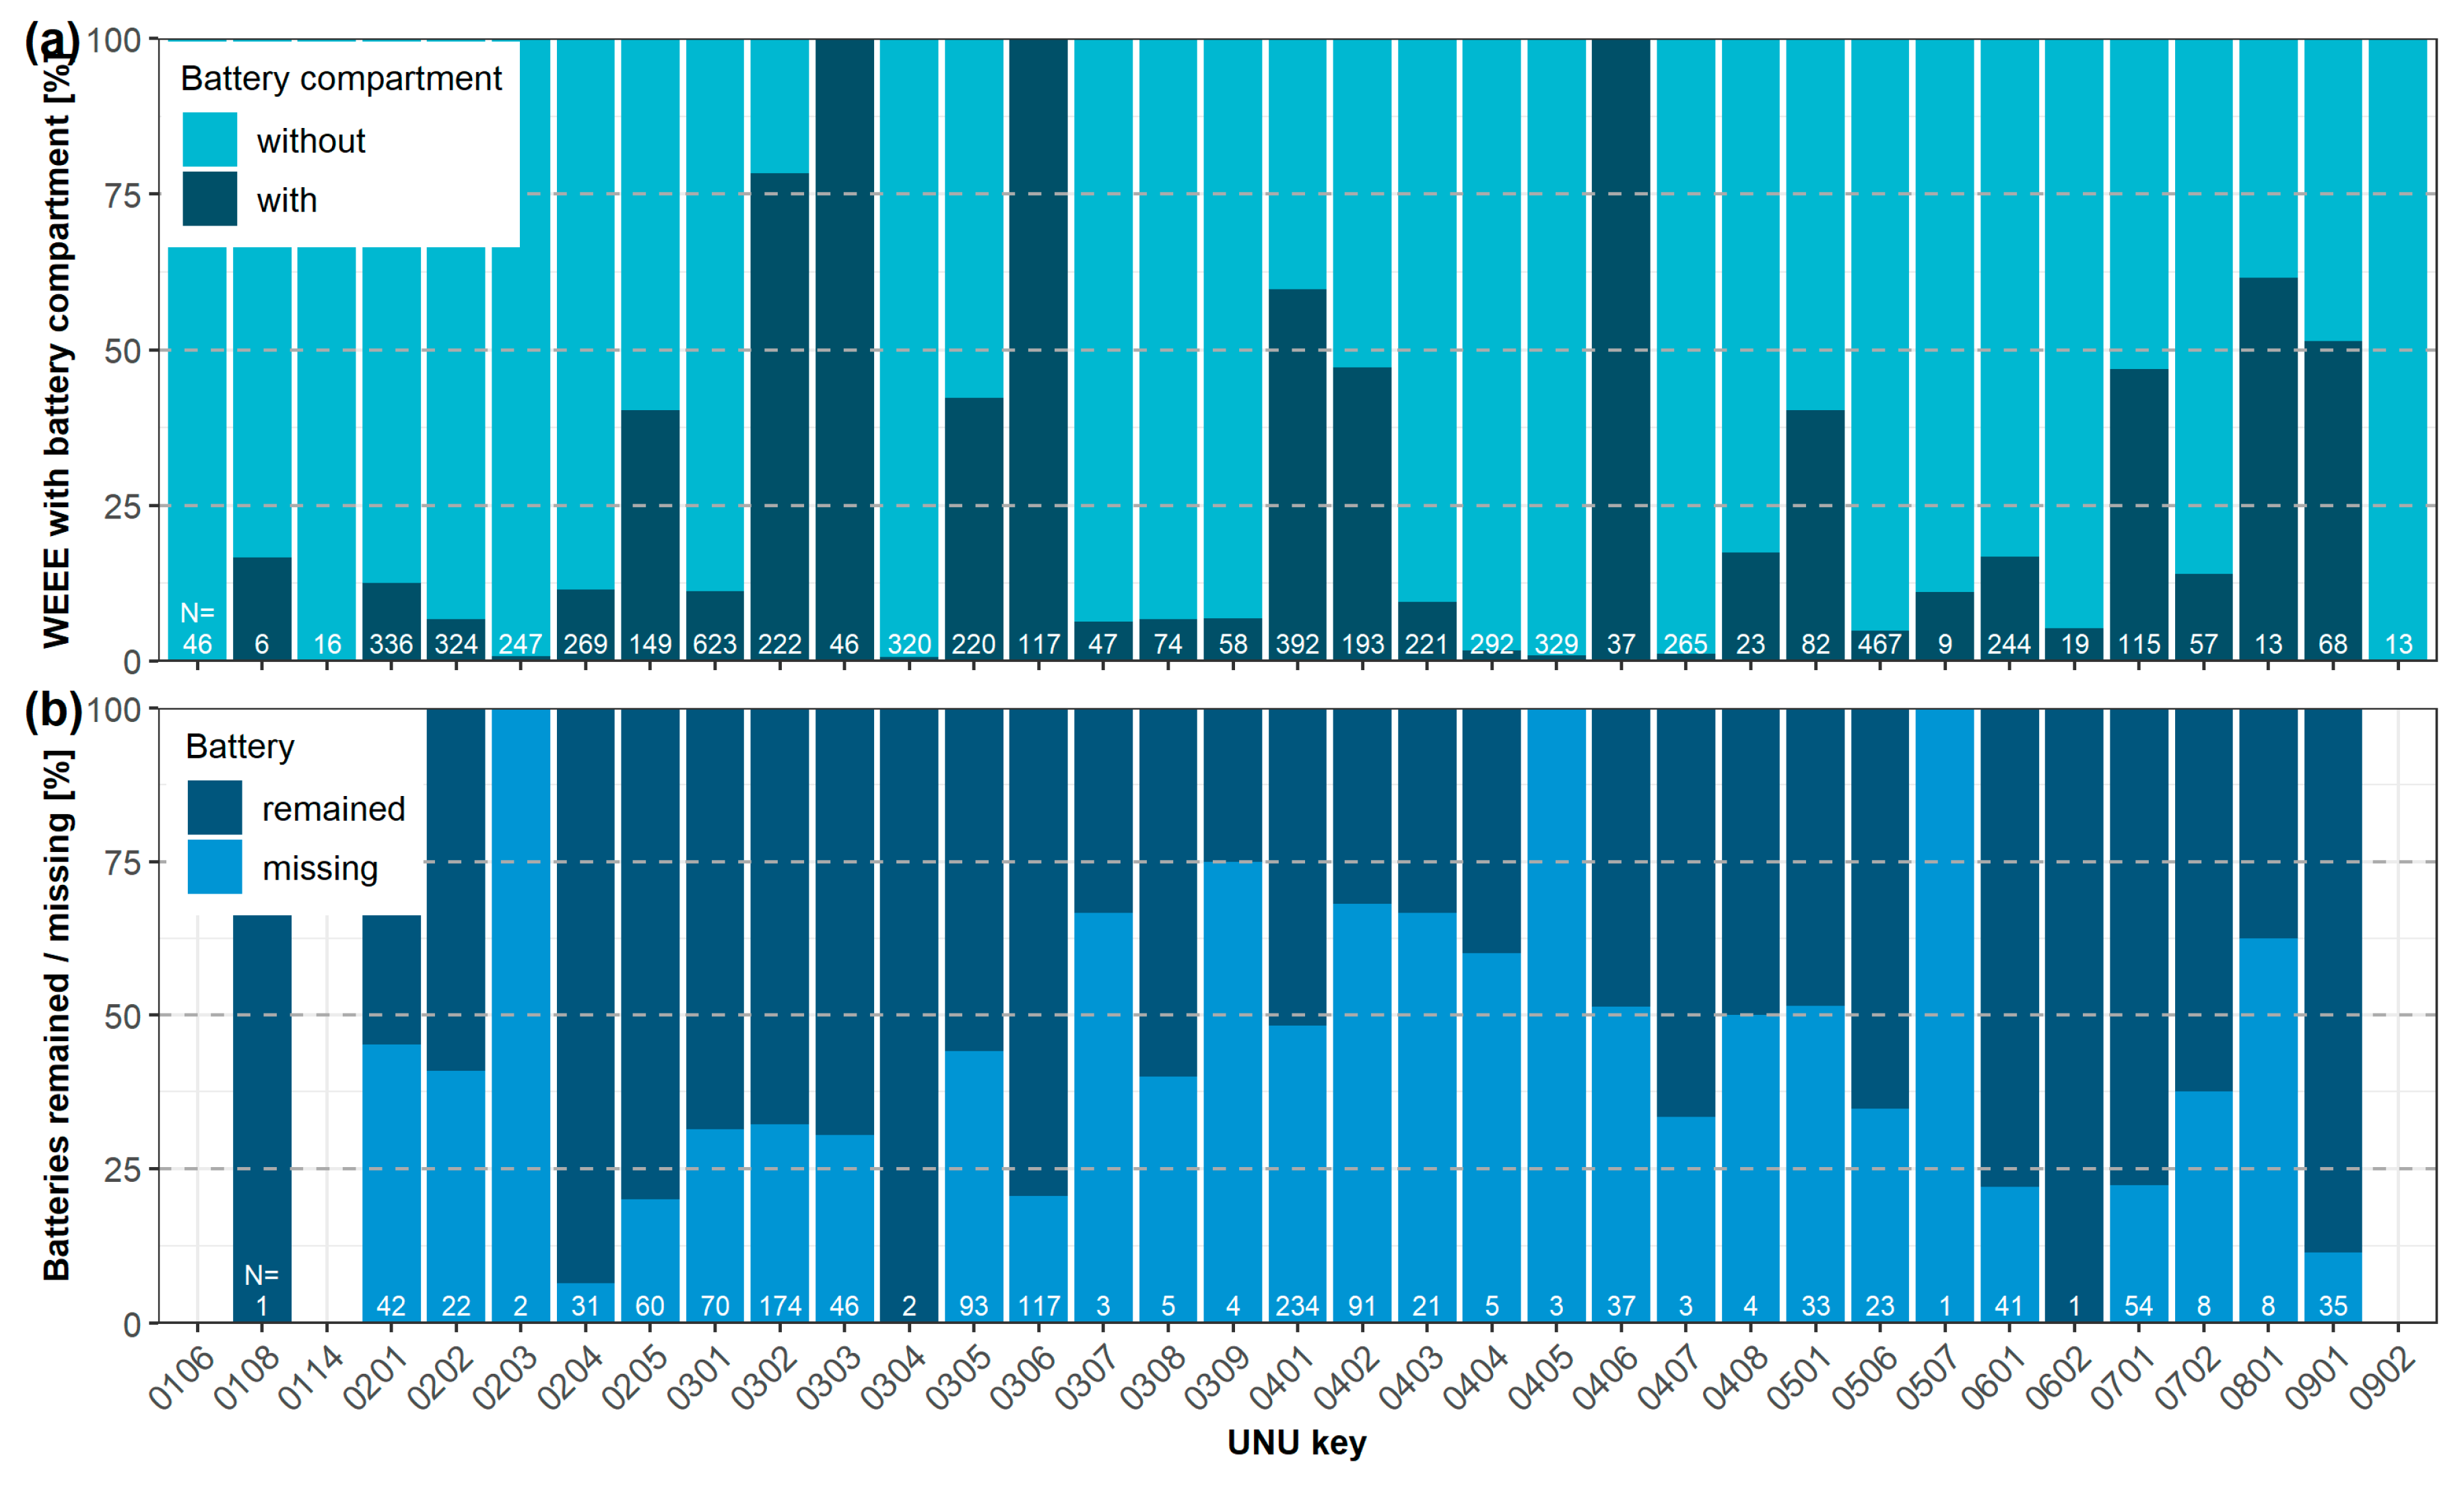
  • Identification of WEEE with and without battery compartment and determination of the proportion of remaining batteries.
  • Statistical description and analysis of distribution patterns for WEEE mass, battery mass (BM), and battery mass share (BMS) of built-in batteries in WEEE.
  • Recommendation for determining MSS in the case of small data sets and unknown or inconclusive distribution patterns for BMS of built-in batteries in WEEE.

2. Materials and Methods

This study is based on comprehensive empirical data collection and harmonized classification of built-in batteries in WEEE constituting a pilot data set for further analysis. Firstly, the results are statistically analyzed and examined for commonly assumed distribution patterns (normal and lognormal distribution). Secondly, data-driven simulation (bootstrapping) using the original sample data is performed to obtain more accurate results on WEEE battery characteristics. Finally, both a parametric approach (PA) and a nonparametric approach (NPA) are employed to approximate the MSS for quantification of the mass share of built-in batteries in WEEE. The detailed data sets, as well as the recommendations on MSS, will provide the a priori knowledge necessary for future sampling campaigns.
For all data analyses, the computational framework R [50] was employed using the packages “base”, “stats” [50], and ”e1071” [51]. The respective R commands are listed in the Supplementary Materials Table S2.

2.1. Sampling and Classification

Between 2015 and 2017, seven sampling campaigns were carried out at primary treatment plants for WEEE in Germany, France, and Belgium. The WEEE originated from private households, and the samples were taken prior to any treatment, i.e., as collected. In total, 23 Mg WEEE were sampled, comprising 6457 WEEE devices and 814 built-in batteries. The ‘product count’ procedure developed in the H2020 project ProSUM [2] with the corresponding sampling template [52] was used for data collection. Each device was individually weighed, classified according to the UNUkeys, and subsequently examined for battery compartments (with/without). Built-in batteries were removed, weighed and classified according to the BATTkeys (see Table 1). Table S1 in the Supplementary Materials shows the total mass and number of WEEE and BATT sampled in each sampling campaign.
A more comprehensive system was used for classification, compared to the official classification defined in Directive 2012/19/EU [22] for WEEE and Directive 2006/66/EC [23] for batteries, respectively. For WEEE, the so-called ‘UNU-keys’ and more detailed ‘UNUsubKeys’ (hereinafter referred to as UNUkeys and subKeys) were employed [53]; for batteries, the so-called BATTkeys [2] were used. The employed ‘keys’ are hierarchical and harmonized, allowing further data stratification, evaluation of distribution patterns and data quality, comparisons among studies, and the application to other scenarios and models.
The ‘UNUkey’ classification system was developed by the United Nations University (UNU) to enable the linkage of production and composition data as well as life span characteristics for lifetime distribution modeling [54,55]. The systems consist of three levels with a four-digit identifier on the most aggregated level. The first two digits reflect the ten categories of Annex I of the WEEE Directive 2012/19/EU [22] (see Table 1). Moreover, the UNUkeys and subKeys can be allocated to the new six categories (Annex III, WEEE Directive 2012/19/EU), which have been in force since 2018 (see Supplementary Materials Tables S16 and S17).
For batteries, the ‘BATTkeys’ shown in Table 1 were used. This classification system was defined in the H2020 Project ProSUM [2] and considers the allocation of battery type-specific materials, fire hazard (Li) [56], and environmental aspects (Cd, Pb). The term “BATT” was used if no distinction between the battery keys was possible.
The hierarchical structure of the UNUkeys and subKeys for WEEE, as well as BATT and BATTkey for batteries, allows the analysis and calculation for different ‘key’ combinations (UNUkey-BATT, subKey-BATTkey, etc.). We focus on combinations of UNUkey-BATT and UNUkey-BATTkey for an explanation of the methods and presentation of the results. The corresponding results for other combinations can be taken from the Supplementary Materials, provided that sufficient data points are available.

2.2. Statistical Analysis

Data description for all ‘key’-combinations comprised the calculation of mean ( x ¯ ), standard deviation (SD), and coefficient of variation (VC). Mass and mass share are described in the results section with x ¯ ± SD . While these parameters assume a normal distribution, more robust descriptors were calculated to comply with the requirements set by the European Solid Waste Analysis (SWA) tool [40]: 95% confidence interval (95% CI), median ( x ˜ ), and additionally median absolute deviation ( MAD = median ( x i x ˜ ) ) [57]. Of the different methods for determining the 95% CI, we chose to calculate the value range between 2.5 and 97.5% quantiles [58].
Moreover, distribution patterns were analyzed to assess the commonly applied assumption of normal distribution in sampling and data management. The Shapiro–Wilk (SW) test on normality was employed, which has the highest test power compared to other tests [58,59] but is sensitive to the sample size. If the calculated probability value p is below 0.05, the null hypothesis that the data set is normally distributed is rejected. The weakness of the SW test with small sample sizes is considered by calculating the shape parameters of the distribution: skewness and kurtosis [60]. Normally distributed data is symmetrical, i.e., they have a kurtosis and skewness of 0. Negative values for kurtosis and skewness mean thin-tailed and left-skewed distributions, whereas positive values stand for fat-tailed and right-skewed [51].

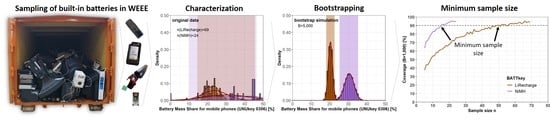
2.3. Data-Driven Simulation: Bootstrapping

Bootstrapping is a statistical method that provides an estimate of the data distribution by resampling one or more small samples with replacement [30,61,62,63]. The bootstrap method was used to simulate sampling distributions and to estimate the properties of the statistic (e.g., x ¯ ,   x ˜ ,   SD ,   VC ,   MAD ) more accurately [62,63,64,65,66,67]. Following the central limit theorem, the bootstrap method gives a reasonable approximation of the real probability curve when the number of bootstrap samples (B) is high enough [30]. In contrast to other parametric simulations, which assume specific population distributions (e.g., normal distribution), the non-parametric bootstrapping method requires no assumption regarding the statistical distribution [65] and uses the original data and resamples from this data set with many repetitions (number of repetitions = B). For each of the B bootstrap samples (resample), a simple random sample x = (x1, x2, ..., xn) of size norig with replacement is drawn from the original dataset. For each bootstrap sample, the resample statistics are calculated [64], indicated by an asterisk (*). The distribution of a resample statistic is called bootstrap distribution S* = S(x1, x2, ..., xn), which approximates the characteristics (center, spread, shape) of the population distribution [64]. For example, the approximated population mean (µ*) is the arithmetic mean of the bootstrap means and can be calculated according to Equation (1).
µ * = 1 B i = 1 B ( x ¯ i * )
In Equation (1), µ * is the bootstrap population mean; B is the number of bootstrap samples; and x ¯ i * is the mean of each bootstrap sample i. Accordingly, the standard deviation (SD) of the bootstrap distribution approximates the standard error of the mean (SEM) [63], shown as SD*.
In this study, the number of samples taken with replacement was set to the original number of samples (data points) norig, the number of repetitions is set to B = 5000. Adequate bootstrap simulation results depend on the minimum number of data points in the original dataset [58]. Guided by [58], we chose 15 as the minimum number of data points for bootstrap simulations (norig ≥ 15), which reduces the number of combinations for simulation of batteries and WEEE. Nevertheless, the robustness of this method is always based on the number of original data and repetitions B. While B is a matter of computational capacity, the challenge is to collect a sufficient amount of harmonized raw data for the simulation to increase robustness.

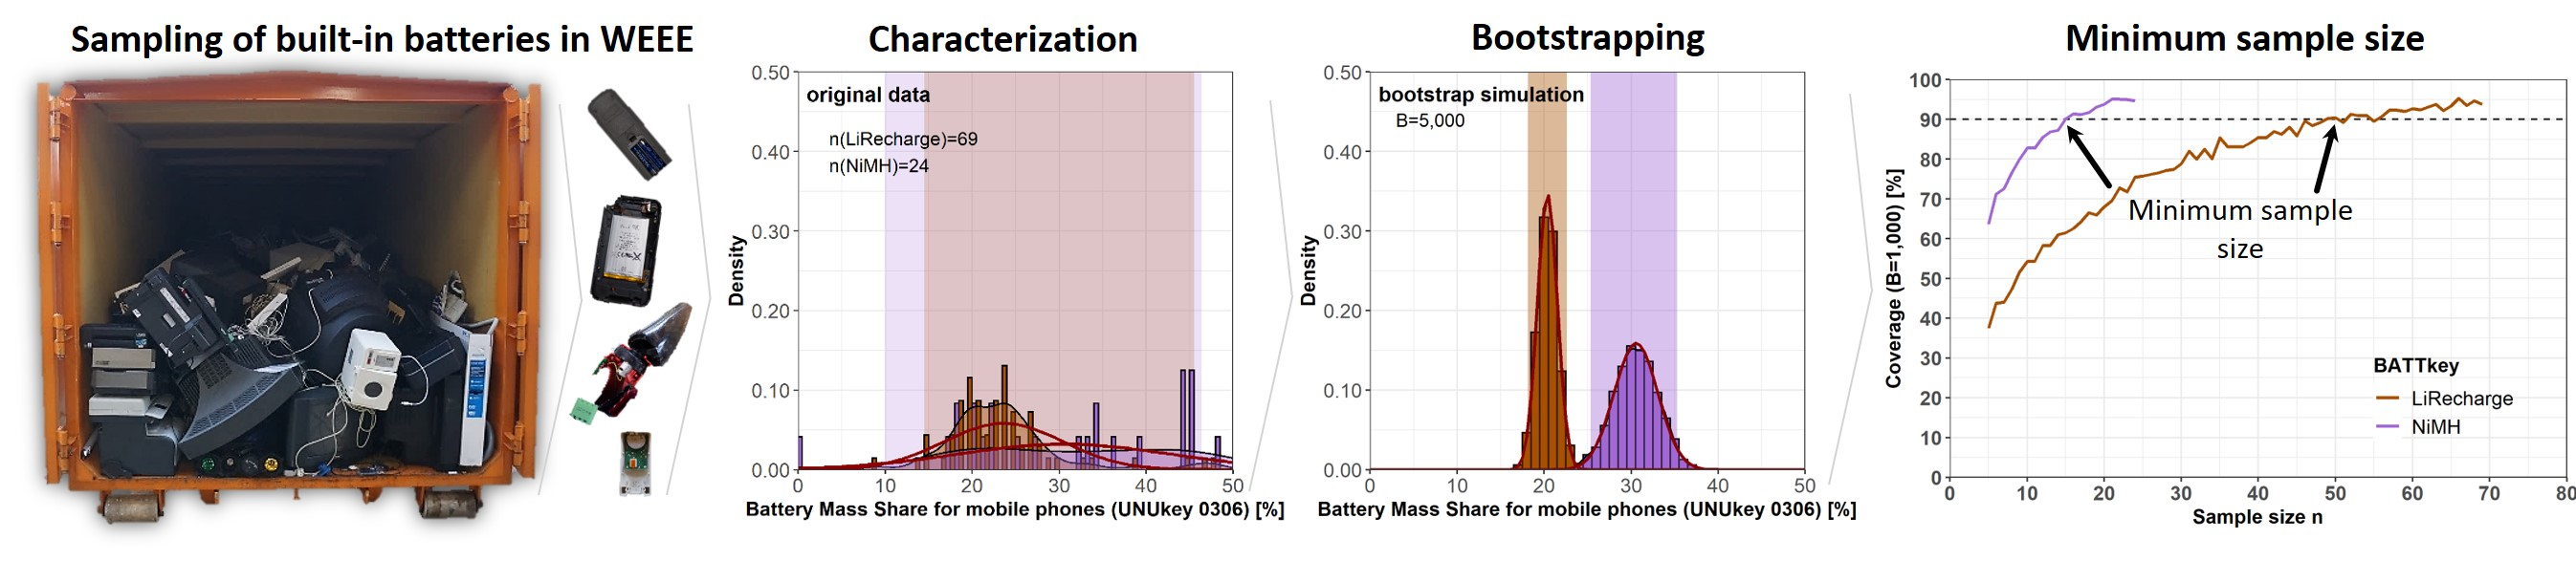
2.4. Determining the Minimum Sample Size (MSS)

The determination of MSS for any sampling campaign is necessary to gain representative results while limiting the expenditures for sampling. The methods to determine MSS vary in literature [34,35,37,39,40,42,43,68,69,70,71,72]. Most statistical approaches require the description of the variation of the targeted characteristics and the assumption of the data distribution to approximate the MSS. Therefore, statistical parameters such as the VC are calculated based on data from pilot studies. In this study, the sampling data is used to test two approaches to approximate the MSS: a parametric approach (PA) with the assumption of an underlying distribution pattern and a non-parametric approach (NPA), which bases on all single data points and their probability in the pilot data set.

2.4.1. Parametric Approach (PA): Assumption of Data Distributions

Parametric approaches base on the assumption of distinct data distributions to approximate the MSS given a calculated uncertainty. The calculation in Equation (2) is referred to in various references [31,72,73], assuming t-distributed data. The t-distribution is used alternatively for normal distribution in situations where the sample size is small, and the population standard deviation is unknown [74]. For a given probability level assuming an error probability of α = 0.05, a two-sided t-distribution, and an infinite number of degrees of freedom, tα/2 is 1.96 [31]. The coefficient of variation (VC) is used to express the data uncertainty gained by, e.g., a pilot study. We accept a relative error of ±10% (erel = 0.1) to describe the whole population sufficiently accurate [33].
n m i n = ( t α 2 · V C e r e l ) 2
Keeping tα/2 and erel constant in Equation (2), the number of samples depends solely on the VC of the samples. The PA is performed for both the original data (VC) and the bootstrap distribution (VC*) to illustrate the influence of bootstrapping on the variation of the data.

2.4.2. Non-Parametric Approach (NPA): Data-Driven Simulation with Bootstrapping

The NPA represents an alternative for determining the MSS without requiring a specific statistical distribution or large sample sizes in the original dataset [65]. This method is carried out in three steps (see Figure 1): (a) estimation of population characteristics and bootstrap confidence interval (CI*), (b) simulation of sampling with a smaller sample size to test whether the results lie within the 95% CI*, (c) determination of the MSS if the results are sufficiently covered within 95% CI*.
Firstly, we generate the bootstrap distribution for BMS by resampling from the original dataset with B = 5000 repetitions and calculating the arithmetic mean of each bootstrap sample. The sample size was set to the original number of data points (ni = norig). The generated probability distribution approximates the population characteristic and is used to calculate the bootstrap confidence interval (95% CI*) (Figure 1a). Only combinations of WEEE and batteries (UNUkey-BATT, UNUkey-BATTkey) with at least 15 data points in the original dataset were used for simulation to ensure reasonable results [58] (see Supplementary Materials).
Secondly, bootstrapping was used again to resample from the original dataset randomly but with smaller sample numbers starting from ni = 5 and increasing ni to the original number of samples norig. For each subsample of ni, 1000 subsamples (B = 1000) were drawn [60], and the arithmetic mean (bootstrap mean x i * ) was calculated (see Figure 1b).
Thirdly, we checked whether each bootstrap mean x i * lies within the 95% CI* of the simulated population distribution [58]. The proportion of the 1000 bootstrap means x i * within the 95% CI* was defined as ’coverage’. As for the PA, we assume a relative error of 10%, i.e., a coverage of ≥90%, as sufficient to represent the population at a given ni. Thus, the MSS is approximated at ni = MSS, if the coverage increases above 90% (see arrow in Figure 1c). In other words, a sample number n with 90% coverage means that in 90% of samples with this sample size, the resulting value is likely to be within the 95% CI* of the population and consequently representative.

3. Results and Discussion

The results section first shows in which WEEE (expressed as UNUkeys) batteries were found. In addition, the percentage of devices with battery compartments and the percentage of devices with remaining batteries is presented. WEEE characteristics are briefly addressed. The battery masses (BM) and battery mass shares (BMS) of the built-in batteries in WEEE are investigated in detail. The investigations comprise the description of UNUkey-specific battery types, BM, and BMS, as well as statistical testing of commonly assumed data distribution patterns. Moreover, bootstrap simulation is introduced to show the effects on data accuracy in case of unknown or inconclusive distribution patterns. Finally, recommendations to determine the MSS are given by comparing a parametric approach and a non-parametric approach using bootstrapping.
Here, only example UNUkeys and BATTkeys with a focus on BMS are shown and discussed. All detailed results on WEEE mass, BM, and BMS are available in the Supplementary Materials.

3.1. Share of Waste Electrical and Electronic Equipment (WEEE) with and without Battery Compartment

In total, 5967 WEEE products were investigated for battery compartments, of which 4693 (79%) are not for use with batteries. This corresponds to a total mass of WEEE of 20.9 Mg, of which 18.6 Mg (89% by mass) are products without a battery compartment (see Supplementary Materials Table S3). Both results correspond to recently published data, as Friege et al. [14] determined a 79% share of devices without a battery compartment, and Hobohm et al. [17] reported results between 85% and 92% by mass in sampling campaigns in Germany in 2014 and 2015. Figure 2a shows the proportion of WEEE devices according to UNUkeys (0106—Household Heating and Ventilation; 0108—Fridges; 0114—Microwaves; 0201—Other Small Household; 0202—Food; 0203—Hot Water; 0204—Vacuum Cleaners; 0205—Personal Care; 0301—Small IT; 0302—Desktop PCs; 0303—Laptops; 0304—Printers; 0305—Telecom; 0306—Mobile Phones; 0307—Professional IT; 0308—Cathode Ray Tube Monitors; 0309—Flat Display Panel Monitors; 0401—Small Consumer Electronics; 0402—Portable Audio and Video; 0403—Music Instruments, Radio, Hi-Fi; 0404—Video; 0405—Speakers; 0406—Cameras; 0407—Cathode Ray Tube TVs; 0408—Flat Display Panel TVs; 0501 —Lamps; 0506—Household Luminaires; 0507—Professional Luminaires; 0601—Household Tools; 0602—Professional Tools; 0701—Toys; 0702—Game Consoles; 0801—Household Medical; 0901—Household Monitoring and Control; 0902—Professional Monitoring and Control) distinguishing products with or without a battery compartment. Battery compartments are predominately present in small household appliances (SHA, 0201–0205), information technology (IT) and telecom equipment (ITCE, 0301–0303, 0305–0308), consumer equipment (CE, 0401, 0402, 0406), toys, leisure, and sports equipment (TLS, 0701), medical devices (MD, 0801), and monitoring and control instruments (MCI, 0901). Whereas most devices within one WEEE category are equipped with as well as without a battery compartment, the devices in UNUkey 0303, 0306, and 0406 all have a battery compartment. Also, more than 75% of the devices in UNUkey 0302 have a battery compartment.
The percentage of batteries missing, i.e., not installed, removed prior to collection, or dropped out during collection or transport, differs between the WEEE categories and the UNUkeys. On average, 34% of the more than 1200 devices with battery compartments were found without batteries. In other words, 66% of WEEE with a battery compartment were discarded with the battery still embedded. For most UNUkeys with a battery compartment, the removal rate of batteries prior to collection/treatment was below 50% (Figure 2b). In the case of 0204, 0205, 0306, 0601, 0701, and 0901, batteries were found in over 75% of the devices. Thus, mainly these equipment types contribute to the contamination of subsequent material flows, if prior identification and separation of the batteries are not carried out.
The further breakdown of the UNUkeys into subKeys allows a more precise determination of devices with a high potential of remaining batteries. Within one UNUkey, there are subKeys without battery compartments as well as devices with exclusively remaining batteries. In this case, the more detailed product classification can improve the separation efficiency and increase data accuracy and precision. Detailed data on battery compartments and remaining/missing batteries at UNUkey and subKey level can be found in the Supplementary Materials Figure S1 (proportion) and Figure S2 (mass share).
As seen in Figure 2, three different variables to which the results can refer become apparent and must always be distinguished in further data evaluation and interpretation. Accordingly, the following distinction is made between WEEE: (1) with and without battery compartment, corresponding to all devices (Figure 2a), (2) with battery compartment and the battery is missing or remained in the device (Figure 2b), and (3) with battery compartment, and the battery has remained in the device. Therefore, battery-specific statements on raw material losses by WEEE batteries always require the determination of the proportion of (1) and (2).

3.2. WEEE Characteristics

The WEEE characteristics are not the focus of this work but can be relevant for the interpretation of the battery mass shares. The descriptive statistics for all product weights of WEEE broken down by UNUkey and subKey can be found in the Supplementary Materials Tables S4 and S5.

3.3. Battery Characteristics

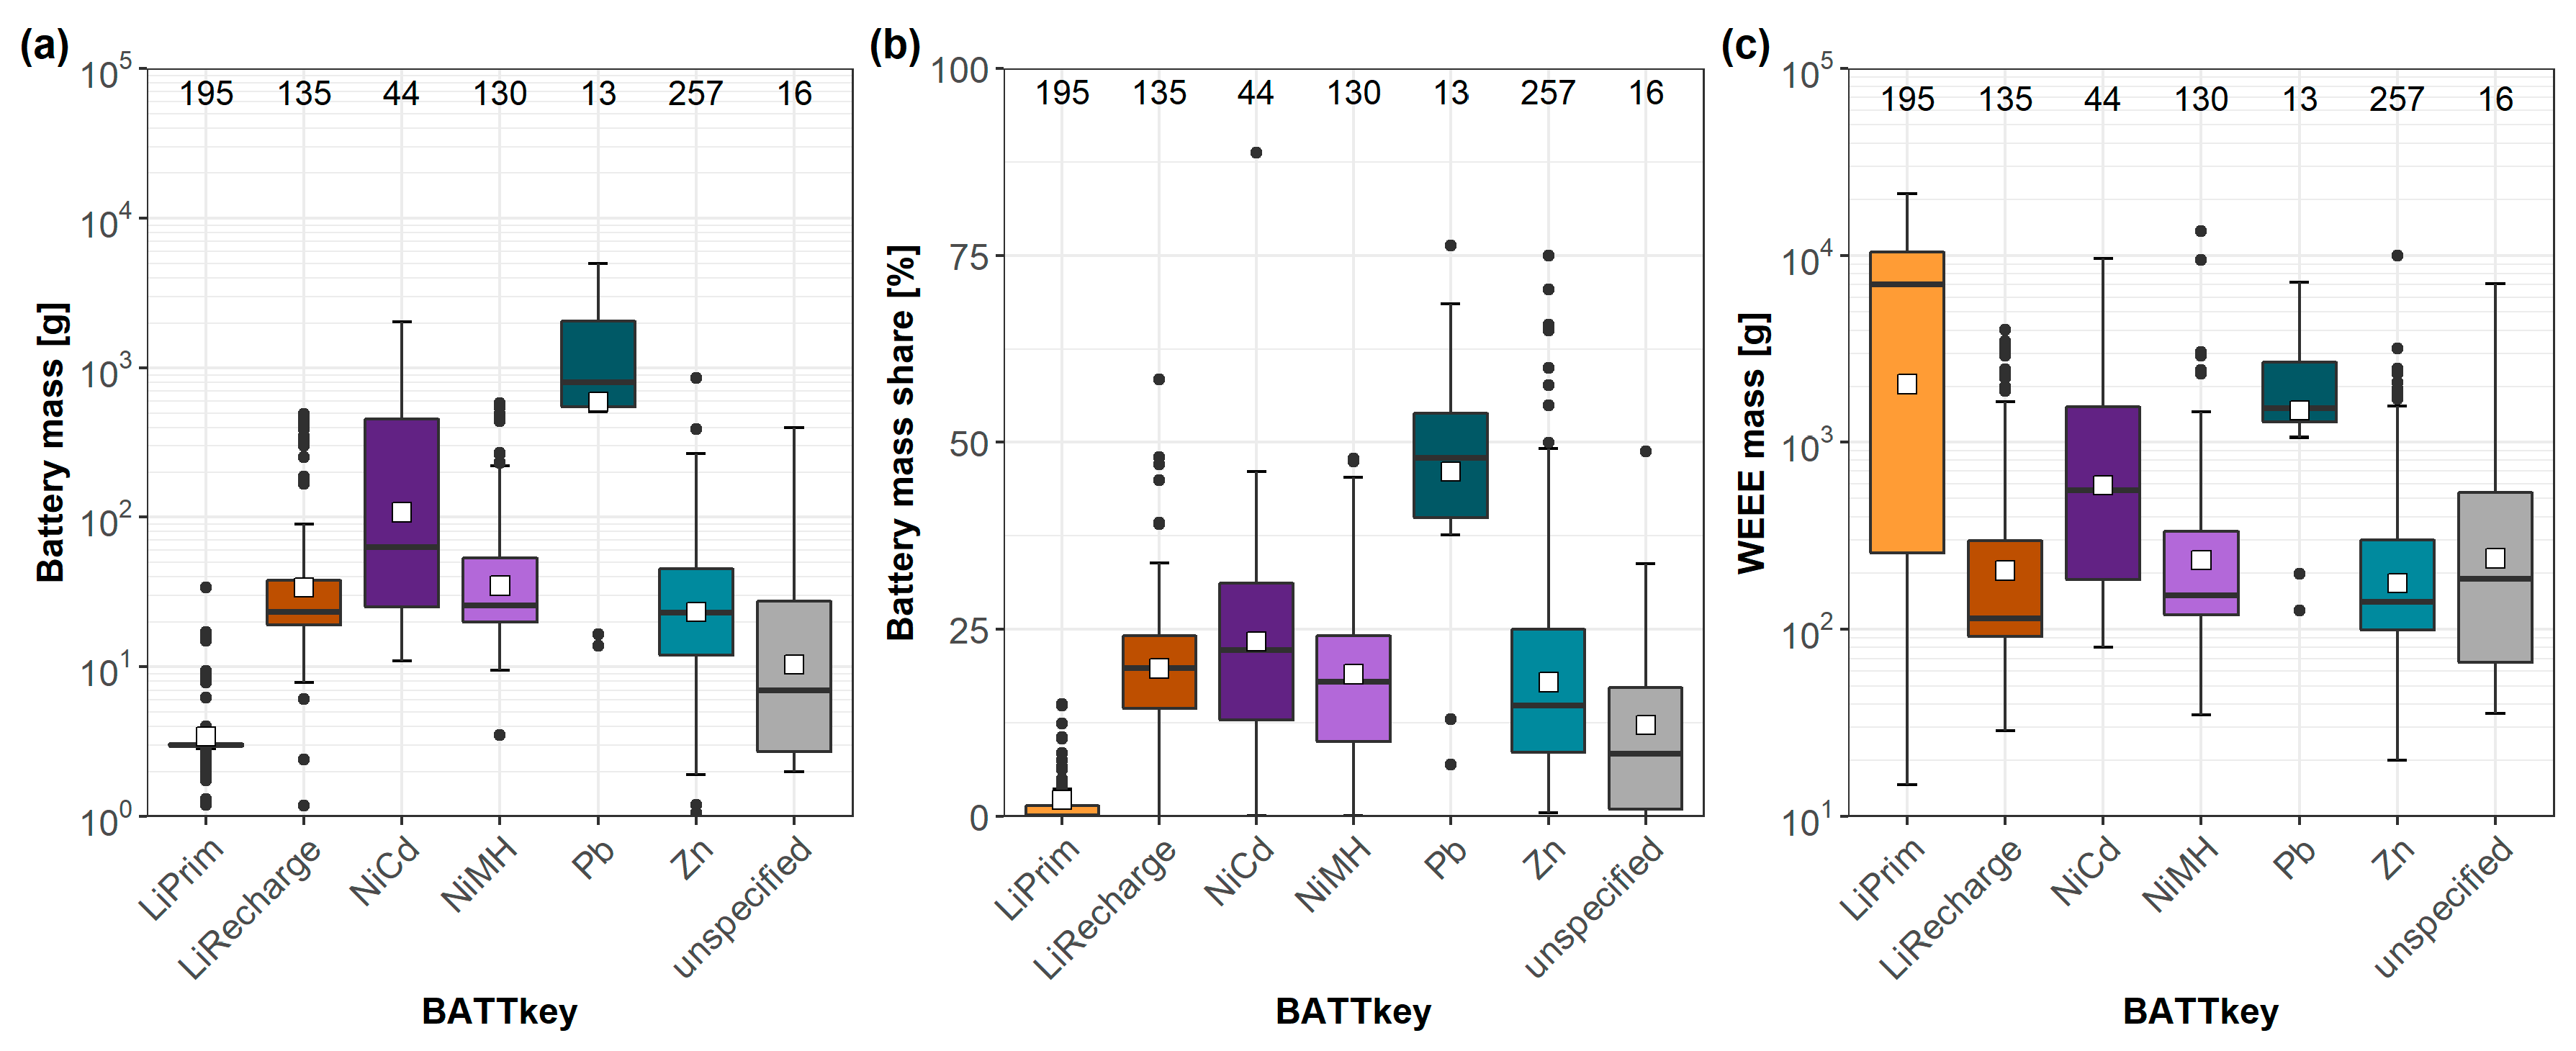
3.3.1. Mass and Mass Share of Built-in Batteries

Figure 3 shows the mass and mass share of all batteries differentiated according to their chemical system (BATTkey). Figure 3a illustrates that the total mass of batteries in WEEE ranges from a few grams for lithium primary (LiPrim) to more than five kilograms for Pb batteries. In total, 322 rechargeable batteries (LiRecharge, NiCd, NiMH, Pb) and 452 primary batteries (LiPrim, Zn) are identified. Sixteen batteries could not be specified due to missing labels or destroyed sleeve surfaces. These batteries show a wide mass range and thus could be assigned to all of the battery types.
LiPrim batteries have the most distinct mass with 3 g as the median value corresponding to the mass of CR2032 button cells [13] as used on IT mainboards. In contrast, the other primary battery type based on Zn shows a large mass range varying between 2 g and 150 g with an average value of 38 g and a median of 23 g. Similar to LiPrim, Zn batteries are used in many of the WEEE devices investigated covering 16 UNUkeys and 29 subKeys (see Table A1). However, in contrast to LiPrim, they were found in a much higher variety of designs (AAA to D, block format), which causes a higher mass range (VC 170%, MAD 17).
Comparing the secondary battery systems, NiMH and LiRecharge batteries show a similar mass range and usually weigh between 10 g and 430 g (95% CI). Even though LiRecharge is gradually replacing the NiMH system [2], both were found in similar numbers of UNUkeys (16 LiRecharge, 15 NiMH) and subKeys (27 LiRecharge, 24 NiMH) which demonstrates that this technology trend of recent years is now detectable in the waste stream.
The number of NiCd and Pb batteries found in WEEE was the lowest. These batteries were installed in fewer types of devices. Besides the required restrictions of the Battery Directive to use hazardous materials [23], the reasons for this are a high weight with lower energy density compared to LiRecharge and NiMH [75]. NiCd batteries weigh between 14 and 1500 g (95% CI), whereas Pb batteries are the heaviest batteries weighing between 15 g and 4300 g (95% CI). These values are consistent with the results of Bigum et al. [13] and Terazono et al. [20].
The battery mass share per BATTkey is shown in Figure 3b. The mass share of LiPrim is the lowest at about 2%. Except for Pb, the battery mass fraction for LiRecharge, NiCd, NiMH, and Zn is about 20% by mass among all WEEE considered (mean 18–23%, median 15–22%). In contrast, Pb batteries have higher mass shares of about 45% (see Table A1). Depending on battery mass (Figure 3a) and WEEE mass (Figure 3c), these values vary highly, showing a coefficient of variation of 40% to 70%. For primary batteries in particular, WEEE masses vary widely between a few grams to several kilograms (Figure 3c). The varying composition of WEEE flows thus causes a wide spread of BMS and the BM, complicating the identification and quantification of built-in batteries.

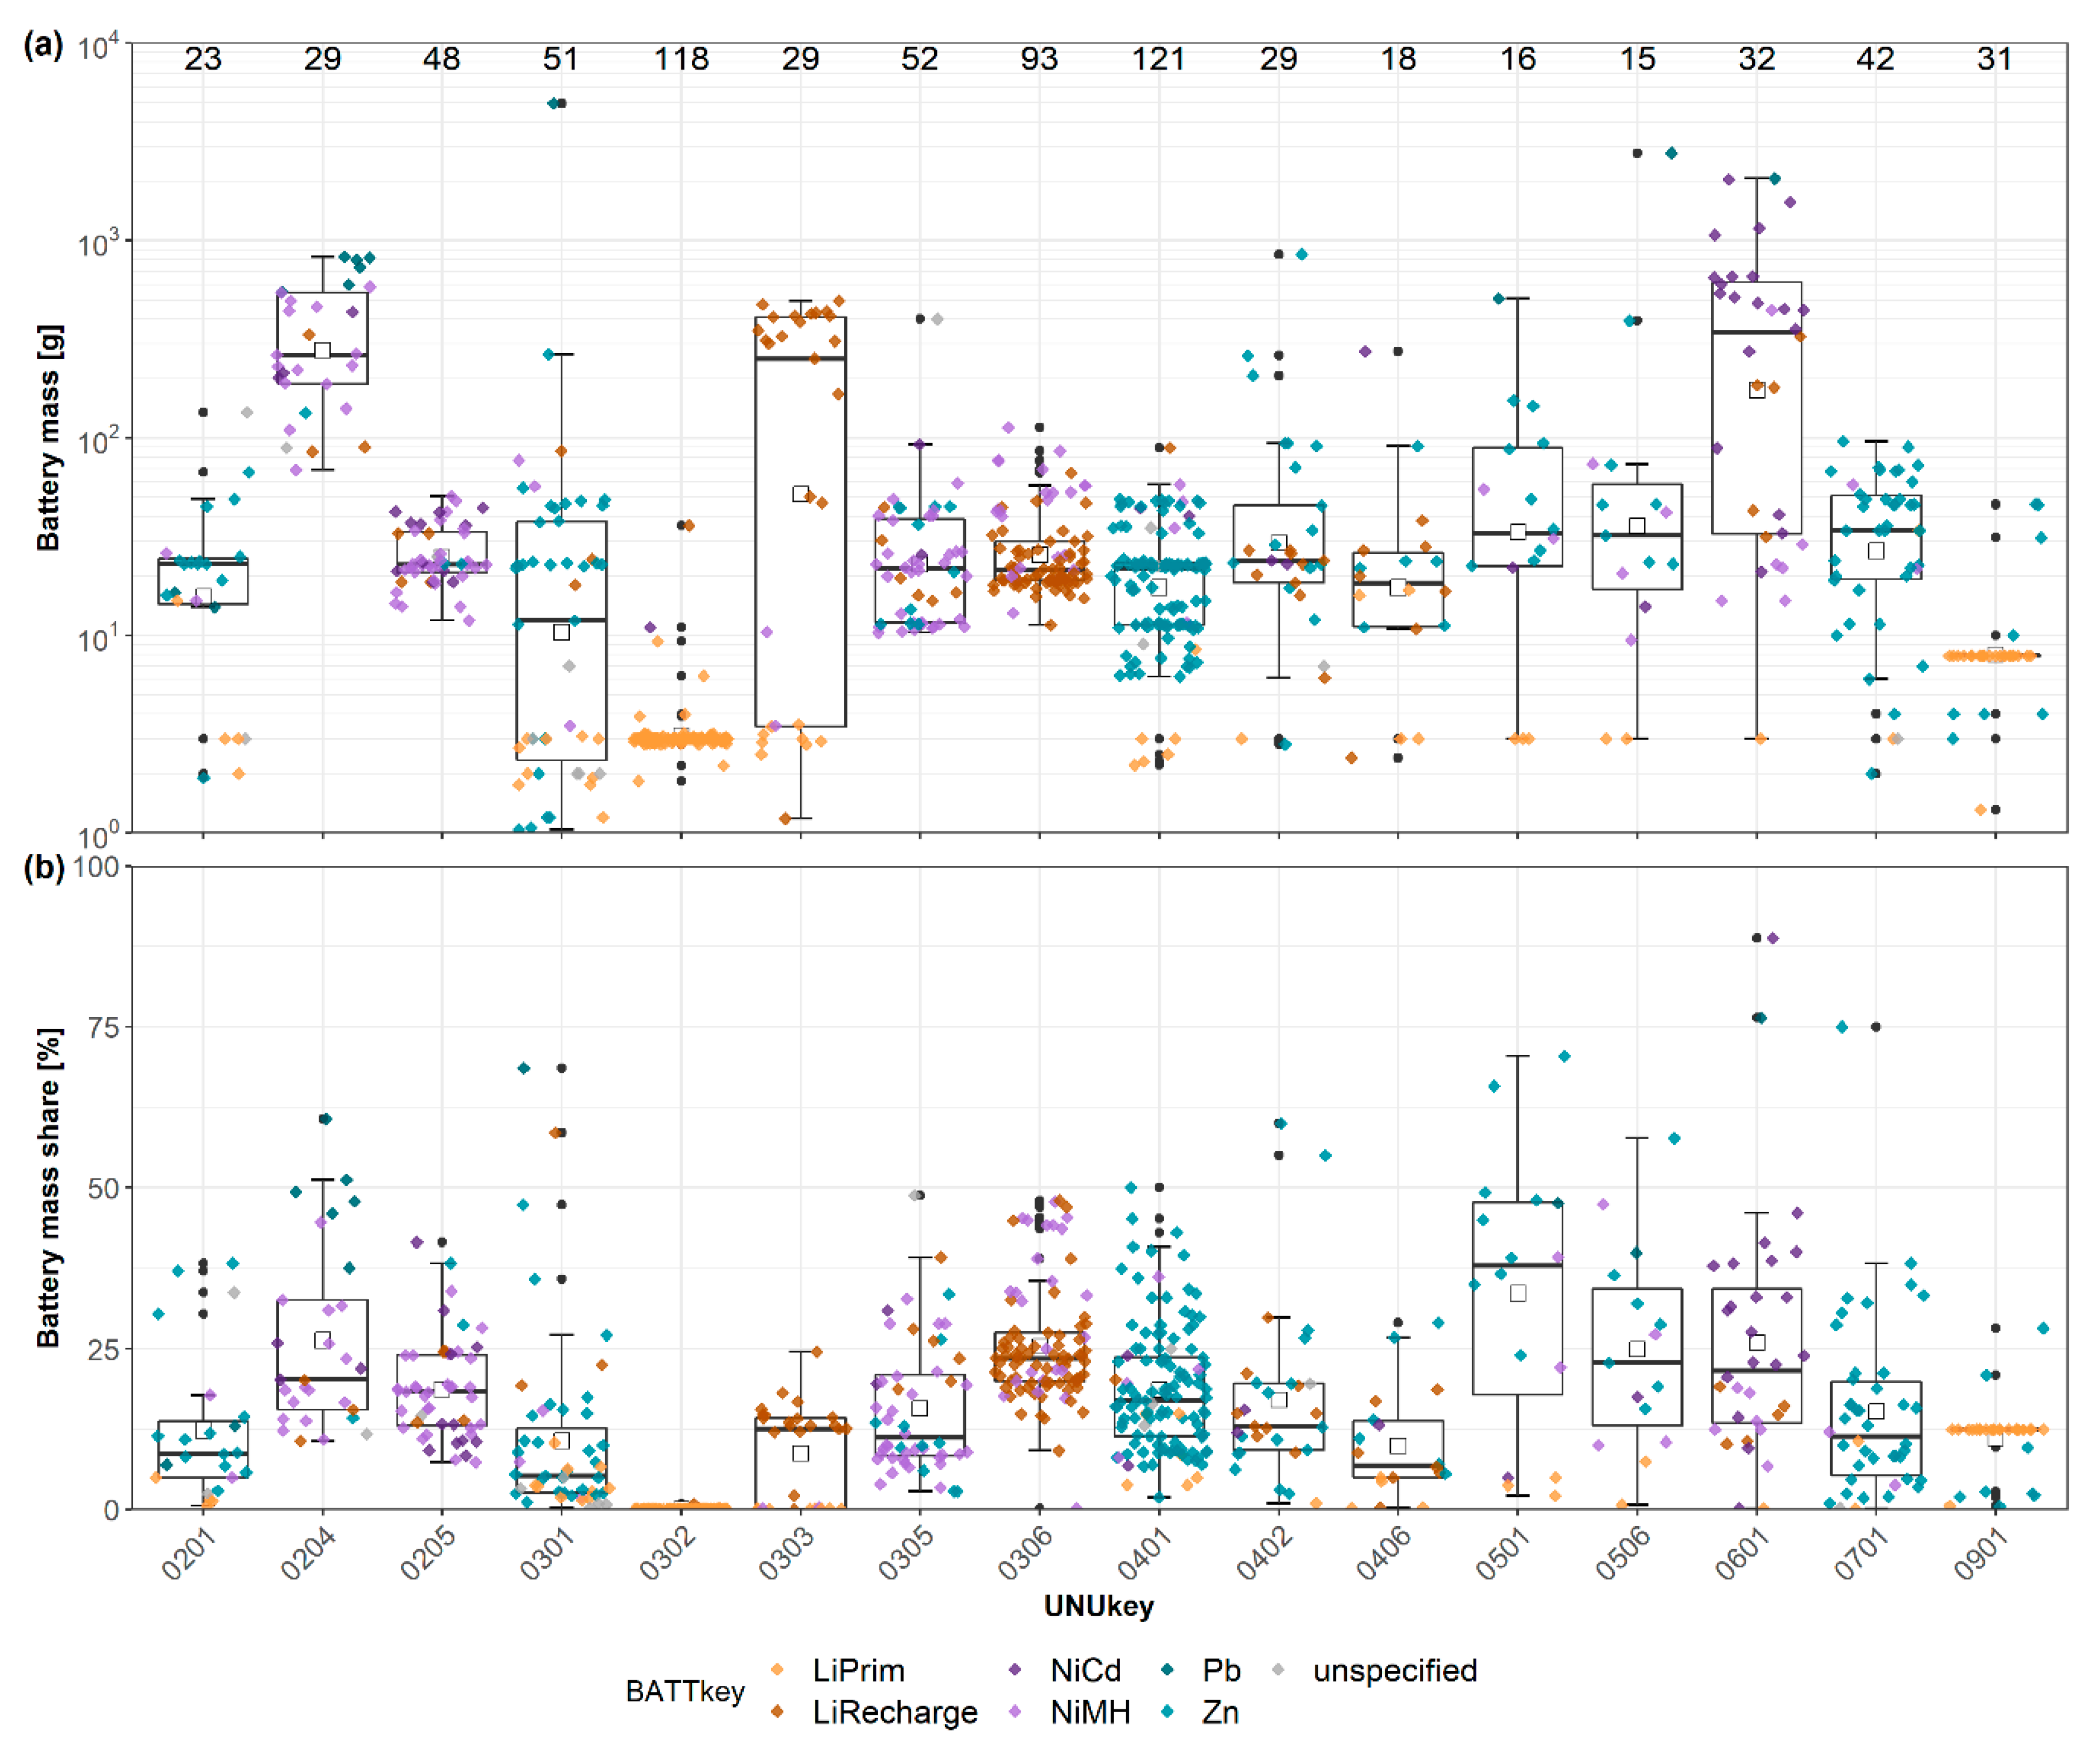
3.3.2. Product-Specific Battery Characteristics

For improved battery recycling and thus resource management, product-specific characteristics such as the occurrence of only certain batteries or specific mass/mass share are advantageous. A direct assignment of battery to product facilitates the selective separation of pollutants or recyclables prior to further treatment with mixed WEEE. With an increasing proportion of Li batteries, the safe and non-destructive removal of the batteries is also gaining importance in terms of safety aspects. Additionally, product-specific BM and BMS improve the estimation of associated raw material losses of batteries through complementary flows.
Figure 4 illustrates the assignment of UNUkeys and BATTkeys embedded as present in all 790 WEEE with built-in batteries. Some battery types are only present in a few WEEE (NiCd, Pb), while other battery types are found in almost all types of devices (Zn, LiPrim, LiRecharge). Furthermore, an accumulation of battery types can be observed in some equipment groups, such as Zn in 0401 or LiPrim in 0302. Moreover, it is noteworthy that many of the device groups contain all or nearly all battery types. In this context, Pb and NiCd pose a risk of contamination with heavy metals for subsequent processing steps.
Considering the subKey level (shown in Supplementary Materials Figure S3), it can be observed that both NiCd and Pb batteries occur together or with NiMH or LiRecharge systems within a subKey. This indicates that the substitution of batteries containing lead and cadmium by other batteries is still ongoing and visible in the waste stream and thus requires special attention when sampling and treating WEEE. An exception from this grouping is 050103 (other lamps for insects or tanning) for NiCd and 060104 (power supplies and adapters) for Pb batteries, which were both found with exclusively one battery system embedded.
Figure 5a,b shows the mass and mass share of built-in batteries in WEEE per UNUkey, respectively. The distribution of all battery data (BATT) is illustrated as a boxplot, whereas all 790 single batteries are displayed as dot-plots colorized by the respective BATTkey. The subdivision into UNUkeys shows that the values for BM and BMS within a WEEE category (first two digits of the UNUkey) are considerably different. The box plots in both figures show that the mean and median values differ from each other, which indicates skewed, i.e., not normally distributed data. In addition, the values for some UNUkeys differ, in some cases, very widely (0301, 0303), while other UNUkeys show only minor variations (0306, 0901). A further subdivision into subKeys leads to a reduction of the variance and more precise results for BM and BMS for the respective key (see Supplementary Materials Figure S4, Table S9, Table S11, Table S13, and Table S15).
Both the BM and the BMS show considerable differences between the UNUkeys regarding the order of magnitude as well as variation (Figure 5). Some UNUkeys have batteries below 10 g (0302, 0901), whereas other devices have battery weights well above 100 g (0204, 0303, 0601). Devices with batteries that typically weigh 10 to 100 g are 0201, 0205, 0305, 0306, 0401, 0402, 0406, 0501, 0506, and 0701.
Primary batteries can be found in the majority of UNUkeys. In addition to IT and telecommunication equipment (UNUkey 03xx), LiPrim batteries can be found in almost all UNUkeys shown in Figure 5. This battery type is predominately used for button cells, like CR2032, which weighs on average 3 g. In contrast to cylindrical or prismatic cells, button cells are often used as a constant power supply to store system settings on the mainboard of ITCE devices, not for supplying the device with energy itself. Increasing WEEE mass is consequently not leading to higher battery mass resulting in small BMS in heavier WEEE (see Figure 3b,c), which means batteries are difficult to identify, locate, and remove.
The largest group of primary batteries are Zn-based systems (Zn), which also include zinc-carbon and alkaline manganese systems. Zinc batteries were found in both cylindrical and prismatic (9V block) design, which were mainly embedded in small consumer electronics, such as remote controls (040104), portable audio (0402), small IT (0301), and small toys (070101) [76]. The dominant design is R6 (formerly AA), which weighs about 23 g (corresponding to the median mass for Zn in this study). Within a device type (subKey), primary and secondary lithium systems, NiMH, and NiCd occur in addition to Zn systems (see Supplementary Materials Figure S3).
Regarding rechargeable batteries, LiRecharge and NiMH were dominantly present in WEEE. LiRecharge is characterized by high power and energy density, high voltage, long storage life, and low self-discharge rate [77,78], which is why they can be found among most UNUkeys (Figure 4). However, only laptops (0303) and mobile phones (0306) show a predominant use of LiRecharge batteries having mass shares of 13 ± 5% and 24 ± 7% by mass, respectively. The random occurrence of these batteries in some device types makes their systematic identification challenging.
NiMH was mainly found in SHA (handheld vacuum cleaners (0204), toothbrushes (0205)), telephones (0305), and mobile phones (0306). The mass variation is between 7 ± 5 g (0303) and 296 ± 165 g (0204), with a 95% CI between 10 and 490 g. Considering the high variation (VC = 170%), the indication of median and MAD is advisable. NiMH most frequently weighed about 26 ± 21 g (median+/−MAD), which corresponds to a mass share of about 18 ± 11% (see Table A1).
Pb and NiCd batteries were rarely present within WEEE, predominately as a result of the ban of cadmium and lead in portable batteries since 2006 [23]. Pb batteries are by far the heaviest batteries used in WEEE and were mostly found in portable vacuum cleaners (0204). With 15 to 4300 g (95% CI), Pb batteries make up 50% of the weight of the device. NiCd batteries have lower energy density compared to NiMH, causing a decrease of NiCd in WEEE. In total, 44 NiCd were found in the devices, which were mainly used in personal care and tools. Besides, NiCd batteries often weigh more than twice as much (300 ± 440 g) and thus constitute a larger share of the equipment mass (23 ± 15%).
In summary, individual hotspots, i.e., a significant accumulation of certain BATTkeys, can be identified for some UNUkeys and especially subKeys. Devices with only one type of battery were rarely found except for LiPrim in desktop PC 0302. Thus, no product-specific allocation can be made for the majority of the devices. Moreover, the technological development of batteries in recent years is apparent in the occurrence of NiCd and NiMH in tools (0601) as well as NiMH and LiRecharge in mobile phones (0306). Moreover, most combinations of UNUkey/subKey and BATTkey show high data variability for BM and BMS, which is why no distinct product-specific characteristics can be ascertained, leading to increased MSS. Thus, considering the different numbers of samples per UNUkey, only indicative statements can be made, and more precise statements can only be made by considering the data distribution pattern, which is derived from a sufficient number of samples.

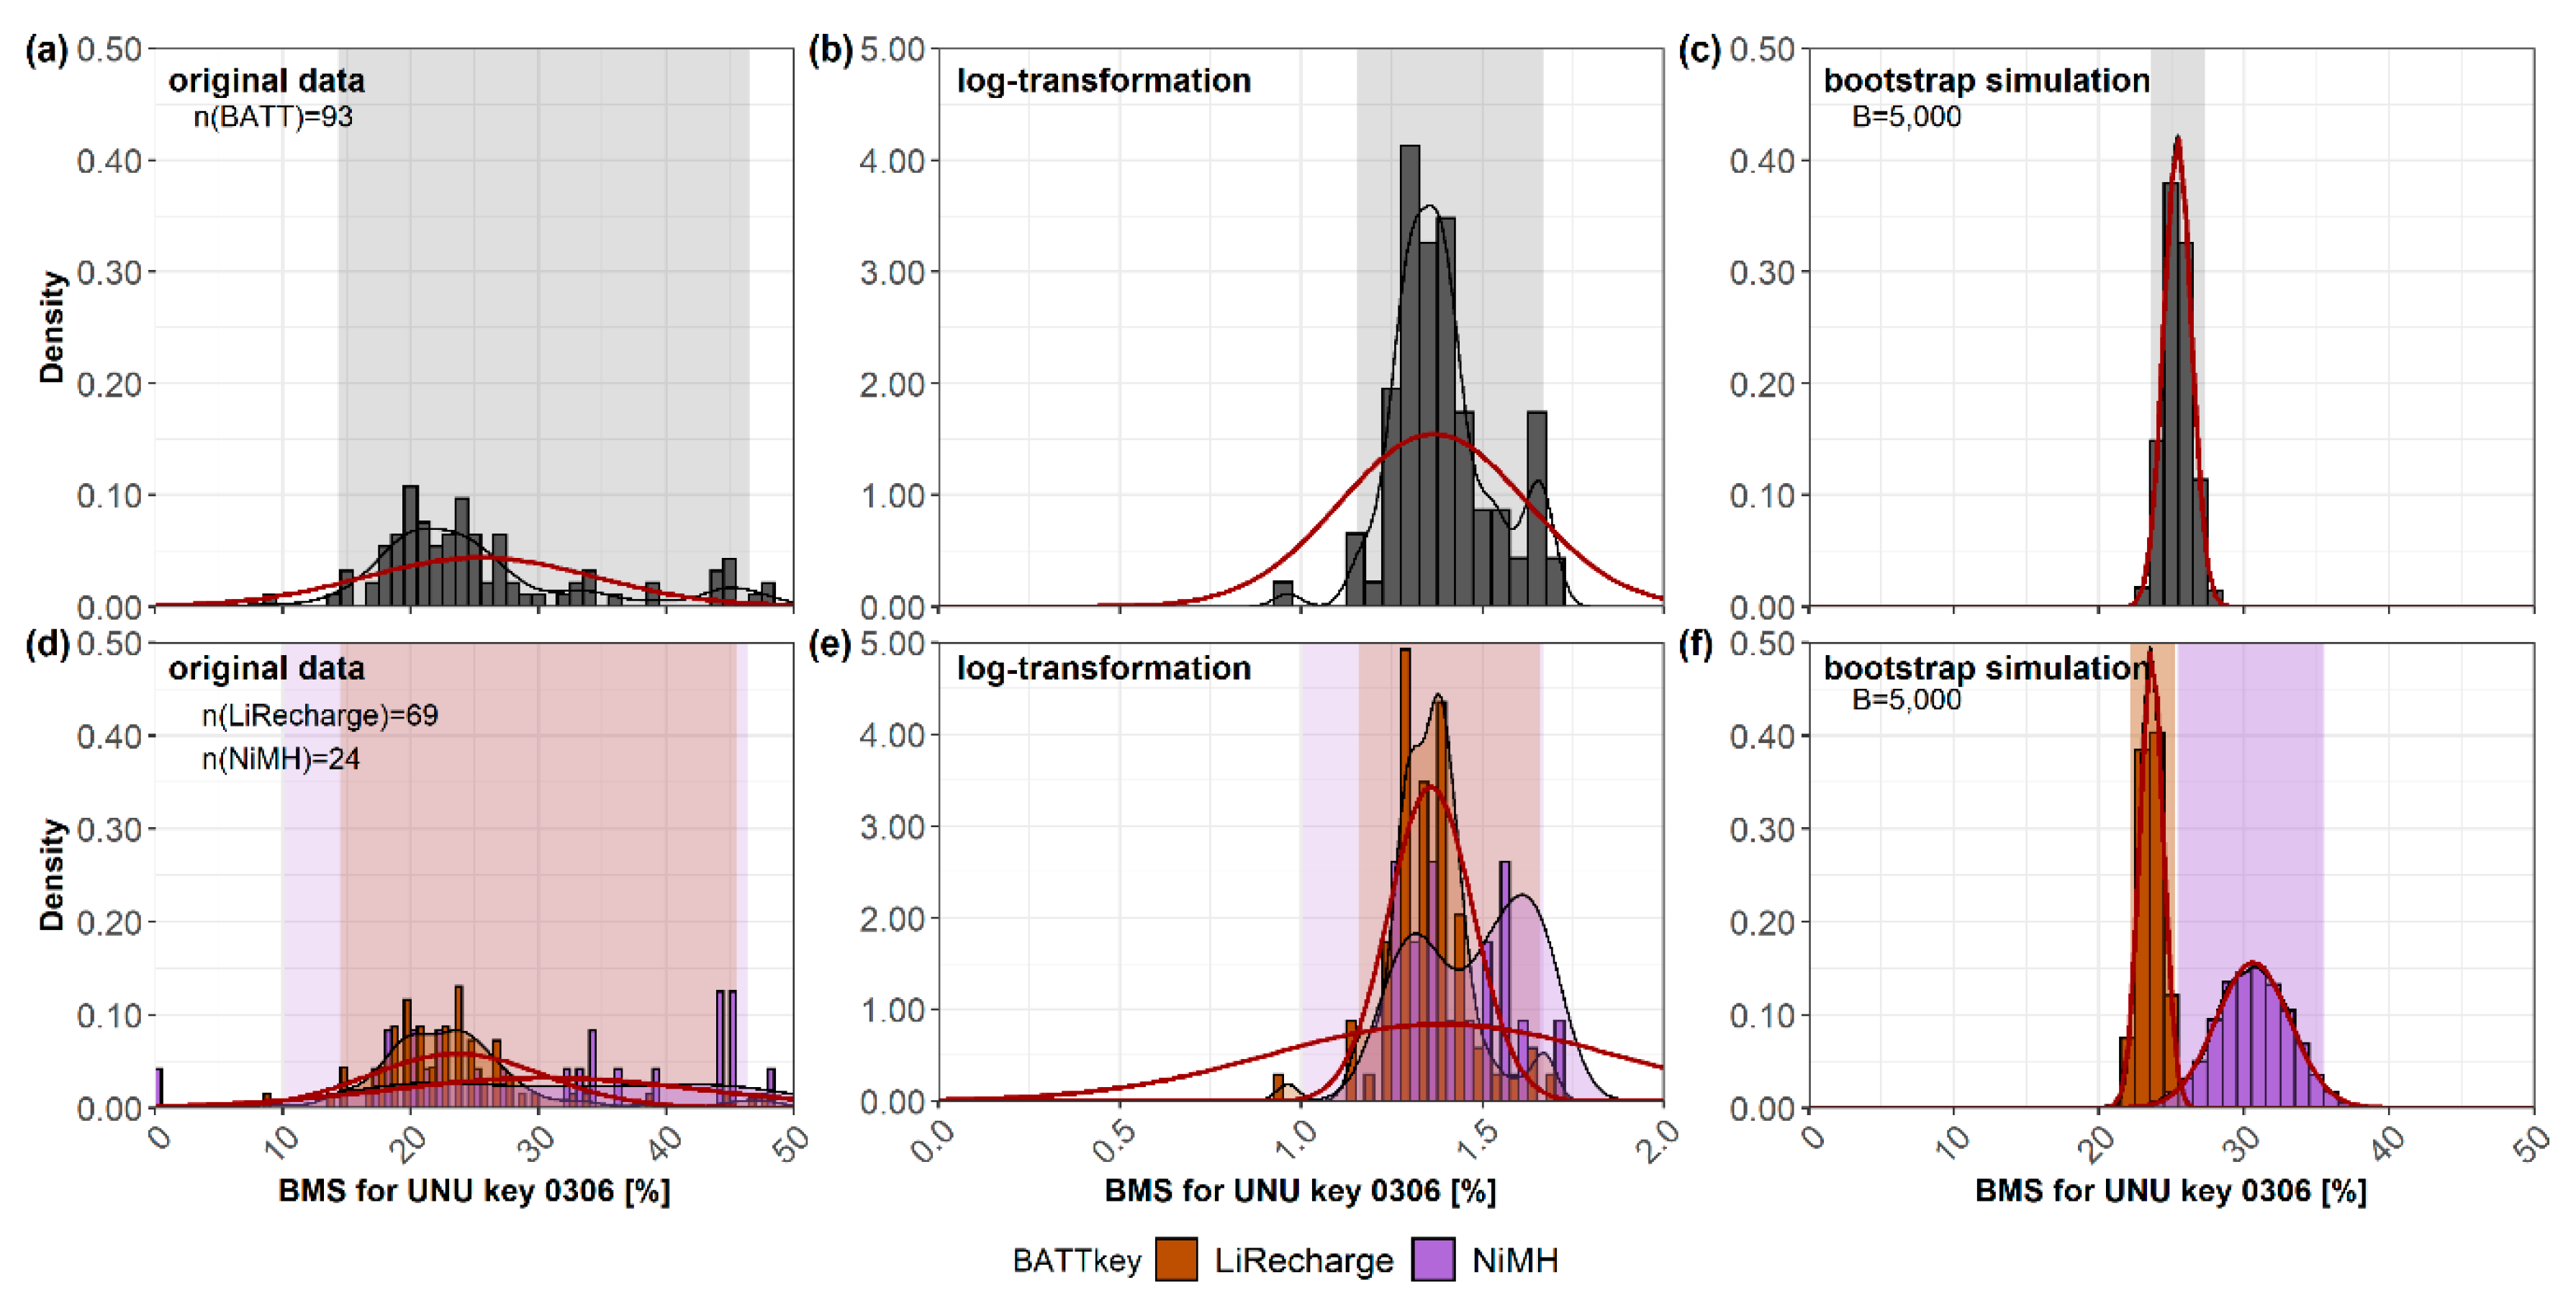
3.3.3. Distribution Pattern and Bootstrap Simulation

When research results are described with mean value (position parameter) and standard deviation (shape parameter), a normal distribution is assumed. However, these parameters are not robust for describing data sets, i.e., they are sensitive to extreme values, outliers, and skewed distributions. The latter is likely if mean values are low, variances large, values have a lower limit (usually zero for concentrations), or datasets are “closed” like for mass shares or compositional data (from 0 to 100%) [79,80]. In this case, testing for distribution patterns (e.g., lognormal distribution) to improve the data description is recommended [58,79,80]. All data on WEEE mass, battery mass, and battery mass share were tested for normal and lognormal distribution. Moreover, skewness and kurtosis for these parameters were calculated. This section focuses on battery mass share to demonstrate a) the influence of the shape of the distribution and what difference a few data points can make, and b) bootstrapping as a method to simulate the impact of resampling on data precision and accuracy.
In general, the assumption of a normal distribution is not applicable for BM and BMS data of the different battery types (see Supplementary Materials Tables S7, S10, S11, S14, and S15). In most cases, mean values and medians deviate strongly, and the variation (SD, VC) is large, indicating a skewed and heterogeneous data distribution. Moreover, the analysis of skewness and kurtosis (both 0 for normal distribution), as well as the SW test (p > 0.05 for normal distribution), confirm that neither normal distribution nor lognormal distribution is present. Thus, without further examination of distribution patterns or collection of additional data, no distinct distribution patterns are given, and the data description using mean and SD may be biased.
Figure 6 shows the data distribution of battery mass shares as a histogram and probability density function (PDF) for the original data (a), the log-transformed data (b), and the bootstrap simulation (c) using the example of mobile phones (0306). The results for the other UNUkeys and subKeys are given in the Supplementary Materials Tables S7, S10, S11, S14, and S15. In Figure 5, the range in which the mass share lies with a probability of 95% is marked as a semi-transparent grey box (95% CI). The black curve shows the smoothed density estimate of the raw data, whereas the red curve shows the PDF of the normal distribution for the sample mean and SD. If both curves coincide, there is a normal distribution of the data, which can be confirmed by the SW test and the results of kurtosis and skewness.
Figure 6a–c show the results for mobile phones (0306) without differentiation of battery systems (dark grey bars), whereas Figure 6d–f distinguishes between LiRecharge and NiMH. The example datasets comprise 93 batteries in mobile phones, of which 69 are LiRecharge batteries and 24 are NiMH batteries. In Figure 6a, most BMS are between 15 and 30% by mass, with some values up to 50% by mass (Figure 6a). Considering BATTkeys, the result is a more distinct BMS for LiRecharge, which concentrates around 20% by mass, whereas NiMH accounts for a BMS of 30% by mass (Figure 6f).
The description of these datasets using mean and SD, however, is not always applicable since normal distribution must be validated. In the example shown, neither BATT nor LiRecharge are normally distributed, but the SW confirms normal distribution for NiMH. By inspecting Figure 6b,e, we can assume that log-transformation for closed data sets like BMS does not improve the data description, which is confirmed by the results for SW, kurtosis, and skewness. Normal or (log-)normal distribution could rarely be confirmed when examining the original and log-transformed BMS data sets on UNUkey-BATT, UNUkey-BATTkey, subKey-BATT, and subKey-BATTkey level. Nevertheless, given the number of samples, two observations could be made. The proportion of data sets with lognormal distribution is higher than for normal distribution. This confirms that closed data sets can be better described by log transformation [79,80]. Furthermore, the specification of subKey and BATTkey increases the proportion of normal and lognormal distributions. Therefore, the applied classification improves the description of BMS and provides more accurate results with less variation of the data.
The bootstrap simulation in Figure 6c shows the BMS result of B = 5000 mean values drawn randomly from the original data set (Figure 6a). The simulated results are product- and battery-specific estimates for the mean mass fraction and depend on the underlying data. The mean (µ*) and the VC* of the simulated mean values were calculated for the simulated 5000 bootstrap samples. While the bootstrap simulation has only a minor influence on the mean value (compare x ¯ and µ*), it becomes apparent that the variation (SD*, VC*) and 95% CI* decrease strongly, providing more precise data on BMS [64]. Moreover, the bootstrap distribution is symmetric, i.e., not skewed, which allows using SD* and VC* to describe the data uncertainty. However, this does not imply that bootstrap distributions are normally distributed. For instance, BATT (Figure 6c) and LiRecharge (Figure 6f) are normally distributed in 0306, but NiMH (Figure 6f) is not.
The investigation of other UNUkeys showed that only a few of the bootstrap distributions have an SW p-value of more than 0.05 and are therefore considered normally distributed. The distribution shape, on the other hand, showed that the data is marginally skewed (skewness near 0), but very often has a thin-tailed shape (negative kurtosis). Consequently, the description of the bootstrap results with Gaussian statistics is biased. Therefore, we always recommend a critical review of statistical assumptions for the original data and the additional use of more robust descriptors, such as median and MAD or confidence intervals.

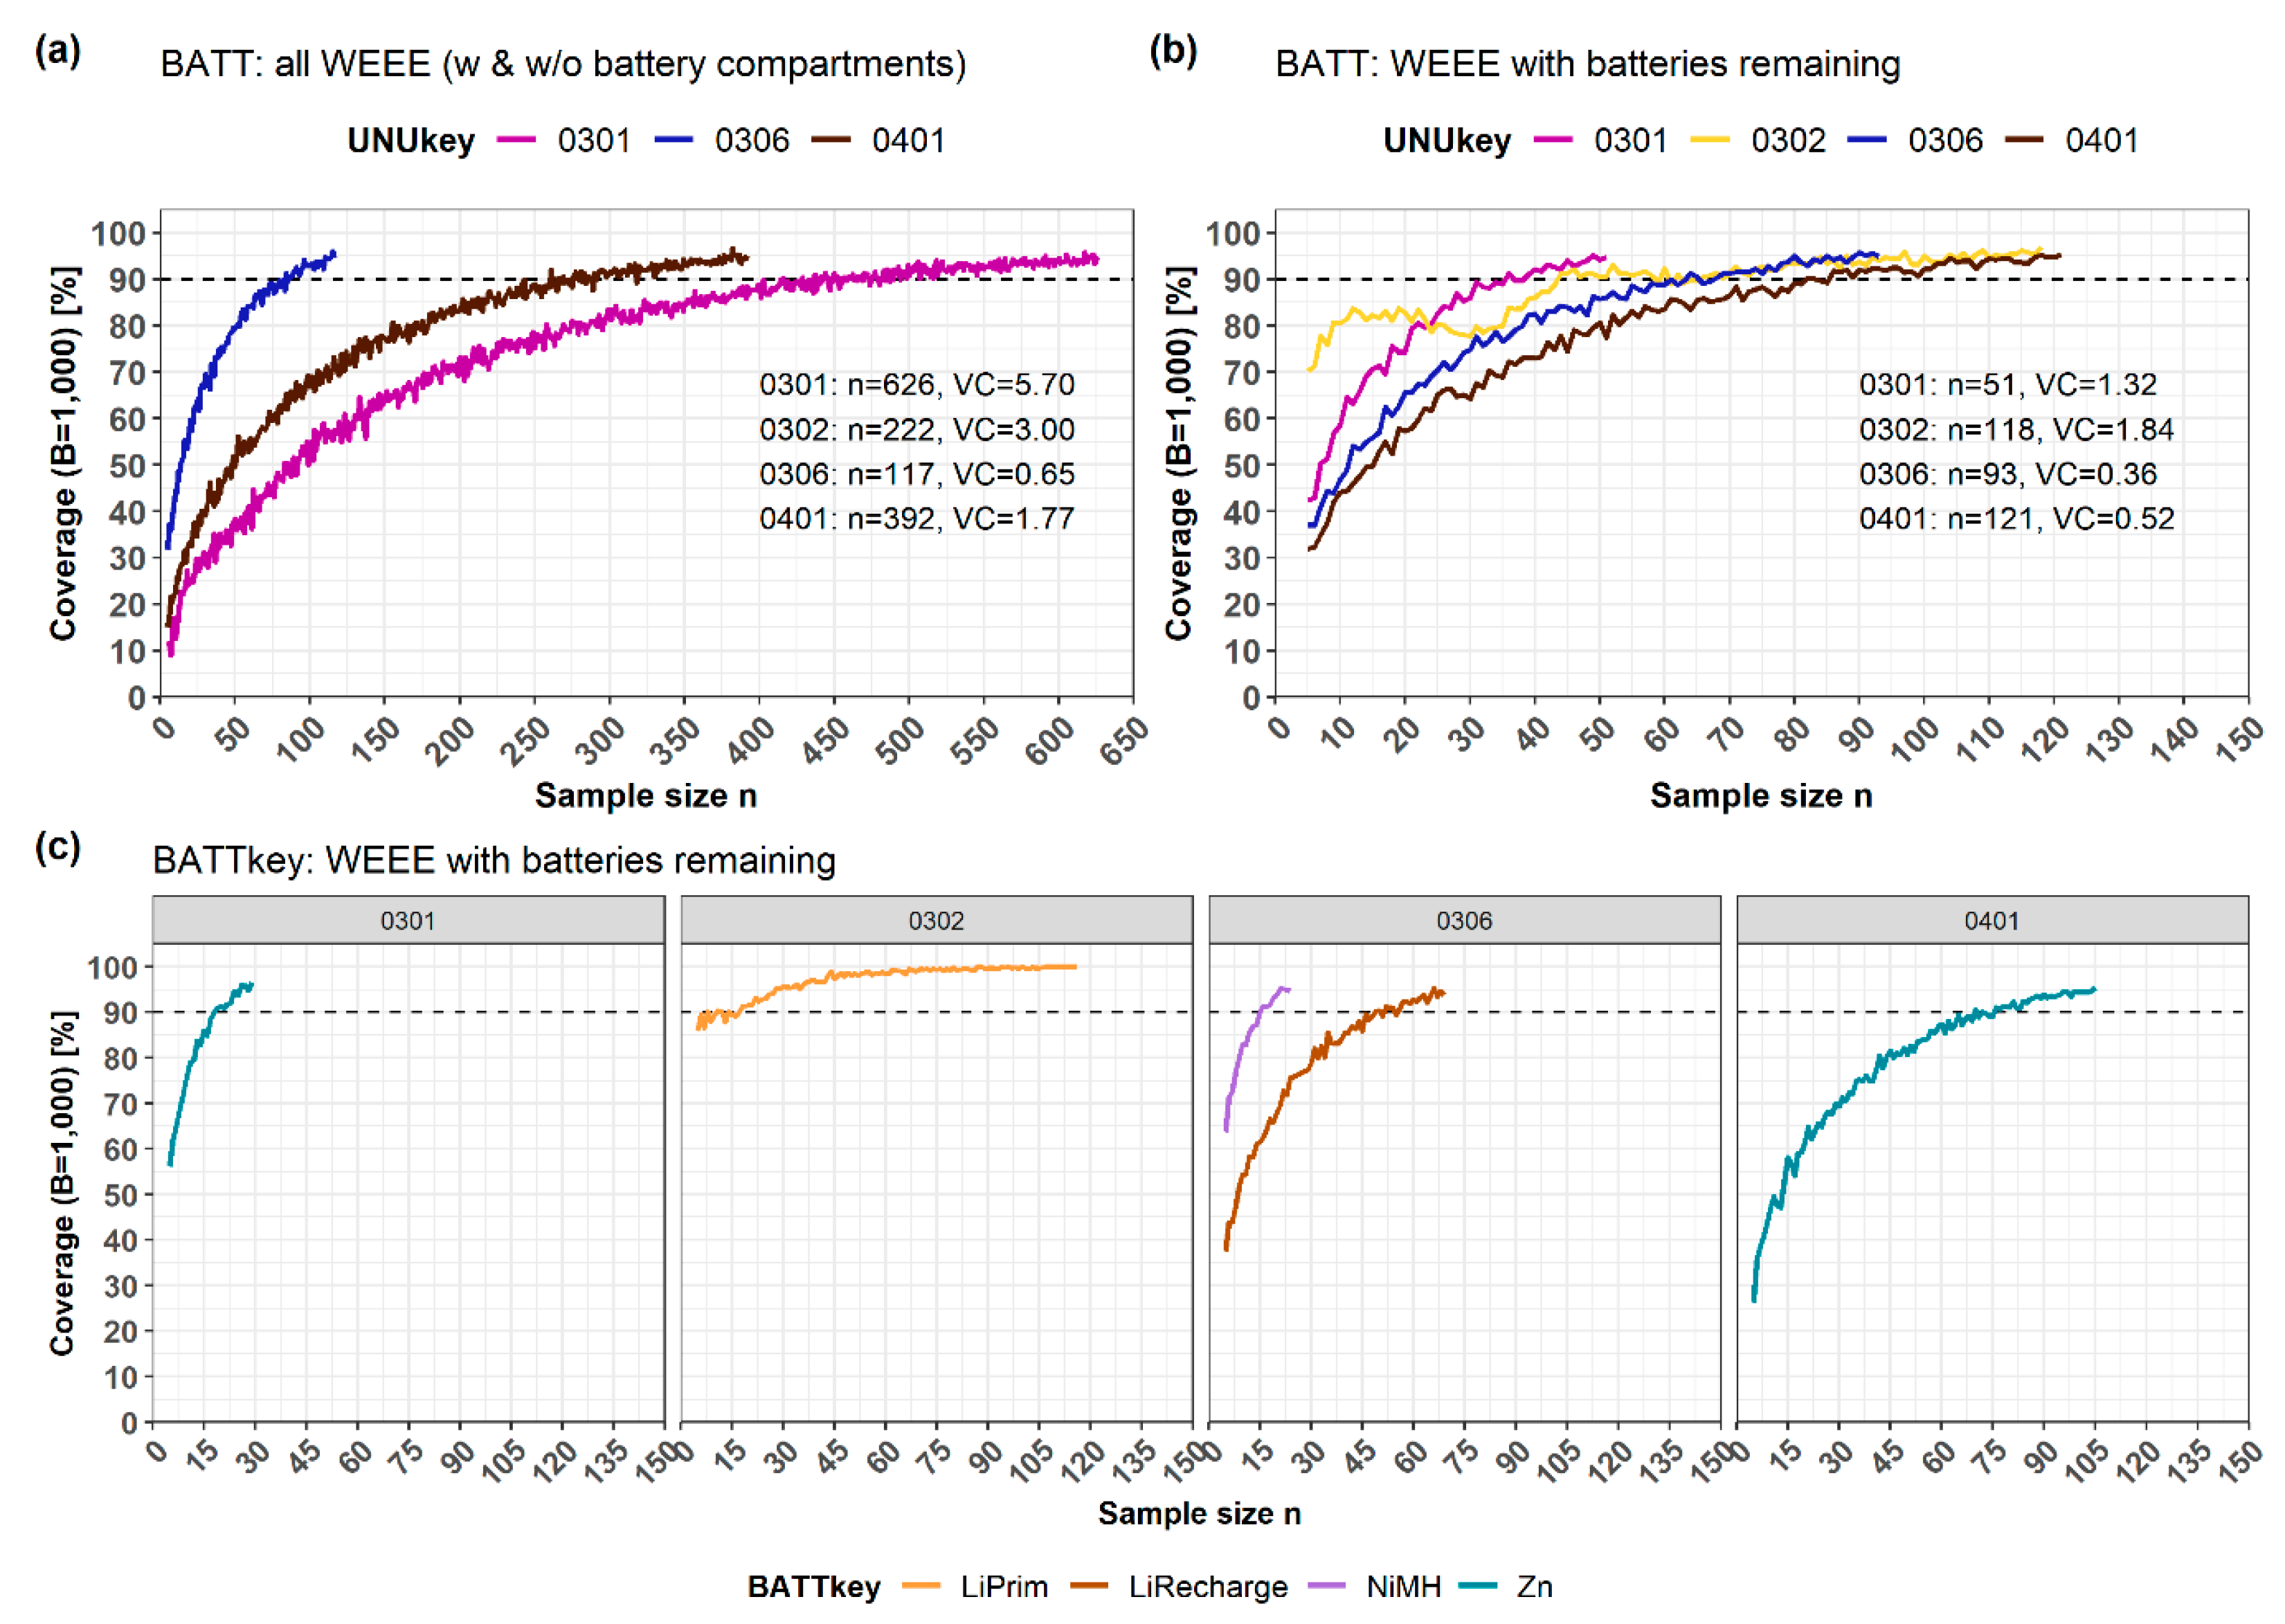
3.4. Minimum Sample Size to Determine Battery Mass Shares in WEEE

Investigations on distribution patterns of the BMS for different batteries and WEEE have shown that, in most cases, no normal distribution can be assumed for the data. The inherent variation of the original data makes it challenging to define MSS with statistical approaches applicable for future investigations. Hence, the influence of inaccurately assumed distribution patterns on the calculation of MSS must be considered to derive recommendations. Therefore, two approaches were compared: a PA and an NPA. For the PA, a normal distribution is assumed using the coefficient of variation of the original data set (VC) and the bootstrap distribution (VC*) in Equation (2). The NPA is based on bootstrapping with an increasing number of samples drawn from the original data set while testing iteratively whether each bootstrap mean lies within the bootstrap 95% CI*, which was simulated with the initial number of sample in the data set (compare Figure 6e,f).
The approaches are demonstrated on the example of UNUkeys 0301 (small IT), 0302 (Desktop PCs), 0306 (mobile phones), and 0401 (small consumer electronics), all of which have at least 15 data points to generate reasonable simulation results.
Table 2 compares the NPA and the two PA showing the results of the original (VC) and bootstrap variation coefficient (VC*) for PA. For each UNUkey, the results of the battery mass shares are shown without consideration (BATT) and with consideration of the BATTkey. BATT shows stronger deviations resulting in higher MSS. The VC is high for many UNUkeys because the underlying data are not normally distributed (see the section on product-specific battery characteristics). Consequently, the highest MSS are calculated for the PA(VC), which is the methodology of the SWA tool [40]. Table 2 shows that except for 0306 BATT, 0306 LiRecharge, and 0401 BATT and Zn, the sample size was too small.
The result of the bootstrap simulation is a more precise data distribution characterized by smaller VC. If this VC* is used in the PA, the MSS is consequently reduced compared to PA(VC). Besides, bootstrap simulation with high repetitions (B) can produce very narrow distributions, resulting in very small MSS. However, the advantages of bootstrapping for improving accuracy and precision often lead to implausible results when using PA. In these cases, too small VC are calculated, resulting in sample sizes of one to two devices (see Table 2, column PA(VC*)).
The explanations above have shown that a general assumption of normally distributed data in the calculation of the MSS is both biased and leads to very high MSS. Regardless of the classification used, distribution functions can only be validly determined if the sample size is sufficient. Since extensive sampling in waste management is economically critical and organizationally complex, we have tried to determine MSS using an alternative approach. This NPA is independent of large data sets or certain distribution assumptions.
By simulating an iterative sampling with an increasing number of samples (n), we approached the confidence interval of the population. The results of selected UNUkeys and BATTkeys are shown in Figure 7. With a sufficient number of samples n the graph should asymptotically approach 100%, which would correspond to complete coverage of all sub-samples within the 95% CI*. A coverage of 90% means that the MSS is reached for 900 of 1000 sub-samples within the 95% CI*.
Figure 7a–c illustrates the extent to which a specification of the sampling aim and battery type influences the MSS. Figure 7a shows the NPA results for all devices of one UNUkey, regardless of whether the device had a battery compartment or a battery. The intersection of the graphs with 90% coverage, representing the MSS, is noted in Table 2 as NPA. Depending on the proportion of devices with a battery compartment (see Figure 2), the total number of devices is correspondingly larger than in Figure 7b. As a result, a high proportion of devices without a battery compartment (BMS is zero) leads to a higher MSS, as it influences the location and shape of the simulated distribution function and, thus, the 95% CI*. For example, the difference between the MSS of 0306 in Figure 7a,b is small, whereas 0306 (90% without batteries) and 0401 (70% without batteries) show significant differences. Consequently, the MSS decreases if devices with a battery compartment are separated beforehand (Figure 7b).
As shown in the section on bootstrapping, specifying the battery type increases the accuracy and precision of the result. For example, simulating the data at BATTkey level for 0306 (see Figure 6) shows that more distinct distributions are generated (Figure 6f). As a result, the sub-sample means of the NPA approach are more often within the defined range of the 95% CI*, which increases the coverage even at low sample numbers and reduces the MSS compared to Figure 7a,b. Furthermore, this example demonstrates the purpose of considering additional stratification variables (here BATTkey) for sampling. In this case, the age of WEEE implies the installation of older NiMH or newer LiRecharge batteries. With the ongoing technology change towards LiRecharge, the density distribution in Figure 6c will shift to the left and approach the density distribution of LiRecharge (Figure 6f). Without consideration of relevant stratification variables, a new determination of the MSS is, therefore, inevitable to avoid biased results. One possibility to identify these stratification variables is a comprehensive recycling-oriented characterization.
The comparison of all three approaches PA(VC), PA(VC*), and NPA illustrates the challenges in the determination of MSS using statistical approaches. A fundamental problem for the PA is the use of VC under the assumption of normal distribution. The heterogeneous composition of devices and device groups in the waste stream and the changing use of battery systems due to technological change or substance bans cause constant changes resulting in high variabilities. The consequence of these rapid changes can be very high or low WEEE and battery masses in the sample, which lead to extreme values for BMS, increased data variation within a UNUkey, and consequently biased results of PA.
The example of lithium primary batteries in desktop PCs (0302) shows that both PA(VC*) and NPA calculate a very small MSS. Bootstrapping increases the precision of the results, but can result in too small VC* for the application of PA, as it will result in implausible MSS. Consequently, MSS for PA is smaller for VC* if the acceptable error is kept constant. However, the use of VC is prone to be biased, since not only the original data, but also the bootstrap data (VC*) is not always normally distributed. Even with large amounts of data, a normal distribution cannot automatically be assumed. PA(VC*) is not a preferred method because the variance of the bootstrap simulation is very small for many repetitions (B = 5000), and the coefficient of variation leads to much too low MSS. This problem is overcome in most cases with the NPA using 95% CI*.
However, the NPA method also has its limitations. For instance, the example 0302 additionally shows that a very small and specific BMS results in a very narrow 95% CI* (see Table 2). The consequence is that the values from the bootstrap simulation are not within the 95% CI*, especially if there are zero values (Figure 7a) in the original data set. As a result, 0302 is not shown in Figure 7a, as all bootstrap results are outside the confidence range. This problem can only be overcome by adequate specification, in this case, by determining LiPrim batteries.
The PA was shown to be highly biased for estimating MSS due to indistinct data distribution patterns or the wrong assumption of normally distributed data. Bootstrap simulation can help to generate both more precise and accurate sampling results, which helps to approximate MSS and thus reduces the economic costs of sampling. If only a few WEEE devices are sampled (at least 15), and the data distribution pattern is indistinct or unknown, the NPA presented here shows advantages in comparison to PA. In contrast to PA, extreme values or outliers have less influence on the confidence interval when using NPA. Since the occurrence probabilities of the original values are decisive in bootstrap simulation, the most frequent values will have a more considerable influence on the result. For example, single extreme values caused by, e.g., new technology trends, like the change to LiRecharge batteries in tools, would not have a significant influence on the variation of the data when NPA is applied. Nevertheless, the number of data in the pilot data set also determines the validity of the statements for the NPA, which increases with an increasing number of sample values.

3.5. Sampling Recommendation

The shortcomings of current sampling methods are: (1) the lack of harmonization of the WEEE and BATT nomenclature at the product level and (2) the aggregated statistical description of the results, mostly based on normal distribution. Thus, data-driven optimization of sampling results, e.g., through merging of data from different sources and data-driven simulations, such as bootstrapping and the NPA, is not achievable. These quasi cost-neutral improvements of sampling results are not yet used.
Therefore, we recommend the following procedural adjustments for future investigations, which are not only applicable to the case of built-in batteries in WEEE, but also to other objects of sampling investigations. Firstly, standardized codes for WEEE (UNUkeys) and batteries (BATTkeys) should be used, enabling the exchange and comparison of the collected data, e.g., by supplementing existing guidelines such as the SWA-tool [40]. Secondly, the data should be recorded according to a standardized sampling protocols [52]. Thirdly, instead of describing the results of large individual samples under the assumption of normal distribution, several smaller samples should be taken, the results of which should be described with more robust descriptors (median, MAD, 95% CI). Such harmonized data will provide the necessary a priori knowledge for future investigations, which should be made publicly available together with other data about the urban mine [81,82,83] in an urban mine knowledge database [84]. Fourthly, the raw data obtained by sampling can be combined with data from public sources, such as statistics, monitoring reports, scientific publications. These combined datasets can be used to calculate and adjust the MSS of future investigations using the NPA.

4. Conclusions

Methodically coherent procedures for the determination of battery characteristics in WEEE products as well as a shared database providing a priori knowledge about product characteristics are missing or are insufficient, which makes it challenging to derive recommendations on sampling procedures and MSS.
The applied harmonized nomenclature using UNUkeys for WEEE and batteries proved to extend the possibilities for data stratification and evaluation. The results show that specific battery types (BATTkeys) were frequently identified in certain UNUkeys and subKeys. This concentration of BATTkeys in UNUkeys can simplify battery identification since batteries remain in two-thirds of WEEE with a battery compartment when discarded. Furthermore, it could be observed that secondary batteries are usually installed in fewer groups of devices, whereas primary batteries were found in many different devices with strongly varying mass shares. Product-specific values for mass and mass share could not be ascertained, which impedes a more precise assessment and leads to increased sample sizes of built-in batteries in WEEE.
Concerning the statistical description of sampling results, we showed that the assumption of normally or lognormally distributed data proved to be rarely valid to characterize these samples. Using mean and SD or VC for the statistical description of the data leads to biased results. In addition, more robust descriptors like median and MAD or data-driven simulation (bootstrapping) are recommended to improve the quality and representativeness of sampling results.
With regard to the approximation of the MSS, we conclude that the PA is strongly affected by the assumed distribution pattern as well as the number of samples. Bootstrapping was shown to be favorable to generate more accurate results on battery characteristics in the case of unknown or inconclusive sample distributions and fewer data points. Moreover, bootstrapping in combination with recycling-oriented product characterization, can be used to perform the NPA, which provides a more robust approach to approximate the MSS. However, for both approaches, the future availability of harmonized data is required and defines the validity of the results.
Consequently, recyclers, researchers, and policymakers should focus on a common harmonized method to generate and collate consistent data, which is crucial for an urban mine knowledge database. The product count procedure enables to (1) identify (safety) relevant products in WEEE, (2) set depollution targets as defined by CENELEC [24], (3) lower the labor costs for sampling due to simulation-based optimization of results and MSS, (4) display trends to plan recycling strategies, and (5) derive more valid results on waste characteristics to improve resource efficiency in WEEE and waste battery management.

Supplementary Materials

The following are available online at https://0-www-mdpi-com.brum.beds.ac.uk/2313-4321/5/3/19/s1, Figure S1: Proportion of WEEE devices (UNU subKey) with and without battery compartment, Figure S2: Mass share of WEEE devices (UNU subKey) with and without battery compartment, Figure S3: Occurrence and count of battery types (BATTkeys) in subKeys, Figure S4: Mass (a) and mass share (b) of batteries remained in WEEE classified as subKeys and distinguished by their chemical system (BATTkey), Table S1: Number and mass of WEEE and BATT sampled, Table S2: R packages, Table S3: Number of electronic devices (UNUkey level) with or without battery compartment and share of batteries remained in a product, Table S4: Descriptive statistics for mass of all WEEE investigated differentiated in UNUkeys, Table S5: Descriptive statistics for mass of all WEEE investigated differentiated in UNU subKeys, Table S6: Descriptive statistics for mass of batteries in WEEE differentiated in UNUkeys, Table S7: Descriptive statistics for mass of batteries in WEEE differentiated in UNUkeys and BATTkeys, Table S8: Descriptive statistics for battery mass share of WEEE differentiated in UNUkeys, Table S9: Descriptive statistics for battery mass share of WEEE differentiated in subKeys, Table S10: Descriptive statistics for battery mass share of batteries in WEEE differentiated in UNUkeys and BATTkeys, Table S11: Descriptive statistics for battery mass share of batteries in WEEE differentiated in subKeys and BATTkeys, Table S12: Descriptive statistics for battery mass share of batteries in WEEE differentiated in UNUkeys, Table S13: Descriptive statistics for battery mass share of batteries in WEEE differentiated in subKeys, Table S14: Descriptive statistics for battery mass share of batteries in WEEE differentiated in UNUkeys and BATTkeys. Table S15: Descriptive statistics for battery mass share of batteries in WEEE differentiated in subKeys and BATTkeys, Table S16: UNUkey classification and allocation to WEEE categories EU-10. The pilot dataset and R code are also available at DepositOnce: http://0-dx-doi-org.brum.beds.ac.uk/10.14279/depositonce-9338 (accessed on 13 July 2020).

Author Contributions

Conceptualization, P.M.M., N.K., O.M., K.S., and V.S.R.; methodology, P.M.M., N.K., O.M., M.R., V.S.R.; software, P.M.M., O.M. and M.R.; validation, P.M.M., O.M., and N.K.; formal analysis, P.M.M., M.R.; investigation, P.M.M.; resources, P.M.M.; data curation, P.M.M.; writing—original draft preparation, P.M.M.; writing—review and editing, P.M.M., N.K., O.M., K.S., M.R. and V.S.R.; visualization, P.M.M.; supervision, V.S.R.; project administration, V.S.R.; funding acquisition, V.S.R. All authors have read and agreed to the published version of the manuscript.

Funding

This research was funded by the European Union’s Horizon 2020 research and innovation program (grant agreement No. 641999) as part of the project ‘ProSUM—Prospecting Secondary raw materials in the Urban mine and Mining waste’.

Acknowledgments

The authors would like to thank Alice Bizouard from eco-systèmes (France) as well as Evelien de Ridder and Lorenzo Glorie from the Recycling department of Recupel (Belgium) for their active support during the sampling. We acknowledge support by the German Research Foundation and the Open Access Publication Fund of Technische Universität Berlin.

Conflicts of Interest

The authors declare no conflict of interest. The study was designed in collaboration with the project partners. The funders had no role in the design of the study; in the collection, analyses, or interpretation of data; in the writing of the manuscript, or in the decision to publish the results.

Appendix A

Table A1. Battery mass and mass share differentiated by BATTkey.
BATTkeynLiPrimLiRechargeNiCdNiMHPbZnUnspecified
195135441301325716
Mass
(BM)
m ¯ [g]3.9743106913003847
SD [g]3.2120440110140066100
VC [-]0.81.61.41.71.11.72.2
m ˜ [g]3.0236726800237.0
MAD [g] 0.0748.17121430177.4
95% CI [g; g][1.9; 8.8][8.9; 430][14; 1500][10; 490][15; 4300][2.3; 150][2; 300]
SW/SWlog [-]0/00/00/00/00/00/00/0
S/Slog [-]5.4/1.92.2/0.992.1/0.283.0/0.931.3/−1.18.4/−0.272.7/0.7
K/Klog42/4.73.5/1.24.5/−1.58.4/0.760.59/0.04692/1.66.3/−0.87
Mass
share
(BMS)
x ¯ [%]2.3202319461812
SD [%]4.39.01612191514
VC [-]1.900.460.660.610.420.761.1
x ˜ [%]0.04520221848158.4
MAD [%]0.0317.21411121112
95% CI [%; %][0.02; 12][1.9; 43][0.5; 46][0.65; 45][8.8; 74][2.0; 53][0.096; 43]
SW/SWlog 0/00/00/00/00.28/00/00/0.12
S/Slog1.8/0.920.83/−4.01.6/−2.80.72/−2.4−0.58/−1.51.4/−0.691.1/−0.76
K/Klog1.5/−0.872.9/214.9/8.7−0.083/8.2−0.4/1.12.2/0.270.43/−0.57
Occurrence inUNUkeys191611157169
subKeys2327152482910
n: number of observations, m ¯ / x ¯ : mean, SD: standard deviation, VC: coefficient of variation, m ˜ / x ˜ : median, MAD: median absolute deviation, 95% CI: confidence interval [2.5th quantile, 97.5th quantile], SW: p-value of Shapiro-Wilk test (normally distributed if p > 0.05, highlighted in bold), S: skewness, K: kurtosis; log(subscripted): respective values after log-transformation. Results are rounded to two significant digits.
Table A2. Statistics on battery mass and mass share, differentiated by UNUkey.
UNUkeynBattery Mass
m ¯ [g]SD [g]VC [-] m ˜ [g]MAD [g]95% CI
02012326281.12312[2; 98]
02021339350.894664[2.9; 100]
0204293602400.67260260[80; 820]
020548269.60.36236.2[14; 47]
0301511206905.71216[1.1; 220]
03021183.43.20.9430[2.8; 6.5]
0303292101900.92250300[2.1; 480]
03055233541.72215[11; 84]
03069329180.61215.1[15; 77]
040112122140.662216[3; 48]
040229731602.22412[2.9; 440]
04037717313721[10; 200]
04061836631.81811[2.7; 200]
050116791201.63339[3; 380]
05061524071033227[3; 1900]
0601324705601.2340460[12; 2000]
07014238250.663424[3; 90]
07025336.20.19354.1[24; 38]
090131101117.90[2.6; 46]
all750762703.62123[2.1; 546]
Battery mass share
UNUkeyn x ¯ [%]SD [%]VC [-] x ˜ [%]MAD [%]95% CI
02012312120.948.76.5[1; 38]
0202134.56.11.42.33.1[0.15; 18]
02042926140.54209.4[11; 54]
020548197.80.41188.4[7.9; 38]
03015111141.35.25[0.88; 56]
03021180.0450.0821.80.0310.009[0.019; 0.098]
0303298.77.60.87136.3[0.061; 20]
03055216100.66117.2[3; 38]
030693259.10.36235.4[14; 47]
0401121199.70.52179.6[5; 41]
04022917130.78137.7[2.1; 57]
0403719241.33.53.1[1.5; 60]
0406189.98.50.856.97.8[0.27; 28]
05011634220.643819[2.7; 69]
05061525160.642318[3.1; 54]
06013226190.742216[0.14; 79]
07014215140.92119.9[0.23; 38]
07025199.40.49251.8[8.3; 26]
090131115.60.51120[0.6; 23]
all75016140.891314[0.02; 48]
n: number of observations, x ¯ : mean, SD: standard deviation, VC: coefficient of variation, x ˜ : median, MAD: median absolute deviation, 95% CI: confidence interval [2.5th quantile, 97.5th quantile]. Results are rounded to two significant digits.

References

  1. European Commission. A New Circular Economy Action Plan: For a Cleaner and More Competitive Europe. Available online: https://eur-lex.europa.eu/resource.html?uri=cellar:9903b325-6388-11ea-b735-01aa75ed71a1.0017.02/DOC_1&format=PDF (accessed on 28 July 2020).
  2. Huisman, J.; Leroy, P.; Tertre, F.; Ljunggren Söderman, M.; Chancerel, P.; Cassard, D.; Løvik, A.N.; Wäger, P.; Kushnir, D.; Rotter, V.S.; et al. FINAL REPORT—ProSUM Project. Prospecting Secondary Raw Materials in the Urban Mine and Mining Wastes; ProSUM: Brussels, Belgium, 2017. [Google Scholar]
  3. EPBA. The Collection of Waste Portable Batteries in Europe in View of the Achievability of the Collection Targets Set by Batteries Directive 2006/66/EC; European Portable Battery Association: Brussels, Belgium, 2014. [Google Scholar]
  4. Dornbusch, H.-J.; Hannes, L.; Santjer, M.; Böhm, C.; Wüst, S.; Zwisele, B.; Kern, M.; Siepenkothen, H.-J.; Kanthak, M. Vergleichende Analyse von Siedlungsrestabfällen aus Repräsentativen Regionen in Deutschland zur Bestimmung des Anteils an Problemstoffen und Verwertbaren Materialien. Abschlussbericht; 113/2020. 2020. Available online: https://www.umweltbundesamt.de/sites/default/files/medien/479/publikationen/texte_113-2020_analyse_von_siedlungsrestabfaellen_abschlussbericht.pdf (accessed on 28 July 2020).
  5. AWV Ostthüringen. Abfallwirtschaftskonzept Für Den Abfallwirtschaftszweckverband Ostthüringen, 2015. Available online: https://www.awv-ot.de/files/1517CB8AD7E/VV-0615%20Abfallwirtschaftskonzept_Beschluss.pdf (accessed on 6 March 2019).
  6. Berthold, E.; Hoeß, P. Untersuchung des Restabfalls aus Haushalten im Landkreis Schweinfurt (Phasing-Out-Gebiet). 2007. Available online: https://www.abfallberatung-unterfranken.de/fachbeitraege/24/hausmuellanalyse_lkr_sw_07.pdf (accessed on 6 March 2019).
  7. Ministerium für Wirtschaft, Klimaschutz, Energie und Landesplanung Reinland-Pfalz. Abfallwirtschaftsprofile der öffentlich-rechtlichen Entsorgungsträger Rheinland-Pfalz 2014. 2015. Available online: https://mueef.rlp.de/fileadmin/mwkel/Abteilung_5/Kreislaufwirtschaft/Abfallbilanz/Abfallwirtschaftsprofile_2014_mit_Sicherheit_komprimiert.pdf (accessed on 6 March 2019).
  8. Sabrowski, R. Abfallwirtschaftskonzept Stadt Weimar. 2011. Available online: https://stadt.weimar.de/fileadmin/redaktion/Dokumente/stadtrat/beschluesse/2011/s23/2011_050_-_Beschluss_Abfallwirtschaftskonzept_der_Stadt_Weimar_2011_-_2015_01.pdf (accessed on 6 March 2019).
  9. Sabrowski, R. Stadt Leipzig Restabfallanalyse 2013. 2013. Available online: https://www.stadtreinigung-leipzig.de/assets/files/PDF/Flyer/EB-RAA%20SRL%202013.pdf (accessed on 6 March 2019).
  10. Sabrowski, R. Abfallwirtschaftskonzept Landeshauptstadt Wiesbaden. 2015. Available online: https://www.elw.de/fileadmin/Redakteur/PDF/Abfallwirtschaftskonzept_2015_Langfassung.pdf (accessed on 6 March 2019).
  11. Sabrowski, R. Hausmüllanalyse der Stadt Jena. 2016. Available online: https://www.jena.de/fm/1727/Endbericht%20HMA%202015_2016-neu.pdf (accessed on 6 March 2019).
  12. Meyer, S.; Hertel, M.; Wertstoff- und Bioabfallpotenzial im Hausmüll der Stadt Regensburg. Hausmüllsortier-Analysen und Auswirkungen bzgl. Biomüll. 2016. Available online: https://www.regensburg.de/fm/121/wertstoffpotenzialbericht.pdf (accessed on 6 March 2019).
  13. Bigum, M.; Petersen, C.; Christensen, T.H.; Scheutz, C. WEEE and portable batteries in residual household waste: Quantification and characterisation of misplaced waste. Waste Manag. 2013, 33, 2372–2380. [Google Scholar] [CrossRef] [PubMed]
  14. Friege, H.; Reutter, L.; Gnutzmann, N.; Klöffer, A.; Mohrlok, M.; de La Sauce, A.; Wons, W.; Kross, S. An Examination of Batteries Remaining in Used Electric and Electronic Devices: Insights Gained from a Transdisciplinary Project. Recycling 2016, 1, 321–327. [Google Scholar] [CrossRef] [Green Version]
  15. Friege, H.; Zeschmar-Lahl, B.; Borgmann, A. Managing Cd Containing Waste—Caught by the Past, the Circular Economy Needs New Answers. Recycling 2018, 3, 18. [Google Scholar] [CrossRef] [Green Version]
  16. Hobohm, J. Ressourcenoptimierte Erfassung von Elektro- und Elektronikaltgeräten. Dissertation; Technische Universität Hamburg-Harburg, Verlag Abfall aktuell der Ingenieurgruppe RUK GmbH: Stuttgart, Germany, 2017; ISBN 978-3-9817572-6-2. [Google Scholar]
  17. Hobohm, J.; Sven Wasserberg; Kerstin Kuchta; Clemens Kuebart. Evaluierung der Sammlung von Elektrokleingeräten über Depotcontainern der Stadtreinigung Hamburg. Müll und Abfall 2016, 2016, 83–89. [Google Scholar]
  18. Savi, D.; Kasser, U.; Ott, T. Depollution benchmarks for capacitors, batteries and printed wiring boards from waste electrical and electronic equipment (WEEE). Waste Manag. 2013, 33, 2737–2743. [Google Scholar] [CrossRef]
  19. Sommer, P.; Rotter, V.S.; Ueberschaar, M. Battery related cobalt and REE flows in WEEE treatment. Waste Manag. 2015, 45, 298–305. [Google Scholar] [CrossRef]
  20. Terazono, A.; Oguchi, M.; Iino, S.; Mogi, S. Battery collection in municipal waste management in Japan: Challenges for hazardous substance control and safety. Waste Manag. 2015, 39, 246–257. [Google Scholar] [CrossRef]
  21. Bund/Länder-Arbeitsgemeinschaft Abfall. Anforderungen an die Entsorgung von Elektro- und Elektronikaltgeräten. Merkblatt 31 A. 2017. Available online: https://www.laga-online.de/documents/m-31-a_1517834714.pdf (accessed on 6 March 2019).
  22. WEEE Directive 2012/19/EU. Directive 2012/19/EU on Waste Electrical and Electronic Equipment (WEEE) (Recast); European Parliament and Council, Official Journal of European Union: Brussels, Belgium, 2012; pp. 38–71. [Google Scholar]
  23. Battery Directive 2006/66/EC. Directive 2006/66/EC on Batteries and Accumulators and Waste Batteries and Accumulators and Repealing Directive 91/157/EEC; European Parliament and Council, Official Journal of European Union: Brussels, Belgium, 2006. [Google Scholar]
  24. CENELEC. Collection, Logistics & Treatment Requirements for WEEE. Part 3-1: Specification for de-Pollution—General; CEN-CENELEC Management Centre: Brussels, Belgium, 2015. [Google Scholar]
  25. Chancerel, P.; Rotter, V.S. Recycling-oriented characterization of small waste electrical and electronic equipment. Waste Manag. 2009, 29, 2336–2352. [Google Scholar] [CrossRef]
  26. Dańczak, A.; Chojnacka, I.; Matuska, S.; Marcola, K.; Leśniewicz, A.; Wełna, M.; Żak, A.; Adamski, Z.; Rycerz, L. The Recycling-Oriented Material Characterization of Hard Disk Drives with Special Emphasis on NdFeB Magnets; Physicochemical Problems of Mineral Processing: Wroclaw, Poland, 2018; ISSN 2084-4735. [Google Scholar] [CrossRef]
  27. Ebin, B.; Petranikova, M.; Ekberg, C. Physical separation, mechanical enrichment and recycling-oriented characterization of spent NiMH batteries. J. Mater. Cycles Waste Manag. 2018, 20, 2018–2027. [Google Scholar] [CrossRef] [Green Version]
  28. Ueberschaar, M.; Jalalpoor, D.D.; Korf, N.; Rotter, V.S. Potentials and Barriers for Tantalum Recovery from Waste Electric and Electronic Equipment. J. Ind. Ecol. 2017, 21, 700–714. [Google Scholar] [CrossRef]
  29. Ueberschaar, M.; Rotter, V.S. Enabling the recycling of rare earth elements through product design and trend analyses of hard disk drives. J. Mater. Cycles Waste Manag. 2015, 17, 266–281. [Google Scholar] [CrossRef]
  30. Wilcox, R.R. Fundamentals of Modern Statistical Methods. Substantially Improving Power and Accuracy; Springer: New York, NY, USA, 2001; ISBN 978-1-4419-2891-7. [Google Scholar]
  31. Sächsisches Landesamt für Umwelt, Landwirtschaft und Geologie. Richtlinie zur einheitlichen Abfallanalytik in Sachsen. Sächsische Sortierrichtlinie 2014; mit Ergänzung zur Identifikation von Lebensmittelabfällen: Dresden, Germany, 2016; Available online: https://publikationen.sachsen.de/bdb/ (accessed on 6 March 2019).
  32. Martinho, G.; Pires, A.; Saraiva, L.; Ribeiro, R. Composition of plastics from waste electrical and electronic equipment (WEEE) by direct sampling. Waste Manag. 2012, 32, 1213–1217. [Google Scholar] [CrossRef] [PubMed]
  33. Pohlmann, M.; Windisch, M.; Eisenblätter, R.; Zwisele, B.; Lichtenvort, K.; Beyer, T.; Kanthak, M.; Dornbusch, H.; Oelgemöller, D. Richtlinie für die Durchführung von Untersuchungen zur Bestimmung der Menge und Zusammensetzung Fester Siedlungsabfälle im Land Brandenburg. 1998. Available online: https://lfu.brandenburg.de/cms/media.php/lbm1.a.3310.de/fb_34.pdf (accessed on 6 March 2019).
  34. Rotter, V.S.; Chancerel, P.; Schill, W.P. Practicalities of individual producer responsibility under the WEEE directive: Experiences in Germany. Waste Manag. Res. 2011, 29, 931–944. [Google Scholar] [CrossRef] [PubMed]
  35. Länderarbeitsgemeinschaft Abfall. Guideline for the Procedure for Physical, Chemical and Biological Investigations in Connection with the Recycling/Disposal of Waste to the Guideline for Sampling (LAGA PN98). Notice M32. German Version; Mitteilungen der Länderarbeitsgemeinschaft Abfall (LAGA). 2001. Available online: https://www.laga-online.de/Publikationen-50-Mitteilungen.html (accessed on 25 June 2019).
  36. VKF. Merkblatt M 4 des Verbandes Kommunaler Fuhrpark- und Stadtreinigungsbetriebe (VKF) und der Arbeitsgemeinschaft für Kommunale Abfallwirtschaft (AkA): 10 /1963 in B. Jäger: Bestimmung der Zusammensetzung Fester Abfälle; Müll-Handbuch, Erich Schmidt-Verlag: Berlin, Germany, 1963. [Google Scholar]
  37. Normenausschuss Wasserwesen (NAW) im DIN. Characterization of Solids—Sampling of Solid and Semi-Solid Materials—Part 1: Guidance for the Segmental Sampling of Stockpiles of Unknown Composite; Beuth Verlag GmbH: Berlin, Germany, 2014; ICS 13.030.10 (DIN 19698-1). [Google Scholar]
  38. Morf, L.S.; Taverna, R. Metallische und Nichtmetallische Stoffe im Elektronikschrott. Stoffflussanalyse. 2004. Available online: https://www.bafu.admin.ch/bafu/de/home/themen/abfall/publikationen-studien/publikationen/metallisch-nichtmetallisch-elektronikschrott.html (accessed on 13 August 2020).
  39. Inglezakis, V.; Dvorsak, S.; Varga, J.; Venetis, C.; Zorpas, A.; Elaiopoulos, K.; Ardeleanu, N.; Ilieva, L.; Moustakas, K.; Loizidou, M.; et al. Municipal Solid Waste Composition and Physicochemical Characteristics in Romania And Bulgaria. IJCEES 2012, 3, 64–73. [Google Scholar]
  40. European Commission. Methodology for the Analysis of Solid Waste (SWA-Tool). SWA-Tool, Development of a Methodological Tool to Enhance the Precision & Comparability of Solid Waste Analysis Data. 2004. Available online: www.swa-tool.net (accessed on 6 March 2019).
  41. Bayerisches Landesamt für Umwelt. Restmüllzusammensetzung in Phasing-Out-Gebieten. (EU Ziel-2-Programm Bayern) Abschöpfbares Wertstoffpotenzial als Funktion abfallwirtschftlicher Rahmenbedingungen; Schlussbericht, Eigendruck Bayer, Bayerisches Landesamt für Umwelt: Augsburg, Germany, 2007. [Google Scholar]
  42. Bilitewski, B.; Chancerel, P.; Groß, F.; Janz, A.; Rotter, V.S.; Schill, W.-P.; Wagner, J. Rechtliche und fachliche Grundlagen zum ElektroG: Teil 3: Anforderungen an die Ermittlung des individuellen Anteils an Altgeräten an der gesamten Altgerätemenge pro Geräteart durch Sortierung oder nach wissenschaftlich anerkannten statistischen Methoden. 2008. Available online: https://www.umweltbundesamt.de/sites/default/files/medien/publikation/long/3463.pdf (accessed on 6 May 2018).
  43. Dahlén, L.; Lagerkvist, A. Methods for household waste composition studies. Waste Manag. 2008, 28, 1100–1112. [Google Scholar] [CrossRef]
  44. Normenausschuss Bergbau (FABERG) im DIN. Normenausschuss Materialprüfung (NMP) im DIN. Testing of Solid Fuels—Sampling and Sample Preparation; Part 2: Sampling; Beuth Verlag GmbH: Berlin, Germany, 2006; ICS 75.160.10. [Google Scholar]
  45. Parfitt, J.; Griffiths, P.; Reid, T. Guidance on the Methodology for Waste Composition Analysis. For Local Authorities Commissioning Waste Composition Analysis of Municipal Waste, 2015. Available online: https://www.zerowastescotland.org.uk/sites/default/files/WCAMethodology_Jun15.pdf (accessed on 11 July 2018).
  46. Ma, W.; Hoffmann, G.; Schirmer, M.; Chen, G.; Rotter, V.S. Chlorine characterization and thermal behavior in MSW and RDF. J. Hazard. Mater. 2010, 178, 489–498. [Google Scholar] [CrossRef]
  47. Kern, M.; Siepenkothen, H.-J. Orientierende Resmüllanalyse Abfallzweckverband Südniedersachsen. September 2012; Witzenhausen-Institut für Abfall, Umwelt und Energie GmbH: Witzenhausen, Germany, 2012. [Google Scholar]
  48. Normenausschuss Wasserwesen (NAW) im DIN. Characterization of Waste—Sampling of Waste Materials —Framework for the Preparation and Application of a Sampling Plan; DIN EN 14899, Beuth Verlag GmbH: Berlin, Germany, 2006. [Google Scholar]
  49. Riber, C.; Rodushkin, I.; Spliid, H.; Christensen, T.H. Method for fractional solid-waste sampling and chemical analysis. Int. J. Environ. Anal. Chem. 2007, 87, 321–335. [Google Scholar] [CrossRef]
  50. R Core Team. R: A Language and Environment for Statistical Computing; R Foundation for Statistical Computing: Vienna, Austria, 2018. [Google Scholar]
  51. Meyer, D.; Dimitriadou, E.; Hornik, K.; Weingessel, A.; Leisch, F. e1071: Misc Functions of the Department of Statistics, Probability, R package version 1.7-1; TU Vienna: Vienna, Austria, 2019. [Google Scholar]
  52. Rotter, V.S.; Mählitz, P.M.; Chancerel, P.; Emmerich, J.; Habib, H.; Hallberg, A.; Huisman, J.; Korf, N.; Kushnir, D.; Løvik, A.N.; et al. ProSUM D4.4—Protocols for CRM Content in Waste Flows and Data Quality Assessment. 2017. Available online: http://www.prosumproject.eu/sites/default/files/Deliverable%204.4%20Protocols%20for%20CRM%20Content%20in%20Waste%20Flows%20%26%20Data%20Quality%20Assessment.pdf (accessed on 29 July 2020).
  53. Baldé, C.P.; Kuehr, R.; Blumenthal, K.; Gill, S.F.; Kern, M.; Micheli, P.; Magpantay, E.; Huisman, J. E-Waste Statistics. Guidelines on Classification, Reporting and Indicators; United Nations University, IAS–SCYCLE: Bonn, Germany, 2015. [Google Scholar]
  54. Baldé, C.P.; Wang, F.; Kuehr, R.; Huisman, J. The Global E-Waste Monitor 2014: Quantities, flows and resources; United Nations University, IAS-SCYCLE: Bonn, Germany, 2015. [Google Scholar]
  55. Baldé, C.P.; Forti, V.; Gray, V.; Kuehr, R.; Stegmann, P. Global-E-waste Monitor 2017: Quantities, Flows, and Resources; United Nations University (UNU): Bonn, Germany; International Telecommunication Union (ITU): Geneva, Switzerland; International Solid Waste Association (ISWA): Vienna, Austria, 2017; ISBN 978-92-808-9053-2. [Google Scholar]
  56. Ollion, L.; Anta, M.; Herreras, L.; Characterisation of Fires Caused by Batteries in WEEE. Survey Results from the WEEE Management Chain—Part A. 2020. Available online: https://www.euric-aisbl.eu/position-papers (accessed on 27 May 2020).
  57. RDocumentation. Mad: Median Absolute Deviation. Available online: https://www.rdocumentation.org/packages/stats/versions/3.6.2/topics/mad (accessed on 18 April 2020).
  58. Hedderich, J.; Sachs, L. Angewandte Statistik Methodensammlung Mit R, 16th ed.; Springer: Berlin, Germany, 2018; ISBN 978-3-662-56656-5. [Google Scholar]
  59. Yap, B.W.; Sim, C.H. Comparisons of various types of normality tests. J. Stat. Comput. Simul. 2011, 81, 2141–2155. [Google Scholar] [CrossRef]
  60. Edjabou, M.E.; Boldrin, A.; Astrup, T.F. Compositional analysis of seasonal variation in Danish residual household waste. Resour. Conserv. Recycl. 2018, 130, 70–79. [Google Scholar] [CrossRef] [Green Version]
  61. Efron, B. The Jackknife, the Bootstrap and Other Resampling Plans; 6. printing; Society for Industrial and applied mathematics: Philadelphia, PA, USA, 1994; ISBN 978-0-898711-79-0. [Google Scholar]
  62. Efron, B.; Tibshirani, R. Bootstrap Methods for Standard Errors, Confidence Intervals, and Other Measures of Statistical Accuracy. Stat. Sci. 1986, 1, 54–77. [Google Scholar] [CrossRef]
  63. Le Boedec, K. Reference interval estimation of small sample sizes: A methodologic comparison using a computer-simulation study. Vet. Clin. Pathol. 2019, 48, 335–346. [Google Scholar] [CrossRef] [PubMed]
  64. Jay Kerns, G. Introduction to Probability and Statistics Using R; 2018; ISBN 978-1726343909. Available online: https://cran.r-project.org/web/packages/IPSUR/vignettes/IPSUR.pdf (accessed on 17 March 2019).
  65. United States Environmental Protection Agency. RCRA Waste Sampling Draft Technical Guidance. Planning, Implementation, and Assessment; 2002. Available online: https://www.epa.gov/hw-sw846/draft-technical-guidance-about-waste-sampling-under-resource-conservation-and-recovery-act (accessed on 14 August 2019).
  66. Ambrose, H.; Kendall, A. Understanding the future of lithium: Part 1, resource model. J. Ind. Ecol. 2019, 43, 1767. [Google Scholar] [CrossRef]
  67. Rousselet, G.A.; Pernet, C.R.; Wilcox, R.R. A Practical Introduction to the Bootstrap: A Versatile Method to Make Inferences by Using Data-Driven Simulations; A, 2019. Available online: https://psyarxiv.com/h8ft7/ (accessed on 4 September 2020). [CrossRef] [Green Version]
  68. Bovea, M.D.; Pérez-Belis, V.; Ibáñez-Forés, V.; Quemades-Beltrán, P. Disassembly properties and material characterisation of household small waste electric and electronic equipment. Waste Manag. 2016, 53, 225–236. [Google Scholar] [CrossRef]
  69. Borkowf, C.B.; Johnson, L.L.; Albert, P.S. Power and Sample Size Calculations. In Principles and Practice of Clinical Research, 5th ed.; Borkowf, C.B., Johnson, L.L., Albert, P.S., Eds.; Elsevier/Academic Press: San Diego, CA, USA, 2018; pp. 359–372. ISBN 978-0-12-849905-4. [Google Scholar]
  70. Bartlett, J.E.; Kotrlik, J.W.; Higgins, C.C. Organizational Research: Determining Organizational Research: Determining Appropriate Sample Size in Survey Research Appropriate Sample Size in Survey Research. Inf. Technol. Learn. Perform. J. 2001, 19, 43. [Google Scholar]
  71. Normenausschuss Materialprüfung (NMP) im DIN. Solid Recovered Fuels—Methods for Sampling, German version EN 15442:2011; Beuth Verlag GmbH: Berlin, Germany, 2011; ICS 75.160.10 (DIN EN 15442). [Google Scholar]
  72. Waste Generation and Characterization. Waste Characterization: Approaches and Methods; Christensen, T.H., Ed.; Wiley: Chichester, UK, 2011; ISBN 9781405175173. [Google Scholar]
  73. Cochran, W.G. (Ed.) Sampling Techniques, 3rd ed.; Wiley: New York, NY, USA, 1977; ISBN 0-471-16240-X. [Google Scholar]
  74. Brereton, R.G. The t-distribution and its relationship to the normal distribution. J. Chemom. 2015, 29, 481–483. [Google Scholar] [CrossRef]
  75. Ashby, M.F. Case Study. In Materials and Sustainable Development; Elsevier: Amsterdam, The Netherlands, 2016; pp. 151–166. ISBN 9780081001769. [Google Scholar]
  76. Berndt, D.; Spahrbier, D. Batteries. In Ullmann's Encyclopedia of Industrial Chemistry; Wiley-VCH Verlag GmbH & Co. KGaA: Weinheim, Germany, 2011; pp. 41–93. [Google Scholar] [CrossRef]
  77. Li, L.; Zhang, X.; Li, M.; Chen, R.; Wu, F.; Amine, K.; Lu, J. The Recycling of Spent Lithium-Ion Batteries: A Review of Current Processes and Technologies. Electrochem. Energ. Rev. 2018, 1, 461–482. [Google Scholar] [CrossRef]
  78. Gulbinska, M.K. Lithium-Ion Battery Materials and Engineering. Current Topics and Problems from the Manufacturing Perspective; Springer: London, UK, 2014; ISBN 978-1-4471-6547-7. [Google Scholar]
  79. Limpert, E.; Stahel, W.A.; Abbt, M. Log-normal Distributions across the Sciences: Keys and Clues. BioScience 2001. [Google Scholar] [CrossRef]
  80. Edjabou, M.E.; Martín-Fernández, J.A.; Scheutz, C.; Astrup, T.F. Statistical analysis of solid waste composition data: Arithmetic mean, standard deviation and correlation coefficients. Waste Manag. 2017, 69, 13–23. [Google Scholar] [CrossRef] [Green Version]
  81. Løvik, A.N.; Figi, R.; Schreiner, C.; Rösslein, M.; Widmer, R.; Bunge, R.; Pohl, T.; Korf, N.; Kuntz, C.; Mählitz, P.M.; et al. Variability and Bias in Measurements of Metals Mass Fractions in Automobile Shredder Residue. Recycling 2019, 4, 34. [Google Scholar] [CrossRef] [Green Version]
  82. Korf, N.; Løvik, A.N.; Figi, R.; Schreiner, C.; Kuntz, C.; Mählitz, P.M.; Rösslein, M.; Wäger, P.; Rotter, V.S. Multi-element chemical analysis of printed circuit boards—Challenges and pitfalls. Waste Manag. 2019, 92, 124–136. [Google Scholar] [CrossRef]
  83. Mählitz, P.M.; Løvik, A.N.; Figi, R.; Schreiner, C.; Kuntz, C.; Korf, N.; Rösslein, M.; Wäger, P.; Rotter, V.S. Characterizing the Urban Mine—Challenges of Simplified Chemical Analysis of Anthropogenic Mineral Residues. Resources 2019, 8, 132. [Google Scholar] [CrossRef] [Green Version]
  84. Huisman, J.; Leroy, P.; Tertre, F.; Ljunggren Söderman, M.; Chancerel, P.; Cassard, D.; Løvik, A.N.; Wäger, P.; Kushnir, D.; Rotter, V.S.; et al. Urban Mine Platform. Available online: http://www.urbanmineplatform.eu/ (accessed on 6 August 2020).
Figure 1. Non-parametric approach (NPA) to approximate the minimum sample sizes (MSS) with data-driven simulations. (a) Simulated bootstrap population, (b) sub-sampling from datasets with increasing sample size and 1000 repetitions, (c) coverage of sub-sample results in percent lying within the population 95% confidence interval (CI*).
Recycling 05 00019 g001
Figure 2. The proportion of WEEE devices (UNUkeys) with and without battery compartment (a) and the proportion of WEEE with a battery compartment in which batteries remained or were missing (b). The total number of appliances (N) is shown in white at the bottom. Figure data available in Supplementary Materials Table S3.
Recycling 05 00019 g002
Figure 3. Battery mass (a), battery mass share (b), and WEEE mass (c) differentiated according to their chemical systems (BATTkey). The mass is illustrated with a logarithmic scale. The lower and upper hinges of the boxplots correspond to the first and third quartiles (the 25th and 75th percentiles). The median is drawn as a bold horizontal line; the mean is shown as a square. Upper/lower whisker is the largest/smallest observation less/greater than or equal to upper/lower hinge +/− 1.5 ∗ interquartile range (IQR). The black dots represent values that lie outside of this range.
Recycling 05 00019 g003
Figure 4. Occurrence and count of battery types (BATTkeys) in UNUkeys. Total number of devices considered: 790. Figure data are given in the Supplementary Materials Table S7.
Recycling 05 00019 g004
Figure 5. Mass (a) and mass share (b) of batteries remaining in WEEE classified as UNUkeys and distinguished by their chemical system (BATTkey). The number of observations (n) is displayed on top of the graph (a). The lower and upper hinges of the boxplots correspond to the first and third quartiles (the 25th and 75th percentiles). The median is drawn as a bold horizontal line; the mean is shown as a square. Upper/lower whisker is the largest/smallest observation less/greater than or equal to upper/lower hinge +/− 1.5 ∗ IQR. The data of this figure can be found in the Supplementary Materials Table S7, Table S8, Table S10, Table S12, and Table S14.
Recycling 05 00019 g005
Figure 6. Histogram and density distribution for the battery mass share (BMS) of LiRecharge and NiMH for mobile phones (UNUkey 0306). Original data (a,d), log-transformed data (b,e), and bootstrap sample means with B = 5000 (c,f). The (log-)normal distribution curve for the sample mean and SD is shown in dark red. The 95% CI* is drawn as a semi-transparent area in the corresponding BATTkey color.
Recycling 05 00019 g006
Figure 7. NPA: Simulation of MSS using bootstrap simulation. The proportion of sub-samples that lie within the simulated 95% CI* (coverage) is plotted against the number of samples used to draw the sub-samples. A coverage of 90% is considered acceptable to achieve representable results with the given sample size (dashed line). The graphs show the three possible combinations using small information technology (IT) (0301), desktop personal computers (PCs) (0302), mobile phones (0306) and small consumer electronics (0401) as examples: (a) all WEEE with and without battery compartment, (b) only WEEE with battery compartment without battery specification (BATT), (c) WEEE with batteries and BATTkey specification.
Recycling 05 00019 g007
Table 1. Classification of waste electrical and electronic equipment (WEEE) categories (UNUkey main structure, the detailed classification can be found in Supplementary Materials Tables S16 and S17) and battery systems (BATT keys).
UNUkeyDescriptionBATTkeyDescription
0001Central Heating (CH, household installed)LiPrimLithium-based batteries, primary
0002Photovoltaic panels (PV)LiRechargeLithium-based batteries, rechargeable
010xLarge household appliances (LHA)ZnZinc-based batteries
020xSmall household appliances (SHA)NiCdNickel-cadmium based batteries
030xIT and telecom equipment (ITCE)NiMHNickel-metal hydride batteries
040xConsumer equipment (CE)PbLead-acid batteries
050xLighting equipment (LE)OtherOther batteries (e.g., silver-oxide)
060xElectrical and electronic tools (EET)UnspecifiedNot specified or identifiable
070xToys, leisure, and sports equipment (TLS)
080xMedical devices (MD)BATTNo distinction of the battery system.
090xMonitoring and control instruments (MCI)
100xDispensers (D)
Table 2. Comparison of the approaches to determine the MSS with the PA using the original PA(VC) and bootstrap coefficient of variation PA(VC*) as well as the NPA.
UNUkeynBATTkeyPA(VC)PA(VC*)NPA
VCMSS VC*MSS95% CI*MSS
030151BATT1.326700.1812[7.2; 15]40
29Zn1.034200.1914[6.9; 14]20
0302118BATT1.8413000.1711[0.03; 0.06]70
116LiPrim0.631500.104[0.03; 0.04]20
030693BATT0.36500.041[24; 27]70
24NiMHND0.40600.082[26; 35]20
69LiRecharge0.29300.061[22; 25]60
0401121BATT0.521000.051[17; 20]90
105Zn0.511000.062[17; 21]80
n: number of samples, VC: coefficient of variation, PA(VC): a parametric approach using the VC of the original data, PA(VC*): a parametric approach using the VC of the bootstrap samples, NPA: non-parametric approach, MSS: minimum sample size, ND (superscript): normal distribution of original data. Results are rounded to two significant digits.

