The Energy and Carbon Footprint of an Urban Waste Collection Fleet: A Case Study in Central Italy


Department of Engineering, CIRIAF, University of Perugia, Via G. Duranti, 67-06125 Perugia, Italy
*
Author to whom correspondence should be addressed.
Recycling 2020, 5(4), 25; https://0-doi-org.brum.beds.ac.uk/10.3390/recycling5040025
Submission received: 23 August 2020
/
Revised: 1 October 2020
/
Accepted: 2 October 2020
/
Published: 7 October 2020
Abstract
:Municipal solid waste collection and transport are functional activities in waste management, with a significant energy and carbon footprint and a significant effect on the urban environment. An issue related to municipal solid waste collection and transport is their regional and municipal implementation, affected by sorting and recycling strategies at local level. An efficient collection is necessary to optimize the whole recycling process. The present paper shows the results of an energy, environmental, and economic evaluation of a case study, analyzing the fleet used for municipal solid waste collection and transport in 10 municipalities in Central Italy. The current scenario was compared with alternative scenarios on the basis of some parameters for performance evaluation: vehicles’ energy consumption, carbon footprint, routes, and costs. Results show that for passenger cars, the alternative scenario based on an entire fleet of dual compressed natural gas (CNG) vehicles led to a reduction of the CO2 emissions (−2675 kgCO2eq) in the analyzed period (January–August 2019) and a reduction of the energy consumption (−1.96 MJ km−1). An entire fleet of CNG vehicles led to an increase of CO2 emissions: +0.02 kgCO2eqkgwaste−1 (+110%) for compactors (35–75 q) and +0.09 kgCO2eqkgwaste−1 (+377%) for compactors (80–180 q). Moreover, both categories report a higher fuel consumption and specific energy consumption. For waste transport high-capacity vehicles, we propose the installation of a Stop-Start System, which leads to environmental and energy benefits (a saving of 38,332 kgCO2eq and 8.8 × 10⁻⁷ MJ km−1kgwaste−1). On three-wheeler vehicles, the installation of the Stop-Start System is completely disadvantageous.
1. Introduction
Municipal Solid Waste (MSW) management plays a crucial role as a service to the community in modern societies and contributes to the establishment of sustainable urban areas. The amount of MSW has increased over the last decades, because of the growing world population (especially in urban areas [1]), global industrialization, and economic and industrial development. In 2018, the Italian production of MSW was equal to 30.2 million tons, with a growth of 2% compared to 2017 [2]. The goal set by the European Union by 2020 is recycling 50% of the waste generated by households [3]. This value was recently updated to 55% by 2025, 60% by 2030 and 65% by 2035. The waste production statistics, on one side, and the ambitious recycling goals, on the other side, require an accurate planning of MSW management.
MSW management consists of the following functional activities: (i) generation, separation and storage at source; (ii) collection and transportation; (iii) separation, processing and transformation; (iv) disposal [4]. MSW collection and transportation is a crucial element in MSW management systems as far as cost, public health due to emission [5], recovery, or recycling of materials and depletion of resources (e.g., fossil fuel) are concerned [6].
Costs related to collection and transport constitute a major portion of expenditures in MSW management systems and range from 50–75% of total operational costs in developed countries such as Sweden, to 70–85% in developing countries [7,8]. In addition, collection and transport of waste causes energy-related greenhouse gas (GHG) emissions, which increase in the case of sorting into multiple waste fractions for the sake of recycling. Sorting and recycling require up to 80% more driven distance, and over a doubling in the number of routes [9].
Another issue is related to the fact that the collection system for both unsorted and sorted MSW varies from one country, region or city to the next. In particular, scientific literature decouples the design of MSW management systems in a first regional strategic level, where decisions on system configuration are made by regional entities, and in a municipal tactical and operational level, where decisions are made by municipalities [10]. Thus, the optimization of waste collection and disposal covers several aspects, such as increasing traffic congestion, CO2 reduction, high costs and great economic and social impact, and should be done using adequate collection techniques [11].
In the literature, several mathematical models have been proposed to plan the entire collection and transport structure computationally. These models have been broadly classified into three domains: (i) vehicle routing; (ii) facility location; and (iii) flow allocation [12]. Many papers have studied the routing of waste collection vehicles, related to the territory and regional areas as case studies [13,14,15,16,17].
Maimoun et al. [18] evaluated life-cycle emissions, cost, fuel and energy consumption of potential alternative fuel technologies for waste, with respect to diesel fuel, in the United States. They found that natural gas waste collection vehicles (compressed and liquid) fueled with North-American natural gas had higher greenhouse gas (GHG) emissions relative to diesel-fueled vehicles. Landfill gas and biodiesel waste collection vehicles, instead, have lower GHG emissions relative to diesel. They also underlined that repetitive stops and starts during waste collection generate more emissions than constant speed driving.
Maimoun et al. [19] used a multi-criteria decision analysis (MCDA) to rank fuel alternatives for the U.S. waste collection industry, considering environmental and financial criteria. They found that, in the United States, conventional diesel is still the best option, followed by hydraulic-hybrid vehicles, landfill gas, fossil natural gas, and biodiesel.
Pastorello et al. [20] discussed the contribution of waste collection vehicles to atmospheric emissions and found that the increasing compressed natural gas usage of the MSW fleet in the city of Milan lead to a reduction of 32%, 22%, and 15% in PM, NOx, and VOC emissions.
Liang et al. [21] studied a fuzzy group decision supporting framework for sustainability prioritization of alternative-fuel based vehicles in China and found that the most sustainable sources are biodiesel based vehicles and compressed natural gas (CNG) based vehicles. They concluded that China’s administration should prioritize biodiesel-based vehicles under the current context of China.
Zhao et al. [22] completed a hybrid life cycle environmental impact assessment to evaluate the GHG emission and energy consumption impacts throughout the 10-year lifetime of diesel, CNG, hydraulic hybrid, and all-electric collection trucks. They found that both the all-electric and the CNG refuse trucks generate more GHG emissions over their respective life cycles than diesel trucks because of their energy consumption.
It is clear from literature that findings are not univocal, but strictly related to the considered scenario. To enrich the evaluations found in the literature related necessarily to local areas, the present paper presents an energy, environmental and economic analysis on the fleet used for MSW collection and transport in some Municipalities in Central Italy. The authors firstly analyzed the current scenario, separating the fleet into vehicles used for the MSW transport and vehicles dedicated to personnel transport. Several parameters were identified for performance evaluation: vehicles’ energy consumption, carbon footprint, routes, and costs. The current scenario is then compared with alternative scenarios, defined by: (i) the use of alternative fuels such as CNG and liquefied petroleum gas (LPG), (ii) the installation of a Stop-Start System, which switches off the engine when the vehicle is stopped to upload waste and supplies energy to the waste loading equipment. The comparative analysis between current and alternative scenarios is aimed at evaluating the obtainable benefits. The possible disadvantages due to the variation of the fleet are also assessed in terms of cost increase and route covered per unit of used fuel or transported waste.
2. Methodology
2.1. Background
Waste management in Italy is managed at a municipal level in accordance with national legislation, and differs widely from area to area. In general, waste is collected by a waste disposal company contracted to the municipal authority [23].
The available literature shows that the northern Italian provinces have a low landfill disposal rate, and, in a large part of southern-central Italian provinces, landfill disposal is still a widespread practice [23]. Nevertheless, from 2007 to 2016, the percentage of waste collected separately rose from 27.5% in 2007 up to 52.5% in 2016. For the same period, the share of waste landfilled dropped from 49.3% to 25% [24].
In the regional area of Umbria, the total amount of produced MSW in 2018 was 4.6 × 10⁸ kg (460,387 t), in the province of Perugia, it was 3.5 × 10⁸ kg (355,185 t) [2]. In the area of Perugia, the separate waste collection service is arranged into three different systems. In the historical city center there is a door-to-door collection, where waste is sorted into the following categories: paper and cardboard, plastics and metal, glass, organic waste and residual waste. In high-density residential areas, close to the historical city center, waste collection follows a door-to-door model only for paper and cardboard, plastics and metal, organic waste and residual waste, while glass is collected through curbside containers. In the suburban districts, in contrast, door-to-door sorted collection is planned only for: (i) paper and cardboard, (ii) plastics, metal and glass together, (iii) residual waste. The organic waste is collected through roadside containers. The high number of sorted waste categories significantly affects the extent of collection and transport activities, with a consequent impact on the energy consumption and on the environmental emissions, as well as on the economics of the company.
2.2. System Boundaries
The present study is focused on the analysis of the fleet of vehicles of a company in central Italy, located in Perugia, operating in the waste sector. The municipalities where the selected company operates and which are taken into account in the analysis are: Bastia Umbria, Bettona, Fiumicino, Gubbio, Perugia, Todi, Torgiano, Umbertide, all in the province of Perugia, Umbria Region, and also Viterbo and Fiumicino in the Lazio Region, which have similar recycling and collection strategies as the province of Perugia. The served municipalities are shown in the Supplementary Material (Figure S1).
The fleet used by the company includes vehicles for personnel transport, vehicles for MSW collection and transport and the operating machines, used only in the mechanical and biological treatment (MBT) plants, located in the municipal area of Perugia. Almost 50% of the total mileage is done in the municipal area of Perugia (equal to 141,552 km), by the vehicles for personnel transport and by the operating machines. These vehicles are occasionally used in the other municipal areas. In addition, MSW transport vehicles mainly operate in the municipal area of Perugia. The kilometers traveled by MSW transport vehicles is very small inside the MBT plant areas, where street sweepers are usually used. The total number of kilometers traveled in the mentioned municipalities, the map and the waste routes are shown in the Supplementary Material (Figures S1, S2 and S3).
The fleet is formed by 480 vehicles dedicated to: personnel transport, MSW collection and transport, operating machines in the MBT plants. The vehicles were divided into 25 categories, as shown in Table 1, depending on the type of vehicle and its transport capacity, measured in quintals (q). Categories were defined as in the company software, containing the database of vehicles and describing the brand and type of equipment of the vehicles. The last two columns divided the vehicles in two groups: (i) vehicles which do not transport MSW but contribute to the total fuel consumption due to refueling registered in the company software (as explained in Section 2.3); (ii) vehicles which transport MSW.
The #N/D (not defined) category contains vehicles not classifiable in the defined categories, because of their specific equipment. Being a limited number, they are neglected in the analysis. The total number of vehicles can be divided into five types of fuel used: 65 gasoline vehicles, 351 diesel vehicles, 23 LPG/gasoline vehicles, 11 CNG vehicles, 30 CNG/gasoline vehicles.
There are 192 vehicles not dedicated to MSW transport. Out of 192 vehicles, 82 vehicles belonging to the categories of passenger cars, trucks and operating machines were analyzed. The other 110 vehicles were analyzed individually, because they have low capacity and unload in a high capacity vehicle or because the vehicle does not carry anything, such as a sweeper operating in the destination plant.
2.3. Data Analysis
Data used in the analysis are related to the period from January 2019 to August 2019, recorded in the management software: GBS and WinWaste. GBS software is an online platform used to manage company’s supplies. In its database, the characteristics of the vehicles, such as model, license plate numbers, refueling data, costs and kilometers released by the operator, are collected. The WinWaste software is a waste management software, which records waste amount delivered by the vehicle to a certain destination. Data are related to waste mass, European Code of Waste (ECW), license plate number, and registration date.
Refueling operations are monitored by the vehicle’s driver, using a badge for the internal diesel fuel pump, or through a card when external distributors are used. In both cases, the card or the badge are assigned to the license plate number of the used vehicle. During refueling, the driver also records the current mileage. Other parameters are automatically derived.
Data from GBS and WinWaste are saved in excel files. The first step of the analysis is focused on the elimination of data anomalies through statistical calculations. Then, parameters are identified to define the energy, environmental, and economic performance. There are some calculated parameters: (i) kilometers traveled before refueling, (ii) ratio of kilometers travelled to the fuel mass in kilograms (km kg−1), or ratio of kilometers travelled to the fuel volume in liters (km L−1) (iii) waste net capacity.
The statistical analysis was carried out by calculating the standard deviation of the ratio of the travelled kilometers to the fuel mass in kilograms (km kg−1) or ratio of kilometers travelled to the fuel volume in liters (km L−1), for each vehicle, and relative to the fuel, the net capacity and category.
The excluded values of the ratio km kg−1 or km L−1 by standard deviation analysis are due to values that are too high or too low with respect to the average. The high values occur for many traveled kilometers with small amounts of fuel; this can happen because of a broken badge, incorrect recorded values, or low waste load. Some of the listed cases lead to values that are not considered anomalous, but are still eliminated because they have a significant impact on the average value. Low values instead are due to the following reasons: (i) vehicle operating at idle, (ii) high use of the compactors’ press on board, (iii) waste has a high specific weight, (iv) for street sweepers, use of brushes. Because of anomalies’ elimination, the analyzed number of refueling is reduced to 73% of the initial value and the number of analyzed vehicles to 88%.
The transported types of waste taken into account are: (1) paper and cardboard, (2) organic fraction, (3) unsorted waste, (4) metal, (5) plastics, (6) plastics and metal together, (7) glass, plastics and metal together, (8) glass. After this simplification, the number of analyzed vehicles is reduced to 70%.
The properties of fuels used in the calculation are the Lower Calorific Value (LCV), density, and specific equivalent CO2 emissions [25]. The specific equivalent CO2 emissions include the following compounds: CO2, N2O, CH4 and are calculated in kgCO2eq emitted for mass unit or volume unit of used fuel (mass unit for gaseous fuel and volume unit for liquid fuel). The chemical-physical properties of fuels are shown in the Supplementary Material (Table S1). For dual vehicles, such as CNG/gasoline and LPG/gasoline, a weighted average value of the chemical-physical parameters is considered, according to the amount of each fuel used per route.
Performance parameters for vehicles are: (i) fuel consumption in kilometers per kilogram (km kg−1) or ratio of kilometers per liters of fuel (km L−1), (ii) cost per kilometer (€ km−1), (iii) energy consumption per kilometer (MJ km−1), calculated as in Equation (1) (for liquid fuels, the amount in kg is calculated as ) (iv) total amount of emitted CO2 (kgCO2eq), (v) total fuel consumption (kg), (vi) total costs (€).
For vehicles dedicated to MSW transport, calculation of the performance parameters is referred to waste mass unit. On the basis of the above-described parameters, a comparative analysis between the current scenario and an alternative scenario, where part of the fleet is replaced with alternative fuel vehicles, is proposed. Table 2 shows the differences between the current scenario and the alternative scenario for each analyzed category.
For high capacity vehicles dedicated to MSW transport, another solution is also analyzed, consisting of the installation of a Stop-Start System to improve the energy and environmental efficiency of the heavy vehicles. A solution present on the market is analyzed. A Stop-Start hybrid system is designed to shut down the internal combustion engine when the vehicle stops for MSW collection and provides power to the onboard low-power systems such as container lifters. As these vehicles spend most of their time idling, this technology reduces engine operating hours and therefore fuel consumption and emissions.
Experimental tests on MSW collection vehicles show that fuel savings are equal to 30%, reducing the idling time to the minimum [26]. The disadvantages are the initial investment cost and installation and maintenance costs. In addition, the system weighs 290 kg, which generates an increase in fuel consumption. The analysis aims to assess the benefits and disadvantages of the system applied on heavy MSW collection vehicles, on energy and environmental performances without considering how investment and maintenance costs affect total expenditures.
3. Results and Discussion
In this section, the results of the comparative analysis between the current scenario and the proposed low-impact scenario are presented and discussed.
3.1. Vehicles Not Dedicated to MSW Transport
The current performance of vehicles not dedicated to MSW transport is discussed according to the parameters presented in the previous paragraph. In addition to the passenger cars, the company also has other vehicles not dedicated to MSW transport, such as trucks and several types of operating machines. Only the results about passenger cars are presented and discussed, since trucks have similar results and the operating machines, used for specific activities in the company’s plants, are few and very diverse, and thus not comparable to one another.
To analyze an alternative scenario with lower energy consumption and lower environmental impact, it is assumed that Diesel vehicles are replaced with dual CNG vehicles. The number of kilometers travelled by each diesel vehicle is maintained, while some parameters, such as the cost per kilometer (€ km−1) and fuel consumption, related to the diesel vehicles, are replaced by those obtained for the dual CNG vehicles.
Figure 1 shows the values of the six parameters used to evaluate the performance of the fleet not dedicated to MSW transport. The six values are distributed in three graphs according to their order of magnitude. The graphs report on the vertical axis the quantitative values of the two scenarios analyzed and on the horizontal axis the performance parameters, comparing the current scenario with the alternative one.
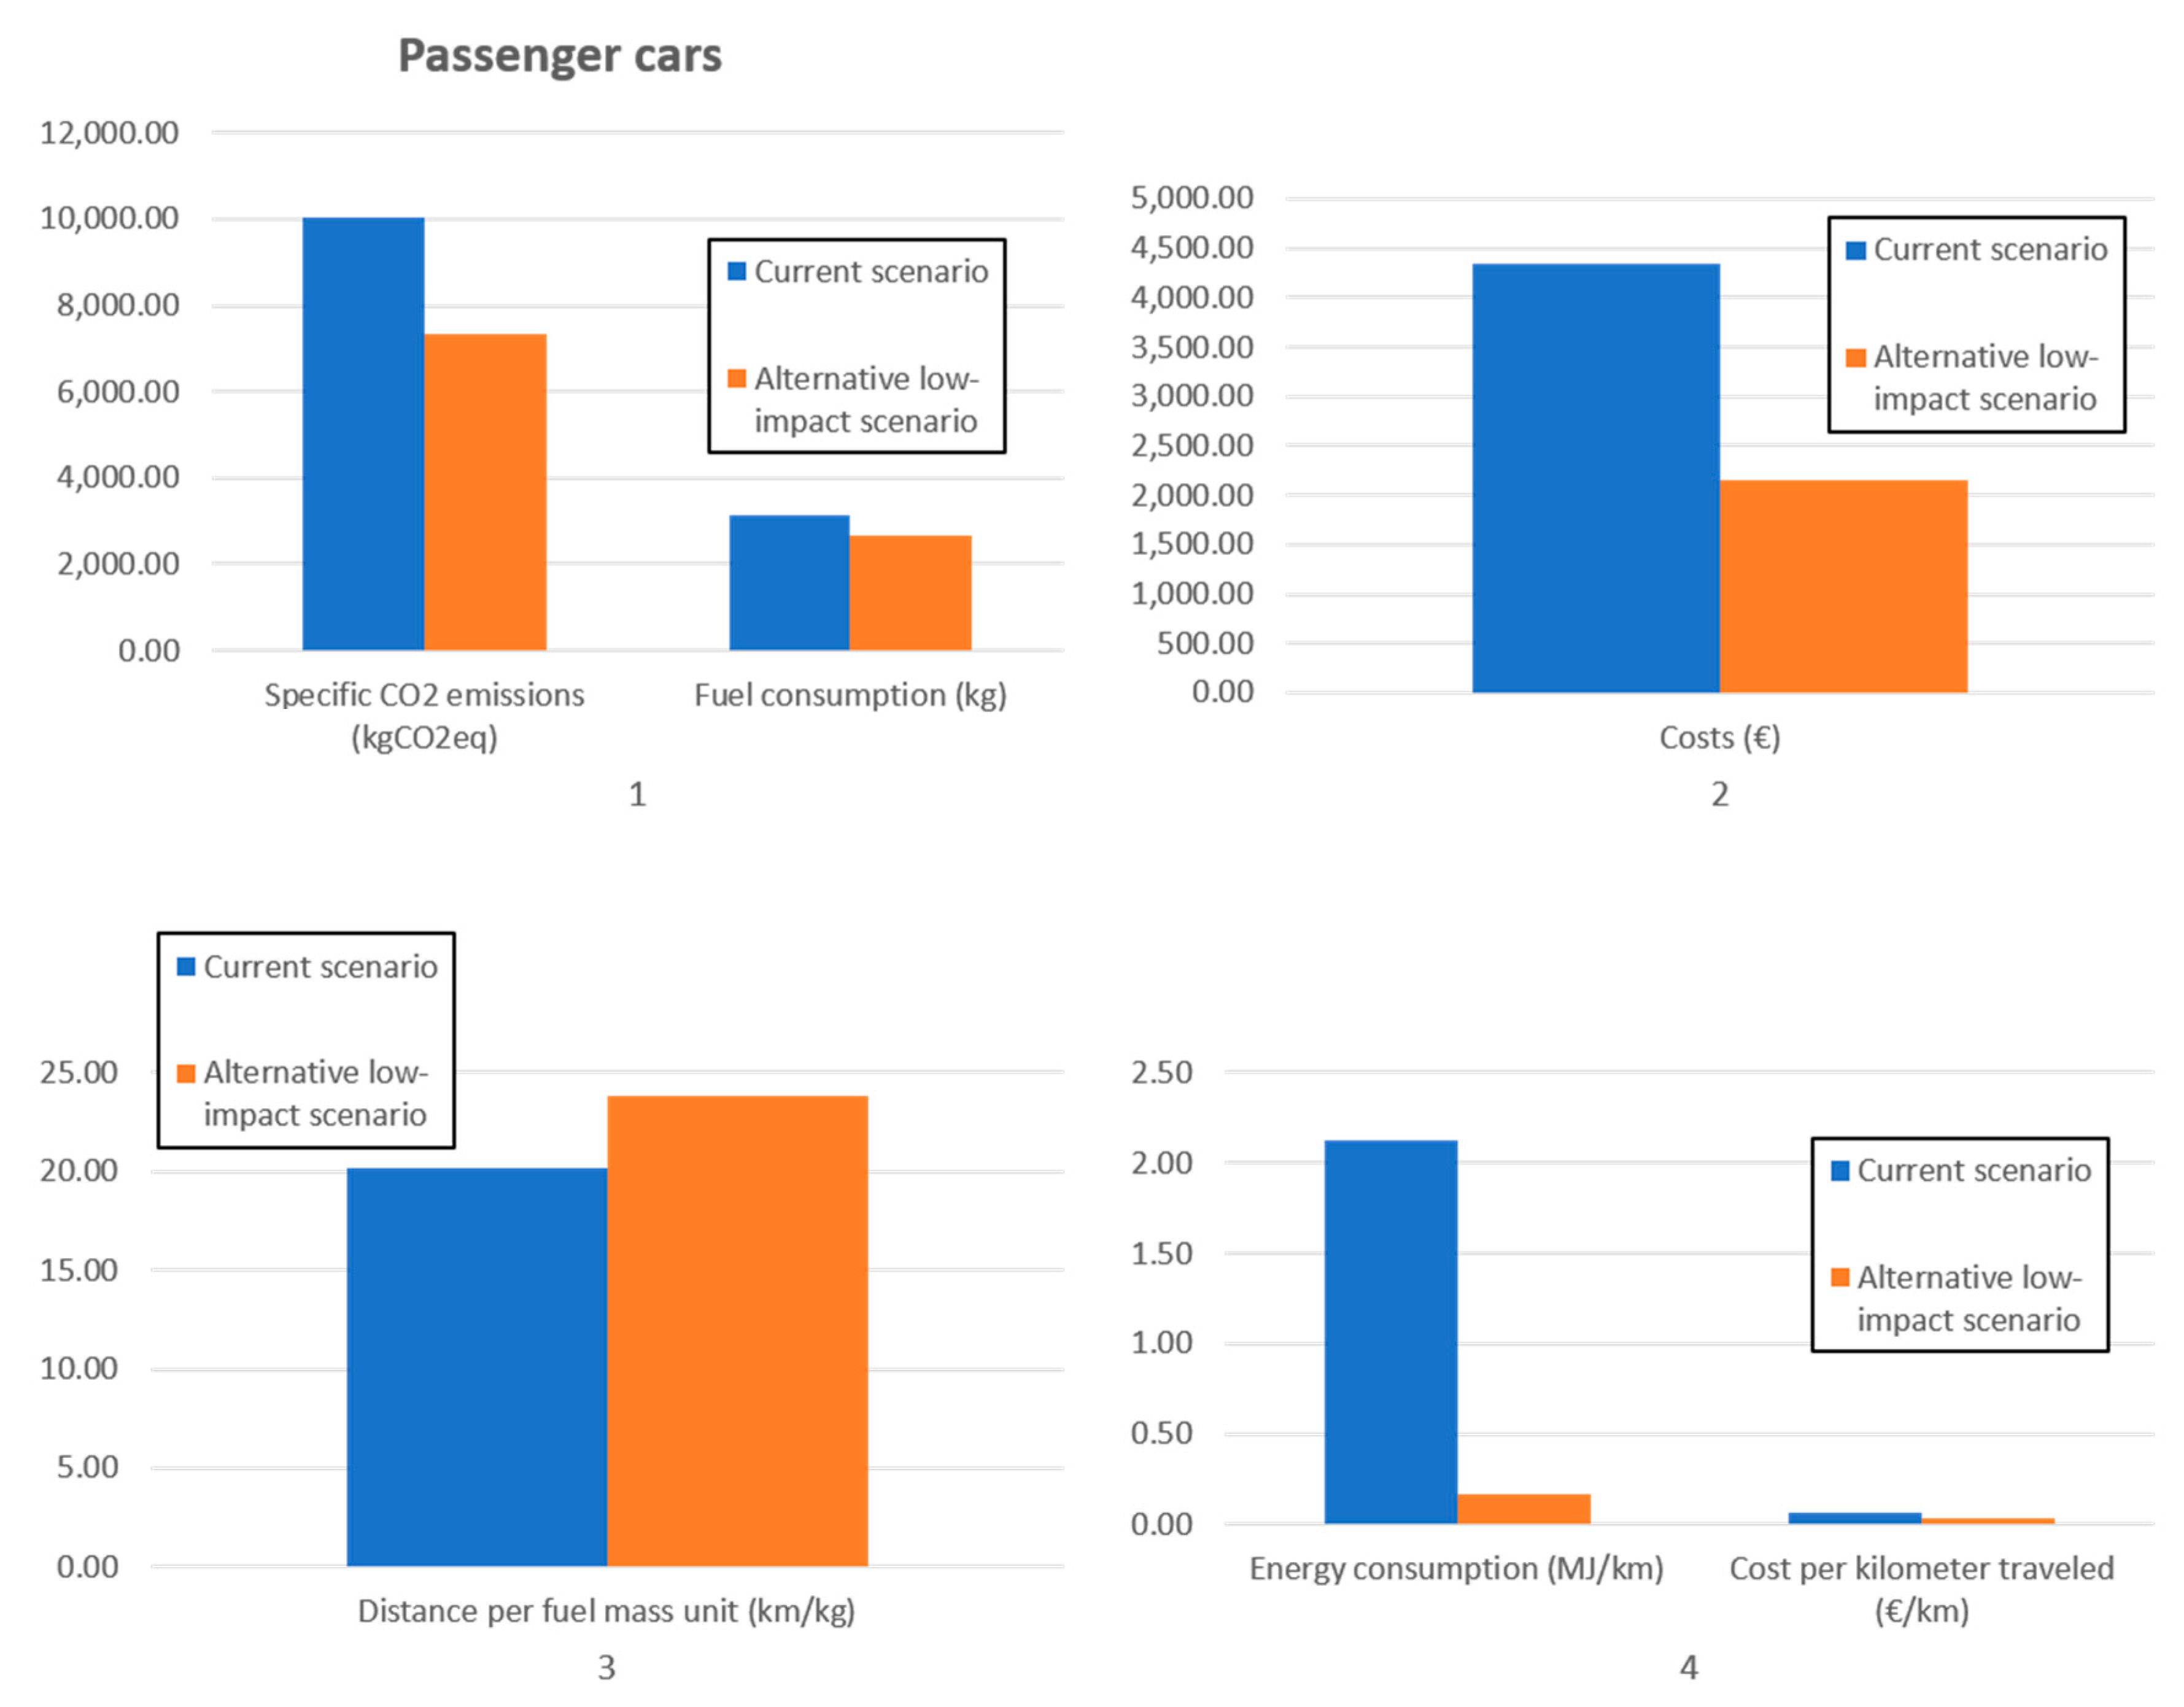
Graph 1, Figure 1, shows CO2 emissions and total fuel consumption. The environmental performance improves in the alternative scenario, releasing into the atmosphere about 7325 kgCO2eq, while in the current scenario CO2 emissions are equal to 10,000 kgCO2eq in the analyzed period (January–August 2019). There is also a reduction of the fuel consumption: about 2642 kg for CNG vehicles compared to 3130 kg for diesel vehicles. Graph 2 shows the reduction in the total costs, equal to 2147 € for CNG vehicles, compared to 4348 € for diesel vehicles. The third graph shows the distance traveled per fuel mass unit. The kilometers traveled per liter for dual CNG vehicles are 23.8 km kg−1, while those for diesel vehicles are 20.1 km kg−1, so there is a slight increase in this parameter. There is also an improvement in the specific energy consumption, shown in Graph 4, together with the specific costs per kilometer traveled. The value of the specific energy consumption for dual CNG vehicles is 0.17 MJ km−1, while that for diesel is 2.13 MJ km−1, so there is a saving of 1.96 MJ km−1. Costs per kilometer traveled are halved in the case of CNG use, 0.034 € km−1 instead of 0.069 € km−1 (Graph 4). Cost reduction is due to the combined effect of a slight improvement in fuel economy and a lower cost of CNG with respect to diesel in the Italian scenario (30–50% reduction).
3.2. Vehicles Dedicated to MSW Transport
In this paragraph results about some categories of vehicles dedicated to MSW transport are presented: (i) compactors with a total weight in the range of 35–75 q and 80–180 q, which are vehicles using diesel and CNG; (ii) Porter Vehicles using gasoline, diesel and LPG; (iii) diesel compactors with a total weight of 180–330 q; (iv) Three-wheelers.
3.2.1. Compactors (35–75 q) and (80–180 q)
Regarding passenger cars, for both of the analyzed compactor categories, the alternative scenario where Diesel vehicles are replaced with CNG vehicles, is proposed. For each vehicle, mileage amount is maintained, as is the amount of waste transported, while some parameters, such as the cost per kilometer per waste mass unit (€ km−1kgwaste−1) and fuel consumption (km kgfuel−1kgwaste−1), are replaced with those obtained for the CNG vehicles.
Figure 2 summarizes the results, showing the comparison between the current diesel fleet of compactors (35–75 q), and the alternative scenario in which the same fleet uses CNG as fuel.
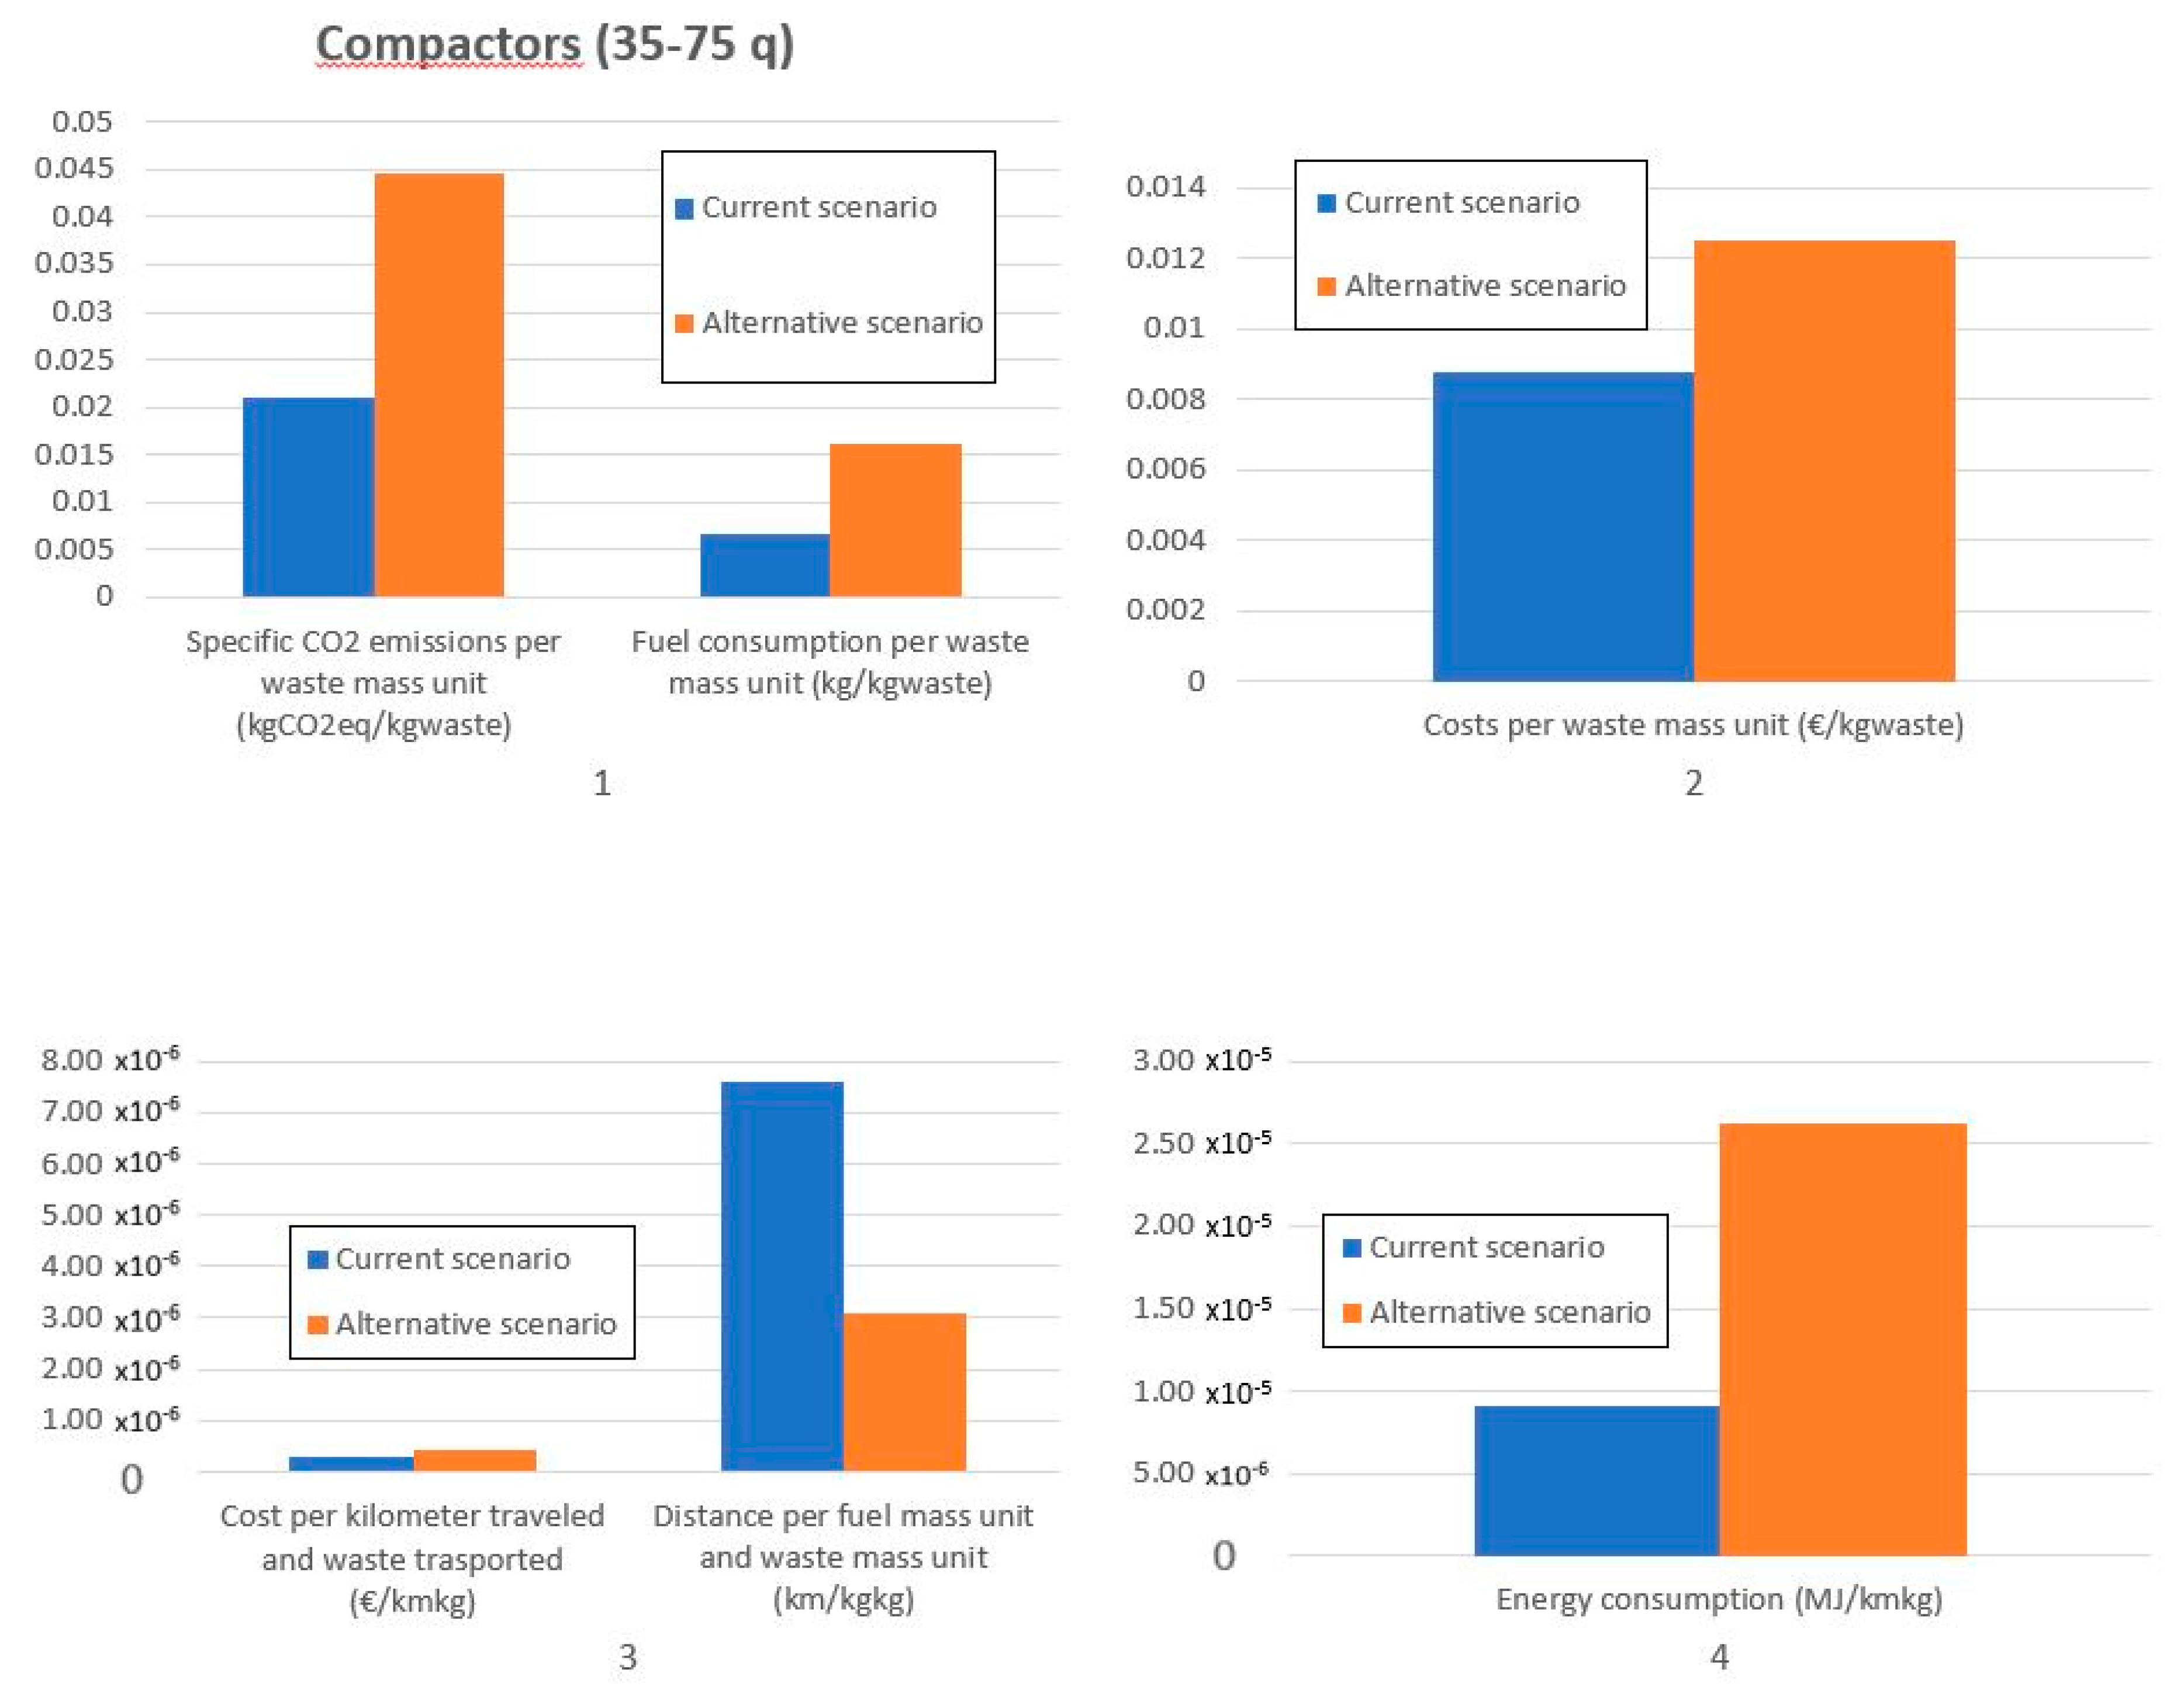
For compactors (35–75 q), there is a significant worsening in the environmental performance of the alternative scenario, changing from 16,585 kgCO2eq to 34,941 kgCO2eq released into the atmosphere in the analyzed period (January–August 2019), with an increase of +110% with respect to the current scenario. Moreover, fuel consumption increases changing from 5183 kg to 12,721 kg (+145%) and the costs increase from 6880 € to 9827 € (+43%), with an economic disadvantage in the alternative scenario. Specific values of emissions and fuel consumption are shown in Graph 1 of Figure 2. In the alternative scenario the specific CO2 emissions change from 0.02 kgCO2eq kgwaste−1 to 0.04 kgCO2eq kgwaste−1, while the fuel consumption changes from 0.006 kgfuel kgwaste−1 to 0.016 kgfuel kgwaste−1. Graph 2 shows costs per waste mass unit: they change from 0.008 € kgwaste−1 to 0.0125 € kgwaste−1. Similar results are obtained in Graph 3, Figure 2, where costs per kilometer traveled and waste transported are higher in the alternative scenario (4.04 × 10⁻⁷ € km−1kgwaste−1 instead of 2.83 × 10⁻⁷ € km−1kgwaste−1). The specific fuel consumption (Graph 3, Figure 2) in the alternative scenario is 3 × 10⁻⁶ km kgfuel−1kgwaste−1, while that in the current scenario is 7.5 × 10⁻⁶ km kgfuel−1kgwaste−1 (−59%). This means that, with the same amount of transported waste, the distance traveled per fuel mass unit in case of CNG vehicles is half of the distance traveled in the case of diesel vehicles, thus also affecting the specific energy consumption (Graph 4, Figure 2), which is 2.6 × 10⁻⁵ MJ km−1kg−1, while that in the current scenario is 9.1 × 10⁻⁶ MJ km−1kg−1, so there is a loss of 1.7 × 10⁻⁵ MJ km−1kg−1 (+186%).
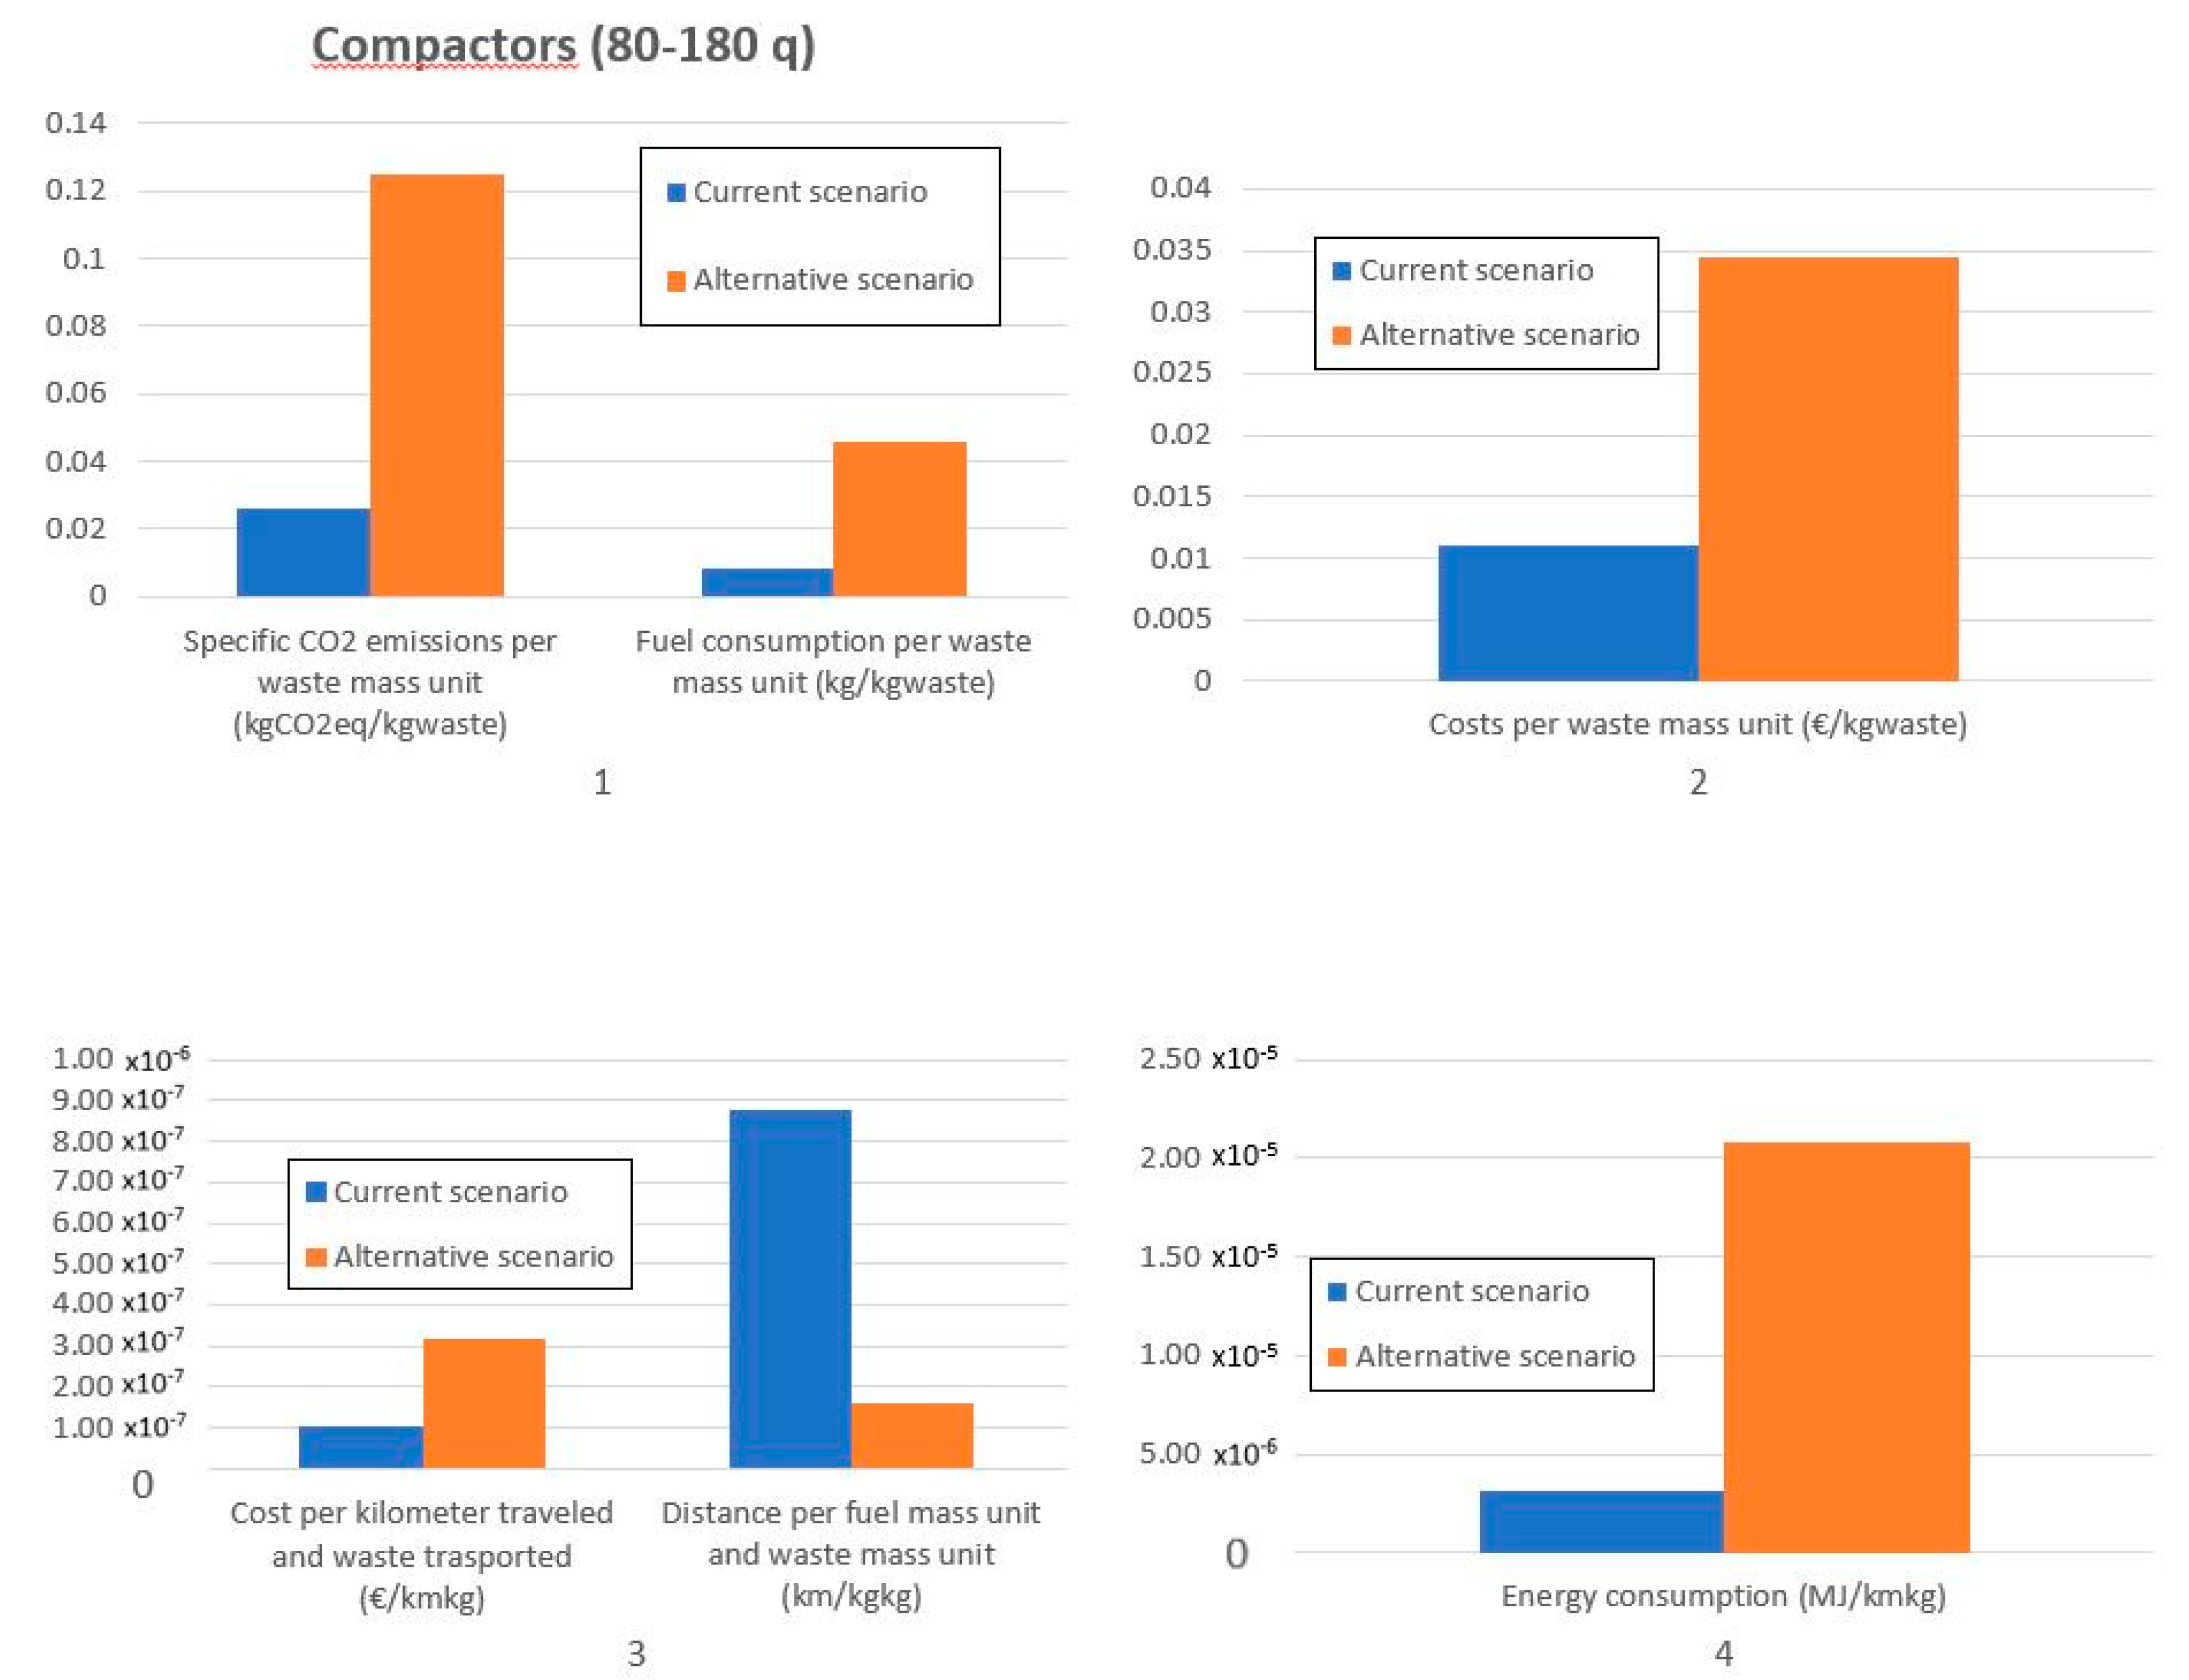
As far as the category compactors (80–180 q) is concerned, the alternative scenario is supposed to release into the atmosphere about 487,590 kgCO2eq, while the CO2 emissions for the current scenario are 102,111 kgCO2eq, with a consequent significant worsening in the environmental performance (+377%). Fuel consumption in the alternative scenario is 177,523 kg compared to 31,912 kg of the current scenario (+456%). Total expenditure for refuel is 134,568 €, higher than that in the current case, equal to 42,989 € (+213%); therefore, an increase in the weight of the vehicle also causes an increase in disadvantages.
In Figure 3, Graph 1 shows the comparison between the current scenario and the alternative scenario in terms of specific emissions and fuel consumption per waste mass unit. CO2 emissions change from 0.026 kgCO2eq kgwaste−1 to 0.125 kgCO2eq kgwaste−1, while fuel consumption changes from 0.008 kgfuel kgwaste−1 to 0.04 kgfuel kgwaste−1. In Graph 2, costs change from 0.01 € kgwaste−1 to 0.03 € kgwaste−1.
Graph 3 shows specific costs per kilometer traveled and waste mass unit and fuel economy expressed in kilometers per fuel mass unit and waste mass unit. Specific costs are more than doubled in the alternative scenario, changing from about 1.0 × 10⁻⁷ € km−1kgwaste−1 to about 3.15 × 10⁻⁷ € km−1kgwaste−1. Fuel economy in the alternative scenario is 1.5 × 10⁻⁷ km kg−1kg−1, while that in the current case is 8.7 × 10⁻⁷ km kg−1kg−1 (−82%). The alternative energy consumption, shown in Graph 4, is 2.1 × 10⁻⁵ MJ km−1kg−1, while that for diesel is 3.2 × 10⁻⁶ MJ km−1kg−1, so there is a loss of 1.7 × 10⁻⁵ MJ km−1kg−1.
For the category of Compactors with a total weight in the range 80–180 q, the replacement of diesel vehicles with CNG vehicles brings important disadvantages, such as the increase in the CO2 emissions, the total costs, in the total amount of fuel used and in the specific energy consumption. These disadvantages are greater for the compactors (80–180 q) than for the compactors (35–75 q).
This study shows diesel consumption in the current scenario equal to 6 kgfuel twaste−1 (Compactors 35–75 q) and 8 kgfuel twaste−1 (Compactors 80–180 q), showing the lowest diesel consumption with lower waste amount picked up per route. The current specific fuel consumption is consistent with data from other analyses [27].
Comparing the results obtained here in terms of CO2 emissions in the current scenario (20 kgCO2eq twaste−1 for Compactors 35–75 q and 26 kgCO2eq twaste−1 for Compactors 80–180 q) with those of similar studies, they fall in the same range: Eisted et al. [28] reported a range of 5–50 kgCO2eq twaste−1 for developed countries.
3.2.2. Porter Vehicles
Porter vehicles are a group used for MSW collection and transport and in this category. There are gasoline, diesel and LPG vehicles. The alternative scenario for the category of porter vehicles is analyzed assuming a replacement of gasoline or diesel vehicles with LPG vehicles. Figure 4 shows the comparison between the performance of the current fleet of gasoline porter vehicles and that in the alternative scenario assuming LPG porter vehicles.
From Figure 4, the following considerations can be made. Graph 1 shows the specific CO2 emissions and fuel consumption, while Graph 2 shows the specific costs in terms of the waste mass unit: specific CO2 emissions and costs are reduced, changing respectively from 0.03 kgCO2eq kgwaste−1 to 0.02 kgCO2eq kgwaste−1 and from 0.016 € kgwaste−1 to 0.013 € kgwaste−1. Fuel economy, in contrast, increases from 0.013 Lfuel kgwaste−1 to 0.016 Lfuel kgwaste−1. In Graph 3, it can be seen that the amount of kilometers per fuel liter per mass unit of transported waste is lower in the alternative scenario with respect to the current case (7.4 × 10⁻⁶ km L−1kg−1 instead of 8.7 × 10⁻⁶ km L−1kg−1, −15%). Another disadvantage is the slight increase in the energy consumption of LPG vehicles, 5.4 × 10⁻⁶ MJ km−1kg−1, while that for the gasoline fleet is 5.3 × 10⁻⁶ MJ km−1kg−1 (+2%). Specific costs per kilometer traveled and waste transported change from 2.10 × 10⁻⁷ € km−1kgwaste−1 to 1.62 × 10⁻⁷ € km−1kgwaste−1.
Summarizing the global results, there are some beneficial effects in the alternative scenario with respect to the current scenario, consisting in a reduction of the total CO2 emissions, changing from 24,886 kgCO2eq to 22,416 kgCO2eq (−10%), and a reduction of total costs (10,786 € instead of 13,931 €) (−23%), even though the fuel consumption increases from 11,296 L to 13,338 L (+18%).
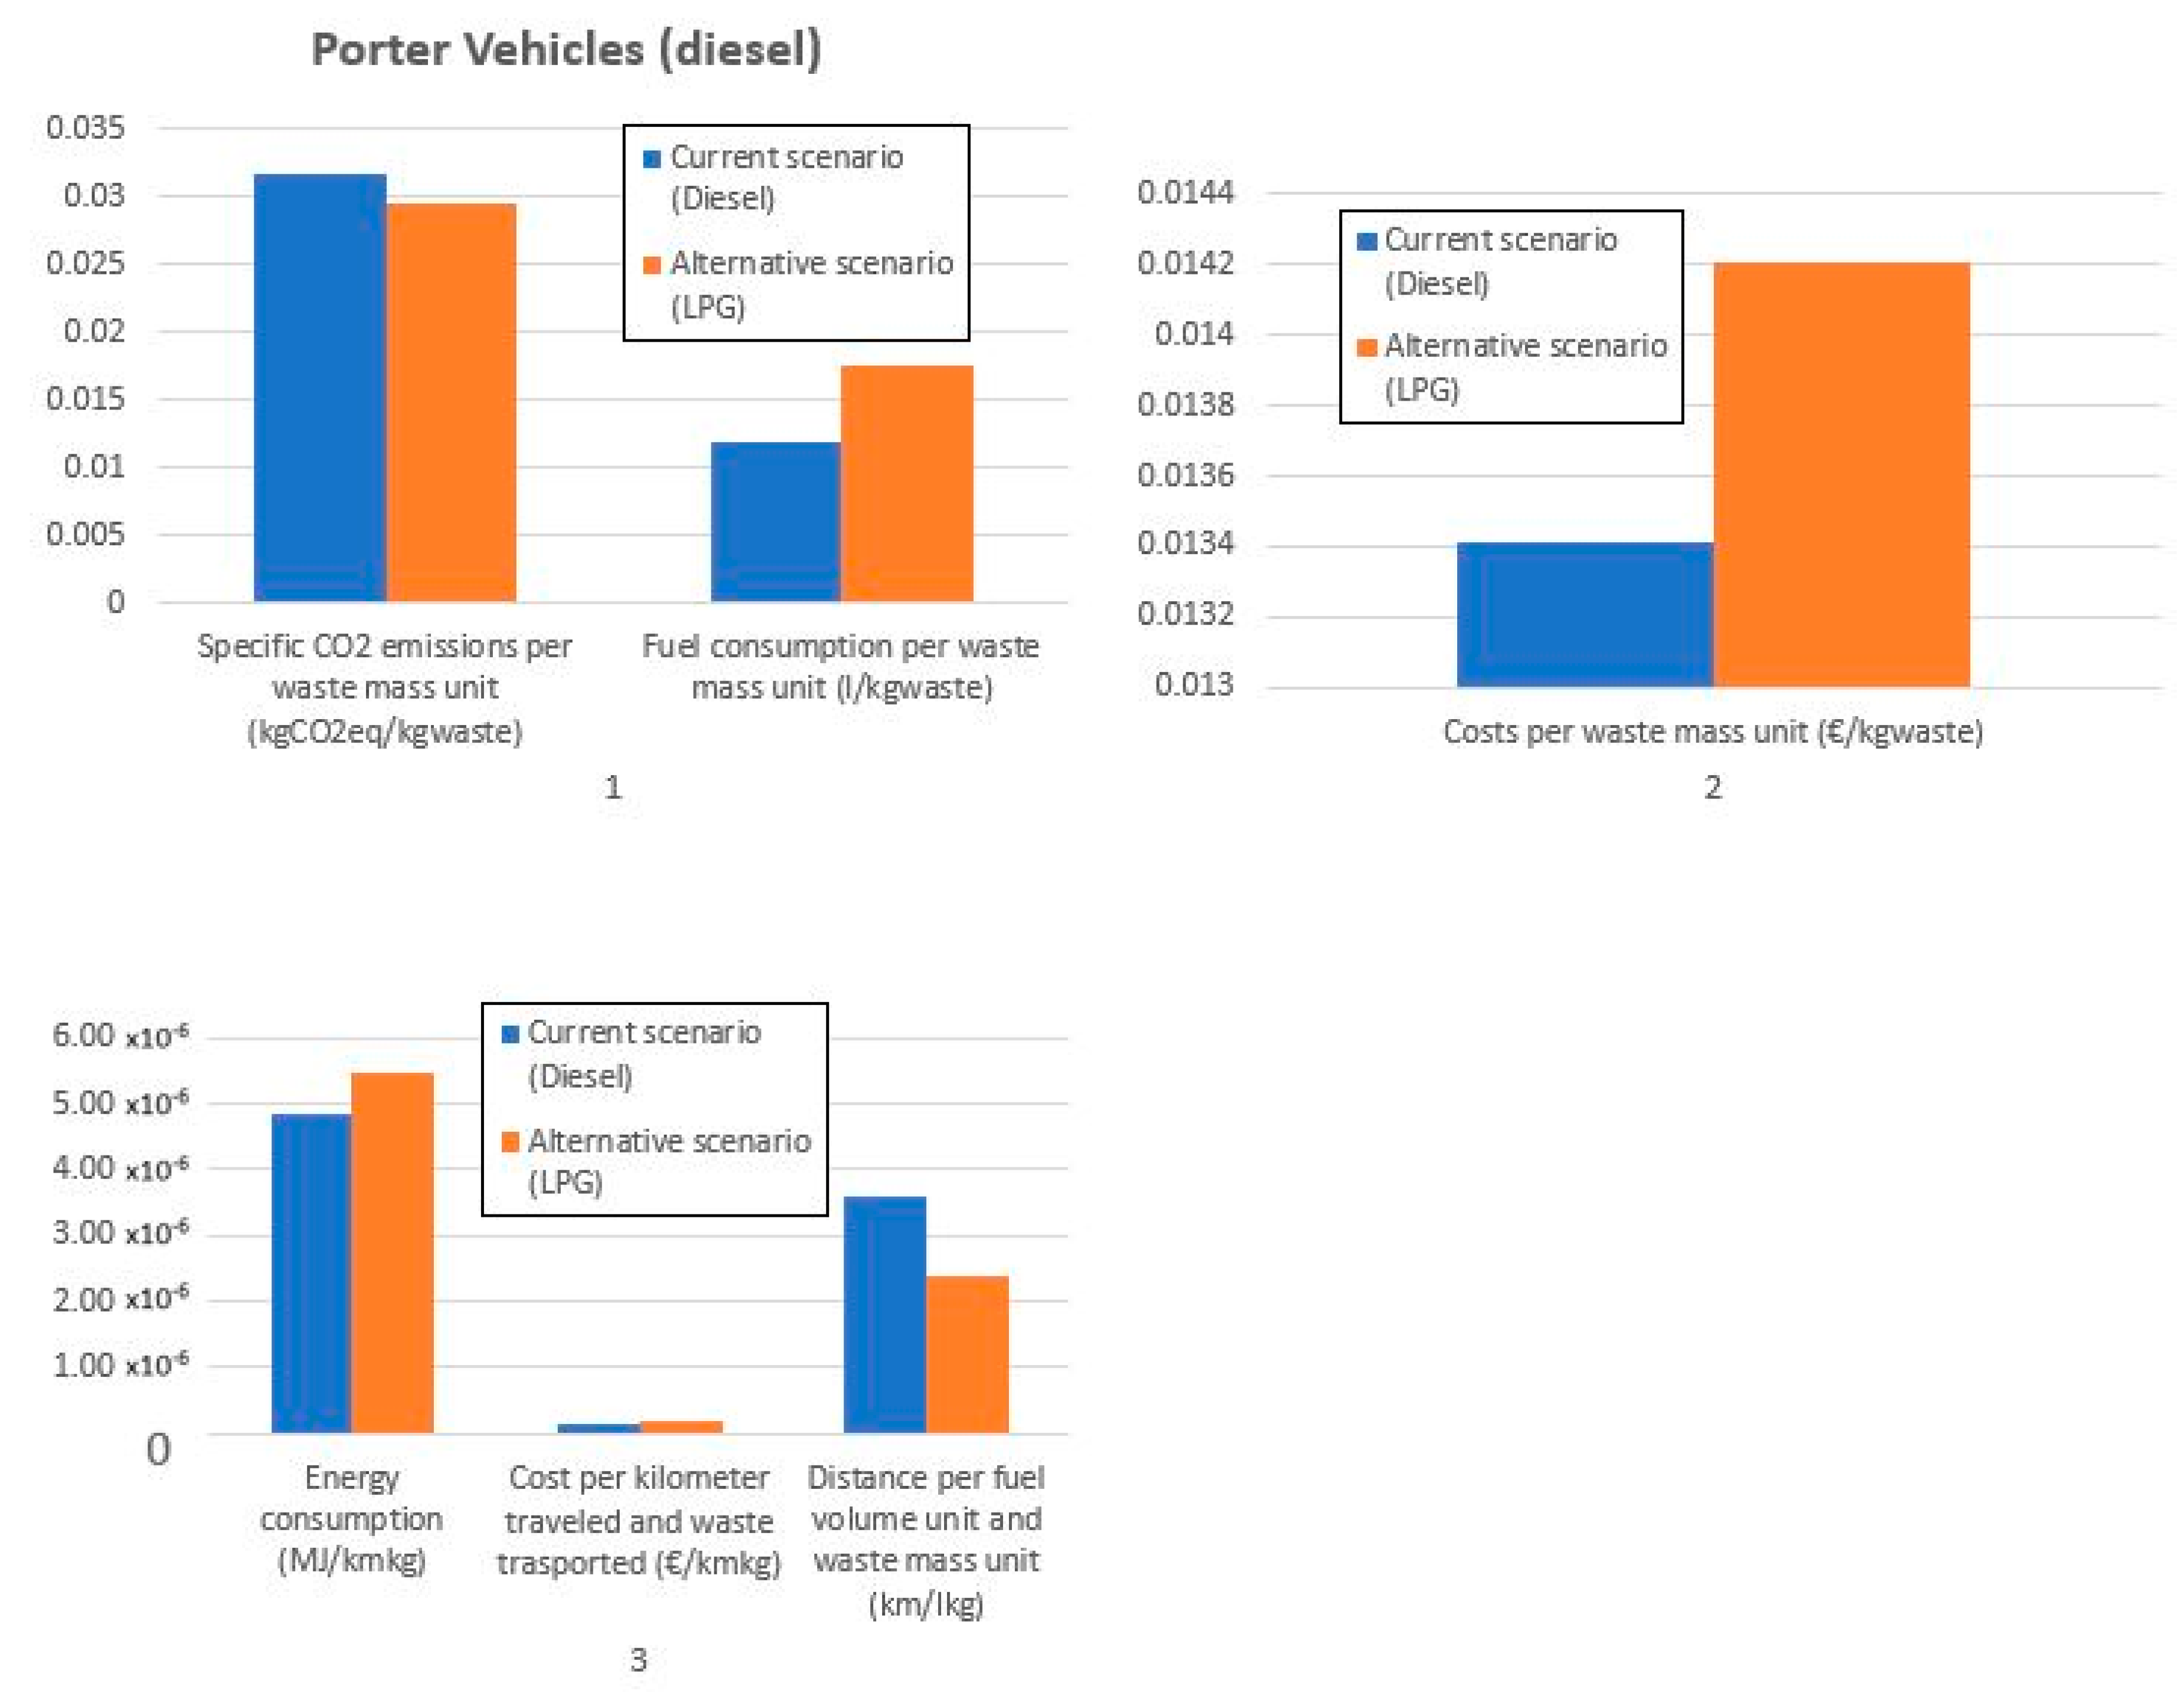
Figure 5 shows the comparison between the performance of the current fleet of diesel porter vehicles and that in the alternative scenario assuming the substitution of diesel vehicles with LPG porter vehicles.
Graph 1 shows that the replacement of diesel vehicles with LPG vehicles leads to a slight decrease of the specific CO2 emissions, equal to 0.029 kgCO2eq kgwaste−1. Fuel economy (Graph 1) and specific costs (Graph 2) get worse (0.017 Lfuel kgwaste−1 and 0.014 € kgwaste−1 in the alternative scenario).
Considering the global performance, the total CO2 emissions decrease from 45,545 kgCO2eq to 42,495 kgCO2eq (−7%). The increase in fuel consumption and total costs is, respectively, 25,286 L instead of 16,945 L in the current case (+49%), and 20,448 € instead of 19,295 € of the diesel vehicles (+6%). Energy consumption changes from 4.8 × 10⁻⁶ MJ km−1kg−1 in the current diesel scenario to 5.5 × 10⁻⁶ MJ km−1kg−1 for LPG vehicles (+13%). Specific costs per kilometer traveled and waste transported change from 1.53 × 10⁻⁷ € km−1kgwaste−1 to 1.62 × 10⁻⁷ € km−1kgwaste−1. Fuel economy is worse for the LPG case, 2.4 × 10⁻⁶ km L−1 kg−1, while that for diesel vehicles is 3.5 × 10⁻⁶ km L−1kg−1 (−33%).
So far, it can be concluded that for low-capacity vehicles, the fuel replacement is the least suitable approach, increasing the impact and the total costs. Moreover, for high capacity vehicles, fuel replacement seems to have more disadvantages in terms of energy consumption and costs.
3.2.3. Compactors (180–330 q)
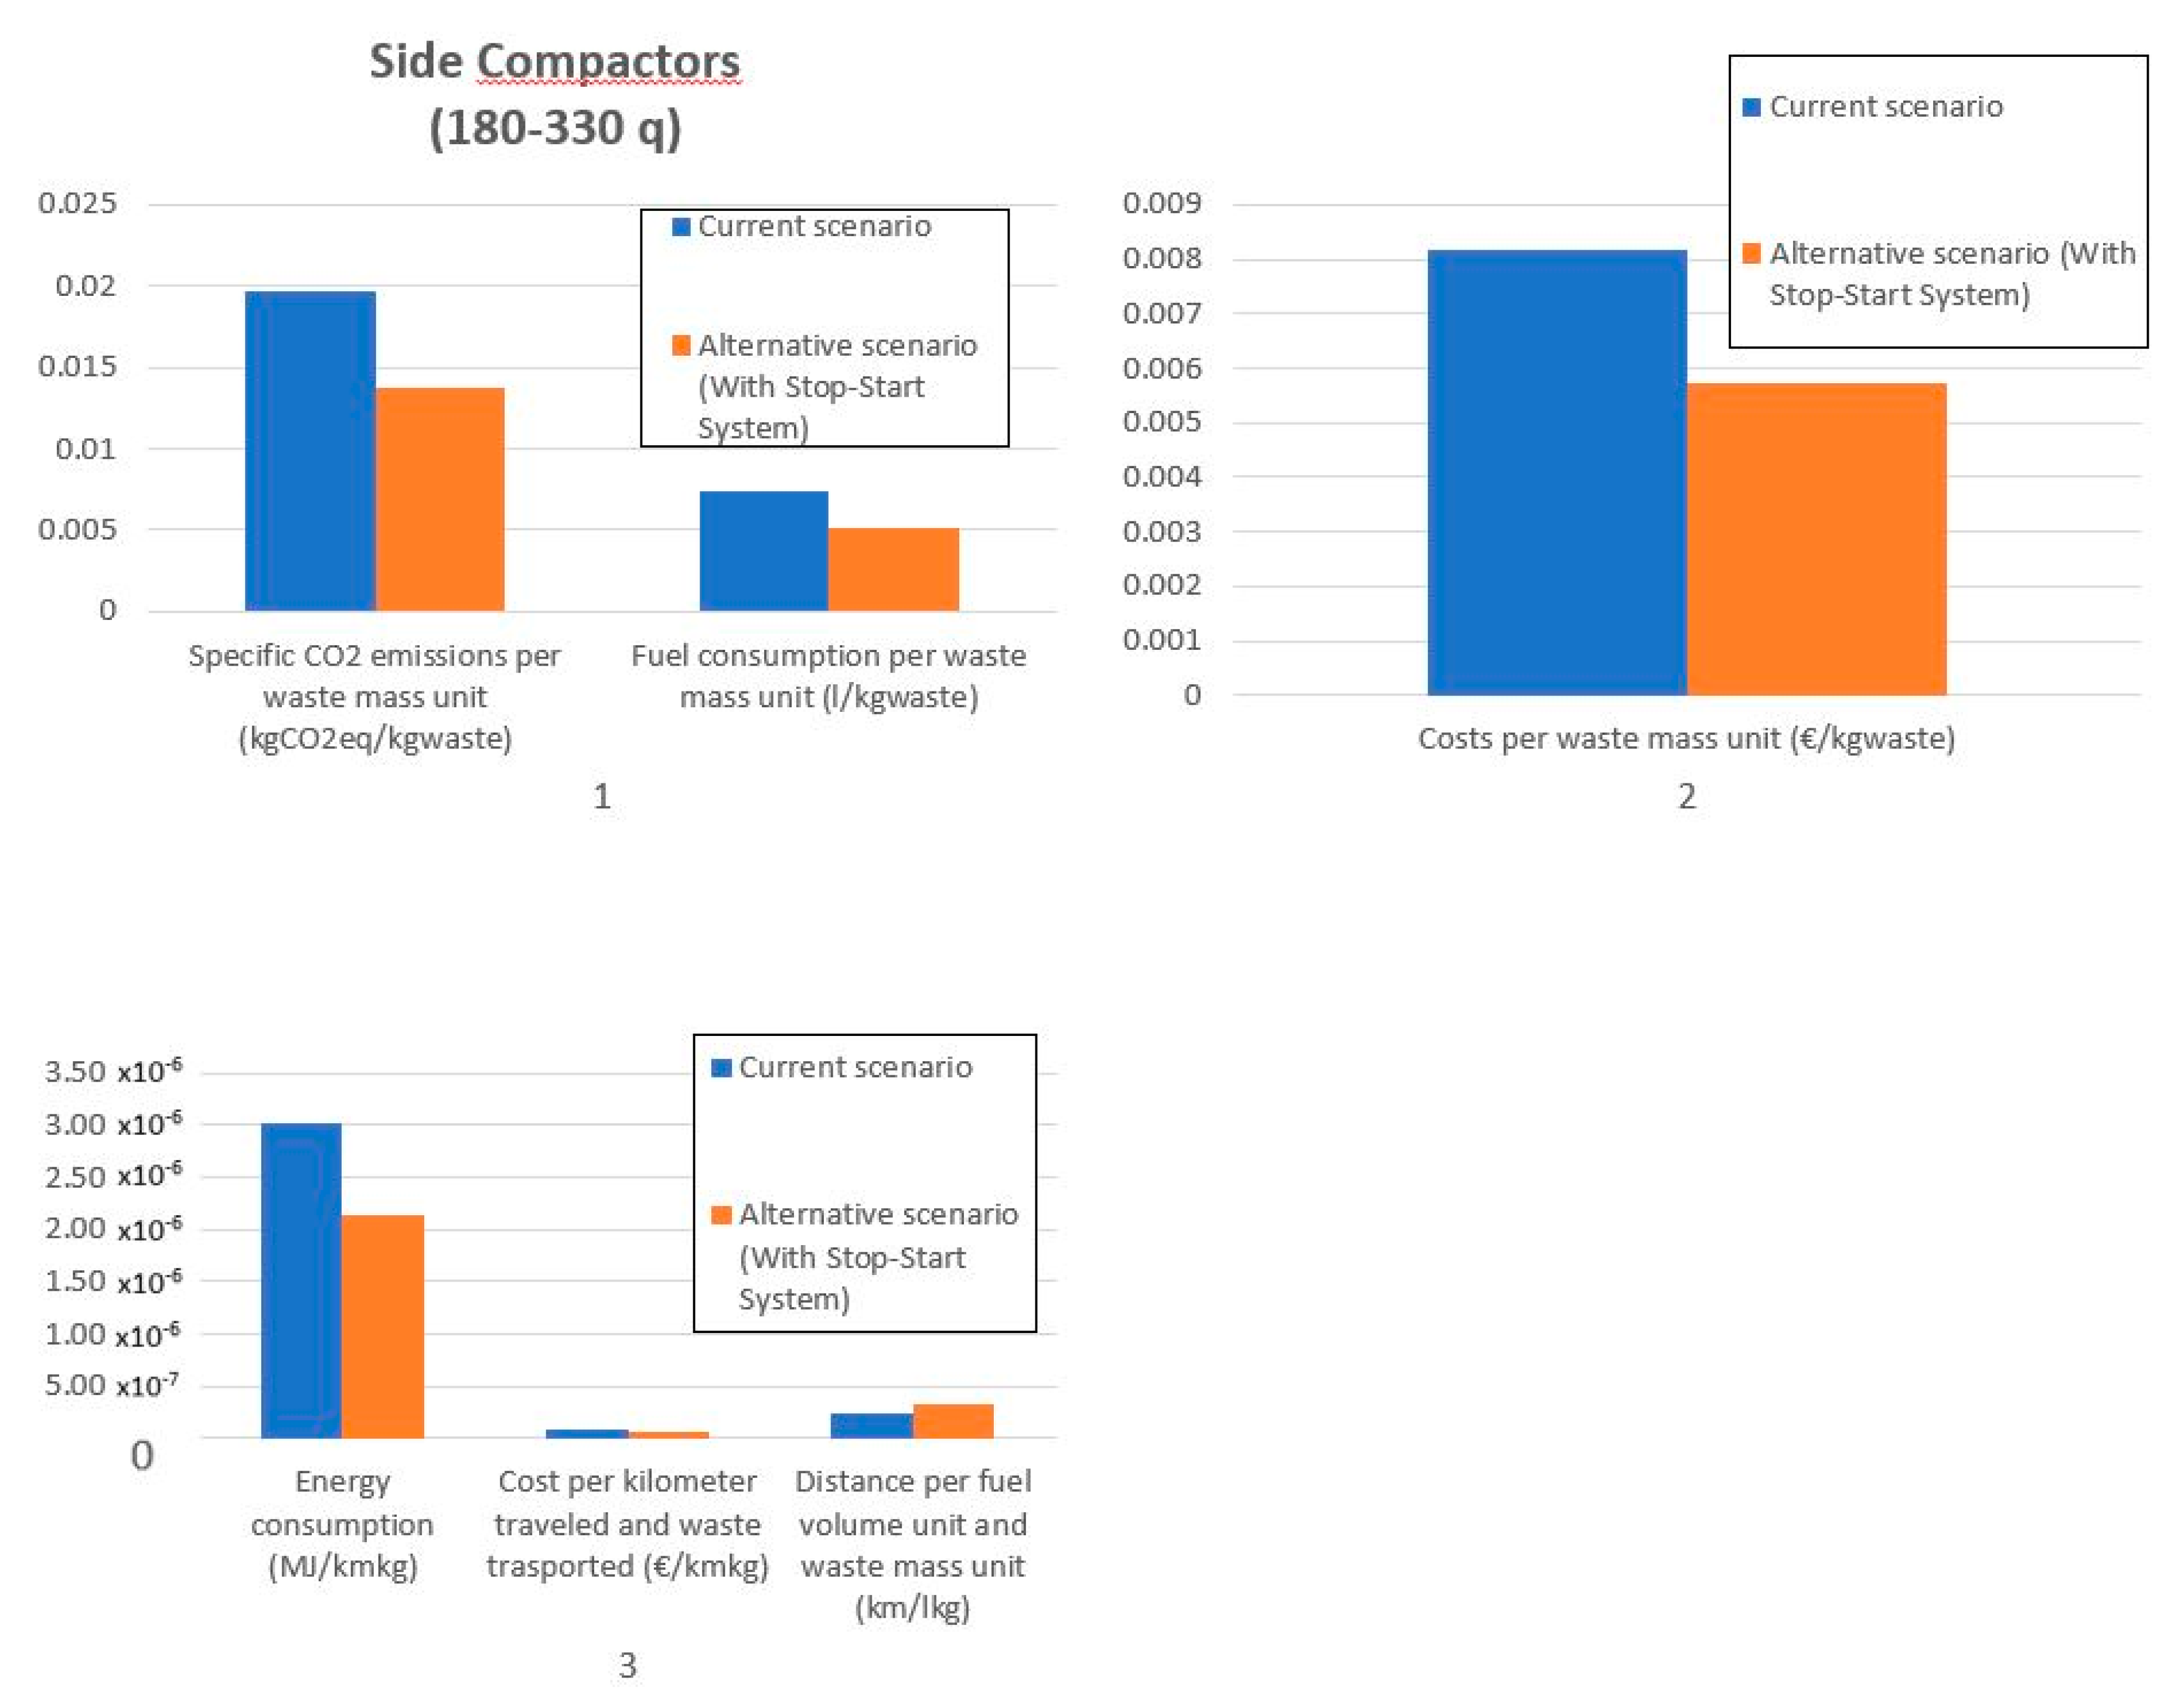
An alternative solution is the installation of a Stop-Start System to improve the energy and environmental efficiency of the heavy vehicles. A solution present on the market is analyzed. The proposed alternative scenario is constituted by heavy MSW collection vehicles equipped with a Stop-Start System, which produces a 30% reduction in consumption (as stated by the manufacturer), but at the same time also an increase in weight of 290 kg.
The alternative scenario with a Stop-Start System installed on heavy side compactors is supposed to release about 97,898 kgCO2eq, while the current fleet releases 136,230 kgCO2eq, achieving a significant improvement in environmental performance (−28%). There is a reduction of fuel consumption and total costs, passing respectively from 50,685 L to 36,423 L, and from 56,518 € and 40,615 € (for both there is a decrease of −28%).
Figure 6 shows a comparison between the current fleet of Side Compactors (180–330 q) and the same fleet equipped with the Stop-Start System on board, considering both energy consumption reduction and weight increase. There is a reduction of all the specific parameters (Graph 1 and Graph 2). In Graph 3, fuel economy improves also in terms of kilometers per fuel liter per mass unit of transported waste, reaching 3.4 × 10⁻⁷ km kg−1L−1, instead of 2.5 × 10⁻⁷ km kg−1L−1 (+37%). The Stop-Start System globally affects positively energy consumption, with a reduction to 2 × 10⁻⁶ MJ km−1kg−1, with respect to the value in the current case equal to 3 × 10⁻⁶ MJ km−1kg−1 (−29%). Specific costs per kilometer traveled and waste transported change from 9.36 × 10⁻⁸ € km−1kgwaste−1 to 6.60 × 10⁻⁸ € km−1kgwaste−1.
3.2.4. Three-Wheelers
Different results are obtained for MSW collection vehicles with lower capacity, such as the Three-Wheelers category; the results of this category are shown graphically in the Supplementary Material (Figure S4). The CO2 emissions increase with the installation of a Stop-Start System on the Three-Wheeler vehicles, passing from 940 kgCO2eq of the current case to 1662 kgCO2eq in the Start-stop system scenario (+77%). The Stop-Start System negatively affects also other parameters, such as the fuel consumption, which reaches 754 L instead of 426 L (+77%), and the total costs, which change from 526 € to 930 € (+77%). Fuel economy with a Stop-Start System is equal to 2 × 10⁻⁴ km kg−1L−1, instead of 7 × 10⁻⁴ km kg−1L−1 (−73%). The specific parameters per waste mass unit have the following modifications: the CO2 emissions in the alternative scenario change from 0.06 kgCO2eq kgwaste−1 to 0.11 kgCO2eq kgwaste−1; fuel consumption change from 0.03 Lfuel kgwaste−1 to 0.05 Lfuel kgwaste−1 and the costs increase from 0.03 € kgwaste−1 to 0.06 € kgwaste−1.
Energy consumption, instead, improves as the value in case of Stop-Start System installation is 1.8 × 10⁻⁴ MJ km−1kg−1, while in the current case it is 2 × 10⁻⁴ MJ km−1kg−1 (−15%). So even though a Stop-Start System results in a slight specific energy saving, environmental impact and costs get worse, mainly due to the weight increase, which has a bigger influence on vehicles with lower capacity.
3.3. Discussion
Table 3 describes the main results obtained for each category of vehicles, divided into advantages, disadvantages and impacts.
The substitution of diesel fuel with CNG is positive from every point of view only in the case of passenger cars: the results confirm the relevance of using CNG in substitution to diesel in light-duty vehicles. This is consistent with other data in the literature. Borderlanne et al. [29] stated that with CNG as fuel, emissions may be cut by up to 51%. Our results show a reduction in total CO2 emissions, maintaining the same route, equal to 26%.
The alternative scenario for compactors’ categories leads instead to completely different results. The diesel replacement with CNG has only disadvantages, there is a worsening in carbon footprint, fuel consumption, economic and energy impact and route performance. This is consistent with other results in the literature. Maimun et al. [19] used multi-level multi-criteria analysis, based on life-cycle emissions, water footprint, power density and financial criteria, to rank fuel alternatives. The study shows that conventional diesel is still the best option in the US scenario for heavy compactors, and that CNG is completely disadvantageous.
As discussed in [30], the current heavy-duty CNG engines are spark-ignition engines operating on the Otto cycle, for which the thermal efficiency is lower than for diesels. Generally, the higher H/C ratio in natural gas compensates for the lower efficiency, resulting in CO2 emissions lower than from diesels. Nevertheless, there are studies in the literature that demonstrate a strong dependency of the emission benefits from the specific route traveled by the compactors. In [31], the authors found that CO2eq emissions of the CNG vehicle range from −13 to +12% with respect to those of the diesel vehicle, depending on the route and its characteristics. Thus, our results corroborate the thesis for which vehicle performance is heavily dependent upon the local orography: in the present case study, the considered area has a sloping landscape, thus resulting in worse values of the selected parameters. This issue should be taken into account by decision-makers when selecting the waste collection fleet. The use of LPG in porter vehicles results only in environmental benefits, consisting in a reduction of 7–10% in CO2 emissions. Other results in the literature show a strong reduction of CO2 emissions with LPG [32].
The Stop-Start System gives benefits from an energy, environmental and economic point of view for heavy compactors, while it has no positive effects for lighter vehicles, such as the three wheelers. As already evaluated by [18], repetitive stops and starts during waste collection, especially in a door-to-door approach as in the scenario evaluated in the present paper, generated more emissions with respect to the constant speed driving. This could be cut by the use of the Stop-Start System in heavy compactors. Results in the present paper show a CO2 emission reduction of 28%, while, in the literature, tests on four-wheel-drive diesel vehicles result in a 20% reduction due to better global energy efficiency [33].
4. Conclusions
This work aims to analyze the energy and carbon footprint of an urban waste collection fleet of an Italian company operating in Central Italy, and developing two possible alternative solutions. One is the replacement of part of the fleet with vehicles that use alternative fuels, such as CNG and LPG. The second solution is the use of Stop-Start Systems to improve the environmental and energy performance of vehicles with higher net capacity. For both the proposed solutions, benefits and disadvantages were assessed.
The comparative analysis is discussed for some of the vehicle categories used by the company. For passenger cars, a category of vehicles not dedicated to MSW transport, the alternative solution based on an entire fleet of dual CNG vehicles brings to a reduction of the CO2 emissions equal to 2675 kgCO2eq and a reduction in energy consumption equal to 1.96 MJ per kilometer, without any economic disadvantage.
Regarding MSW transport low-capacity vehicles, the alternative solution based on an entire fleet of CNG vehicles, the following significant disadvantages may be obtained: an increase of 20 kgCO2eq released into the atmosphere per ton of waste transported for Compactors (35–75 q) and an increase of 90 kgCO2eq released into the atmosphere per ton of waste transported for Compactors (80–180 q). Both categories report a worsening in all the considered parameters. There is an economic disadvantage, which increases with high-capacity vehicles, with an increase of 2947 € for Compactors (35–75 q) and an increase of 91,578 € for Compactors (80–180 q). Thus, it can be concluded that the alternative scenario is characterized by no benefit, the use of CNG as a fuel for vehicles dedicated to MSW transport is not economically, energetically, or environmentally convenient.
The alternative LPG-based scenario for Porter Vehicles does not produce significant results from an energy, environmental, economic, or fuel consumption point of view.
Finally, for MSW transport high-capacity vehicles, side Compactors (180–330 q), we propose the installation of a Stop-Start System, which has the following benefits: a saving of 38,332 kgCO2eq and a saving of 8.8 × 10⁻⁷ MJ km−1kg−1. The Stop-Start System does not seem to produce economic disadvantages in terms of fuel economy, but this analysis needs to be further investigated also considering investment, installation, and maintenance costs. On the three-wheeler vehicles, the installation of the Stop-Start System is completely disadvantageous.
Further developments concern the detailed study of the specific weight of each type of transported waste, in order to precisely calculate the actual coefficient of use of the vehicle with respect to its net capacity, and to optimize the vehicles’ used volume with respect to its net capacity.
Finally, there emerges a strong dependency of performance on the specific route traveled, and this should be further explored.
Supplementary Materials
The following are available online at https://0-www-mdpi-com.brum.beds.ac.uk/2313-4321/5/4/25/s1, Figure S1: Municipalities served by the MSW collection fleet, Figure S2: Kilometers travelled by: (1) vehicles for people transport (cars and trucks) and operating machines; (2) MSW transport vehicles, Figure S3: Waste routes, Figure S4: Comparison between the current scenario and the alternative scenario (with Stop-Start System)—Three-wheelers, Table S1. Chemical-physical properties of fuels.
Author Contributions
Conceptualization, A.Q. and B.C.; methodology, A.Q. and B.C.; formal analysis, A.Q.; investigation, A.Q.; writing—original draft preparation, A.Q.; writing—review and editing, B.C.; supervision, B.C. All authors have read and agreed to the published version of the manuscript.
Funding
This research received no external funding.
Acknowledgments
The authors would like to acknowledge Chiara Consalvi, GESENU SpA, for the precious contribution on data collection.
Conflicts of Interest
The authors declare no conflict of interest.
References
- Santamouris, M.; Ban-Weiss, G.; Osmond, P.; Paolini, R.; Synnefa, A.; Cartalis, C.; Muscio, A.; Zinzi, M.; Morakinyo, T.E.; Ng, E.; et al. Progress in urban greenery mitigation science—Assessment methodologies advanced technologies and impact on cities. J. Civ. Eng. Manag. 2018, 24, 638–671. [Google Scholar] [CrossRef] [Green Version]
- ISPRA—Istituto Superiore per la Protezione e la Ricerca Ambientale. Rapporto Rifiuti Urbani. Edizione 2019; ISPRA—Istituto Superiore per la Protezione e la Ricerca Ambientale: Rome, Italy, 2019.
- EU Commission. Directive 2008/98/EC of the European Parliament and of the Council on Waste and Repealing Certain Directives; EU Commission: Strasbourg, France, 2008. [Google Scholar]
- Sasikumar, K.; Krishna, S.G. Solid Waste Management; PHI Learning Pvt. Ltd.: Delhi, India, 2009; ISBN 8120338693. [Google Scholar]
- Castellani, B.; Morini, E.; Filipponi, M.; Nicolini, A.; Palombo, M.; Cotana, F.; Rossi, F. Comparative analysis of monitoring devices for particulate content in exhaust gases. Sustainability 2014, 6, 4287–4307. [Google Scholar] [CrossRef] [Green Version]
- Pires, A.; Martinho, G.; Rodrigues, S.; Gomes, M.I. Collection: The strongest link for a sustainable solid waste management. Waste Manag. Res. 2020, 38, 107. [Google Scholar] [CrossRef] [PubMed]
- Ghose, M.K.; Dikshit, A.K.; Sharma, S.K. A GIS based transportation model for solid waste disposal—A case study on Asansol municipality. Waste Manag. 2006, 26, 1287–1293. [Google Scholar] [CrossRef]
- Sonesson, U. Modelling of waste collection—A general approach to calculate fuel consumption and time. Waste Manag. Res. 2000, 18, 115–123. [Google Scholar] [CrossRef]
- Zbib, H.; Wøhlk, S. A comparison of the transport requirements of different curbside waste collection systems in Denmark. Waste Manag. 2019, 87, 21–32. [Google Scholar] [CrossRef]
- Ghiani, G.; Lagana, D.; Manni, E.; Musmanno, R.; Vigo, D. Operations research in solid waste management: A survey of strategic and tactical issues. Comput. Oper. Res. 2014, 44, 22–32. [Google Scholar] [CrossRef]
- Dotoli, M.; Epicoco, N. A Vehicle Routing Technique for Hazardous Waste Collection. IFAC Pap. 2017, 50, 9694–9699. [Google Scholar] [CrossRef]
- Yadav, V.; Bhurjee, A.K.; Karmakar, S.; Dikshit, A.K. A facility location model for municipal solid waste management system under uncertain environment. Sci. Total Environ. 2017, 603, 760–771. [Google Scholar] [CrossRef]
- Tung, D.V.; Pinnoi, A. Vehicle routing-scheduling for waste collection in Hanoi. Eur. J. Oper. Res. 2000, 125, 449–468. [Google Scholar] [CrossRef]
- Markov, I.; Varone, S.; Bierlaire, M. Integrating a heterogeneous fixed fleet and a flexible assignment of destination depots in the waste collection VRP with intermediate facilities. Transp. Res. Part B Methodol. 2016, 84, 256–273. [Google Scholar] [CrossRef] [Green Version]
- Yadav, V.; Karmakar, S.; Dikshit, A.K.; Vanjari, S. A feasibility study for the locations of waste transfer stations in urban centers: A case study on the city of Nashik, India. J. Clean. Prod. 2016, 126, 191–205. [Google Scholar] [CrossRef]
- Asefi, H.; Shahparvari, S.; Chhetri, P.; Lim, S. Variable fleet size and mix VRP with fleet heterogeneity in Integrated Solid Waste Management. J. Clean. Prod. 2019, 230, 1376–1395. [Google Scholar] [CrossRef]
- Saucedo Martinez, J.A.; Mendoza, A.; Alvarado Vazquez, M. Collection of Solid Waste in Municipal Areas: Urban Logistics. Sustainability 2019, 11, 5442. [Google Scholar] [CrossRef] [Green Version]
- Maimoun, M.A.; Reinhart, D.R.; Gammoh, F.T.; McCauley Bush, P. Emissions from US waste collection vehicles. Waste Manag. 2013, 33, 1079–1089. [Google Scholar] [CrossRef]
- Maimoun, M.; Madani, K.; Reinhart, D. Multi-level multi-criteria analysis of alternative fuels for waste collection vehicles in the United States. Sci. Total Environ. 2016, 550, 349–361. [Google Scholar] [CrossRef] [Green Version]
- Pastorello, C.; Dilara, P.; Martini, G. Effect of a change towards compressed natural gas vehicles on the emissions of the Milan waste collection fleet. Transp. Res. Part. D Transp. Environ. 2011, 16, 121–128. [Google Scholar] [CrossRef]
- Liang, H.; Ren, J.; Lin, R.; Liu, Y. Alternative-fuel based vehicles for sustainable transportation: A fuzzy group decision supporting framework for sustainability prioritization. Technol. Forecast. Soc. Chang. 2019, 140, 33–43. [Google Scholar] [CrossRef]
- Zhao, Y.; Tatari, O. Carbon and energy footprints of refuse collection trucks: A hybrid life cycle evaluation. Sustain. Prod. Consum. 2017, 12, 180–192. [Google Scholar] [CrossRef]
- Agovino, M.; Ferrara, M.; Garofalo, A. An exploratory analysis on waste management in Italy: A focus on waste disposed in landfill. Land Use Policy 2016, 57, 669–681. [Google Scholar] [CrossRef]
- Di Maria, F.; Sisani, F.; Contini, S.; Ghosh, S.K.; Mersky, R.L. Is the policy of the European Union in waste management sustainable? An assessment of the Italian context. Waste Manag. 2020, 103, 437–448. [Google Scholar] [CrossRef] [PubMed]
- DEFRA. Government GHG Conversion Factors For Company Reporting. Methodology Paper for Emission Factors: Final Report. 2018. Available online: https://assets.publishing.service.gov.uk/government/uploads/system/uploads/attachment_data/file/726911/2018_methodology_paper_FINAL_v01-00.pdf (accessed on 15 April 2020).
- Effenco Hybrid Solutions, Cost Effective Electric Technology. Available online: https://www.effenco.com/ (accessed on 15 April 2020).
- Larsen, A.W.; Vrgoc, M.; Christensen, T.H.; Lieberknecht, P. Diesel consumption in waste collection and transport and its environmental significance. Waste Manag. Res. 2009, 27, 652–659. [Google Scholar] [CrossRef] [PubMed]
- Eisted, R.; Larsen, A.W.; Christensen, T.H. Collection, transfer and transport of waste: Accounting of greenhouse gases and global warming contribution. Waste Manag. Res. 2009, 27, 738–745. [Google Scholar] [CrossRef] [PubMed]
- Bordelanne, O.; Montero, M.; Bravin, F.; Prieur-Vernat, A.; Oliveti-Selmi, O.; Pierre, H.; Papadopoulo, M.; Muller, T. Biomethane CNG hybrid: A reduction by more than 80% of the greenhouse gases emissions compared to gasoline. J. Nat. Gas. Sci. Eng. 2011, 3, 617–624. [Google Scholar] [CrossRef]
- López, J.M.; Gómez, Á.; Aparicio, F.; Sánchez, F.J. Comparison of GHG emissions from diesel, biodiesel and natural gas refuse trucks of the City of Madrid. Appl. Energy 2009, 86, 610–615. [Google Scholar] [CrossRef]
- Quiros, D.C.; Smith, J.; Thiruvengadam, A.; Huai, T.; Hu, S. Greenhouse gas emissions from heavy-duty natural gas, hybrid, and conventional diesel on-road trucks during freight transport. Atmos. Environ. 2017, 168, 36–45. [Google Scholar] [CrossRef]
- Simsek, S.; Uslu, S. Investigation of the impacts of gasoline, biogas and LPG fuels on engine performance and exhaust emissions in different throttle positions on SI engine. Fuel 2020, 279, 118528. [Google Scholar] [CrossRef]
- Fonseca, N.; Casanova, J.; Valdés, M. Influence of the stop/start system on CO2 emissions of a diesel vehicle in urban traffic. Transp. Res. Part D Transp. Environ. 2011, 16, 194–200. [Google Scholar] [CrossRef] [Green Version]
Figure 1.
Comparison between the current scenario and the alternative scenario—Passenger cars (Graph 1: CO2 emissions and fuel consumption, Graph 2: total costs, Graph 3: specific distance per fuel mass unit, Graph 4: specific energy consumption and costs per kilometer).
Figure 1.
Comparison between the current scenario and the alternative scenario—Passenger cars (Graph 1: CO2 emissions and fuel consumption, Graph 2: total costs, Graph 3: specific distance per fuel mass unit, Graph 4: specific energy consumption and costs per kilometer).

Figure 2.
Comparison between the current scenario and the alternative scenario—Compactors (35–75 q) (Graph 1: specific CO2 emissions and fuel consumption per waste mass unit, Graph 2: specific costs per waste mass unit, Graph 3: specific costs and distance, Graph 4: specific energy consumption per kilometer traveled and waste mass unit).

Figure 3.
Comparison between the current scenario and the alternative scenario—Compactors (80–180 q) (Graph 1: specific CO2 emissions and fuel consumption per waste mass unit, Graph 2: specific costs per waste mass unit, Graph 3: specific costs and distance, Graph 4: specific energy consumption per kilometer traveled and waste mass unit).

Figure 4.
Comparison between the current scenario and the alternative scenario—Porter vehicles (gasoline) (Graph 1: specific CO2 emissions and fuel consumption per waste mass unit, Graph 2: specific costs per waste mass unit, Graph 3: specific energy consumption, costs and distance).
Figure 4.
Comparison between the current scenario and the alternative scenario—Porter vehicles (gasoline) (Graph 1: specific CO2 emissions and fuel consumption per waste mass unit, Graph 2: specific costs per waste mass unit, Graph 3: specific energy consumption, costs and distance).

Figure 5.
Comparison between the current scenario and the alternative scenario—Porter vehicles (diesel) (Graph 1: specific CO2 emissions and fuel consumption per waste mass unit, Graph 2: specific costs per waste mass unit, Graph 3: specific energy consumption, costs and distance).
Figure 5.
Comparison between the current scenario and the alternative scenario—Porter vehicles (diesel) (Graph 1: specific CO2 emissions and fuel consumption per waste mass unit, Graph 2: specific costs per waste mass unit, Graph 3: specific energy consumption, costs and distance).

Figure 6.
Comparison between the current scenario and the alternative scenario (with Stop-Start System)—Side compactors (180–330 q)—(Graph 1: specific CO2 emissions and fuel consumption per waste mass unit, Graph 2: specific costs per waste mass unit, Graph 3: specific energy consumption, costs and distance).


Table 1.
Categories of vehicles.
| Category | Fuel | Number of Vehicles | Vehicles with Refueling Only | MSW Transport Vehicles | |
|---|---|---|---|---|---|
| 1 | #N/D | Diesel | 4 | 4 | 0 |
| 2 | Passenger car | Diesel | 11 | 39 | 0 |
| CNG/gasoline | 28 | ||||
| 3 | Truck | Gasoline | 1 | 15 | 0 |
| Diesel | 13 | ||||
| CNG/gasoline | 1 | ||||
| 4 | Tanker (purching, leachate) | Diesel | 5 | 4 | 1 |
| 5 | Side Compactor (180–330 q) | Diesel | 13 | 2 | 11 |
| 6 | Back Compactor (180–330 q) | Diesel | 20 | 6 | 14 |
| 7 | Compactor (35–75 q) | Diesel | 51 | 20 | 34 |
| CNG | 2 | ||||
| CNG/gasoline | 1 | ||||
| 8 | Compactor (80–180 q) | Diesel | 58 | 3 | 64 |
| CNG | 9 | ||||
| 9 | Van | Diesel | 14 | 4 | 10 |
| 10 | Jolly Vehicles | Diesel | 4 | 4 | 0 |
| 11 | Washing machine for waste containers | Diesel | 4 | 3 | 1 |
| 12 | Forklift truck | Diesel | 8 | 8 | 0 |
| 13 | Sprinkler vehicle, beach rake machine | Diesel | 3 | 3 | 0 |
| 14 | Mini hydrostatic drive loaders | Diesel | 1 | 1 | 0 |
| 15 | Wheel loader | Diesel | 4 | 4 | 0 |
| 16 | Tana and Kaelble operating machines, Crawler loaders, Krambo | Diesel | 4 | 4 | 0 |
| 17 | Three-wheeler | Gasoline | 34 | 20 | 14 |
| 18 | Skip loader (240–330 q) | Diesel | 19 | 1 | 18 |
| 19 | Skip Loader (35–65 q) | Diesel | 5 | 1 | 4 |
| 20 | Porter Vehicles | Gasoline | 30 | 26 | 67 |
| Diesel | 40 | ||||
| LPG/Gasoline | 23 | ||||
| 21 | Tipper truck | Diesel | 20 | 4 | 16 |
| 22 | Semitrailer\Compactor trailer | Diesel | 2 | 2 | 0 |
| 23 | Street sweepers | Diesel | 26 | 11 | 15 |
| 24 | Sweeper on running gear | Diesel | 9 | 2 | 7 |
| 25 | Road tractors | Diesel | 13 | 1 | 12 |
| Total number | 480 | 192 | 288 |
Table 2.
Description of the current scenario and the alternative scenario for each analyzed category.
Table 2.
Description of the current scenario and the alternative scenario for each analyzed category.
| Categories | Current Scenario | Alternative Scenario | Performance Parameters |
|---|---|---|---|
| Passenger cars | Recorded mileage 11 diesel cars 28 CNG cars | Same mileage as in the current scenario 39 CNG cars | CO2 emissions Fuel consumption Total and specific costs for refueling Energy consumption |
| Compactors (35–75 q) | Recorded mileage Recorded waste amount 51 diesel compactors 3 CNG compactors | Same mileage and waste amount as in the current scenario 54 CNG compactors | CO2 emissions Fuel consumption Total and specific costs for refueling Energy consumption (MJkm−1kg−1 and kmkgfuel−1kgwaste−1) |
| Compactors (80–180 q) | Recorded mileage Recorded waste amount 58 diesel compactors 9 CNG compactors | Same mileage and waste amount as in the current scenario 67 CNG compactors | |
| Compactors (180–330 q) | Recorded mileage Recorded waste amount All diesel compactors | Same mileage and waste amount as in the current scenario All diesel compactors equipped with Stop-Start System | |
| Porter vehicles | Recorded mileage Recorded waste amount 30 gasoline vehicles 40 diesel vehicles 23 LPG vehicles | Same mileage and waste amount as in the current scenario Gasoline/diesel vehicles replaced with LPG vehicles | |
| Three-wheelers | Recorded mileage Recorded waste amount All gasoline vehicles | Same mileage and waste amount as in the current scenario All gasoline vehicles equipped with Stop-Start System |
Table 3.
Results obtained.
| Categories | Alternative Scenario | ||
|---|---|---|---|
| Benefits | Disadvantages | Impacts | |
| Passenger cars with CNG/gasoline fuel | −2675 kgCO2eq (−26%) −1.96 MJ km−1 (−91%) −488.7 kg (−15%) −2200 € (−50%) −0.035 € km−1 (−51%) +3.7 km kg−1 (+18%) | Carbon footprint Energy impact Fuel consumption Economic impact Route performance | |
| Compactors (35–75 q) with CNG fuel | +2947 € (+43%) +1.2 × 10⁻⁷ € km−1kgwaste−1 (+43%) +18,355 kgCO2eq (+110%) +0.02 kgCO2eq kgwaste−1 (+110%) + 7538 kg (+145%) −4.5 × 10⁻⁶ km kg−1kg−1 (−59%) +1.7 × 10⁻⁵ MJ km−1kg−1 (+186%) | Economic impact Carbon footprint Fuel consumption Route performance Energy impact | |
| Compactor (80–180 q) with CNG fuel | +385,478 total kgCO2eq (+377%) +0.09 kgCO2eq kgwaste−1 (+377%) +1.7 × 10⁻⁵ MJ km−1kg−1 (+550%) +91,578 € (+213%) +2.1 × 10⁻⁷ € km−1kgwaste−1 (+213%) +145,610 kg (+456%) −7.2 × 10⁻⁷ km kg−1kg−1 (−82%) | Carbon footprint Energy impact Economic impact Fuel consumption Route performance | |
| Porter Vehicles gasoline supposed with LPG fuel | −2470 total kgCO2eq (−10%) −0.003 kgCO2eq kgwaste−1 (−10%) −3145 € (−23%) −4.7 × 10⁻⁸ € km−1kgwaste−1 (−23%) | +2042 L (+18%) +9.7 × 10⁻⁸ MJ km−1kg−1 (+2%) −1.3 × 10⁻⁶ km L−1kg−1 (−15%) | Carbon footprint Economic impact Fuel consumption Energy impact Route performance |
| Porter Vehicles diesel supposed with LPG fuel | −3049.4 total kgCO2eq (−7%) −0.002 kgCO2eq kgwaste−1 (−7%) | +8341 L (+49%) +1153 € (+6%) +9.2 × 10⁻⁹ € km−1kgwaste−1 (+6%) +6.5 × 10⁻⁷ MJ km−1kg−1 (+13%) −1.2 × 10⁻⁶ km L−1kg−1 (−33%) | Carbon footprint Fuel consumption Economic impact Energy impact Route performance |
| Side Compactor (180–330 q) with Stop-Start System | −38,332 total kgCO2eq (−28%) −0.002 kgCO2eq kgwaste−1 (−28%) −8.8 × 10⁻⁷ MJ km−1kg−1 (−29%) −14,262 L (−28%) −15,903 € (−28%) −2.7 × 10⁻⁸ € km−1kgwaste−1 (−28%) +9 × 10⁻⁸ km kg−1L−1 (+37%) | Carbon footprint Energy impact Fuel consumption Economic impact Route performance | |
| Three-Wheelers with Stop-Start System | −3 × 10⁻⁵ MJ km−1kg−1 (−15%) | +722 total kgCO2eq (+77%) +0.05 kgCO2eq kgwaste−1 (+77%) +328 L (+77%) +404 € (+77%) −5 × 10⁻⁴ km kg−1L−1 (−73%) | Energy impact Carbon footprint Fuel consumption Economic impact Route performance |
© 2020 by the authors. Licensee MDPI, Basel, Switzerland. This article is an open access article distributed under the terms and conditions of the Creative Commons Attribution (CC BY) license (http://creativecommons.org/licenses/by/4.0/).
Share and Cite
MDPI and ACS Style
Quintili, A.; Castellani, B. The Energy and Carbon Footprint of an Urban Waste Collection Fleet: A Case Study in Central Italy. Recycling 2020, 5, 25. https://0-doi-org.brum.beds.ac.uk/10.3390/recycling5040025
AMA Style
Quintili A, Castellani B. The Energy and Carbon Footprint of an Urban Waste Collection Fleet: A Case Study in Central Italy. Recycling. 2020; 5(4):25. https://0-doi-org.brum.beds.ac.uk/10.3390/recycling5040025
Chicago/Turabian StyleQuintili, Alessio, and Beatrice Castellani. 2020. "The Energy and Carbon Footprint of an Urban Waste Collection Fleet: A Case Study in Central Italy" Recycling 5, no. 4: 25. https://0-doi-org.brum.beds.ac.uk/10.3390/recycling5040025