Article

Mechanical Property Assessment of Interlocking Plastic Pavers Manufactured from Electronic Industry Waste in Brazil

by
Luiz Tadeu Gabriel
1,2,
Rodrigo Fernando Bianchi
1,2 and
Américo T. Bernardes
1,*
1
Programa Ciências: Física de Materiais, Departamento de Física, Instituto de Ciências Exatas e Biológicas, Universidade Federal de Ouro Preto, Ouro Preto 35400-000, Brazil
2
Laboratório de Polímeros e de Propriedades Eletrônicas de Materiais, Departamento de Física, Instituto de Ciências Exatas e Biológicas, Universidade Federal de Ouro Preto, Ouro Preto 35400-000, Brazil
*
Author to whom correspondence should be addressed.
Submission received: 9 November 2020 / Revised: 21 January 2021 / Accepted: 16 February 2021 / Published: 25 February 2021

Abstract

:
The estimated production of world electronic waste until 2017 is approximately 6 Gt. Despite this enormous problem, there are no clear regulations regarding the orientation for disposal or treatment of this type of residuals in many countries. There is a federal public policy in Brazil that supports a network of Computer Reconditioning Centers—CRCs. These CRCs train young people and recover or recycle electronic equipment. Through this work, CRCs produce interlocking plastic pavers for application on pavements from recycled electronic industry waste. This article presents the characterization of these interlocking paver’s mechanical properties when applied on the pavement. This characterization is a necessary step to show the effectiveness of this product. We show that the plastic pavers behave similarly to the artifacts manufactured in concrete, thus creating commercial opportunities for this initiative, and contributing to the Brazilian Solid Waste Policy.

1. Introduction

1.1. Generation of Electronic Waste in the World and Opportunities for the Circular Economy

It has been estimated that until 2017, 8.3 Gt of virgin polymers have been produced, about 75% became waste. Of this waste, in 2015, approximately 9% were recycled, 12% were incinerated, and 79% were accumulated. By 2050, primary waste generation is projected to reach about 25 Gt, with a tendency to stabilize waste disposal to approximately 13 Gt, an increase in incineration to approximately 12 Gt, and an increase in recycling to around 9 Gt [1].
Electronic waste is emerging as a new environmental challenge of the 21st century due to the rapid escalation of the electronic sector and increased consumption of electronic products [2]. Globally, a significant portion of the plastic waste generated ends up in landfills due to limited plastics management. Landfills were recognized as the primary source of plastic losses to the environment [3]. The speed with which products become obsolete further aggravates problems with the environment, which becomes the destination of waste generated and disposed of improperly in most cases. In this sense, urban prospecting techniques can serve to mitigate the negative impact that anthropic products cause on the environment [4].
Each year, approximately 50 million tons of electronic waste are generated worldwide. This electronic waste contains hazardous materials harmful to human health and the environment [5]. There is also a lack of knowledge available to control methods and strategies for handling electronic waste. Moreover, there is no agreement between the reuse, recycling, recovery, and reform industries. However, recycling is the main method for dealing with electronic waste [6].
The ISWA—International Solid Waste Association, a non-governmental and nonprofit international association based in Austria that works to promote and develop solid waste care worldwide, published a report stating that in 2019 the world broke the record for the production of electronic waste with 53.6 million tons. This number is equivalent to the production of e-waste of 7.3 kg per inhabitant in one year. In Europe, that number reached 16.2 kg per inhabitant. According to the report, Asia generated the most massive volume of e-waste in 2019—around 24.9 Mt, followed by the Americas (13.1 Mt) and Europe (12 Mt), while Africa and Oceania generated 2.9 Mt and 0.7 Mt, respectively [7].
Europe is firmly committed to recycling plastics, especially packaging [8], and according to the European waste management hierarchy, the preferred way for reuse is through recycling. From an environmental point of view, reuse is beneficial if the impacts that arise during a certain period of use of a reused product are less than the duration of a new product. Otherwise, reuse is not beneficial for recycling [9]. From the four white goods (washing machine, refrigerator, stove, and freezer) and four small electronic devices (PC—personal computer, printer, monitor, and laptop), by using Life Cycle Assessment, 68% by weight of Germany e-waste might be reused [9].
In the United States, more than 35 state manufacturer’s extended liability laws on waste were adopted between 1991 and 2009. For electronics, these laws vary between early disposal fees or return mandates [10]. In Indonesia, a study aims to understand influential factors for its residents to participate in a formal e-waste recycling program. Electronic waste collection requires collaboration between the government and companies of electronics manufacturers and must be supported by a legal framework [11].
A model that correlates the amount of electronic waste with the economic increase was developed by [12]. According to the researchers, there is a strong linear correlation between the global generation of electronic waste and the Gross Domestic Product—GDP. It was observed that electronic waste be considered an opportunity for the recycling or recovery of valuable metals (for example, copper, gold, silver, and palladium), given their significant content in precious metals than in ores.
Cucchiella et al. [13] stand that an economic assessment will define the potential revenues from the recovery of 14 e-products, for instance: notebooks with LCD—liquid crystal display and LED—light-emitting diode display; TVs with CRT—cathode-ray tube, LCD, and LED; cell phones, and smartphones; photovoltaic panels; HDDs—hard disk drives; and SSDs—solid-state drives and tablets) based on current and future available volumes, which is one of the main challenges in the recycling sector.

1.2. Generation of Electronic Waste in Brazil and Motivation to Manufacture WEEE Interlocking Plastic Pavers

According to the UN—United Nations report, in 2017, Brazil generated about 1.4 Mt of WEEE’s—Waste Electrical and Electronic Equipment [14]. Brazil is the second-largest producer of this waste in the Americas, with the U.S.A. being the first one, and Brazil leading the rankings in Latin America [15].
Brazil has an increasing rate of electronic waste generation. With few treatment systems for e-waste, the material goes to landfills or goes into informal chains in gray markets. It is necessary to implement a reverse logistics system within a regulatory and technical framework. There are possible synergies between the demands of formal companies and the instruments that will be applied to a recently approved regulation as a way to overcome these limitations [16]. Some solutions have been developed. To assess sustainability and prioritize alternatives for potential implementation in the metropolitan region of Rio de Janeiro, a hybrid scheme for collecting WEEE with delivery points at stores, subway stations, and neighborhood centers was designed, with the involvement of private companies, cooperatives, and social enterprises; and complete recycling of all components [17].
In Brazil, the National Solid Waste Policy was established through Law no 12,305 of 2010. This law aims at the non-generation, reduction, reuse, recycling, and treatment of solid waste and its disposal. The law reinforces the need to conduct research that contributes to reducing environmental impacts caused by the increasing generation of this waste [18]. Thus, it is essential to characterize products from the reuse of these residues. With the current waste generation scenario from the electronics industry, space is being created for new raw materials: WEEE [19]. In this case, recycling is one of the most essential actions to reduce impacts and boost production [20]. In a parallel way, it is very important the construction of an environment propitious to the creation of recycling actions, as discussed by Vieira et al. [21]
Within the scope of the Digital Inclusion Policy, the Brazilian Federal Government and partners promote the implementation of CRC’s—Computer Reconditioning Centers, responsible for the correct treatment of e-waste, promoting professional qualification for young people in vulnerable social condition, the reconditioning of computers and the environmentally proper disposal of waste [14].
According to the annual report of the ABRIN—Brazilian Association of Recycling and Innovation, 986 t of computer equipment discarded by the Brazilian federal government were processed by the CRC’s in 2017 [16], 36% of which consists of CPUs, 4% of notebooks or laptops, 24% of monitors, 10% of printers, 25% of other IT—Information Technology items, and 1% of IT furniture [22]. The CRC “Programando o Futuro” of Valparaíso/GO produces interlocking plastic pavers from housings and plastic components. These pavers can be used for applications on floors, walkways, elevated walkways, and parking. Figure 1 illustrates the pavers’ production flow and its application.
It is worthy to say that the CRC program processed about 5% of total mass-produced by the federal government [10]. We think that commercial opportunities may be opened up for this action. For each ton of material disposal, based on average market data, for approximately US $0.5 per kg, there is an approximate amount of resources in the order of US $511 thousand in revenue for the CRC, if they operated in the correct commercial disposal and within the requirements of the current legislation [14].
The reuse of the ever-increasing electronic waste as a load in the manufacture of concrete beams can improve structural strength and allow its use in constructing buildings [23]. Other researchers showed that electronic waste’s addition provided a decreasing trend of structural resistance [24]. Assessing the presence of other polymers applicable in pavers’ production, the use of vulcanized rubber residue from unserviceable tires with residual aggregates from the demolition of civil construction and Portland cement was investigated [25].
The insertion of PET—Polyethylene Terephthalate—in concrete alloys for pavements generated a reduction in the concrete’s compression strength when comparing the metered specimens with and without the aggregate. In contrast, the water absorption of parts manufactured with PET waste showed higher values than those observed for parts without waste. There are significant environmental advantages compared to traditional parts [26].
Considering the economic importance of reusing e-waste in civil construction, we proposed in the present research the characterization of those interlocking plastic pavers manufactured by the CRC “Programando o Futuro”. In Brazil’s case, it is typical for the creation of products for civil construction manufactured by using mining or mineral rejects since those are the country’s critical economic activities. Characterization of products is a necessary step to define the benefits of recycling [27], as producing interlocking blocks with iron ore [28].
Different from the usual composites used in civil construction, where a substance to strength it is mixed into the concrete matrix, in the present work the interlocking blocks are manufactured exclusively with e-waste and some added charge, as we describe below. This is a new type of material. Thus, this fabrication process lacks the paver’s characterization. This is a crucial step to the transition between an idea to a product. Re-use or recycling must show to be economical and effective. As we show in the present paper, the interlocking blocks produced from e-waste are suitable for civil construction. The attributes of interest are defined for application on walkways and parking lots. The results obtained are compared with those of other types of materials typically used in the construction industry, following international standards.
This paper is organized as follows. The next section presents the methodology for materials characterization: International Standards have been used and the metrological procedures for the calculations of uncertainties were described. All the essays are specified, and the equipment identified to allow replicability of the results. After that, the essays’ results are shown and compared with those obtained for standard pavers produced from concrete, and also under the regulatory or normalized definitions for some countries. Finally, the conclusions and scenarios for future researches are presented.

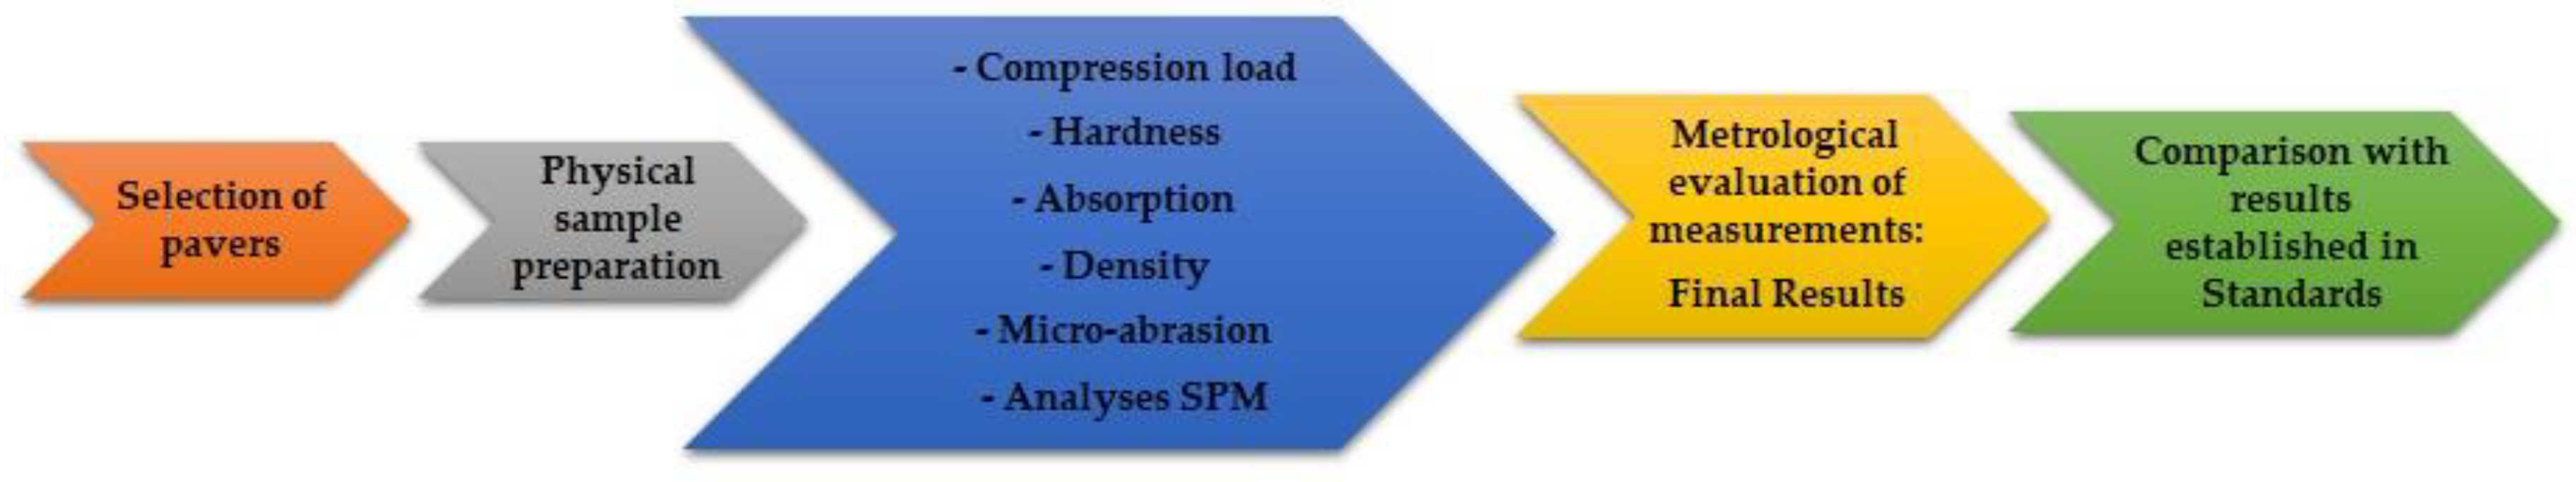
2. Materials and Methods

The interlocking plastic pavers studied in this research are produced from a mixture of polymers from computers or electronic equipment with other substances. As we have pointed out above, this manufacture is different for that of reinforcement of concrete blocks. In the transformation/recycling process, 100% of the plastic waste from the component/sub-assembly can be used. These residues, composed of ABS—Acrylonitrile Butadiene Styrene, and PS—PolyStyrene polymers, make up 70% of the main processed load. The remaining 30% of the cargo comprises other polymers or residual materials from the carcasses, such as metallic residues, sawdust, discarded toys, cigarettes, and mineral powder. This 30% load can also contribute to the reuse of non-recyclable waste.
The preferred polymers for the highest percentage of load, ABS and PS, have excellent characteristics such as low density, resistance to high temperatures, good mechanical resistance, high resistance to abrasion, dimensional stability, etc. [29].
The pavers under study have inclusions and pores, which are not expected to modify an interlocking paver’s mechanical behavior, as they are small in size compared to the entire material. These inclusions come from metallic materials constituting the housings of computer components or other granular materials added as cargo during production. This residue is also desirable since the manufacture of the interlocked block must be economically viable. The non-treatment of the waste, together with the primary raw material, reduces the cost of the process; that is, even with the presence of inclusions, the interlocked block must have resistance to the compression load compatible with the values defined in the Standards for the same models of artifacts of concrete.
To fuse the polymer particles’ surface, a procedure known as agglutination is used, which is a technique for compacting and agglomerating polymeric and residual particles previously ground through heating and pseudo plastification of the material [30]. After this, the mixture is brought to constant pressure in a matrix made with the parameters of the block’s dimension and shape. In this process, there is a reduction in the compacted material’s free surface energy, minimizing the generation of pores and conditioning the stress relief on the surface atoms.
Rigid polymers, like PS, ABS, PC—Polycarbonate, can have high values for elastic modulus, ductility, and yield strength, determining the limits of tensile strength. These mechanical characteristics change with temperature. An increase in temperature produces a reduction in the modulus of elasticity and the limit of tensile strength, with a consequent improvement in ductility. For this control, polymers’ melting, and glass transition, temperatures are used as essential parameters [31] for determining the agglutination temperature.
To obtain specimens for essays, 10 interlocking pavers were chosen at random from a batch produced in CRC “Programando o Futuro”. The specimens have been produced in dimensions accordingly the Standards. Essays were defined from the materials’ predetermined applications: resistance to compression load, surface hardness, medium absorption, medium density, resistance to micro-abrasive wear, and study of surface topography and phase contrast by SPM—Scanning Probe Microscopy. The flowchart of the essays is depicted in Figure 2.

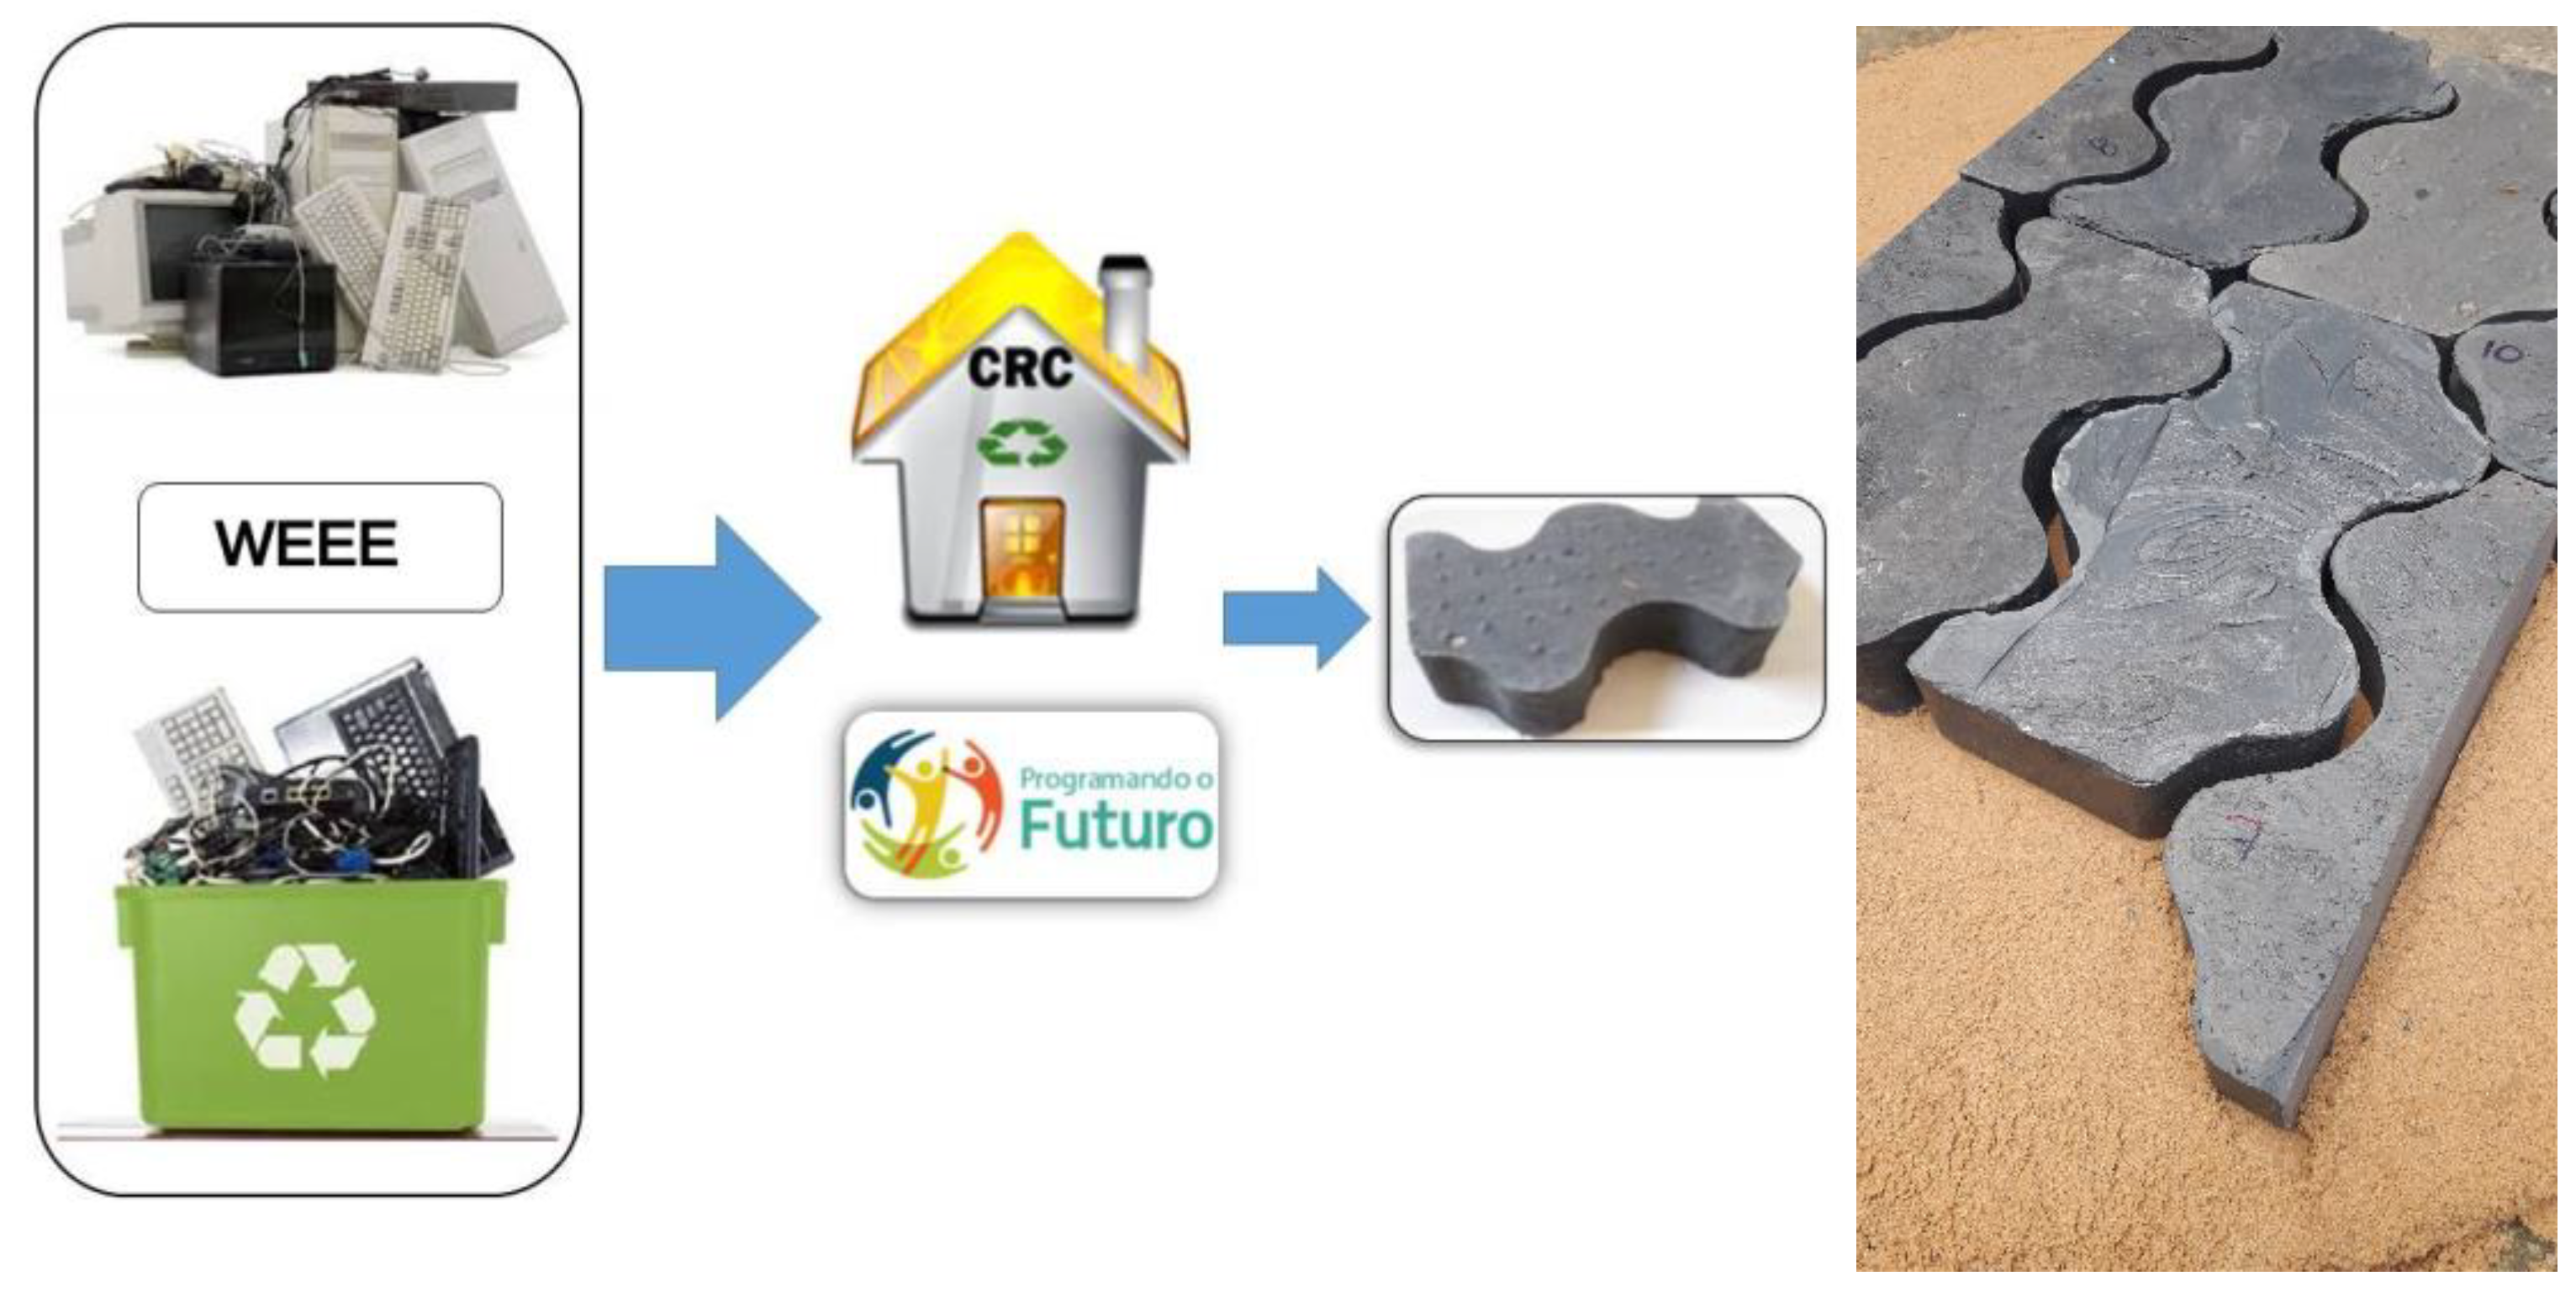
2.1. Manufacture of Interlocking Block

The manufacturing process of interlocking plastic pavers goes through the following steps:
  • Classification: Materials containing appropriate and preferred waste for recycling are organized;
  • Separation: The main raw material polymers (PS and ABS) are separated from other materials of the equipment, which might serve as cargo;
  • Shredding: The separated materials go through the shredding process and are stored in specific quantities for agglutination;
  • Agglutination: a compaction technique and agglomeration of previously ground particles with pseudo-plasticization [30] at temperatures between 115 °C and 140 °C. In this process, 70% PS or ABS and 30% load are used (which may be sawdust, fabric, other plastic waste, or even small metals aggregated in previously separated housings);
  • Pressing: Put the agglutinated mass in a specific mold (in the form of an interlocking floor, block, or brick) and start pressing for approximately 1 min, solidifying at room temperature (which is between ~20 °C and 30 °C in Valparaíso/GO).
  • Deburring: The mass is cleaned by trimming the burrs generated by the material purged in the compression.
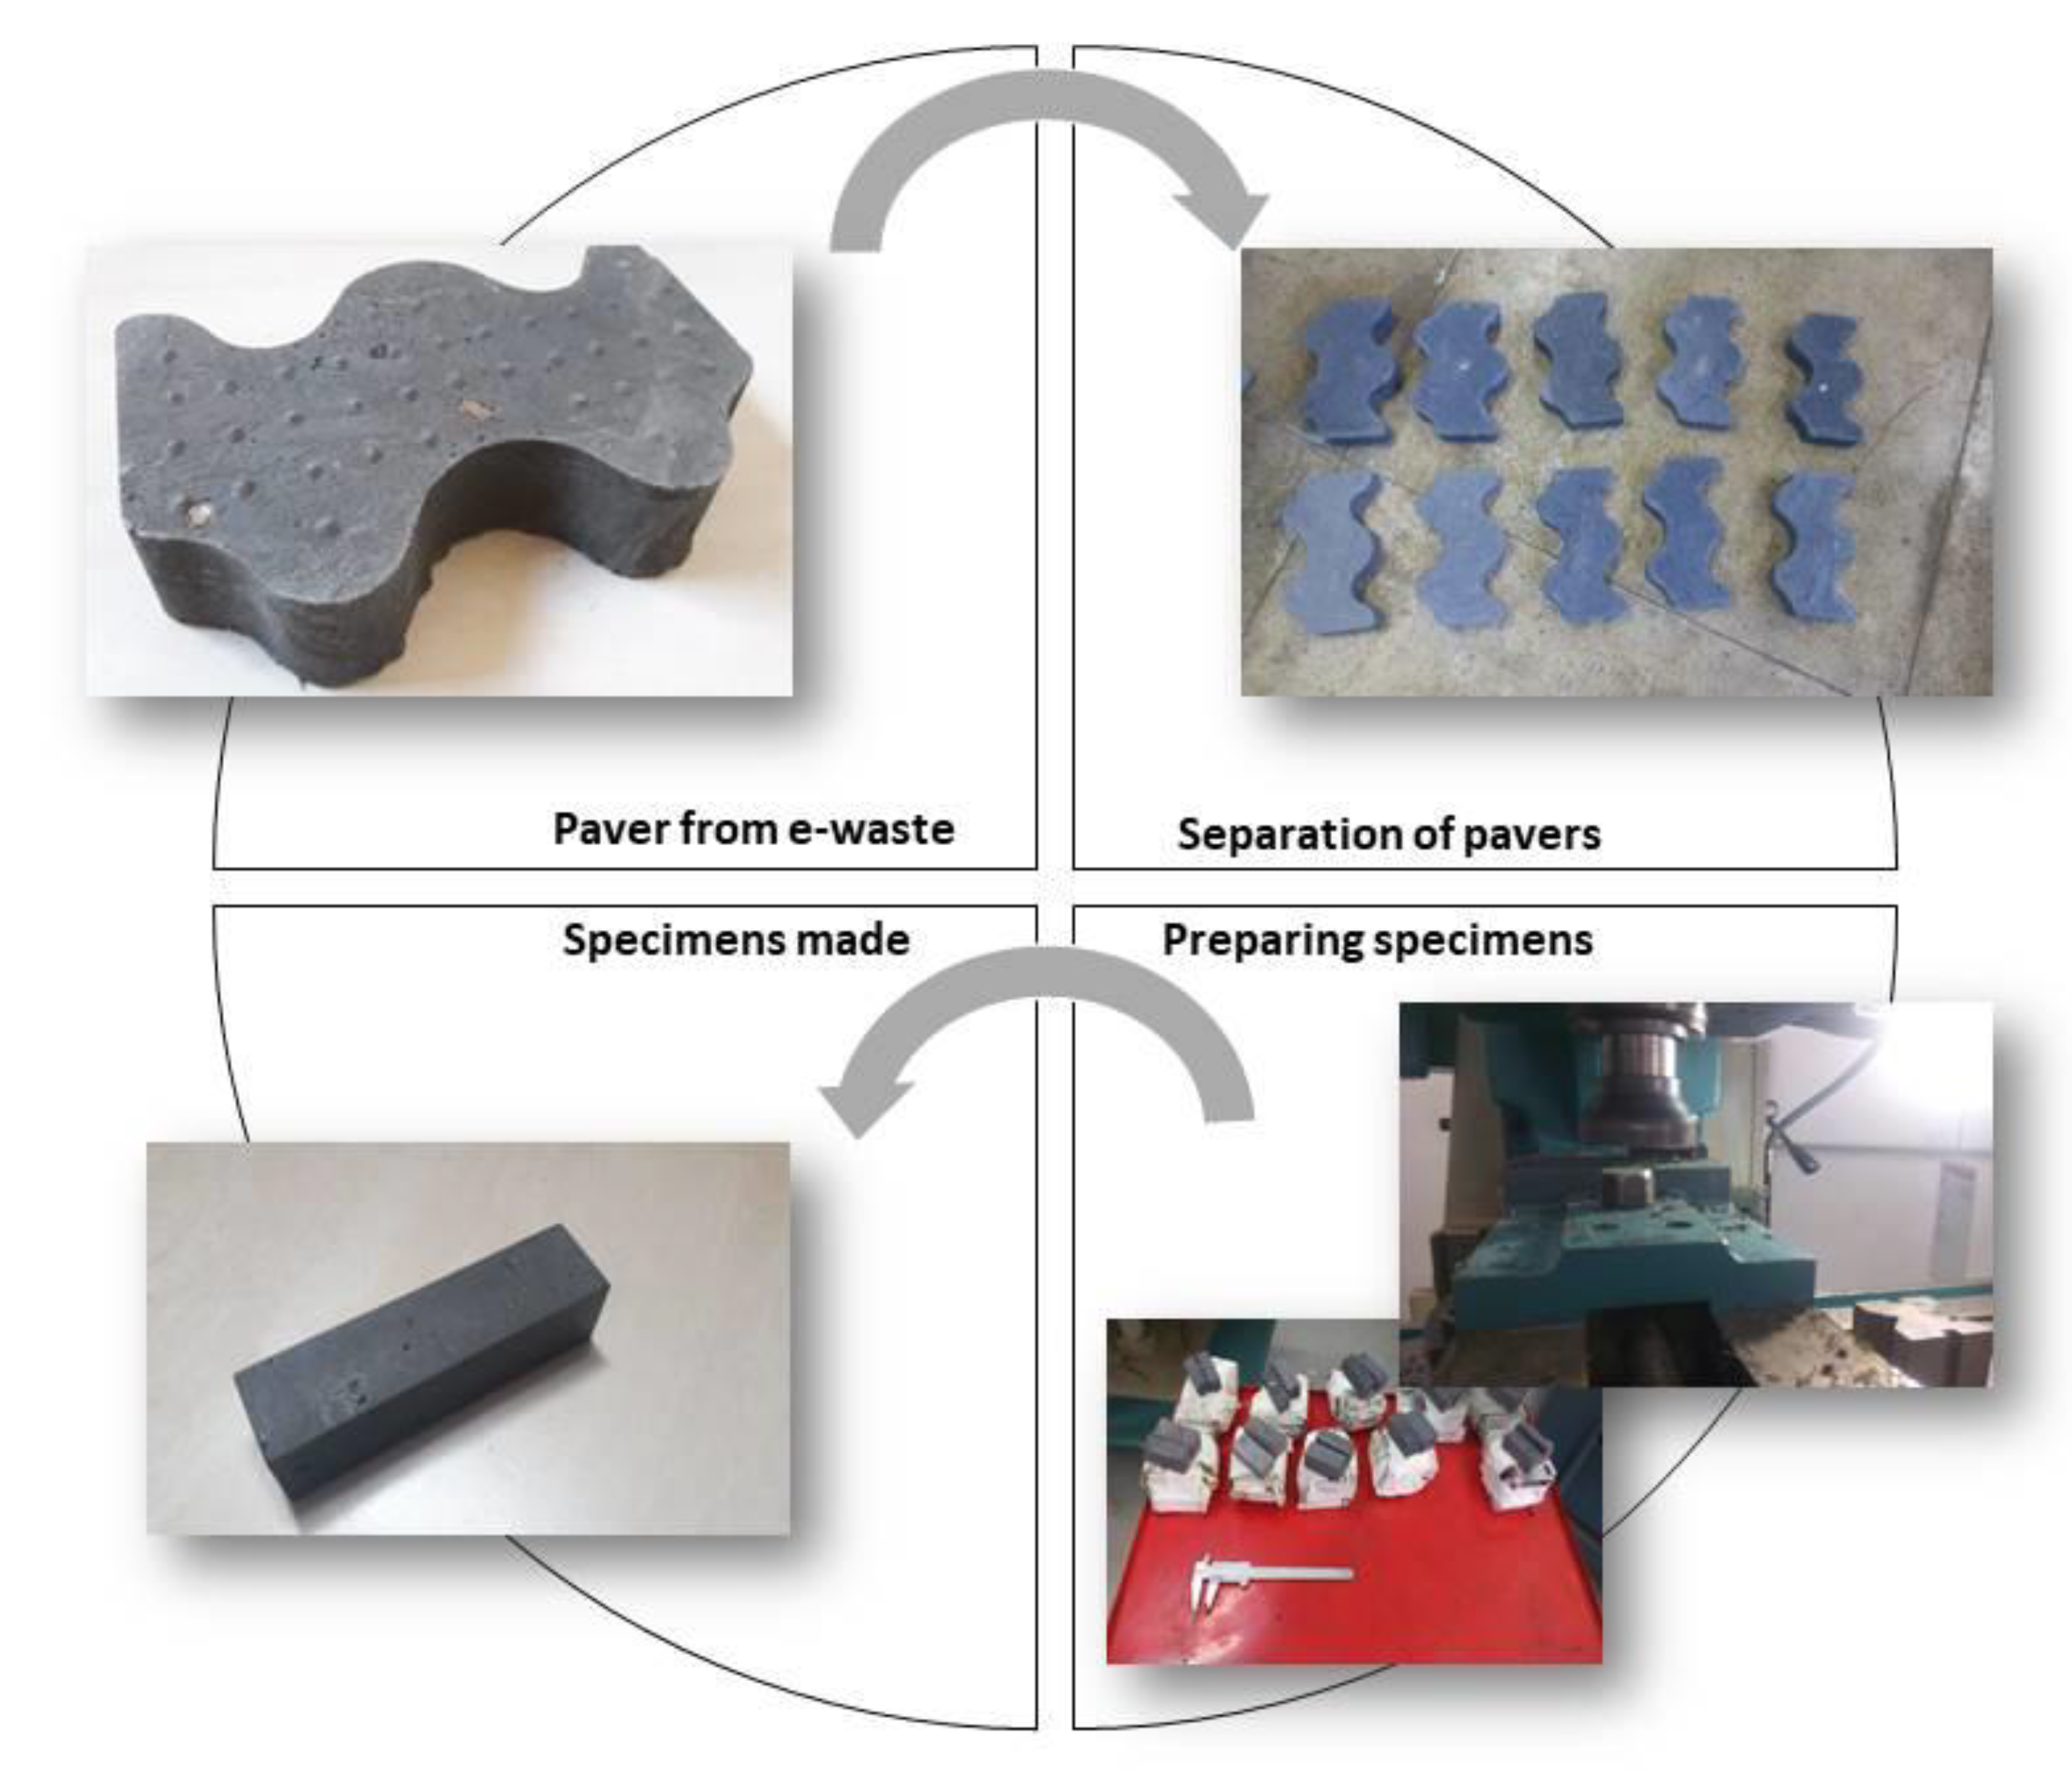
2.2. Specimens

Since there are no specific standards for assessing the mechanical strength of interlocking floors made up of e-waste, procedures based on the following standards were adopted:
  • EN ISO 604: 2002-Plastics—Determination of compression properties:
  • ASTM D695-02a-Standard Test Method for compression Properties of Rigid Plastics;
  • ISO 2039-2: 1987 Plastics—Determination of hardness—Part 2: Rockwell hardness
  • ASTM D785-08: 2015-Standard Test Method for Rockwell Hardness of Plastics and Electrical Insulating Materials
The shape of a specimen and the method used, and the number of tests involved per essay were based on these Standards. The Standards EN ISO 604: 2002 and ASTM D695-02a are equivalent. The number of specimens to be tested depends on the materials’ structure. For isotropic materials, at least five specimens from each material sample must be tested. For anisotropic materials, at least ten specimens of each sample should be tested in the perpendicular direction and five samples in the direction parallel to the main axis of the anisotropy [32].
The material produced from the process described above can be considered isotropic because there is no preferred direction in this process. Therefore, 5 interlocking blocks from the batch of 10 were randomly chosen. These were identified by blocks 3, 4, 5, 7, and 8. The specimens made to the mechanical evaluations were prepared by mechanical machining: cutting with a band saw, roughing by milling, and finishing by sanding. Figure 3 shows the steps to obtain the specimens.

2.3. Mechanical Assessments

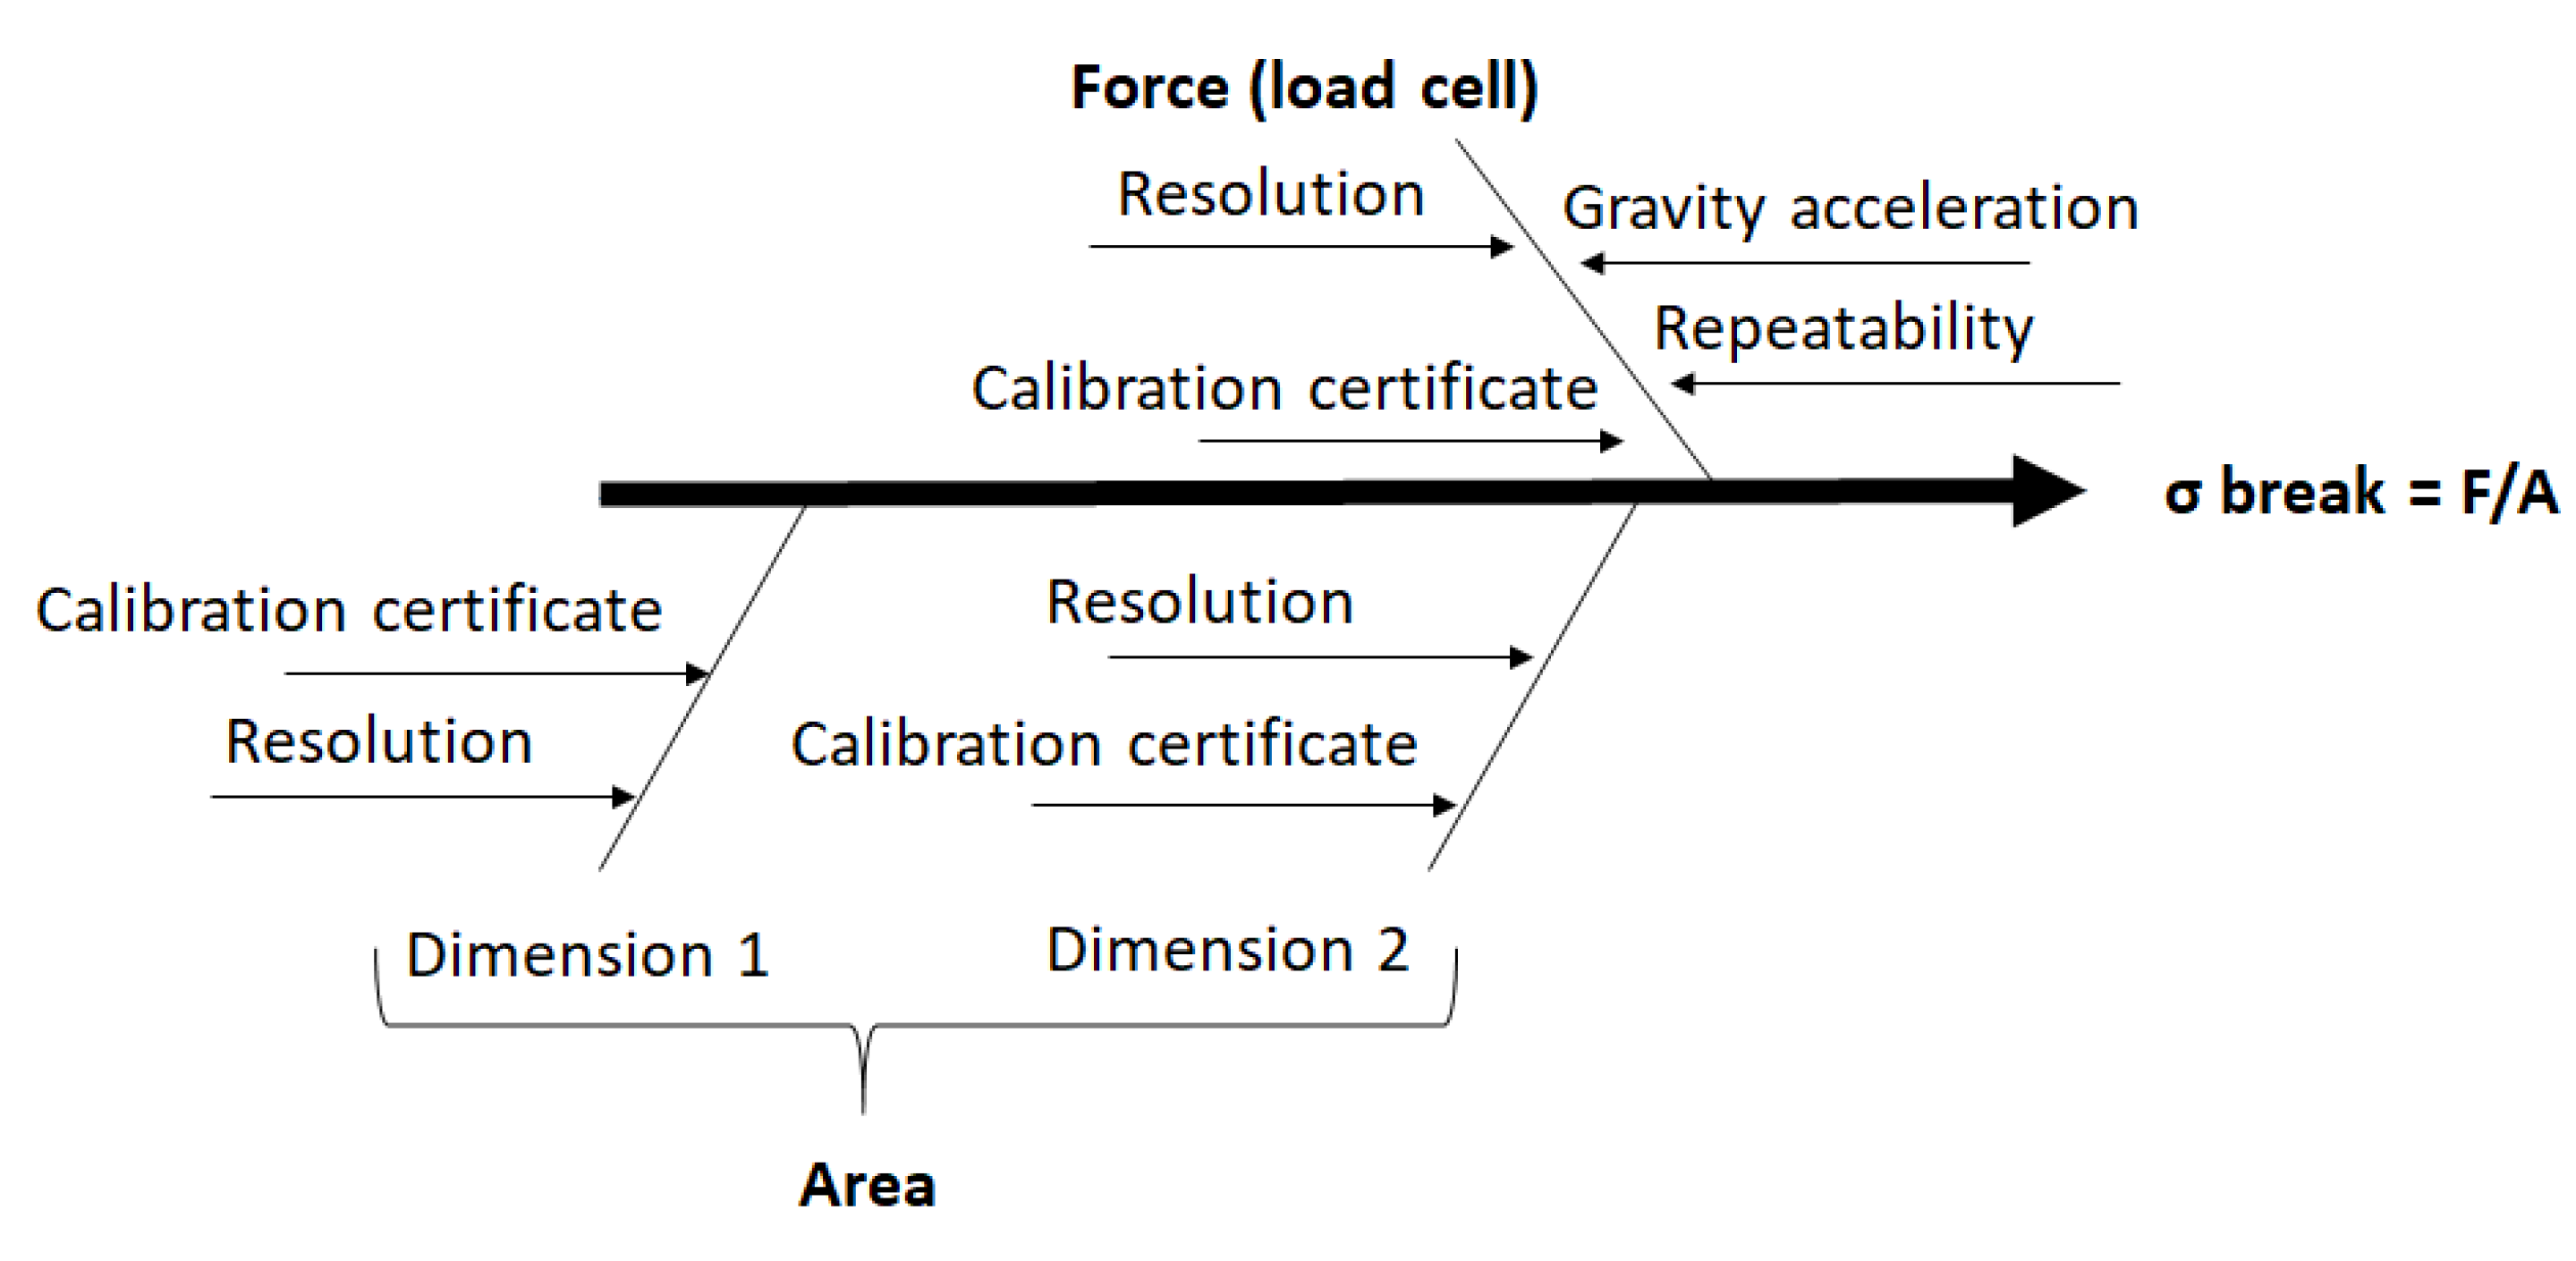
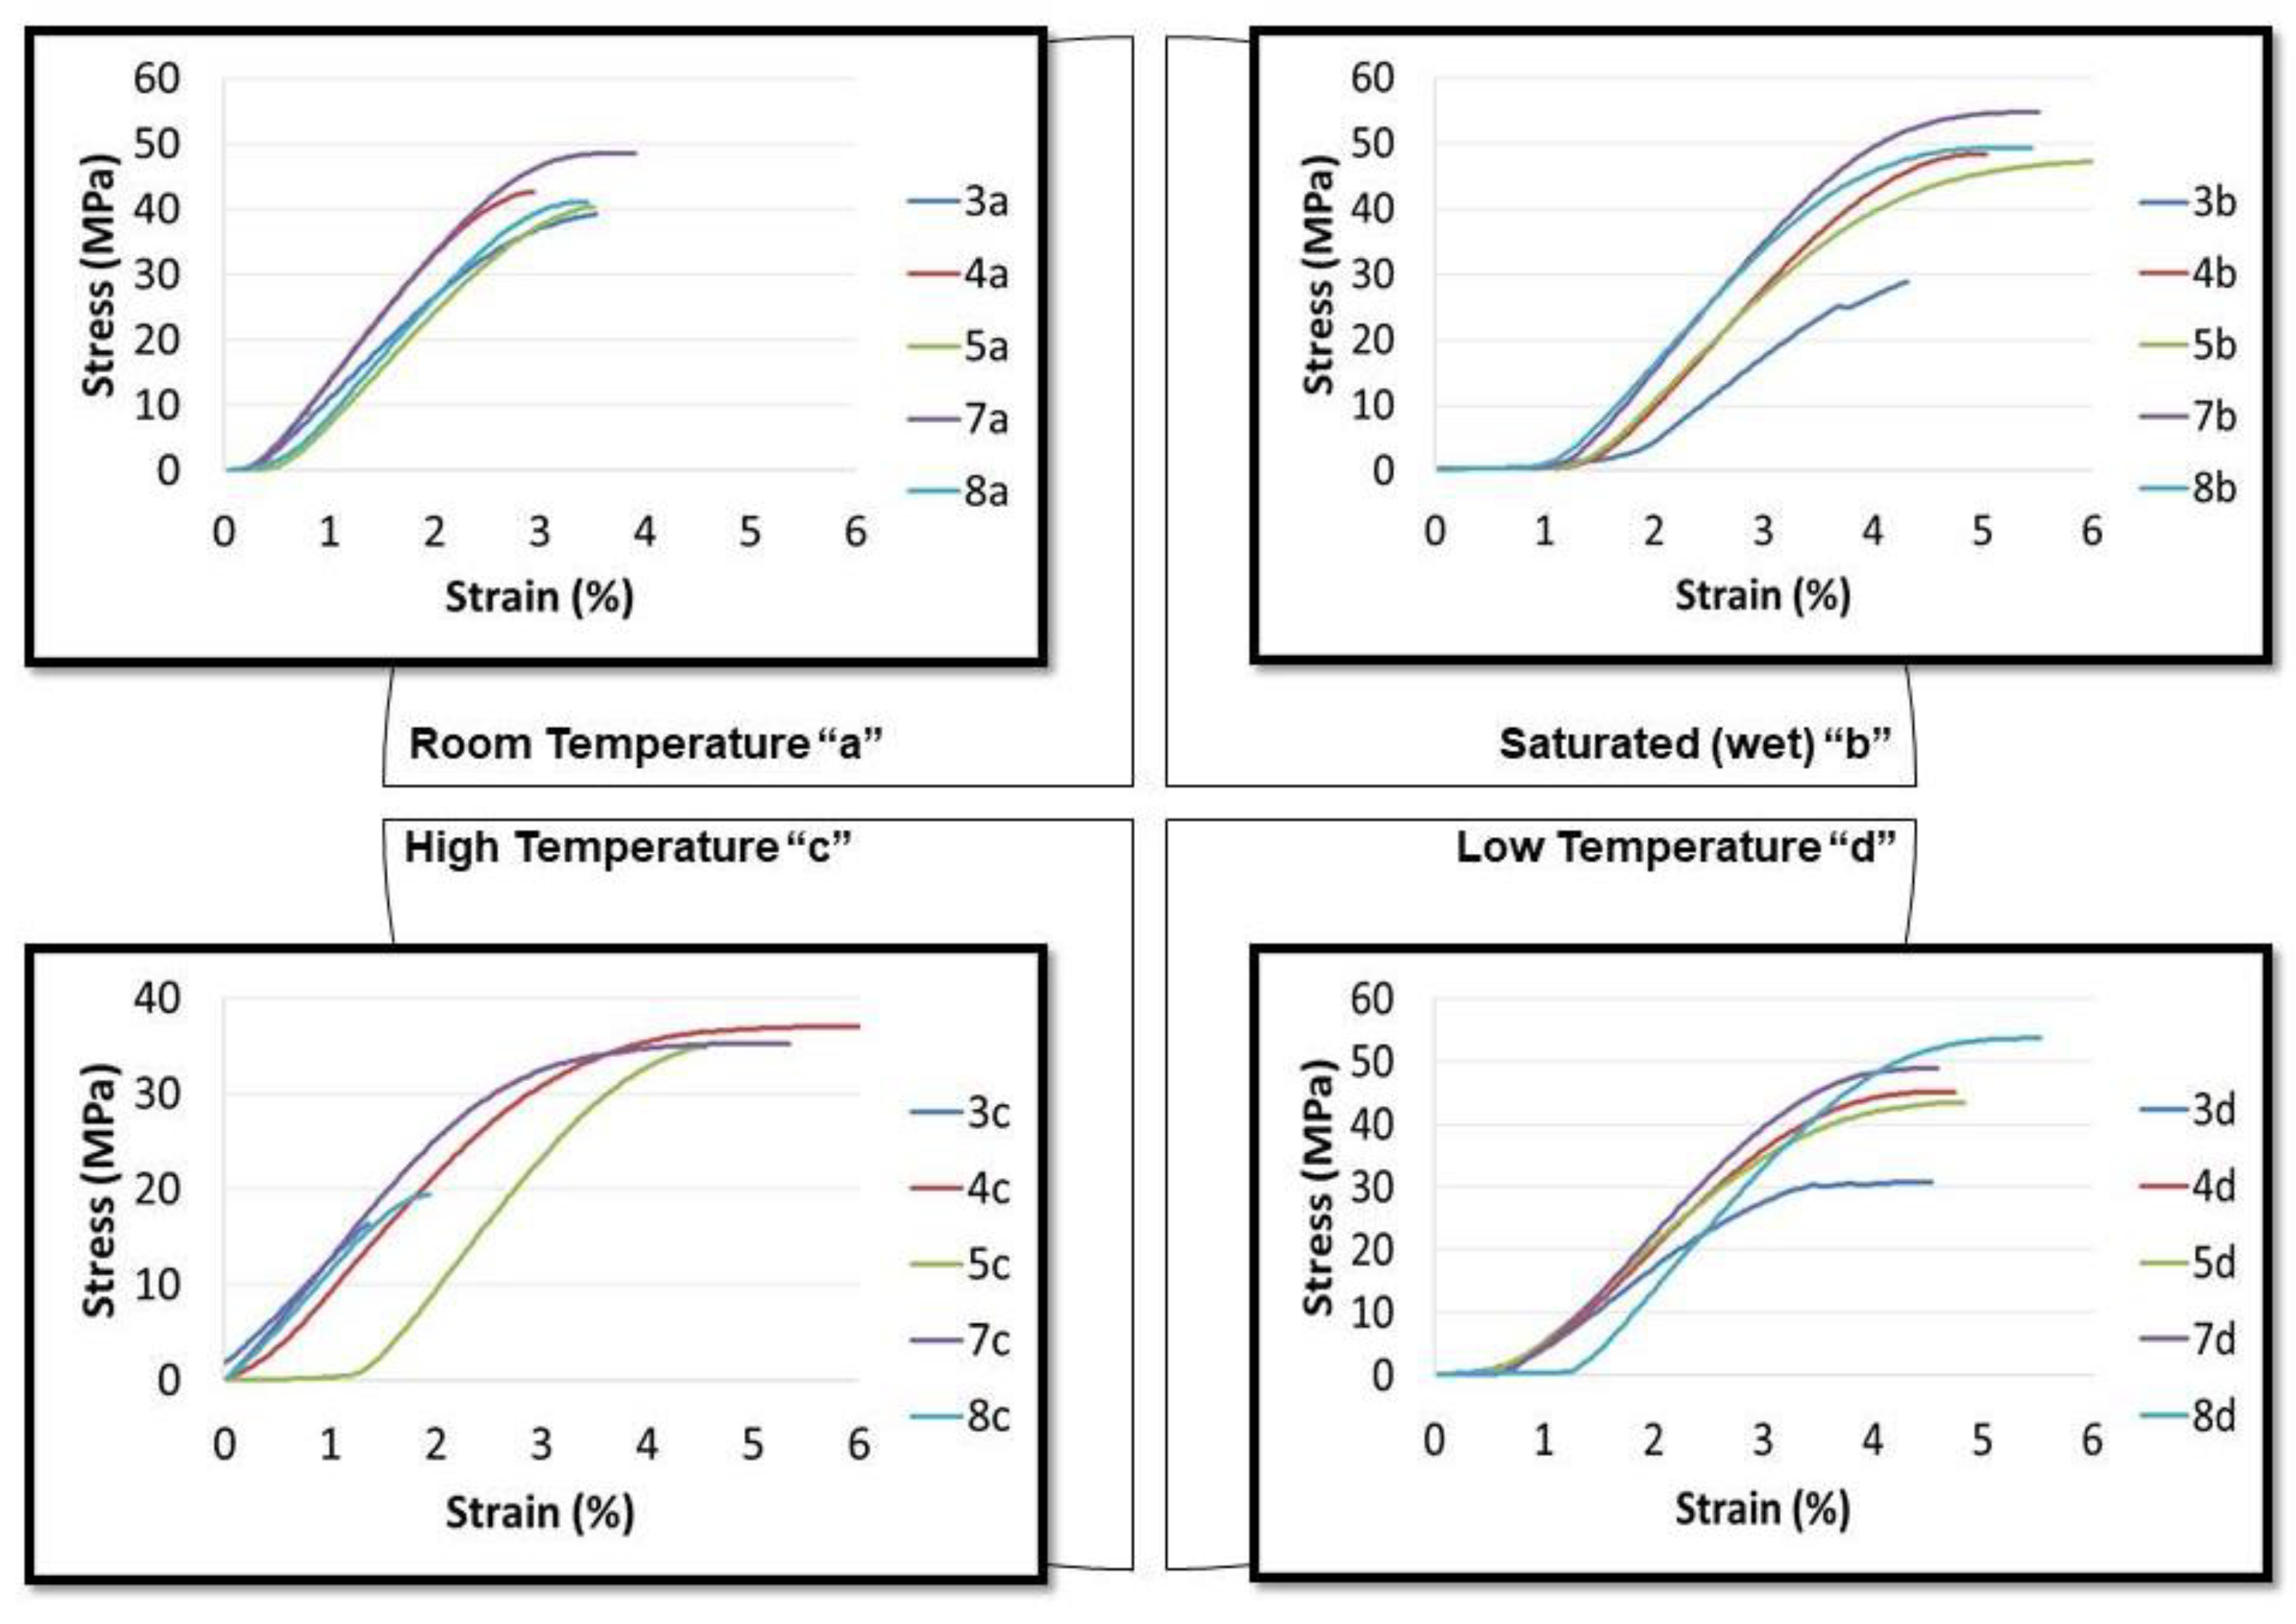
2.3.1. Evaluation of Resistance to a Compression Load

The tests to evaluate resistance to compression load were carried out at the Fracture Mechanics Laboratory of the Metallurgy Department—Escola de Minas—Universidade Federal de Ouro Preto (DEMET/EM/UFOP), with a servohydraulic testing system from the manufacturer MTS, model 810 Material Test System, Software Station Manager—M15 Flex test 40—2013, 10 × 103 kg capacity with a servo valve.
To better understand the behavior of the blocks in different environmental conditions common in our country, four additional tests were carried out, classified from “a” to “d”, as described below. Five specimens were prepared for each test specification.
  • “a”: Test at room temperature (which was about 24 °C);
  • “b”: Saturation test (24 h of immersion);
  • “c”: Hot test (70 °C);
  • “d”: Freezing test (0 °C).
In all the essays, the specimen is compressed parallel to its main axis at a constant speed until it breaks, or the tension decreases or when the length reaches a predetermined value [24,30].

Uncertainty Calculation

For all tests, uncertainty calculations were made accordingly to the GUM—Guide to the Expression of Uncertainty in Measurement [33]. The uncertainty calculations considered repeatability in five different specimens since there is no replication of the measurement at the same point because it is a destructive test. The main uncertainty factors are the instrument, the resolution, and the repeatability.
The sources of quantifiable uncertainty are presented in the Ishikawa diagram, as shown in Figure 4. The other possible components of uncertainty are considered non-quantifiable or do not influence the measure.
Given the above definitions, the uncertainty components’ calculation is done in two steps: the repetition of measurements or Type A assessment of standard uncertainty; and uncertainty inherited from the instrument or Type B assessment of standard uncertainty.
As we conclude from the essays, the higher contribution to the uncertainty comes from the repetition of compression strength measurements. This uncertainty contribution will always exist because the material is composed of at least two different polymeric molecules and contains impurities and/or inclusions, which can cause a variation in the behavior in the different conditions. There is a broad interval in the measurements to evaluate hot, cold, and saturated conditions. Worthy to say that it is important that the confidence intervals remain under the conditions of block application.
It is important to mention that the same type of approach for calculating the uncertainties was adopted in all the test procedures described below. For space savings, they will not be described here, but are available upon request.

2.3.2. Surface Hardness Assessment

The surface hardness assessment was obtained from a branded pen impact type durometer Time, model TH130, resolution 0.1 HRC. The instrument was provided by the Machining Company Torneamentos Mariana LTDA, Mariana-MG. In this evaluation, only one specimen was used, chosen randomly, repeating 5 measurements at three different points.

2.3.3. Evaluation of Average Water Absorption

To evaluate the average absorption, first, we measure the mass of a dry sample. After this measurement, the specimen is immersed in distilled water for 24 h, and the mass measurement is repeated. The absorption evaluation was calculated in 5 samples with five mass checks each, dry and saturated. These specimens were used in the resistance test to the saturated compression load (test “b” described above). The absorption value is obtained in percentage by the expression given by the ratio between the difference between wet and dry mass [34].
The measurements used an analytical balance: Shimadzu—Model AY220, resolution 0.0001 g, provided by the Laboratory of Polymers and Electronic Properties of Materials LAPPEM/ICEB/UFOP.
The block absorption analysis, since one does not have a proper standard, used the procedures for interlocking concrete blocks. This technique evaluates the increase of mass in a solid specimen with a porous appearance, suggesting water accumulation in the pores, which explains the variation in mass and, consequently, the absorption [35].
In the evaluation of average density, the ratio between the mass and the corresponding volume of the test pieces tested in the evaluation of average absorption was used. The volume was calculated from the Mitutoyo 300 mm universal caliper measurements, resolution 0.05 mm, provided by the Machining Company Torneamentos Mariana LTDA, Mariana-MG.

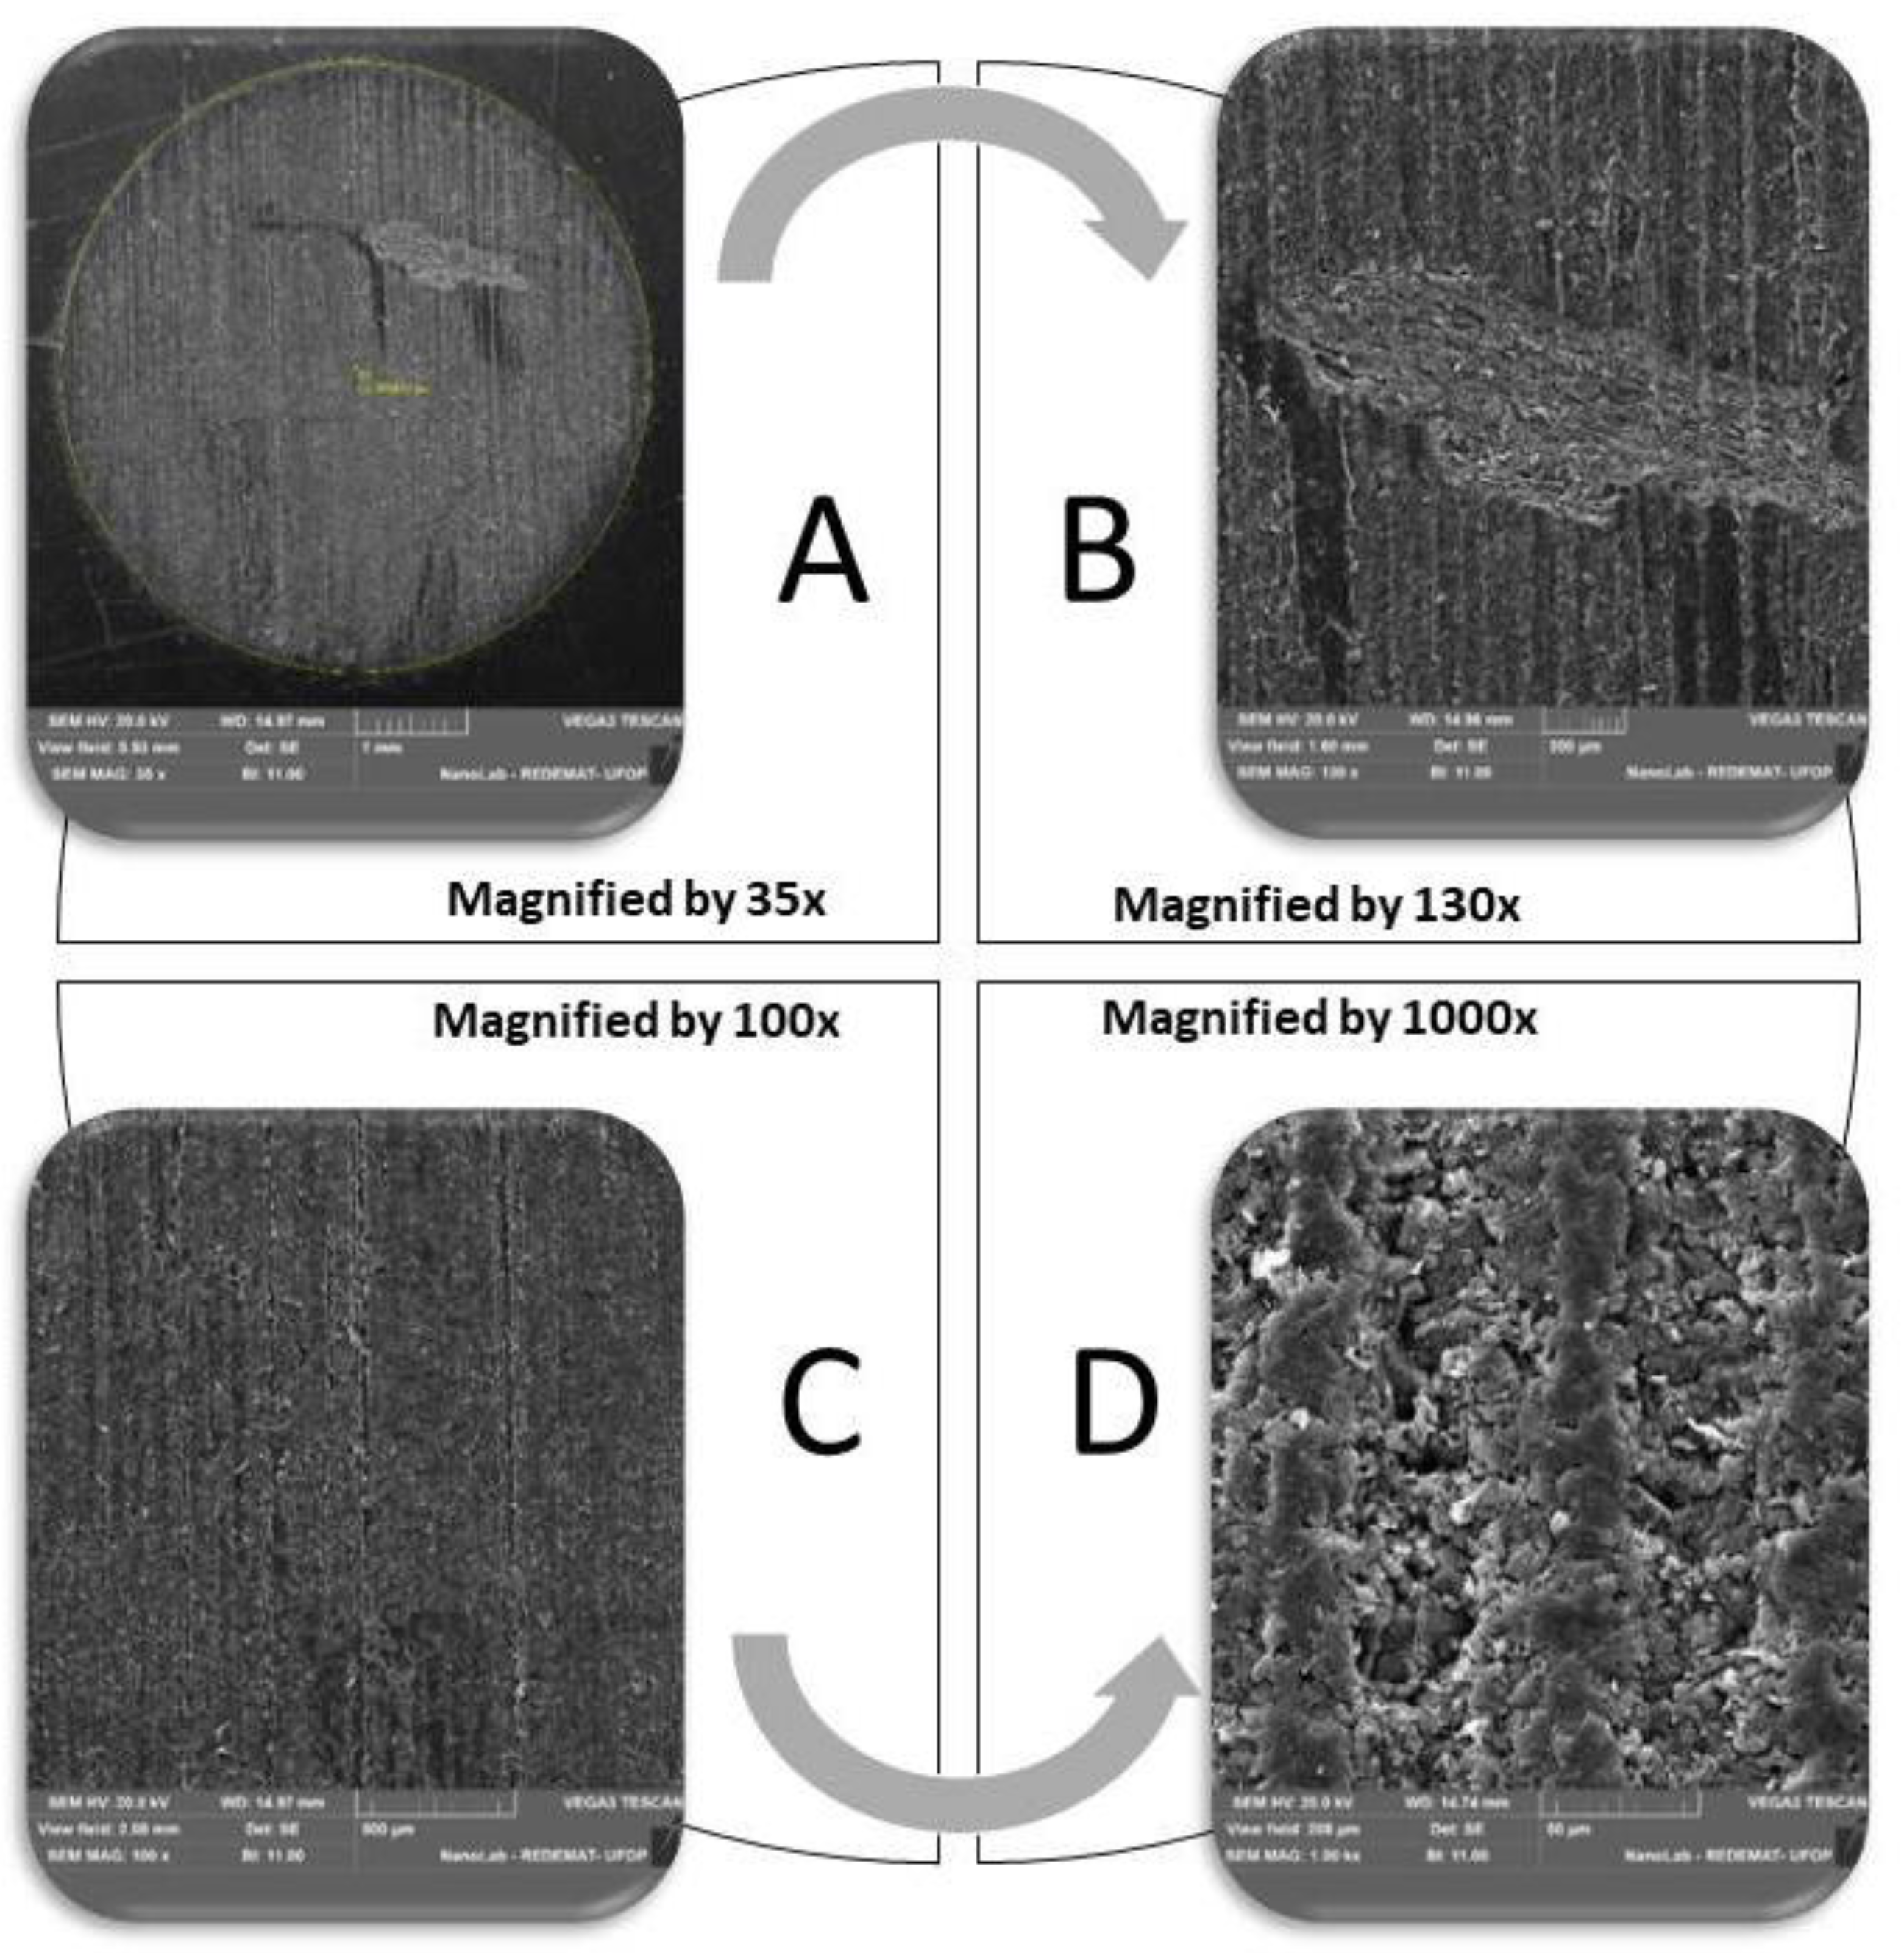
2.3.4. Evaluation of Resistance to Micro-Abrasive Wear

In the evaluation of resistance to micro-abrasive wear, two specimens were used. In each specimen, 5 tests were carried out; that is, there are 10 wear evaluation points. The tests were performed on equipment developed by the Foundry Laboratory DEMET/EM/UFOP. A Scanning Electron Microscope was used to measure the wear cap—MEV, from the manufacturer TESCAN, model VEGA 3 SEM, of the Laboratory NANOLab EM/UFOP.
Wear was assessed by rotating a sphere against a static specimen, with abrasive mud between the sphere and the specimen. The spherical cap-shaped groove has a volume calculated from the sphere’s radius and the spherical cap’s diameter. Thus, the wear coefficient can be interpreted as the volume of material worn per unit of force and per unit of sliding distance (m3/Nm) [36].
After micro-abrasive essays, a study of the wear mechanism was carried out by SEM—Scanning Electron Microscope.

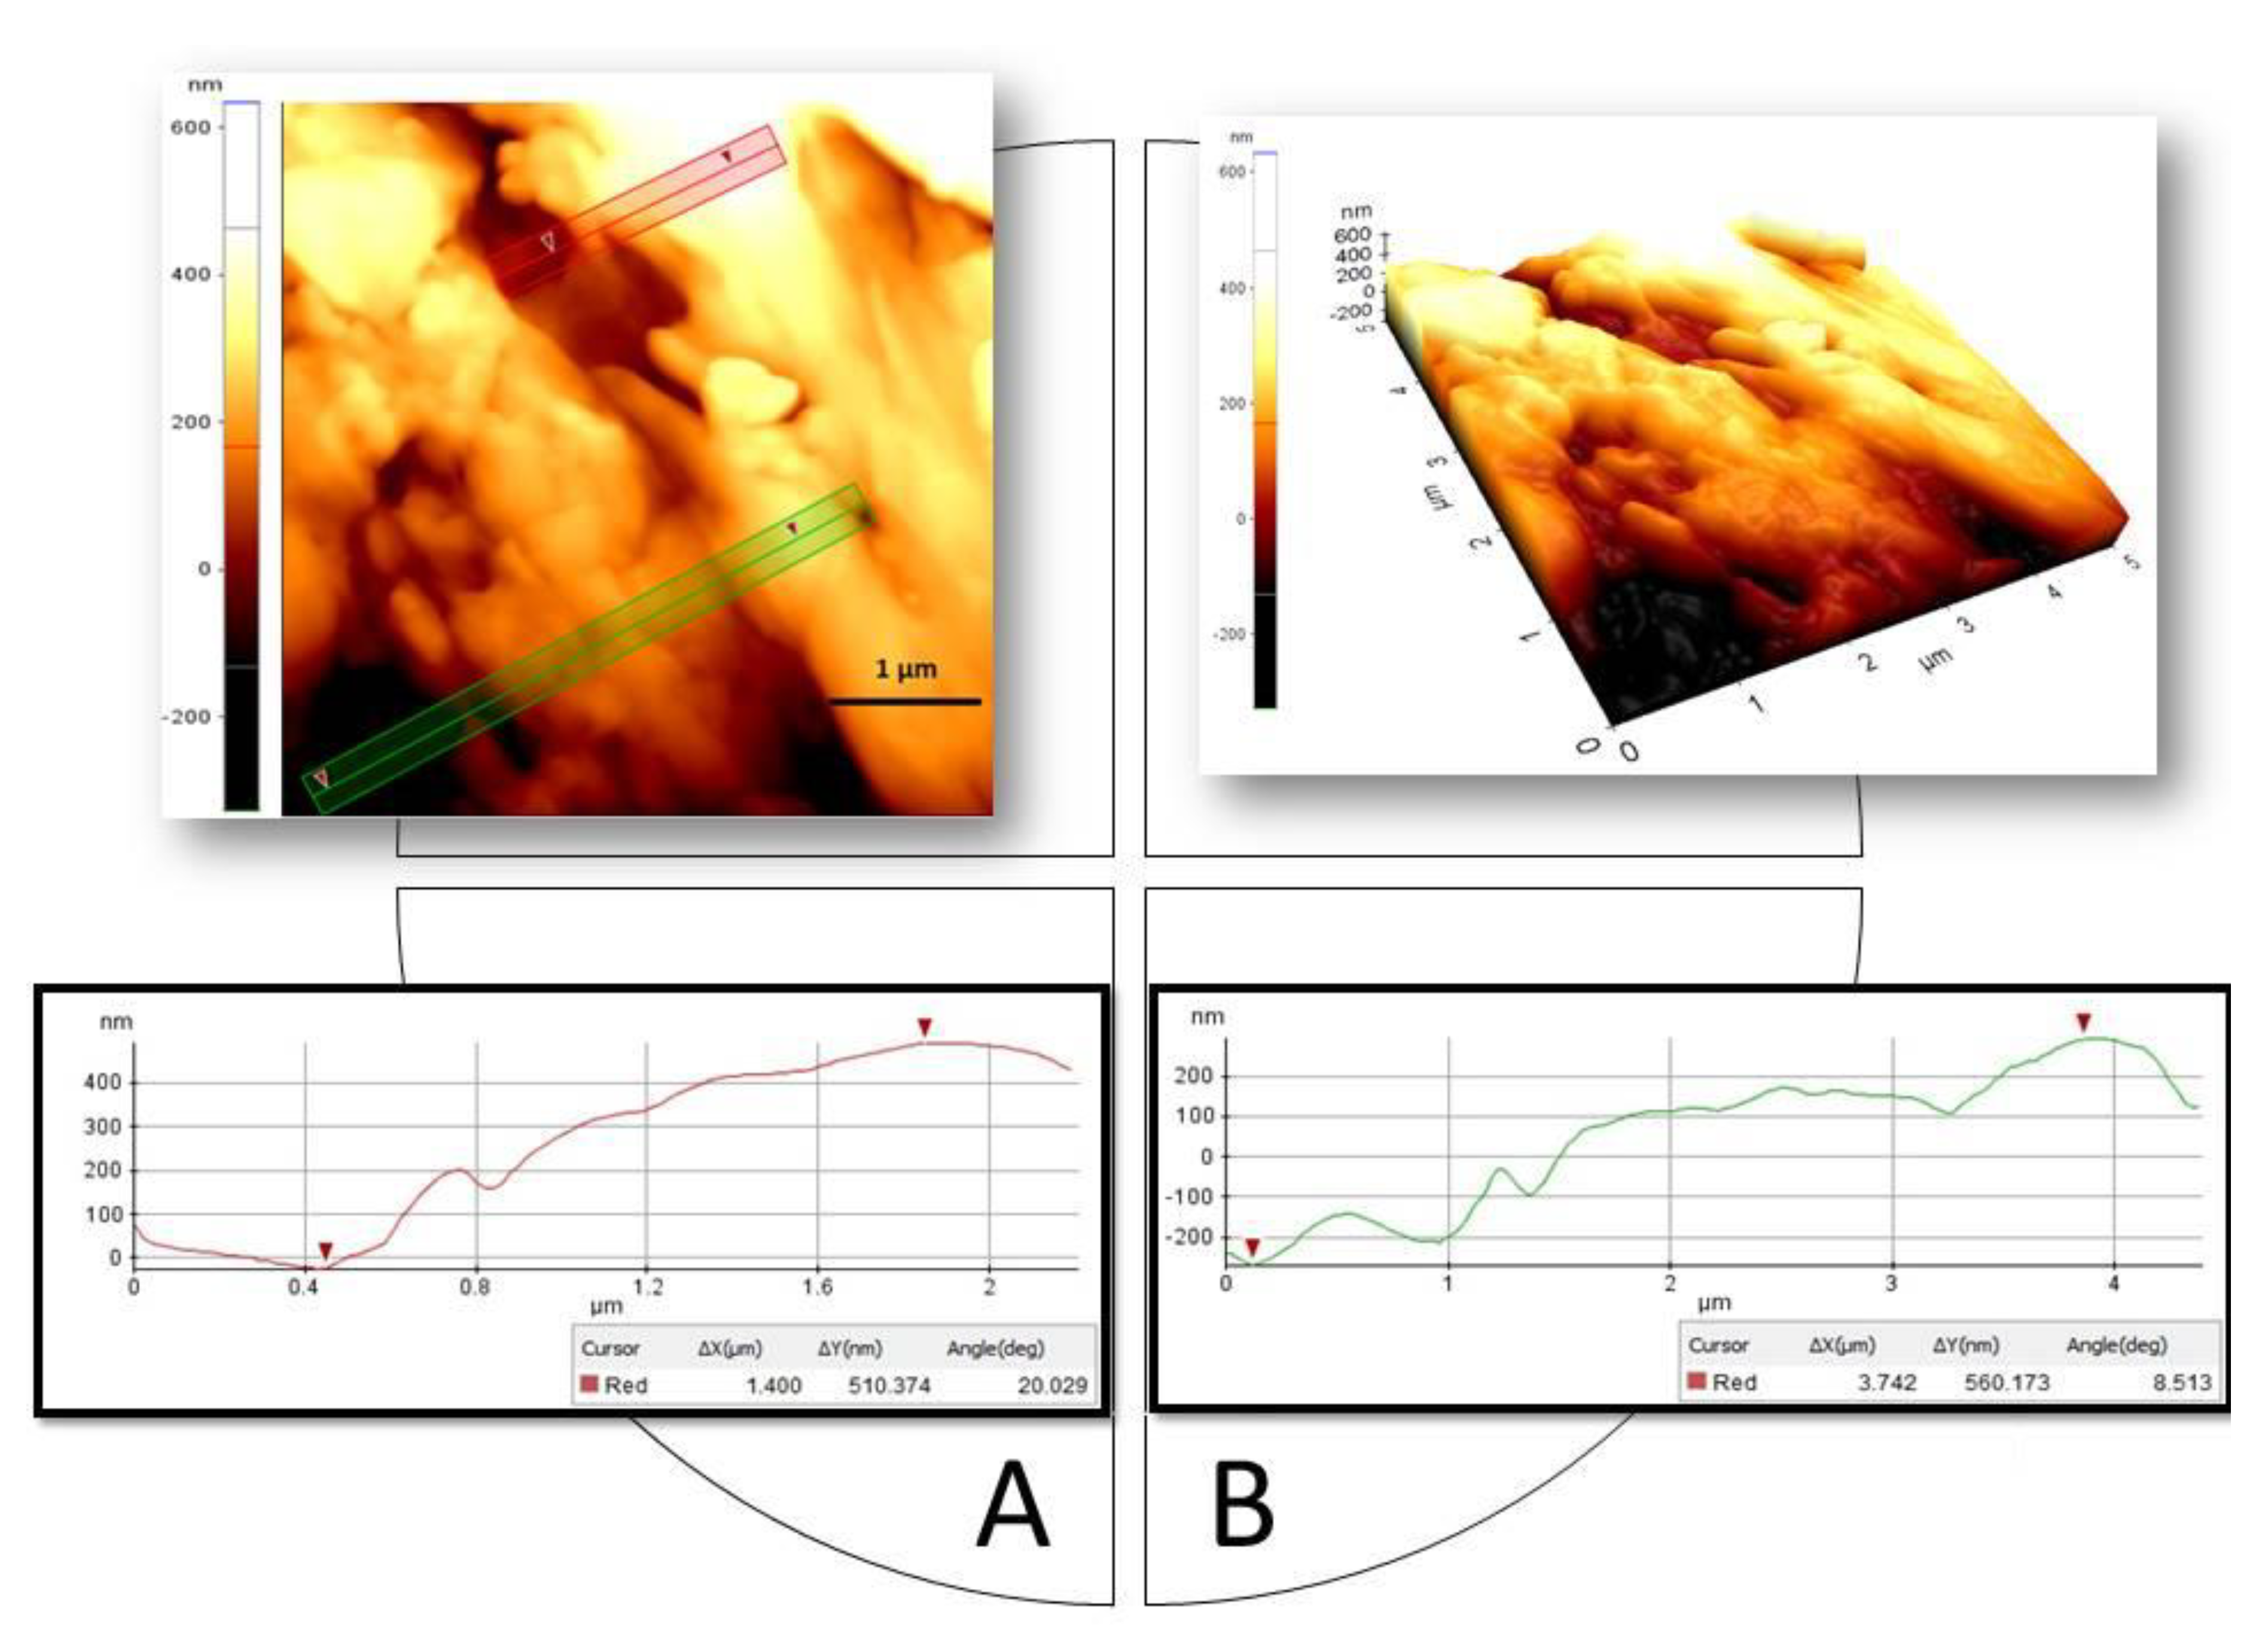
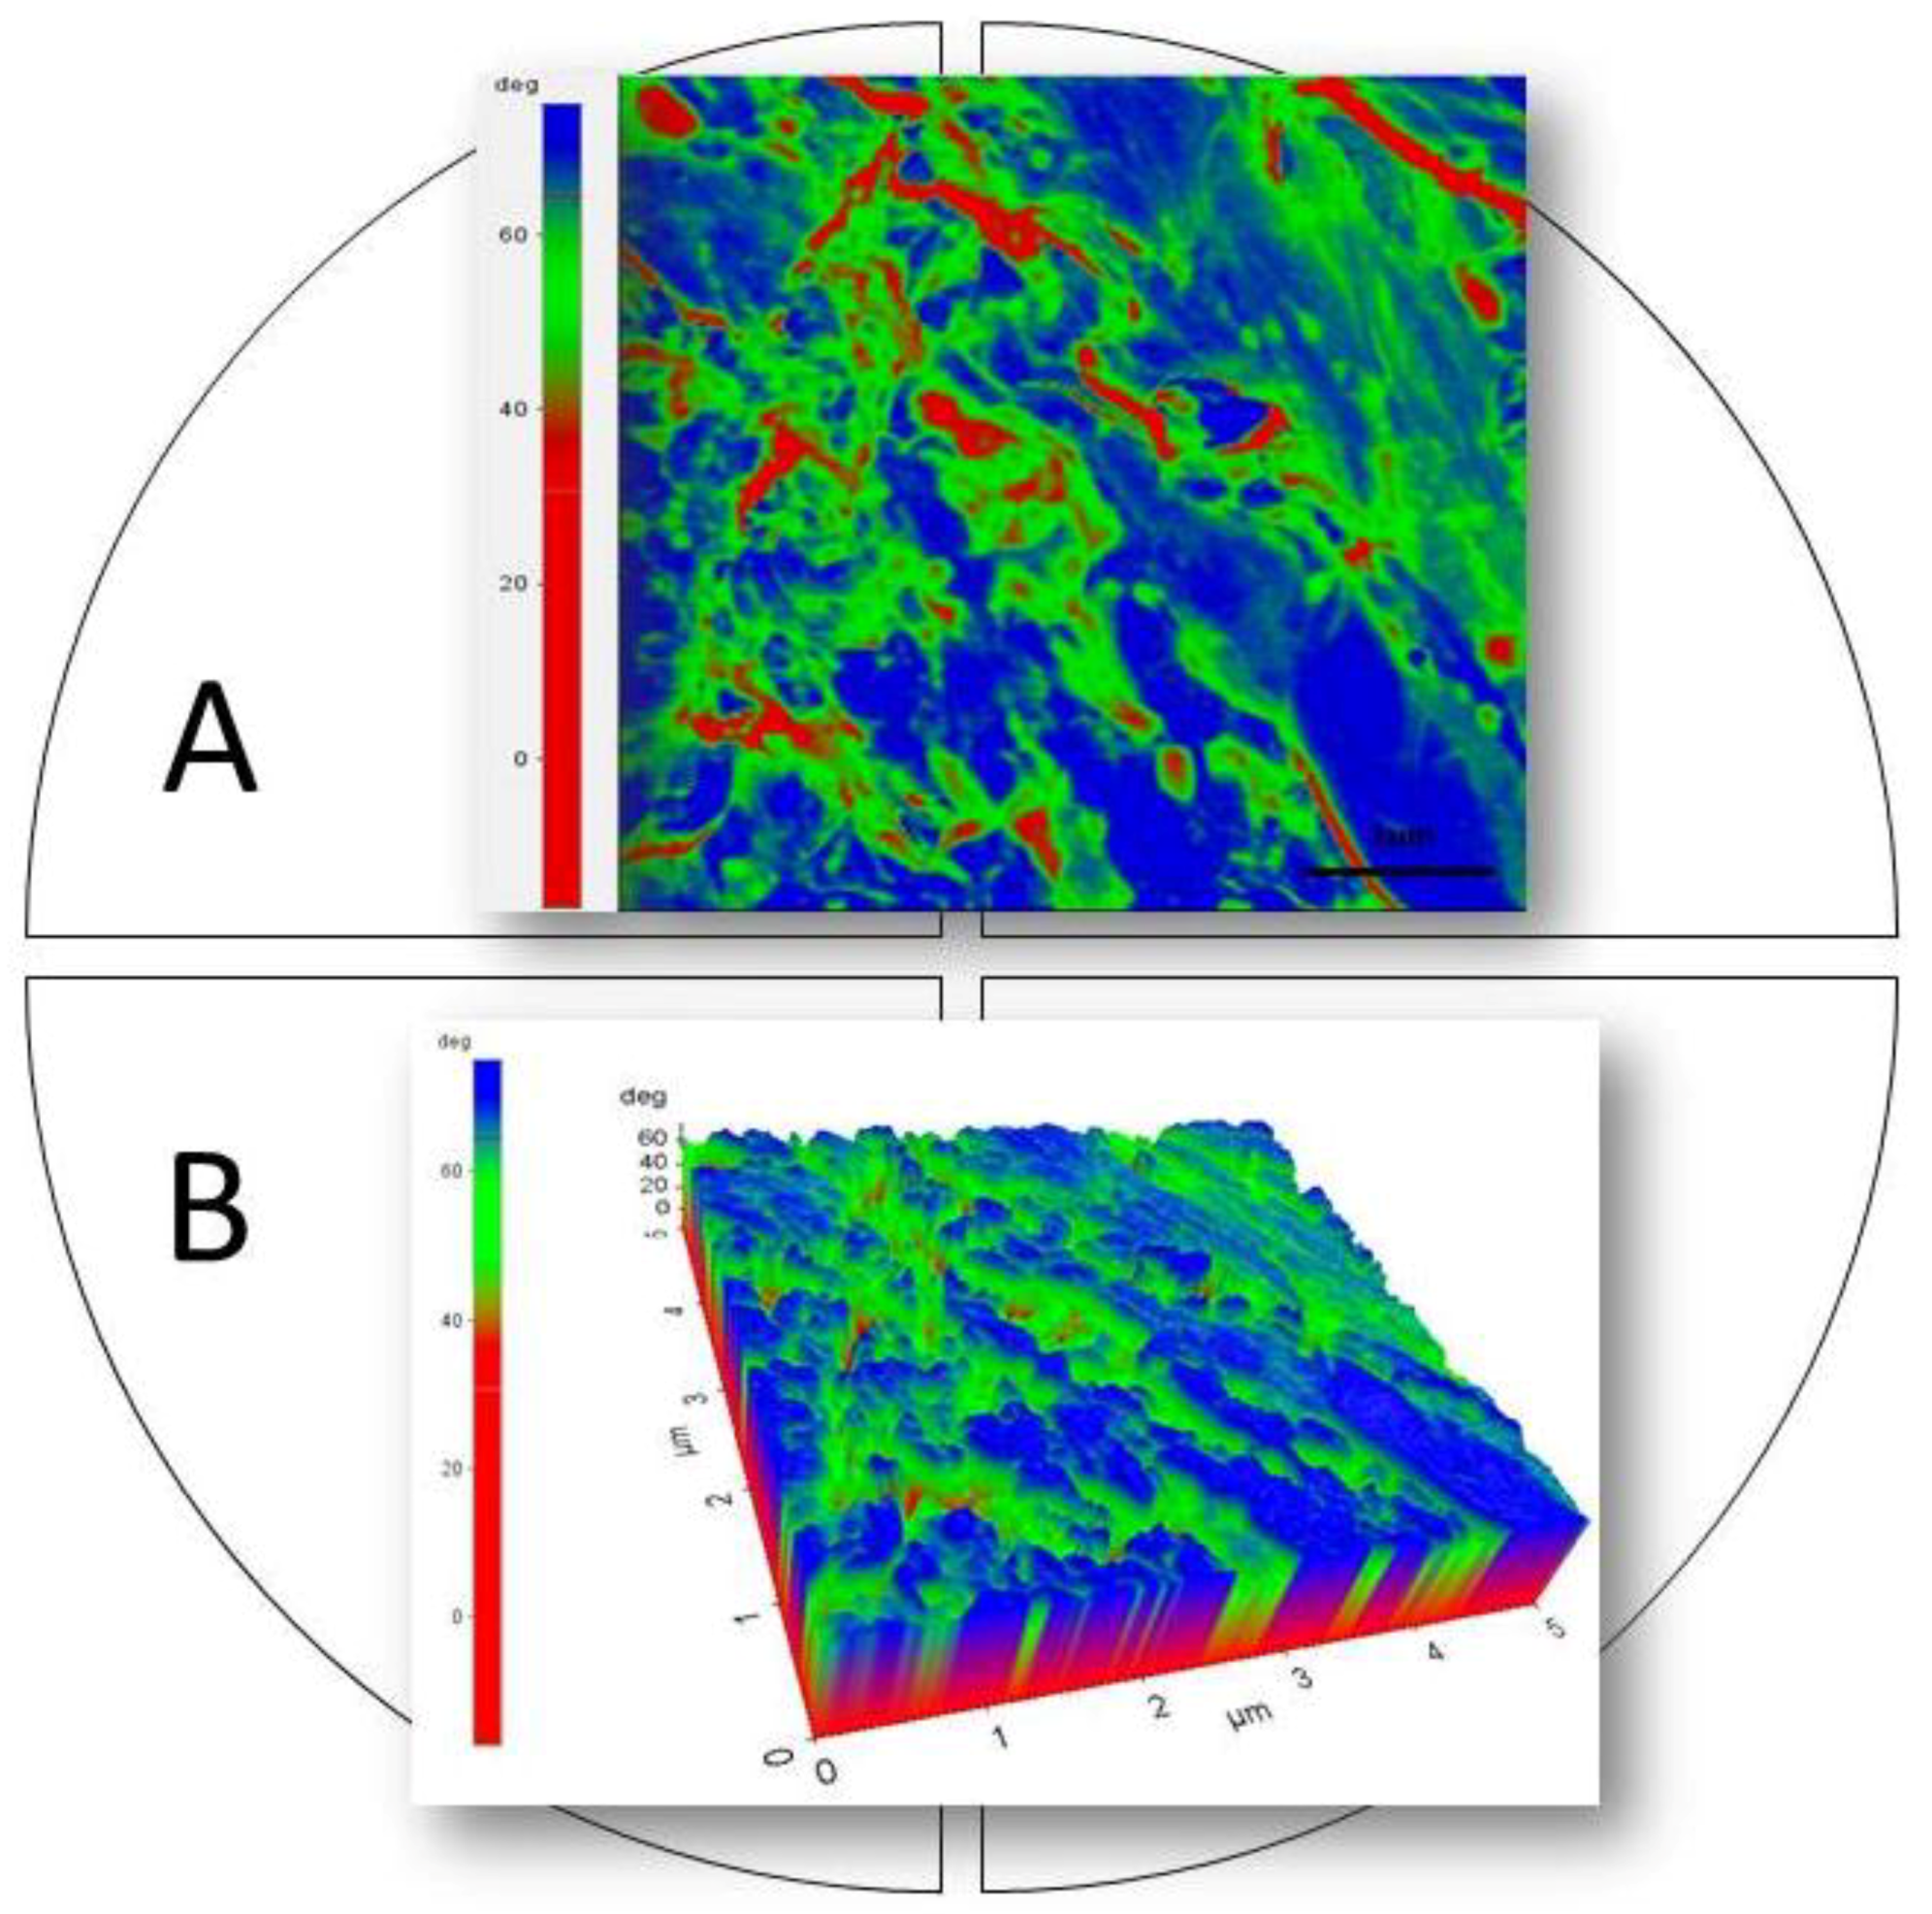
2.3.5. Study of Surface Topography and Phase Contrast with SPM

For the analysis of the microform of the material structure and the combination of the compound’s different materials, an analysis of the surface topography was done using topography and phase-contrast images. An AFM—Atomic Force Microscope—was used, from the manufacturer Park Systems, model Park XE7, from the Microscopy Center of Instituto Federal de Minas Gerais—IFMG, Ouro Preto.
The mode used in this test was tapping (intermittent contact), because a soft material with energy dissipation favors the distinction between attractive and repulsive regimes for image generation.
The set of techniques allows generating images, where the channels monitored in the tapping mode were topography, error, and NCM Phase in trace and retraction (a round trip of the AFM probe in different images). In the form of peaks and valleys, dimensional information on the surface morphology and phase difference of materials are observed [37].

3. Results and Discussions

The techniques for evaluating resistance to compression stress, surface hardness, absorption rate, density, and resistance to micro-abrasive wear were used in order to expose blocks produced from WEEE to conditions or application requests: as an interlocking block for pavements, walkways, parking, and walkways.

3.1. Resistance to Compression Load

A fragile fracture was observed in all samples. The compression load resistance values have been considered satisfactory when compared to those obtained for interlocking concrete blocks. The samples that presented lesser resistance showed a fracture in portions with some inclusion. As we have discussed above, the material does not treat the separation of aggregate residues. The material under study had a maximum breaking strength limit of approximately 9355 N.
The stress versus strain curves showed features of essays on polymers, with a linear relationship between stress/strain in some interval, which allows the evaluation of Young’s module. The value is within the expected parameters for polymers, even for specimens treated at high temperatures, low temperatures, and saturation. As we have described above, five specimens have been tested for each essay. Figure 5 shows the stress-strain results for each essay. Results for saturated specimens, as well those for high temperatures, showed significant dispersion. The essay at room temperature showed lower dispersion, as shown in the uncertainty value presented in Table 1.
The average values were considered in the uncertainty calculations for each measurement, as discussed above. The values of average compression strengths and average Young modules with respective estimated uncertainties are expressed in Table 1.
There is a reduction in resistance to compression in the case of the hotter specimen, and a small variation in Young’s modulus concerning the other tests. This occurs due to the relative movement of adjoining polymer chains as tension increases, facilitated by reducing secondary bonding forces on a molecular scale. The material becomes softer and more ductile [31].
Comparing the results of the polymeric paver’s compression load resistance with those required for concrete pavers, as shown in Table 2, the material has acceptable behavior.

3.2. Surface Hardness

The material under study has high surface hardness because it has ABS in its composition. The evaluation took place at room temperature (~24 °C), and the values are shown in Table 3 below. Each column refers to each essay’s three points: at the left, middle, and right parts of the specimen. The three columns at left present the measurements obtained directly, and the three columns at right present the results after corrections, which have been calculated from the calibration certificate. As one can observe, the several values obtained for a specific point are not the same, due to micro deformations on the tested surface, even though it is a non-destructive evaluation.
The average surface hardness measurement with respective estimated uncertainty can be expressed as = (51.1 ± 1.0) HRC.
Since the hardness assessments in Portland concrete are currently made by axial compression with a sclerometer obtaining the sclerometric index (MPa), it is not possible to directly compare the results obtained in HRC for this work. Winslow [38] used the ASTM Standard E 18-79 “Rockwell Hardness and Rockwell Superficial Hardness of Metallic Materials”, obtaining the concrete’s average surface hardness ranging from 45 to 52 HR. Thus, the polymer block surface hardness meets Portland concrete specifications applied on floors, since we have obtained values between 50.1 and 52.1 HRC.

3.3. Average Water Absorption

Construction with interlocking blocks requests the existence of space between them, in the resulting application. This gap is necessary to allow rainwater to flow to the soil and be absorbed; the parking lot should not be impermeable. Thus, a necessary feature of pavers is the low absorption of water, allowing it to flow to the soil. For the interlocking blocks produced from e-waste, a low absorption rate was obtained, as shown in Table 4. This low rate indicates conditions for the flow of rainwater, and the construction of parking with these blocks, giving space between them for free movement, settlement, and drainage of water to the soil passing through the gap.
The tests showed that the material has properties consistent with light paving, such as parking lots, sidewalks, bike paths, and walkways. The average value of the absorption rate was considered in the measurement of uncertainty calculations. With the respective estimated uncertainties, we have = (0.085 ± 0.004)%.

3.4. Average Density

The material under study has a low average density compared to the density of concrete that varies between 2.5 and 3 g/cm3, as shown in Table 5.
The average density measurement with respective estimated uncertainty can be expressed as = (1.075615 ± 0.000019) g/cm3.

3.5. Resistance to Micro-Abrasive Wear

A circumferentially shaped cavity was generated, shown in a 35× zoom in Figure 6A. An inclusion is observed in this cavity, as o observed from the 130× zoom, shown in Figure 6B. The wear mechanism is uniform, even in the presence of different materials in the compost. The details on the wear surface and confirming the wear mechanism by scratching are shown in Figure 6C, where micropores can be observed. The scratch wear mechanism was observed, generating micropores. For this test, Aluminum Carbide was used as an abrasive, suitable for evaluating severe wear, resulting in uniformity as detected in Figure 6D. We assume that these micropores allow the penetration of contaminants, which might accelerate the material’s degradation.
In the micro-abrasion resistance assessment equipment, the measurement replication was done in the same specimen, but at different points. The analyzes of the resistance to micro-abrasive wear were done in 2 specimens conditioned to loads of 1 N and 3 N, respectively. The evaluation of resistance to micro-abrasive wear showed values adequate to the designed application. Table 6 shows the loss of volume from the dimensions of the wear cavities.
The final results of the average micro-abrasive wear coefficients for the 1 N and 3 N loads with the respective standard uncertainties are:
  • K with load 1 N = (0.0010 ± 0.0002) m3/Nm.
  • K with load 3 N = (0.0002 ± 0.0002) m3/Nm.
ABNT, ASTM, and BSEM standards are based on wear depth, even by different tests. Thus, to correlate the methods used, we calculate the respective depths of the spherical caps formed by the wear sphere:
  • K with load 1 N: 0.48 mm
  • K with load 3 N: 0.35 mm
By using the same methodology as this project, [36] obtained a wear coefficient K between 9.67 × 10⁻¹³ m3/Nm and 19.02 × 10⁻¹³ m3/Nm in the evaluation of abrasive wear resistance of grinding bodies produced with white cast iron high chrome. It is a metallic material with an average hardness of 80 HRC. Thus, we assume that the polymer under study has resistance to micro-abrasion equivalent to that expected.

3.6. Surface Topographic Analysis and Phase Contrast with SPM—Scanning Probe Microscopy

To analyze the microform of the material structure and the connection between the compound’s different materials, an analysis of the surface topography was done using topography and phase-contrast images. Using the AFM—Atomic Force Microscopes technique, with the Force-Tip Sample ratio, topography, error, and phase-contrast images are generated in trace and retraction (round trip of the probe in different images), where it is observed in shape of peaks and valleys dimensional information of surface morphology and phase difference of materials [37].
The mode used in this test was Tapping (Intermittent contact), because the soft material with energy dissipation favors the distinction between attractive and repulsive regimes for image generation. According to [39], AFM can distinguish the different modules of elasticity of the constituent materials even though there is no difference in the sample’s topography. This is thanks to the AFM needle that vibrates on the sample and detects the material’s ability to absorb the energy of the shock with the needle. As the sample was manufactured from materials already processed, this mode will bring morphological and topographic information after reproducing the specimens’ polymers.
It is possible to observe variations in the surface due to “voids”, that is, variations in the measurements of the “high” and “low” points. The lower the darker surface (bottom of the “hole”): in this case, black. The higher, the clearer.
The red ruler in Figure 7, highlighted in Figure 7A, represents a depth of approximately 510 nm. The green ruler, represented in the graph of Figure 7A, has a point that stands out for its light color and in the lower left corner a dark color, showing a “very high” point and a “very low” point in approximately 560 nm.
As the probe identifies different materials by the attractive/repulsive action, detecting the material’s ability to absorb the energy from the shock of the needle, Figure 8 shows the presence of more than one material in the compound under study, with blue being the largest quantity, the red represents the base for fixing the sample. A reasonable degree of homogeneity of the polymeric matrix under study is observed.

4. Conclusions

Production of electronic waste increases rapidly, and it is necessary the definition of public policies to deal with this. Recycling is one important line of action and recycling industrial residues for the production of basic materials for civil construction is a growing way to use these residuals. To this production be effective and economical, it is necessary for the characterization of those new materials.
In this work, we characterize the mechanical properties of interlocking plastic pavers produced with residues from the electric-electronic industry. These pavers are produced at the Computer Reconditioning Center Programando o Futuro, in the city of Valparaíso/GO. CRC is part of the public policy of the Ministry of Communications, which aims to the recondition equipment, the adequate disposal of e-waste, and education and training of young people in situations of social vulnerability.
The CRC developed a technique to produce pavers from e-waste. As we have discussed in the introduction, this type of action is adherent to other researches that aim to manufacture products for civil construction from the electrical and electronic industry residuals.
Pavers are produced from a mixture of different materials, but their main components—in the order of 70%—are computer housings composed of ABS, PS, and PC. The extra charge of material crushed with cigarettes, CDs, toys, or makeup packs is added. This mixture is heated at temperatures between 115° and 140° and pressed into molds.
Characterization of materials for civil constructions obtained from mineral or steel industries residuals, or even with the re-use of those originally used in the civil construction, is common in the literature. However, since the recycling of polymers aiming at civil construction is very recent, one needs a description of the basic features of those new materials obtained from e-waste. This is also necessary to support public policies, as well as to define new Standards for these new materials.
Tests of resistance to compression, hardness, absorption, and micro-abrasion were performed. The topographic characteristics of the material were also verified, allowing us to visualize the structural arrangement of its components. From the tests carried out and the estimated uncertainty assessments, it is clear that interlocking plastic pavers manufactured from e-waste behave similar to blocks made from concrete. These evaluations showed that the material has properties consistent with those required for light paving, such as parking lots, sidewalks, bike paths, walkways, and walkways.
Future works and researches should be developed in the definition of Standards for this new type of material, as well as in the development of new methods for their characterization. We believe that this kind of work, mainly in Brazil or other developing countries, which produce tons of non-reused electronic equipment and where recycling of e-waste is a newborn activity, should influence public and private agents to support the creation of new cheap products for diverse applications. It is also necessary to create new essays, describing physical, chemical, and biological features.
This type of recycling or reconditioning action contributes to at least two of the Sustainable Development Goals proposed by the UN [40] which must be implemented by all countries in the world by 2030.

Author Contributions

L.T.G.: conceptualization, testing and essays, data curation, investigation, methodology, and writing original draft. R.F.B.: supervision, investigation, writing—review and editing, and methodology. A.T.B.: conceptualization, investigation, formal analysis, methodology, writing—review and editing, and project administration. All authors have read and agreed to the published version of the manuscript.

Funding

This research was carried out with partial funding of the Coordination for the Improvement of Higher Education Personnel—Brazil (CAPES): Financing code 001; Funding from the Brazilian agencies CNPq and Fapemig, and financial support from PROPP-UFOP are also acknowledged.

Data Availability Statement

Publicly available datasets were analyzed in this study. This data can be found at: http://www.repositorio.ufop.br/handle/123456789/12341 (accessed on 20 January 2021).

Acknowledgments

We acknowledge support from Leonardo Godefriod, Maria Aparecida Pinto and Geraldo Lúcio de Faria for helping us in some essays and granting access to their laboratories. Further, we acknowledge the support from Geraldo Alves (Torneamentos Mariana) and Danúbia Clemente (SENAI Mariana) for giving access to their facilities. Paulo Couto and Alexandre Mendes are also acknowledged for discussions and clarifying issues on the uncertainties assessments. Finally, we are very grateful to the people of CRC Programando o Futuro, in the person of its coordinator Vilmar Simion for preparing the samples and giving us access to the data of their production.

Conflicts of Interest

The authors declare no conflict of interest.

References

  1. Geyer, R.; Jambeck, J.R.; Law, K.L. Production, Use, and Fate of All Plastics Ever Made. Sci. Adv. (Calif.) 2017, 3, e1700782. Available online: http://advances.sciencemag.org/content/3/7/e1700782 (accessed on 5 February 2019). [CrossRef] [PubMed] [Green Version]
  2. Chowdhury, A.; Patel, J. E-Waste Management and its Consequences: A Literature Review. Prestig. E-J. Manag. Res. 2017, 4, 52–63. [Google Scholar]
  3. Yadav, V.; Sherly, M.A.; Ranjan, P.; Tinoco, R.O.; Boldrin, A.; Damgaard, A.; Laurent, A. Framework for Quantifying Environmental Losses of Plastics from Landfills. Resour. Conserv. Recycl. 2020, 161, 104914. [Google Scholar] [CrossRef]
  4. Corrêa, H.L.; Figueiredo, M.A.G. Urban Mining: A Brief Review on Prospecting Technologies. Braz. J. Dev. 2020, 6, 29441–29452. [Google Scholar] [CrossRef]
  5. Khutale, Y.P.; Yadav, S.B.; Awati, R.V.; Awati, V.B. Electronic Waste Management. Int. J. Recent Trends Eng. Res. 2019, 5, 42–50. [Google Scholar] [CrossRef]
  6. Mao, S.; Gu, W.; Bai, J.; Dong, B.; Huang, Q.; Zhao, J.; Zhuang, X.; Zhang, C.; Yuan, W.; Wang, J. Migration of heavy metal in electronic waste plastics during simulated recycling on a laboratory scale. Chemosphere 2020, 245, 125645. [Google Scholar] [CrossRef]
  7. ISWA. The Global E-Waste Monitor 2020. Available online: http://www.iswa.org/home/news/news-detail/article/-21c8325490/109/ (accessed on 15 July 2020).
  8. Demets, R.; Roosen, M.; Vandermeersch, L.; Ragaert, K.; Walgraeve, C.; Meester, S. Development and Application of an Analytical Method to Quantify Odour Removal in Plastic Waste Recycling Processes. Resour. Conserv. Recycl. 2020, 161, 104907. [Google Scholar] [CrossRef]
  9. Boldoczki, S.; Thorenz, A.; Tuma, A. The Environmental Impacts of Preparation for reuse: A Case Study of Weee Reuse in Germany. J. Clean. Prod. 2020, 252, 119736. [Google Scholar] [CrossRef]
  10. O’reilly, P.G. Regulation, Product Durability, and Market Process in Recycling Electronic Waste. Ph.D. Thesis, Mineral And Energy Economics at the Colorado School of Mines, Faculty and the Board of Trustees of the Colorado School of Mines, Golden, CO, USA, 2019. Available online: http://mountainscholar.org/bitstream/handle/11124/174005/OReilly_mines_0052E_11872.pdf?sequence=1&isAllowed=y (accessed on 27 July 2020).
  11. Siringo, R.; Herdiansyah, H.; Kusumastuti, R.D. Underlying Factors behind the Low Participation Rate in Electronic Waste Recycling. Global J. Environ. Sci. Manag. 2020, 6, 203–214. Available online: http://www.gjesm.net/article_37686_ee1060947420a30acb5e857c61c2a433.pdf (accessed on 27 July 2020).
  12. Awasthi, A.K.; Cucchiella, F.; D’Adamo, I.; Li, J.; Rosa, P.; Terzi, S.; Wei, G.; Zeng, X. Modelling the Correlations of E-Waste Quantity with Economic Increase. Sci. Total Environ. 2018, 613–614, 46–53. [Google Scholar] [CrossRef] [PubMed]
  13. Cucchiella, F.; D’Adamo, I.; Lenny Koh, S.C.; Rosa, P. Recycling of WEEEs: An economic assessment of present and future e-waste streams. Renew. Sustain. Energy Rev. 2015, 51, 263–272. [Google Scholar] [CrossRef] [Green Version]
  14. ABRIN. Brazilian Association of Recycling and Innovation-Annual Report 2017-Disposal Data, Management, Indicators and Collection. São Paulo: 65p. 2018. Available online: http://www.abrin.eco.br/ (accessed on 13 May 2019).
  15. Baldé, C.P.; Forti, V.; Gray, V.; Kuehr, R.; Stegmann, P.; The Global E-Waste Monitor. United Nations University (UNU), International Telecommunication Union (ITU) & International Solid Waste Association (ISWA), Bonn/Geneva/Vienna: 2017. Available online: http://collections.unu.edu/view/UNU:6341 (accessed on 13 May 2019).
  16. Santos, K.L. The Recycling of E-Waste in the Industrialised Global South: The Case of Sao Paulo Macrometropolis. Int. J. Urban Sustain. Dev. 2020, 1–14. [Google Scholar] [CrossRef]
  17. Souza, R.G.; Clímaco, J.C.N.; Sant’anna, A.P.; Rocha, T.B.; Valle, R.A.B.; Quelhas, O.L.G. Sustainability assessment and prioritisation of e-waste management options in Brazil. Waste Manag. 2016, 57, 46–56. [Google Scholar] [CrossRef] [Green Version]
  18. MMA–Ministry of the Environment. National Solid Waste Policy. Available online: http://www.mma.gov.br/cidades-sustentaveis/residuos-solidos/politica-nacional-de-residuos-solidos (accessed on 28 July 2020).
  19. Xavier, L.H.; Resíduos Eletroeletrônicos na Região Metropolitana do Recife (RMR): Guia Prático para um Ambiente Sustentável. 1ª edição. Recife: Editora Massangana. 2014. Available online: https://www.researchgate.net/publication/271587261_Residuos_Eletroeletronicos_na_Regiao_Metropolitana_do_Recife_Guia_pratico_para_um_ambiente_sustentavel (accessed on 13 May 2019).
  20. Hopewell, J.; Dvorak, R.; Kosior, E. Plastics recycling: Challenges and Opportunities. Philosophical Transactions of The Royal Society B: Biological Sciences. R. Soc. 2009, 364, 2115–2126. [Google Scholar] [CrossRef] [PubMed] [Green Version]
  21. De Oliveira Vieira, B.; Guarnieri, P.; Camara e Silva, L.; Alfinito, S. Prioritizing Barriers to Be Solved to the Implementation of Reverse Logistics of E-Waste in Brazil under a Multicriteria Decision Aid Approach. Sustainability 2020, 12, 4337. [Google Scholar] [CrossRef]
  22. MCTIC: Ministry of Science, Technology, Innovations and Communications. Computers for Inclusion. 2019. Available online: http://www.mctic.gov.br/mctic/opencms/indicadores/detalhe/O-Centro-de-Recondicionamento-de-Computadores-2.html (accessed on 10 March 2019).
  23. Manjunath, B.T.A. Partial Replacement of E-plastic Waste as Coarse-Aggregate in Concrete. Procedia Environ. Sci. 2016, 35, 731–739. [Google Scholar] [CrossRef]
  24. Hamsavathi, K.; Prakash, K.S.; Kavimani, V. Green High Strength Concrete Containing Recycled Cathode Ray Tube Panel Plastics (E-Waste) as Coarse Aggregate in Concrete Beams for Structural Applications. J. Build. Eng. 2020, 30, 101192. [Google Scholar] [CrossRef]
  25. Silva, A.P. Fabricação de Análise de Pavimentos Intertravados (PAVERS) Utilizando Resíduos de Borracha de Pneus Inservíveis e Resíduos de Construção Civil e Demolição (RCD) Como Agregado Miúdo; 29 f. TCC (University Graduate)-Curso de Engenharia Civil; Universidade do Vale do Paraíba: São José dos Campos, Brazil, 2016. [Google Scholar]
  26. Paschoalin Filho, J.A.; Pires, G.W.M.O.; Rezende, L.V.S.; Santana, J.C.C. Resistência a Compressão e Absorção de água de peças de piso Intertravado Manufaturadas com Resíduos de pet. HOLOS 2019, 1, 1–21. [Google Scholar] [CrossRef]
  27. Jain, N.; Garg, M.; Minocha, A.K. Green Concrete from Sustainable Recycled Coarse Aggregates: Mechanical and Durability Properties. J. Waste Manag. 2015, 1–8. [Google Scholar] [CrossRef] [Green Version]
  28. Silva, F.L.; Moreira, G.F.; Coelho, H.C.S.; Pires, K.S.; Kruger, F.L.; Araujo, F.G.S. Caracterização Quantitativa Eletrônica de Blocos Intertravados com Rejeito de Minério de Ferro. XXVIII Encontro Nacional de Tratamento de Minérios e Metalurgia Extrativa. Belo Horizonte-MG. 2019. Available online: https://www.artigos.entmme.org/?wpfb_file_sort=%3Cfile_size (accessed on 7 January 2020).
  29. Dias, M.R.Q. Separação de Plásticos de REEE Recorrendo à Separação Gravítica e Flutuação por Espumas. IST Técnico Lisboa. Engenharia Geológica e de Minas. Lisboa. 2013. Available online: http://fenix.tecnico.ulisboa.pt/downloadFile/395146045208/Disserta%C3%A7%C3%A3o_MaraDias_MEGM_54230.pdf (accessed on 28 May 2020).
  30. Wassermann, A.I. Processamento e Características Mecânicas de resíduos Plásticos Misturados. Universidade Federal do Rio Grande do Sul–Departamento de Engenharia Química. Porto Alegre. 2006. Available online: http://lume.ufrgs.br/bitstream/handle/10183/17360/000714892.pdf;jsessionid=4BE30884E5DF1BECC0AC870E76A497E4?sequence=1 (accessed on 31 June 2019).
  31. Callister, W.D.J.; Rethwisch, D.G. Materials Science and Engineering: An Introduction, 8th ed.; John Wiley and Sons: Hoboken, NJ, USA, 2009; Available online: https://www.amazon.com/Materials-Science-Engineering-Introduction-8th/dp/0470419970 (accessed on 20 January 2021).
  32. ISO-International Standardization Organization. 604:2002: Plastics-Determination of Compression Properties; ISO: Geneva, Switzerland, 2012. [Google Scholar]
  33. BIPM: Bureau International des Poids et Mesures. JCGM 100:2008 GUM, 1995 with Minor Corrections Evaluation of Measurement Data—Guide to the Expression of Uncertainty in Measurement; Paris, France, 2010; Available online: https://www.bipm.org/en/publications/guides/gum.html (accessed on 20 January 2021).
  34. ABNT-Brazilian Association of Technical Standards. ABNT NBR 9781/2013: Concrete Paving Units-Specification and Test Methods; ABNT/MB 3483: Rio de Janeiro, Spain, 2013. [Google Scholar]
  35. Kassman, A.; Jacobson, S.; Erickson, L.; Hedenqvist, P.; Olsson, M. A new test method for the intrinsic abrasion resistance of thin coatings. Surf. Coat. Technol. 1991, 50, 75–84. [Google Scholar] [CrossRef]
  36. Santos, L.C. Influência do Tratamento Térmico de Revenimento Sobre a Resistência ao Desgaste Abrasivo de Corpos Moedores Produzidos Com Ferro Fundido Branco de Alto Cromo; 59 f. TCC (University graduate)-Engenharia Metalúrgica; Universidade Federal de Ouro Preto: Ouro Preto, Spain, 2014. [Google Scholar]
  37. Leite, F.L.; Zeimath, E.C.; Herrmann, P.S.P. Análise de Minerais do Solo por Espectroscopia de Força Atômica. EmbrapaSão Carlos-Sp 2005, 70, 1–7. Available online: http://www.infoteca.cnptia.embrapa.br/bitstream/doc/28204/1/CT702005.pdf (accessed on 26 October 2018).
  38. Winslow, D.N. A Rockwell Hardness Test for Portland Cement Concrete. Purdue University-West Lafayette, Indiana. 1981. Available online: http://pdfs.semanticscholar.org/c4f4/a5d61aa8017b453ce85533c011ccbec8262b.pdf?_ga=2.251600705.615054613.1599741451-287955651.1599741451 (accessed on 10 September 2020).
  39. Herrmann, P.S.P.; da Silva, M.A.; Bernardes, F.R.; Job, A.E.; Colnago, L.A.; Frommer, J.E.; Mattoso, L.H. Microscopia de Varredura por Força: Uma Ferramenta Poderosa no Estudo de Polímeros. Polímeros: Ciência e Tecnologia, São Paulo. 1997, Volume 1, pp. 51–61. Available online: http://www.scielo.br/pdf/po/v7n4/8878.pdf (accessed on 13 May 2019).
  40. UN. The 2030 Agenda for Sustainable Development. 2015. Available online: http://sdgs.un.org/goals (accessed on 23 January 2020).
Figure 1. (left) From e-waste to interlocking plastic pavers: the recycling way. Containers to collect e-waste are distributed in strategic points (malls, supermarkets etc.). The Computer Reconditioning Centers (CRC) also collects electronic equipment either in public or private institutions. (right) On a sand bed, the pavers form a pavement with space for accommodation and drainage.
Recycling 06 00015 g001
Figure 2. Process flowchart describing the steps of this work.
Recycling 06 00015 g002
Figure 3. Separation of pavers and specimen preparation for essays.
Recycling 06 00015 g003
Figure 4. Cause and effect diagram for calculating measurement uncertainty in the compression strength test.
Recycling 06 00015 g004
Figure 5. Stress x Strain graphs. The results for each test are presented for the four specimens obtained from each block (numbered as 3, 4, 5, 7, and 8, randomly selected as described above). Letters “a”, “b”, “c”, and “d” refers to the different essays.
Recycling 06 00015 g005
Figure 6. Magnified by (A) 35×, (C) 100×, (B) 130×, and (D) 1000×. Evaluation of micro-abrasive wear in inclusions using the SEM technique.
Recycling 06 00015 g006
Figure 7. Topographic images of the Atomic Force Microscope (AFM) in trace of the probe. At left viewpoint vertical to the image and, at right, and oblique view. The two plots below show topography for two regions: (A) refers to the red scale of the image, and (B) refers to the green scale of the image.
Recycling 06 00015 g007
Figure 8. (A) Phase contrast images of the sample in 2d. (B) Phase contrast images of the sample in 3d.
Recycling 06 00015 g008
Table 1. Values of average compression strengths and average Young modules.
Compression strength at room temperature(42 ± 5) MPa
Saturated compression strength(46 ± 14) MPa
High temperature compression strength(27 ± 12) MPa
Frozen compression strength(44 ± 12) MPa
Young’s modulus at room temperature(1.420 ± 0.013) GPa
Saturated Young’s modulus(0.950 ± 0.008) GPa
Hot Young’s modulus(1.110 ± 0.006) GPa
Frozen Young’s modulus(1.150 ± 0.004) GPa
Table 2. Comparative table of resistance to compression load.
StandardRequirements
Light Traffic and PedestriansHeavy TrafficBike Paths and ParkingSpecial VehiclesAcceptable Limits
ABNT NBR 9781:2013Brazil≥35 MPa≥50 MPa---
ASTM C936:1996USA----≥55 MPa
CSA A231.2-95Canada----≥50 MPa
SANS 1058:2009South Africa≥25 MPa≥50 MPa---
AS/NZS 4456.4:2003Australia≥25 MPa≥35 MPa≥15 MPa≥60 MPa-
BSEM 1388:2003EuropeNo individual results <3.6 MPa and breaking load <250 N/mm
Compression strength of the Interlocking Block made from WEEERoom temperature (MPa) = 37–47
Saturated (MPa) = 32–60
Hot (MPa) = 15–39
Frozen (MPa) = 32–56
Table 3. Result table of surface hardness values.
Point Measurement
(Left, Middle, Right)
Point Correction
(Left, Middle, Right)
45.652.749.146.954.050.4
48.652.642.749.953.944.0
50.552.246.851.853.548.1
51.947.950.553.249.251.8
51.752.650.953.053.952.2
Point-corrected average hardness (HRC)51.052.949.3
Average hardness (HRC)51.1
Table 4. Comparative table of absorption rate.
StandardRequirements
ABNT NBR 9781:2013Brazil≤6%
ASTM C936:1996USAAverage: ≤5%
BSEM 1388:2003Europe<6%
Interlocking Block Made from WEEEA (%) = 0.081–0.089
Table 5. Result table of average density values.
Specimen3b4b5b7b8b
Measures (g)8.21429.61738.33869.58258.4978
8.21429.61738.33869.58258.4978
8.21429.61738.33869.58258.4978
8.21429.61738.33869.58258.4978
8.21429.61738.33869.58258.4978
Individual average (g)8.21429.61738.33869.58258.4978
Volume (cm3)7.998.188.118.838.01
Density (g/cm3)1.028061.175711.028191.085221.06090
Average density (g/cm3)1.075615
Table 6. Comparative table of resistance to micro-abrasion.
StandardRequirement
ABNT NBR 12042:1992BrazilGroup A: floor with high traffic demand ≤0.8 mm
Group B: heavy pedestrian traffic between 0.8 mm and 1.6 mm
Group C: light traffic between 1.6 mm and 2.4 mm
ASTM C936:1996USAVolume loss: ≤15 cm3/50 cm2
BSEM 1388:2003Europe<23 mm
Interlocking block made from WEEEK with load 1 N (m3/Nm) = 0.0008 to 0.0012
K with load 3 N (m3/Nm) = 0 to 0.0004
Publisher’s Note: MDPI stays neutral with regard to jurisdictional claims in published maps and institutional affiliations.

