The Effect of Recycled HDPE Plastic Additions on Concrete Performance


1
Faculty of Engineering, Mulawarman University, Samarinda 75117, Indonesia
2
Department of Governance and Technology for Sustainability, University of Twente, 7522 NB Enschede, The Netherlands
*
Author to whom correspondence should be addressed.
Recycling 2021, 6(1), 18; https://0-doi-org.brum.beds.ac.uk/10.3390/recycling6010018
Submission received: 17 October 2020
/
Revised: 25 December 2020
/
Accepted: 3 March 2021
/
Published: 6 March 2021
(This article belongs to the Special Issue The Use of Recycled Materials to Promote Pavement Sustainability Performance)
Abstract
:This study examined HDPE (high-density polyethylene) plastic waste as an added material for concrete mixtures. The selection of HDPE was based on its increased strength, hardness, and resistance to high temperatures compared with other plastics. It focused on how HDPE plastic can be used as an additive in concrete to increase its tensile strength and compressive strength. 156 specimens were used to identify the effect of adding different percentages and sizes of HDPE lamellar particles to lower, medium, and higher strength concrete for non-structural applications. HDPE 0.5 mm thick lamellar particles with sizes of 10 × 10 mm, 5 × 20 mm, and 2.5 × 40 mm were added at 2.5%, 5%, 10%, and 20% by weight of cement. The results showed that the medium concrete class (with compressive strength equal to 10 MPa) had the best response to the addition of HDPE. The 5% HDPE addition represented the optimal mix for all concrete types, while the 5 × 20 mm size was best.
1. Introduction
Plastic has long been considered a manmade material with many benefits. It has lightweight properties and is easily shaped to the designer’s desires. Its versatile properties have led to its widespread use. Since 2016–2017, plastic consumption has increased from 335 million tons to 348 million tons. This demand is expected to reach 485 million tons by 2030 [1]. The downside of plastic use is the waste generated and the environmental pollution caused because many plastics are not biodegradable and can take between 500 and 1000 years to decompose [2]. The pollution risks from the toxins released can impact groundwater quality, animal/human health, food-chain poisoning, and reduction in soil fertility [3]. Furthermore, if burnt in an open space, plastics produce carbon monoxide (a greenhouse gas). If disposed of in waterways, plastics can cause siltation and impede water flows, thereby creating a flood risk [4,5]. Research on beaches has shown that coastline plastic waste in 192 countries in 2010 amounted to between 4.8 and 12.7 million metric tons [6]. This waste threatens marine organisms [7] and has led to many demands to restrict plastic use and reshape behavior at the consumer level [8]. Recycling has increased in developed countries since 2006 [1] and offers a partial solution. The regular process of plastic recycling starts with sorting it into several polymer types, followed by cleaning, scraping, smelting, and converting it into pellets to be repurposed into plastic bags, plastic containers, carpets, jacket insulation, and other materials. However, traditional recycling suffers from cross-contamination and requires high energy consumption [9]. In 2018, processing plastic waste for energy used 43% of all of the collected post-consumer waste stream [1]. Furthermore, the insufficient processing and management of plastic waste worldwide face the challenge of insufficient plastic waste treatment facilities at all stages of collection, separation, and disposal. By 2050, it is projected that about 12 billion metric tons of plastic litter will end up in landfills and the natural environment [10]. Many countries, including Indonesia, experience problems with plastic waste. Indonesia generates some 67.8 million tons of waste, with plastic waste being the second-largest waste stream after organic waste, reaching 17% in 2018 [11]. To solve the problems of plastic waste and divert this away from landfill, requires any opportunities to be identified within the value chains.
Investing in a circular system to manage plastic pollution offers potential solutions with social and environmental benefits. Circularity will retain the value of plastic materials if they are returned back into the supply chain, thus reducing the volume of discarded plastics ending up in nature. Therefore, the identification of a relevant local strategy for waste (including plastics) and the tailoring of partnerships to suit various stakeholders (i.e., businesses, industries, and civil society) are necessary [12,13]. Here, building a nexus between the waste and construction sectors emerges as a possible option for increasing plastic circularity, especially macro-plastics, which are in widespread use [14]. The additional value to be obtained from their use as an additive in concrete mixtures could also create new business opportunities [15]. The final application from plastic additions to concrete, as examined in this study is expected to be for non-structural projects, such as wall panels, parking lots, or paths [16,17,18]. Even plastic fibers can be used below the concrete layer in constructing rigid pavements.
Concrete has properties that are sensitive to the type of added materials that are beyond those specified in the traditional job mix design. The strength of concrete depends on the type and size of the aggregates used [19,20,21], and different additive materials produce variations in tensile strength and compressive strength [22,23,24,25]. Single-use plastics are considered suitable for disposal as admixtures in concrete, as low-carbon reusable materials, e.g., PET (polyethylene terephthalate) [26] and HDPE (high-density polyethylene) [27]. The advantages of using plastic additions in concrete are that they are lightweight, better resistant to weather, waterproof [28], and confer thermal insulation properties [9,29]. However, compared to PET, HDPE has higher temperature resistance than PET (melting at 130–135 °C). Further, as Merli et al. [30] identified, HDPE is less discussed in the literature compared to PET. This motivated our interest and focus on HDPE.
A few researchers have discussed the use of HDPE in concrete in different contexts. For instance, Pesic et al. [31] investigated the effect recycled HDPE fibers had for reinforced concrete for structural uses using two different fiber diameters (0.25 mm and 0.4 mm) with 0.40%, 0.75%, and 1.25% fiber volume fraction. The study showed that the HDPE fiber reinforced concrete of 0.75–1.25% could maintain a constant post-cracking tensile of 30–40% of the flexural peak capacity. The use of HDPE for non-structural uses was discussed by Lopez et al. [32], who considered using recycled HDPE as a partial replacement of coarse aggregate in mixes of Acrylic Polymer Pervious Concrete (AcPPC) at ratios of 10%, 20%, and 30% at sizes of ½″ and ¾″. The study showed that the optimum strength was reached by a 10% addition at sizes of ½″. Further, by using a different type of plastic, Jain et al. [16] investigated the effect of plastic bag additions to concrete at 0.5, 1, 2, 3, and 5% of the weight of concrete. They found that a higher percentage of plastic reduced concrete’s workability. The addition also affected the bonding between plastic aggregate and cement paste, as it created voids, thus reducing the concrete strength. The above-mentioned studies clearly emphasized that plastic addition could benefit concrete properties at certain levels, and contribute to sustainable construction. However, how different types of plastics may affect the behavior of concrete is an interesting issue, which offers scope for discussion and development.
Unlike these previous studies, we have investigated different aspects. Our study examines the potential use of HDPE addition on different concrete classes. We assess the effect of various HDPE lamellar particle sizes and percentages as lightweight admixtures into different concrete mixes used for non-structural works, but not as a replacement to cement or other materials. This paper is structured as follows: Section 1 is an introduction providing the background and aim of this study. It is followed by a description of materials and methods in Section 2. The results of the tests are provided in Section 3 and discussed in Section 4. Conclusions and recommendations for future research are presented in Section 5.
2. Materials and Methods
This study used concrete mixes formed from cement and aggregate (fine and coarse aggregate). These are designed to fall into three concrete classes: lower, medium, and higher concrete strength. Lower concrete strength is in the following named as B0 and it represents concrete with cylindrical strength of f’c = 7 MPa. Medium and high concrete strength here refers to cylindrical strength f’c equal to 10 MPa and 25 MPa respectively. Three different sizes of HDPE lamellar (10 × 10 mm, 5 × 20 mm, and 2.5 × 40 mm) with the same thickness of 0.5 mm were added to the mixtures to examine their effect on concrete properties. The ACI (American Concrete Institute) and ASTM (American Society for Testing and Materials) testing standards were used to calculate specific gravity, slump value, unit weight, tensile and compressive strength. Table 1 provides a summary of the standard testing used in this research.
2.1. Materials
2.1.1. Cement
As this study’s scope involved non-structural applications, the examination used cement type 1, which is intended for walls, pavement, sidewalks, and other precast products. Using the ASTM C-127 standard, this cement material was found to have a specific gravity of 3.18 g/cm3, which falls in the acceptable range of 3.1–3.3 g/cm3. This cement composition comprises four main chemical compounds, i.e., tricalcium silicate (3CaO·SiO2), shortened to C3S (55 wt.%), dicalcium silicate (2CaO·SiO2), abbreviated to C2S (17 wt.%), tricalcium aluminate (3CaO·Al2O3), shortened to C3A (10 wt.%), tetracalcium aluminoferrite (4CaO·Al2O3·Fe2O3), shortened to C4AF (7 wt.%), carbon disulphide (CS2) (6 wt.%). In addition, there are small amounts of minor compounds, e.g., alkali (Na2O), free calcium oxide (free CaO), ignition loss, and magnesium oxide (MgO) of which, according to Indonesian national standard (SNI No 15-2049/2015), the maximal amount should be less than 5 and 6 wt.% respectively.
2.1.2. The Aggregates
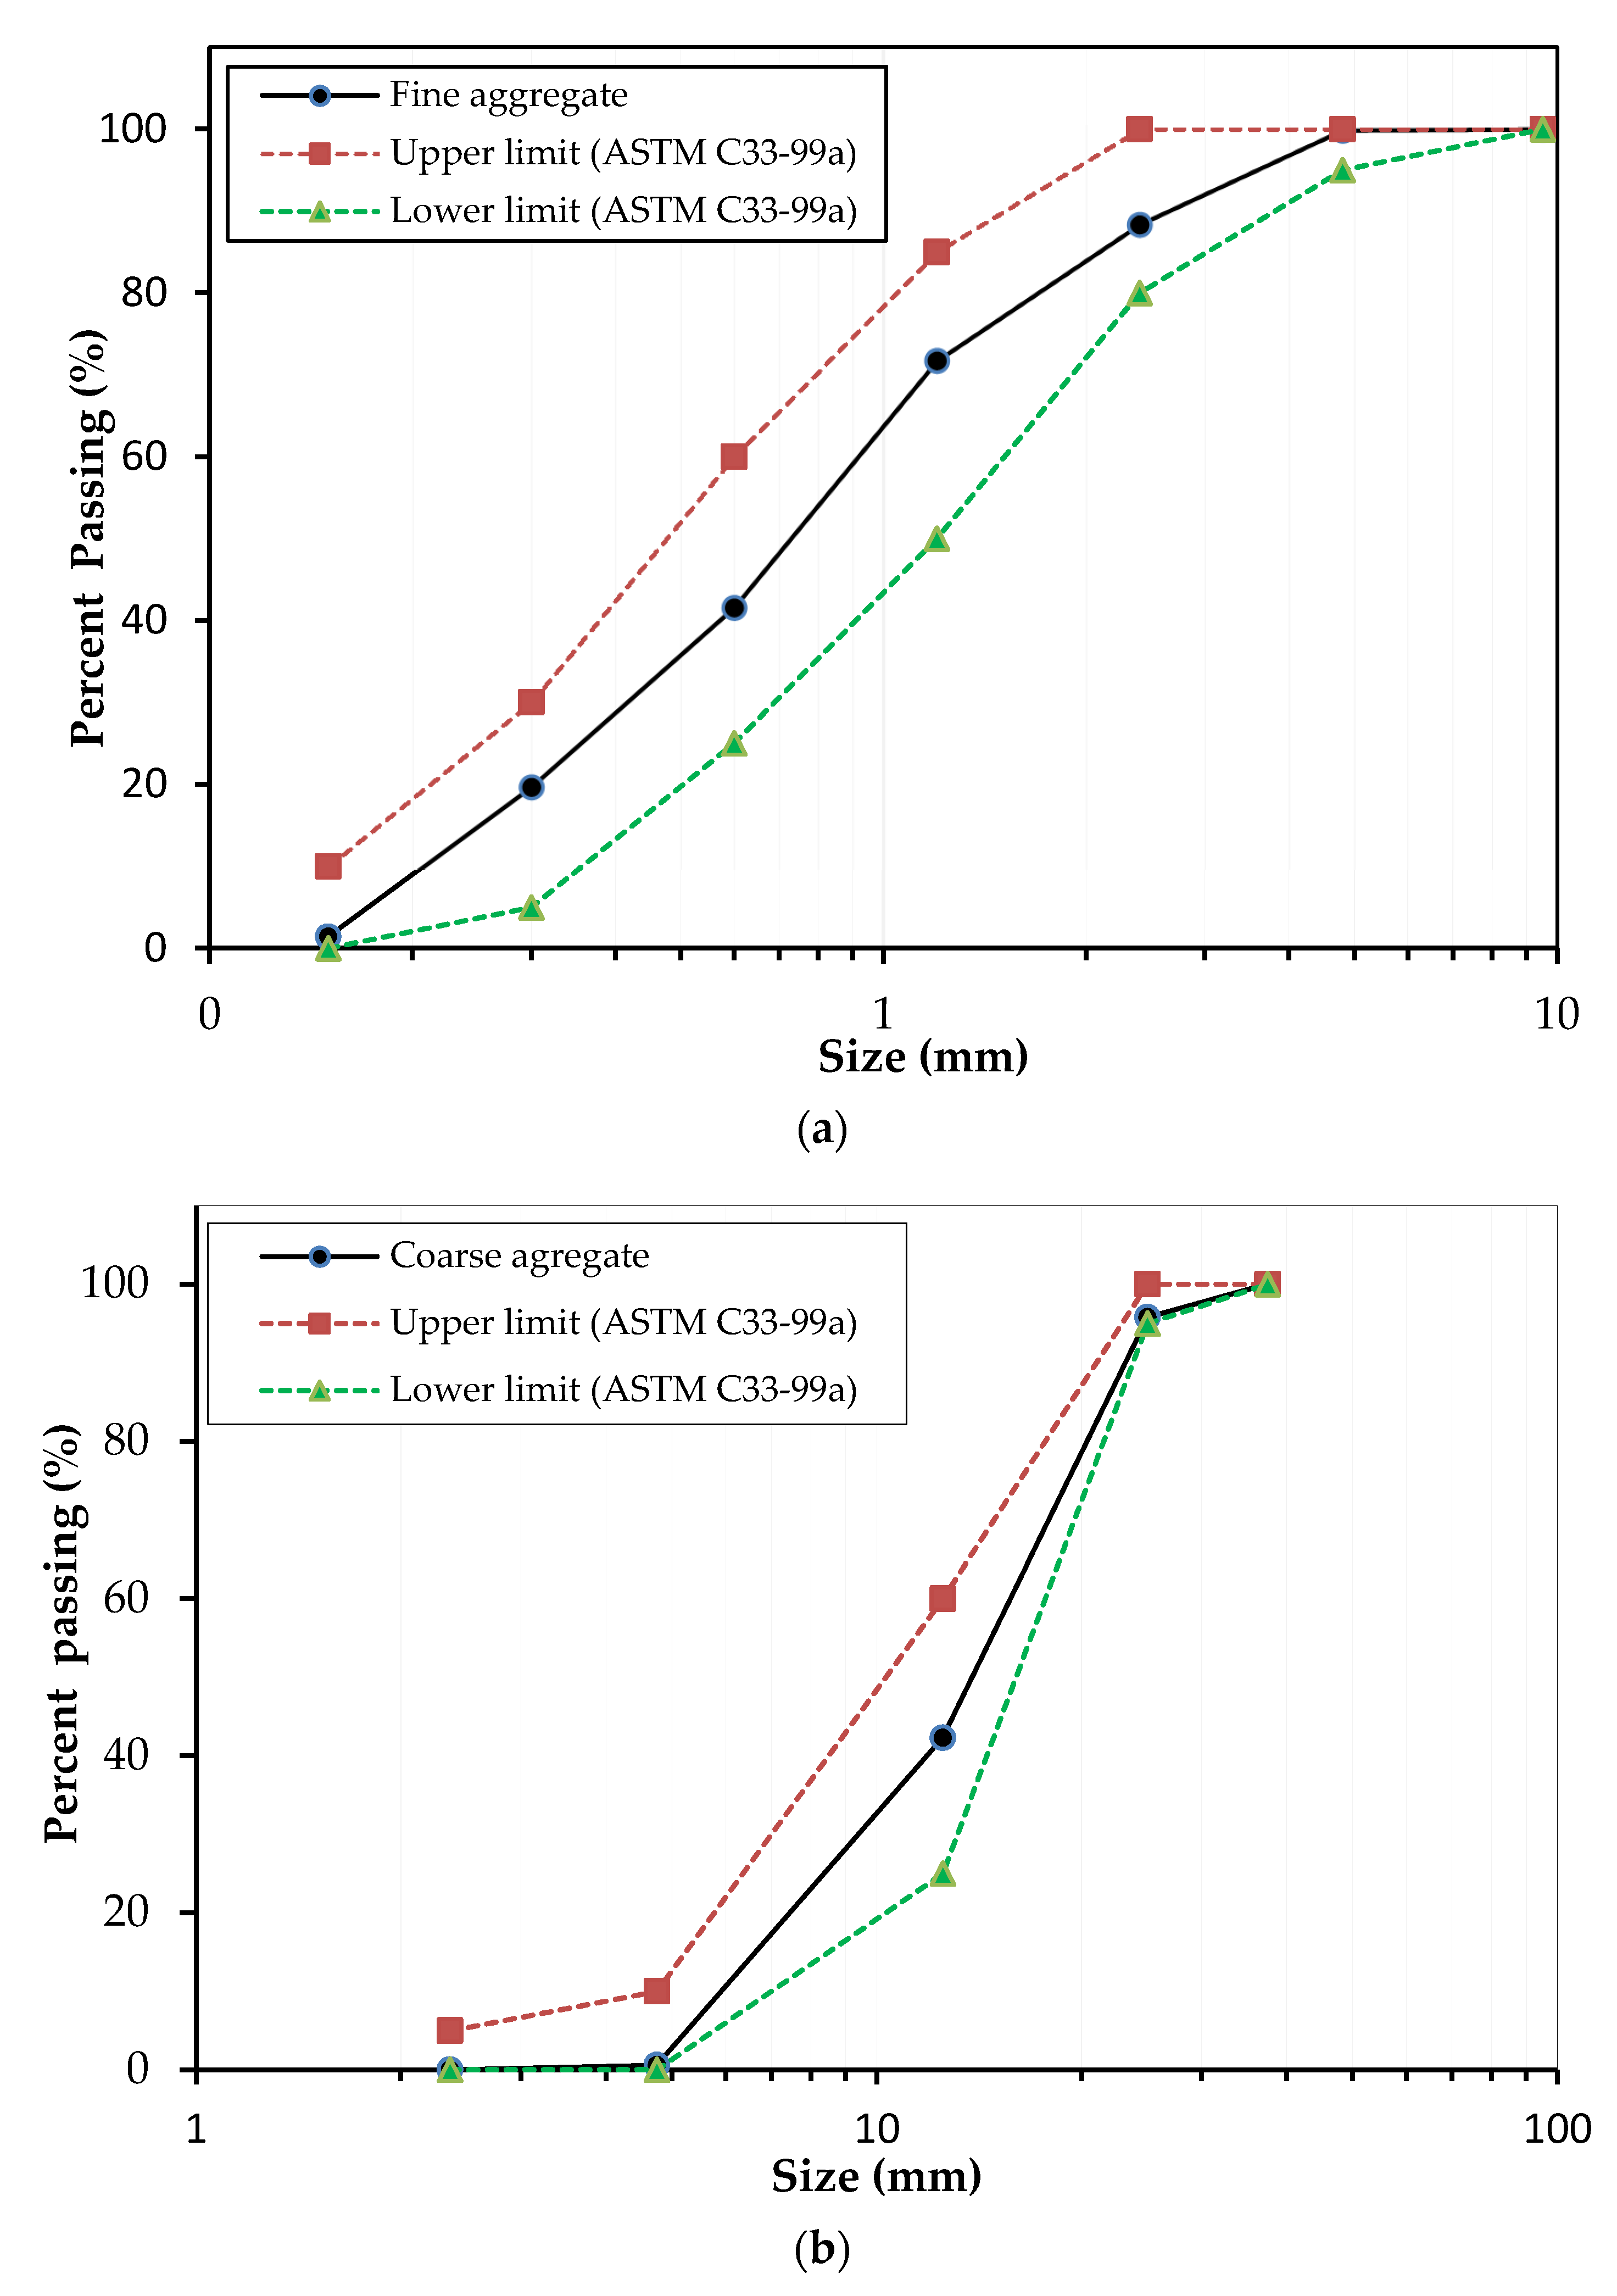
The aggregates refer to any particulates used as an inert filler in concrete. These vary from sand, gravel, crushed stone to blast-furnace slag. Following ASTM C33, the aggregates are categorized into fine and coarse aggregate. This study used sand as a fine aggregate within a range of 0.1–10 mm (Figure 1a), and crushed stone as a coarse aggregate meeting the range of 2–30 mm (Figure 1b). These aggregates were collected from Palu, Central Sulawesi, Indonesia. Palu’s aggregates are considered basalt and are widely used for lightweight building walls and concrete in Indonesia. Its physical characteristics and quality provided adequate consolidation in concrete mixes, and offers higher resistance to alkali-silica reaction, compared to other aggregates obtained from areas in East Kalimantan.
These aggregates were tested at the Faculty of Engineering Laboratory, Mulawarman University, Samarinda, following the ASTM C33-99a standard [33] for sieve analysis, which defines the adequate grading requirement and aggregate quality in concrete. The results of this test for fine and coarse aggregate are shown in Figure 1.
The unit weight testing of fine and coarse aggregates was conducted using the ASTM C29/C29M-07 standard [34]. 2.55 g/cm3 for the coarse aggregate and 2.54 g/cm3 for the fine aggregate was obtained, meeting the standard requirement of 2.5–2.7 g/cm3. The test for coarse aggregate abrasion was conducted using the ASTM C131/C131M-20 standard [35] and a result of 23% was obtained. This value was lower than the 27% ASTM limit. Table 2 provides the detailed physical properties of the materials used for mixing concrete.
2.1.3. Specimen Preparation of HDPE Lamellar Particles
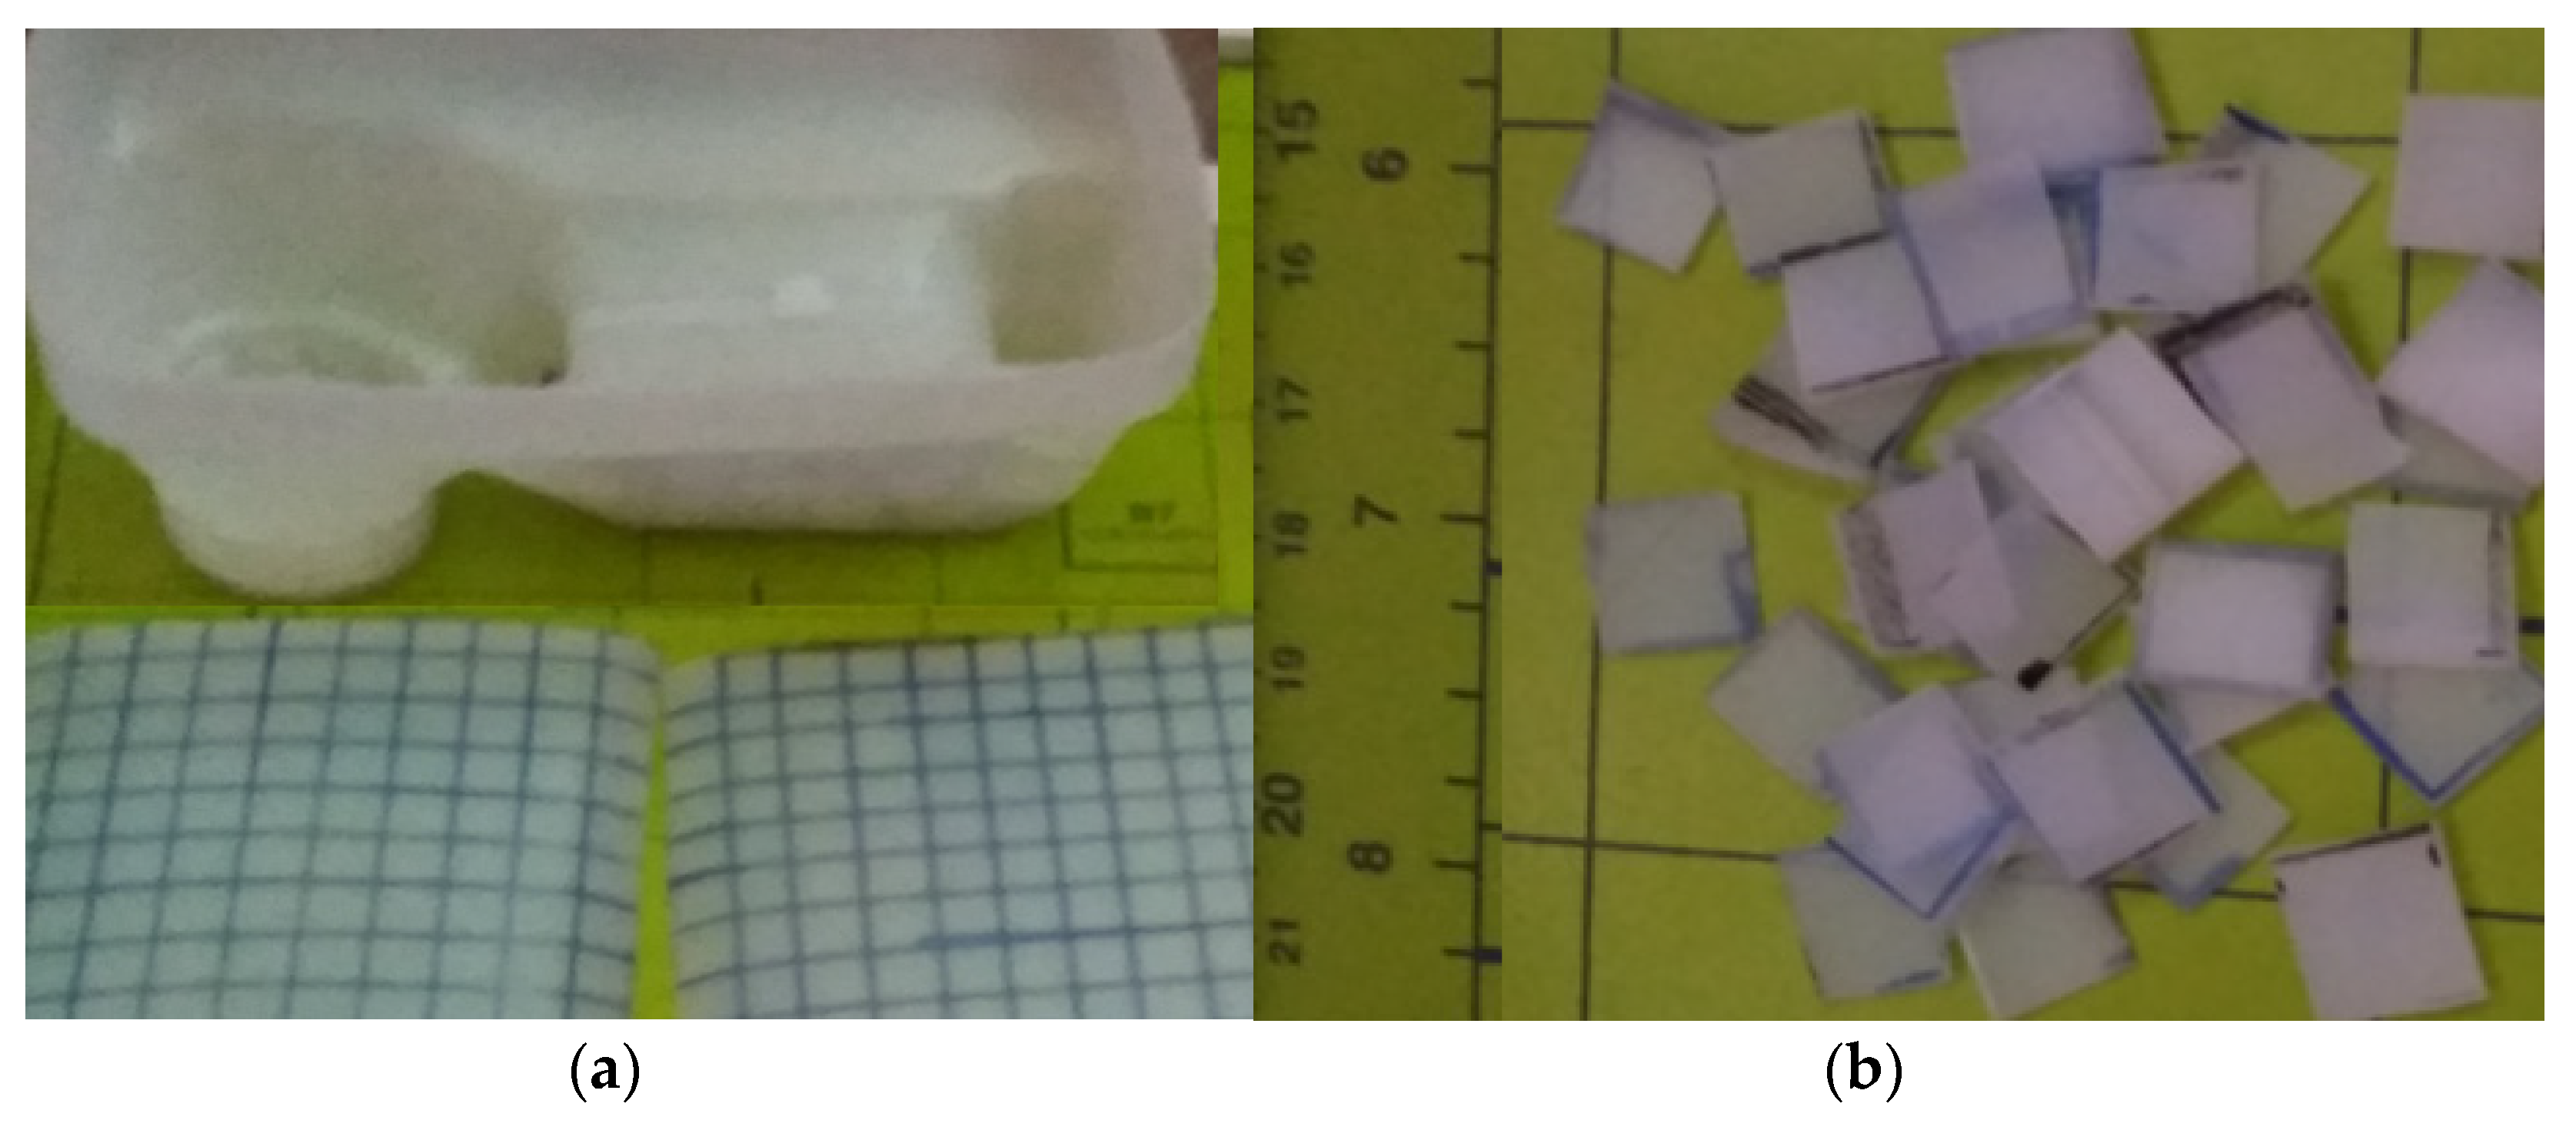
The HDPE plastic materials were collected from wastes disposed of in Samarinda landfills to reflect potential future plans to reduce non-sustainable waste that contaminate waterways and aquifers. They were rinsed in preparation for the cutting process. Figure 2a shows the production of lamellar particles and how we ensured a similar thickness for all the sheets. We implemented a cutting procedure using markings determined as a function of the pattern and size. First, a selection of HDPE plastic samples 0.5 mm thick was cut into lamellar particles before adding to the concrete mixture, excluding any thicker or less than 0.5 mm. This process produced three sizes, namely, 10 × 10 mm, 5 × 20 mm, and 2.5 × 40 mm; each with an identical surface area of 1 cm2. This ensures commonality of interaction between the plastic addition and cement in any change in propertie00s of concrete mixture and the bonding effect. Figure 2b shows an example of HDPE lamellar particles with a size of 10 × 10 mm at a similar thickness of 0.5 mm after the cutting process.
2.2. Concrete Preparation and Testing
2.2.1. Job Mix Design
The concrete mix design and the material composition of the three concrete types are shown in Table 3. The process of identifying the right proportion of concrete mixture complied with the standard practice for selecting proportions for normal, heavyweight, and mass concrete (ACI 211.1-91) [36]. Therefore, concrete strength tests were performed 28 days after casting to ensure that the resultant properties satisfied quality control designs. The concrete specimens were demolded after 24 h and kept in a water curing tank until the age of testing at a room temperature of 27 °C. We defined the slump value of the mixture for the three different concrete classes at the same range so it met cost efficiency and workability in the field. To meet this value, we set the w/c ratio at different levels, according to the water to cement ratio used.
2.2.2. Mixing Process
Table 4 shows the design experiments for the three concrete types, four different percentages of HDPE additions, lamellar particle sizes, and various aggregate particles used for the mixtures as described in Figure 1. The process started by mixing the different cement types and aggregates under dry conditions for a few minutes before adding water. The lamellar particles were then added to each concrete type according to their size categories (10 × 10 mm; 5 × 20 mm; 2.5 × 40 mm) until the concrete mixture became homogeneous.
The terms used are as follows: B0 refers to normal concrete meeting the standard job mix design without the addition of HDPE lamellar, while B0-HDPE 2.5% refers to B0 concrete with the addition of 2.5% HDPE. The amount of HDPE lamellar particles for the experimental investigation is calculated on the basis of the weight of the cement used.
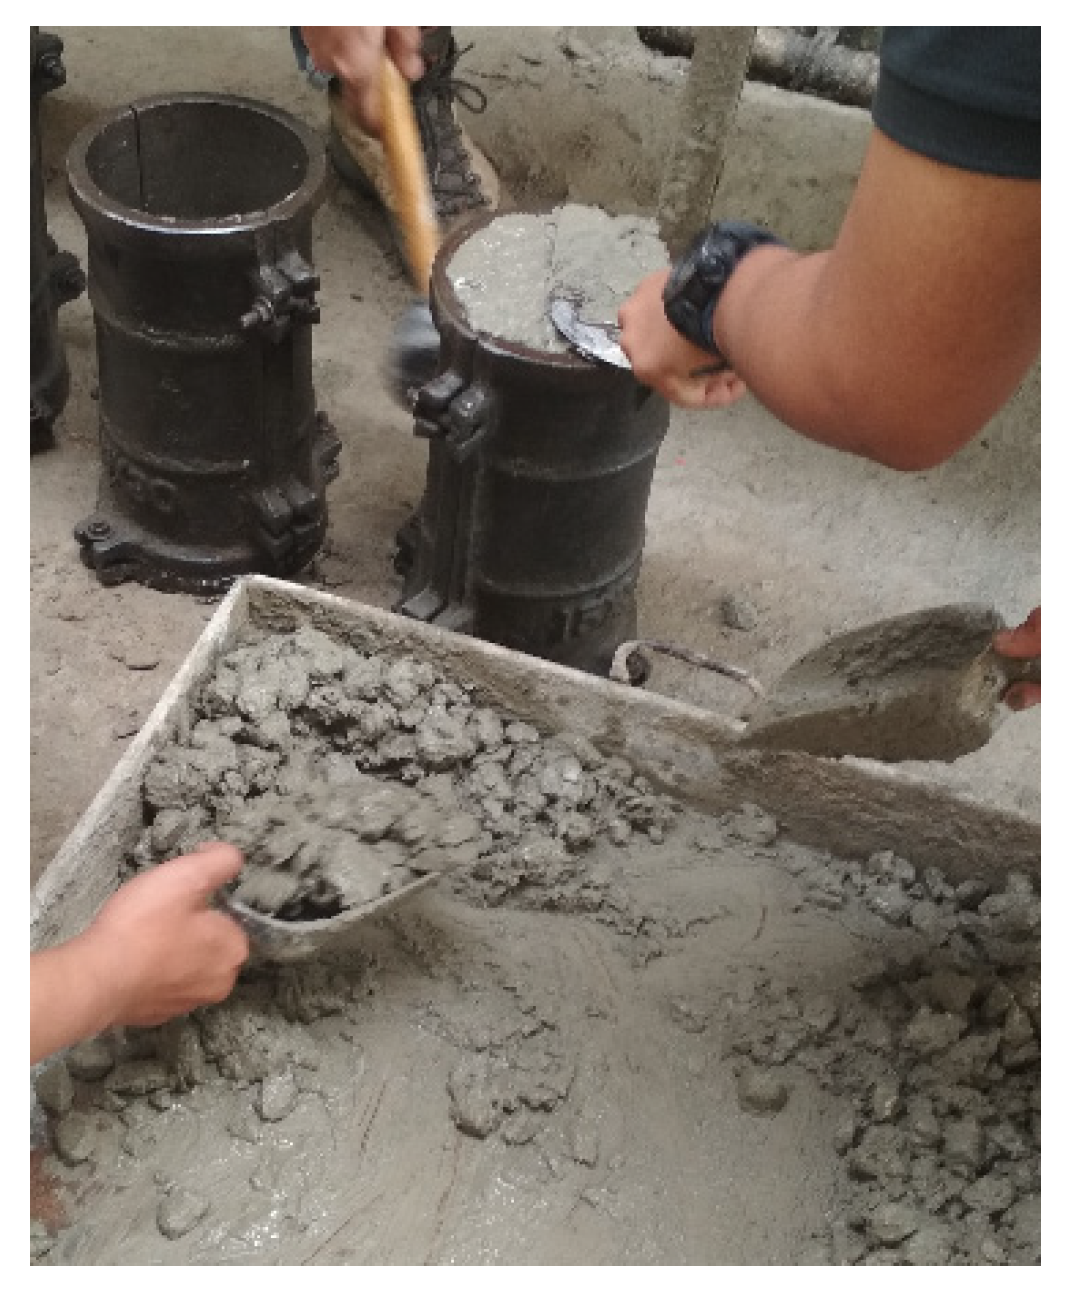
This study used cylindrical specimens with a diameter of 150 mm and a height of 300 mm (Figure 3). The cylinder molds were made of steel to avoid leakage and hold their integrity under severe use. The mold nonabsorbent material avoids a reaction with Portland or other hydraulic cement. For each test, two samples were used for each size of HDPE lamellar particles. Accordingly, the number of samples used for the splitting tensile and cylindrical compressive strength tests was six. The total number of samples used was 156, including those for normal concrete testing. Since only two specimens were used for each design, the data were processed as average.
We set a higher water/cement ratio to produce a workable concrete (minimum 0.52). Typically, the minimum water/cement ratio is 0.35–0.4, as a lower ratio may result in the concrete becoming too dry and unworkable [37]. Furthermore, the use of a higher water/cement ratio results in a high slump value. However, the addition of HDPE plastic sheets compensated for this change. To evaluate the effect of adding HDPE lamellar particles, several tests were conducted, including slump testing using the ASTM C143 standard [38], compressive strength testing using the ASTM C39 standard [39], and tensile strength testing using the ASTM C496 standard [40].
3. The Results
This study conducted tests to examine the appropriate concrete mixtures incorporating HDPE lamellar particles for non-structural applications to determine the effect of HDPE size and additions on low-quality concrete, medium-quality concrete, and high-quality concrete can be explained as follows.
3.1. Concrete Slump Test
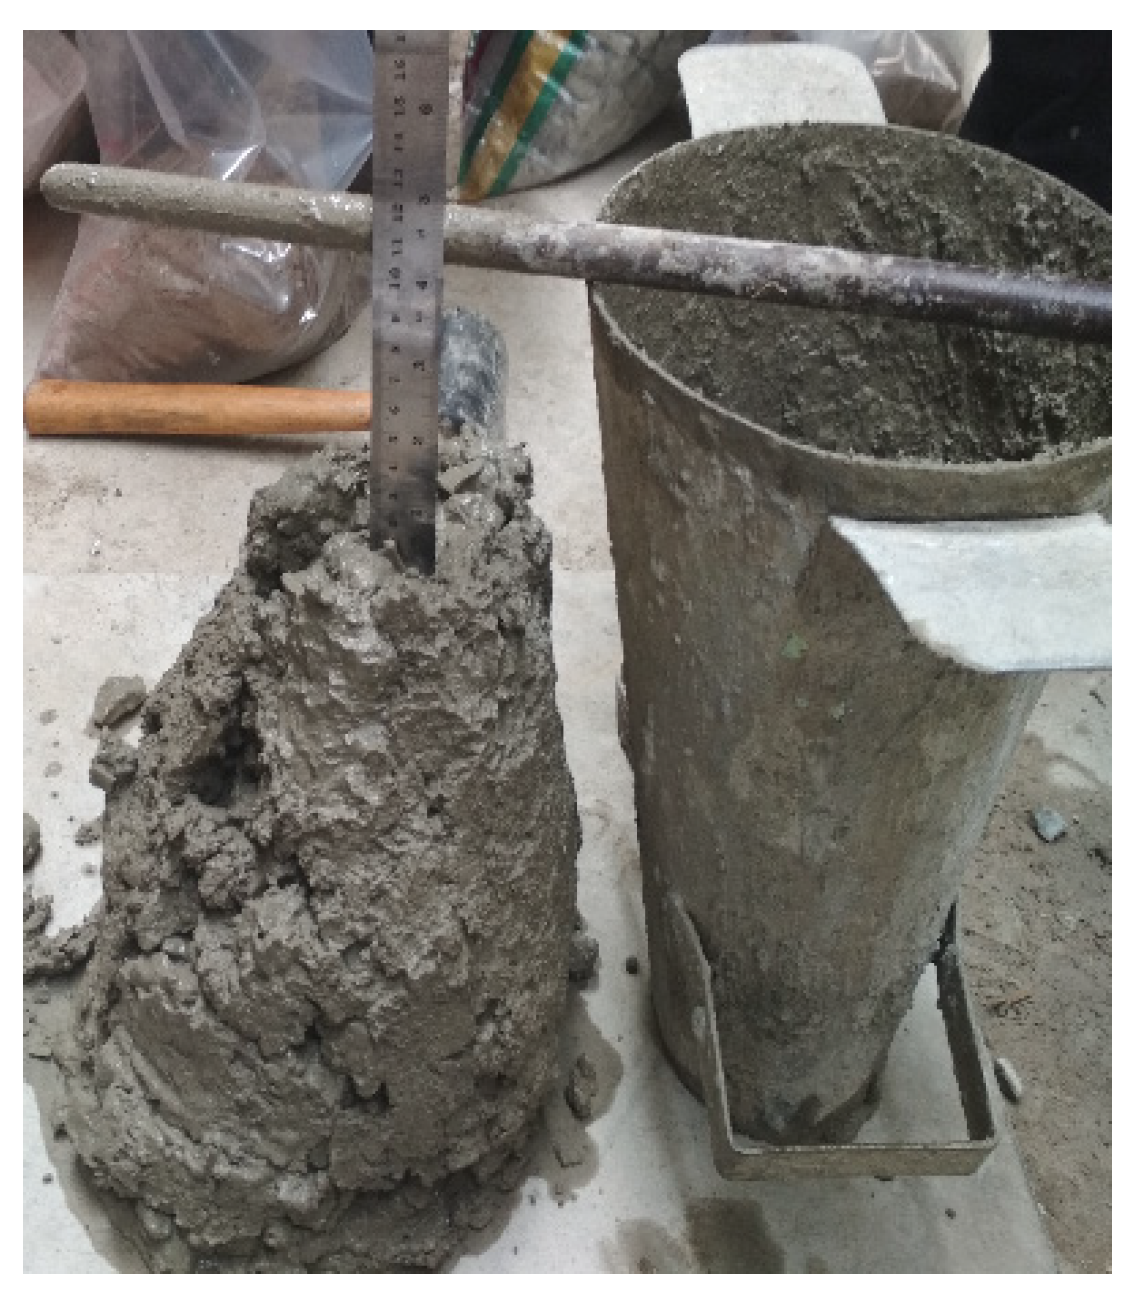
Concrete workability is quantified by the concrete slump, which depends on many factors, e.g., mixing methods, concrete materials and admixtures, and the workability changes with time due to those factors. In this slump test, the preparation of specimens using the mold (slump cone) is shown in Figure 4, and the varying HDPE lamellar particles were added to the fresh concrete before testing.
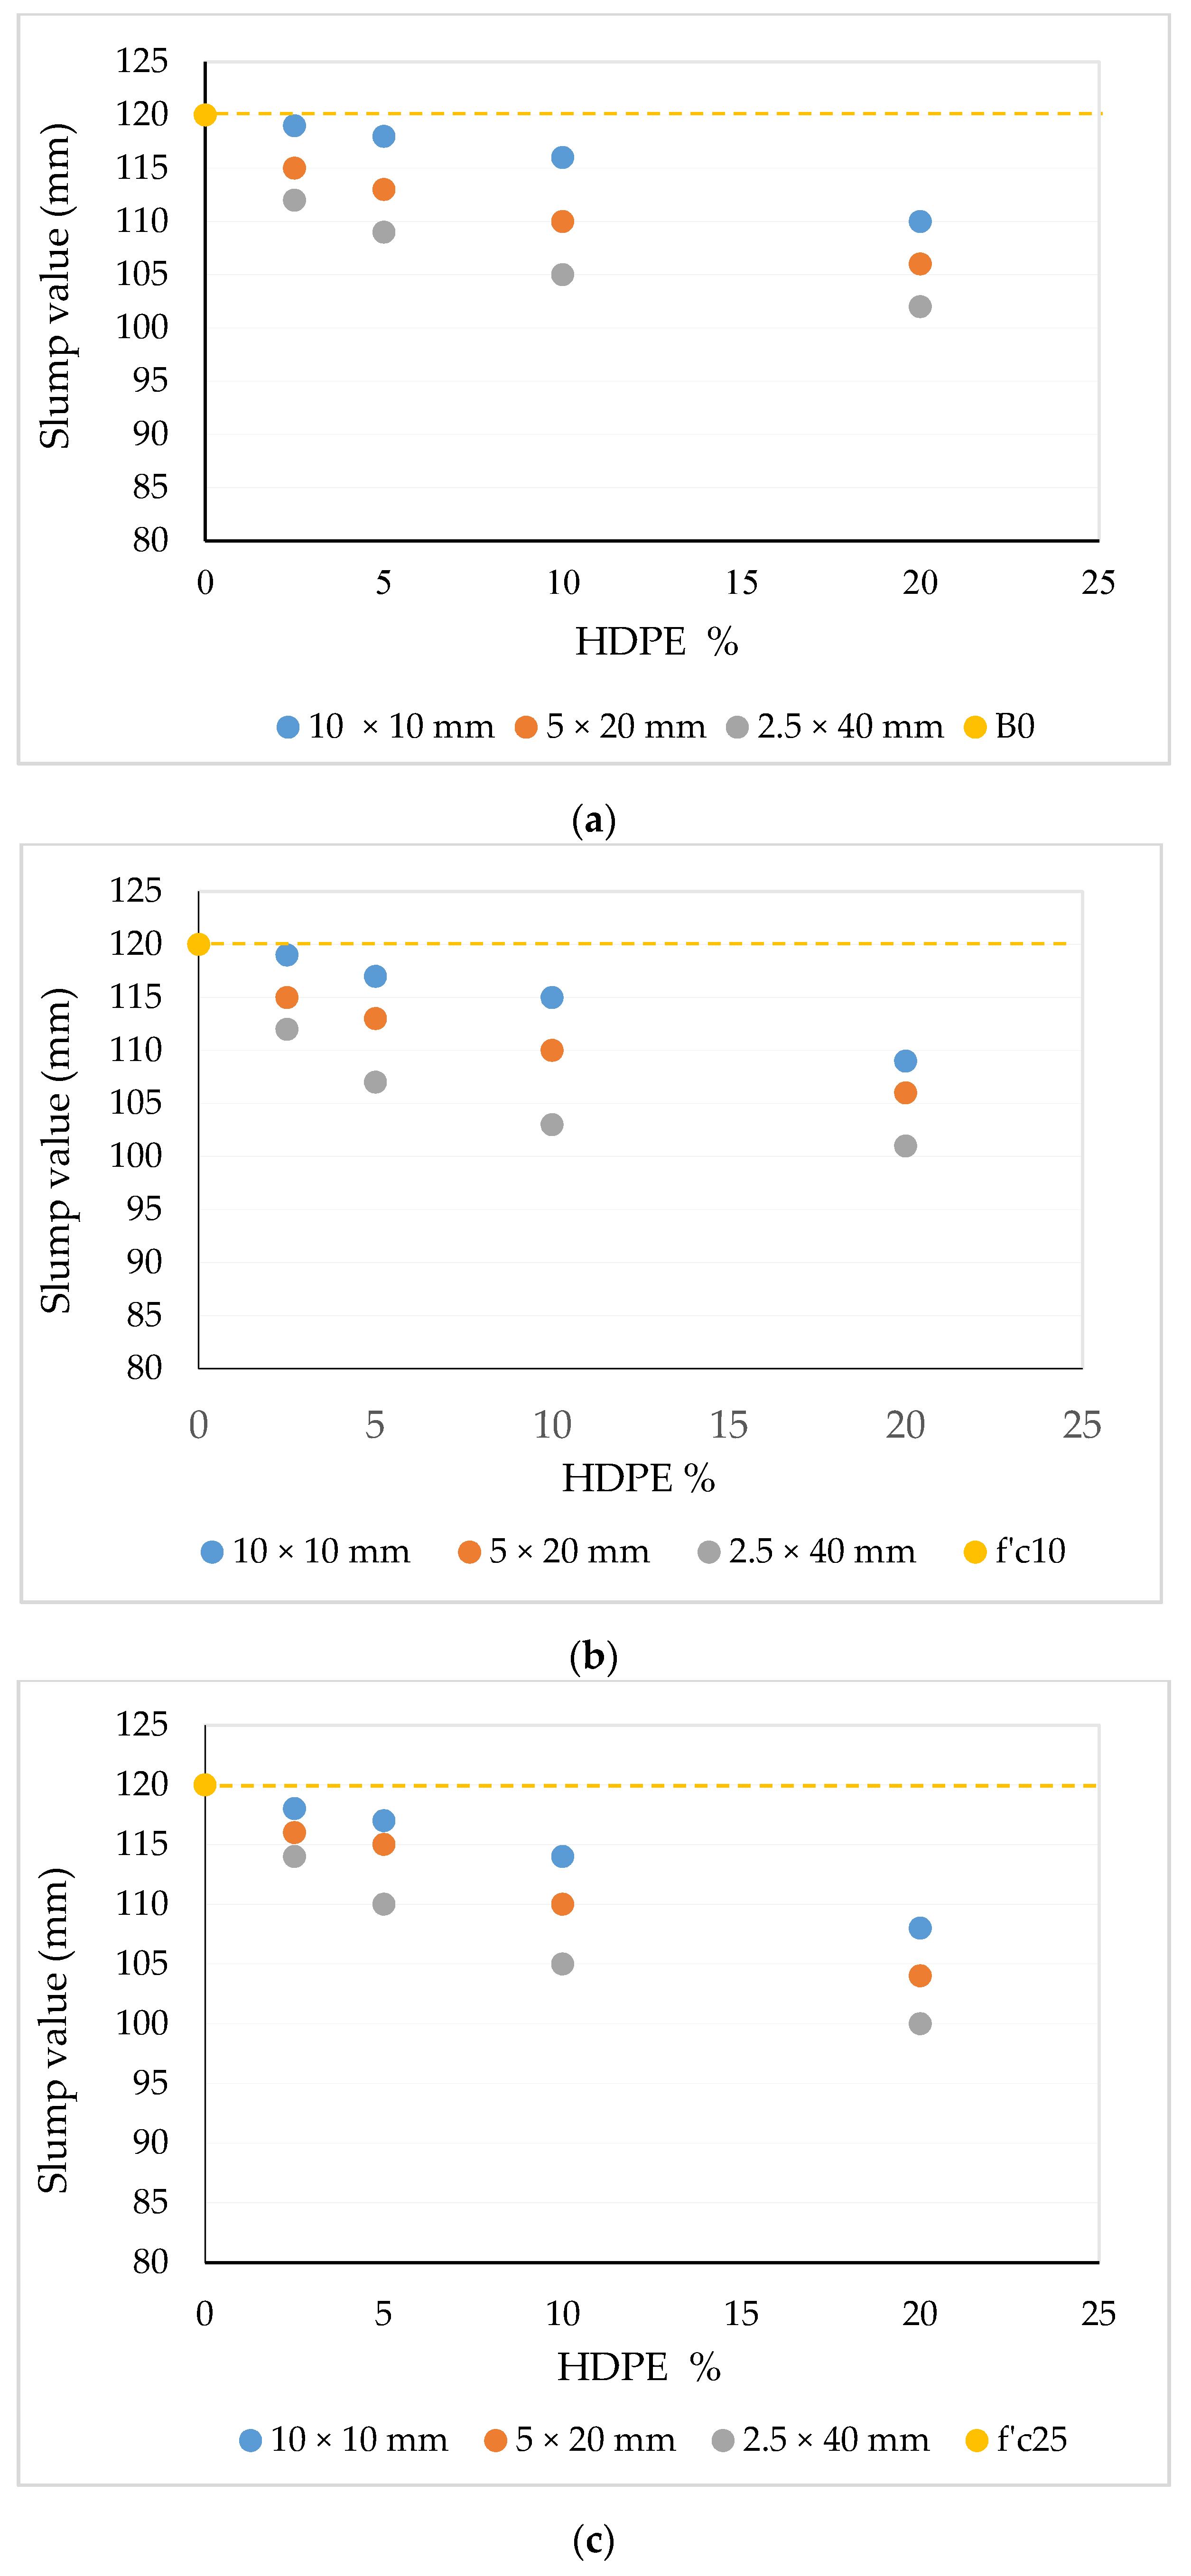
We set the slump value for normal concrete (baseline) to 115–125 mm. As shown in Figure 5, a greater amount of HDPE to the concrete mix led to a smaller slump value. The slump value of B0 concrete (Figure 5a) with HDPE size at 10 × 10 mm declined by 10% for 20% HDPE lamellar addition (accounted from 120 mm of normal concrete to 110 mm). The lowest percentage reduction at slump value showed up in f’c10 with HDPE size 10 × 10 mm (Figure 5b), and the maximum value given by f’c25 with HDPE size 2.5 × 40 mm, at 16.7% (Figure 5c). We found, from all the samples used, the maximum value of reduction ranged from 5 to 20 mm compared to the standard value.
3.2. Unit Weight of Concrete
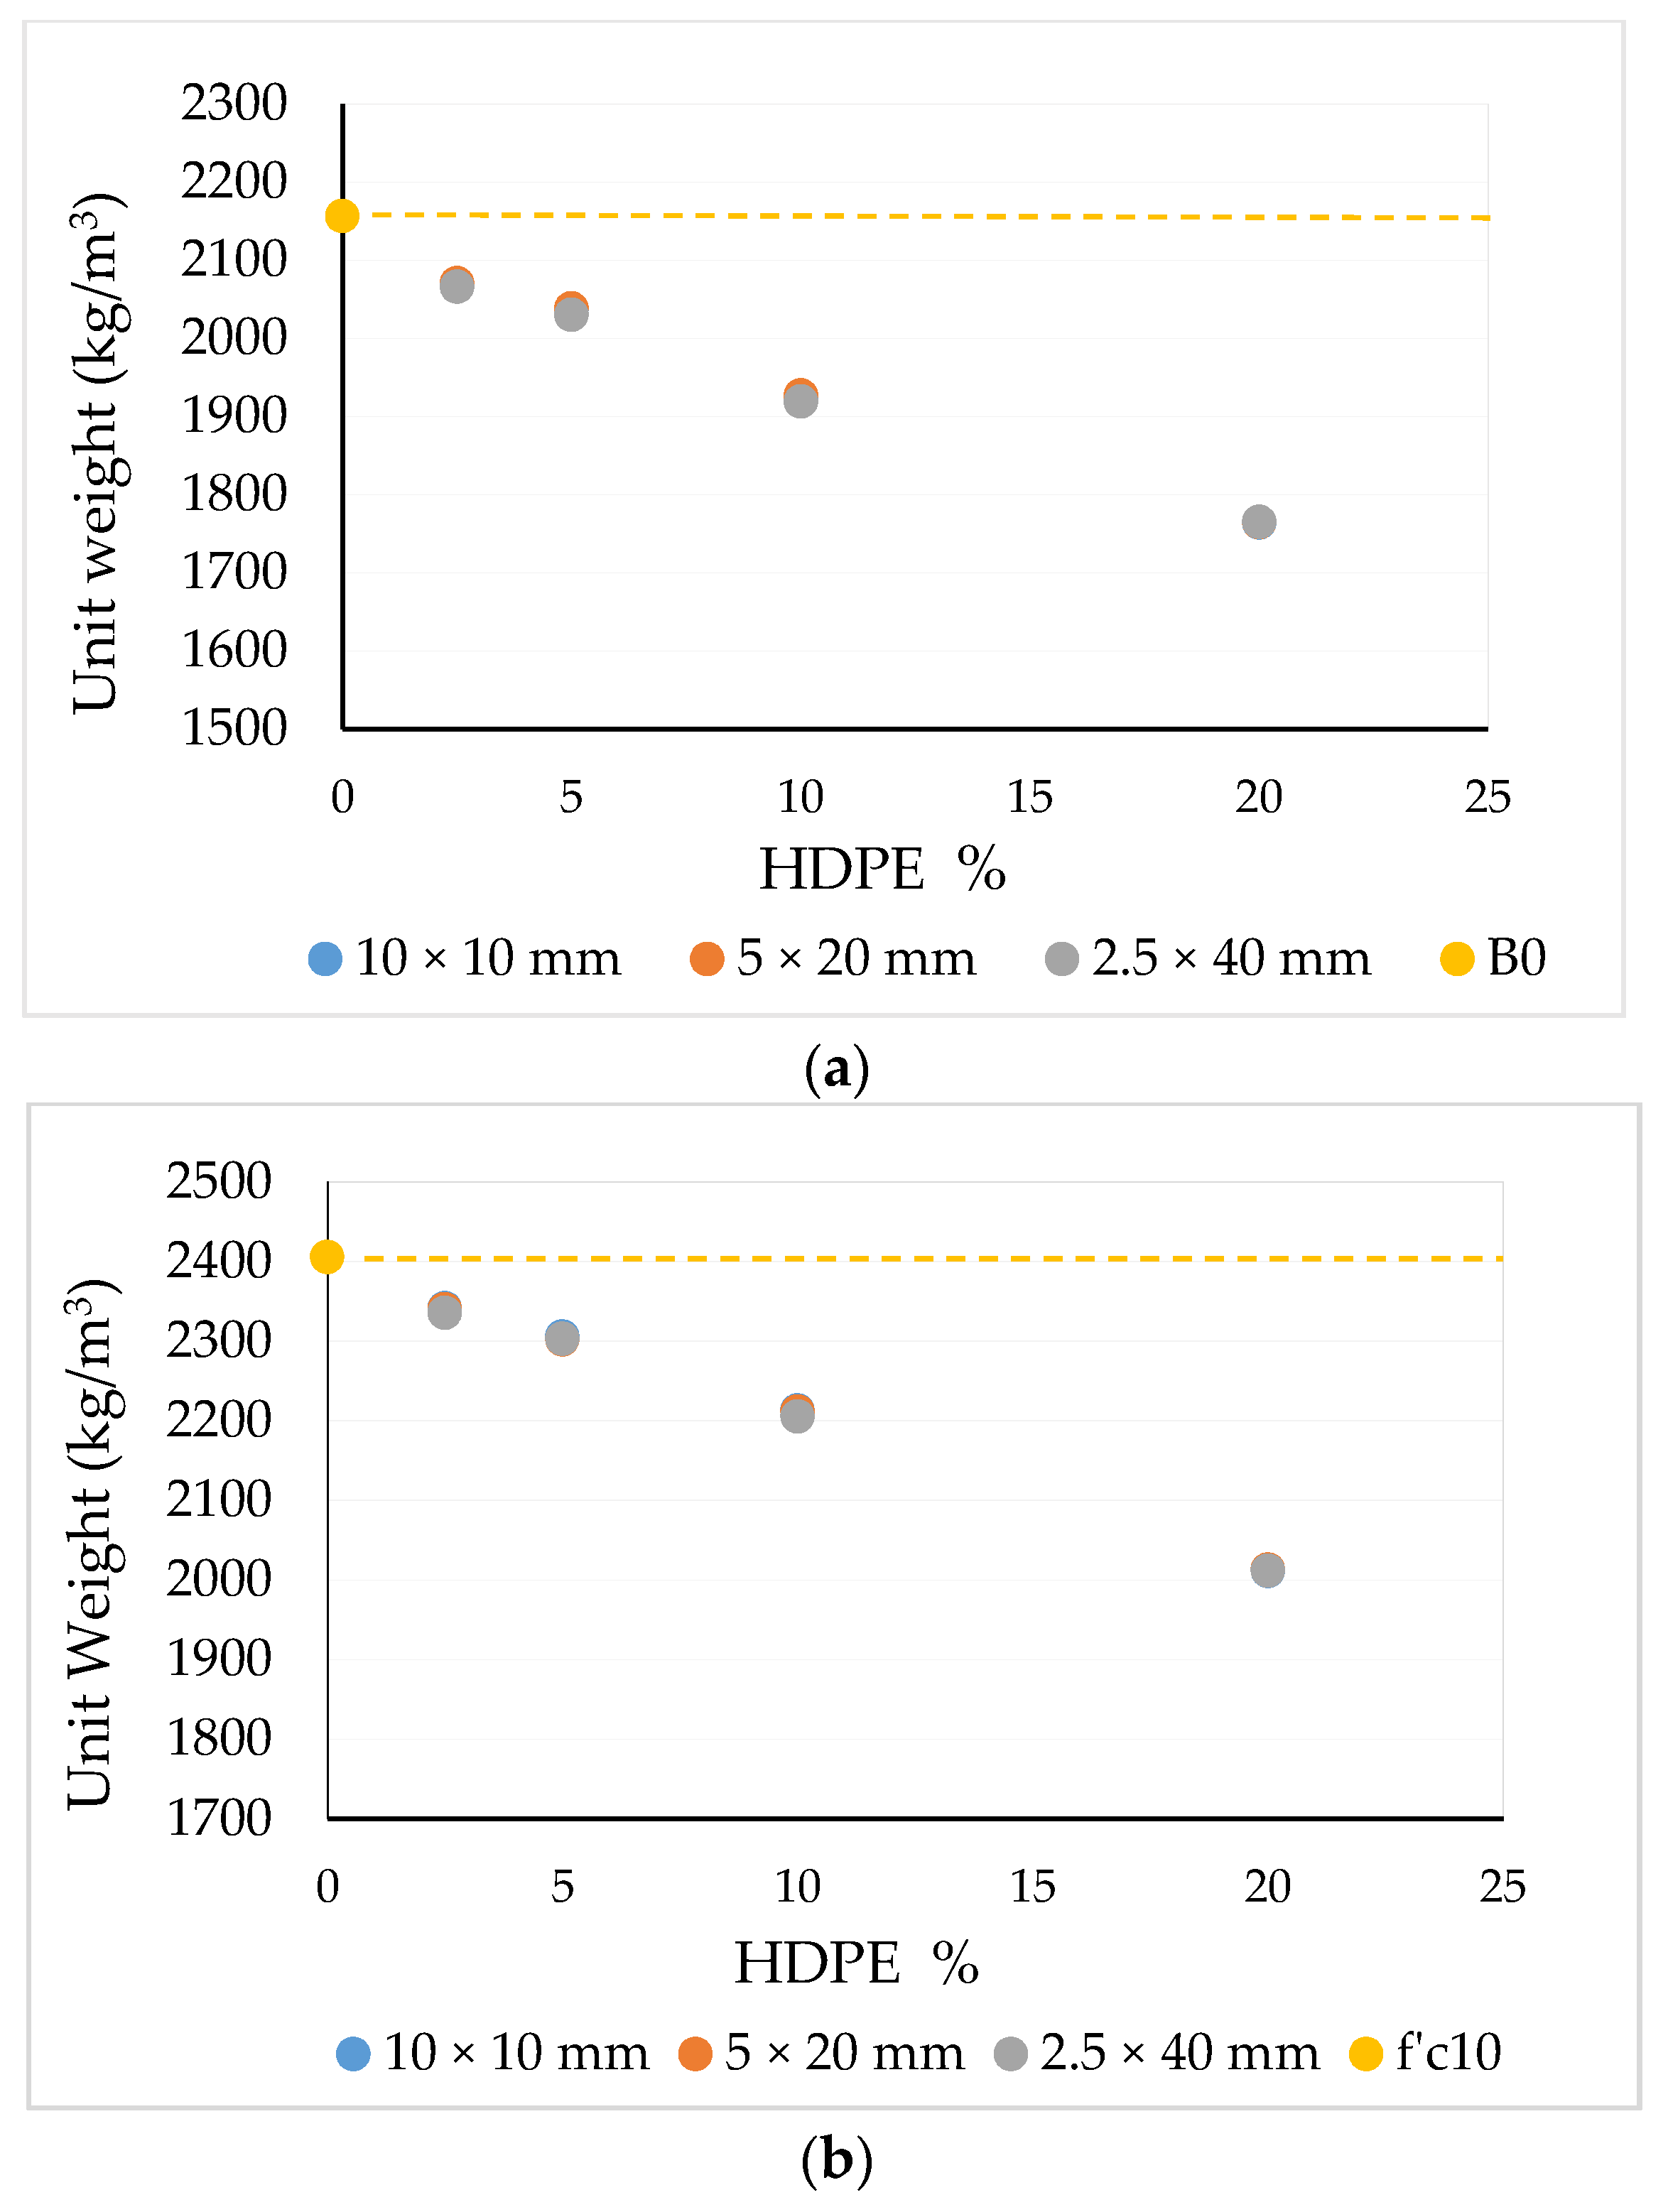
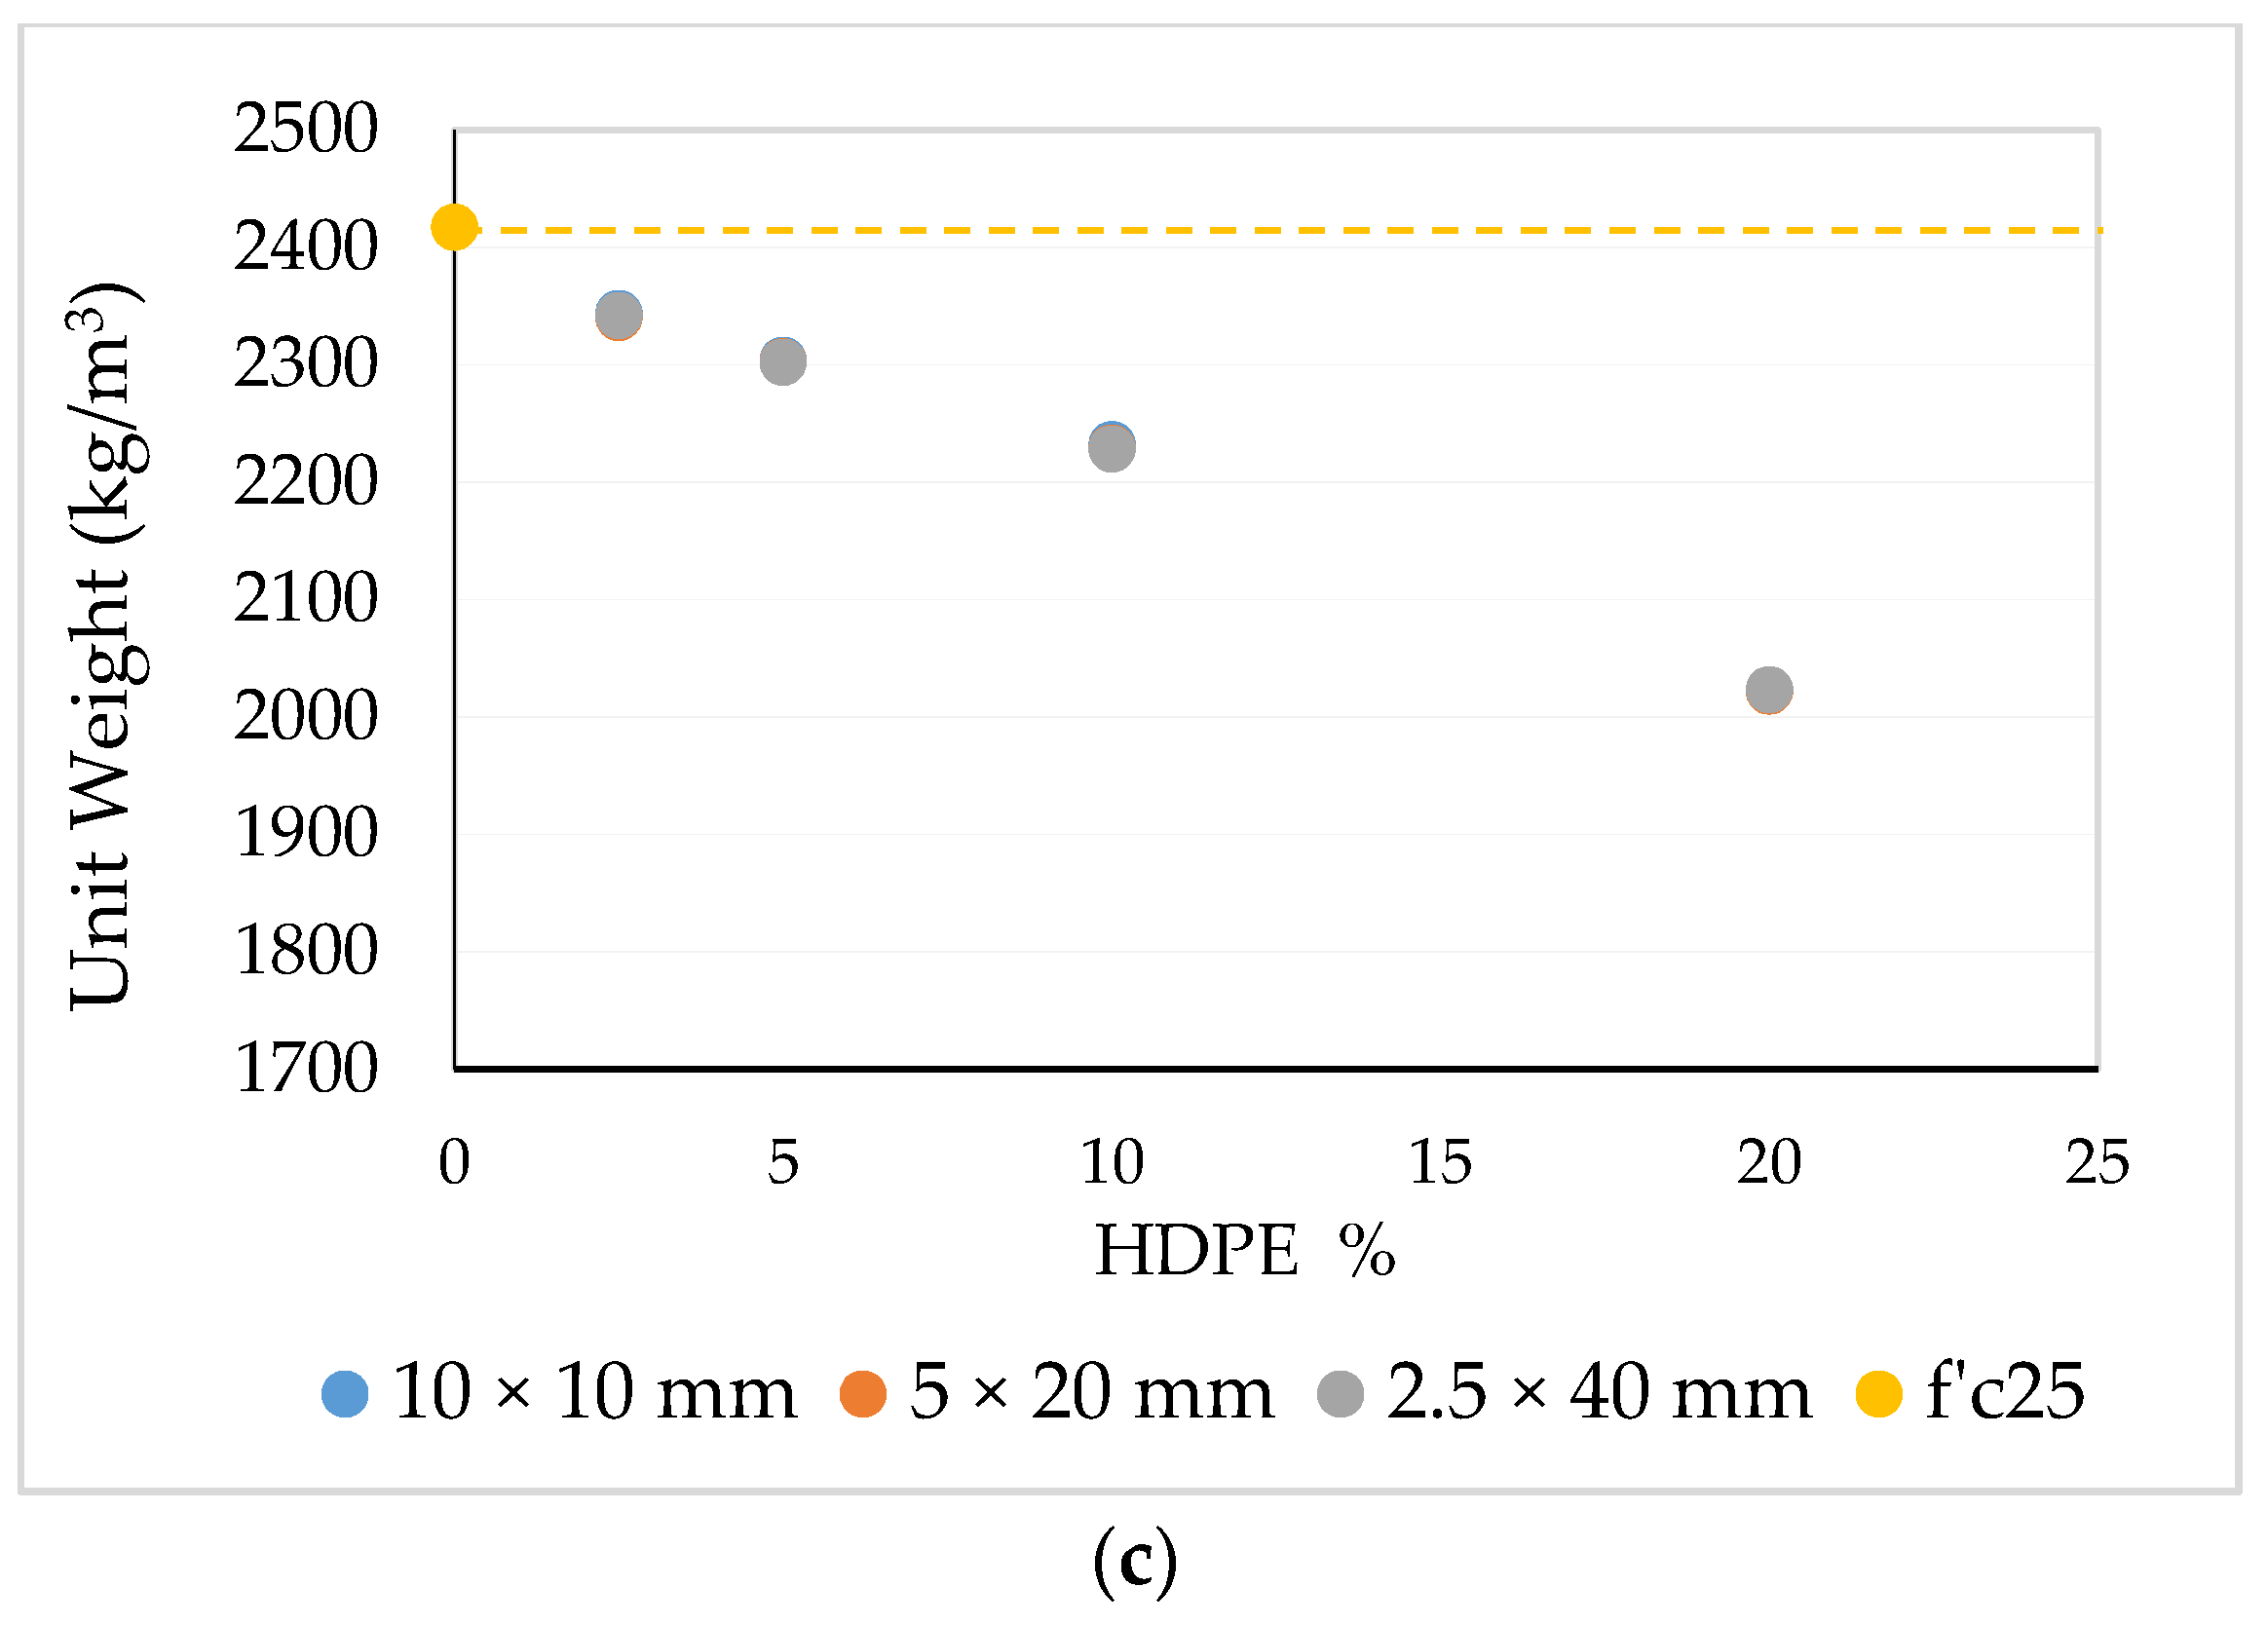
ASTM C29 [34] uses the term unit weight to refer to the concrete property in mass per unit volume. This gives a good indication of sample concrete density. The unit weight for all samples was determined by comparing the specimen’s weight with the specimen’s substantial volume. The relationship between the unit weight of the concrete, HDPE lamellar content, and its sizes are given in Figure 6. The graphs show that a greater addition of HDPE lamellar particles led to lighter concrete due to the low density of HDPE plastic, which was applied to B0, f’c10, and f’c25. However, the size of the HDPE sheets did not affect the concrete unit weight, as they all showed a similar value for certain percentages. For example, in Figure 6b, the unit weight of 20% additions was 2011 kg/m3, 2013 kg/m3, and 2012 kg/m3 for HDPE sizes of “10 × 10 mm”, “5 × 20 mm”, and “2.5 × 40 mm” respectively.
3.3. Tensile and Compressive Strength
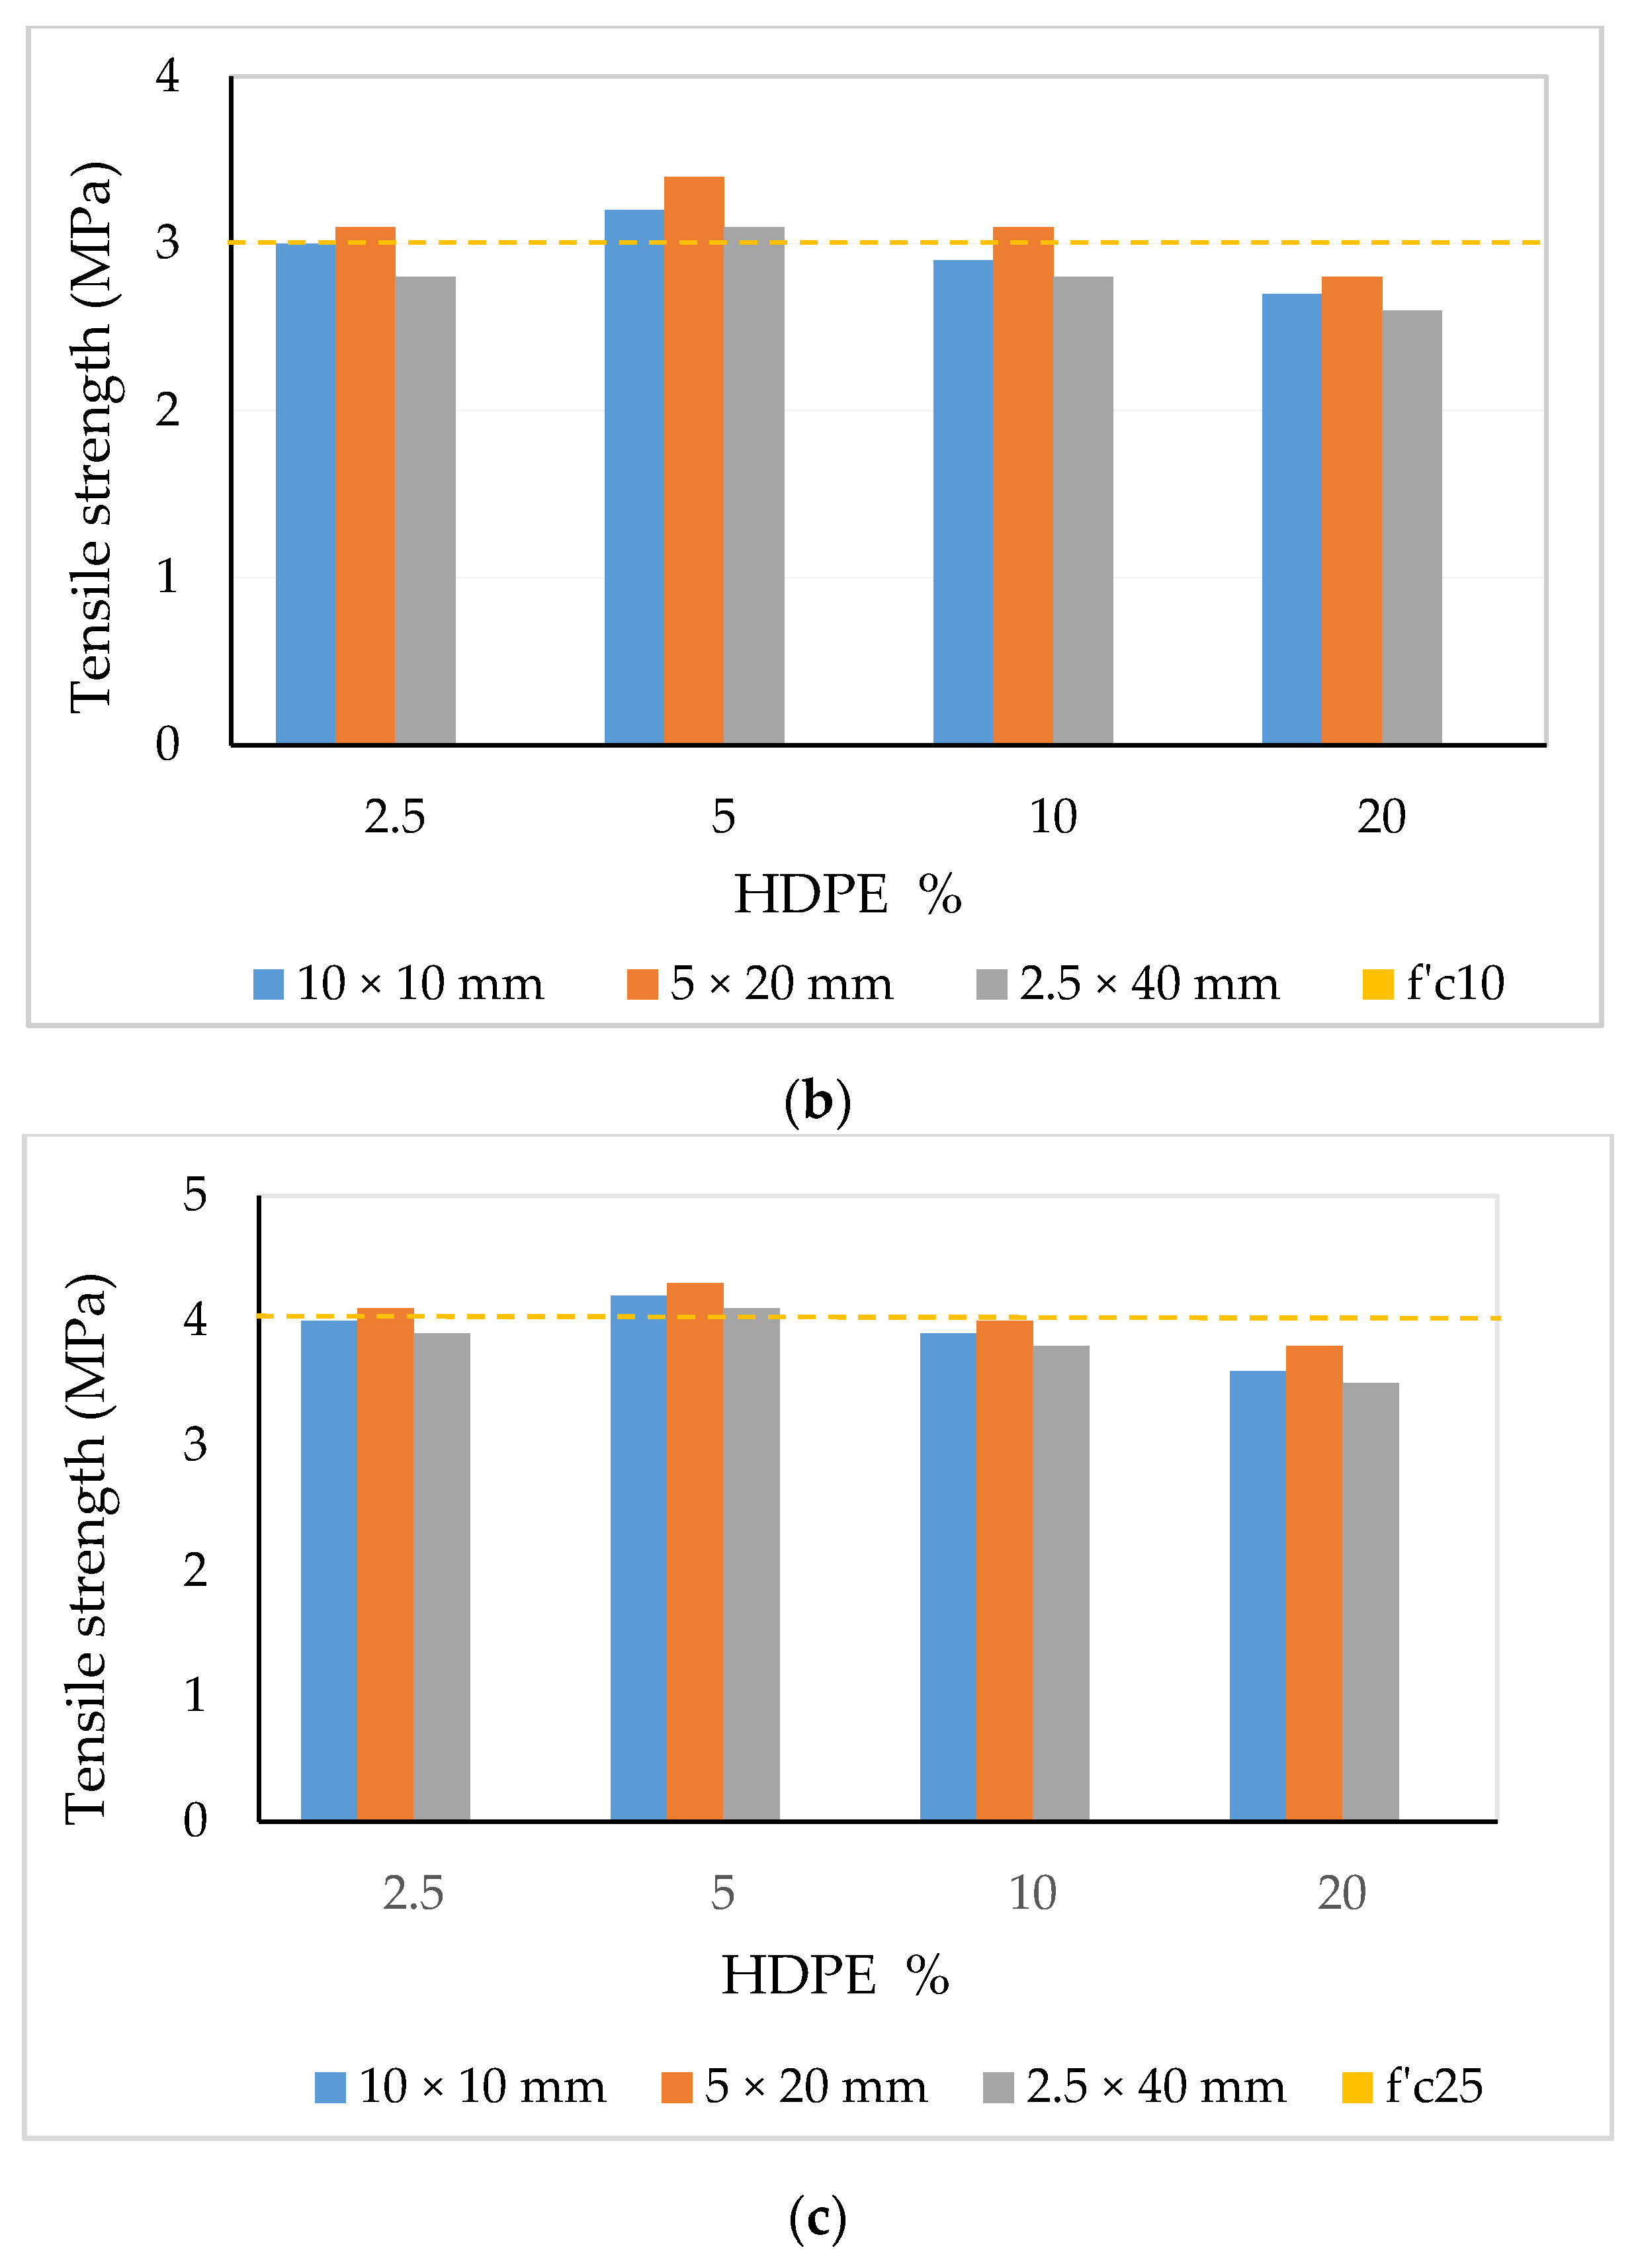
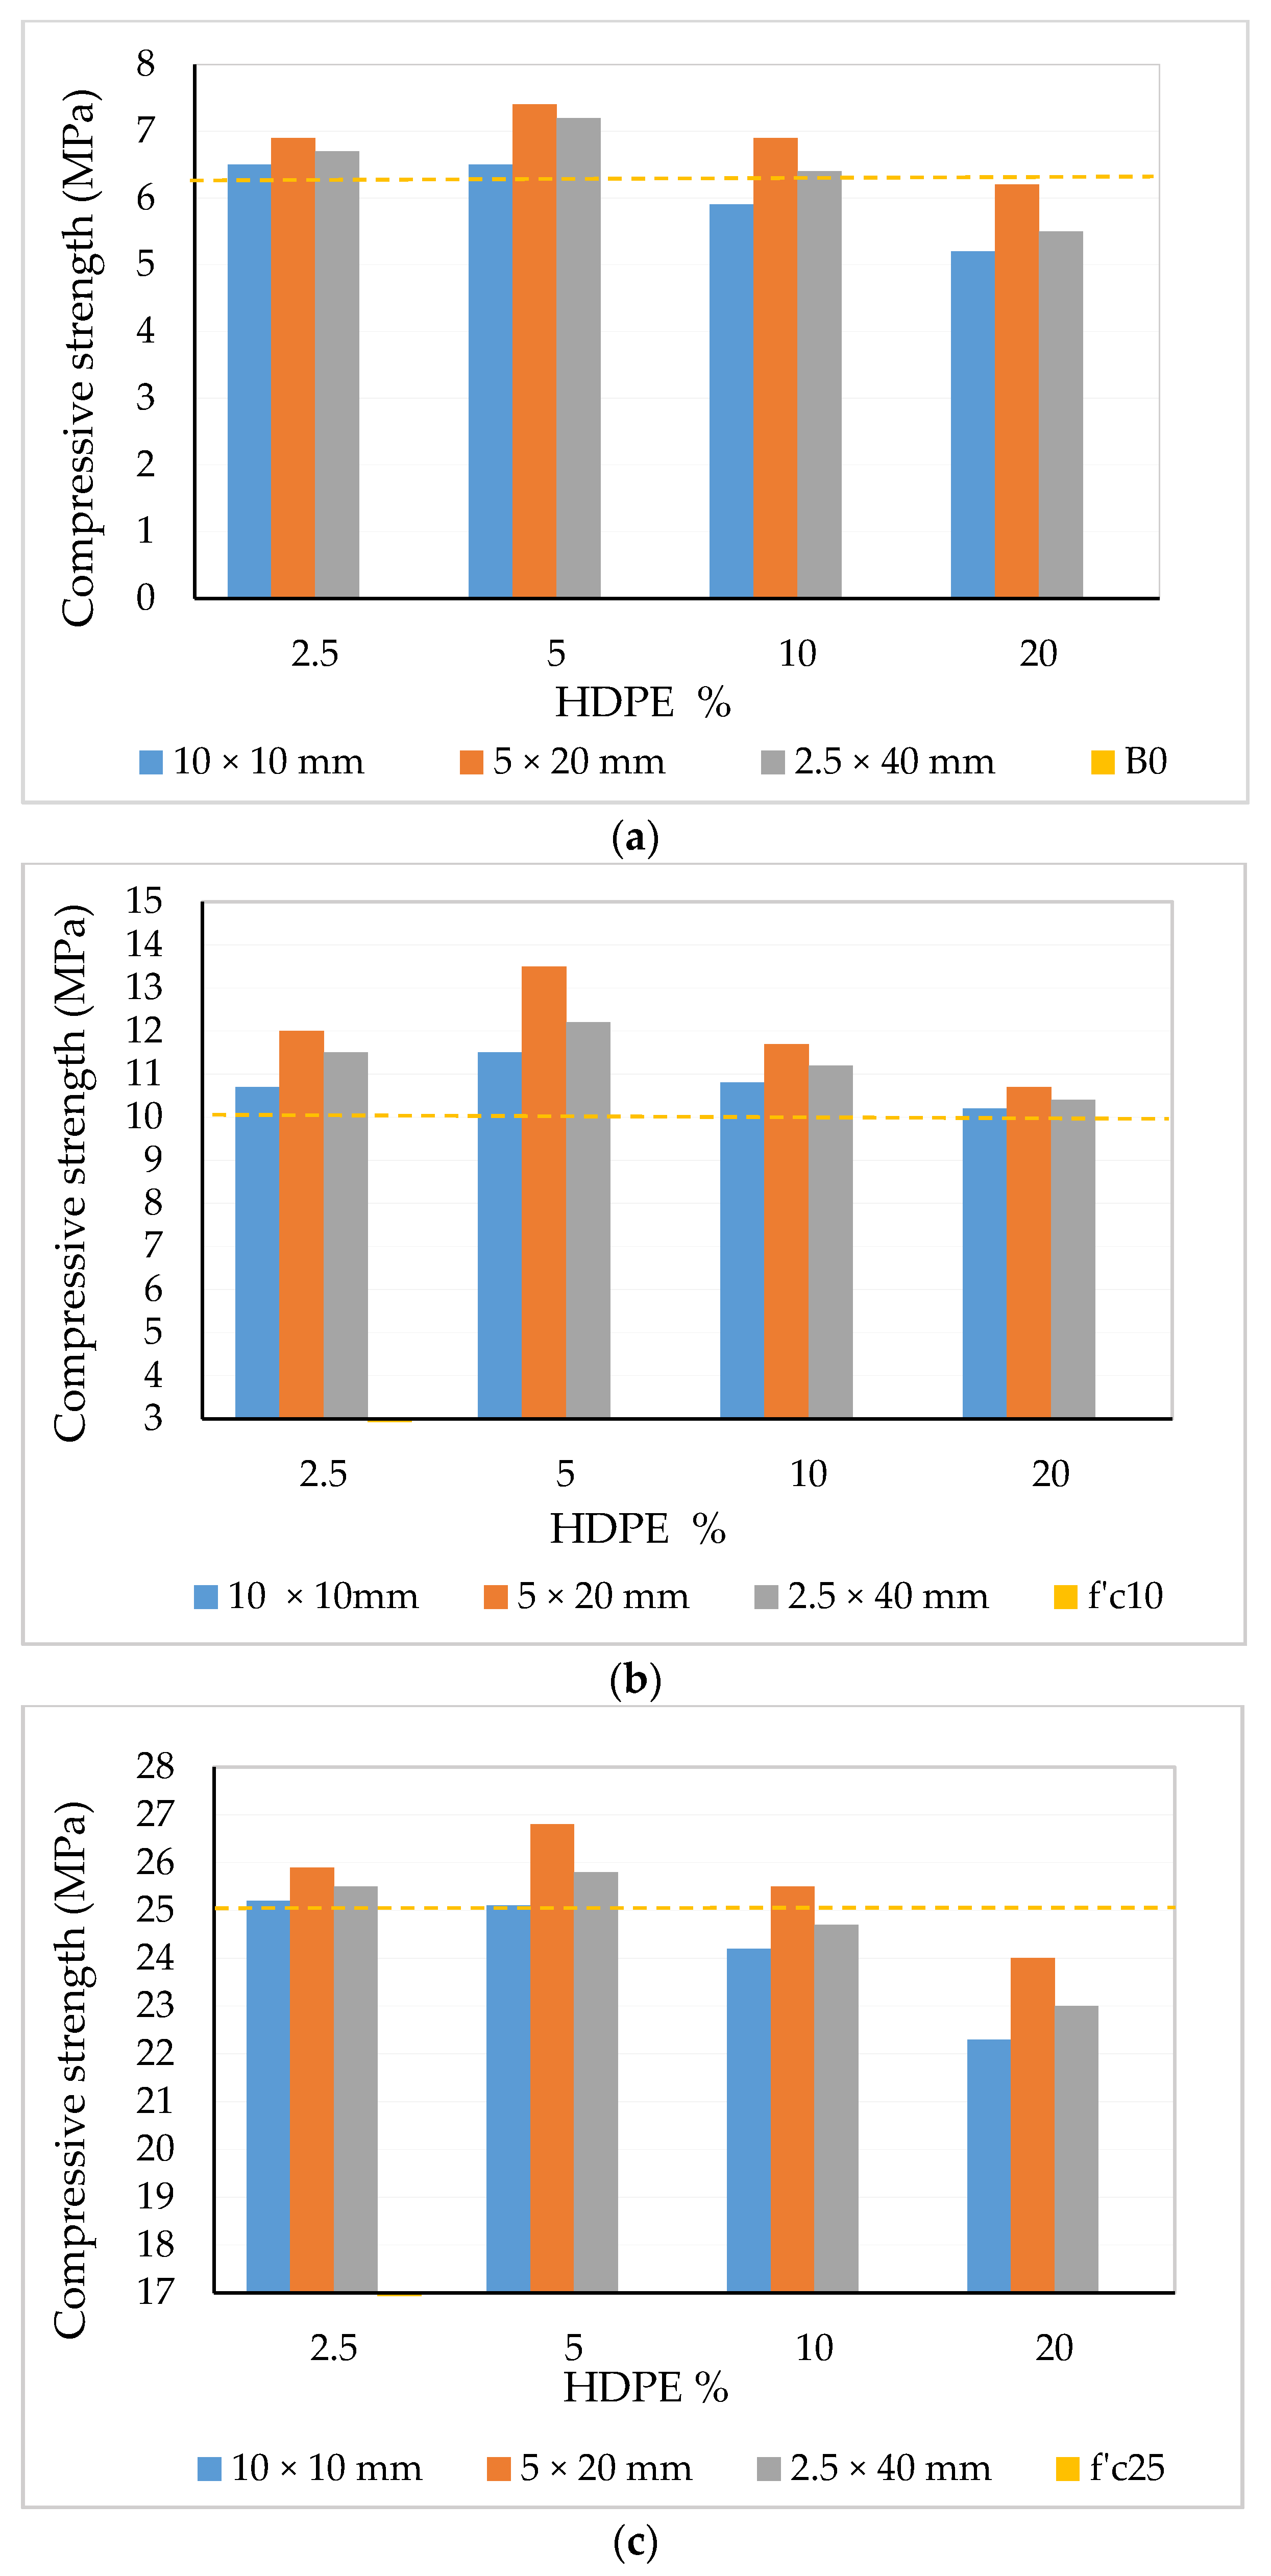
Tensile and compressive strengths are the important mechanical properties that identify concrete performance. Figure 7 and Figure 8 display the results of splitting tensile and cylindrical compressive strength tests for the concrete mixtures containing HDPE addition (the testing results are shown in Appendix A). Our experiments indicated that the strength varied depending on the HDPE content and sizes.
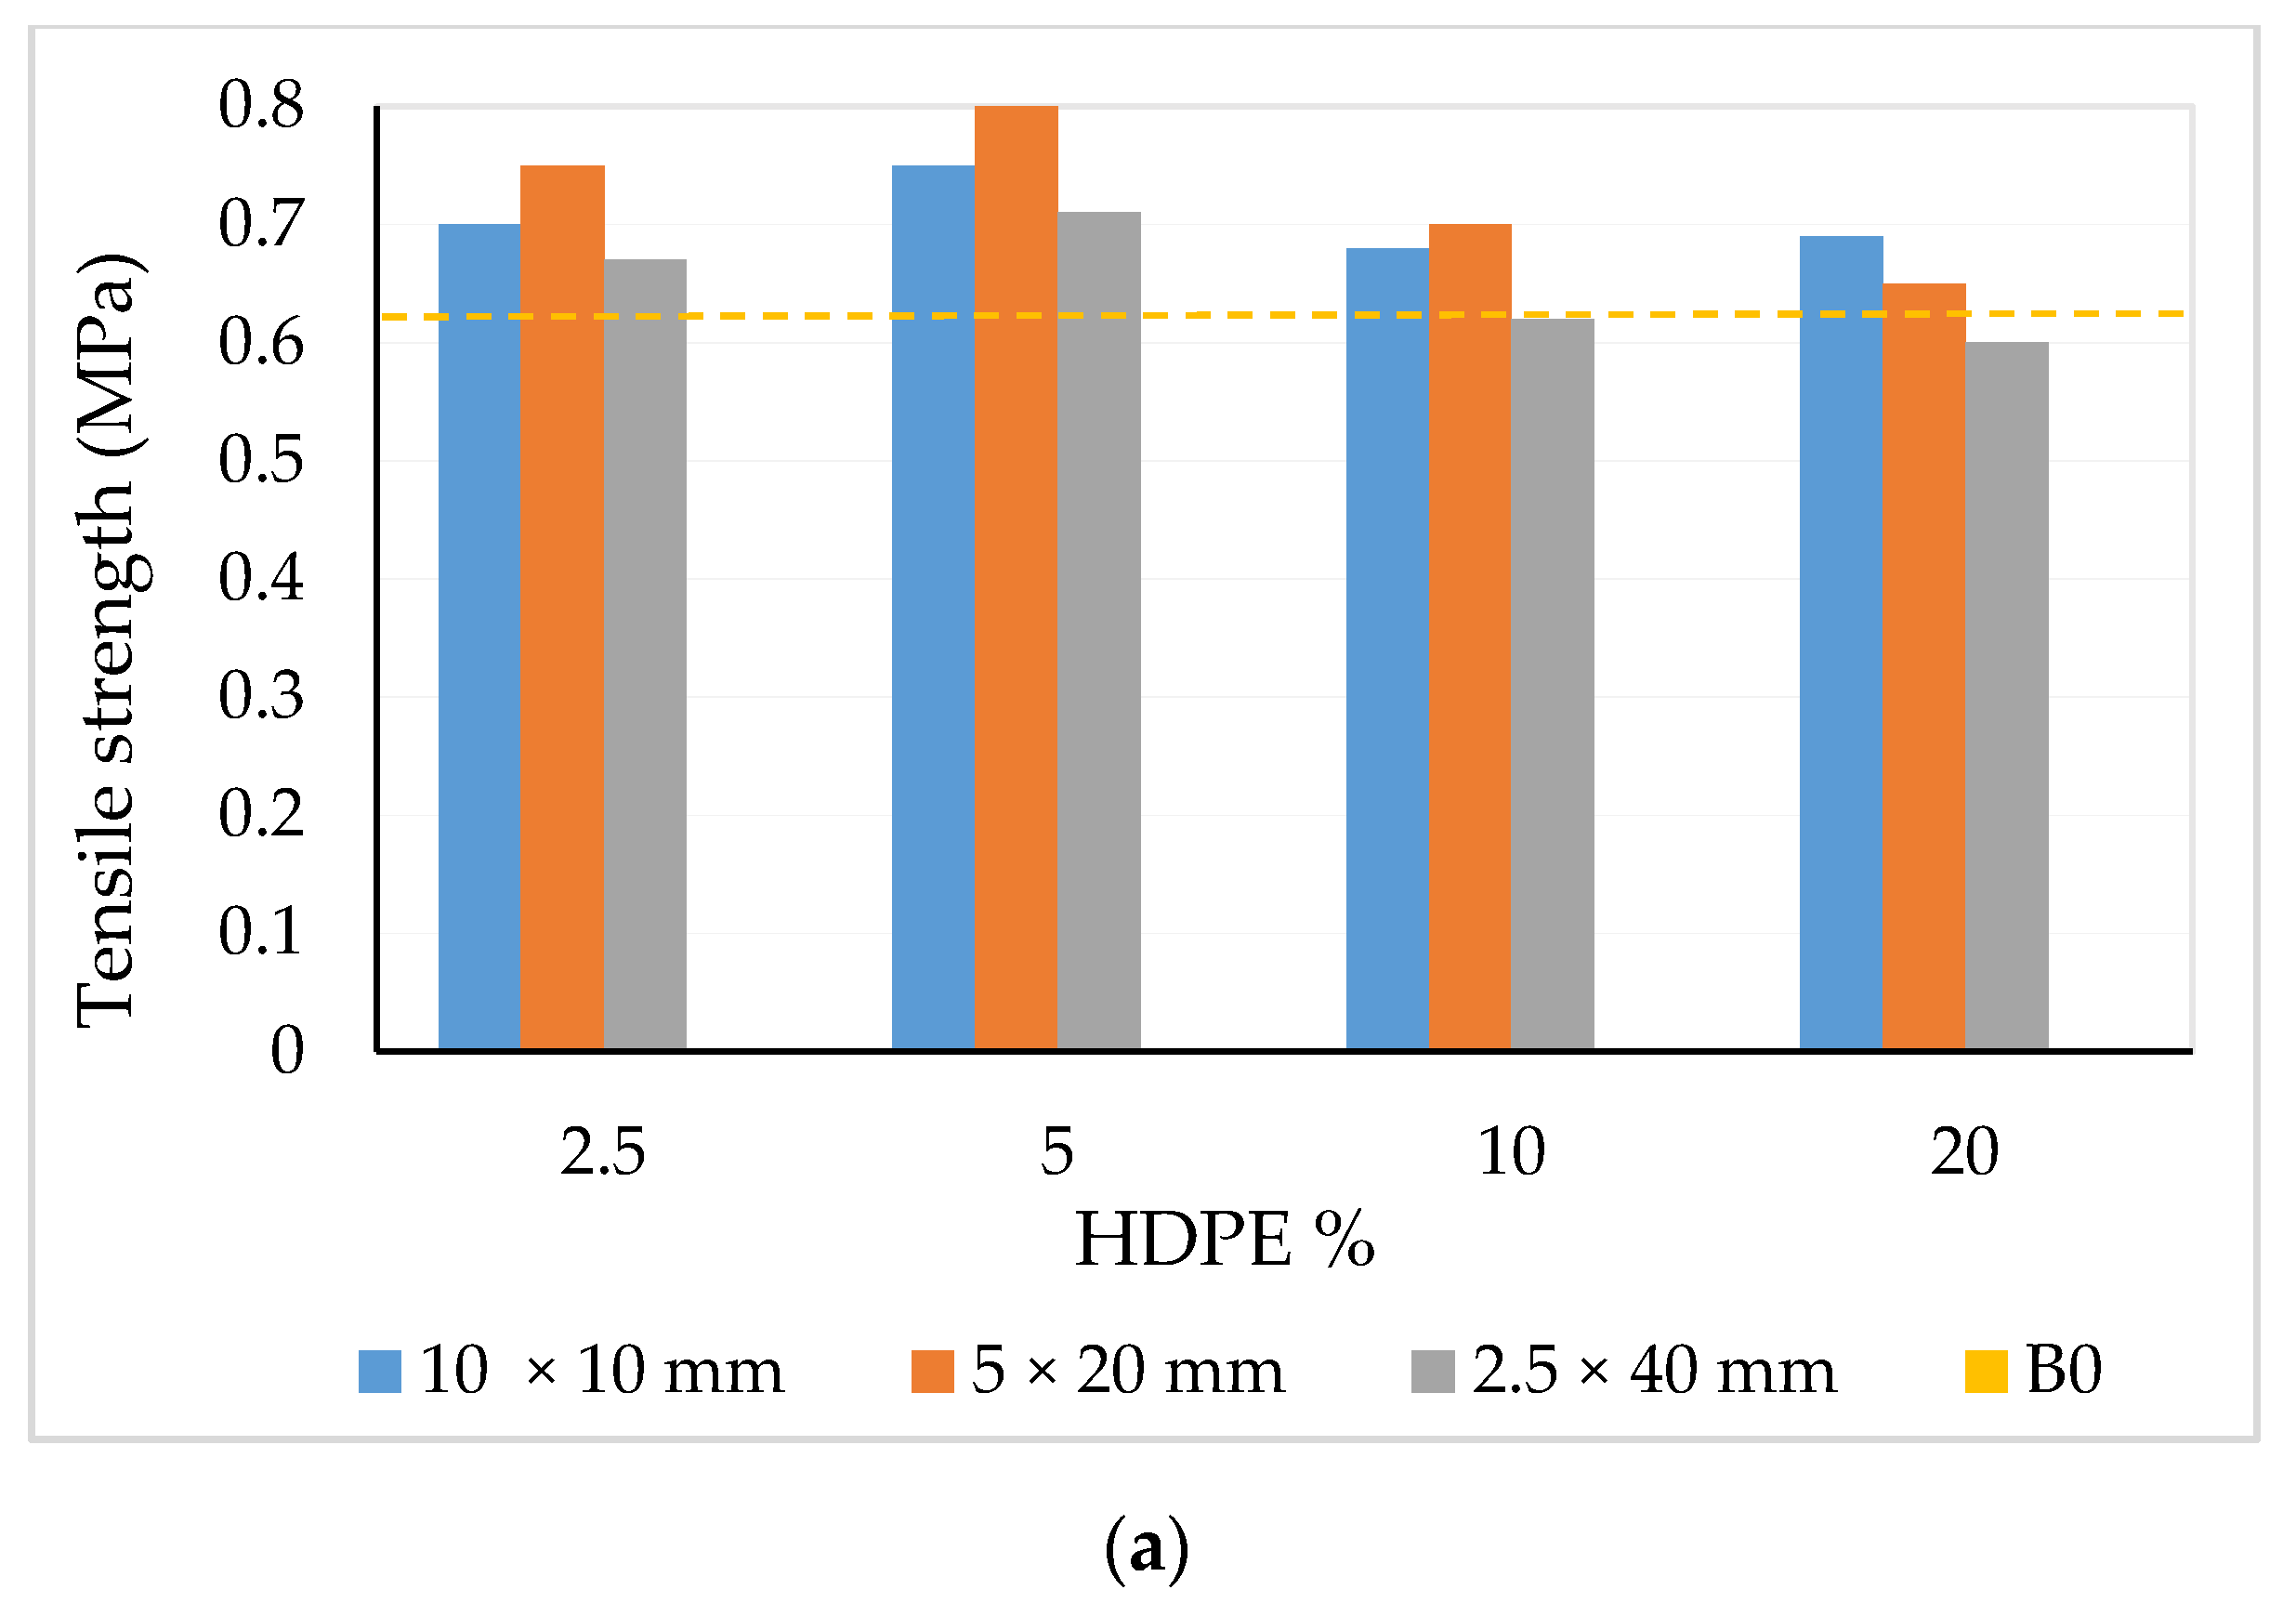
In line with the job mix design shown in Table 3, the concrete aggregate content and w/c ratio had an effect on tensile and compressive strength. Figure 7 shows that the B0 concrete had a lower tensile strength, compared to f’c10 and f’c25. We observed also that the percentage and HDPE sizes behaved differently on concrete strength. Although all sizes of HDPE lamellar had an equal surface area (1 cm2), they produced a different response. In this case, we found that for all concrete classes, the addition of HDPE up to 5% showed higher tensile strength compared to other percentages (above the baseline), and the “5 × 20 mm” was the best shape compared to the size of “10 × 10 mm” and ”2.5 × 40 mm”. This finding aligned with the compressive strength results shown in Figure 8a–c, where the 5% addition and “5 × 20 mm” strength value was above the normal concrete quality. This graph also indicates that f’c10 concrete gave a better response to the increase in concrete quality compared to B0 and f’c25, where in all percentage additions and different lamellar shapes, the value was above the normal concrete.
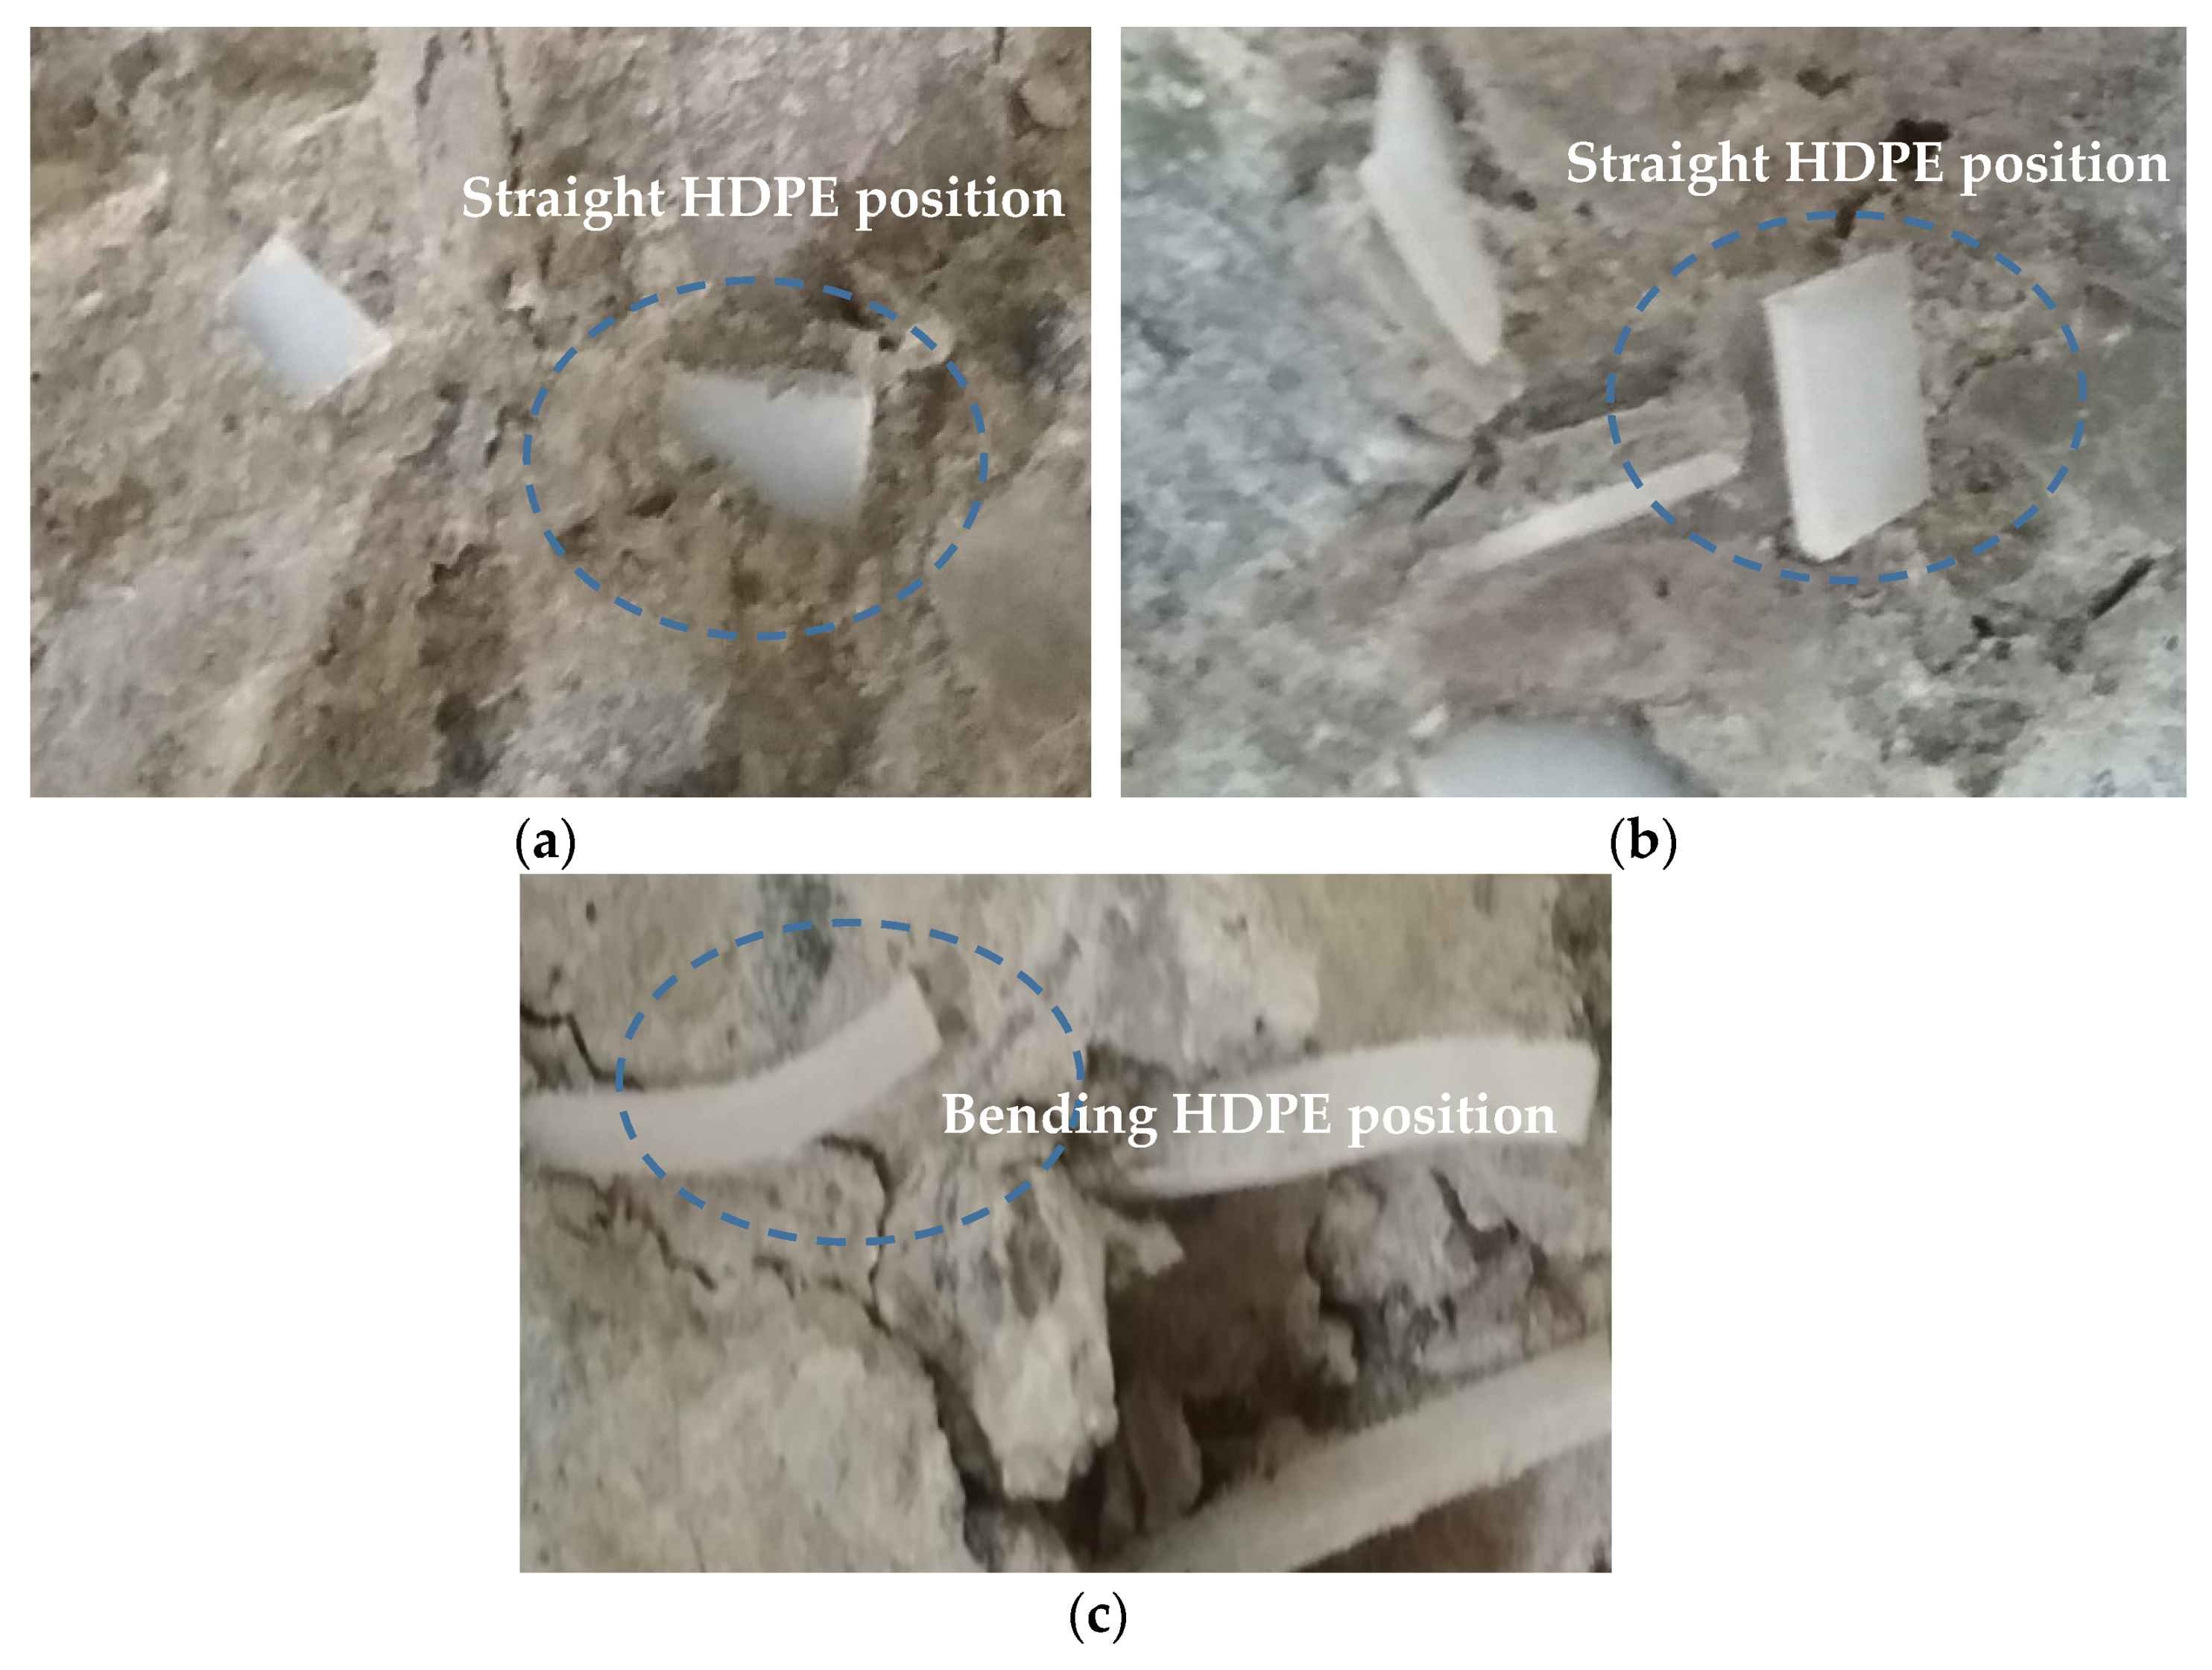
In addition, for the compaction, Figure 9a,b shows a two-dimensional (2D) image of HDPE positions in the concrete mixture. The lamellar particles with sizes of “10 × 10 mm” and “5 × 20 mm” remained unaffected by coarse aggregate pressure during casting. When tested for compressive strength, the broken piece of concrete was then observed visually. The size of 10 × 10 mm and 5 × 20 mm seemed to pack and bond together with the concrete mixture in a straight position. However, we found that the “2.5 × 40 mm” sheet became curved during casting (Figure 9c). Though this condition depends on the different angles of lamellar particles and the level of coarse aggregate pressure received during casting, the results showed that the 5 × 20 mm specimens performed better compared to 2.5 × 40 mm.
4. Discussion and Analysis
4.1. Relationship between HDPE Additions and Slump Value
The concrete workability indicates the consistency of the concrete mix during the work. It relates to the degree of its compaction provided by the external (contact with the surface) and internal friction (given by the aggregate size, shape, grading). The use of admixtures, e.g., plastics could also affect the compaction. The fact that plastic materials are generally lightweight and resistant to weather, means that they can be considered as suitable additive materials for concrete [19]. Previous studies indicated that added materials, including plastics, can improve the properties of concrete given appropriate percentage mixes [9,28]. In this case, the addition of plastic can improve toughness and energy absorption at post-cracking [41,42]. Further, given the very poor biodegradability of plastic, i.e., HDPE, can not only improve the long-term performance of concrete structures but it can also contribute to environmental sustainability and performance of the construction industry [43,44].
However, the addition of HDPE to the concrete mixture affected the slump value, which is essential for concrete workability. Good workability is associated with the finishing stages, homogeneity, and resistance to segregation. In regard to segregation, this must be avoided during casting, due to fresh concrete’s low workability [45]. Increasing the amount of water used in the job mix and adding materials at proportioning mix to maintain concrete density [46] could be useful. For instance, recently, two types of added plastic have been used in concrete mixes and have shown satisfactory results when using 30% plastic waste in the total aggregate [47]. Therefore, to prevent less fluidity in the first place, we managed the w/c ratio and admixture additions that function to alter concrete properties when making the job mixes. Table 3 shows we set a higher w/c ratio than the typical w/c ratio, and we used a lamellar shape (bigger size than fiber).
Even so, our findings, shown in Figure 5, identified that a small amount of added plastic does not affect the mixture’s workability, but a higher percentage of added plastic was found to influence the cementitious materials’ content and sharply decrease the concrete’s workability. The possible reason is plastic hydrophobicity, which causes an insufficiency of plastics to mix with other materials. It may limit the hydration of cement as a result of the lesser bonding between plastic surfaces and cement paste. Additionally, due to the angular and nonuniform nature of plastic aggregate particles [28,48], the increase of HDPE lamellar particles in the concrete mixture results in lower fluidity compared to normal concrete. This applies to different sizes of plastic lamellar particles, as seen in Figure 5, which clearly indicates that, for all additions of HDPE at different sizes, the addition of HDPE lamellar particles thickened the concrete mixture, thereby lowering the slump value. To sum up, when considering the range of slump reduction, the added HDPE lamellar particles fit well for low-degree workability applications. We consider that the findings of this study may be useful for non-structural works, where higher strength is not the main aspect [49,50].
4.2. Relationship between HDPE Additions and Unit Weight
When the HDPE lamellar particles were added into the concrete mixture, due to the nature of plastic (e.g., immiscibility), the addition of plastic in the mixture may increase the air content in concrete, thus affecting its density [19]. Additionally, during the hydration and curing process, some amount of moisture is removed from the concrete mixture. The immiscibility of plastics could affect compactness when a certain level of admixture is replaced by HDPE. However, here, the volume of concrete remains the same, as indicated by the amount pushed out of the sample mold. Further, as the unit weight of normal concrete is about 2400 kg/m3; higher than HDPE, which is about 930–970 kg/m3, it is justifiable that concrete containing HDPE additions would have lower unit weight. Figure 6 shows that for all concrete classes, compared to normal concrete, the unit weight of the concrete mixture dropped linearly with the increased number of lamellar particles in the mixture. Thus, an increase in HDPE content enables a reduction in concrete weight; an important target in construction. In particular, for the same percentage of HDPE lamellar additions, the different size of plastic lamellar particles does not affect the unit weight. This finding is indicated by an almost similar value of unit weight for “5 × 20 mm”, “2.5 × 40 mm”, and “10 × 10 mm” lamellar particles.
Further, this study identified that the addition of HDPE, in lamellar shape, provided the best response to concrete quality up to 5 % for medium concrete strength of f’c10. This type of concrete could add benefit to non-structural walls, base concrete in the rigid pavement on highways, paving blocks for parking lots with low loads, wall panels, shotcrete (or Gunite), and concrete footpaths. For the use of precast concrete walls especially, concrete mixtures containing HDPE could reduce the building’s structural load and energy consumption within the building by lowering the inside temperature. Together with fillers (e.g., sand, quarry fine), this type of concrete mix could help prevent heat transfer within a structure, which is relevant to Indonesia’s moderate to high temperatures. In particular, there is a strong connection between thermal conductivity and concrete’s substantial weight whereby the use of plastics to replace aggregates can reduce concrete’s thermal conductivity compared to bare concrete [9,51].
Although the previous study has discussed the development of lightweight concrete using HDPE additions (25%), opening up new development opportunities for non-structural and structural applications [52], our findings show that the concrete with added plastics should be directed to medium concrete strength. Therefore, mean concrete containing plastics cannot be used as a primary construction material, i.e., for column, beam, and plate constructions, mainly due to safety factors and its poor fire-resistant behavior [50]. These findings have an impact and add to the development of lightweight concrete for the green construction sector. Thus, the addition of HDPE could also lead to a more sustainable approach to reducing plastic waste.
4.3. The Effect of HDPE Additions to Tensile and Compressive Strength
As stated earlier, previous studies have found a relationship between plastics addition influencing concrete’s tensile strength and compressive strength [19,21,53] matching those of steel fibers that affected the value of splitting tensile and compressive strength [54], as well as plastic fibers, carbon fibers, and fibers from natural materials, such as flax or other plants. According to Hasan et al. [41], inserting fibers into a concrete mixture can increase the concrete composite’s tensile strength by about 10–15%, compared to standard concrete. Other research found similar results that fibers can prevent brittle failure and enhance the ductility of the concrete [48,52,54].
The tensile strength is an essential determinant of how concrete performs under induced stress. Figure 7 and Figure 8 show the connection between tensile and compressive strength; although their relationship is not directly proportional. The higher the compressive strength, the higher the tensile strength, but at a decreasing rate [55]. This study indicates that the addition of 5% HDPE increases the tensile and compressive strength of concrete, better than 2.5%, 10%, and 20%. Furthermore, the addition of 10% and 20% HDPE content to B0 and f’c25 concrete reduced the tensile and compressive strength. This finding in line with other studies showing that increasing the volume fraction can affect fiber bonding and decrease the strength of concrete composites [15,25,51]. However, this study identified that this did not apply to f’c10 MPa concrete, where an increase in quality occurred, even with a content of 20% for sheets with a size of 5 × 20 mm (13% increase in splitting tensile strength; 35% increase in compressive strength). Therefore, the amount of added HDPE should be chosen on the basis of the weight of the cement used, as outlined in Table 2.
Further, since all HDPE samples added had the same cross-sectional area, the size largely determines the results, whereby the position of plastic lamellar particles in the concrete can reduce the optimality of the aggregate bond, as seen in Figure 9. The findings emphasized that even though the plastic lamellar particles have the same cross-sectional area, different results came because their position depends on the pressure received. This explains why some lamellar particles are curved and some are straight. Figure 7 and Figure 8 show that in particular for lamellar particles at a size of “10 × 10 mm”, the plastic lamellar particles are packed together in a straight position, but in terms of its capacity to withstand loads, the size of “5 × 20 mm” produced a better response compared to “10 × 10 mm”. It shows that the length of the lamellar particles is important, up to a certain size. In summary, the performance of the additions with respect to strength testing was in the order of 5 × 20 mm > 2.5 × 40 mm > 10 × 10 mm. Thus, the use of HDPE with a size of 5 × 20 mm as an additive in the concrete mixture was acceptable.
5. Conclusions and Recommendations for Future Research
Few studies have assessed the effect of added particles’ length on concrete properties. This study has contributed to the understanding of the optimal percentages and sizes of HDPE in the shape of lamellar particles in concrete. Our study contributes to showing the effect that HDPE additions have in terms of size and percentage on concrete qualities to improve its use and exploitation and to design the concrete mix design process. Some important findings are:
- (1).
- This study evaluated the use of 2.5%, 5%, 10%, and 20% HDPE lamellar particle additions at sizes of 10 × 10 mm, 0.5 × 20 mm, and 2.5 × 40 mm incorporated into three concrete types (B0, f’c10, and f’c25). The f’c10 MPa concrete performed best in response to the addition of lamellar particles, whereas 5% was the optimal HDPE content, and 5 × 20 mm was the optimal size.
- (2).
- All variants of HDPE lamellar particles described can be used with f’c10 MPa concrete. However, only 5 × 20 mm HDPE sheets should be used with B0 and f’c25 MPa concrete.
- (3).
- Future research should investigate f’c10 MPa to determine the effects of different percentage additions and material composition into concrete mixes. Additionally, further work is needed to identify whether similar effects apply to different plastic shapes. More testing could explore the valuation of physical concrete properties, e.g., water porosity.
Author Contributions
T.; conceptualization, design and analysis, investigation, initial draft, visualization; J.N.; draft preparation, administration process, and the editing process. All authors have read and agreed to the published version of the manuscript.
Funding
This research received no external funding.
Data Availability Statement
All data is contained within the article.
Acknowledgments
We thank our colleagues in the Department of Civil Engineering, Mulawarman University, who help and provide us their insight and suggestions that greatly assisted our research.
Conflicts of Interest
The authors declare no conflict of interest associated with this publication. There has been no significant financial support for this work that could have influenced its outcome.
Appendix A

Table A1.
Compressive and Tensile Test Results of 156 Specimens Used.
| HDPE Addition | Compressive Test (MPa) | Tensile Test (MPa) | ||||
|---|---|---|---|---|---|---|
| Number of Specimens | Number of Specimens | |||||
| 1 | 2 | Average | 1 | 2 | Average | |
| B0 | 6.40 | 6.30 | 6.35 | 0.60 | 0.68 | 0.64 |
| B0-HDPE 2.5% | ||||||
| 10 × 10 mm | 6.30 | 6.70 | 6.50 | 0.70 | 0.70 | 0.70 |
| 5 × 20 mm | 6.80 | 7.00 | 6.90 | 0.80 | 0.70 | 0.75 |
| 2.5 × 40 mm | 6.80 | 6.60 | 6.70 | 0.70 | 0.65 | 0.68 |
| B0-HDPE 5% | ||||||
| 10 × 10 mm | 6.40 | 6.60 | 6.50 | 0.70 | 0.80 | 0.75 |
| 5 × 20 mm | 7.40 | 7.40 | 7.40 | 0.80 | 0.80 | 0.80 |
| 2.5 × 40 mm | 7.15 | 7.25 | 7.20 | 0.70 | 0.74 | 0.72 |
| B0-HDPE 10% | ||||||
| 10 × 10 mm | 5.90 | 6.00 | 5.95 | 0.70 | 0.65 | 0.68 |
| 5 × 20 mm | 6.90 | 6.90 | 6.90 | 0.70 | 0.70 | 0.70 |
| 2.5 × 40 mm | 6.40 | 6.42 | 6.41 | 0.64 | 0.60 | 0.62 |
| B0-HDPE 20% | ||||||
| 10 × 10 mm | 5.20 | 5.20 | 5.20 | 0.69 | 0.69 | 0.69 |
| 5 × 20 mm | 6.20 | 6.20 | 6.20 | 0.65 | 0.66 | 0.66 |
| 2.5 × 40 mm | 5.50 | 5.45 | 5.48 | 0.60 | 0.60 | 0.60 |
| f’c10 | 10.05 | 10.00 | 10.03 | 3.00 | 3.00 | 3.00 |
| f’c10-HDPE 2.5% | ||||||
| 10 × 10 mm | 10.70 | 10.70 | 10.70 | 2.80 | 3.20 | 3.00 |
| 5 × 20 mm | 12.00 | 12.00 | 12.00 | 2.90 | 3.30 | 3.10 |
| 2.5 × 40 mm | 11.30 | 11.70 | 11.50 | 2.70 | 2.90 | 2.80 |
| f’c10-HDPE 5% | ||||||
| 10 × 10 mm | 11.50 | 11.50 | 11.50 | 3.20 | 3.15 | 3.18 |
| 5 × 20 mm | 13.50 | 13.50 | 13.50 | 3.30 | 3.45 | 3.38 |
| 2.5 × 40 mm | 12.20 | 12.17 | 12.19 | 3.10 | 3.15 | 3.13 |
| f’c10-HDPE 10% | ||||||
| 10 × 10 mm | 10.80 | 10.80 | 10.80 | 2.80 | 3.00 | 2.90 |
| 5 × 20 mm | 11.71 | 11.68 | 11.70 | 3.20 | 3.00 | 3.10 |
| 2.5 × 40 mm | 11.20 | 11.20 | 11.20 | 2.65 | 2.90 | 2.78 |
| f’c10-HDPE 20% | ||||||
| 10 × 10 mm | 10.20 | 10.20 | 10.20 | 2.60 | 2.80 | 2.70 |
| 5 × 20 mm | 10.68 | 10.72 | 10.70 | 2.80 | 2.85 | 2.83 |
| 2.5 × 40 mm | 10.40 | 10.40 | 10.40 | 2.60 | 2.70 | 2.65 |
| f’c25 | 25.00 | 25.10 | 25.05 | 4.00 | 4.10 | 4.05 |
| f’c25-HDPE 2.5% | ||||||
| 10 × 10 mm | 25.40 | 25.00 | 25.20 | 4.10 | 4.00 | 4.05 |
| 5 × 20 mm | 25.50 | 26.30 | 25.90 | 4.15 | 4.10 | 4.13 |
| 2.5 × 40 mm | 25.30 | 25.70 | 25.50 | 3.80 | 3.98 | 3.89 |
| f’c25-HDPE 5% | ||||||
| 10 × 10 mm | 25.00 | 25.20 | 25.10 | 4.20 | 4.15 | 4.18 |
| 5 × 20 mm | 26.60 | 27.00 | 26.80 | 4.30 | 4.35 | 4.33 |
| 2.5 × 40 mm | 26.10 | 25.50 | 25.80 | 4.20 | 4.10 | 4.15 |
| f’c25-HDPE 10% | ||||||
| 10 × 10 mm | 24.40 | 24.00 | 24.20 | 3.80 | 3.90 | 3.85 |
| 5 × 20 mm | 25.60 | 25.40 | 25.50 | 4.00 | 3.90 | 3.95 |
| 2.5 × 40 mm | 24.40 | 25.00 | 24.70 | 3.90 | 3.70 | 3.80 |
| f’c25-HDPE 20% | ||||||
| 10 × 10 mm | 22.60 | 22.00 | 22.30 | 3.70 | 3.60 | 3.65 |
| 5 × 20 mm | 24.50 | 23.60 | 24.05 | 3.90 | 3.72 | 3.81 |
| 2.5 × 40 mm | 22.90 | 23.10 | 23.00 | 3.50 | 3.52 | 3.51 |
References
- The Association of Plastic Recyclers (APR): Recognition Program Operating Procedures. Available online: https://plasticsrecycling.org/images/pdf/Recognition_Program/Procedure/Recognition_ProgramOperating_Procedures_June_2009.pdf (accessed on 27 May 2020).
- How Long It Takes for Some Everyday Items to Decompose. Available online: http://storage.neic.org/event/docs/1129/how_long_does_it_take_garbage_to_decompose.pdf (accessed on 27 May 2020).
- Verma, R.; Vinoda, K.; Papireddy, M.; Gowda, A. Toxic Pollutants from Plastic Waste—A Review. Procedia Environ. Sci. 2016, 35, 701–708. [Google Scholar] [CrossRef]
- Lebreton, L.C.M.; Van Der Zwet, J.; Damsteeg, J.-W.; Slat, B.; Andrady, A.; Reisser, J. River plastic emissions to the world’s oceans. Nat. Commun. 2017, 8, 15611. [Google Scholar] [CrossRef] [PubMed]
- Van Emmerik, T.; Schwarz, A. Plastic debris in rivers. Wiley Interdiscip. Rev. Water 2020, 7, e1398. [Google Scholar] [CrossRef] [Green Version]
- Jambeck, J.R.; Geyer, R.; Wilcox, C.; Siegler, T.R.; Perryman, M.; Andrady, A.; Narayan, R.; Law, K.L. Plastic waste inputs from land into the ocean. Science 2015, 347, 768–771. [Google Scholar] [CrossRef] [PubMed]
- Mattsson, K.; Hansson, L.-A.; Cedervall, T. Nano-plastics in the aquatic environment. Environ. Sci. Process. Impacts 2015, 17, 1712–1721. [Google Scholar] [CrossRef] [PubMed]
- Baier, D.; Rausch, T.M.; Wagner, T.F. The Drivers of Sustainable Apparel and Sportswear Consumption: A Segmented Kano Perspective. Sustainability 2020, 12, 2788. [Google Scholar] [CrossRef] [Green Version]
- Poonyakan, A.; Rachakornkij, M.; Wecharatana, M.; Smittakorn, W. Potential Use of Plastic Wastes for Low Thermal Conductivity Concrete. Materials 2018, 11, 1938. [Google Scholar] [CrossRef] [Green Version]
- Geyer, R.; Jambeck, J.R.; Law, K.L. Production, use, and fate of all plastics ever made. Sci. Adv. 2017, 3, e1700782. [Google Scholar] [CrossRef] [Green Version]
- Sistem Informasi Pengelolaan Sampah Nasional. Available online: http://sipsn.menlhk.go.id/?q=3a-komposisi-sampah (accessed on 4 August 2020).
- Godfrey, L. Waste Plastic, the Challenge Facing Developing Countries—Ban It, Change It, Collect It? Recycling 2019, 4, 3. [Google Scholar] [CrossRef] [Green Version]
- Nurdiana, J.; Franco-García, M.-L.; Hophmayer-Tokich, S. Incorporating circular sustainability principles in DKI. Jakarta: Lessons learned from Dutch business schools management. In Towards Zero Waste; Franco-García, M.L., Carpio-Aguilar, J., Bressers, H., Eds.; Greening of Industry Networks Studies; Springer: Cham, Switzerland, 2019; Volume 6, pp. 145–163. [Google Scholar]
- Napper, I.E.; Thompson, R.C. Plastic Debris in the Marine Environment: History and Future Challenges. Glob. Chall. 2020, 4, 1900081. [Google Scholar] [CrossRef]
- EMF (The Ellen Mac Arthur Foundation). Urban Biocycles. 2017. Available online: https://www.ellenmacarthurfoundation.org/publications/urban-biocyles (accessed on 20 June 2020).
- Jain, A.; Siddique, S.; Gupta, T.; Jain, S.; Sharma, R.K.; Chaudhary, S. Fresh, Strength, Durability and Microstructural Properties of Shredded Waste Plastic Concrete. Iran. J. Sci. Technol. Trans. Civ. Eng. 2019, 43, 455–465. [Google Scholar] [CrossRef]
- Kaufmann, J.; Frech, K.; Schuetz, P.; Münch, B. Rebound and orientation of fibers in wet sprayed concrete applications. Constr. Build. Mater. 2013, 49, 15–22. [Google Scholar] [CrossRef]
- Alani, A.M.; Beckett, D. Mechanical properties of a large scale synthetic fibre reinforced concrete ground slab. Constr. Build. Mater. 2013, 41, 335–344. [Google Scholar] [CrossRef]
- Babafemi, A.J.; Šavija, B.; Paul, S.C.; Anggraini, V. Engineering Properties of Concrete with Waste Recycled Plastic: A Review. Sustainability 2018, 10, 3875. [Google Scholar] [CrossRef] [Green Version]
- Islam, J.; Meherier, S.; Islam, A.R. Effects of waste PET as coarse aggregate on the fresh and harden properties of concrete. Constr. Build. Mater. 2016, 125, 946–951. [Google Scholar] [CrossRef]
- Batayneh, M.; Marie, I.; Asi, I. Use of selected waste materials in concrete mixes. Waste Manag. 2007, 27, 1870–1876. [Google Scholar] [CrossRef]
- Akinpelu, M.A.; Odeyemi, S.O.; Olafusi, O.S.; Muhammed, F.Z. Evaluation of splitting tensile and compressive strength relationship of self-compacting concrete. J. King Saud Univ.-Eng. Sci. 2019, 31, 19–25. [Google Scholar] [CrossRef]
- Lavanya, G.; Jegan, J. Evaluation of relationship between split tensile strength and compressive strength for geopolymer concrete of varying grades and molarity. Int. J. Appl. Eng. Res. 2015, 10, 35523–35529. [Google Scholar]
- Choi, Y.; Yuan, R.L. Experimental relationship between splitting tensile strength and compressive strength of GFRC and PFRC. Cem. Concr. Res. 2005, 35, 1587–1591. [Google Scholar] [CrossRef]
- Kim, S.B.; Yi, N.H.; Kim, H.Y.; Kim, J.-H.J.; Song, Y.-C. Material and structural performance evaluation of recycled PET fiber reinforced concrete. Cem. Concr. Compos. 2010, 32, 232–240. [Google Scholar] [CrossRef]
- Nikbin, I.M.; Rahimi, S.; Allahyari, H.; Fallah, F. Feasibility study of waste Poly Ethylene Terephthalate (PET) particles as aggregate replacement for acid erosion of sustainable structural normal and lightweight concrete. J. Clean. Prod. 2016, 126, 108–117. [Google Scholar] [CrossRef]
- Silva, A.L.P.; Prata, J.C.; Walker, T.R.; Campos, D.; Duarte, A.C.; Soares, A.M.; Barcelò, D.; Rocha-Santos, T. Rethinking and optimising plastic waste management under COVID-19 pandemic: Policy solutions based on redesign and reduction of single-use plastics and personal protective equipment. Sci. Total. Environ. 2020, 742, 140565. [Google Scholar] [CrossRef] [PubMed]
- Bahij, S.; Omary, S.; Feugeas, F.; Faqiri, A. Fresh and hardened properties of concrete containing different forms of plastic waste—A review. Waste Manag. 2020, 113, 157–175. [Google Scholar] [CrossRef] [PubMed]
- Fraternali, F.; Ciancia, V.; Chechile, R.; Rizzano, G.; Feo, L.; Incarnato, L. Experimental study of the thermo-mechanical properties of recycled PET fiber-reinforced concrete. Compos. Struct. 2011, 93, 2368–2374. [Google Scholar] [CrossRef]
- Merli, R.; Preziosi, M.; Acampora, A.; Lucchetti, M.C.; Petrucci, E. Recycled fibers in reinforced concrete: A systematic literature review. J. Clean. Prod. 2020, 248, 119207. [Google Scholar] [CrossRef]
- Pešić, N.; Živanović, S.; Garcia, R.; Papastergiou, P. Mechanical properties of concrete reinforced with recycled HDPE plastic fibres. Constr. Build. Mater. 2016, 115, 362–370. [Google Scholar] [CrossRef] [Green Version]
- Lopez, N.; Collado, E.; Diacos, L.A.; Morente, H.D. Evaluation of Pervious Concrete Utilizing Recycled HDPE as Partial Replacement of Coarse Aggregate with Acrylic as Additive. MATEC Web Conf. 2019, 258, 01018. [Google Scholar] [CrossRef]
- ASTM C 33-99ae1. Standard Specification for Concrete Aggregates; ASTM International: West Conshohocken, PA, USA, 2002. [Google Scholar]
- ASTM International. Standard Test Method for Bulk Density (“Unit Weight”) and Voids in Aggregate; ASTM C29/C29M-07: West Conshohocken, PA, USA, 2003. [Google Scholar]
- ASTM International. Standard Test Method for Resistance to Degradation of Small-Size Coarse Aggregate by Abrasion and Impact in the Los Angeles Machine; ASTM C131/C131M-20: West Conshohocken, PA, USA, 2005. [Google Scholar]
- American Concrete Institute. ACI Manual of Concrete Practice. In Part 1: Materials and General Properties of Concrete; American Concrete Institute: Farmington Hills, MI, USA, 2000. [Google Scholar]
- Setareh, M.; Darvas, R. Reinforced Concrete Technology. In Concrete Structures; Springer: Cham, Switzerland, 2017; pp. 1–35. [Google Scholar] [CrossRef]
- ASTM International. Standard Test Method for Slump of Hydraulic Cement Concrete; ASTMC143: West Conshohocken, PA, USA, 2000. [Google Scholar]
- ASTM International. Test Method for Compressive Strength of Cylindrical Concrete Specimens; ASTMC39: West Conshohocken, PA, USA, 2014. [Google Scholar]
- ASTM International. Standard Test Method for Splitting Tensile Strength of Cylindrical Concrete Specimens; ASTMC496: West Conshohocken, PA, USA, 2009. [Google Scholar]
- Hasan, M.J.; Afroz, M.; Mahmud, H.M.I. An experimental investigation on the mechanical behavior of macro synthetic fibre reinforced concrete. Int. J. Civ. Environ. Eng. 2011, 11, 18–23. [Google Scholar]
- Xu, L.; Li, B.; Ding, X.; Chi, Y.; Li, C.; Huang, B.; Shi, Y. Experimental Investigation on Damage Behavior of Polypropylene Fiber Reinforced Concrete under Compression. Int. J. Concr. Struct. Mater. 2018, 12, 68. [Google Scholar] [CrossRef]
- Turner, R.P.; Kelly, C.A.; Fox, R.; Hopkins, B. Re-Formative Polymer Composites from Plastic Waste: Novel Infrastructural Product Application. Recycling 2018, 3, 54. [Google Scholar] [CrossRef] [Green Version]
- Kamaruddin, M.A.; Abdullah, M.M.; Zawawi, M.H.; Zainol, M.R.R. Potential use of Plastic Waste as Construction Materials: Recent Progress and Future Prospect. IOP Conf. Series Mater. Sci. Eng. 2017, 267, 012011. [Google Scholar] [CrossRef]
- Mazaheripour, H.; Ghanbarpour, S.; Mirmoradi, S.; Hosseinpour, I. The effect of polypropylene fibers on the properties of fresh and hardened lightweight self-compacting concrete. Constr. Build. Mater. 2011, 25, 351–358. [Google Scholar] [CrossRef]
- Yin, S.; Tuladhar, R.; Shi, F.; Combe, M.; Collister, T.; Sivakugan, N. Use of macro plastic fibres in concrete: A review. Constr. Build. Mater. 2015, 93, 180–188. [Google Scholar] [CrossRef]
- Aldahdooh, M.; Jamrah, A.; Alnuaimi, A.; Martini, M.; Ahmed, M. Influence of various plastics-waste aggregates on properties of normal concrete. J. Build. Eng. 2018, 17, 13–22. [Google Scholar] [CrossRef]
- Ismail, Z.Z.; Al-Hashmi, E.A. Use of waste plastic in concrete mixture as aggregate replacement. Waste Manag. 2008, 28, 2041–2047. [Google Scholar] [CrossRef] [PubMed]
- Albano, C.; Camacho, N.; Hernández, M.; Matheus, A.; Gutiérrez, A. Influence of content and particle size of waste pet bottles on concrete behavior at different w/c ratios. Waste Manag. 2009, 29, 2707–2716. [Google Scholar] [CrossRef] [PubMed]
- Almeshal, I.; Tayeh, B.A.; Alyousef, R.; Alabduljabbar, H.; Mohamed, A.M. Eco-friendly concrete containing recycled plastic as partial replacement for sand. J. Mater. Res. Technol. 2020, 9, 4631–4643. [Google Scholar] [CrossRef]
- Tasdemir, C.; Sengul, O.; Tasdemir, M.A. A comparative study on the thermal conductivities and mechanical properties of lightweight concretes. Energy Build. 2017, 151, 469–475. [Google Scholar] [CrossRef]
- Alqahtani, F.K.; Ghataora, G.; Khan, M.I.; Dirar, S. Novel lightweight concrete containing manufactured plastic aggregate. Constr. Build. Mater. 2017, 148, 386–397. [Google Scholar] [CrossRef]
- Mohammed, A.A.; Mohammed, I.I.; Mohammed, S.A. Some properties of concrete with plastic aggregate derived from shredded PVC sheets. Constr. Build. Mater. 2019, 201, 232–245. [Google Scholar] [CrossRef]
- Awad, H.K. Influence of Cooling Methods on the Behavior of Reactive Powder Concrete Exposed to Fire Flame Effect. Fibers 2020, 8, 19. [Google Scholar] [CrossRef] [Green Version]
- Neville, A.M. Properties of Concrete, 4th ed.; Longman Group: Essex, UK, 1995; p. 844. [Google Scholar]
Figure 1.
Aggregate size: (a) fine aggregate; (b) coarse aggregate.

Figure 2.
The preparation of high-density polyethylene (HDPE) addition: (a) marking procedure for the cutting process; (b) examples of HDPE lamellar particles with a size of 10 × 10 mm.
Figure 2.
The preparation of high-density polyethylene (HDPE) addition: (a) marking procedure for the cutting process; (b) examples of HDPE lamellar particles with a size of 10 × 10 mm.

Figure 3.
Preparation of concrete cylinder specimen.

Figure 4.
Preparation of B0 concrete for the slump test.

Figure 5.
Slump value as a function of HDPE content (%) and sizes: (a) B0; (b) f’c10; (c) f’c25.

Figure 6.
The relationship between concrete unit weight and HDPE content and sizes: (a) B0; (b) f’c10; (c) f’c25.
Figure 6.
The relationship between concrete unit weight and HDPE content and sizes: (a) B0; (b) f’c10; (c) f’c25.


Figure 7.
Tensile strength of concrete mixtures as a function of HDPE content and lamellar shape: (a) B0; (b) f’c10 MPa; (c) f’c25 MPa.
Figure 7.
Tensile strength of concrete mixtures as a function of HDPE content and lamellar shape: (a) B0; (b) f’c10 MPa; (c) f’c25 MPa.


Figure 8.
Compressive strength of concrete mixtures as a function of HDPE content and lamellar shape: (a) B0; (b) f’c10 MPa; (c) f’c25 MPa.
Figure 8.
Compressive strength of concrete mixtures as a function of HDPE content and lamellar shape: (a) B0; (b) f’c10 MPa; (c) f’c25 MPa.

Figure 9.
2D images of HDPE in concrete: (a) 10 × 10 mm; (b) 5 × 20 mm; (c) 2.5 × 40 mm.

Table 1.
The standards used for concrete testing.
| Standard | Targeted Testing |
|---|---|
| ASTM C-127 | Specific gravity of coarse aggregate |
| ASTM C33-99a | Adequate grading requirement and aggregate quality; sieve analysis |
| ASTM C29/C29M-07 | Unit weight for fine and coarse aggregate |
| ASTM C131/C131M-20 | Resistance to degradation by abrasion on small-size coarse aggregate |
| ACI 211.1-91 | Standard Practice for Selecting Proportions for Normal, Heavyweight, and Mass Concrete |
| ASTM C143 | Slump test |
| ASTM C39 | Compressive strength |
| ASTM C496 | Tensile strength |
Table 2.
Physical properties of cement and aggregates.
| Materials | Properties | Value | Allowable Range |
|---|---|---|---|
| Cement type 1 | Specific gravity | 3.18 g/cm3 | 3.1–3.3 g/cm3 |
| Fine Aggregate | Sieve size | Figure 1a | Following ASTM C33-99a |
| Unit weight | 2.54 g/cm3 | 2.5–2.7 g/cm3 | |
| Coarse Aggregate | Sieve size | Figure 1b | Following ASTM C33-99a |
| Unit weight | 2.55 g/cm3 | 2.5–2.7 g/cm3 | |
| Resistance to abrasion | 23% | Maximum of 27% |
Table 3.
Concrete job mix design.
| Description | B0 | f’c10 | f’c25 |
|---|---|---|---|
| Targeted average compressive strength of the concrete | 7 MPa | 10 MPa | 25 MPa |
| Water to cement ratio | 0.95 | 0.63 | 0.52 |
| Slump value | 120 ± 5 mm | 120 ± 5 mm | 120 ± 5 mm |
| Amount of water | 180 kg/m3 | 190 kg/m3 | 215 kg/m3 |
| Amount of cement | 190 kg/m3 | 295 kg/m3 | 413 kg/m3 |
| Fine aggregate content | 969 kg/m3 | 828 kg/m3 | 687 kg/m3 |
| Coarse aggregate content | 1010 kg/m3 | 1014 kg/m3 | 1220 kg/m3 |
Table 4.
Design experiment of specimens used.
| HDPE Addition | Volume of Concrete (m3) | Cement (kg) | Fine Aggregate (kg) | Coarse Aggregate (kg) | Water (kg) | HDPE Lamellar (kg) | Number of Specimens | |
|---|---|---|---|---|---|---|---|---|
| Compressive Strength | Tensile Strength | |||||||
| B0 | 0.021 | 4.03 | 20.54 | 21.41 | 3.82 | 0 | 2 | 2 |
| B0-HDPE 2.5% | ||||||||
| 10 × 10 mm | 0.021 | 4.03 | 20.54 | 21.41 | 3.82 | 0.10 | 2 | 2 |
| 5 × 20 mm | 0.021 | 4.03 | 20.54 | 21.41 | 3.82 | 0.10 | 2 | 2 |
| 2.5 × 40 mm | 0.021 | 4.03 | 20.54 | 21.41 | 3.82 | 0.10 | 2 | 2 |
| B0-HDPE 5% | ||||||||
| 10 × 10 mm | 0.021 | 4.03 | 20.54 | 21.41 | 3.82 | 0.20 | 2 | 2 |
| 5 × 20 mm | 0.021 | 4.03 | 20.54 | 21.41 | 3.82 | 0.20 | 2 | 2 |
| 2.5 × 40 mm | 0.021 | 4.03 | 20.54 | 21.41 | 3.82 | 0.20 | 2 | 2 |
| B0-HDPE 10% | ||||||||
| 10 × 10 mm | 0.021 | 4.03 | 20.54 | 21.41 | 3.82 | 0.40 | 2 | 2 |
| 5 × 20 mm | 0.021 | 4.03 | 20.54 | 21.41 | 3.82 | 0.40 | 2 | 2 |
| 2.5 × 40 mm | 0.021 | 4.03 | 20.54 | 21.41 | 3.82 | 0.40 | 2 | 2 |
| B0-HDPE 20% | ||||||||
| 10 × 10 mm | 0.021 | 4.03 | 20.54 | 21.41 | 3.82 | 0.81 | 2 | 2 |
| 5 × 20 mm | 0.021 | 4.03 | 20.54 | 21.41 | 3.82 | 0.81 | 2 | 2 |
| 2.5 × 40 mm | 0.021 | 4.03 | 20.54 | 21.41 | 3.82 | 0.81 | 2 | 2 |
| f’c10 | 0.021 | 6.25 | 17.55 | 21.49 | 4.03 | 0 | 2 | 2 |
| f’c10-HDPE 2.5% | ||||||||
| 10 × 10 mm | 0.021 | 6.25 | 17.55 | 21.49 | 4.03 | 0.16 | 2 | 2 |
| 5 × 20 mm | 0.021 | 6.25 | 17.55 | 21.49 | 4.03 | 0.16 | 2 | 2 |
| 2.5 × 40 mm | 0.021 | 6.25 | 17.55 | 21.49 | 4.03 | 0.16 | 2 | 2 |
| f’c10-HDPE 5% | ||||||||
| 10 × 10 mm | 0.021 | 6.25 | 17.55 | 21.49 | 4.03 | 0.31 | 2 | 2 |
| 5 × 20 mm | 0.021 | 6.25 | 17.55 | 21.49 | 4.03 | 0.31 | 2 | 2 |
| 2.5 × 40 mm | 0.021 | 6.25 | 17.55 | 21.49 | 4.03 | 0.31 | 2 | 2 |
| f’c10-HDPE 10% | ||||||||
| 10 × 10 mm | 0.021 | 6.25 | 17.55 | 21.49 | 4.03 | 0.63 | 2 | 2 |
| 5 × 20 mm | 0.021 | 6.25 | 17.55 | 21.49 | 4.03 | 0.63 | 2 | 2 |
| 2.5 × 40 mm | 0.021 | 6.25 | 17.55 | 21.49 | 4.03 | 0.63 | 2 | 2 |
| f’c10-HDPE 20% | ||||||||
| 10 × 10 mm | 0.021 | 6.25 | 17.55 | 21.49 | 4.03 | 1.25 | 2 | 2 |
| 5 × 20 mm | 0.021 | 6.25 | 17.55 | 21.49 | 4.03 | 1.25 | 2 | 2 |
| 2.5 × 40 mm | 0.021 | 6.25 | 17.55 | 21.49 | 4.03 | 1.25 | 2 | 2 |
| f’c25 | 0.021 | 8.75 | 14.56 | 25.09 | 4.56 | 0.00 | 2 | 2 |
| f’c25-HDPE 2.5% | ||||||||
| 10 × 10 mm | 0.021 | 8.75 | 14.56 | 25.09 | 4.56 | 0.22 | 2 | 2 |
| 5 × 20 mm | 0.021 | 8.75 | 14.56 | 25.09 | 4.56 | 0.22 | 2 | 2 |
| 2.5 × 40 mm | 0.021 | 8.75 | 14.56 | 25.09 | 4.56 | 0.22 | 2 | 2 |
| f’c25-HDPE 5% | ||||||||
| 10 × 10 mm | 0.021 | 8.75 | 14.56 | 25.09 | 4.56 | 0.44 | 2 | 2 |
| 5 × 20 mm | 0.021 | 8.75 | 14.56 | 25.09 | 4.56 | 0.44 | 2 | 2 |
| 2.5 × 40 mm | 0.021 | 8.75 | 14.56 | 25.09 | 4.56 | 0.44 | 2 | 2 |
| f’c25-HDPE 10% | ||||||||
| 10 × 10 mm | 0.021 | 8.75 | 14.56 | 25.09 | 4.56 | 0.88 | 2 | 2 |
| 5 × 20 mm | 0.021 | 8.75 | 14.56 | 25.09 | 4.56 | 0.88 | 2 | 2 |
| 2.5 × 40 mm | 0.021 | 8.75 | 14.56 | 25.09 | 4.56 | 0.88 | 2 | 2 |
| f’c25-HDPE 20% | ||||||||
| 10 × 10 mm | 0.021 | 8.75 | 14.56 | 25.09 | 4.56 | 1.75 | 2 | 2 |
| 5 × 20 mm | 0.021 | 8.75 | 14.56 | 25.09 | 4.56 | 1.75 | 2 | 2 |
| 2.5 × 40 mm | 0.021 | 8.75 | 14.56 | 25.09 | 4.56 | 1.75 | 2 | 2 |
Publisher’s Note: MDPI stays neutral with regard to jurisdictional claims in published maps and institutional affiliations. |
© 2021 by the authors. Licensee MDPI, Basel, Switzerland. This article is an open access article distributed under the terms and conditions of the Creative Commons Attribution (CC BY) license (http://creativecommons.org/licenses/by/4.0/).
Share and Cite
MDPI and ACS Style
Tamrin; Nurdiana, J. The Effect of Recycled HDPE Plastic Additions on Concrete Performance. Recycling 2021, 6, 18. https://0-doi-org.brum.beds.ac.uk/10.3390/recycling6010018
AMA Style
Tamrin, Nurdiana J. The Effect of Recycled HDPE Plastic Additions on Concrete Performance. Recycling. 2021; 6(1):18. https://0-doi-org.brum.beds.ac.uk/10.3390/recycling6010018
Chicago/Turabian StyleTamrin, and Juli Nurdiana. 2021. "The Effect of Recycled HDPE Plastic Additions on Concrete Performance" Recycling 6, no. 1: 18. https://0-doi-org.brum.beds.ac.uk/10.3390/recycling6010018