
How COVID-19 Could Change the Economics of the Plastic Recycling Sector


1
Fisheries Economics Research Unit, Institute for the Oceans and Fisheries, University of British Columbia, Vancouver, BC V6T 1Z4, Canada
2
Ghana Institute of Management and Public Administration, Accra P.O. Box AH50, Ghana
*
Author to whom correspondence should be addressed.
Recycling 2021, 6(4), 64; https://0-doi-org.brum.beds.ac.uk/10.3390/recycling6040064
Submission received: 4 February 2021
/
Revised: 13 September 2021
/
Accepted: 22 September 2021
/
Published: 26 September 2021
(This article belongs to the Special Issue Advances in the Recycling and Processing of Plastic Waste)
Abstract
:The price of oil has a great influence on prices of recycled plastics and, therefore, plastic recycling efforts. Here, we analyze the effects of the ongoing COVID-19 pandemic on crude oil price and how this, in turn, is likely to affect the degree of plastic recycling that takes place. Impulse response functions and variance decompositions, calculated from the structural vector autoregression, suggest that changes in crude oil prices are key drivers of the price of recycled plastics. The findings highlight that because plastics are made from the by-products of oil, falling oil prices increase the cost of recycling. Therefore, the price of recycled plastics should be supported using taxes while encouraging sustained behavioral changes among consumers and producers to selectively collect and recycle personal protective equipment so that they do not clog our landfills or end up in our water bodies as plastic waste.
1. Introduction
When the first cases of COVID-19 were identified in China in December 2019/January 2020, and the cases continued to expand across all parts of the world, few anticipated the speed and magnitude of the impact of this event on the global economy. In fact, no one could have imagined the extent to which this novel virus would shut down our schools, shops, airport, etc., or that the price of crude oil could drop to the negative dollar. Like most sectors, the plastic recycling sector would be significantly affected by this pandemic, but the nature and extent of how the sector would be affected are yet unknown. Here, we give a prospective outlook on how the disruption triggered by COVID-19 could act as a catalyst for short-term and medium-term changes in the plastic recycling industry worldwide.
Plastics are the lifeblood of modern life. From the bags we carry our groceries in to soft drinks and water bottles and almost every electronic packaging in the supermarket, plastics have penetrated their way into every aspect of our society. Present-day plastics, such as low-density polyethylene, polystyrene, and polypropylene, are part of synthetic polymers, which are derived from oil or gas, and designed to be durable and undergo limited fragmentation [1]. Due to the low cost and versatile properties of these synthetic resins, the production of global plastics reached about 8.5 billion metric tons in 2015 [2]. Today, it is hard to imagine a world without plastics, even though the pervasiveness of plastic in our lives is a recent development. Along with lockdowns to slow the spread of the pandemic, the demand for plastics might be dropped, as other types of plastic consumptions, such as outdoor furniture replacements, could be largely decreased due to COVID-19. However, there is increasing concern over the surge in PPEs. For instance, in February this year, China increased the production of single-use face mask 12-folds per day to meet the high PPE demand among the general public, service workers, and health care workers [3].
Our need for plastic would seem to be stronger now because of COVID-19 and the fact that many of the protective personal equipment (PPEs) needed to protect healthcare workers are either made of plastic or wrapped in it. However, there is a detrimental side of plastic use, which poses a growing environmental threat since a substantial portion of plastic waste ends up leaking into the environment, with approximately 40% clogging our landfills. Of the total amount of plastic waste generated, only over 10% is recovered, with just 2% going through closed-loop recycling (that is, recycling of plastics into the same or similar-quality application) [4]. Additionally, with growing plastic production and use, estimates indicate that the amount of plastic entering the environment annually will more than double by 2050 [2,5], and even without COVID-19, it is estimated that the cumulative amount of plastic added to the ocean could increase by order of magnitude as soon as 2025 [6]. There are three primary aims of this study: 1. To explore the relationship between crude oil price and price of recycled plastic products 2. To examine the impacts of COVID-19 on plastic recycling. 3. To assess the current global commitments to address plastic recycling and the evolving policy landscape.
The recent spike in personal protective equipment production is unprecedented. Besides crippling plastic waste collection and sorting in many countries due to social distancing and concern about waste pickers’ health, COVID-19 will likely affect global plastic recycling through mass production of personal protective equipment (PPEs). At the peak of the pandemic, every news bulletin started with the coronavirus; stopping it or flattening the curve was the most important task in the world. The virus strain (SARS-CoV-2) responsible for the COVID-19 pandemic appeared at the end of 2019, and by the end of January 2021, it infected more than 101,487,289 people and killed over 2,114,312 (until January 23rd, source: Johns Hopkins University, Center for Systems Science and Engineering). The disease spreads from person to person by small droplets from the mouth or nose when the infected person breathes or coughs. A person can become infected by inhaling these droplets or by touching contaminated surfaces and then touching her/his nose, mouth, or eyes [7].
One key preventive measure that protects a person from the pandemic is wearing a respiratory protective device; these protective devices–or simply PPEs–are very important, and, although they cannot prevent an epidemic, they play a key role in slowing it down. If someone is suspected of being infected, they can drastically reduce the number of droplets the person spreads [7].
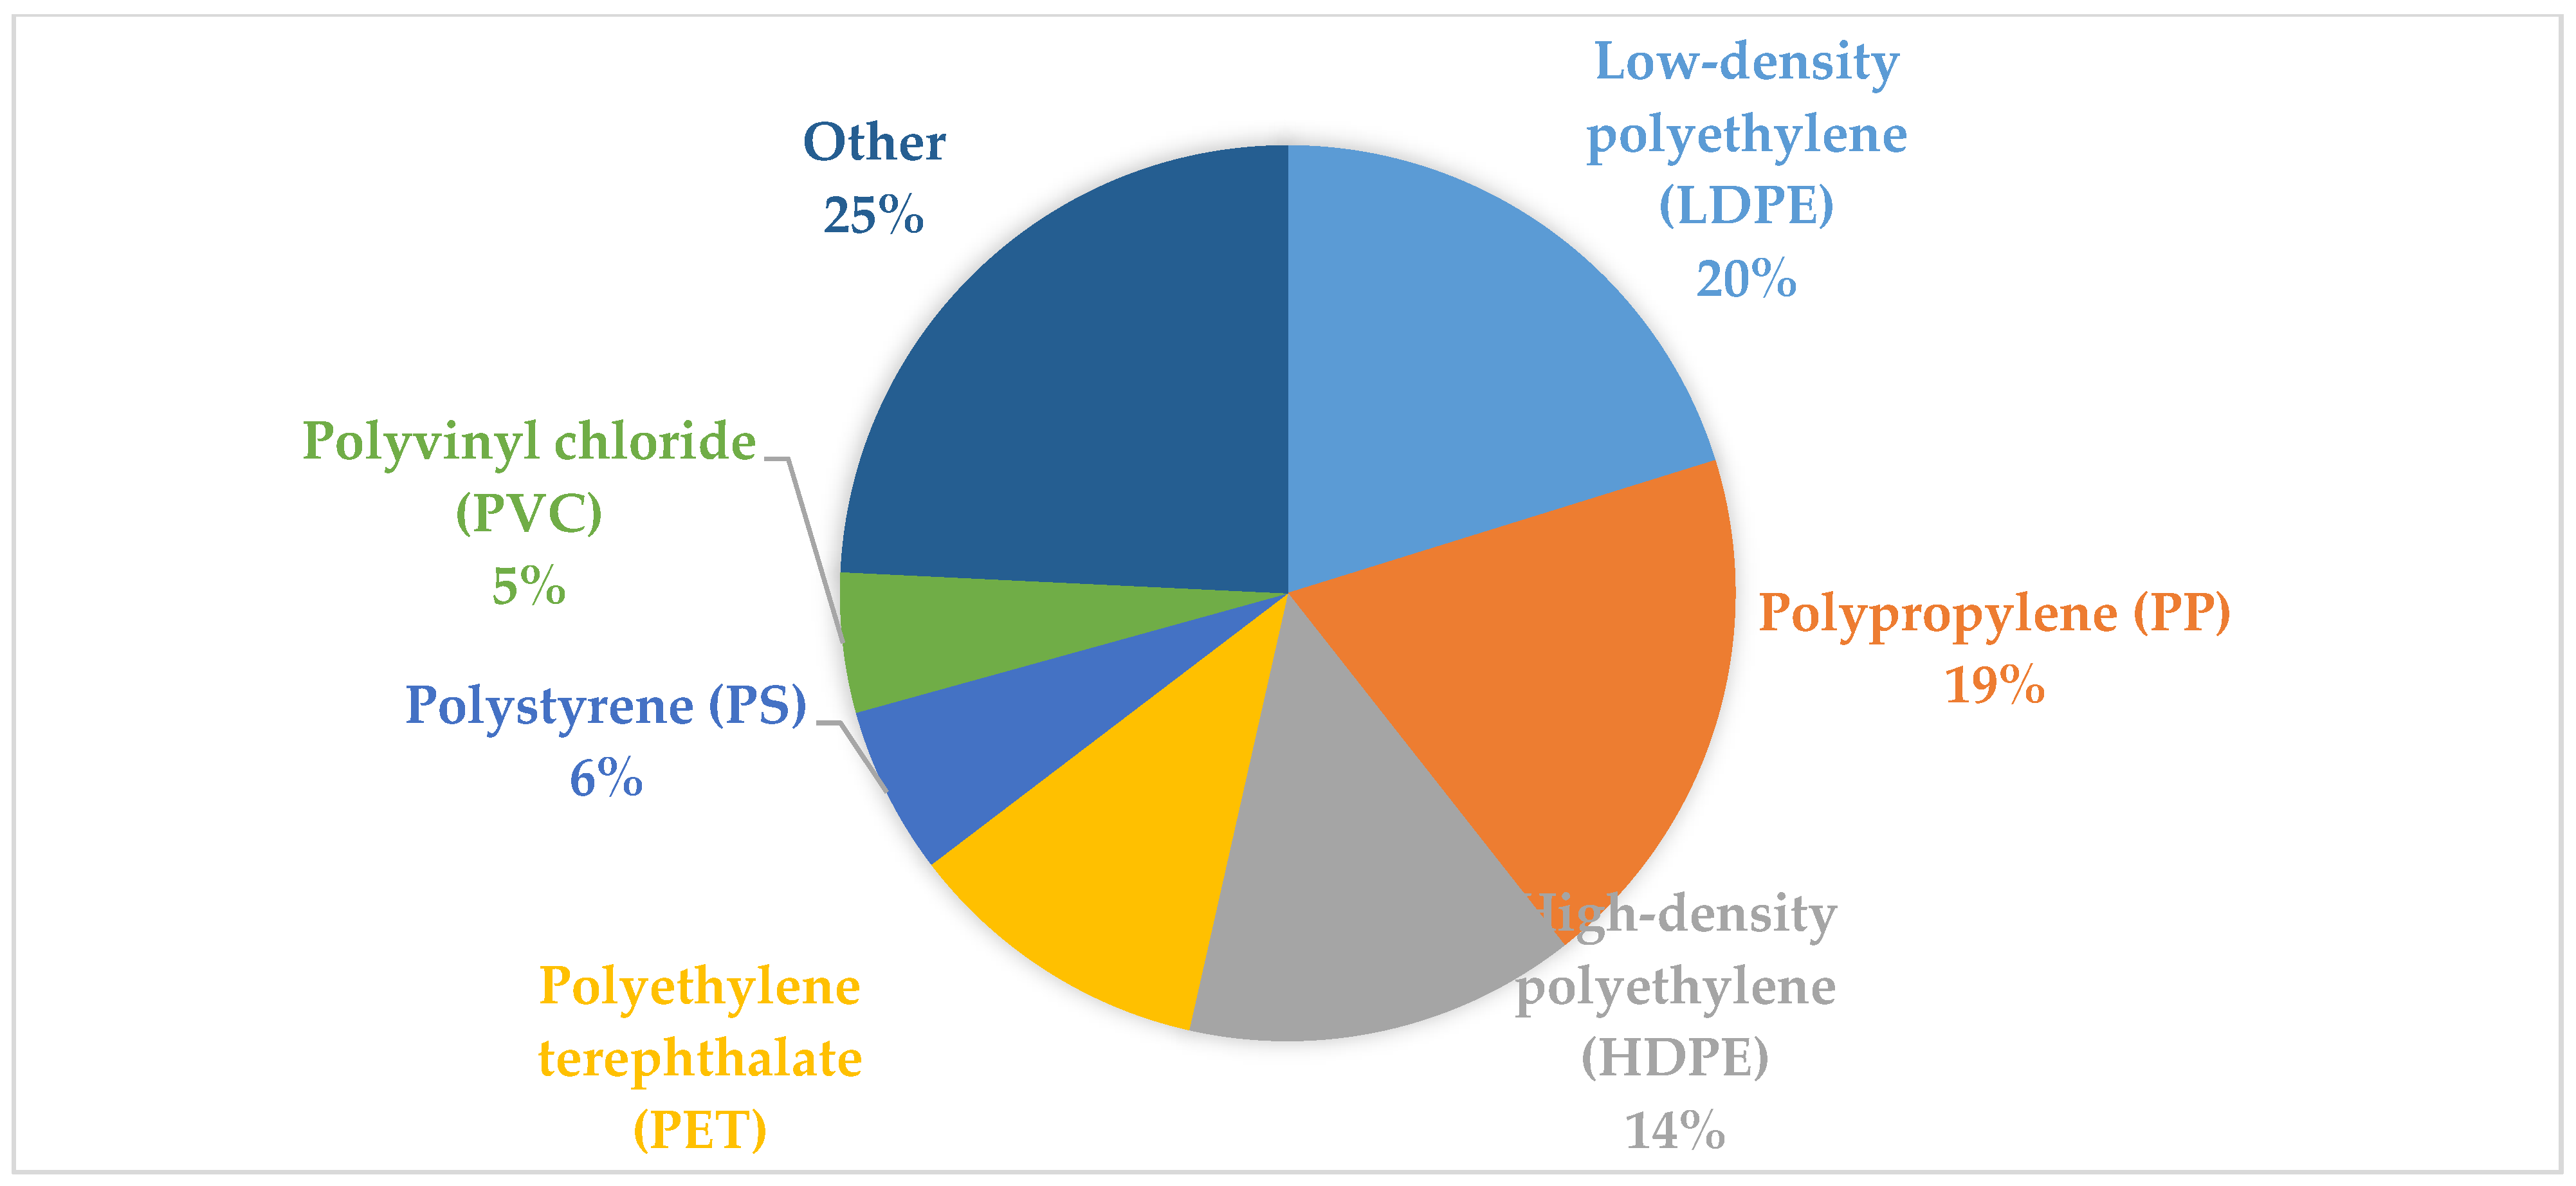
How is all this linked to plastics? Right now, demand for PPEs, which are made from plastic, has outstripped supply in the world. Shield masks have become the most sought-after materials nearly globally, as everybody is trying to obtain at least one PPE. High-quality N95 respirators with high filtering power are in even greater demand. There are also gowns, half-face respirators, masks and full-face respirators with filters, or even carbon fiber filters, which are labeled ‘single-use’, and disposable materials. However, all of these masks, from the simplest to the most complex, are made from a synthetic plastic. For instance, face masks have typically several layers, mainly polypropylene [7], and their demand coupled with a surge in packaged food-delivery business to locked-down households are expected to increase more sharply during the COVID-19 pandemic. Figure 1 shows the distribution of the types of plastic.
It has to be understood that there are multiple sources and channels that result in plastic waste entering our water bodies, such as through erosion of coastal landfills, land drains, sewage, as well as across the surface of the land by wind or water [8]. Plastic waste, including face masks, can also be directly dumped into water bodies by waste management operators or by residents after use. It is equally important that plastic waste, including face masks, should be properly collected and recycled so that they do not end up in our natural environments, especially in the marine environment.
2. COVID-19-Induced Oil Shock and Its Impact on Plastic Recycling Sector
One way COVID-19 will likely affect global plastic recycling is through falling oil prices. Oil is the most important raw material for plastic production. Estimates show that 1 kg of plastic requires about 2 kg of crude oil [9]. Hence, the oil price has a great influence on the plastic price and the profitability of the whole plastic recycling process. Oil prices fell 18.4% (q/q) in 2020 Q1, with a marked deterioration throughout the quarter as the severity of COVID-19 became increasingly apparent [10]. Crude oil prices averaged USD 32/oil barrel (bbl) in March, a decline of 50% compared with January. Prices reached an all-time low in April, with some benchmarks trading at negative levels. Demand for oil has collapsed as a result of COVID-19 mitigation measures, which have dramatically reduced travel and transport, which account for about 2/3 of oil demand [10]. The fall in prices was exacerbated by the collapse of the production agreement between the Organization of the Petroleum Exporting Countries (OPEC) and its partners in early March, and prices failed to rally when a new agreement to reduce production by 9.7 mb/d disappointed markets in April [10]. Several papers have analyzed the correlation between resin price (per ton) and energy price (per barrel), and the outcome has been mixed [9,11]. As shown in Figure 2 below, falling prices of oil tend to drive down prices of recycled markets. In effect, the lower the oil price, the lower the price of recycled plastic, the less profitable the recycling process becomes. In addition, the plunge in crude oil price associated with COVID-19 is putting further downward pressure on the already low price of fossil fuel feedstocks, which reduces the costs of producing virgin resin, which is another challenge for plastic recycling [12].
We provide a review on crude oil and recycled plastic products prices relations that have been identified in the literature, as well as some of their industry focus, methods, and key results. Table 1 provides a summary of them.
3. Methods
3.1. Type of Data and Sources
The paper used secondary time series data, which consisted of annual data for crude oil and recycled plastic price indices for the period 1994 to 2019. This gave a total of 25 observations. The data were sourced and compiled from a varied data repository, such as Bloomberg Intelligence (Bloomberg Intelligence BI PACKG 1098) and FRED (https://fred.stlouisfed.org/series/PCU42993042993042) (Accessed on 6 December 2020).
3.2. Description of Variables
Crude oil is an essential input commodity for the production of plastics, such as low-density polyethylene, polystyrene, and polypropylene, which are part of synthetic polymers, which are derived from oil or gas, and designed to be durable and undergo limited fragmentation [1]. Hence, price movements and fluctuations in prices have a significant effect on the plastic industry. We used crude oil as a proxy for real economic activity and the key component of plastic production. An increase in the price of oil in the international market means lower real economic activity in most sectors. For instance, price changes for fossil fuel preceded price changes for plastics products, implying that petroleum price shocks are passed forward to prices for plastic products [15].
Recycled plastic prices have been volatile, and this has limited recycling capacity, reducing raw recyclates material and restricting growth [12]. While the cost of collecting, sorting, and reprocessing plastic waste is a key factor behind low global recycling rates the prices for virgin plastic and recyclates are closely correlated with the price of oil [12]. The anticipation of crude-petroleum price changes may explain instances in which price changes for plastics preceded changes in petroleum prices [15]. Thus, both time-series data for oil prices and recycled plastic products prices were expressed in percentage growth form by taking the first differences of the natural logarithms of the data.
3.3. Unit Root Test
Economic time series tend to have a strong trend, which causes such series to depict rising or falling patterns and, therefore, are generally non-stationary. Running any regression model without controlling for the non-stationarity problem will yield spurious regression results; that is, such results may appear good but do not make economic sense. Hence, prior to carrying the data analysis for this paper, we first established the presence or absence of unit root. This helped in deciding on the appropriate econometric method to be employed for the estimation. We followed the standard procedure of unit root testing by employing the Augmented Dickey–Fuller (ADF) test developed by Dickey and Fuller [16]. The Augmented Dickey–Fuller test is employed to determine the level or degree of integration of the variables and also to correct for higher-order serial correlation by adding lagged differenced terms on the right-hand side of the equation, as indicated in Equation (1), that is, how many times the variables need to be differenced to attain stationarity. Thus, the ADF test equation is;
where Yt represents the variable in question, T is the trend, k is the lag length, and εt is a random variable assumed to be white noise. This augmented specification is then used to test for the following hypothesis:
Hypothesis 1 (H1).
Yt has a unit root/or non-stationary (H1: γ = 0).
Hypothesis 2 (H2).
Yt has no unit root/or stationary (H2: γ < 0).
3.4. The Johansen Approach Cointegration Test
Additionally, as a requirement for cointegration analysis, the time series data must be tested for series stationarity and establish the order of integration of the individual variables. For cointegration analysis to be valid, all series must be integrated in the same order, usually order one [17].
The Johansen approach cointegration test was used to determine the existence or otherwise cointegration in the series. This approach helps to establish the existence of valid long-run relationships between variables. The Johansen approach cointegration test [18,19] is based on the following vector autoregressive model:
where Zt is an (n × 1) vector of I(1) variables (containing both endogenous and exogenous variables), At is (n × n) matrix of parameters, and μt is (n × 1) vector of white noise errors.
3.5. Results and Discussion
First, we examined the stationarity properties of the series under consideration using the Augmented Dickey–Fuller (ADF) testing procedure. The tests included a trend and an intercept, and the Akaike information criteria were used to select the optimal lag length. The results obtained from the ADF tests indicated that all of the time series are stationary at levels as shown in Table 2. In addition, the ADF statistic showed stationary error terms, at least at the 5% level, further confirming the validity of the model. The Akaike information criteria were used to select the appropriate lag length for a structural vector autoregression (VAR) because it is the least strict in terms of penalizing loss of degrees of freedom. Therefore, in this paper, the two-lag specification was chosen, as shown in Table 3, and the unrestricted Vector Autoregressive (VAR) model was estimated with ordinary least squares. A preliminary result of the cointegration test showed that there is at most one cointegration existing between prices of crude oil and plastic recyclables. Moreover, as shown by the unit root results below, the variables are stationary; hence, a cointegration test is not necessary. Likewise, the results of the pairwise Granger causality tests are shown in Table 4. As can be seen from the Table 4, a probability values <0.05 are considered significant and indicate that oil price and it lags are useful for predicting plastic recycling price.
Due to the volatile nature of oil prices, the use of annual observations allows us to have large information content [20].
3.6. Impulse Response Functions
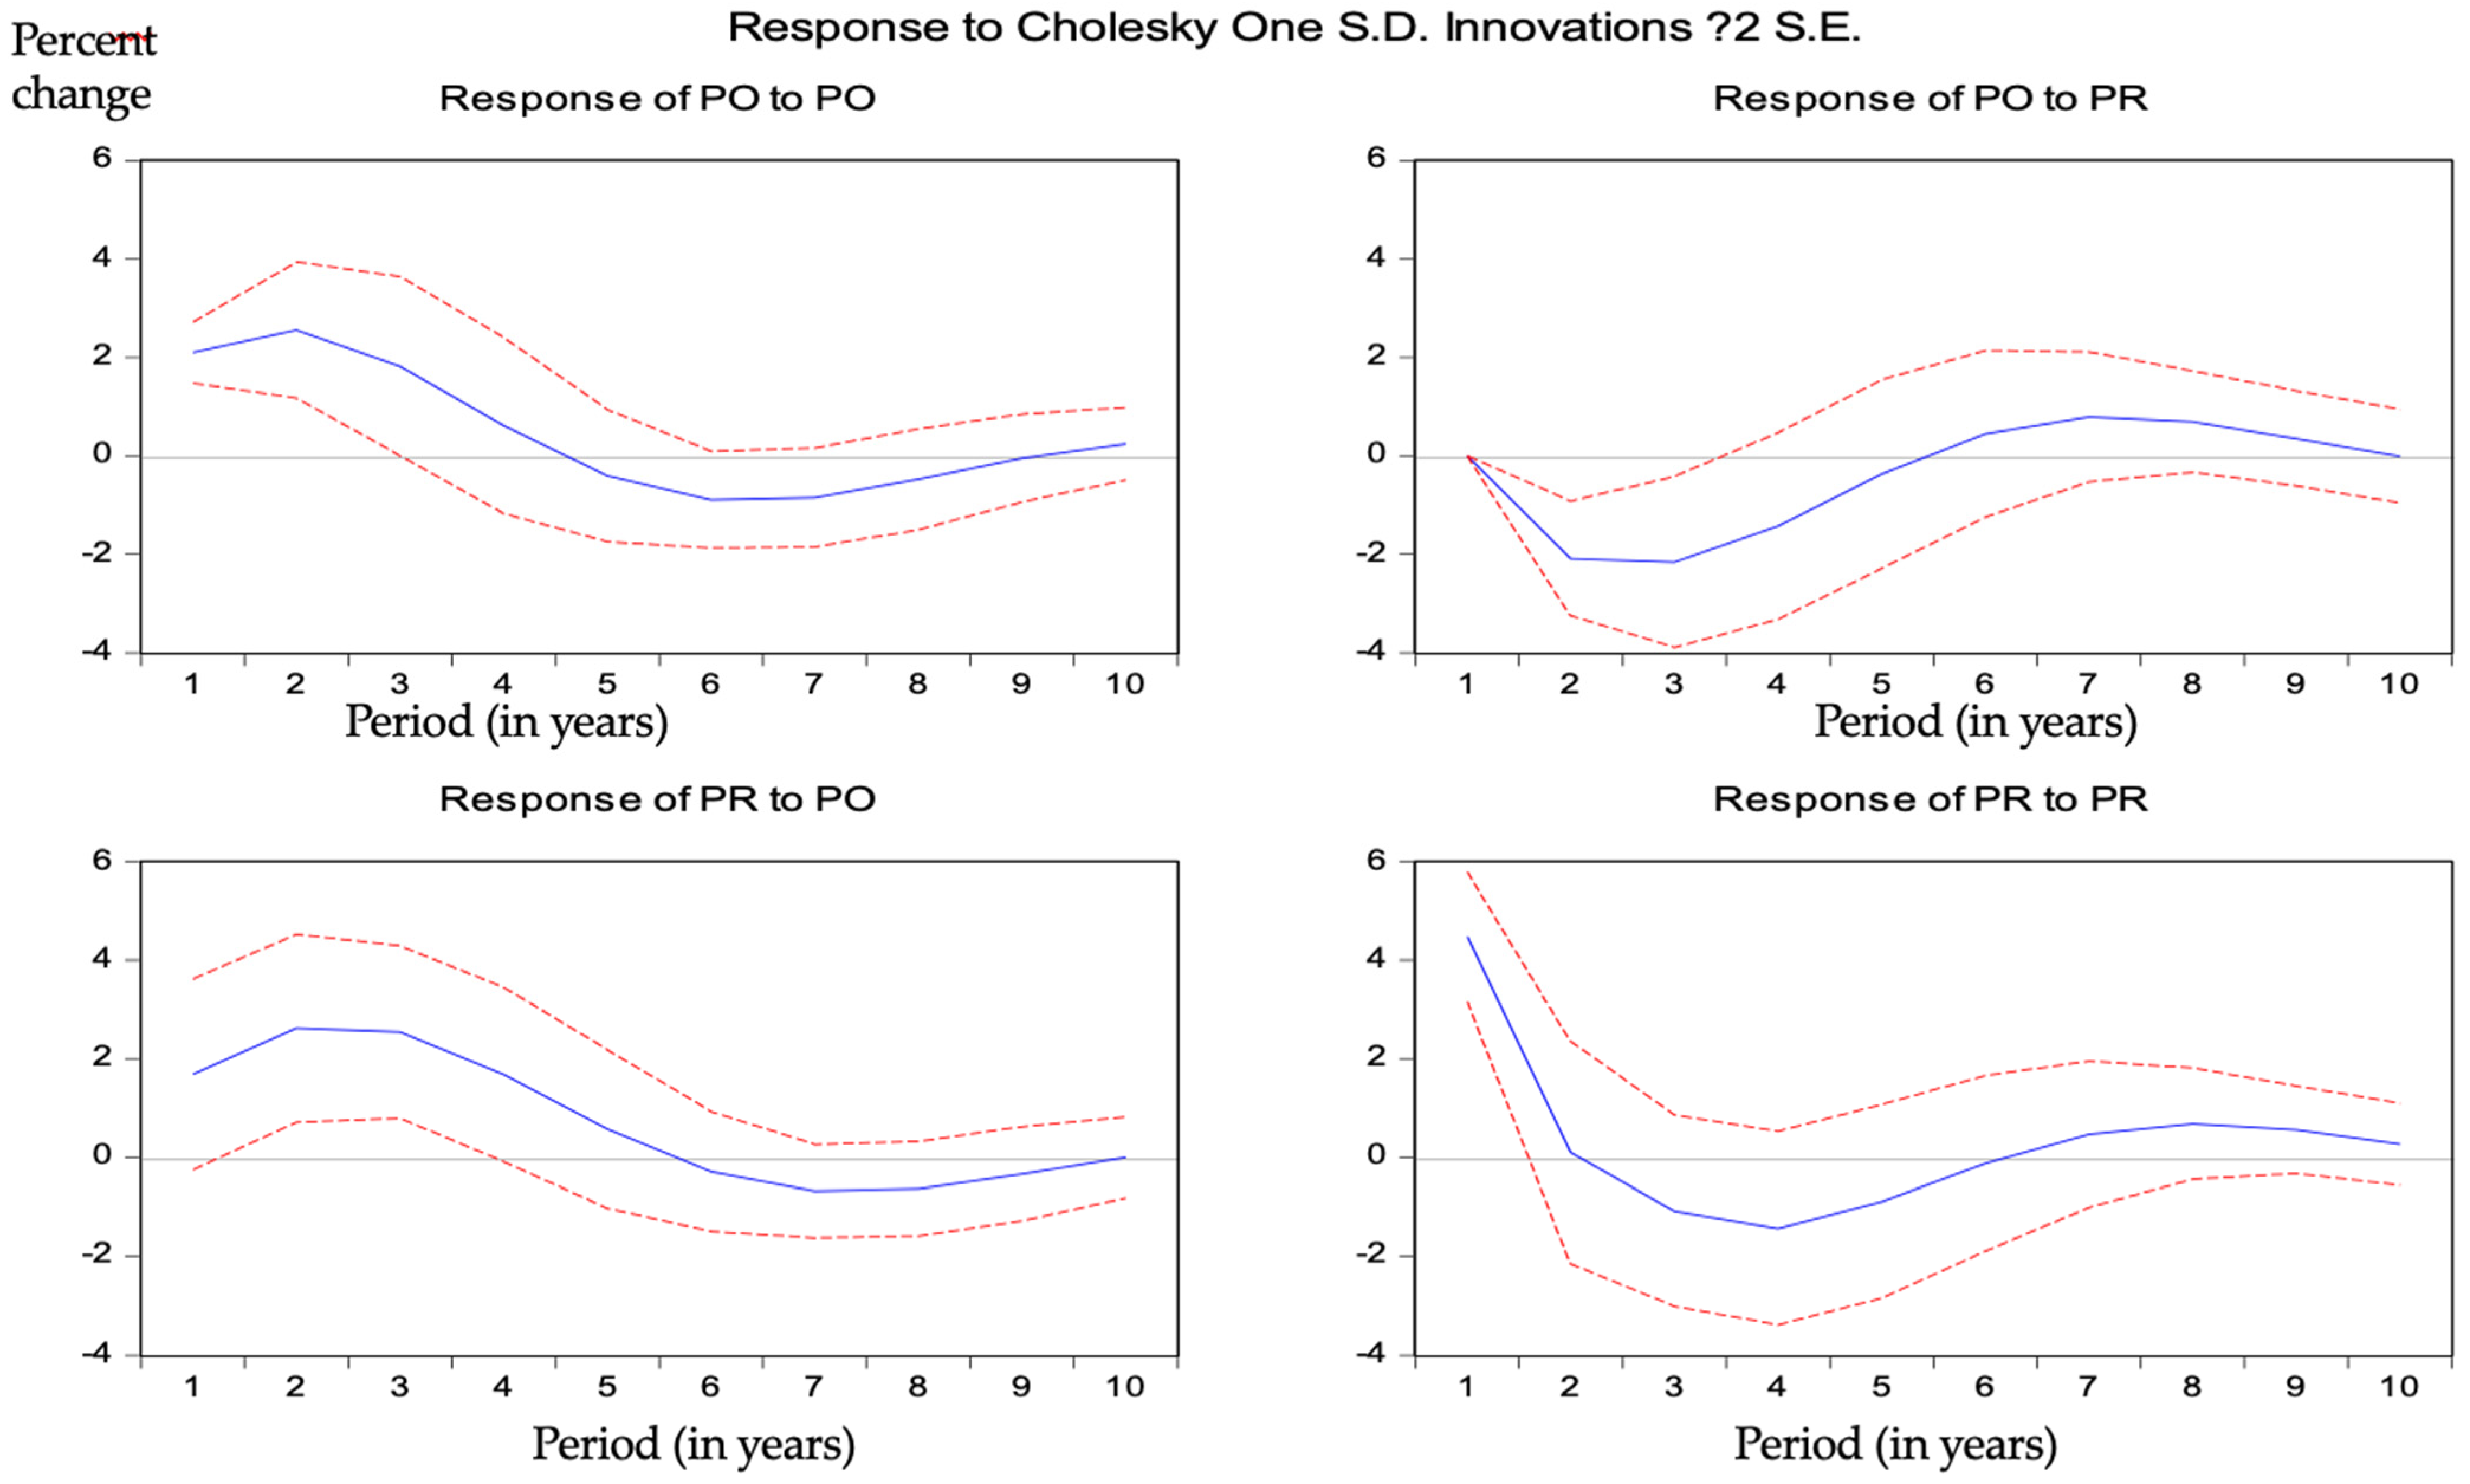
Estimates of the orthogonalized set of residuals and the coefficients from the unrestricted VAR were used to construct accumulated impulse response functions. Impulse response functions measure the dynamic effects of a one-standard-deviation shock to a variable in a system on the current and future values of all variables in the system [21]. An impulse response function is considered significant when its upper band and lower band are both above zero or both below zero [15]. From the impulse response functions, as shown in Figure 3 below, the upper band and lower band of a plastic recyclable price index (PR) to crude oil price (PO) are both above zero, leading to a positive effect at lag 2 and 3, which means that if crude oil price increases, recycling effort also increases after 2 or 3 years.
The impulse response analysis (Figure 3; the response of PR to PO) showed that shocks in oil markets have a significant effect on the changes in the price of recycled plastics. Additionally, recycled plastic markets are influenced by their own shocks and shocks in oil markets. This evidence supports the view that the production agreement between OPEC and its partners as well as political stability in the Middle East oil-producing economies may play a significant role in boosting global plastic recycling efforts.
3.7. Variance Decompositions
The residuals were used to decompose variances. Variance decompositions showed the percentage of variance in the forecast error in one variable of the vector autoregression caused by innovations in the other variables. The variance decompositions after 24 months are presented in Table 5.
The first row of the tabulation shows that only shocks to oil price explain a substantial amount (72 percent) of the variance in the forecast error for oil prices. The last row shows that although innovations to prices for recycled plastics are the most significant factor in explaining the variance in the forecast error for prices of recycled plastic, shocks to the price of crude oil prices account for approximately 33% of the variance.
3.8. Navigating beyond Current Global Commitments to Address Plastic Recycling
In the past few years, more people have argued that plastics should be banned and replaced with other materials because they pose a threat to the environment. The COVID-19 pandemic, which led to the unprecedented production of face masks, which are made from plastic coupled with all-time low oil demand (and prices), has once again triggered efforts to shore up international commitments to reduce plastic waste leakage into the natural environment, especially the marine environment. The section puts pressure on the United Nations (UN) and the European Union (EU) regional partners into historical context by presenting a brief review of previous international commitments, including the earlier EU single-use plastic ban.
3.9. What Has Been the History of Coordinated Efforts to Managed Plastic Waste?
It is well-known that increasing recycling is a way of avoiding the disposal of solid waste [22]. Higher recycling rates address the negative environmental impacts associated with plastic waste, including PPEs, while also is a source of job creation. Financial and economic instruments are applied to encourage proper waste disposal and reuse of materials; this alleviates the marine litter issue, e.g., in the form of incentivizing recycling. Some of these instruments include:
- Deposit-refund schemes
Deposit-refund schemes involve the payment of a deposit upon the purchase of a polluting product (e.g., bottles/cans) that can be refunded once the product or its residues are returned to the seller or established collection point. Such schemes can incentivize the proper handling of waste and recycling [23]. Though limited by consumer preferences (potential increased demand for non-refillable), they can be applied voluntarily by industry but can also be mandatory to encourage recycling [24].
- Subsidies and fiscal incentives
The tax system can be used to subsidize the use of recyclable products [23], while soft loans and subsidies can be used more broadly for the adoption of innovative waste management technologies [25]. Tax breaks for suppliers and manufacturers of recycled plastics help to reduce marine litter in Mauritius [26]. In the same vein, financial and technical supports could be given to recycling companies to facilitate the collection and recycling of PPEs.
- Price differentiation
The possibility of using price differentiation as a tool to boost plastic recycling through a hedonic price model revealed the willingness of consumers to pay a higher price for plastic products with recycled content, which could then be used to finance the collection and transportation of plastic waste and reuse in recycling [27]. There was no empirical support, despite pointing to consumers being willing to pay a higher price for kitchen bags with recycled content [27].
- Business commitments
A number of major public and private commitments to plastic pollution reduction were made between 2016 and 2019. In January 2018, the Ellen MacArthur Foundation, in collaboration with UN Environment Programme, announced at the World Economic Forum in Davos the list of leading brands and grocery outlets that are committed to using 100% reusable, recyclable, or compostable packaging by 2025, together representing more than 6 million tons of plastic packaging per year [28].
The focus of current global commitments is to increase recycling content and reduction of plastic in line with the commitment to “take action to eliminate problematic or unnecessary plastic packaging by 2025”. For example, Unilever is one of the leading signatories pledged to reduce 100,000 Mt of plastic packaging by 2025 over its current volume of 700,000 Mt, which translates into a reduction of 14% [28]. In all, the global commitments signatories contribute to about a 20% reduction of the global plastic packaging market [28]. The double crisis of COVID-19 and marine pollution demand that governments worldwide should make it obligatory for manufacturers and suppliers of PPEs, such as 3M and supermarkets, to disclose their plastic footprints as a guideline for reductions.
Will corporations stay committed? Has the relatively high price of recovered plastic affected the sustainable packaging commitments of leading brands and retailers? Not for now, it seems. With COVID-19 being a great disruptor, considerable additional commitments and effort will be needed to match the unprecedented scale of PPEs production, solve the ecological, social, and economic problems of plastic pollution, and achieve substantial reduction of waste generation through prevention, recycling, and reuse as outlined in the UN SDGs 2030.
4. Conclusions
The study uses the structural VAR model of supply and demand in the plastics market in order to gain insights into price transmission from crude oil to recovered plastics products. The model captures the prices for crude oil and recycled plastics. Impulse response functions and variance decompositions, calculated from the structural VAR, indicate that energy price shocks are transmitted forward to prices for recycled plastics products. Impulse response functions reveal that price of recycled plastics to crude oil price has a positive effect at lag 2 and 3, which means that if the energy price increases, recycling effort also increases after 2 or 3 years.
To mitigate COVID-19-induced plastic waste and ensure sustainable plastic recycling, a number of adjustments in policies and major public and private commitments are needed, including demand-side policy measures, in the form of supporting the establishment of a separate demand for recycled plastics, for example, through the introduction of recycled content labels [12]. However, with tumbling oil prices and the fact that the cost of recycling hinges on the price of oil, it is likely that potential producers of recycled plastics would not invest sufficiently in sorting and recycling capacities because of the limited profitability in the sector; potential manufacturers have limited incentives to use recovered plastics as inputs because of the lower cost of virgin plastics [12]. Market outcomes could improve significantly if manufacturers and suppliers of recycled plastics get support in the form of taxes on the use of virgin plastics or differentiated value-added taxes for recycled plastics [29].
Other financial and economic instruments, such as deposit-refund schemes (involve the payment of a deposit upon the purchase of a polluting product that can be refunded once the product or its residues are returned to the seller or established collection point), can incentivize proper handling of waste and recycling [23,30], including PPEs. Though limited by consumer preferences (potential increased demand for non-refillable), they can be applied voluntarily by industry but can also be mandatory to encourage recycling [24].
Lockdown restrictions have contributed to an increase in the amount of packaging used for the delivery of groceries and food to people. These shifts may aggravate environmental challenges with plastics, which so far existed even before the COVID-19 occurred. Despite the fact that this increase is inevitable, meal-delivery services should integrate reusables for take-out, and delivery should require the creation of ecosystem services (e.g., shared collection points) with supporting products (e.g., low-impact reusable containers).
The study has explored the relationship of recyclate price with recycling rates since the price of oil could dramatically affect the future growth of the recycling sector. Hence, in the medium term, efforts should be made to bring sustained behavioral changes among consumers to practice 5R (reduce, reuse, recycle, refuse, and rethink). In addition, integration of recycled content in plastic products [31] will help minimize the marine plastic challenge. But for now, people should be encouraged not to throw away but selectively collect and recycle PPEs so that they do not end up in our water bodies as plastic waste. Face masks used in health facilities may even be seen as contaminated plastic waste; hence, the government should treat waste management as an essential public service and encourage specialist waste management teams to collect PPEs for mechanical recycling and proper disposal.
Author Contributions
I.I.: Conceptualization, data analysis, writing the original draft, and reviewing. E.W.D.: Reviewing, editing, visualization and validation of results. U.R.S.: Conceptualization, reviewing, editing and supervision. All authors have read and agreed to the published version of the manuscript.
Funding
This research received no external funding.
Data Availability Statement
The datasets generated for this study are available on request to the corresponding author.
Conflicts of Interest
The authors declare no conflict of interest.
References
- Andrady, A.L. Microplastics in the marine environment. Mar. Pollut. Bull. 2011, 62, 1596–1605. [Google Scholar] [CrossRef]
- Geyer, R.; Jambeck, J.R.; Law, K.L. Production, use, and fate of all plastics ever made. Sci. Adv. 2017, 3, e1700782. [Google Scholar] [CrossRef] [Green Version]
- Bermingham, F.; Tan, S.L. Coronavirus: China’s mask-making juggernaut cranks into gear, sparking fears of over-reliance on world’s workshop. South China Morning Post, 12 March 2020. Available online: www.scmp.com/economy/global-economy/article/3074821/coronavirus-chinas-mask-making-juggernaut-cranks-gear (accessed on 20 August 2020).
- McKinsey. The New Plastics Economy—Rethinking the Future of Plastics 2016. Available online: http://www.ellenmacarthurfoundation.org/publications (accessed on 22 August 2020).
- Lebreton, L.; Andrady, A. Future scenarios of global plastic waste generation and disposal. Palgrave Commun. 2019, 5, 6. [Google Scholar] [CrossRef] [Green Version]
- Jambeck, J.R.; Geyer, R.; Wilcox, C.; Siegler, T.R.; Perryman, M.; Andrady, A.; Narayan, R.; Law, K.L. Plastic waste inputs from land into the ocean. Science 2015, 347, 768–771. [Google Scholar] [CrossRef]
- Czigány, T.; Ronkay, F. Editorial corner—A personal view the coronavirus and plastics. eXPRESS Polym. Lett. 2020, 14, 510–511. [Google Scholar]
- Lebreton, L.C.M.; van der Zwet, J.; Damsteeg, J.W.; Slat, B.; Andrady, A.; Reisser, J. River plastic emissions to the world’s ocean. Nat. Commun. 2017, 8, 15611. [Google Scholar] [CrossRef]
- Rudolph, N.; Kiesel, R.; Aumnate, C. Understanding Plastics Recycling: Economic, Ecological, and Technical Aspects of Plastic Waste Handling; Carl Hanser Verlag: Munich, Germany, 2017; pp. 15–114. [Google Scholar]
- World Bank. Commodity Markets Outlook: Implications for COVID-19 for Commodities; The World Bank: Washington, DC, USA, 2020. [Google Scholar]
- Stromberg, P. Market imperfections in recycled markets: Conceptual issues and empirical study of price volatility in plastics. Resour. Conserv. Recycl. 2004, 41, 339–364. [Google Scholar] [CrossRef]
- OECD. Improving Markets for Recycled Plastics: Trends, Prospects and Policy Response; OECD Publishing: Paris, France, 2018. [Google Scholar] [CrossRef]
- Angus, A.; Casado, M.R.; Fitzsimons, D. Exploring the usefulness of a simple linear regression model for understanding price movements of selected recycled materials in the UK. Resour. Conserv. Recycl. 2012, 60, 10–19. [Google Scholar] [CrossRef] [Green Version]
- WRAP. UK’s Recovered Plastic Prices 2008. Available online: www//wrap.org.uk/content/plastic (accessed on 2 July 2020).
- Weinhagen, J.C. Price transmission: From crude petroleum to plastics products. Mon. Labor Rev. 2006, 4, 46–55. [Google Scholar]
- Dickey, D.A.; Fuller, W.A. Distribution of the estimators for autoregressive time series with a unit root. J. Am. Stat. Assoc. 1979, 74, 427–431. [Google Scholar]
- Granger, C.; Newbold, P. Spurious regressions in econometrics. J. Econom. 1974, 2, 111–120. [Google Scholar] [CrossRef] [Green Version]
- Johansen, S.; Juselius, K. Maximum likelihood estimation and inference on cointegration—with applications to the demand for money. Oxf. Bull. Econ. Stat. 1990, 2, 169–210. [Google Scholar] [CrossRef]
- Johansen, S.; Juselius, K. Testing structural hypotheses in a multivariate cointegration analysis of the PPP and the UIP for UK. J. Econom. 1992, 1, 211–244. [Google Scholar] [CrossRef]
- Campos, J.; Ericsson, N.R. Constructive data mining: Modeling consumers’ expenditures in Venezuela. Econom. J. 1999, 2, 226–240. [Google Scholar] [CrossRef]
- Johnston, J.; Dinardo, J. Econometric Methods, 4th ed.; McGraw Hill: New York, NY, USA, 1997; pp. 299–300. [Google Scholar]
- Acuff, K.; Kaffine, D. Greenhouse gas emissions, waste and recycling policy. J. Environ. Econ. Manag. 2013, 65, 74–86. [Google Scholar] [CrossRef]
- McIlgorm, A.; Campbell, H.F.; Rule, M.J. The economic cost and control of marine debris damage in the Asia-Pacific region. Oc. Coast. Manag. 2011, 54, 643–651. [Google Scholar] [CrossRef]
- Ferrara, I.; Plourde, C. Refillable versus non-refillable containers: The impact of regulatory measures on packaging mix and quality choices. Resour. Policy 2003, 29, 1–13. [Google Scholar] [CrossRef]
- Williams, C. Combating marine pollution from land-based activities: Australian initiatives. Ocean Coast. Manag. 1996, 33, 87–112. [Google Scholar] [CrossRef]
- Lane, S.B.; Ahamada, S.; Gonzalves, C.; Lukambuzi, L.; Ochiewo, J.; Pereira, M.; Rasolofojaona, H.; Ryan, P.; and Seewoobaduth, J. Regional Overview and Assessment of Marine Litter Related Activities in the West Indian Ocean Region (WIOMSA Report to the United Nations Environment Programme). 2007. Available online: https://wedocs.unep.org/bitstream/handle/20.500.11822/8764/-A%20Regional%20Overview%20%26%20Assessment%20of%20Marine%20Litter%20Related%20Activities%20in%20the%20%20Western%20Indian%20Ocean%20Region-2007Regional_assessment_of_marine_litter_WIO_Region.PDF?sequence=3&isAllowed=y (accessed on 14 February 2020).
- Anstine, J. Consumers’ willingness to pay for recycled content in plastic kitchen garbage bags: A hedonic price approach. Appl. Econ. Lett. 2000, 7, 35–39. [Google Scholar] [CrossRef]
- Ellen MacArthur Foundation. Global Commitment 2019 Progress Report (2019). Available online: https://www.newplasticseconomy.org/about/publications/global-commitment-2019-progress-report (accessed on 15 December 2020).
- Hopewell, J.; Dvorak, R.; Kosior, E. Plastics recycling: Challenges and opportunities. Philos. Trans. R. Soc. B 2009, 364, 2115–2126. [Google Scholar] [CrossRef] [Green Version]
- Abbott, J.K.; Sumaila, U.R. Reducing marine plastic pollution: Policy insights from economics. Rev. Environ. Econ. Policy 2019, 13, 327–336. [Google Scholar] [CrossRef] [Green Version]
- Issifu, I.; Sumaila, U.R. A review of the production, recycling and management of marine plastic pollution. J. Mar. Sci. Eng. 2020, 8, 945. [Google Scholar] [CrossRef]
Figure 1.
Distribution of plastic waste worldwide in 2015, by the type of plastic and an expected increase in demand due to COVID-19. Note: Other includes polycarbonate, Teflon, acrylonitrile, butadiene styrene. (Data source: National Geographic; Various sources (ASTM International, Association of Plastic Recyclers, Roland Geyer, University of California). Available online: https://0-www-statista-com.brum.beds.ac.uk/statistics/893594/plastic-waste-share-worldwide-by-type/) (accessed on 14 November 2020).

Figure 2.
Recycled price index and crude oil price. Recycled plastic price tends to be positively correlated with the crude oil price. COVID-19 lockdowns hit oil and gas inputs, leading to the collapse of global demand for fossil fuels. As a result, oil prices dropped, making the manufacture of virgin plastics from petroleum less expensive than recycling. Hence, prices of recycled plastics are likely to plummet. (Data source: St Louis Fed Research. Available online: https://fred.stlouisfed.org/series/DCOILWTICO) (accessed on 12 December 2020).
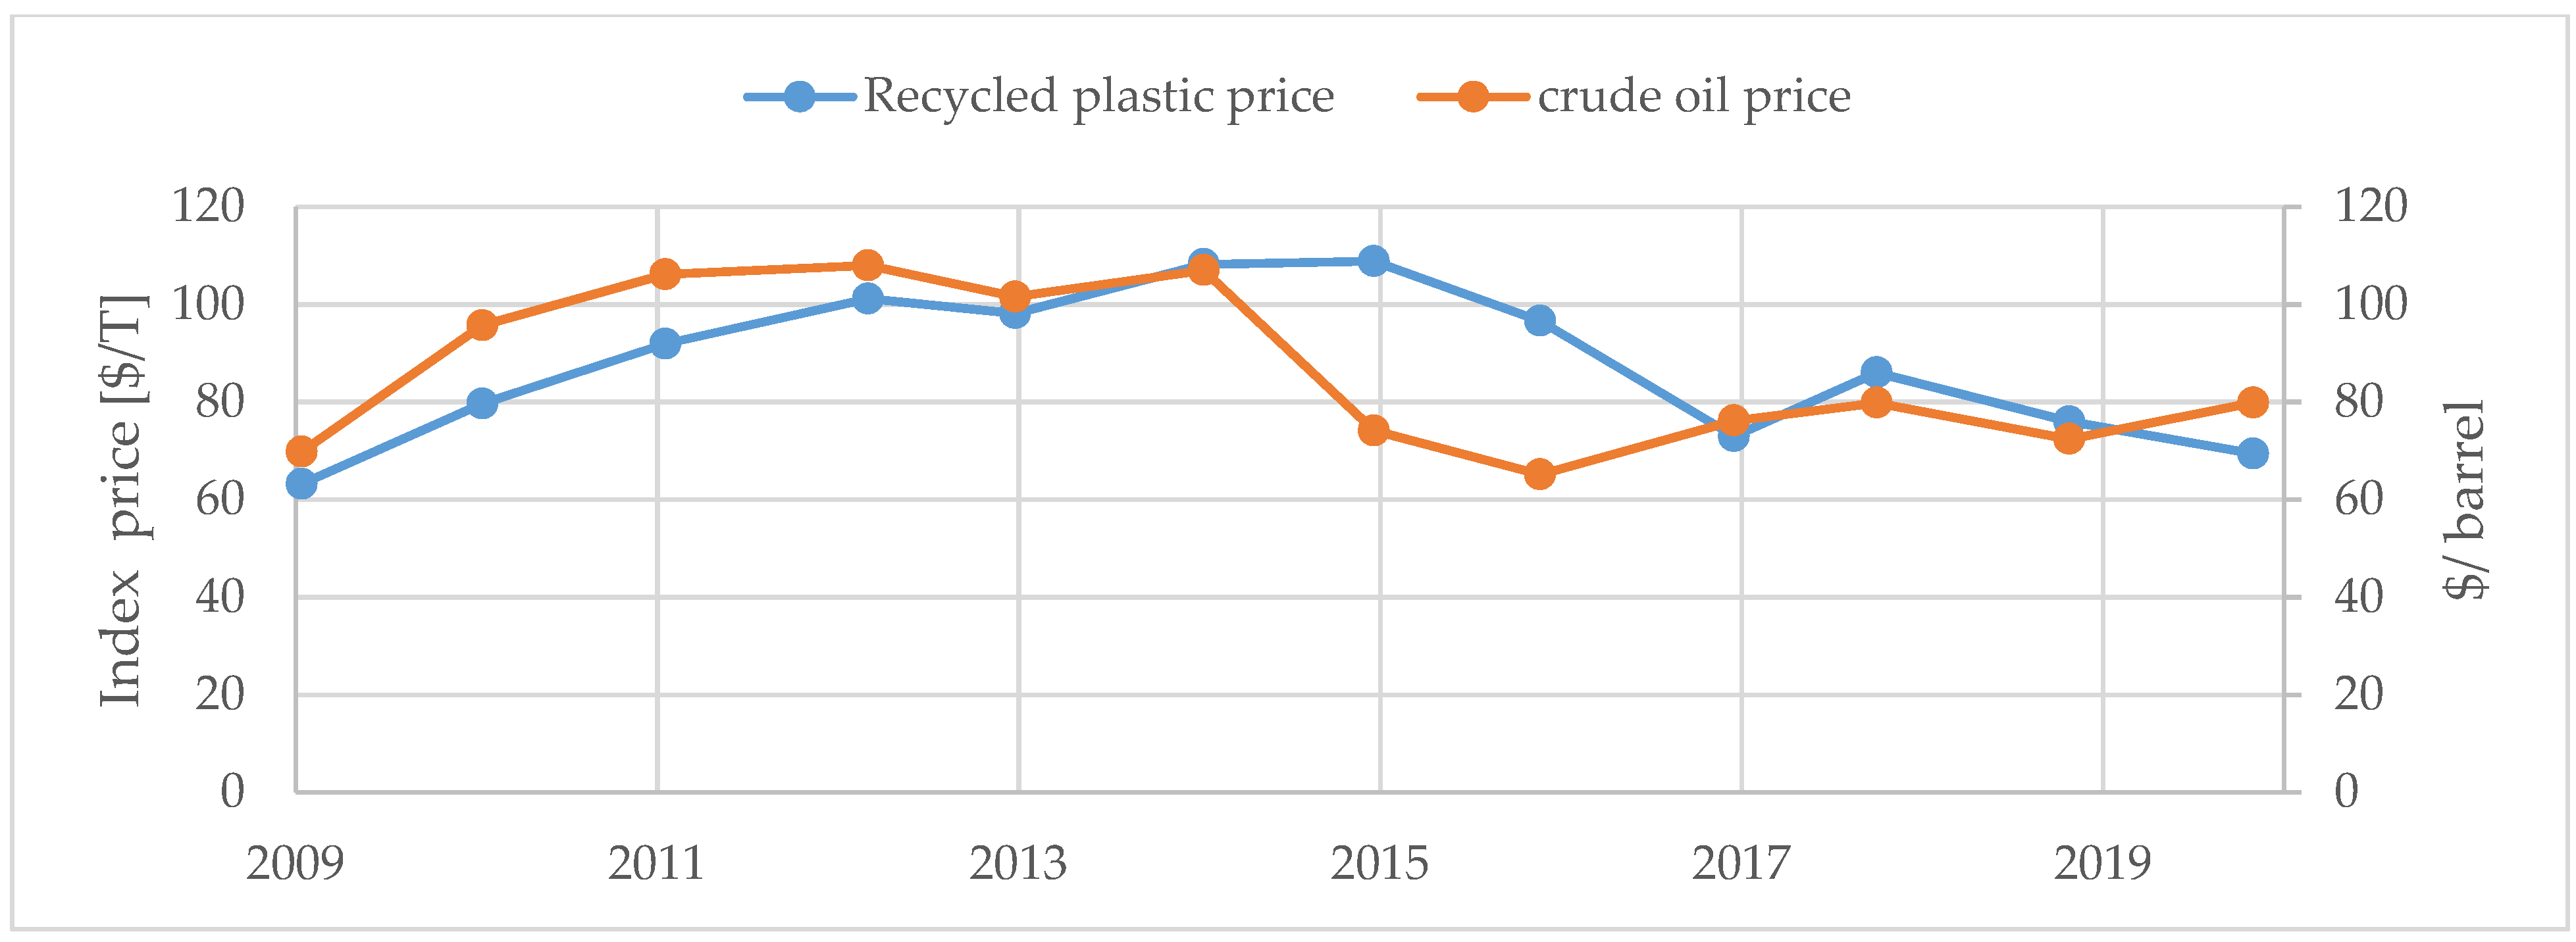
Figure 3.
Impulse response functions. Note: PR denotes the price of recycled plastic; PO represents the price of crude oil. An impulse response function is considered significant when its upper band and lower band are both above zero or both below zero. Here, the upper band and lower band of a plastic recyclable price index (PR) to crude oil price (PO) are both above zero, leading to a positive effect at lag 2 and 3, which means that if crude oil price increases, recycling effort also increases after 2 or 3 years if all things been equal.

Table 1.
Literature review on oil and primary and secondary plastic products prices relations.
| Industry Focus | Data | Method | Results | Reference |
|---|---|---|---|---|
| UK recycled plastic market | Recycled price data from letsrecycle.com | Regression model | Since 2004, the prices of crude oil and recycled plastics are linked | [13] |
| UK’s recovered plastic prices | Virgin, recycled PET, and HDPE data | Scenarios analysis | Recycled plastic is closely linked to the price of virgin plastic | [14] |
| US’s crude oil and plastic products markets | US’s producer price indexes for crude oil and plastics products | Vector autoregression model | Changes in crude oil prices are passed on to prices of plastics products | [15] |
| US’s price volatility in recyclables markets | Recyclables price data in Seattle (US) | Regression analysis | The supply of recycled materials is price inelastic because they are driven by law or taste | [11] |
Table 2.
Descriptive statistics and Unit Root results for crude oil and recyclates prices.
| Variable | Mean | Range | Standard Deviation |
|---|---|---|---|
| Recyclates price index (PR) | 102 | (±12.9) | 10 |
| Crude oil price (PO) | 68 | (±14.0) | 8 |
| N = 25 | |||
| Variable | Augmented Dickey–Fuller | Probability | |
| Recyclates price index (PR) | −3.8359 | 0.0083 | |
| Crude oil price (PO) | −5.0305 | 0.0005 | |
Source: Author’s calculation based on research data. Note: one-sided p-values.
Table 3.
VAR lag selection criteria.
| Lag | LogL | LR | FPE | AIC | SC | HQ |
|---|---|---|---|---|---|---|
| 0 | −112.9128 | NA | 335.5231 | 11.49128 | 11.59085 | 11.51072 |
| 1 | −72.14838 | 69.29948 | 8.530479 | 7.814838 | 8.113558 | 7.873151 |
| 2 | −58.64135 | 20.26054 * | 3.353593 * | 6.864135 * | 7.362001 * | 6.961324 * |
| 3 | −56.17281 | 3.209110 | 4.068610 | 7.017281 | 7.714293 | 7.153345 |
| 4 | −53.49429 | 2.946372 | 5.015211 | 7.149429 | 8.045588 | 7.324368 |
| 5 | −49.61086 | 3.495081 | 5.805800 | 7.161086 | 8.256392 | 7.374901 |
Note: * shows a two-lag specification.
Table 4.
Results of Pairwise Granger Causality Tests.
| Null Hypothesis: | Obs | F-Statistic | Prob |
|---|---|---|---|
| PR does not Granger Cause PO | 23 | 9.03292 | 0.0019 |
| PO does not Granger Cause PR | 23 | 6.33788 | 0.0082 |
Table 5.
Variance decomposition.
| S.E. | PO | PR | |
|---|---|---|---|
| PO | 3.91101 | 71.5169 | 28.4830 |
| PR | 5.45317 | 32.5859 | 67.4141 |
Publisher’s Note: MDPI stays neutral with regard to jurisdictional claims in published maps and institutional affiliations. |
© 2021 by the authors. Licensee MDPI, Basel, Switzerland. This article is an open access article distributed under the terms and conditions of the Creative Commons Attribution (CC BY) license (https://creativecommons.org/licenses/by/4.0/).
Share and Cite
MDPI and ACS Style
Issifu, I.; Deffor, E.W.; Sumaila, U.R. How COVID-19 Could Change the Economics of the Plastic Recycling Sector. Recycling 2021, 6, 64. https://0-doi-org.brum.beds.ac.uk/10.3390/recycling6040064
AMA Style
Issifu I, Deffor EW, Sumaila UR. How COVID-19 Could Change the Economics of the Plastic Recycling Sector. Recycling. 2021; 6(4):64. https://0-doi-org.brum.beds.ac.uk/10.3390/recycling6040064
Chicago/Turabian StyleIssifu, Ibrahim, Eric Worlanyo Deffor, and Ussif Rashid Sumaila. 2021. "How COVID-19 Could Change the Economics of the Plastic Recycling Sector" Recycling 6, no. 4: 64. https://0-doi-org.brum.beds.ac.uk/10.3390/recycling6040064