1. Introduction
Although concrete is one of the most versatile and durable construction materials, premature deterioration presents a significant challenge to the individuals responsible for the inspection and maintenance of concrete elements [
1]. On the other hand, advances in signal processing, combined with the development of efficient numerical algorithms and an increased access to powerful computers, have made it practical to implement imaging technology into non-destructive testing (NDT) of reinforced and prestressed concrete structures, among others. Various NDT technologies are being developed all over the world for the use in the field of reinforced and prestressed concrete structures. These NDT methods range from hammer sounding tests to advanced methods such as Ground Penetrating Radar (GPR) [
2]. As advanced NDT methods like radar, ultrasonic and sonic methods are mainly suited for the detection and characterization of inhomogeneities deeper than 5 to 10 cm, active thermography closes the gap for testing the near surface region between the surface and a depth of 10 cm [
3].
The use of IRT as a means of structural health monitoring has significantly increased in recent years, due in large part to the advancement of IR cameras and the considerable reduction in their cost [
1]. Even though in the inspection of metals, infrared thermography (IRT) is an accepted practice, in the field of reinforced and prestressed concrete, the use of active IRT is relatively new. Additionally, the slow development of IRT for concrete is because, unlike metals and ceramics, concrete is a highly inhomogeneous composite material on a macroscopic level with varying composition and different raw materials. For example, whereas grain sizes in steel are usually smaller than 1 mm, coarse aggregates in concrete are several centimeters in size. Apart from precast concrete units that, like steel products, are fabricated at a plant, most concrete is produced in relatively small ready-mixed concrete plants and delivered to the construction site. Placing, consolidation, and curing of concrete takes place in the field using labor that is relatively unskilled. The resulting product is, by its very nature and construction method, highly variable and does not lend itself to testing by traditional non-destructive methods as easily as steel products [
4].
The development of an IR imaging system for reinforced concrete
in-situ applications poses challenges that are not present in many other applications. A practical IRT system for imaging of concrete structures should be portable, rugged, and easily adaptable to a variety of geometries. In addition, the properties of concrete make it particularly difficult to image [
5], compared to metals concrete has low thermal conductivity and is thermally inert which means that it takes a lot of energy to manipulate its temperature change,
i.e., initiate heat flow in order to use active IRT to detect and/or characterize defects in concrete structures. One has to also consider the dimensions of concrete structures as well as defects occurring in such structures when using IRT [
6,
7].
Despite the above drawbacks, there has been progress in the development of IRT methods and techniques for testing reinforced and prestressed concrete structures.
IRT has proved to be an effective, convenient, and economical method for testing concrete. It can detect internal voids, delaminations, and cracks in concrete structures such as bridge decks, highway pavements, garage floors, parking lot pavements, building walls,
etc. As a testing technique, some of its most important qualities are that: (1) it is accurate; (2) it is repeatable; (3) it does not need to inconvenience the public; and (4) it is economical [
8].
The goal of this review is to provide an overview on the state-of-the-art regarding the use of active IRT for detection and characterization of defects in reinforced and prestressed concrete structures.
IRT investigation techniques are based on the fundamental principle that subsurface anomalies in reinforced concrete, such as voids caused by corrosion on reinforcing steel, or voids caused by poor concrete consolidation called honeycombing, or pooling fluids such as water infiltration, in a material affect heat flow through that material. These changes in heat flow cause localized differences in surface temperature. Thus, by measuring surface temperatures under conditions of heat flow into or out of the material, one can determine the presence and location of any subsurface anomalies [
8].
The only precondition for the detection is that defects within the object under examination lead to a sufficient variation of the temperature, compared to the bulk material [
9]. It is well known that IRT has certain limitations when low thermal conductivity materials comprising deep defects are being tested, but at the same time IRT was proven useful when used in conjunction with NDT methods that enable detection of deeper defects [
10].
While there have been many studies focused on detecting defects in reinforced concrete structures, the problem of defect quantification in cementitious materials like reinforced concrete structures was tackled only by few researcher groups. Many safety-relevant cases of damage in concrete structures originate from defects that are close to the surface, e.g., voids and honeycombing in the top layer of reinforcement, delaminations of carbon-fiber-reinforced plastic (CFRP) laminates used for strengthening of concrete structures, delaminations of protective coating systems as well as surface and subsurface cracks [
3]. Therefore, active thermography is very well suited for condition assessment, damage evaluation and quality assurance of the built infrastructure. The purpose of this paper is to provide an overview on the state-of-the-art regarding the use of active IRT for detection and characterization of defects in reinforced concrete. It was realized that there is much knowledge available in the literature that can be gathered in one review paper. Nevertheless, research groups often start from scratch, dealing with the same problems that were already investigated. This paper would thus provide a starting point for future researchers, giving them viable directions of research in the field of IRT in concrete structures. This work also presents the fields of applicability of IRT with a focus on the aspects related to reinforced concrete structures, as well as the advantages, limitations and potential sources of errors of active IRT employment. Additionally, previous NDT studies that employed IRT techniques using natural excitation are shortly presented. Several research groups have tackled the issues of the comparison of the IRT results with other NDT methods, in order to increase the acceptance of IRT as viable NDT method for concrete structures. Even though good progress in IR data processing is evident (as described in
Section 5), there is an overall lack of understanding on the quantification of defects in concrete structures (
Section 6). The authors view on the future work needed for IRT to become the mainstream NDT method is discussed in
Section 7. This includes accuracy, repeatability, ease and speed of data collection and analysis, as well as the cost of data collection using IRT on concrete structures.
2. IR Thermography Using Natural Excitation Sources
In the case of IR inspection of highway bridges, the driving force for heat transfer is the environment surrounding the bridge. For a bridge deck, the sun provides a significant source of the energy to heat the surface of the concrete via radiant heating, such that the surface of the concrete deck may be warmer than the ambient temperature surrounding the deck [
11,
12,
13]. Significant thermal gradients can be developed from this radiant heating, and the potential to utilize this effect for the purpose of detecting subsurface damage has a long history [
11,
13,
14,
15,
16,
17,
18,
19].
IRT under natural excitation sources, has been used in civil engineering for the last 40 years. The method has been applied to the identification of internal voids, delaminations, and cracks in concrete structures such as bridge decks highway pavements parking garages, pipelines and other applications [
10,
20,
21,
22]. The ASTM standard [
23] for detecting delaminations in concrete bridge decks using IRT was developed. This standard defines restrictions and limitations of the method, together with required proper environmental conditions present for testing, varying environmental conditions during testing (temperature gradient, shaded or direct sunlight, cloud cover and surface water). Bridge decks receive significant attention because the decks typically require repair sometime during the service life of a bridge, frequently due to corrosion-induced delaminations that develop [
24].
The main advantage of natural excitation is that it is both cheap and an environment-friendly technique which provides a perfectly even heating. Disadvantages include relatively low available heating power and the dependence to weather conditions, to surface orientation, and to the color of the concrete, as the sun mainly heats in visible light. The authors of this paper conducted testing using IR thermography of bridge decks during condition assessment of several bridges (
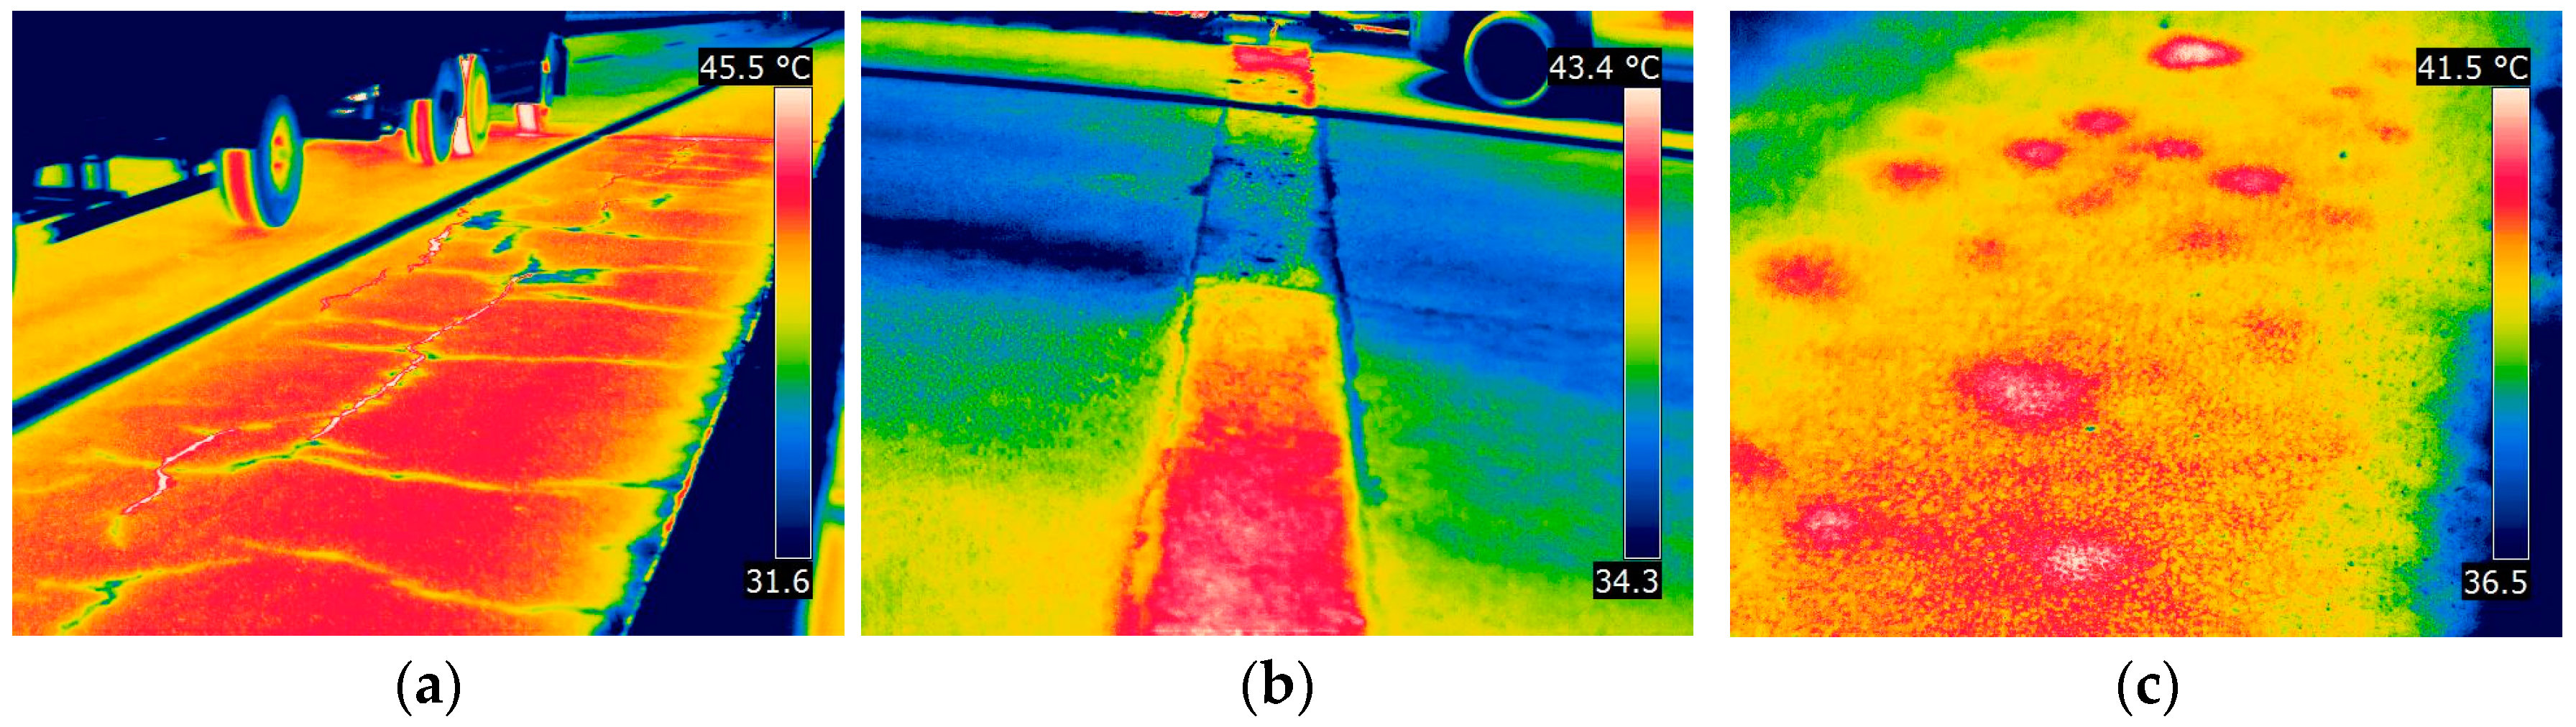
Figure 1).
Although existing defects (cracks and inclusions) on the pavement of the bridge deck were visible from the thermograms presented in
Figure 1, it is evident that there is an impact of the emissivity change on the surface even though the whole surface is of the same material (
Figure 1b). These problems occur due to the ruts, accumulated rubber, and slight changes in the surface color, together with road markings.
Additionally, for the defects visible in
Figure 1c, only qualitative analysis is possible, while the quantitative characteristics (size and depth) cannot be determined without having the additional information about heating power of the Sun on the bridge surface, thermal properties of the material, characteristics of the camera optics, viewing angle,
etc. to be able to determine the diameter of the defects, as well as their depth and/or thickness. This leads to the practical issue, namely, it is not possible to determine whether the defects shown in
Figure 1c are located in the asphalt layer (and if so, is it in the asphalt wearing of asphalt base layer, or both), concrete bridge deck, or whether the problem occurred on the interface of layers. It has also been proven that testing is possible only with direct sunlight on the surfaces in question; furthermore, one needs to achieve transient conditions while testing. If transient conditions are not achieved, it has proved difficult, if not impossible to determine the existence of defects in concrete [
26].
There are contradictory reports regarding appropriate time window for IR measurements. Some researchers recommend daytime measurements (4 to 9 h after sunrise) for solar loading part [
12] while it was mentioned in SHRP2 report [
27] that thermal image of fabricated deck recorded 40 min after sunrise yielded much clearer image than that recorded about noontime. Hiasa
et al. [
28] conducted an experimental study to determine the most thriving time window to collect useful data from an object by using an IR camera. Hiasa
et al. [
28] state that if the difference between damaged and sound part is the only concern, then daytime would be an ideal time window for IR thermography. If IRT is used for deck inspection during daytime, there is a possibility to miss some of delaminated parts of the deck, and there will be a lot of noise in the thermal images, which makes it difficult to detect anomalies in the subsurface. However, due to the significant variations of the concrete temperature (affected by the sun loading and the color of the surface during daytime), Hiasa says that ideal time for IRT inspection of concrete would be during nightime. This is because temperature differences during nighttime are very stable, even though the differentials are very small, below 0.5 °C but without troublesome noise. In addition to ambient temperature conditions, Hiasa
et al. [
28] indicated that camera specifications such as thermal sensitivity, resolution, and detector type might also affect the accuracy. Thus, it is also necessary to establish optimal specifications for an IR camera before any inspection works take place. It was found in the research [
28] that thermal sensitivity and pixel resolution do not affect IR inspection so much compared to detector type or spectral range of the cameras.
The investigation of Scott
et al. [
1] confirmed that, under ideal conditions in Johannesburg during the winter solstice, IRT using natural excitation is capable of detecting internal defects up to a depth of 65 mm below the surface of vertical north facing surfaces. For optimum results it was recommended that IRT inspections should be conducted when little or no wind and cloud cover are present, defects up to a depth of 20 mm could be detected even with the presence of wind and cloud cover. Contrary to [
28], Scott
et al. [
1] recommend that inspections should be conducted after maximum solar loading has been reached in order to accommodate for thermal lag through the concrete and allow for large thermal contrasts to develop. This investigation also showed that steel reinforcement had little influence on the thermal contrast, created by internal defects, on the surface of a concrete element [
1].
Washer
et al. [
24] published a paper which reports on the research conducted to develop guidelines for applying IRT for the inspection scenario when concrete bridge components are in shaded conditions that typically exists below a bridge. As a result, even though direct radiant heating of the sun is unavailable, shaded bridge components heat up and cool down through convective heat transfer with the surrounding environment. For example, as daytime temperatures increase, the concrete temperature also increases during the course of the day, although these increases are delayed relative to the ambient temperature changes due to the thermal mass of the concrete. However, thermal gradients occurring in such a way are much smaller than those that would be imposed by radiant heating from the sun. This is further complicated by the fact that the heat transfer is varying over time, throughout the day, and from day to day. Additionally it can be expected that wind speed will affect the rate at which heat is transferred from the environment to the concrete even though Washer
et al. point out in their guidelines that high wind speeds are not necessarily detrimental to the development of thermal contrast in shaded conditions [
24].
A further complication for both bridge decks and soffits is that the depth of the defect (delamination) will affect both the magnitude of the thermal contrast and the time required for that contrast to develop. Deeper defects will appear later in time and with less contrast than shallow defects, and as such, the time at which the inspection is conducted is an important factor in the effectiveness of the inspection. This is one of the most significant challenges for IRT, because the same defect will have time-varying contrast over the course of the day, based on the surrounding environmental conditions. As a result, relatively simple concept of IRT inspections can become difficult to implement effectively [
24]. The developed guidelines indicate that a minimum ambient temperature change of 8.2 °C is necessary to conduct thermal inspections in the field. To develop this level of ambient temperature change, at least 5.5 °C of temperature change should occur in the first six hours following sunrise [
24]. It was stated by Washer
et al. that useful inspection periods for daytime inspections of shaded concrete structures range from 4 to 7 h following sunrise for typical delamination depth between 5 and 7.5 cm [
24], which is a quite substantial time period and often deemed to be too long for
in-situ measurements.
It has to be said here that the experiment which resulted with the described guidelines [
24] was conducted on the test block that measured 2.44 × 2.44 × 0.91 m, with targets embedded on the surface facing the sun (south side of the block) and in the shade (north side of the block). This means that one (south) side of the concrete block was under the influence of the direct sunlight, while the other (north) side was shaded, but the heat flux could move from hotter (south) to cooler (north) side of the specimen, while no experimental results are shown in the case when the whole concrete specimen would be shaded like in the case of bridge piers, abutments or other bridge components that are not under the influence of direct sunlight even from one side. Even though the thickness and thermal inertia of the test block is significant, one can assume that thermal wave which propagates form the side facing the sun increases the detectability of the defects in the shaded side of the test block.
Another use of IRT with natural excitation was presented in [
10] where material homogeneity in the water intake structure using IRT was studied, and the results were compared with the results of other NDT methods. Here, detection of defected areas was possible due to the water ingress through the concrete walls of the submerged water intake structure, since water permeability of concrete depends to a large degree on its homogeneity.
Scott
et al. [
1] claim that civil applications of IRT are very much limited to IRT inspections with natural excitation (in literature it is referred to as passive) due to the size of the targets being evaluated and the difficulties associated with trying to actively heat such large targets with relatively small external heating sources. However, IRT with natural excitation has its own limitations, which include its inability to evaluate multiple elevations at one time and the reliance the method has on the surrounding ambient environment to provide the necessary thermal variations required to detect subsurface defects. It has been strongly emphasized that when IRT with natural excitation is used for structural health monitoring, a strong understanding of the environmental conditions required to provide adequate thermal gradients is crucial [
1].
As seen from above, NDT of concrete structures using IRT, based on techniques that use natural excitation sources (in the literature often referred as passive techniques) has a number of limitations and drawbacks. Therefore, active thermography techniques are more and more applied in detecting damages in materials and structures.
3. Active Thermography
The active IRT depends on establishing a thermal gradient in the material under test where the energy is imported into the target through the use of an artificial external heat source such that significant heat transfer occurs within the material. This active heating with an additional energy source is either applied at the same side as the IR camera or at the opposite side in transmission configuration [
29].
In civil engineering, two of the active methods, impulse-thermography (IT) and pulse phase thermography (PPT), have proved to be very useful for the investigation of defects close to the surface [
30], while lock-in was also used by few research groups [
31].
Sakagami and Kubo [
31] developed a testing technique for delamination defects in concrete structures. The technique is based on the phase delay measurement using a lock-in (LT) IRT under the application of periodical heating. Experimental studies were performed on the applicability of technique to the detection of artificial delamination defects in a 1 × 1 × 0.3 m
3 concrete block specimen. Sinusoidal reference signal for the lock-in measurement was generated to control 12 quartz lamps via heater control relay. Lock-in measurements were carried out for 11 different heating periods, which were set from 10 to 60 min with 5 min intervals. The modulation frequency, which was reciprocal of the heating period, was then set from 1.67 × 10
−3 to 2.78 × 10
−4 Hz, [
31]. Additionally, lock-in measurements were carried out in [
31] for three heating periods,
i.e., 10, 20 and 30 min on the actual
in-situ delamination damage, where an oil-fired heater (28–38 kWh) was employed instead of the quartz lamp heater. It was found in [
31] that the location and size of the delamination defects can be estimated by the area of contrast change in the phase delay images. Defect depth can be estimated using the relationship between phase delay and heating period (
Figure 2). Sakagami and Kubo state that the defects of 10 cm in depth cannot be detected, by their method, while considering the heating period which was used, they have set the limitation of the detectable defect depth at 5 cm [
31].
Maierhofer
et al. and Weritz
et al. [
7,
32] systematically studied the applicability of pulse phase thermography (PPT) for the investigation of structures on concrete test specimens and on a plastered sandstone column. In the test specimens, voids and delaminations were implemented in different depths and with different sizes, modeling real voids, honeycombing and debonding.
It was concluded that pulse phase thermography proves to be useful for applications in civil engineering, as shown for laboratory and onsite experiments in [
7,
32]. In the experiment made by [
7,
32], heating pulse is realized as a square pulse. For the laboratory measurements, they used a thermal heating unit consisting of three infrared radiators having an electrical power of 2400 W each. The heating procedure was done dynamically by moving the radiators at a distance of about 15 cm to the surface to obtain the best possible homogeneous heating. The heating time was varied between 3 and 60 min, resulting in a surface temperature not higher than 50 °C. For the onsite measurement, Maierhofer
et al. and Weritz
et al. used a conventional electric fan heater with a power of 2000 W [
7,
32]. The cooling down process (120 min long) of the surface was observed with an IR camera (PtSi focal plane array), which detects in a wavelength region from 3 to 5 µm.
Semi-quantitative estimation of defect depths in relation to the frequency was performed and resulted with a conclusion that images in the frequency domain facilitate the visibility and detectability of defects. Authors state that the presence of moisture inside a specimen has a clear influence on the thermal properties and thus on the phase image [
32]. The application of IT and PPT as NDT techniques in civil engineering were optimized for the detection of near-surface inhomogeneities and common subsurface defects in typical structural elements [
7,
32,
33]. These defects include voids and honeycombing in concrete, delaminations, assessment of bonding of carbon fiber reinforced laminates to concrete, as well as poorly grouted ducts in prestressed concrete. The main objective of the research was to quantitatively determine the geometrical parameters of embedded defects. It can be deduced from this research that properties of PPT in civil engineering are in accordance with those reported for materials with higher thermal conductivity. The main advantages of PPT are given by the following properties of the phase images (phasegrams) [
7,
32]:
Deeper probing for amplitude images and thus enhanced detectability. For LT, it has been demonstrated that phasegrams can probe twice the thickness compared to ampligrams.
Phase images are less influenced by surface infrared and optical characteristics and less sensitive to non-uniform heating than thermal images and amplitude images.
Fast inspection, results are images with enhanced resolution of defect geometry
No necessity to know a priori position of non-defect areas. This pre-knowledge is required in IT for the computation of contrast images.
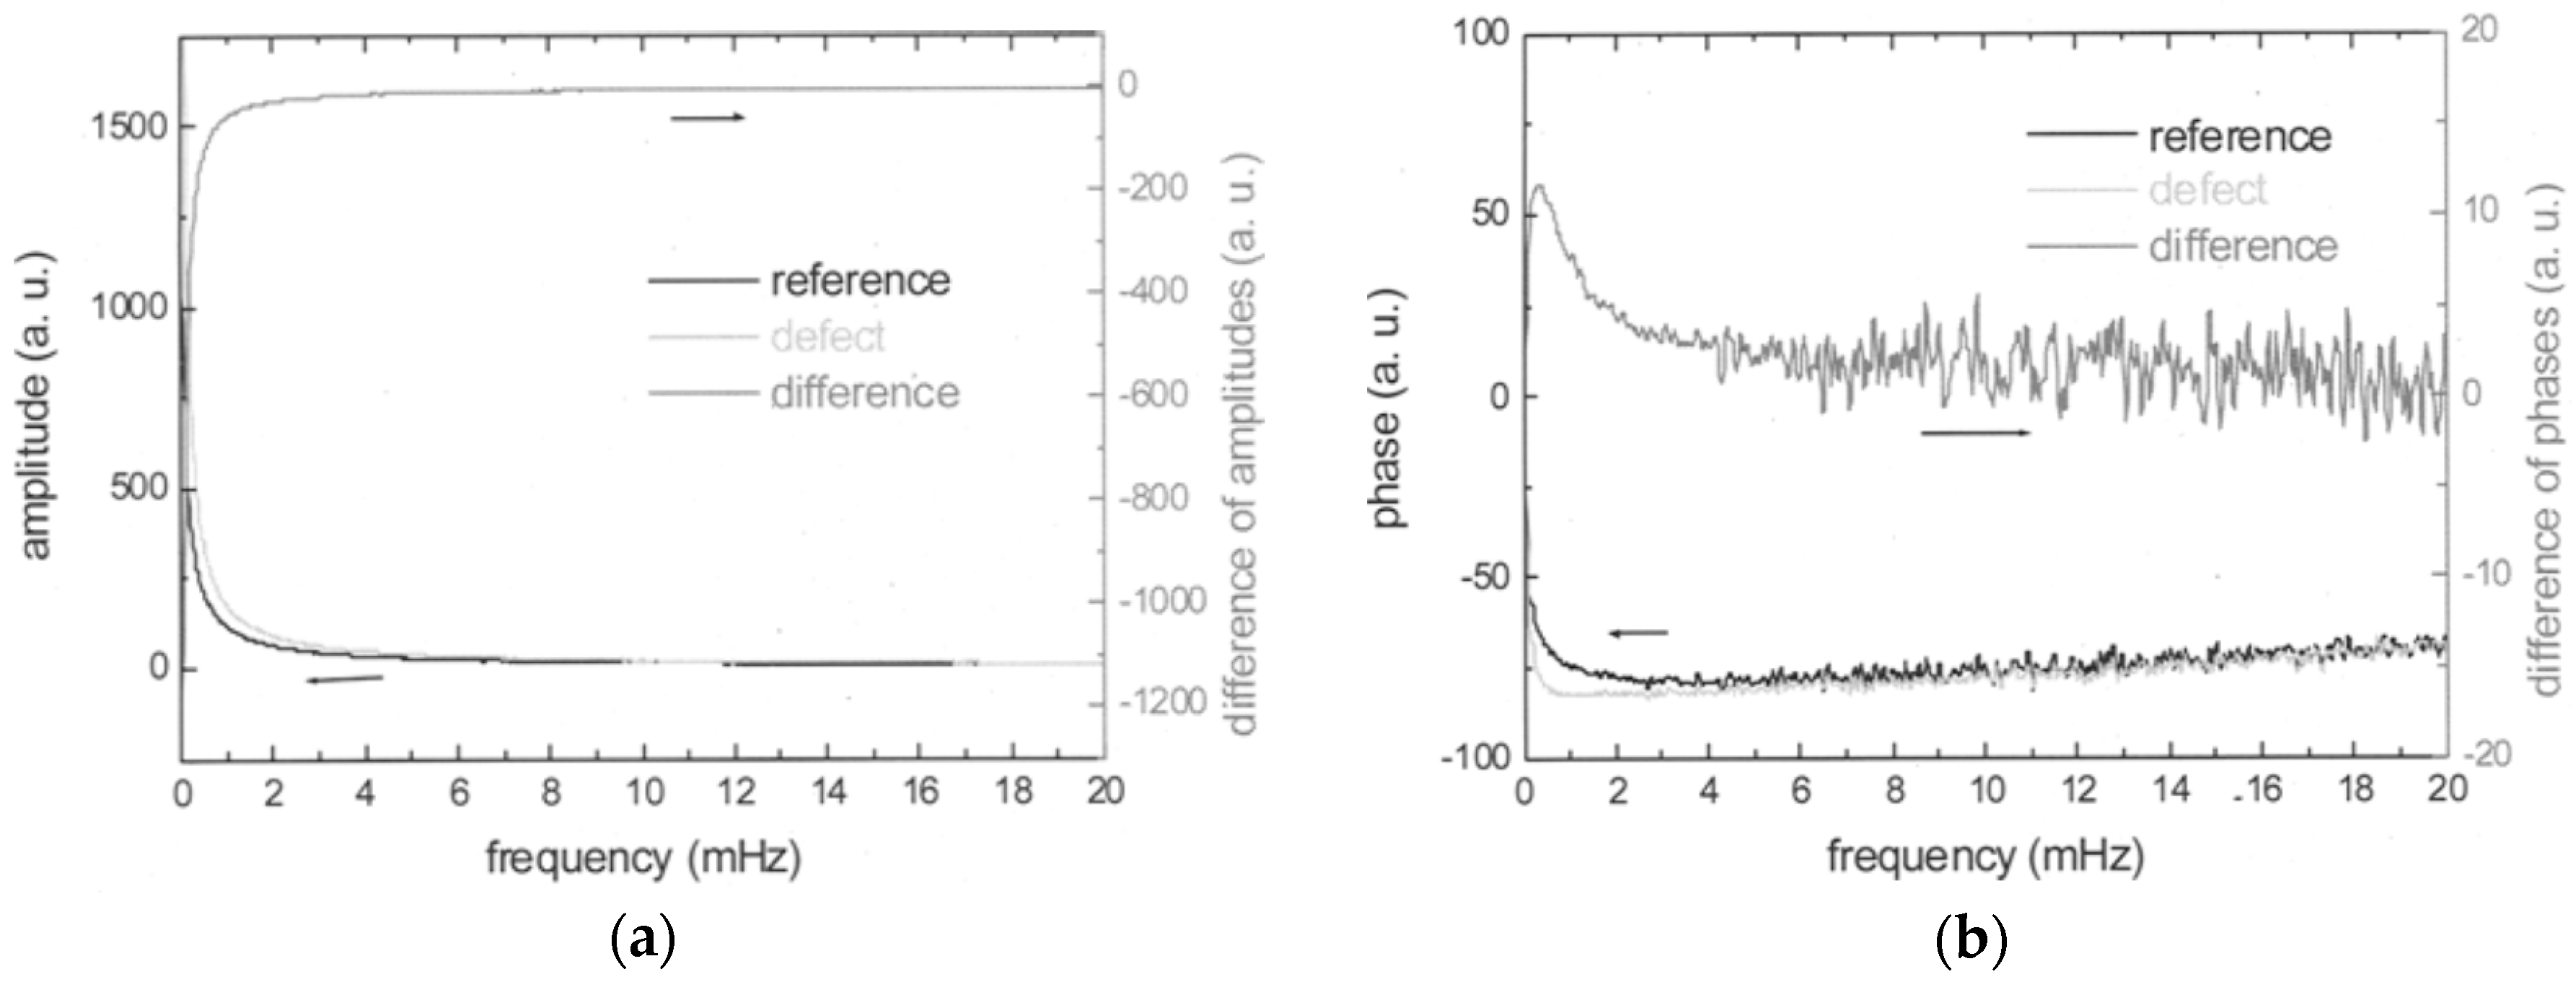
Maierhofer
et al. and Weritz
et al. showed the transient temperature curves for which the FFT was calculated. The amplitude spectra and phase spectra are shown in
Figure 3 [
7,
32].
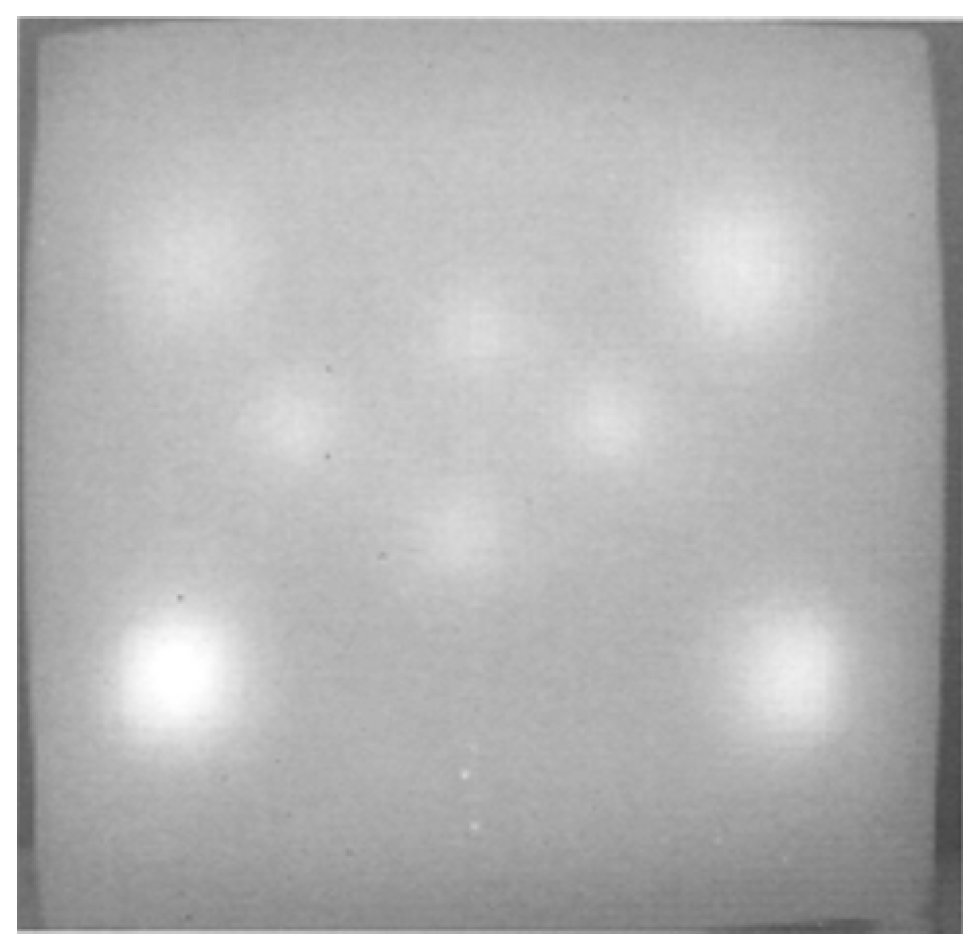
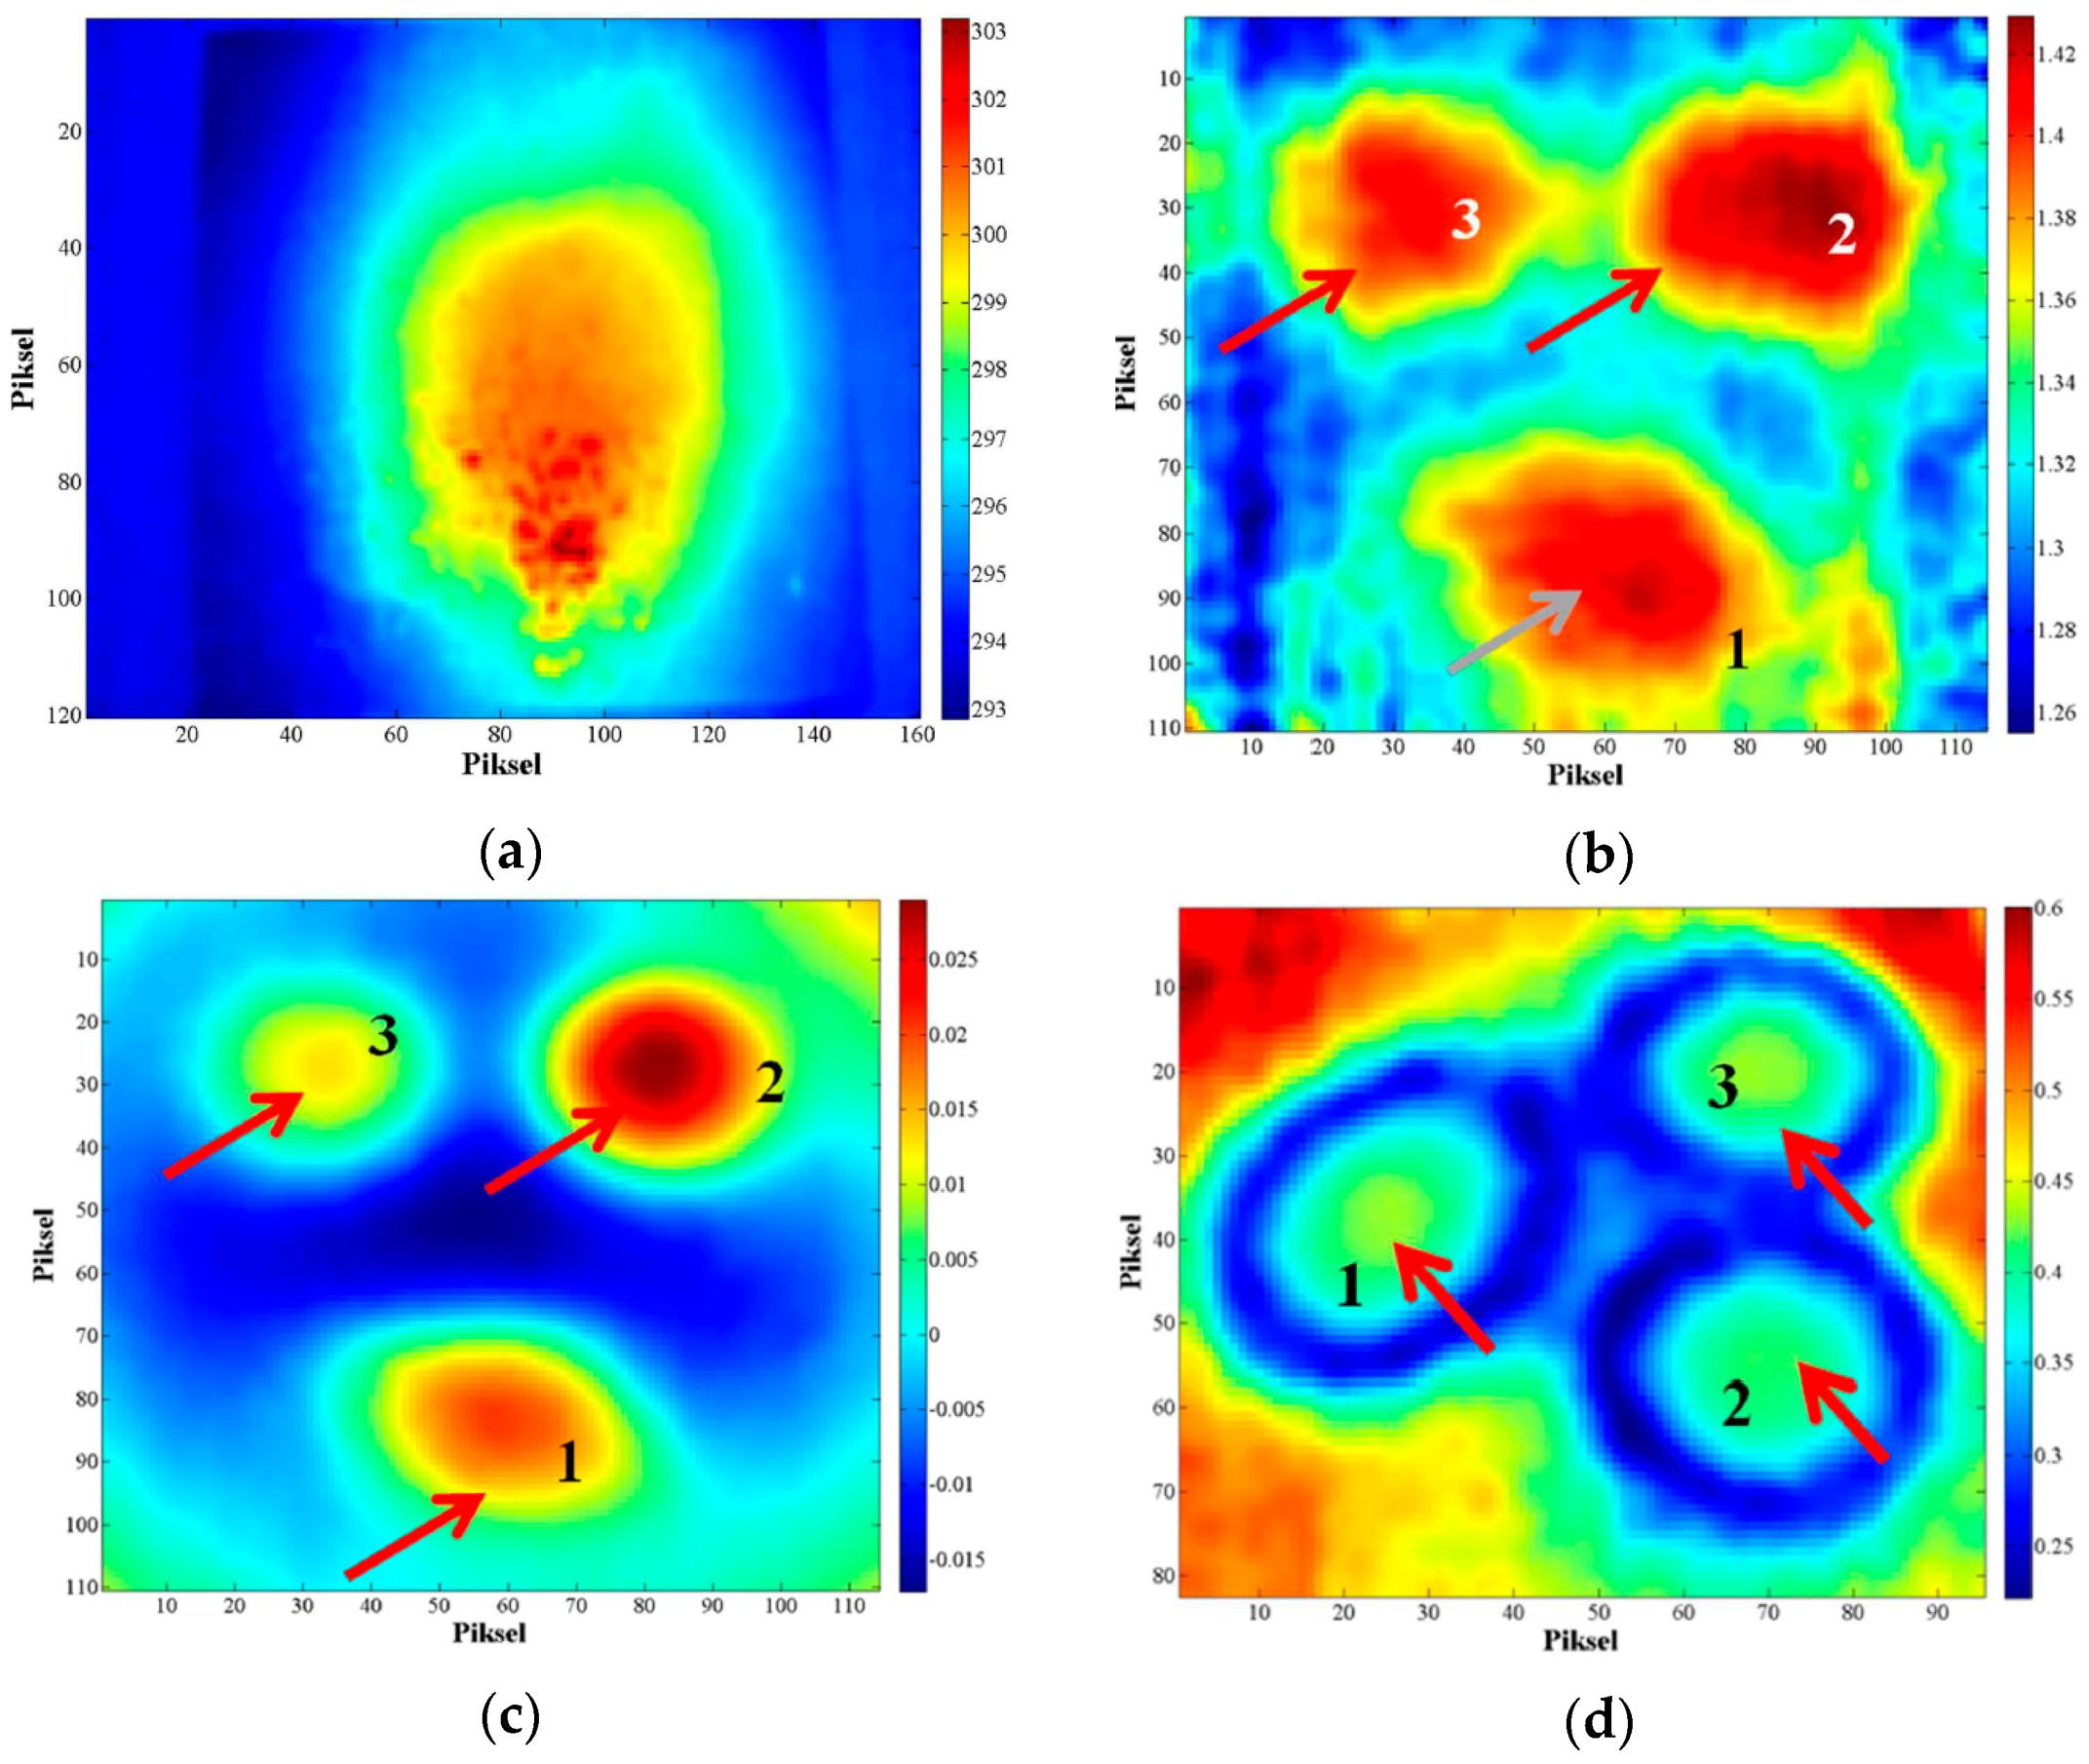
Both images, corresponding to the lowest frequency (0.14 mHz), provide the best visibility of all defect areas (
Figure 4,
Figure 5 and
Figure 6). For higher frequencies, deeper defects become indiscernible. Additionally, phase images show the defects with better contrast compared to amplitude images at the same frequency, especially the deepest defects [
7]. Defects with a tilted orientation in respect to the surface were also identified in phase images, as they seem to be half black and half white (
Figure 5).
Maierhofer
et al. [
32] investigated the detectability of voids in concrete using active IT and concluded that detectability is influenced by the size and depth of the voids. To investigate this influence, a concrete test specimen was built, having the size of 1.5 × 1.5 × 0.5 m
3, with voids simulated by polystyrene cuboids. Additionally, Maierhofer
et al. [
32] looked at the influence of reinforcement density, where only a small influence of the rebar density could be noticed: with increasing rebar density, the temperature contrast of the underneath voids decreased slightly. Therefore, it is expected by Maierhofer
et al. that at real structures, the reinforcement does not constrain investigations performed with IT as this is the case for other NDT methods, e.g., radar. Single rebars could not be resolved in the thermograms [
9].
Maierhofer
et al. [
9] state that a large influence on experimental data was observed during hydration, mainly due to changes of thermal conductivity, where the pore content of cement matrix and porosity of aggregates have a clear influence on thermal properties and thus on the experimental data [
9]. On the other hand, the same research group continued their research using numerical modeling. In [
32] they published the research on how the variations of concrete mixture influence on the density, thermal conductivity and heat capacity of the hydrated concrete and thus on the detection of voids using IRT. For comparison, numerical simulations have been performed. They concluded that the reduction of density has the main influence on the data compared to the results when thermal conductivity was reduced.
Maierhofer
et al. [
9] additionally show that experimentally determined characteristics of the transient curves (ΔT
max and t
max) gained at near-surface voids are influenced by the material properties of concrete in different ways. It is stated that these relationships can be used as references for defect quantification. However, it should be considered that even if concrete mixtures are similar, in many cases thermal properties of the resulting hydrated concrete might deviate, probably due to different conditions during concreting and hydration [
9].
In
Figure 7, ΔT
max and t
max are displayed as a function of compressive strength (for a heating duration of 30 min). It was shown that with increasing strength, the contrast decreases slightly while the time of the maximum contrast increases. This is more or less consistent with a decrease of thermal conductivity as outlined in the results of numerical simulation [
9]. In
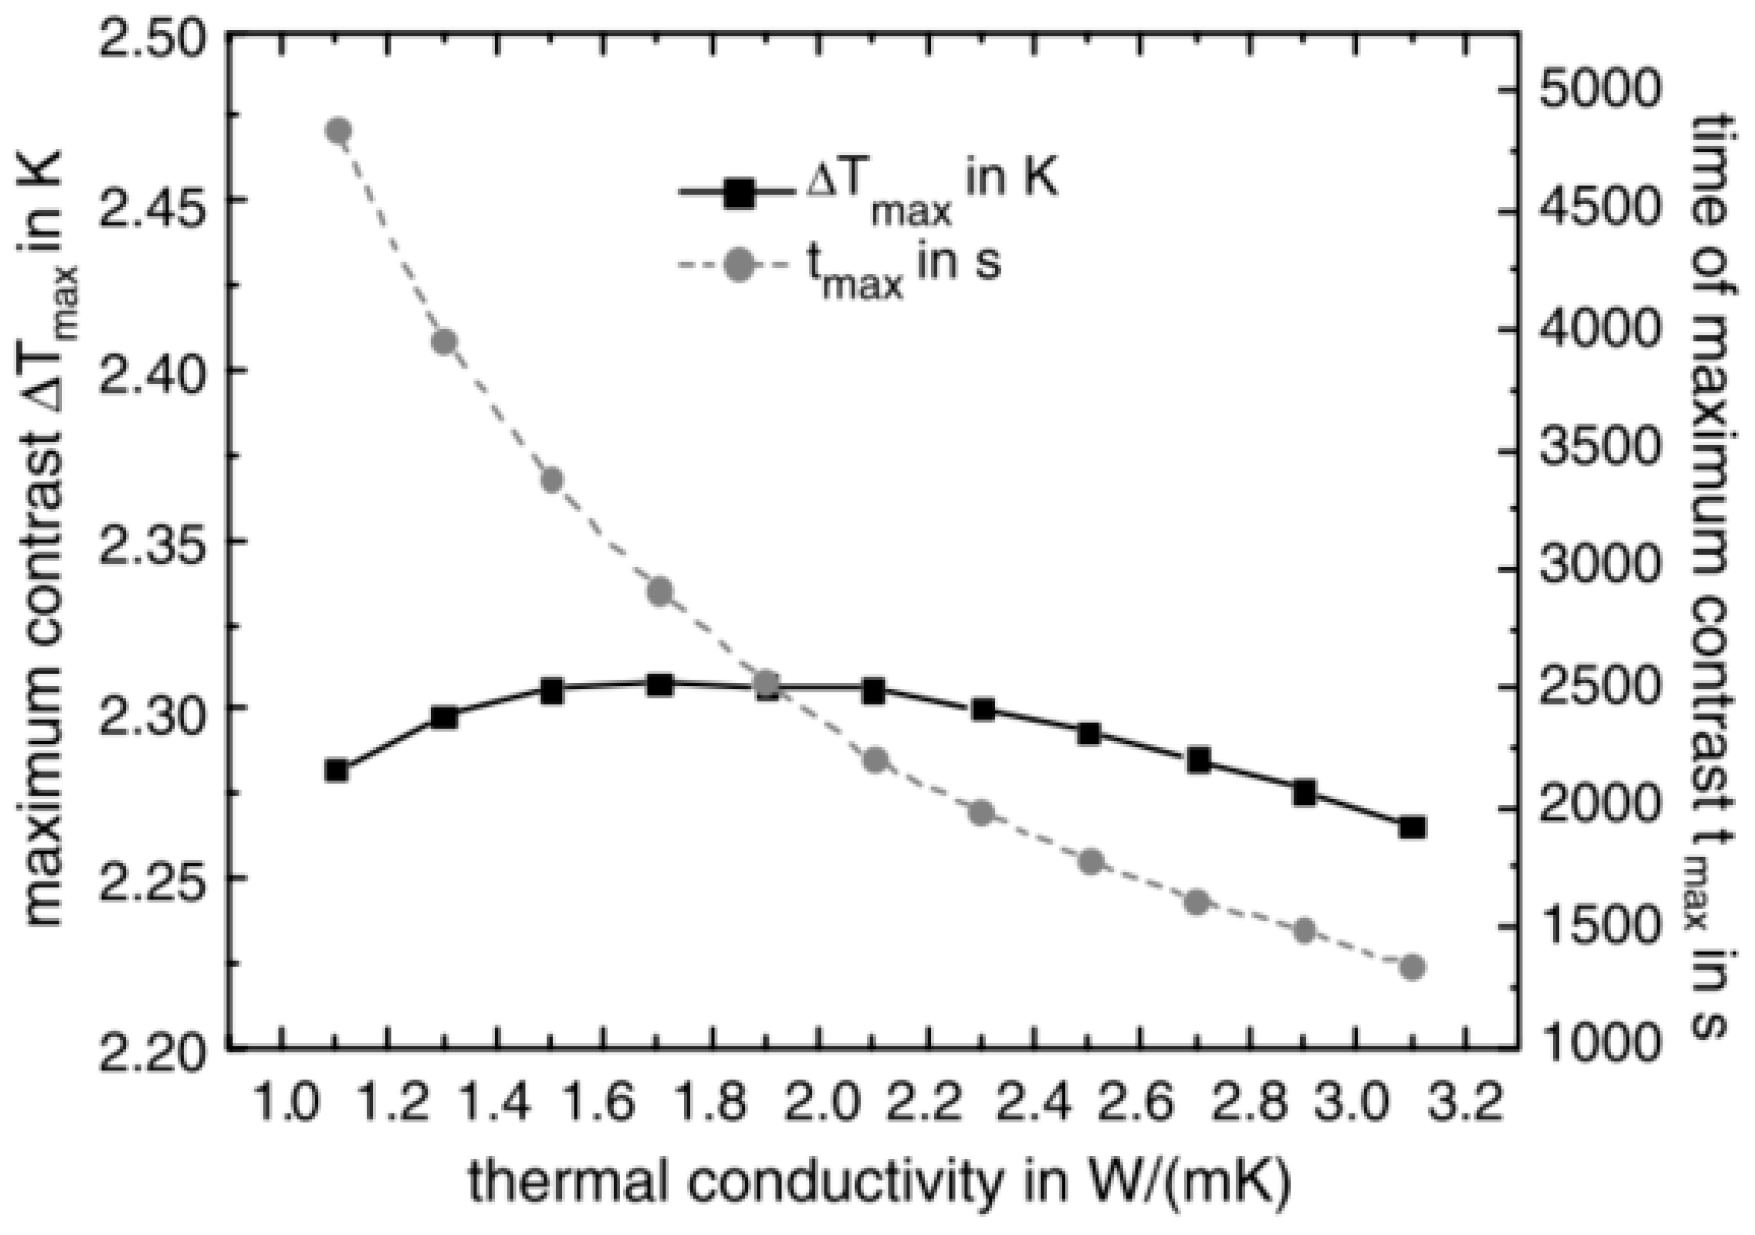
Figure 8, the simulated maximum temperature difference ΔT
max and the time t
max at which this maximum contrast appears are presented for different thermal conductivities. Here (
Figure 8), thermal contrast is nearly independent of the thermal conductivity. With decreasing thermal conductivity, the time of the maximum increases drastically. However, the quantitative values are different: simulated ΔT
max as well as the t
max are larger than the measured ones shown in
Figure 7.
The influence of the density has also been simulated in [
9], where the reduction of the density proved to have a larger influence on ΔT
max and a smaller influence on t
max as shown in
Figure 9. For specimen made with porous aggregates, ΔT
max as well as t
max increase clearly (
Figure 10). It is also shown that the effects of increased density and increased thermal conductivity superimpose each other [
9].
In order to examine the applicability of IT for the detection of grouting faults inside ducts, Maierhofer
et al. [
32] constructed 3.50 m long test specimens which consisted of reinforced concrete with two tendon ducts including tendon wires. Inside the tendon ducts (diameter of 80 mm), three non-grouted areas with a length of 45 cm each were integrated. The tendon ducts had a concrete cover of 8 cm from one side and of 5 cm from the other side [
32]. Transient temperature distributions for detecting these non-grouted areas were realized in three different ways [
32]. In the first case, the heat during hydration of the cement inside the ducts was used. Few minutes after grouting, the ducts could be detected at the surface with the infrared camera. Likewise the grouting faults could be located. In the second case, the pre-stressed concrete test specimen was heated up to 15 min from the outside surface by infrared radiators with a total electrical connected load of 5200 W. Only from the side with small concrete cover (
c = 5 cm) the grouting faults in the ducts could be detected clearly [
32]. In the third case, the heat impulse was generated internally by conductive heating of the wires inside the ducts. By means of a transformer, a current of 15 A was applied for a duration of 15 min. It was concluded by the authors that along both tendon ducts, warm and cold areas corresponded to the grouted and non-grouted areas, respectively. It is recommended that for proofing defects at larger depths, like non-grouted areas in tendon ducts, long measurement times up to 1.5 h are required.
Dupuis and Pollock
et al. [
34,
35] also investigated thermal imaging as a viable option in the detection of simulated voids in post-tensioning ducts in concrete specimens, the simulated void size and orientation with respect to adjacent steel tendons. The heater used with each set-up was a 13.5 kW metal sheath infrared heater, which was located 30 cm and 69 cm from the specimen, respectively to the test setup. Field inspections of concrete box girder bridges, along with lab inspections of specimens simulating post-tensioned box girder bridge walls, have led to the conclusion that the method of heating is an essential part of inspection depending on the type and location of defects. Near-surface defects are detectable with through-thickness heating, as well as with same-surface heating. However, internal defects or embedded material such as post-tensioning ducts or voids inside those ducts are most easily detected with through-thickness heating [
34,
35]. It is also concluded that void size and void orientation with respect to adjacent steel tendons inside the post-tensioning ducts is critical. Simulated voids located between the heated surface and the tendons were most often detectable. However, simulated voids located at the same depth as adjacent tendons were not detectable since the steel tended to mask the presence of any simulated voids [
34,
35].
Corvaglia and Largo [
36] developed an IRT procedure which was applied for quality control of two reinforced concrete structures reinforced with FRP materials. They used a halogen lamp with a nominal power of 500 W, while the adopted camera was a 320 × 256 Focal Plane Array IR camera. The test setup was realized as cheap as possible, in order to develop an experimental procedure that could be easily applied
in-situ and not only in research laboratories. Authors state that thanks to the thermograms post—processing procedure developed in the paper, every defect was quantified in terms of debonded area, and after the definition of acceptance criteria even repair method could be proposed [
36].
Zi
et al. [
37] considered two different kinds of defects: voids below concrete surface and delamination of FRP sheet strengthening concretes. They investigated the optimal conditions for the IRT applied to the above-mentioned problems. It was concluded by the authors that IR lamp was better than the halogen lamp for artificial heating of concrete specimens [
37]. On the other hand, Dumoulin
et al. [
38] combined numerical 3D simulations with experiments on laboratory samples to study the thermal signature of artificial defects inserted between a CFRP plate and a cement concrete block. Different types of defects (different heat capacities and shapes) were inserted, at a same depth, between the concrete substrate and the pultruded CFRP laminate plate glued to its surface. The authors [
38] investigated two kinds of optical thermal excitations: pulse and square heating. The first one was a short pulse heat stimulation using two flashes of 3.2 kJ with a duration pulse of 10 ms, while the second one was a long square heating pulse of 10, 30 and 60 s using two halogen lamps of 1 kW each. For both configurations, distance between the sample and the lamps was 1 m. Localization of defects was performed using singular value decomposition (SVD) on experimental data.
The running contrast was performed in order to reduce the impact of non-uniformity of heating and to analyze the thermal signature of each defect time
versus time evolution for pulse and square heating excitations. It is also noted that thermal contrast is very weak for the pulsed experiment [
38].
Tashan and Al-Mahaidi [
39] investigated the ability of IRT to detect and measure bond defects between CFRP composites and concrete specimens. Their experiments prove that PPT can be used for detection of CFRP bond defects, which can be achieved even with pulse intervals of 1s, while better contrasts are achieved with pulse length of 3 or 5 s. To generate well-recognized bond defects, the input heat flux is recommended to be greater than 500 W/m
2 and the pulse length more than 1 s [
39].
Van Leeuwen
et al. [
40] investigated the applicability and effectiveness of using PPT to improve defects detection in reinforced concrete structures, specifically wastewater treatment plants, and prestressed concrete bridge decks, and they concluded that detection of up to 6 cm deep defects was successful. As a heating source, a circular oil-fired IR heater (thermal power: 15 kW) was used. This heat source creates a very non-uniform heating and thus reduces the detectability of the defects. The slab was heated during twenty minutes, and then one IR picture was taken per minute during a cooling time of 90 min. The best results of the defect detection were obtained with phase images [
40].
Van Leeuwen
et al. [
40] discovered that PPT was sensitive to weather conditions (wind speed, solar radiation,
etc.) causing disturbance and thus reducing the defect detectability. To improve the detection of defects, they proceeded to correct digitally the cooling curves by smoothing before the PPT analysis.
After
in-situ testing in [
40], it was concluded that the use of PPT on real site is a very delicate phase, since the transition between laboratory and real site is accompanied by difficulties such as:
The weather conditions (wind speed, solar intensity, rain, etc.)
The difference of structure and thermal behavior between real defects and artificial ones created in laboratory.
The larger size and thickness of concrete walls, which strongly modify the heat flux behavior.
The accessibility of the zone which has to be inspected, i.e., the distance between the IR camera and the wall must be sufficient to observe the entirety of the zone.
Van Leeuwen
et al. [
40] made an
in-situ experiment, which consisted of trying solar heating in a PPT analysis, which proved to be very satisfactory. It is however stated that such quality of results was possible thanks to very good weather conditions (little wind and very sunny day) and to the presence of large defects in the bridge structure. It was concluded by Van Leeuwen
et al. that except when there were surface color differences, amplitude images did not improve the ability to detect the defects already present on the thermogram. Besides, the defects were less visible on the phase images than on the amplitude images [
40].
To overcome the issues with the accessibility of the zone which has to be inspected, Kurita
et al. [
41] proposed a simple image processing procedure that was used to obtain high-contrast IRT images of the elevated reinforced concrete railway structures. A remote heating system consisting of a 6 kW air-cooled xenon arc lamp and a scanner system was developed to detect hidden defects in elevated concrete structures without the need for an aerial truck or scaffolding. The generation of a thermal image and irradiation were carried out simultaneously by the scanning beam. The power density of the light beam at a distance of 10 m from the lamp was 5 kW/m
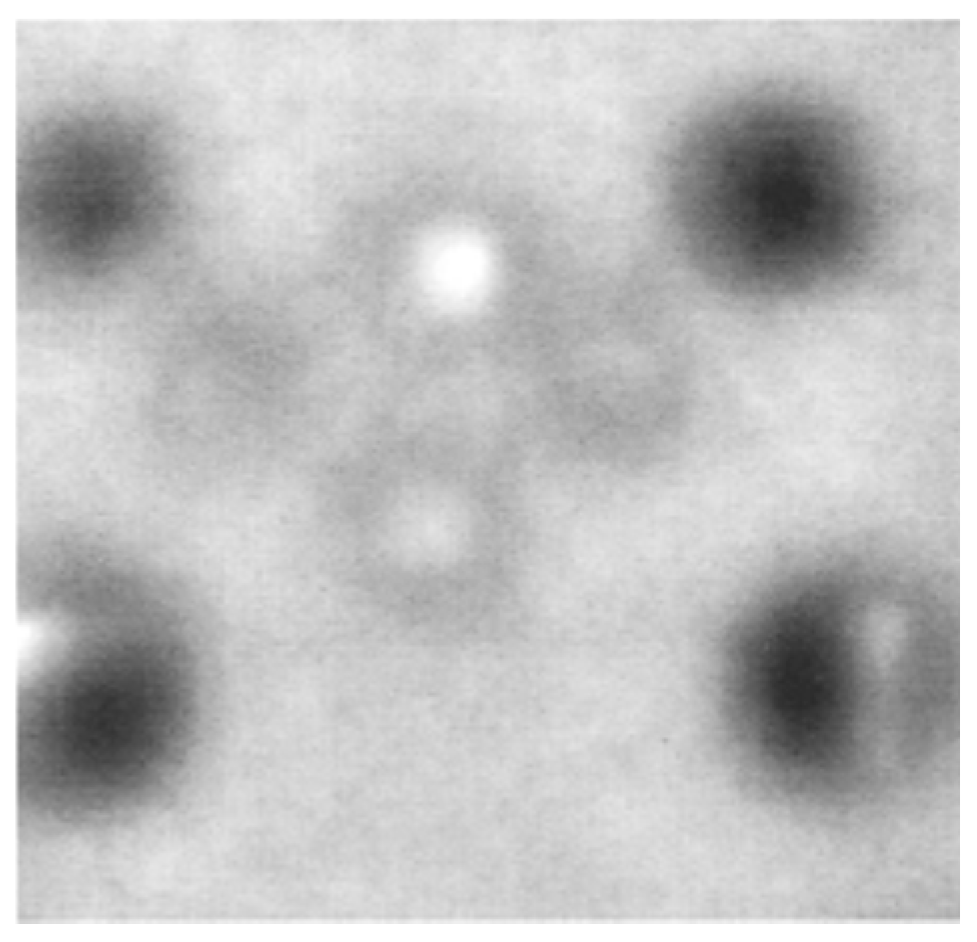
2. The diameter of the collimated light beam was 280 mm, while the velocity at which the beam spot scanned the surface of the object of inspection was 1 m/s. The IR camera used a cooled Hg-Cd-Te detector with a maximum frame rate of 1.5 Hz and a FPA pixel format of 255 × 239, wavelength range from 8 to 12 µm, and temperature resolution of 0.05 K at 30 °C.
In the method by Kurita
et al. [
41], irradiation and the generation of the thermal image take place simultaneously, which increases the speed of operation in comparison to conventional active scheme where the observation of the IR image takes place after the irradiation. The hot spot due to thermal excitation is directly observed by an IR camera, so the infrared images display a high-temperature hot spot caused by the scanning beam which creates a disturbance. In order to eliminate this hot spot, the IR image data were subjected to the image processing procedure which is explained in detail in [
41].
IR images were obtained during irradiation time of 950 s.
Figure 11 compares the image taken under natural excitation (in the literature, it is referred to as passive), and the pseudo-temperature image obtained after the image processing as described in [
41].
It can be seen from paper [
41] that the image processing procedure shown in the study is highly effective at obtaining a high-contrast IR image and is more useful than the conventional IRT method which uses natural excitation to conduct inspections of elevated structures. On the other hand, the authors cannot precisely know the depth and nature of the defects.
Regarding the rebar related problems when using IRT, Aggelis
et al. [
42] applied the two NDT techniques, namely pulse thermography and ultrasound LT for the investigation of subsurface cracking initiated by metal rebar corrosion. The results indicated that the location of the large cracks was easily detected from the IRT characterization of the structure, while more detail of the crack depth was given by one-sided ultrasonic measurements. Considerations were raised in this work [
42] regarding the fact that the test was performed at higher than realistic temperatures, simulated in laboratory conditions, for the facilitation of the detection. Thus it was concluded that crack detection can be proven a difficult task at 50 °C, the temperature of a concrete surface under sunlight on a warm day.
Keo
et al. [
43] implemented IRT with a microwave system (as a thermal excitation) for determination of the presence of steel reinforcement at the depth of about 3.8 cm (sufficiently thick concrete cover) in concrete structures. Electromagnetic waves generation was carried out using a commercial magnetron at the power of 800 W and the frequency of 2.45 GHz. It is concluded by the authors that this method can be used to detect the steel; deducing the positions, spacing and numbers of the main bars in some types of structures (columns, walls or some precast products), which is very important to assure the resistance of the whole structure [
43].
It is evident that for
in-situ testing, the system used should be portable, with relatively low power thermal excitation system, low price and with relatively quick testing procedure. Looking at all these prerequisites, it should be noted that the power of excitation system is determined by the power of the electricity generator used where generators with the power above 5 kW become too expensive. Due to the power issues and actuation of the thermal excitation, one has to critically appraise the research results where the researchers used high power thermal excitation systems with respect to the feasibility of the
in-situ use of such systems. The speed of testing and data gathering are also crucial parameters for IRT to become one of the mainstream NDT methods in concrete structures, while the accuracy and repeatability imply. These parameters are definitely interconnected with the power of the excitation source as well as the heating procedure and data gathering, and thus a good testing methodology should be developed. All the research mentioned in
Section 3 of this paper is mainly focused on one of the parameters, and it can be concluded that majority of the results are valid just for the specific test situation. It has to be said that there is a lack of comprehensive research that would connect the detectability of defects (type of defect, size and depth) with the power of excitation source (or different types of excitation sources), distance of the excitation source, concrete quality (density, thermal properties) as well as the different IR cameras. To put it simply, limits of detection regarding and probability of detection all these parameters should be developed. This would certainly be tedious work, but the authors feel it is necessary in the process of acceptance of IRT to become fully acknowledged method for the NDT of concrete structures.
4. Combining NDT Methods
In order to be accepted as a viable NDT technique in the field of civil engineering, more specifically in the field of reinforced and prestressed concrete structures, IRT has to also be compared with other NDT techniques that are already accepted. Additionally, a combination of few NDT methods can potentially increase the reliability of inspection results for damage identification. This motivated researchers to do laboratory and in-situ testing comparing IRT with other electromagnetic and ultrasound methods.
Büyüköztürk compared various concrete imaging techniques and concluded that IRT can be used for remote, rapid and accurate imaging of the concrete structures [
44]. He also indicated that IRT surveys are restricted to certain weather conditions, as well as effects of emissivity, sky temperature, wind velocity and radiation from the surrounding objects. Another limitation, Büyüköztürk ads, of IRT is that it provides no information about the depth of the defects, since it images the radiation from the concrete surface. To remedy this shortcoming, it can be combined with ground-penetrating radar [
44].
Even though it is not focused directly on concrete structures, the research of Meola
et al. [
45] uses a multi-methodological approach to NDT of architectural structures. They use three different techniques such as IRT, ultrasonics and electric-type geophysical methods to acquire information for a synergic use of the different methods, which can allow for more reliable test results. Sequences of thermal images were acquired with the FPA IR camera, while thermal stimulation was performed with two lamps (1 kW each) in the reflection setup. It was concluded from the research in [
45] that several factors influence defects visibility: defects size and nature, depth, plaster consistency and the type of support. In general, it is said that a large defect is better distinguishable than a smaller one. A deep defect appears defocused because the thermal dispersion inside plaster becomes more important as the plaster thickness increases [
45]. In addition, a compact plaster favors defect visibility while a porous plaster hinders the defect visibility, due to the thermal conductivity of compact plaster, which is higher than that of air while the porous plaster has lower thermal conductivity. Meola
et al. concludes that this effect contrasts the visibility of the defects which are just made of air [
45]. In addition, Meola
et al. noticed that the thermal properties of the support could affect defects visibility. This is because during cooling heat escapes also from the specimen back-side (support) and higher the thermal conductivity of the support with respect to air (defects) better is the defects visibility and this justifies the different behavior of the two specimens with marble and tuff supports [
45].
From a comparison of the results obtained with the different methods Meola
et al. inferred that IRT is the easiest and quickest technique for detection of defects in cement-based materials [
45]. In particular, LT is capable of supplying detailed information about size, position and nature of defects and of discriminating between layered structures and local variations of concrete consistency. Unfortunately, LT is limited to thin concrete layers. On the other hand, PT technique allows for a more in-depth analysis since it was capable of detecting, with good contrast, defects which were very thin (1 mm), quite deep (55 mm) and of thermal characteristics close to the hosting material. However, it is very difficult to identify with PT the interface between stratified materials. In fact, the same signal degradation may be induced by the support (specific thermal characteristics), or by the defect (thermal characteristics too close to the sound hosting material, or too small, or too deep) [
45].
In comparison to IRT, it was concluded in [
45] that the ultrasonic technique, cannot supply in a fast way detailed information about the size and location of small defects in thin layers of concrete. Instead it can provide information useful for the evaluation of structural disomogeneities also in presence of very thick materials. The electric-type geophysical methods seem not properly adequate for detection of small and near-surface defects, according to [
45]. However, by using 3D representations of the natural electric charge accumulations and of the electrical resistivity, some results of the IRT were justified (
i.e., the worst defect visibility observed over the higher porosity area, as well as the possibility to identify three different kinds of support). As a general conclusion it is stressed in [
45] that with a combined use of the three different methodologies, it seems possible to outline and characterize the endogenetic degradation sources from micro- to macro-scales.
Results of several case studies were presented in [
46] regarding the successful application of IRT to a multitude of different testing problems related to a detection of defects up to a depth of about 7 cm. It is stated that due to the high sensitivity of active IRT to defects at depths between 0.1 and 10 cm, IRT is complementary to other NDT methods like radar, ultrasonics and impact-echo which are successfully applied in civil engineering, while achieving reliable results only starting from depth of 5 to 10 cm and deeper. For performing on-site investigations, the authors emphasizes in [
46] that the measurement equipment has to be mobile, light, flexible, water resistant and easy to apply with a maximum of two operators. To overcome the obstacles given by the external conditions, different kinds of heating units including radiant and fan heaters, flash and halogen lamps in combination with a mobile computing unit for digital data recording in real time as well as flexible IR camera for stationary and mobile measurements were used. Data analysis was performed in time domain (maximum contrast of defects or inhomogeneities) and frequency domain (PPT) [
46].
Nahant
et al. verified the accuracy of IRT with other detection techniques (ultrasounds, ground penetrating radar and coring). The results of the four techniques matched perfectly regarding the location of the defect, which proves that IRT works as well as other accepted NDT techniques for detecting subsurface defects in concrete elements, and can be used on construction sites [
6].
Gucunski
et al. [
27] performed a validation testing which graded and compared a variety of NDT technologies, where in total 12 different NDT methods were used. This validation testing was performed as a field validation on a real bridge and laboratory validation testing on a deck with prefabricated deterioration and defects. The testing was performed on a slab directly under the influence of sun, while no testing was performed on the shaded bridge components and/or laboratory specimens. The grading system established by [
27] resulted in below average grade for IRT in the category of accuracy and repeatability, while it received best grades in terms of speed, ease of use and costs. Gucunski
et al. conclude that comprehensive condition assessment of bridge decks, at this stage, can be achieved only through a complementary use of multiple technologies [
27].
Hiasa
et al. [
28] also focused on exploring the enhancement of the usability of IR method as a viable NDT method. In this research, IRT was applied to existing bridge in Florida to prove the reliability and usability in NDT, compared to hammer sounding inspection. Additionally a great deal of research regarding IRT has been conducted by using test pieces with artificial anomalies. The results indicate that the IRT could successfully detect the subsurface defects which could not be located by regular visual inspection techniques [
28].
Khan and Bartoli [
47] presented an application of IRT and impact-echo (IE) techniques to assess the condition of a mock-up bridge deck by cross validating their results and by attempting the fusion of the corresponding heterogeneous data sets. It was shown that IRT provides high spatial resolution and potentially rapid assessment compared to the IE [
47]. However, the fusion with features extracted from IE improves the final imaging of the tested specimens and provides a clear indication of existing shallow delaminations. Therefore, the fusion of two different NDT methods improved reliability of the inspection and assessment of concrete bridge decks [
47].
It has been shown in this section that, among others, the following combinations of IRT with other NDT methods are very promising:
active IRT and radar or elastic waves for depth calibration as described above;
active IRT and shearography of thermal-loaded specimen enabling flaw detection by temperature distribution and surface displacement; and
active IRT and digital imaging.
As shown in this section, IRT still has some detection uncertainties, significant dimensional uncertainties as well as problems in testing procedures, which makes it a useful method but not a method that can be used to detect and quantify defects. IRT still needs other complementary methods in order to be able to gather all the necessary data, like defect depth and size. It can also be said that majority of researchers that combined NDT methods, actually used so called passive IRT (i.e., techniques that use natural sources as thermal excitation), compared to only few researchers that combined active IRT with other NDT methods.
5. IR Data Processing
Data processing related to IRT is performed if qualitative and quantitative information is needed about inhomogeneities and defects just below the surface. Generally, thermogram analysis methods can be distinguished into two approaches; bottom-up and top-down. According to [
48], the analysis methods typically follow the this sequence of steps: (1) image pre-processing; (2) segmentation; (3) feature extraction; (4) classification; and (5) decision.
The bottom-up approach represents the basic approach by following each of the steps, while the top-down approach is oriented to problem solving for the identification of the region of interest (ROI). Both methods yield a ROI, and the decision is made based on the information extracted and evaluated from these regions [
48]. The most straightforward and frequently used bottom-up approach to thermal image analysis is the thresholding technique, which enables the identification of the hotspot within the thermal image. Here, the selection of a suitable threshold value is critical to the segmentation process, which basically highlights the hot spot.
In the top-down approach the segmentation process firstly identifies a regular structure by grouping the repetitive patterns. In order to find the repeated pattern in the thermal image, distinctive features of the image are identified, their features are described, and are compared with each other to find similar regions within the image [
48].
As raw data, temporal sequences of thermograms are available containing information about environmental and measurement parameters. The steps of IRT data processing are the following [
30]:
Enhancement of the signal to noise ratio, e.g., by averaging of thermograms or spatial or temporal filtering.
Location of defect areas by visual examination of the thermograms. Contrast areas can be accentuated by edge filtering or through further steps of image processing.
Transformation of geometrical parameters (size and position of measurement area, planar size and position of inhomogeneities or defects).
In case of IT, selection of transient curves (temperature of a pixel as a function of time during cooling down) of pixels above sound and defect area, calculation of the difference curve.
In case of PPT, calculation of Fast Fourier Transformation (FFT) of each transient curve resulting in amplitude and phase spectra. For enhancing the frequency resolution, zero padding (enhancing the transient curves in total time range with room or offset temperature) of the transient curves is essential since most of the information in the spectra is included in the very low frequencies.
Location of defect areas from amplitude and phase images, for each frequency.
Characterization of defects
RILEM report 207 [
30] stresses the importance of satisfying the following conditions in order for the inhomogeneities to be detected by IRT. These conditions include:
Reflectivity of thermal waves at interface (determined by the differences between the effusivities of the contiguous materials). For the 1D case, the reflection coefficient R of a plane thermal wave for transmission from medium 1 to medium 2 is equal to:
where
e1 and
e2 are thermal effusivities of medium 1 and 2, respectively, while ρ
1, ρ
2,
c1,
c2, λ
1 and λ
2 are densities, thermal capacities and thermal conductivities of medium 1 and 2, respectively. The larger the difference between the effusivities of the two media, the higher the thermal signature of the inhomogeneities is. For instance, the reflection coefficient at a concrete/air interface is about 100%, while the reflection coefficient of a concrete/steel interface is about −24%.
where
p is the depth of penetration (m),
α is the thermal diffusivity (m
2·s
−1), and
f is the thermal excitation frequency (Hz). RILEM report 207 [
30] states that at the surface, the response to thermal excitation is not sensitive to the presence of a discontinuity if its depth exceeds three times the penetration depth. For example, a day-night cycle can be assimilated as a first approximation to a sinusoidal variation of 1.16 × 10
−5 Hz. For concrete, the depth of penetration corresponding to this frequency is of the order of 10 cm. This means that defects deeper than 30 cm cannot be easily detected. Thus, lower frequencies are required.
In Addition to the required conditions (mentioned above) for the defect detection on the basis of the thermal contrast, there have been different research performed on the post-processing techniques on the sequence of thermograms in order to enhance the defect detection possibilities of IRT. Sophisticated data analysis of temporal temperature data in time and frequency domains (e.g., pulse-phase thermography) affords the detection of flaws and inhomogeneities with high reliability [
3].
The main approach of impulse thermography (IT) in analyzing the thermal data was to interpret the function of surface temperature
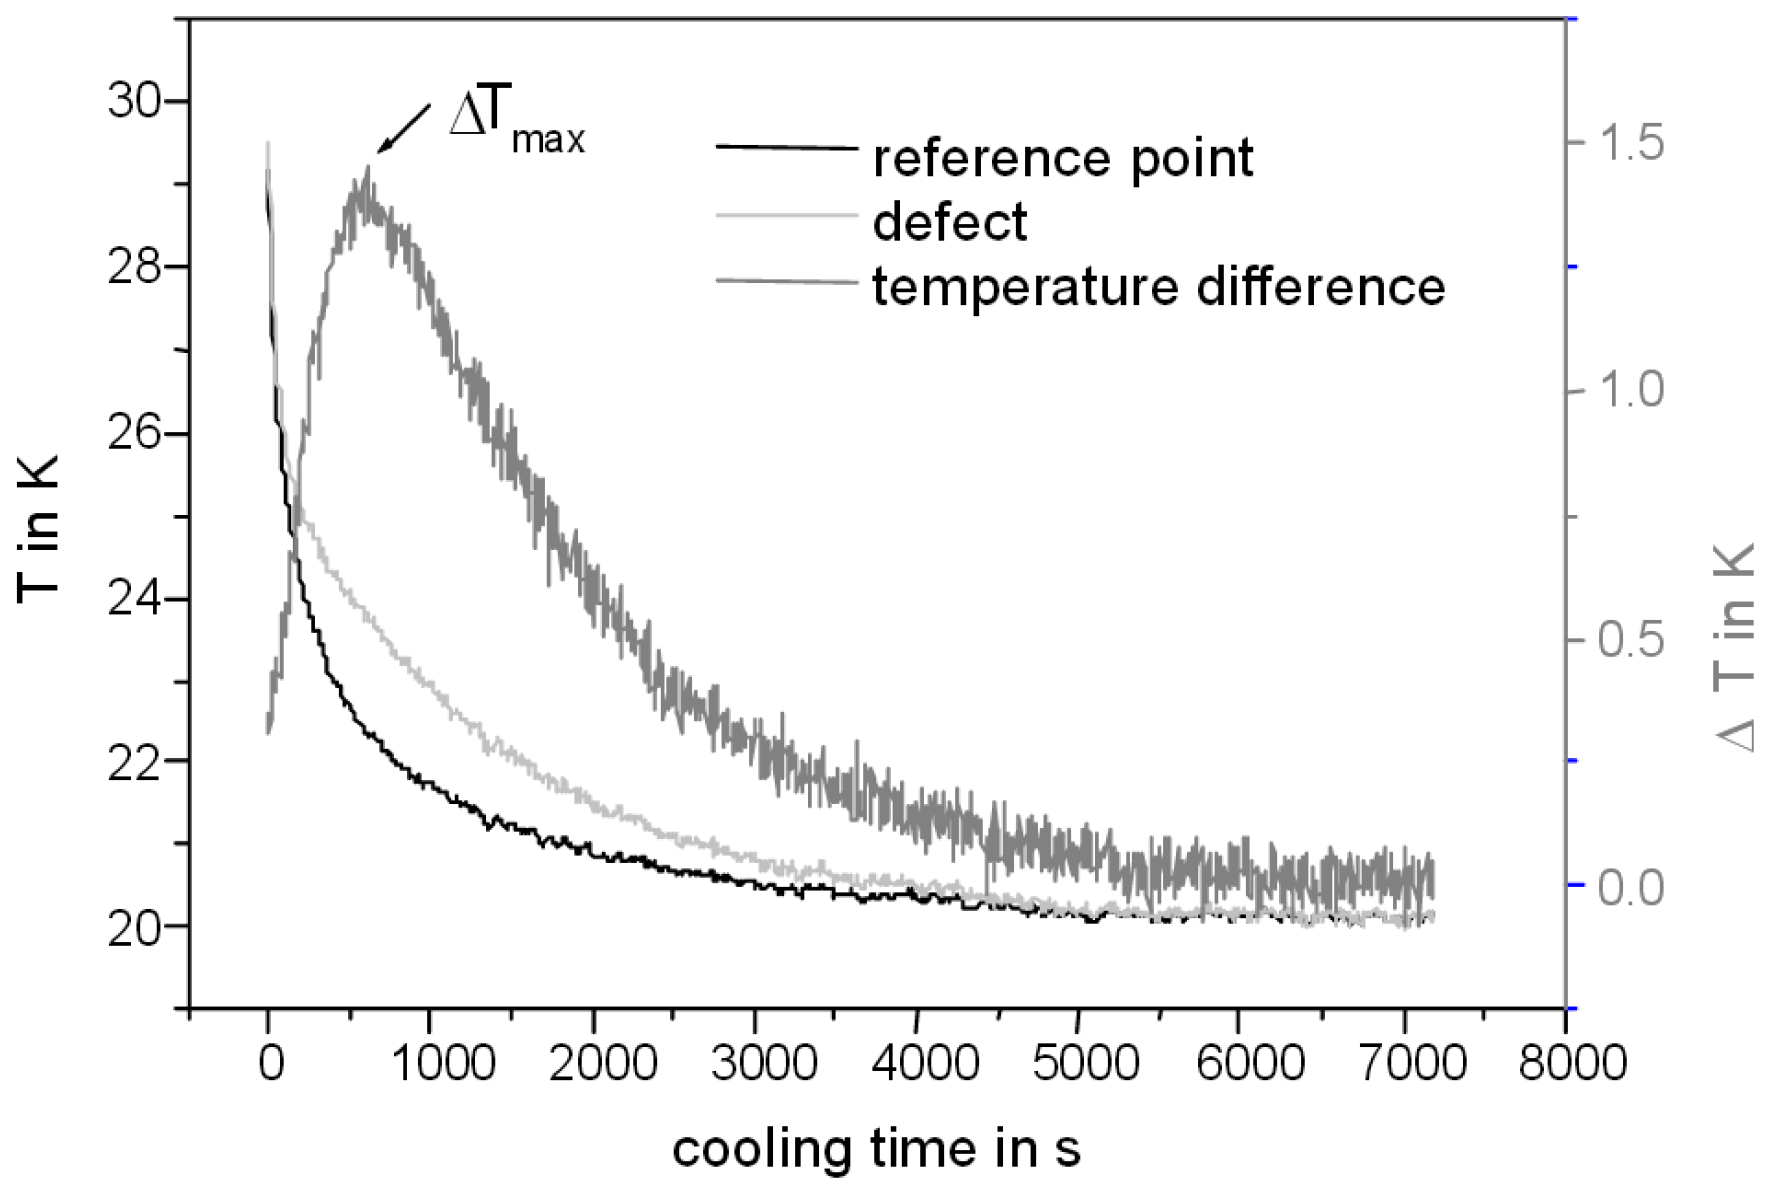
versus cooling time for selected areas with and without inhomogeneities. These selected transient curves were compared and difference curves (difference between transient above the void and transient above the sound area) were calculated. The difference curves (
Figure 12) usually have a maximum of the temperature difference ∆T
max at a distinct time t
max, which depends mainly on the difference of thermal properties, depth of the void and the heating time [
30].
Pulse phase thermography (PPT) is based on the application of the Fast Fourier Transformation (FFT) to all transient curves of each pixel. Thus, one obtains amplitude and phase images for all frequencies. Amplitude images show the internal structure of a specimen up to a maximum available depth depending on the frequency (low pass filter behavior), while phase images show the internal structure within a certain depth range depending on the frequency (band pass filter behavior) [
29,
30].
Akashi
et al. [
49] performed a statistical and analytical study on the relationship between characteristics of the temperature variation and inherent damage of the concrete from the historical inspection database, and developed an automatic damage classification system that can classify the damage rate into three categories: Critical (crack exists and reaches to the concrete surface; immediate action is required), Caution (crack exists within 2 cm depth from the concrete surface; close monitoring is recommended) and Indication (crack exists within 4 cm depth from the concrete surface; currently satisfactory).
Abdel-Qader
et al. [
50] presented an algorithm developed in order to automate the detection of subsurface defects in concrete bridge decks using IRT. This algorithm is based on the region growing approach, which segments the image and identifies the voids without human interference or prior knowledge of the conditions. The algorithm was tested on images collected from concrete bridge deck specimens containing various manmade defects and also on a defect-free control model. The experimental work successfully identified defects in concrete bridge decks up to 7.62 cm below surface using IRT (
Figure 13 [
50]).
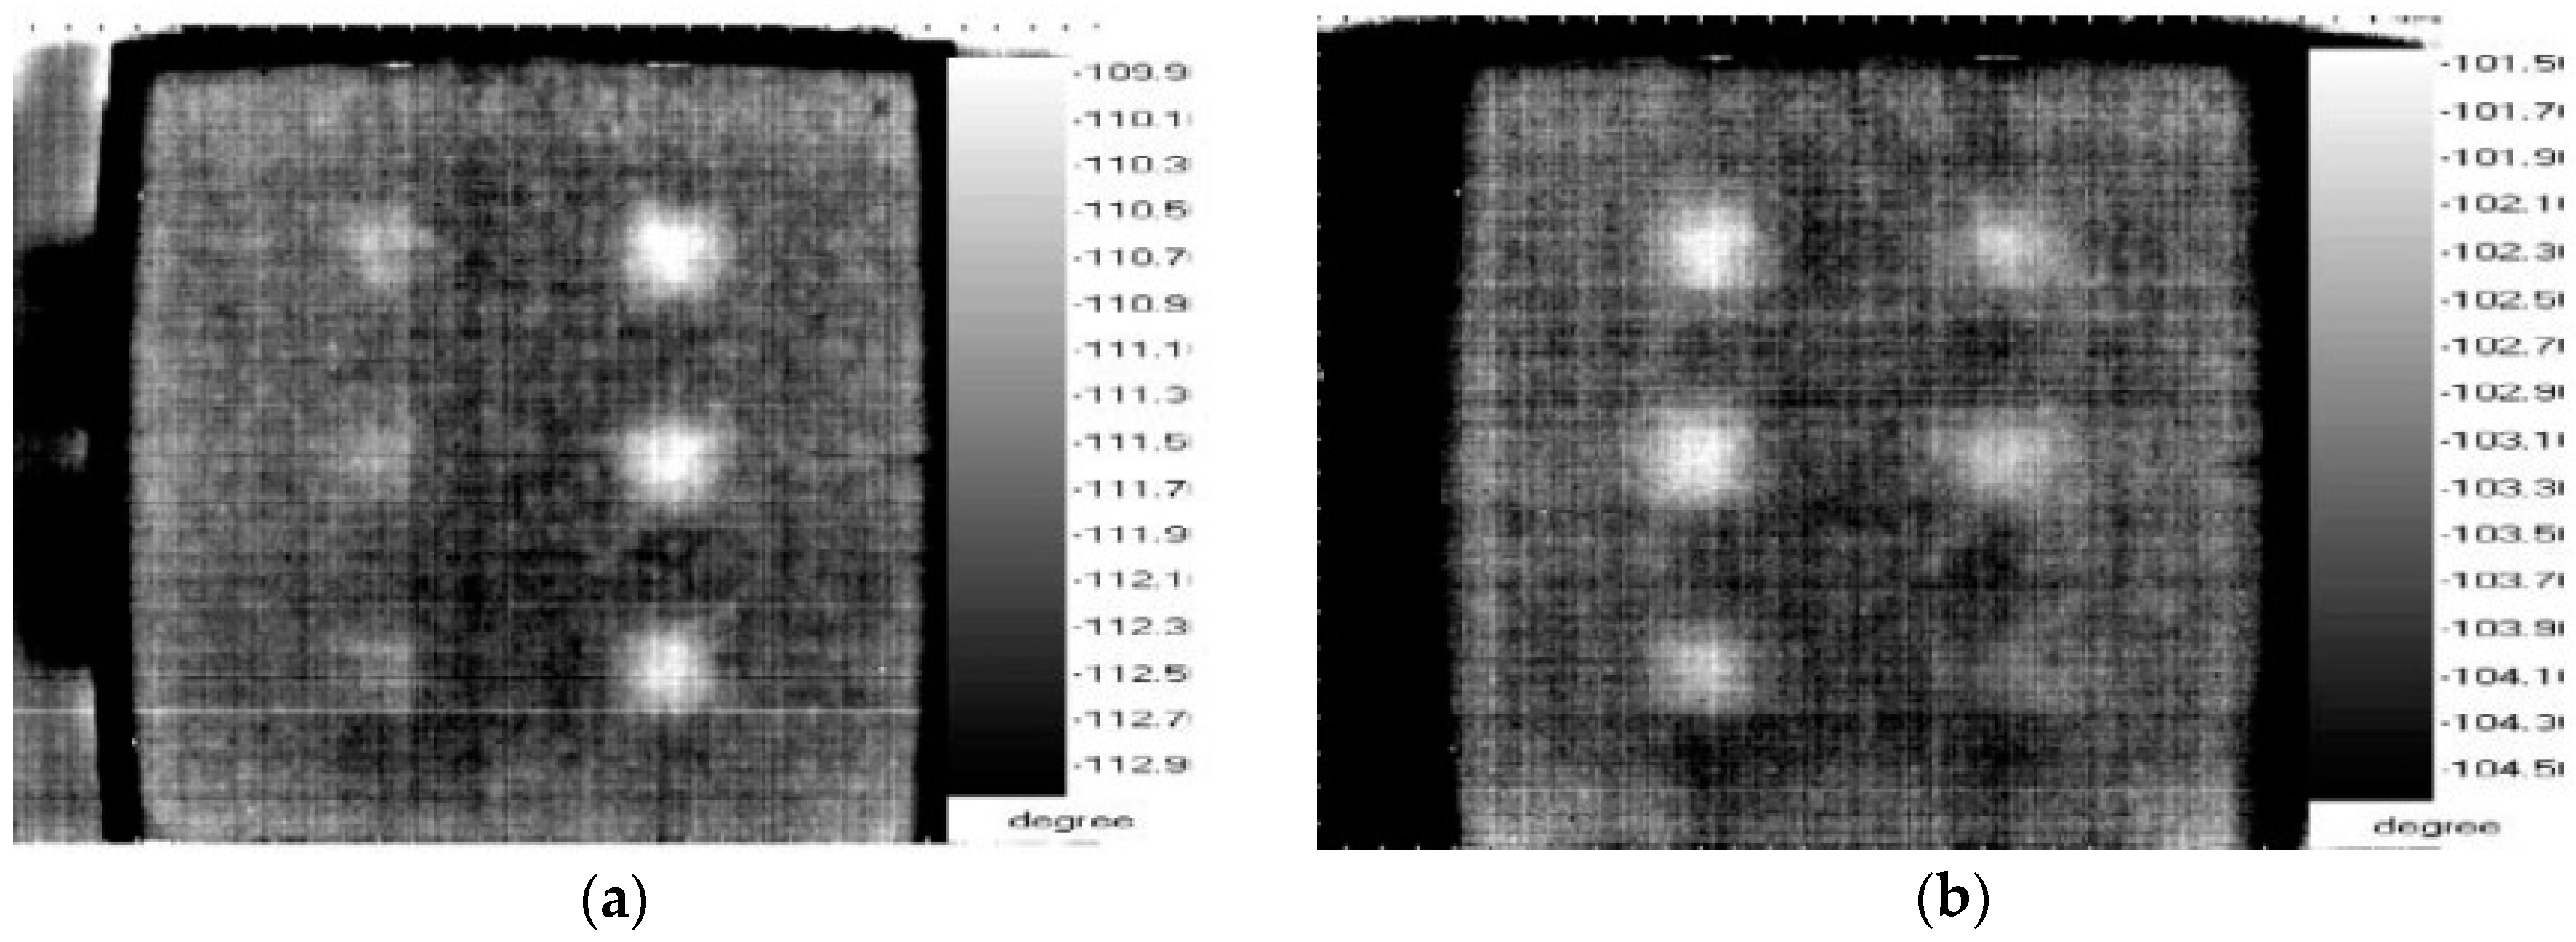
Dumoulin and Averty [
51] developed a system which enables remotely controlled monitoring and surveillance as well as real time data imaging of the critical transport infrastructures. The data were gathered during four days (
Figure 14), after which FFT was performed on the sequence of thermograms, which enabled the researcher to get an insight in the inner deck structure (
Figure 15).
Investigation on inner deck structure were also done by using Singular value decomposition (SVD), allowing to extract the spatial and temporal information from a thermal image sequence (
Figure 15).
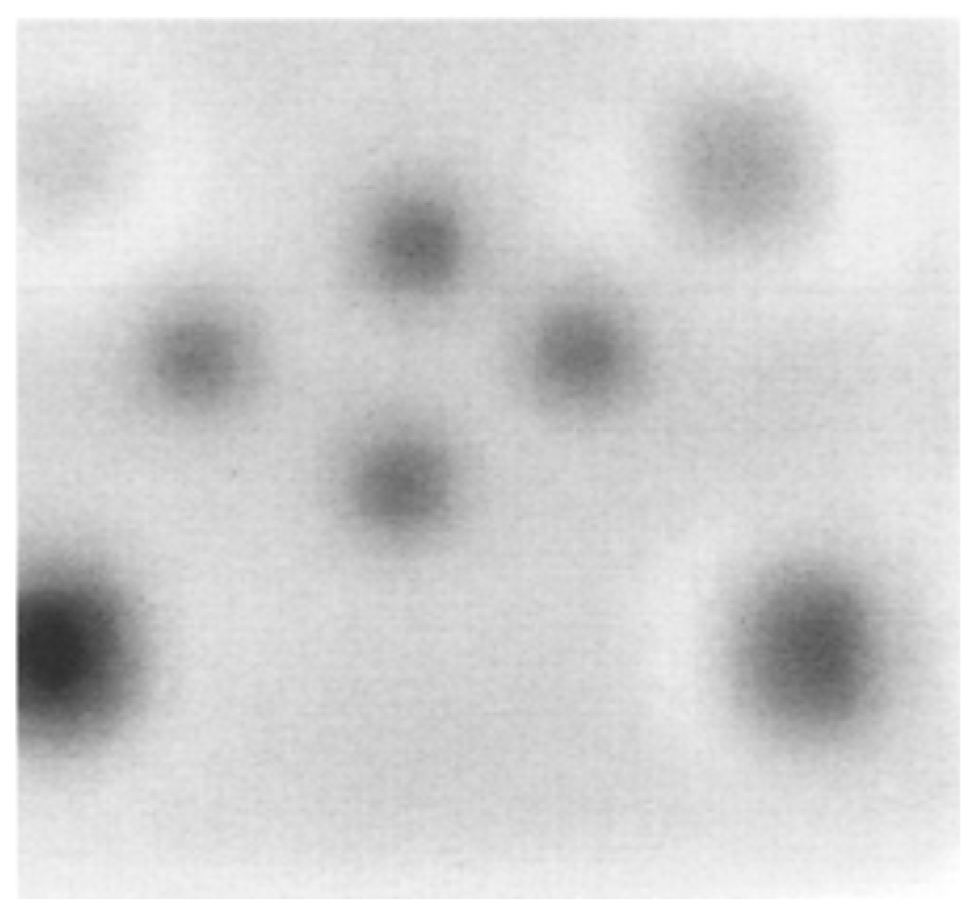
The results of the research where pulsed PPT, principle component thermography (PCT) and correlation operators’ technique were applied in the post-processing of the sequence of thermograms are presented in [
25]. The results show a noticeable improvement in the possibility of detecting damage in case of using the phase images, empirical orthogonal functions (EOFs) and correlograms compared to thermograms (
Figure 16). From the images presented by [
25], it is evident that the existence of reinforcement affects the possibility of detecting defects and its characterization (size and shape). The contrast between the defect located behind reinforcement and the sound area is smaller thus decreasing its detection possibility.
Research and development continue to push the thermogram analysis approaches for improvements in the resolution and sensitivity, as well as in the pixel uniformity and operability. For example, Soldan [
52] proposed a new solution for getting an all-in-focus measurement. His work comprised of taking a measurement series with changed focal settings and then combining the sharp parts using digital image processing. Additionally, Restrepo
et al. showed a technique that is promising but was only applied on CFRP slabs [
53,
54]. The technique is based on the new model of finite differences discretization of Fourier heat propagation in 3D and its application on a sequence of IR images. The new model not only allowed the enhancement of the contrast, but also automatically detects and characterizes the defects found in composite slabs [
53,
54]. Another algorithm for the enhancement of active IRT data and elimination of noise based on Green’s functions was also demonstrated by Goetschel
et al. in [
55]. Finally, Bajorek and Nowakowski modified the thermal tomography reconstruction algorithm to improve the speed of calculations for faster reconstruction of thermal and geometrical parameters of a structure [
56].
6. Defect Detectability and Quantification
Data processing procedures described above might lead to the identification of inhomogeneities induced after thermal activation of a lower or higher surface temperature than in the sound area. The characterization (size, depth, thickness) of these inhomogeneities can only be determined if comprehensive prior-knowledge is available. RILEM report states that quantitative results will be available only on the depth of inhomogeneities or defects, and that these qualitative results will at the same time have more or less large relative errors [
30]. Nevertheless, there are several researchers that tried to characterize the defects based on IRT measurement results, and assumptions like those that voids are filled with air, or water, respectively. The following sections also give an overview in the work that is considered by the authors of this paper to have potential for the defect characterization in the field of concrete structures.
Meola [
57] discusses the factors that influence the defect detection, which are being simply represented as geometrical factor
FG; a thermal factor
FT; and a detection or measure factor
FD. The
FG includes defect diameter (or equivalent diameter)
d and thickness
sd, as well as the thickness of the host material
ss, and can be simply represented as:
FG =
f (
d,
sd,
ss).
FT includes the thermal characteristics (
i.e., thermal conductivity
k, thermal diffusivity
α, and thermal effusivity
e) of both the defect and the host material. If the thermal effusivity is considered
FT = f (ed,
es) being
es the thermal effusivity of the host material and
ed the thermal effusivity of the defect. At last,
FD is a function of the characteristics of the used instrumentation (e.g., sensitivity of the infrared camera) and test parameters [
57]. Through these three parameters, Meola [
57] can describe any defect and/or the host materials. She introduced two dimensionless quantities,
DT (as the normalized temperature difference between defect and defect free material) and
De (as a function of
FG and
FT of both defect and defect free material) (Equations (3) and (4)).
where
Nl is the number of layers,
e the thermal effusivity,
sd the defect thickness and
ss the thickness of defect free material, while
p and
d are the defect depth and diameter, respectively [
57]
where
Ts is the temperature of defect free material,
Td is the temperature above the defect while
Tr is a temperature reference. In fact,
Tr is the temperature of the defect free material before transient heating, or cooling, starts
Tr =
Ts(t = 0) (
i.e., the temperature of the first thermal image taken at
t = 0 in the time sequence) [
57]. It was observed that a power law relationship exist between
DT and
De with the parameters as described in [
57] (
Figure 17). Here,
kr is the relative thermal conductivity (Equation (5)), where
ks and
kd, are thermal conductivities of sound material and defect itself, respectively [
57].
The practical significance and usefulness of
De is that it allows a rapid estimation of the thermal contrast caused by a certain defect inside a specific material during the thermal stimulation [
57].
The applicability and limitations of void and delamination detection below concrete cover, using active IRT with the thermal contrast and phase contrast evaluation techniques, have been studied experimentally by [
58]. It was concluded by Cotič
et al. that the optimal heating time depends strongly on the experimental set-up used, and on the geometry of the investigated specimen. The main result of the work performed by [
58] is the detectability graph shown in
Figure 18.
The authors in [
58] emphasize that this scheme (
Figure 18) is only valid in the case of heating energies that are typically generated by the heat sources described in the paper, and for IR cameras having a medium performance range. It is also stated in [
58] that by applying the thermal contrast method, it is possible to detect defects of size
D, if the defect is covered by a layer of concrete cover having a thickness of 0.9
D or less. On the other hand, by applying the phase contrast method, it is possible to observe defects beneath somewhat deeper layers of concrete (≈ 1.3
D), which represents an improvement of almost 50% compared to that achievable by the thermal contrast method [
58].
Based on a theoretical one-dimensional solution of pulsed thermography, [
59] analyzed the depth predicting principle and procedure of four representative methods for the non-air interface situation, and compared with experimental results of one machined steel sample with eight flat-bottom holes. The results indicate that Peak slope time (PST), Absolute peak slope time (APST) and Logarithmic peak second-derivative (LPSD) methods can give accurate defect depth for all kinds of sample–defect interface. However, the Peak contrast time (PCT) method is easily affected by defect size, sample–defect interface [
59]. On the other hand Zeng
et al. [
60] propose a new method for defect depth prediction. This method is very similar to APST method but it is not sensitive to the noise because no derivation is required. On the other hand, it is affected by the defect size such as the PCT method.
By using a PPT, Dumoulin
et al. [
38] attempted to estimate the defect depth by using a direct relationship between the depth of a defect and the thermal diffusion length, encompassing an empirical constant and a blind frequency of the phase. It has to be said that the error between the real defect depth and the calculated defect depth in [
38] was significant.
Lai
et al. [
61] employed IRT for the analysis of the thermo-signals and to relate, characterize and differentiate embedded interfacial flaws and delaminations generated in externally bonded CFRP and concrete composites. In particular, the apparent flaw sizes estimated by the quantitative IRT were verified to have 88% accuracy, by the image processing method after opening-up the composite, [
61].
Dudzik [
62] presented a two-stage neural algorithm for defect detection and characterization. In order to estimate the defect depth, two neural networks trained on data obtained using an active IRT were employed. The first stage of the algorithm was developed to detect the defect by a classification neural network. Then the defect’s depth is estimated using a regressive neural network. The results were obtained using a test sample made of material with a low thermal diffusivity (0.12 × 10
−6 m
2·s
−1), which is even lower than that of concrete. The largest value of the relative mean error of the defect depth estimation for the testing data was equal to 4.6% [
62].
An evaluation technique for the characteristics of rebar corrosion (
i.e., corrosion rate) in concrete structures was developed by [
63]. Oshita estimated the corrosion of rebar from the temperature history at the concrete surface, which varies due to heat conduction from the reinforcement heated by electro-magnetic induction. If corrosion product exists on the rebar, the temperature at the concrete surface just above the corroded region of rebar becomes lower than that of the non-corroded region by the effect of the thermal property of the corrosion product. Thus, the temperature on the surface of the concrete is dependent on the thickness and distribution of the corrosion products. The thermal characteristics of the corrosion products are similar to those of air, as the specific heat is relatively large, and the thermal conductivity is inversely small [
63].
Some of the research presented in this section seems to be very promising but additional research needs to be performed in order to be able to use IRT for
in-situ measurements and defect quantification. It can be seen from the presented that research regarding the defect quantification,
i.e., measurement of defect diameter, depth and thickness is scarce. Even though there have been some good studies done on defect quantification, it has to be said that researchers use empirical expressions, which often lack of conclusive physical meaning. This means that often these empirical relations are valid only for specific testing situation. It is believed by the authors that recent efforts in the defect quantification in the field of aerospace engineering and other fields of application of IRT are promising. Due to the fact that there are significant differences in the testing methodology between materials in for example aerospace industry and concrete structures (as described in
Section 1 of this paper) as well as the mechanism of energy input in these materials, additional research is needed.
It has to be emphasized here that it is quite difficult to make relative comparison of the results acquired by different research groups. These difficulties emerge from the fact that the results shown in this paper were acquired by using a variety of equipment setup (thermal excitation as well as the acquisition equipment), duration of heating, as well as the size, thickness of defects and concrete quality. In addition, some researchers concluded that there is difference between simulated and real defects that can be found in-situ, there are also other difficulties regarding the transfer of the method from laboratory to in-situ testing, as already mentioned in the paper.
7. Future Work
Compared with other NDT methods that are already well established in civil engineering industry, active thermography is a relatively new method.
The results from this research have highlighted a number of gaps in the literature, which suggest that either of these methodologies have not been utilized for particular defects yet, or that they are not appropriate for detecting these defects. Despite all the research shown also in this paper, still traditional methods, sounding and visual inspections, are mainstream for infrastructural inspection. In order to become more commonly used method, the reliability of the developing IRT technologies should be increased and brought into the same level as the reliability of traditional methods. Additionally, the work on the testing methodology should continue, since the methodology of application of active IRT as a NDT method for maintenance of infrastructure is not well defined yet, this would consequently result with the recommendations for test procedures and protocols for the use of active IRT on reinforced and prestressed concrete structures.
It was shown that artificially damaged parts, tend to exaggerate the features of the real defects [
28],
i.e., it is much easier to detect them by IRT. Therefore, it is important to conduct additional research in order to prove the applicability of IRT for detecting natural anomalies (delaminations, corrosion, cracking and concrete degradation) in existing structures to prove the accuracy and reliability of the IRT.
In the opinion of the authors of this paper, five performance measures should be investigated in future research in order to advance the use of IRT techniques in investigation of reinforced and prestressed concrete structures: accuracy; repeatability; ease of data collection, analysis and interpretation; speed of data collection and analysis; and the cost of data collection and analysis.
Additional research should also be directed to solving the Inverse Problem to characterize the defects, i.e., to obtain information about the thermal and geometrical properties of the detected defects from the difference curves. This implies performing numerical simulations, which need comprehensive knowledge on the test conditions and material properties (the thermal properties of sound and defected material must be known) to be able to get useful results. In addition, several techniques for defect quantification are being developed in the field of composites that should be explored and in future potentially used for defect quantification in reinforced concrete structures.
The focus of IRT research and development will further advance with the development of the higher number of pixels (of the order of 106) with the FPA structure, which are expected to be developed in a short time. The increasing development of microsystem technologies, such as sensors, controls and actuators is also expected to induce the production of high level products at contained cost. These will provide improvements in performance, reliability and cost, and thus the wider applicability.
Considering all of the above, it can be said that possibilities for additional research exist in the field of image acquisition and processing, as well as in the field of quantification of defects. Techniques and procedures in these fields are already advancing for applications other than civil engineering.
8. Conclusions
This review has highlighted the different methodologies that use natural excitation sources as well as active infrared thermography methodologies that are currently being researched and applied in the field of reinforced and prestressed concrete structures, and has verified the effectiveness and usefulness of IRT as a NDT tool in concrete structures.
It can be said that by using IR camera for the NDT of concrete structures, the amount of time needed to inspect the structure can be significantly reduced. This is because the result of IRT, the thermograms, which are screening of potential concrete defects in concrete subsurface, can pinpoint the defected areas in the concrete structures and thus reduce the amount of time to inspect compared to sounding test, since there is no need to inspect spot by spot.
However, traditional methods, sounding and visual inspections, are still mainstream for infrastructural inspection because the reliability of IRT is not enough compared to traditional methods, and the IRT methodology as a NDT method for an infrastructure maintenance is not well defined yet.
The principal problem involved in the detection of defects in concrete structures by active IRT is the system of heating. To obtain a good quality of detection, the thermal stimulation must be as uniform as possible. To be less dependent on this constraint, image processing techniques have to be employed, which have their own set of problems and have to consequently be further developed.
The main advantages of post-processing techniques are: better detectability of defects as well as much lower sensitivity to non-uniformities of heating, irregularities and differences in surface colors. The challenge is the applicability of these methods under on-site conditions to inspect concrete walls of wastewater treatment plants or bridge beams and decks.
This work has also shown that some of the IRT techniques might be suitable for detecting some defects, but not others, also in some situations defects in reinforced concrete structures might be completely overlooked. Additionally, correct methodologies should be used when IRT is being applied to detect defects in concrete structures since the data (single thermograms or sequences of thermograms) could be misinterpreted due to a lack of understanding of the structure or internal conditions.
The thermal image analysis methods that follow an IRT inspection have also been reviewed, and the future trends of thermal imaging of concrete structures have been outlined. It can be concluded that while IRT is a useful tool in NDT of concrete structures, there is great prospect for the development of more advanced, effective and accurate techniques that will employ a combination of the available thermography approaches.
To increase the reliability, for enhancing the accuracy of quantitative results, for unambiguous data interpretation and for taking advantage of different and, in some instances, complementary physical effects, it is useful to combine complementary NDT methods.


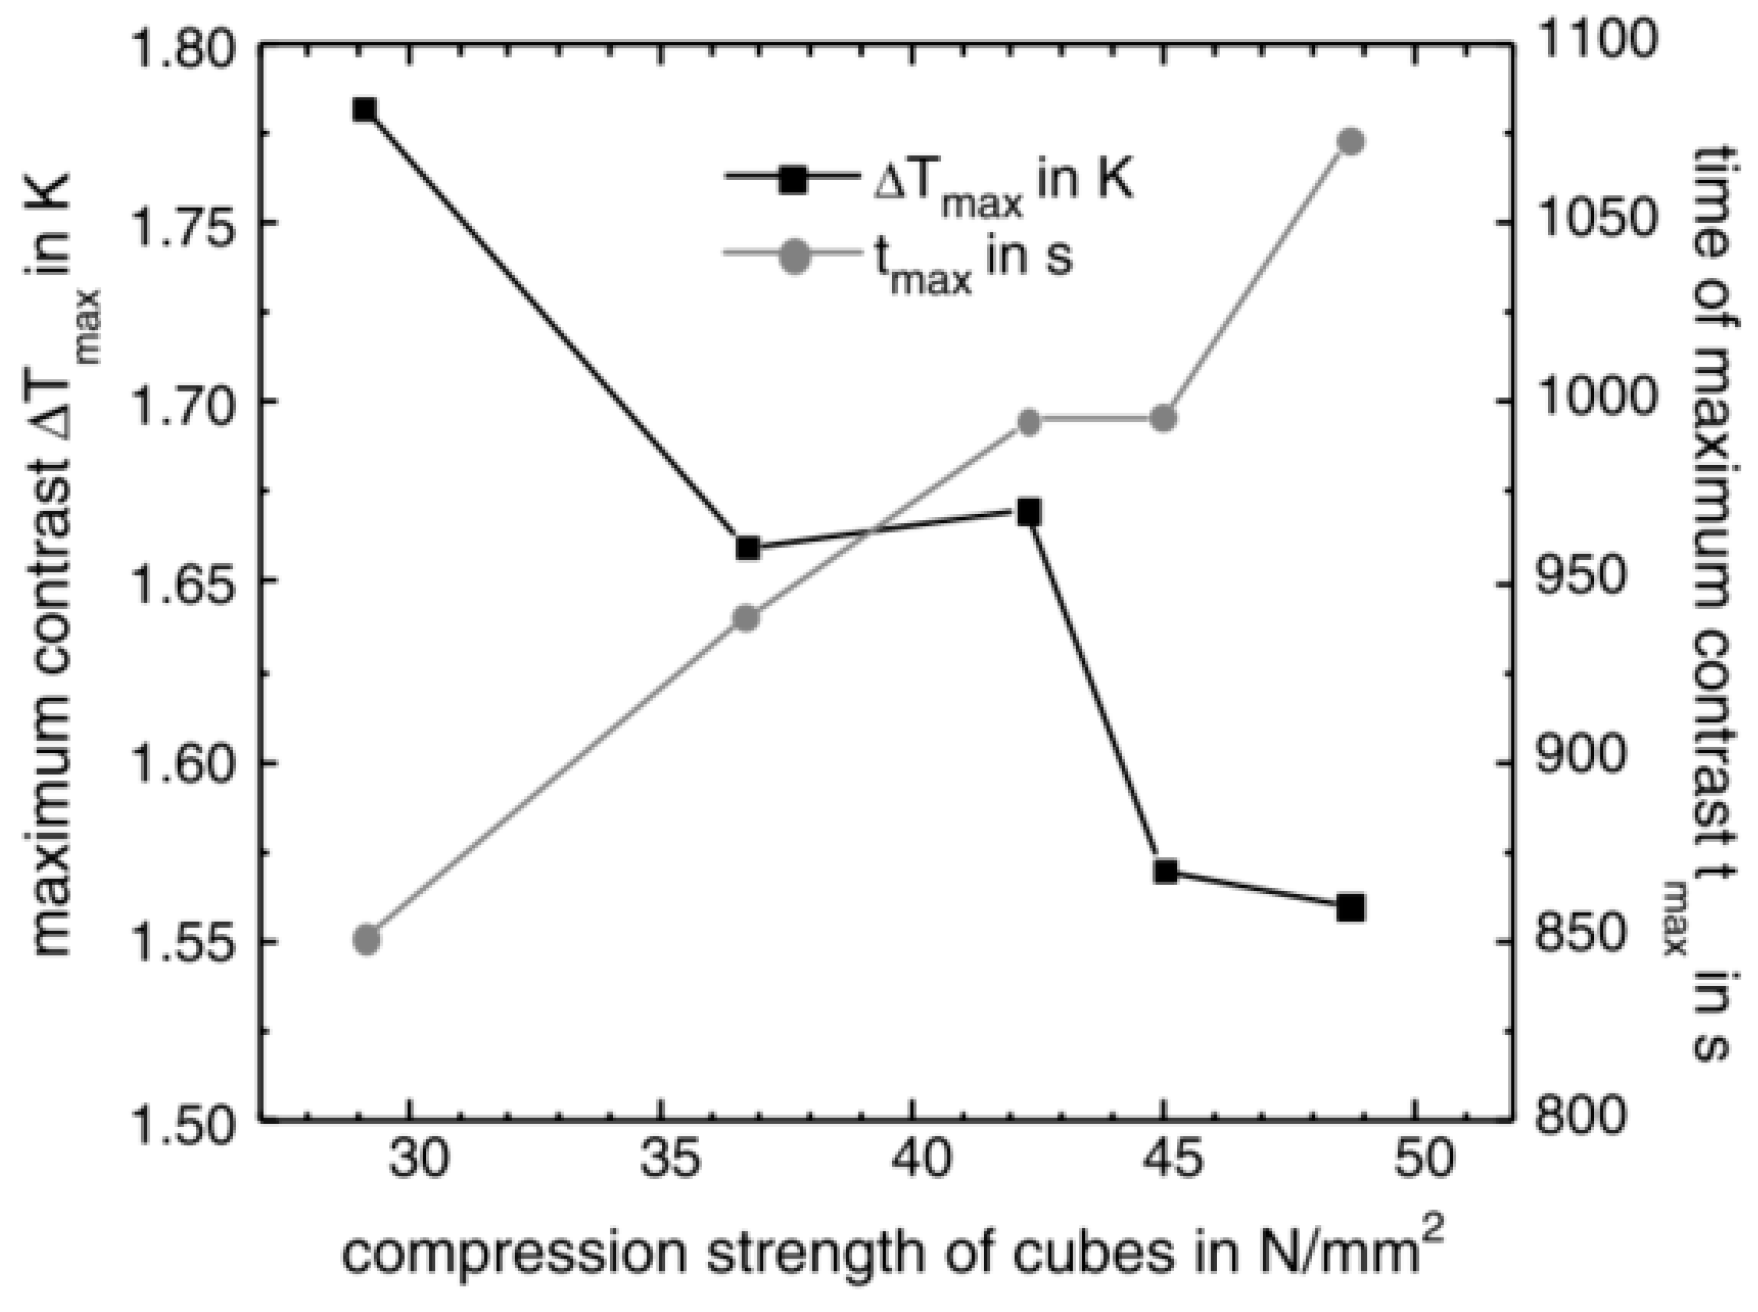
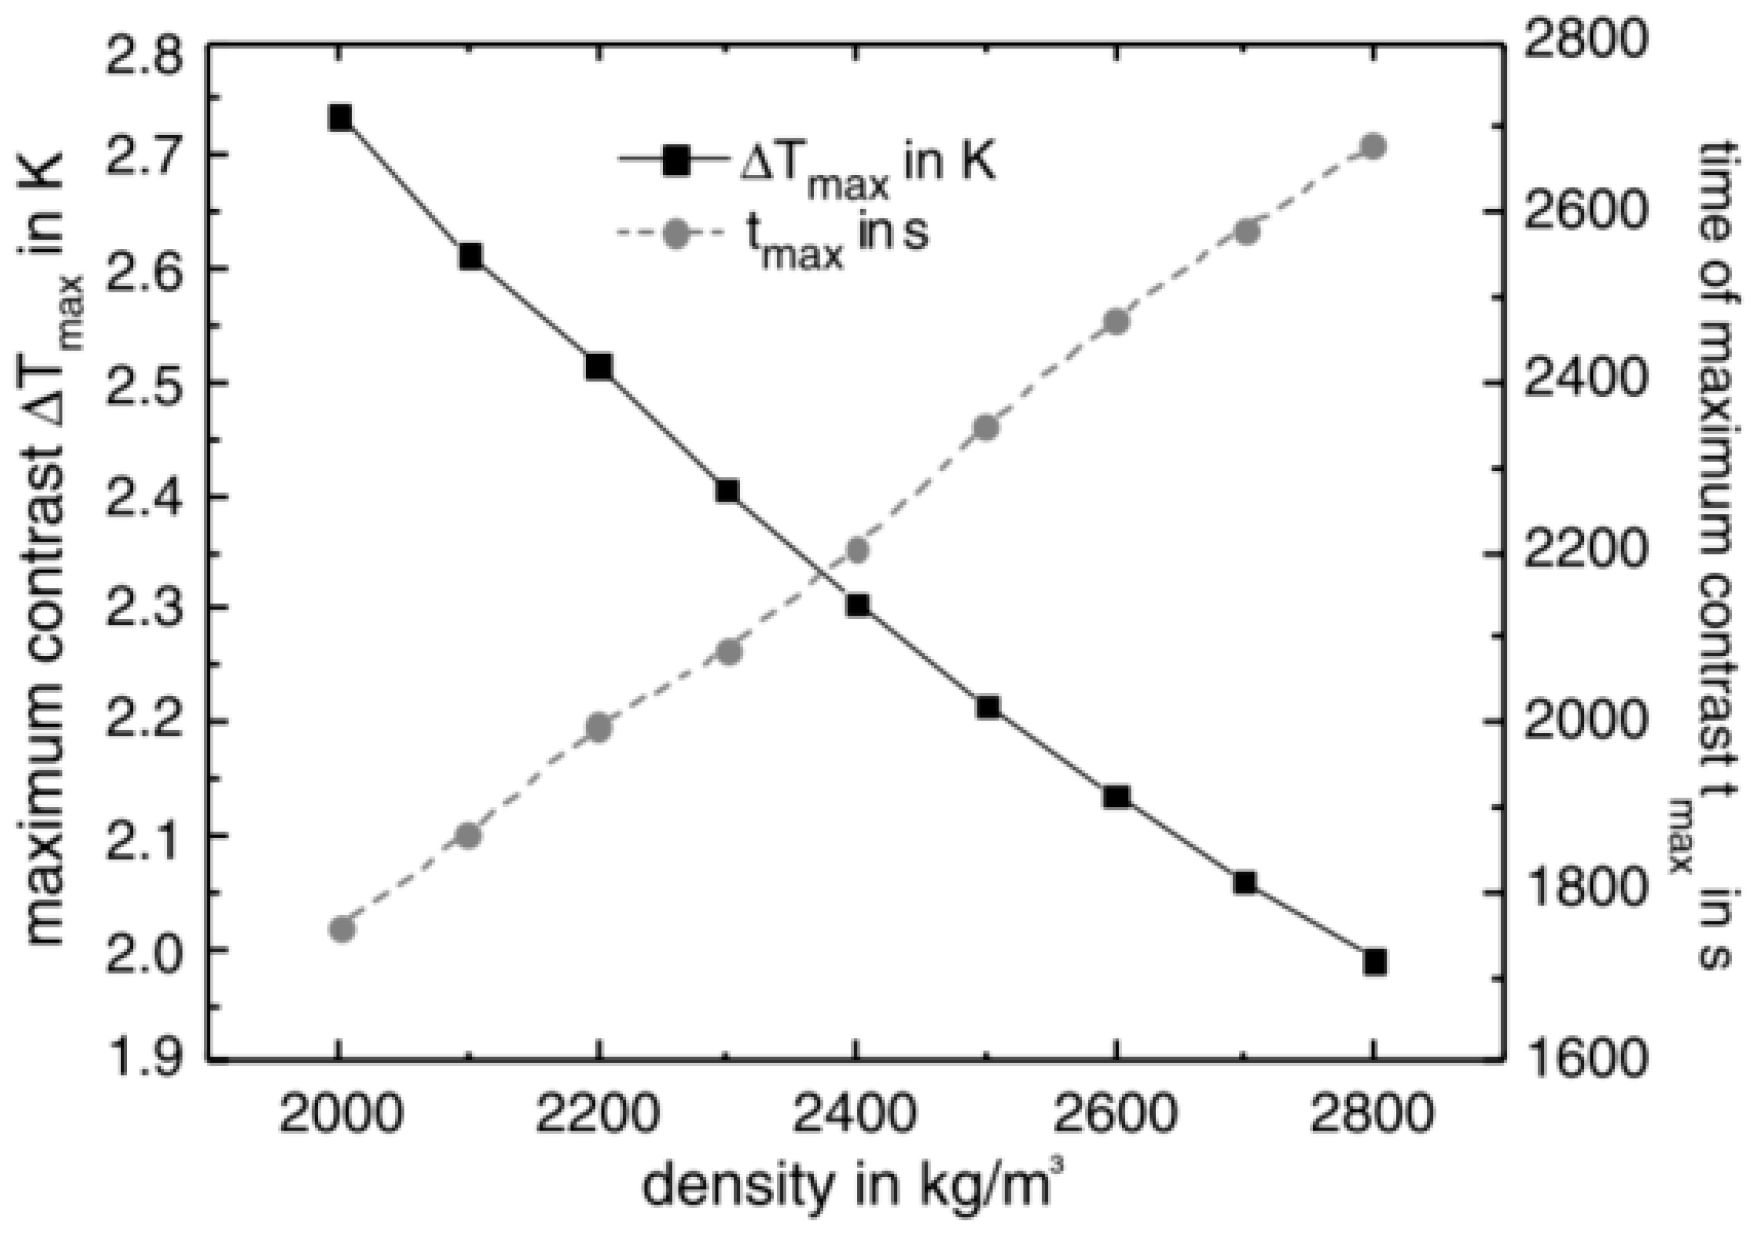
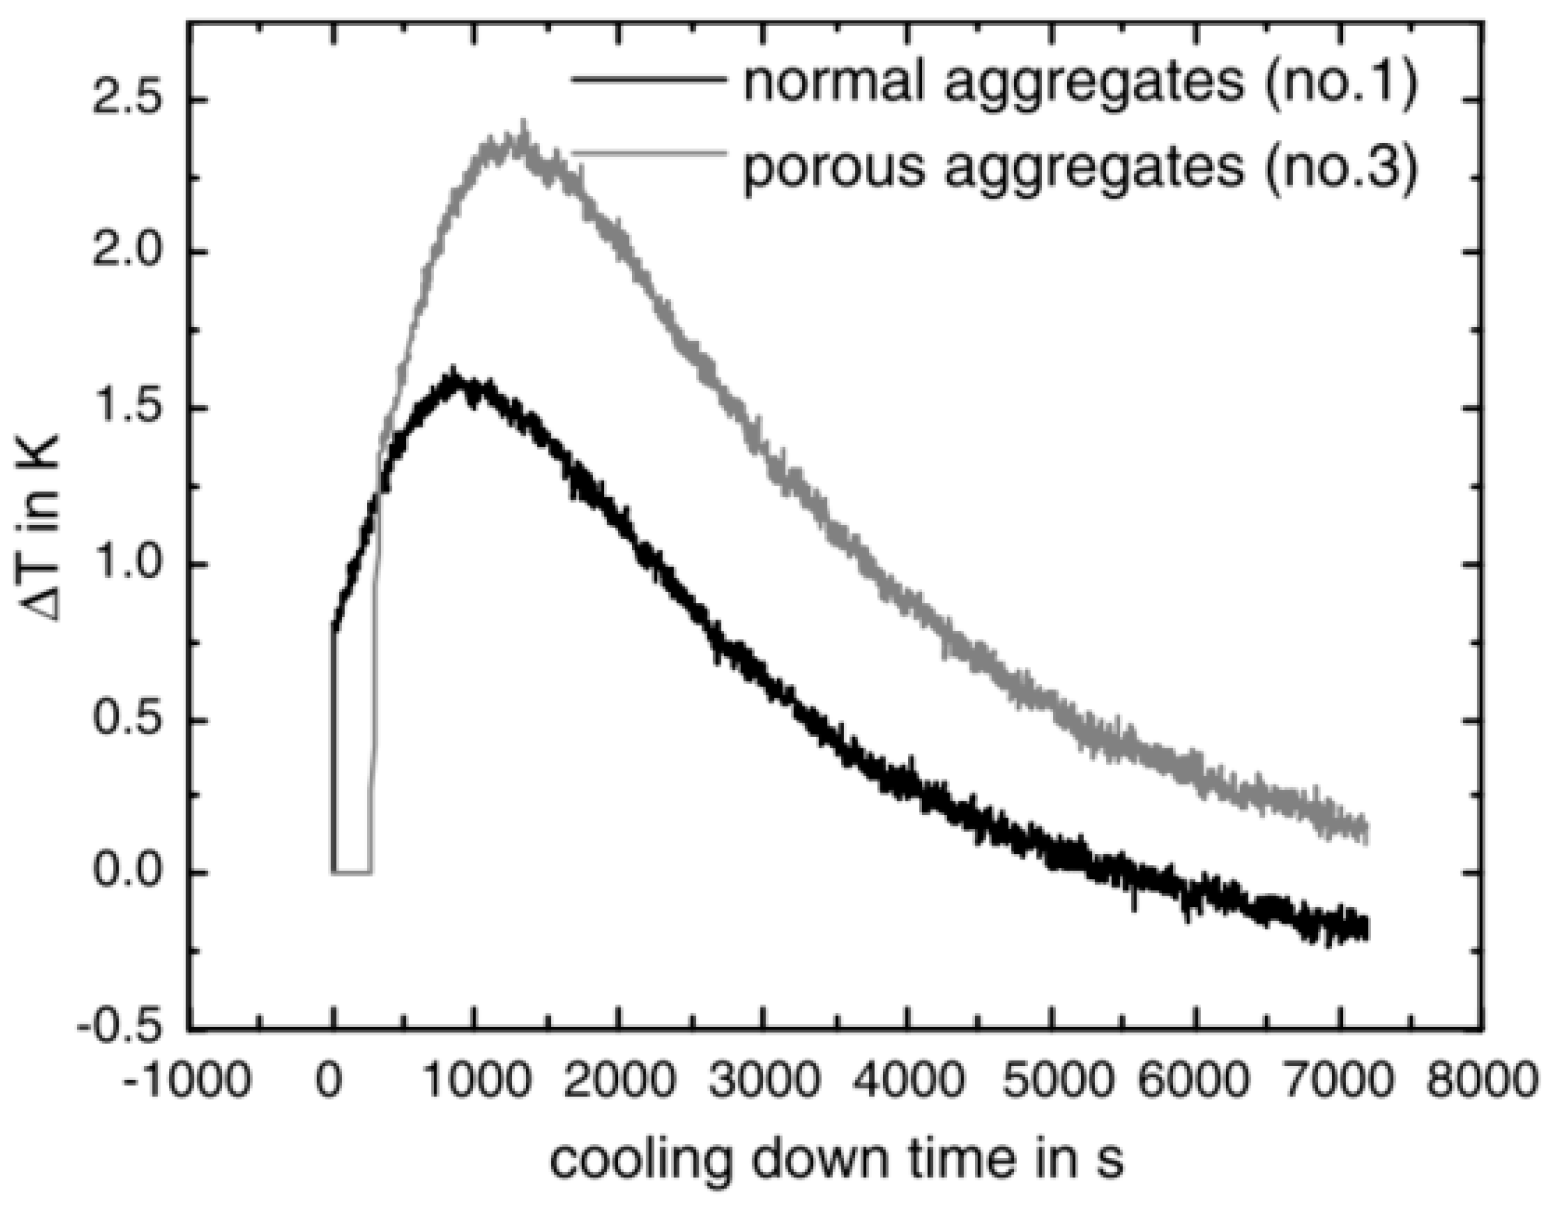
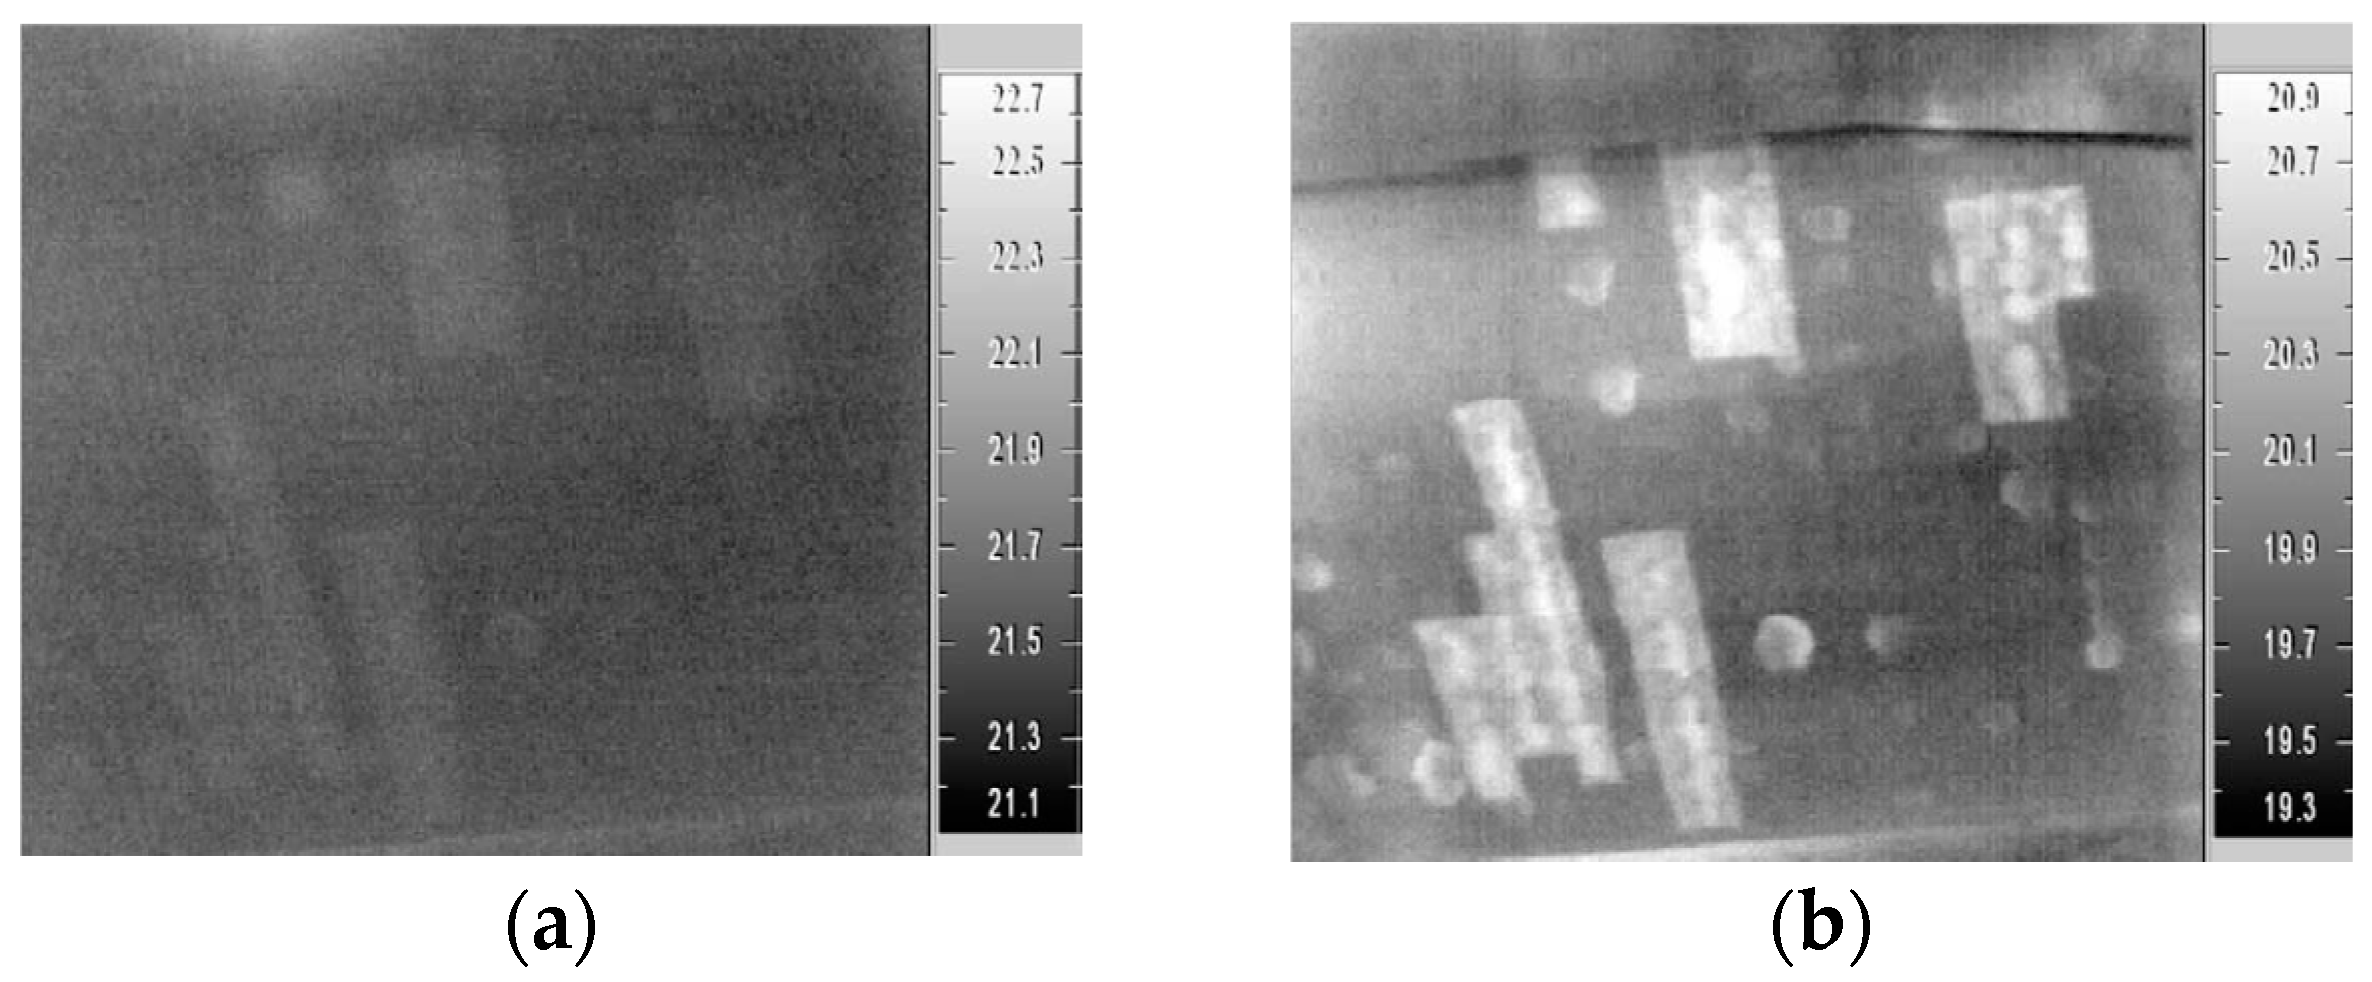
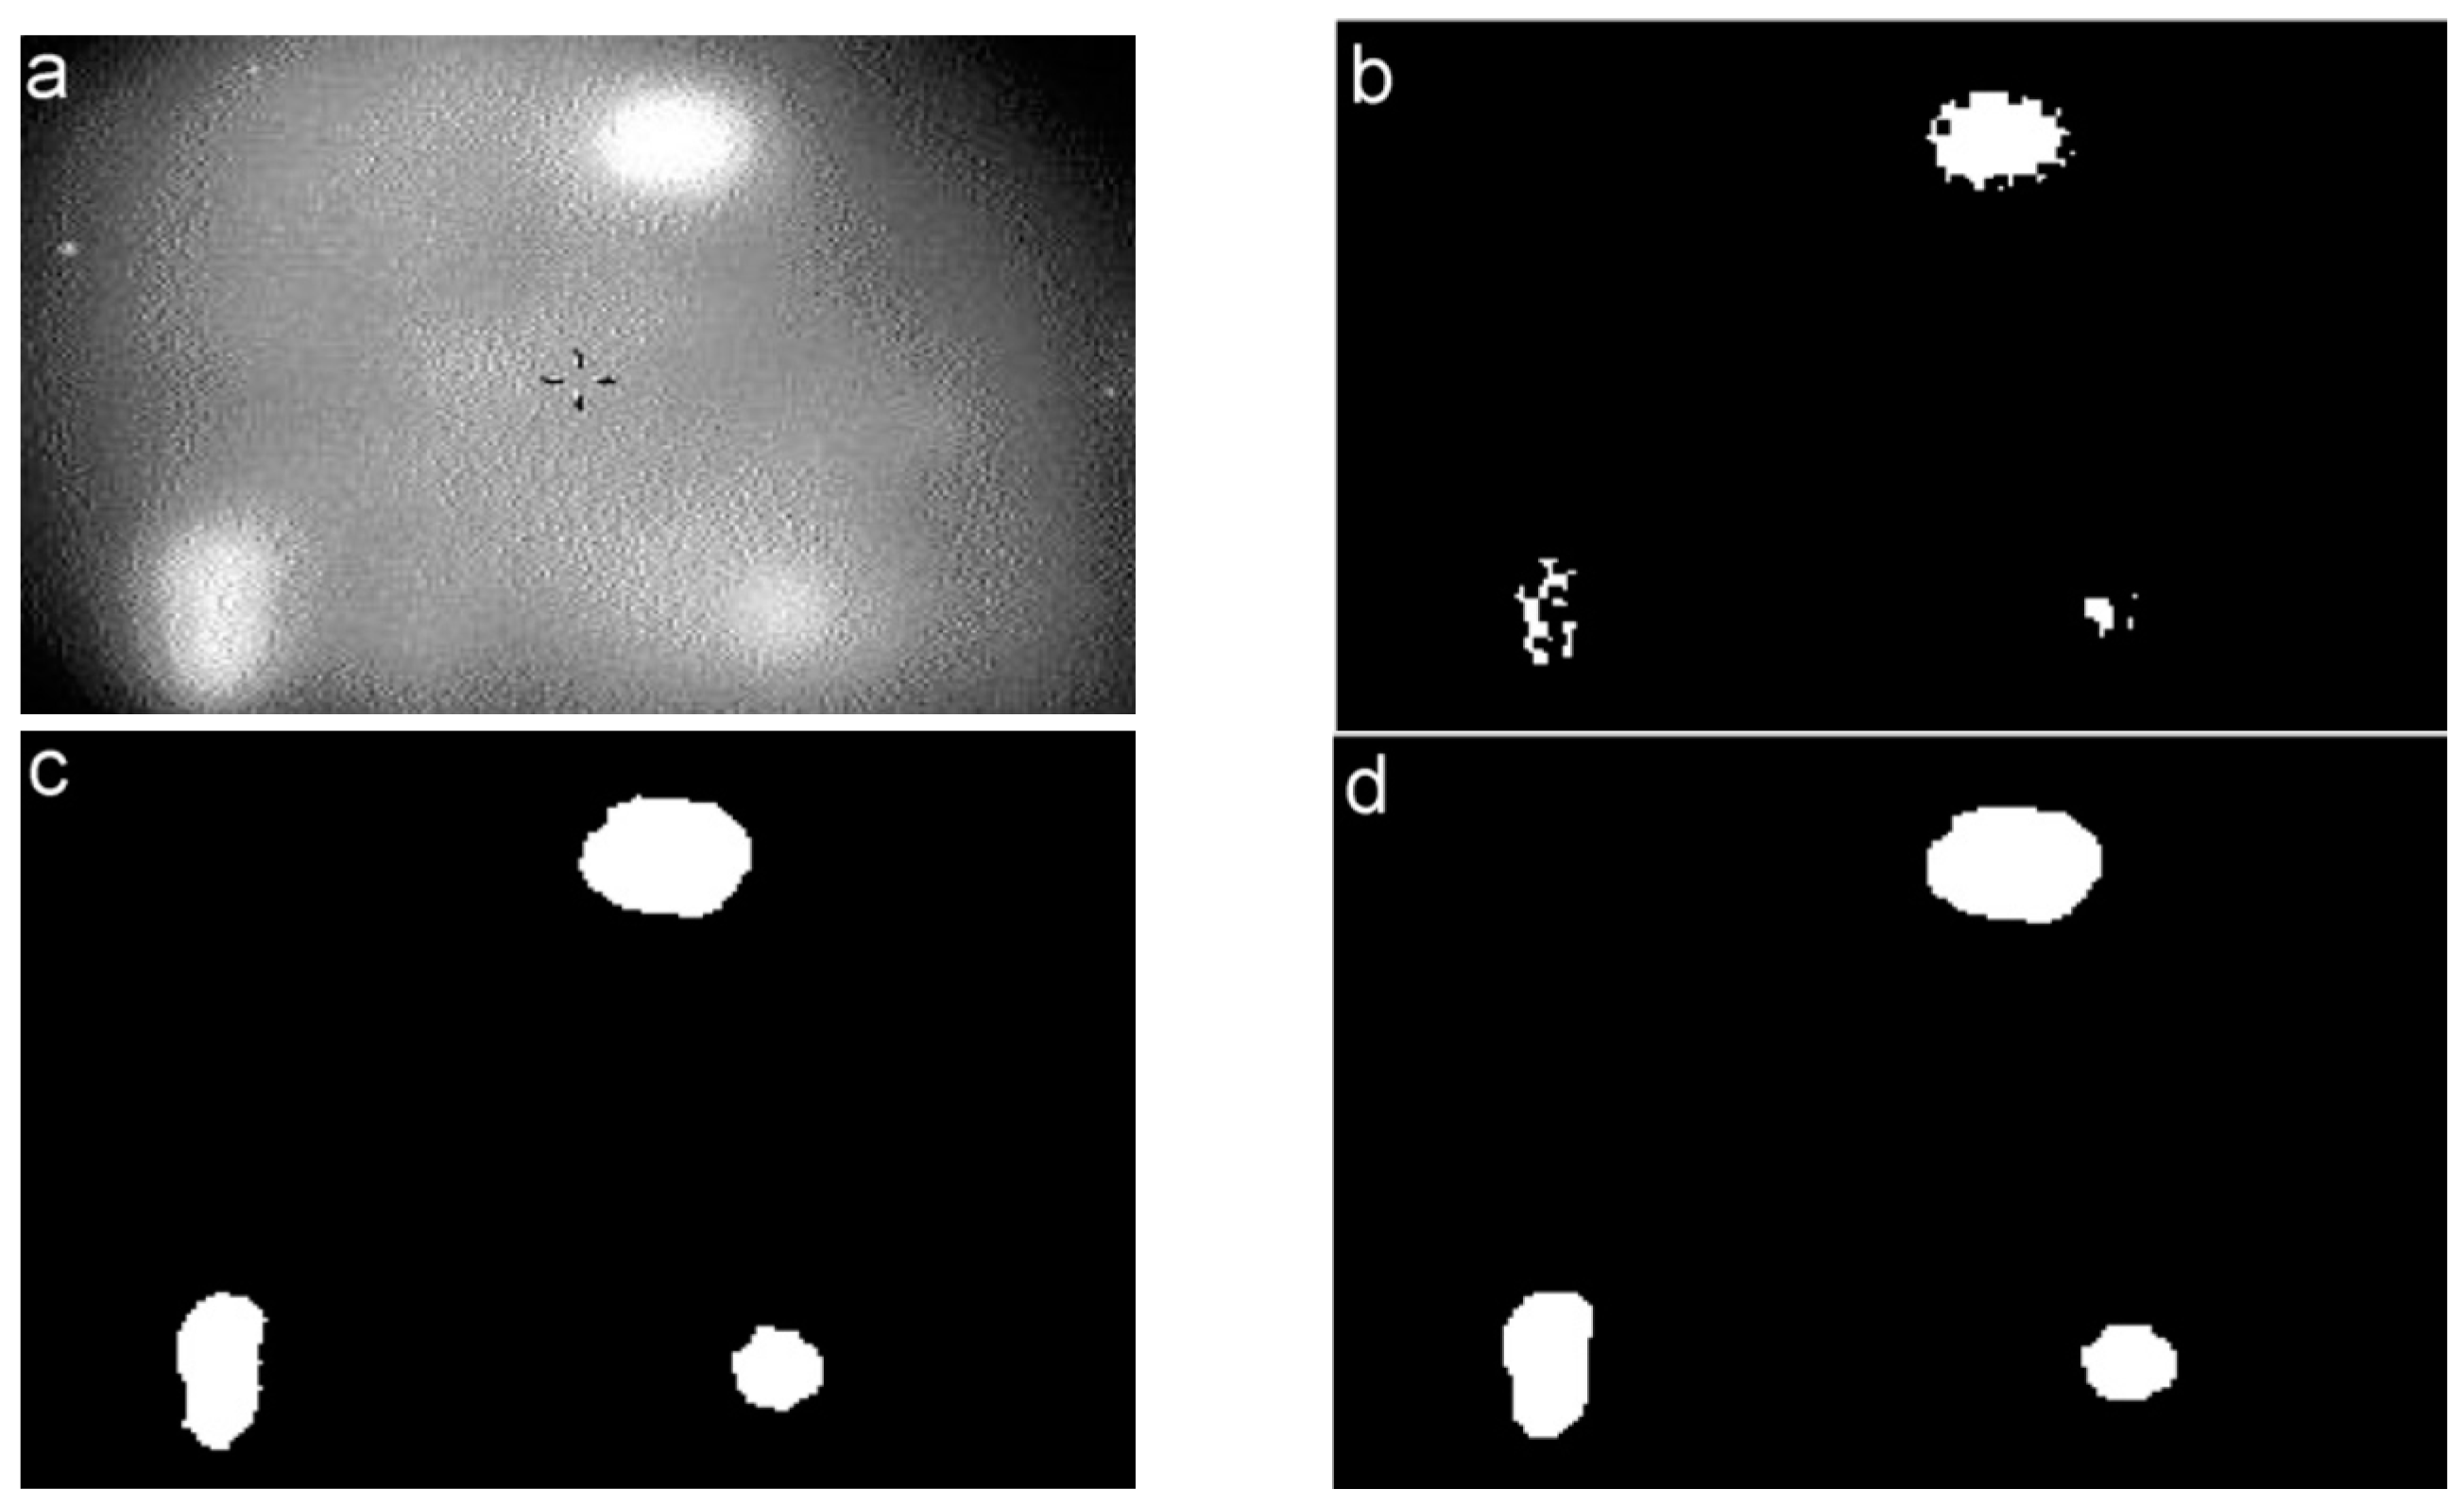
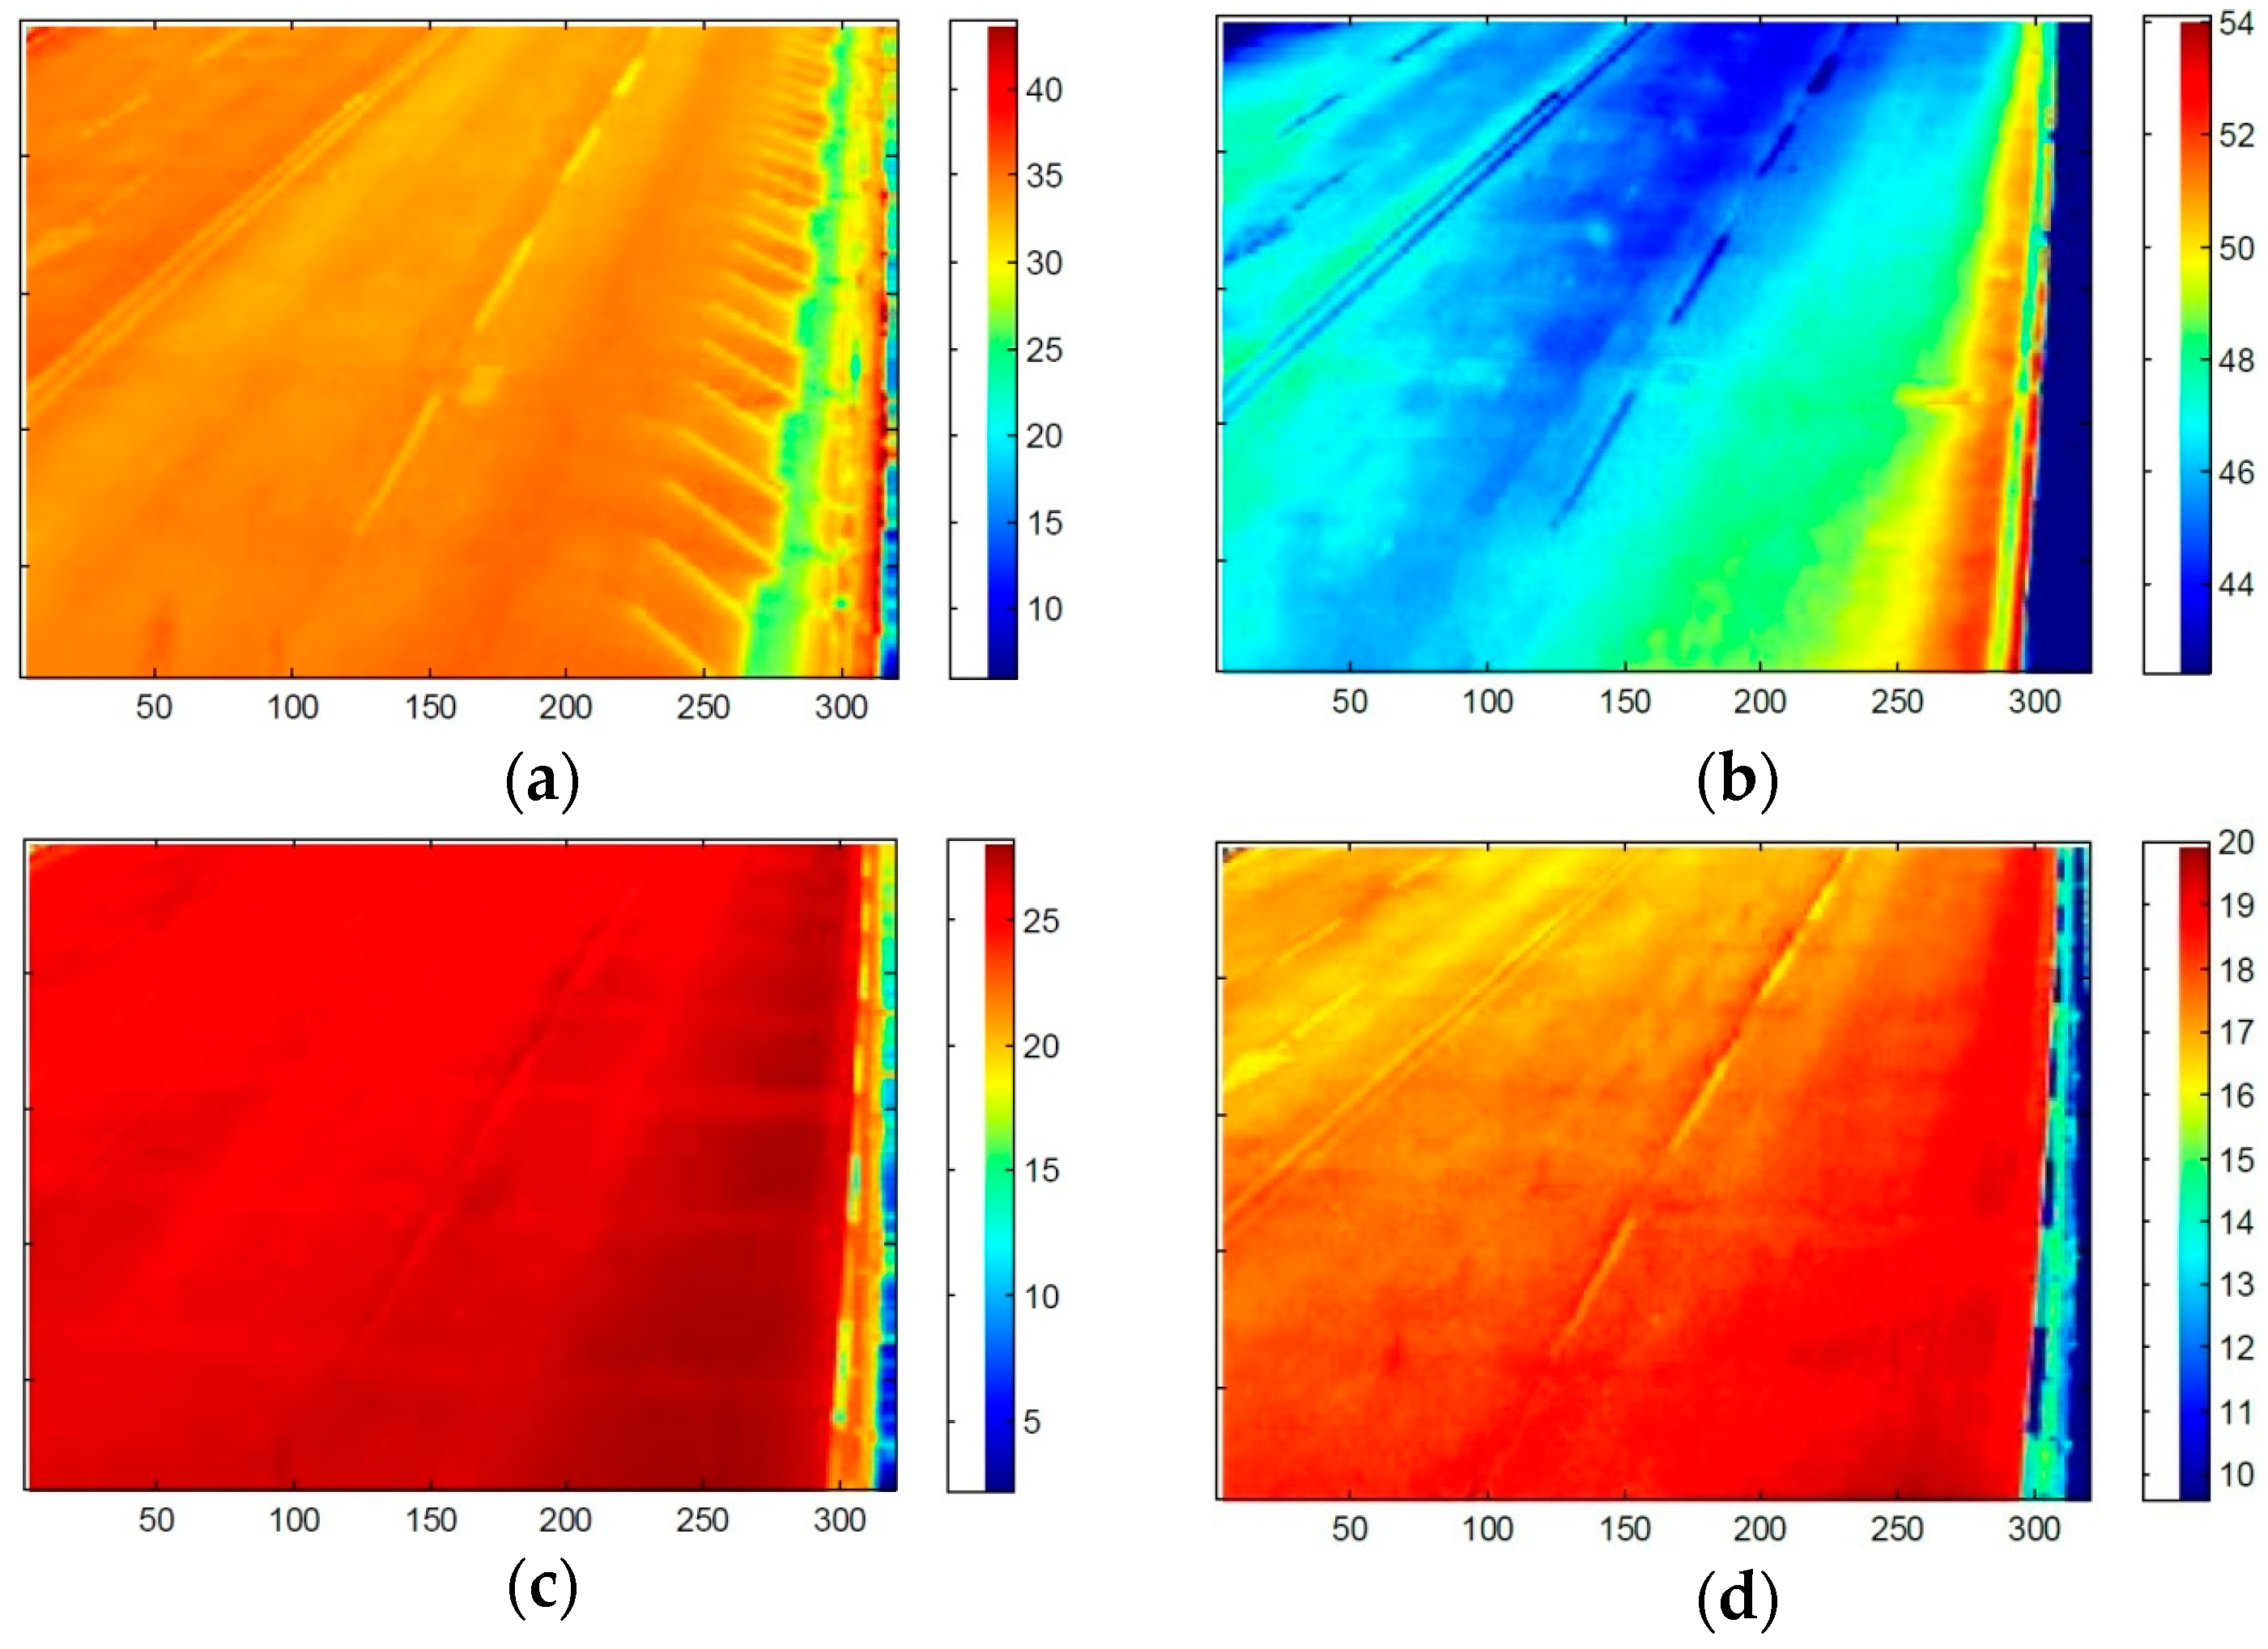
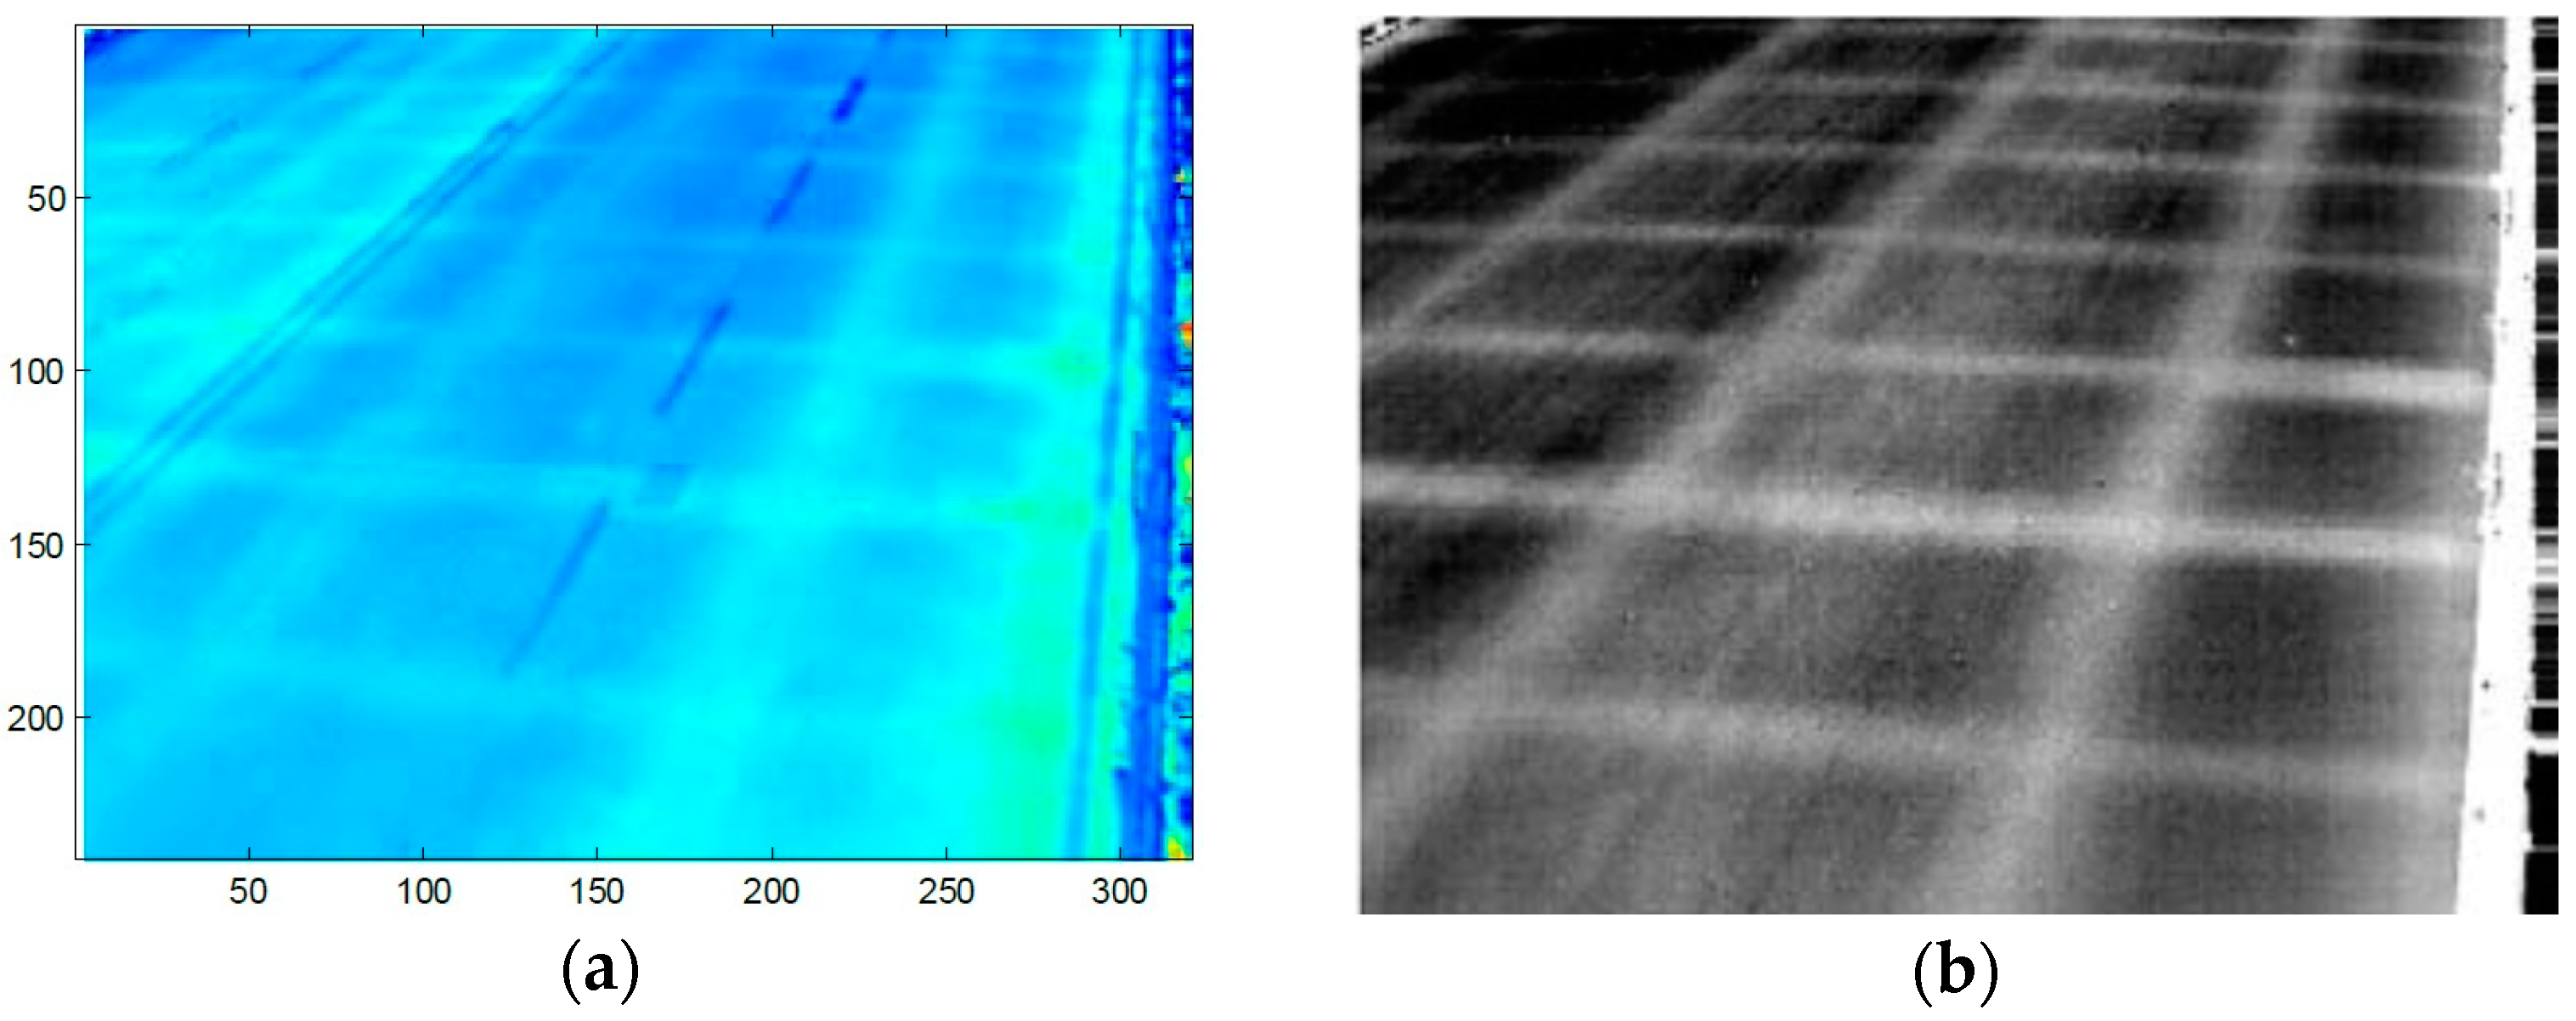
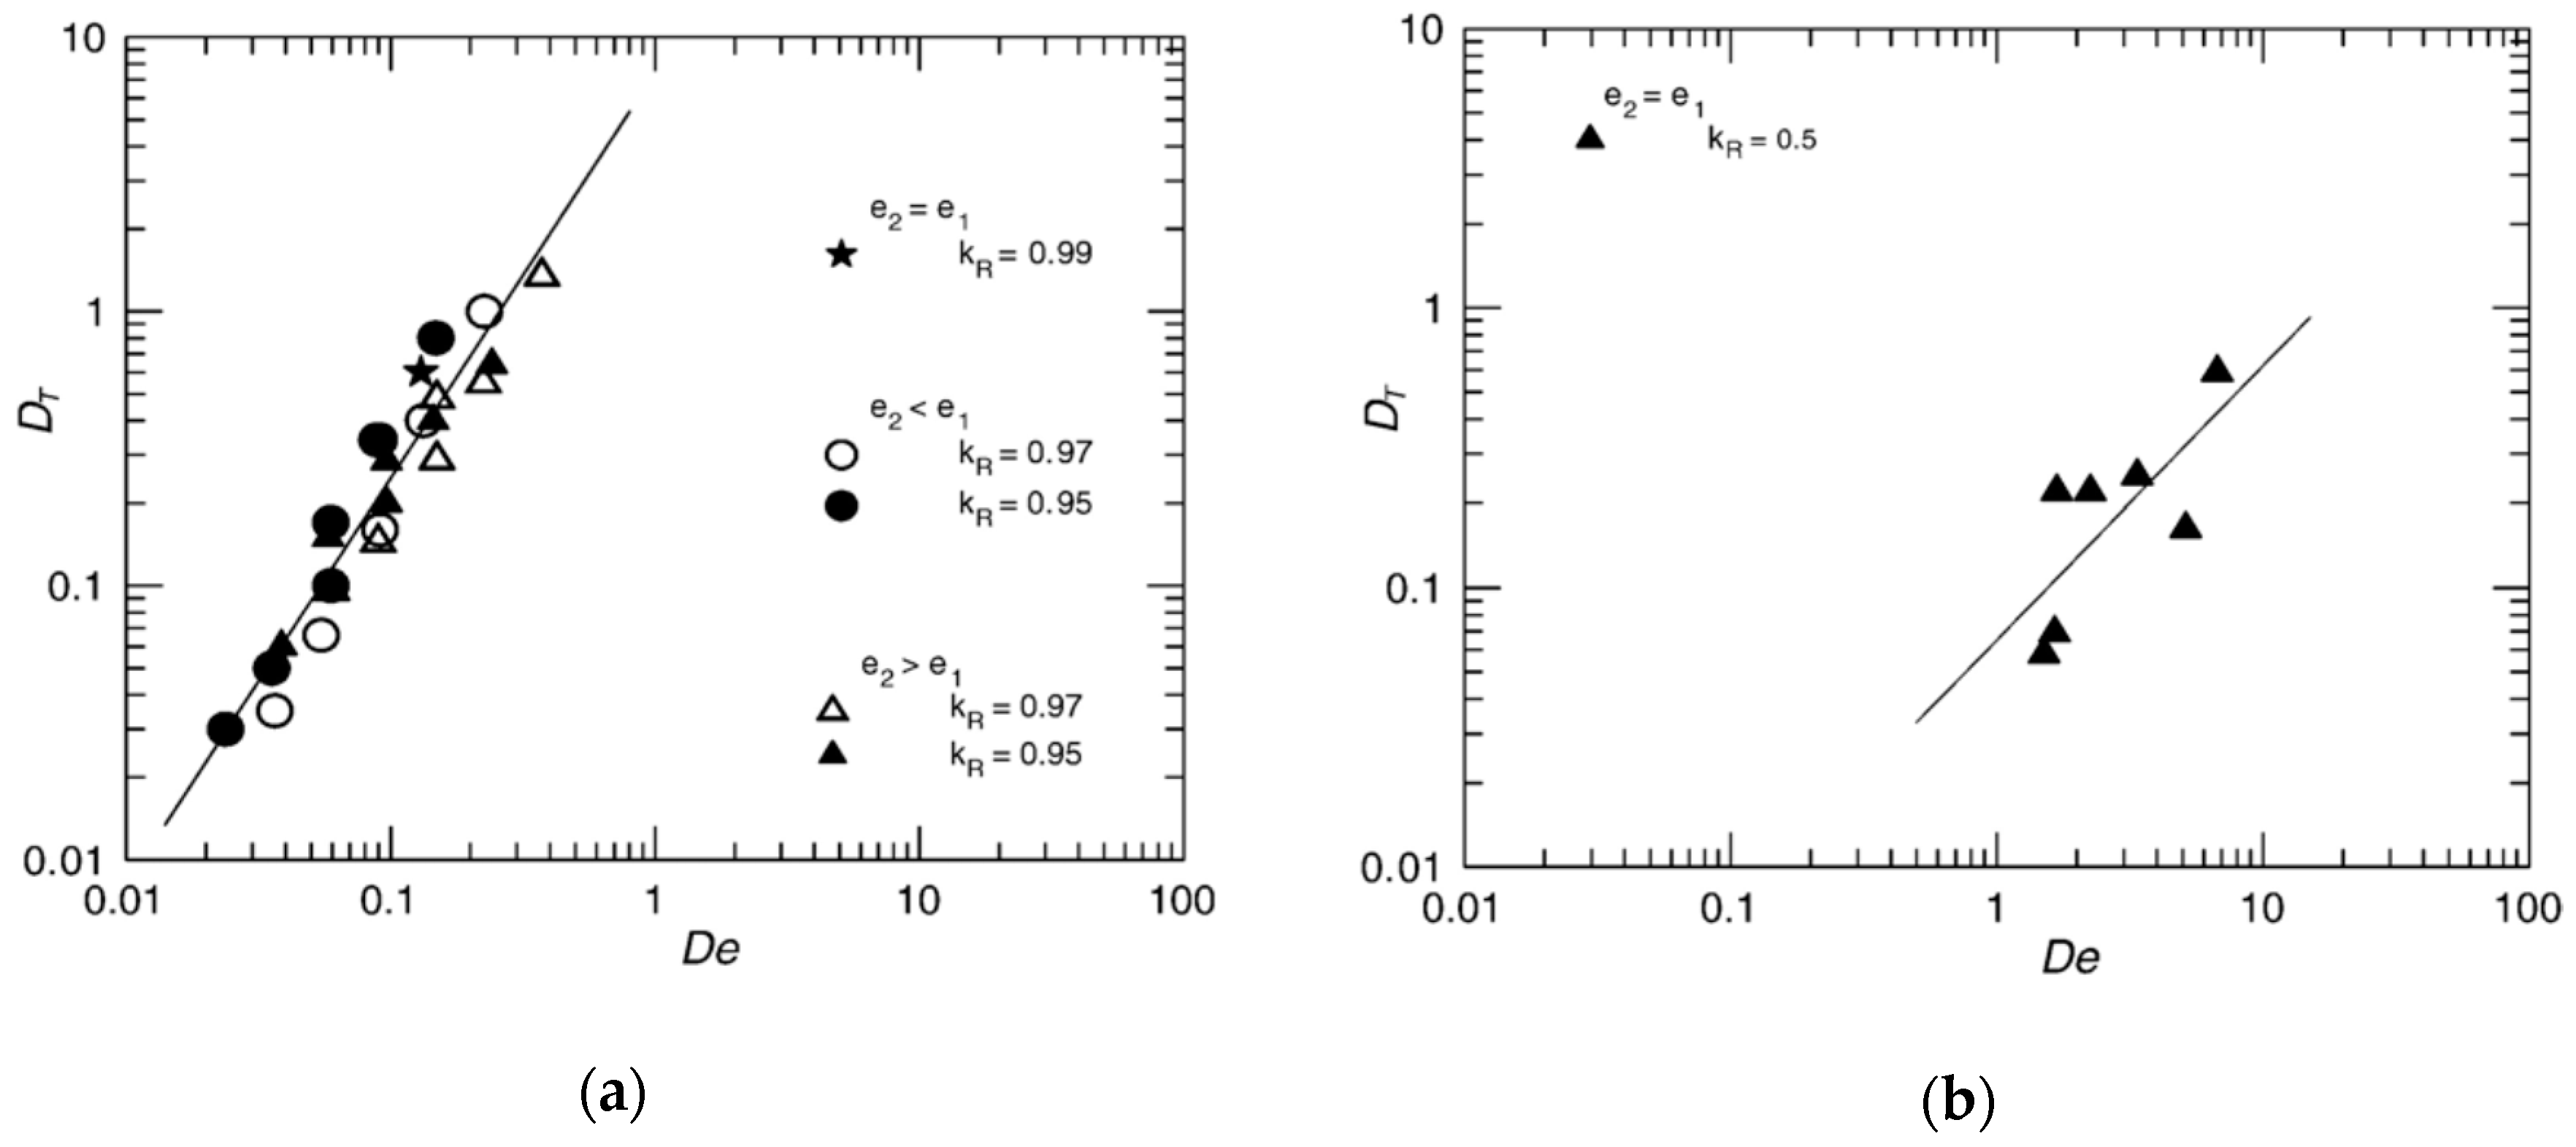
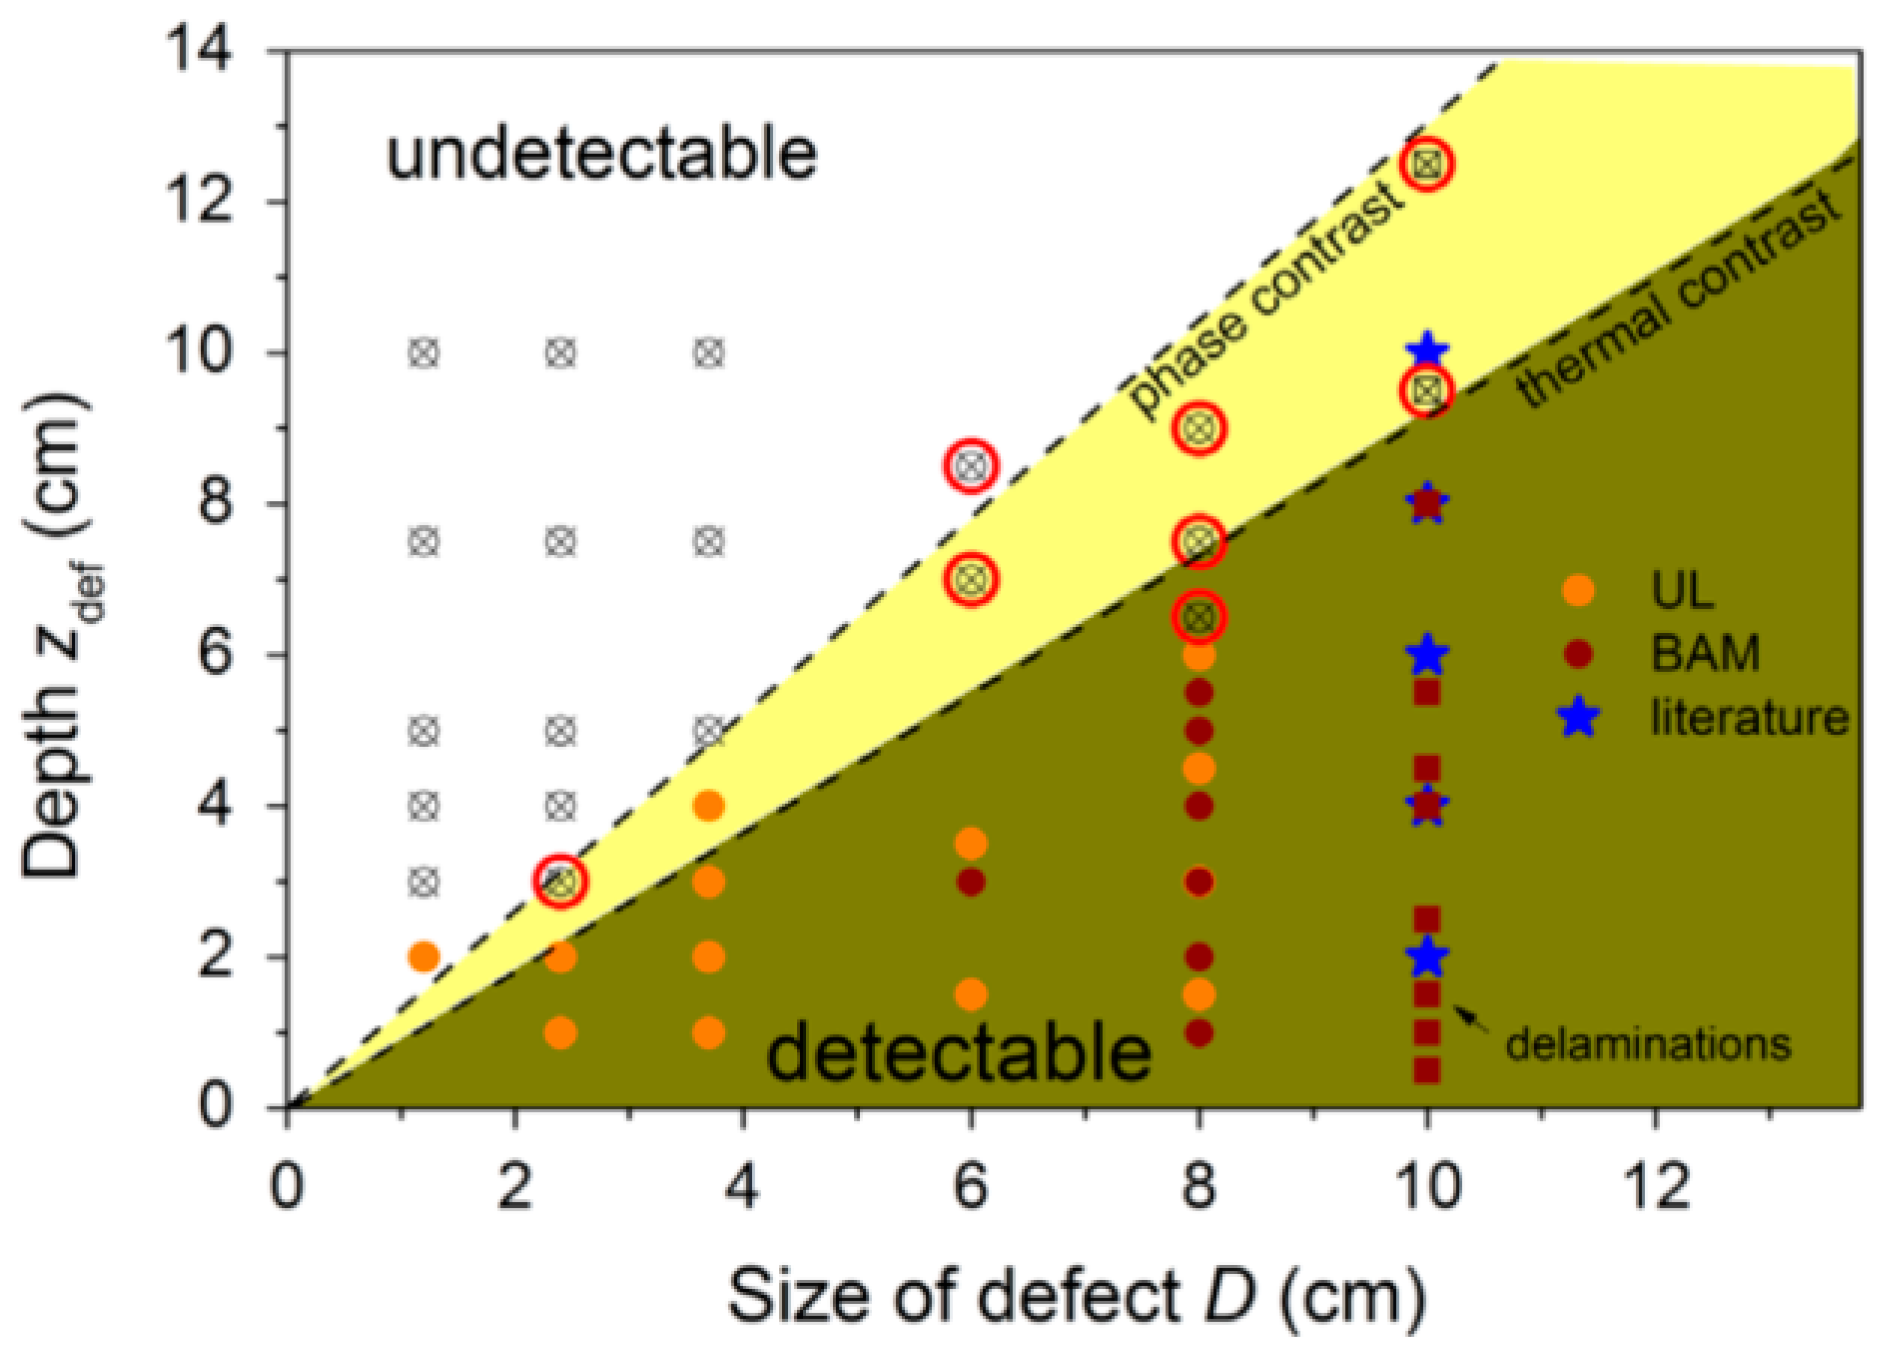