Automated Curved and Multiplanar Reformation for Screening of the Proximal Coronary Arteries in MR Angiography

 , , , and
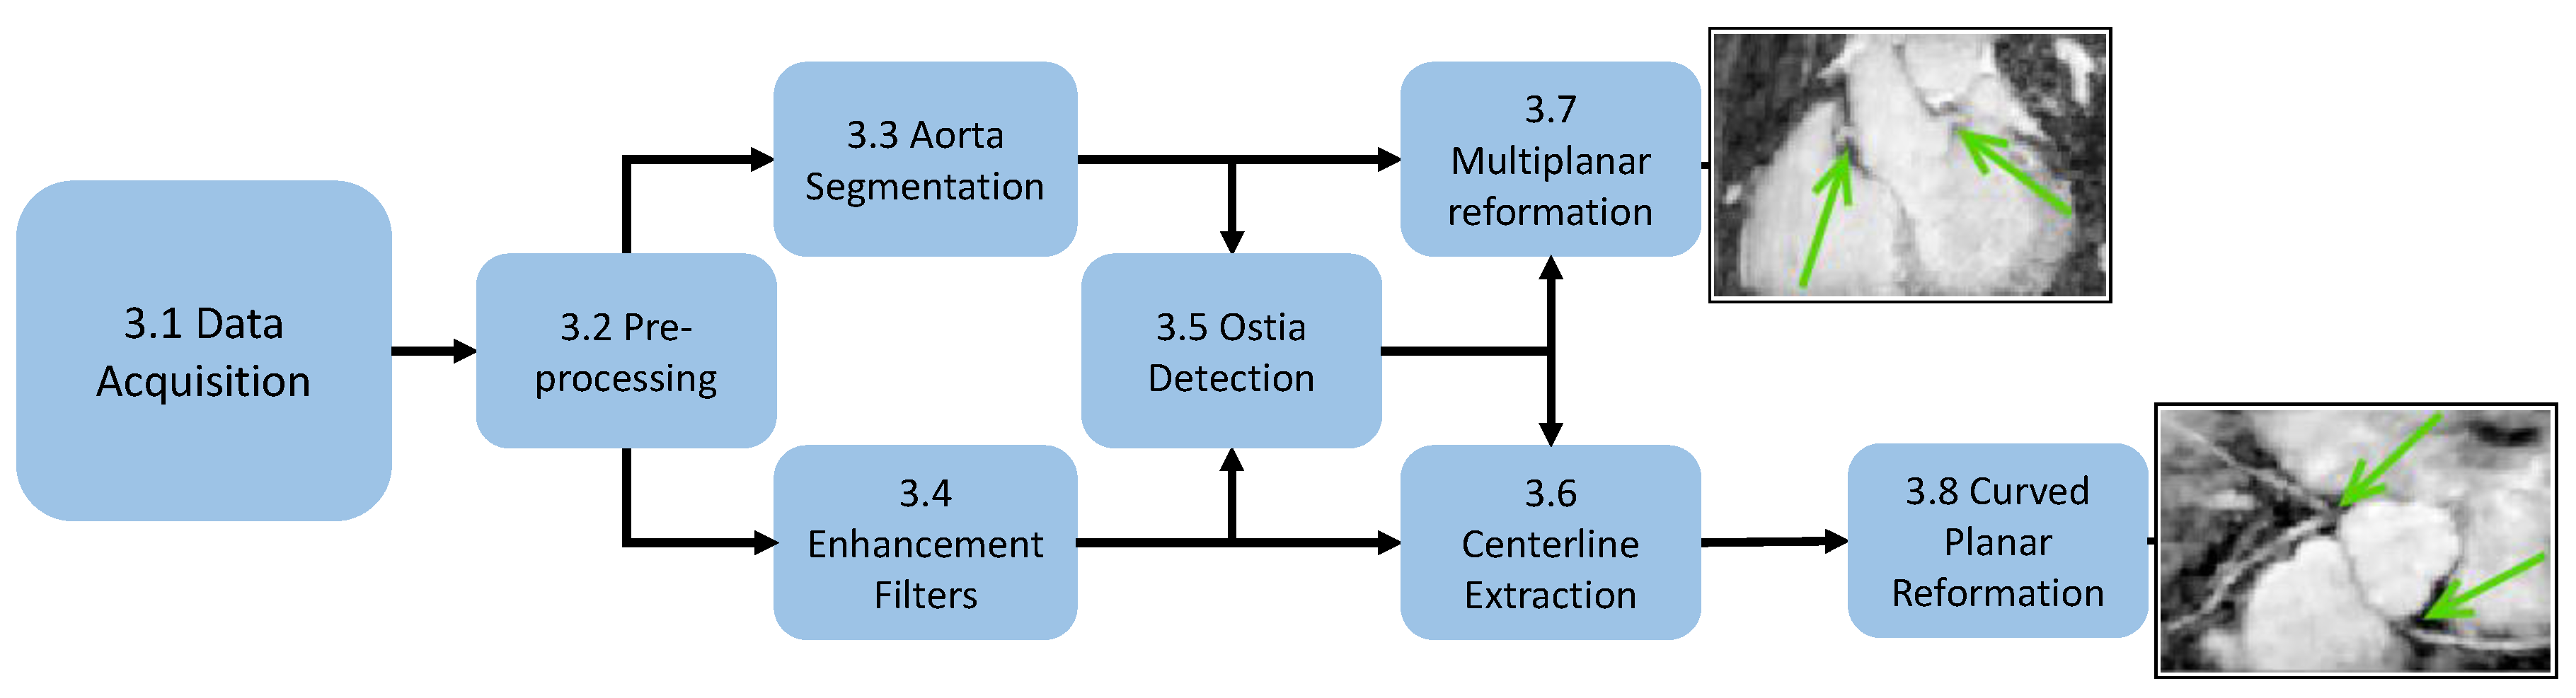
Abstract
:1. Introduction
2. Related Work
2.1. Acquisition Protocol
2.2. Curved and Multiplanar Reformation
2.3. Ostia Detection
3. Methods
3.1. Data Acquisition
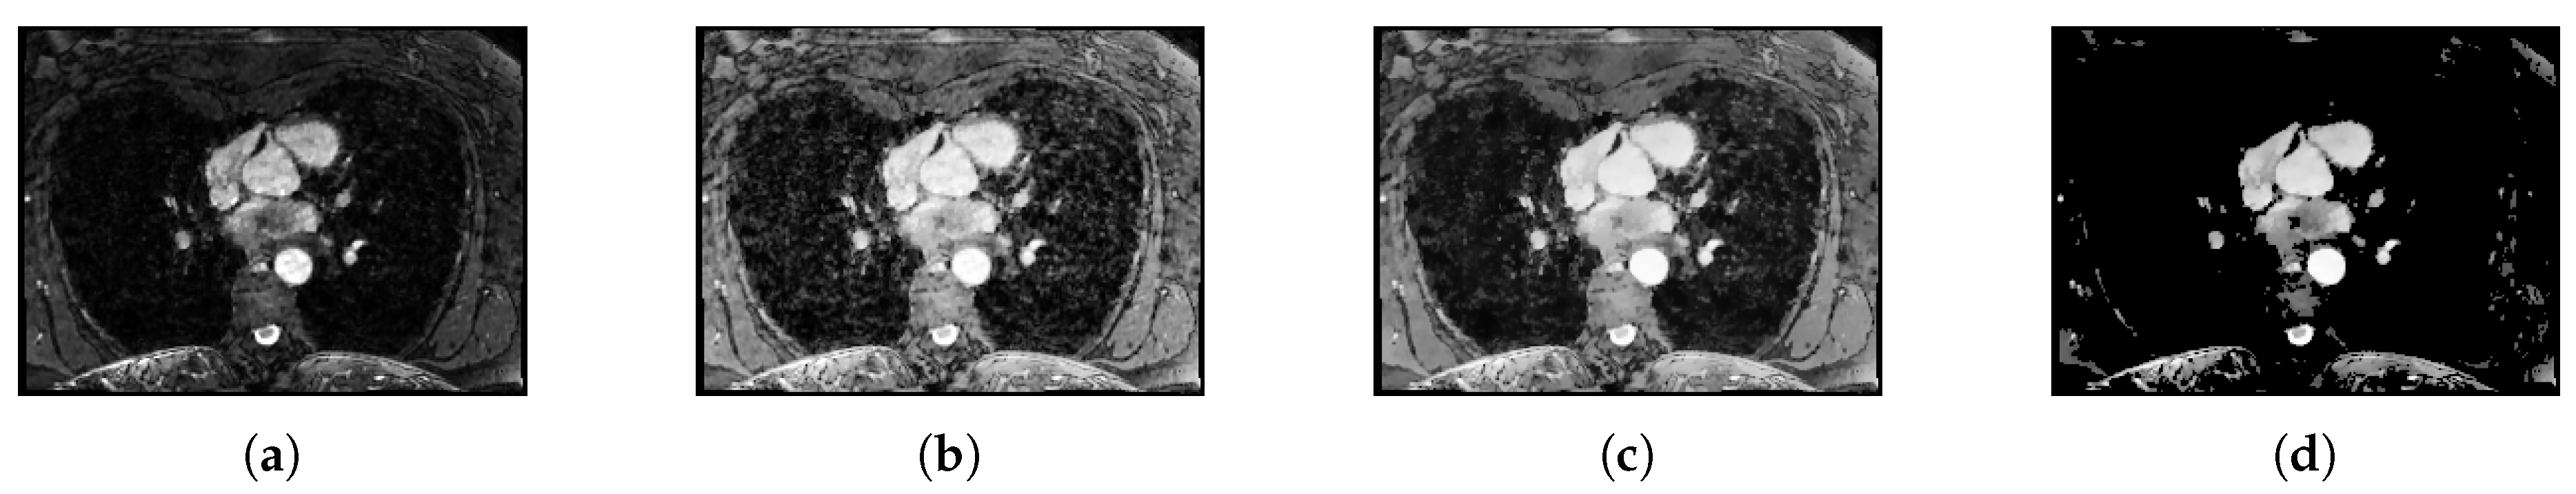
3.2. Preprocessing
3.3. Aorta Segmentation
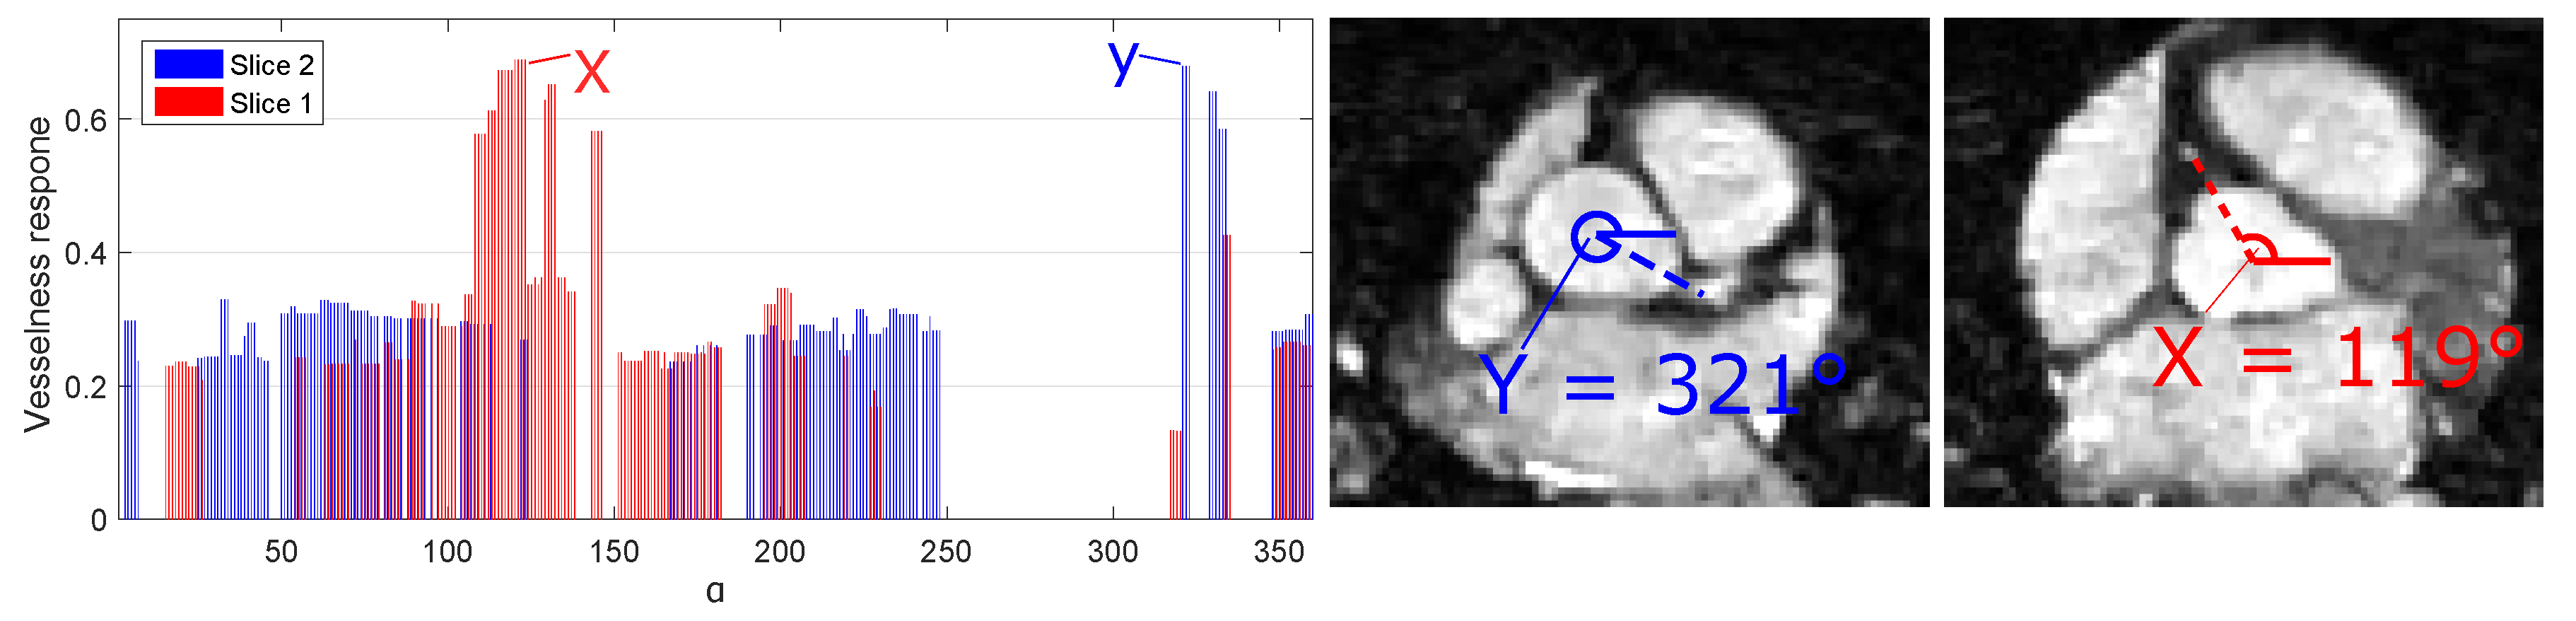
3.4. Vessel Enhancing Filtering
3.4.1. Entropy-Supported Medialness Measure
3.4.2. Tubeness Measure
3.5. Ostia Detection
3.6. Coronary Centerline Extraction
3.6.1. Cost Map Computation
3.6.2. Centerline Extraction
3.7. Multiplanar Reformation
3.8. Curved Planar Reformation
3.8.1. Surface Fitting
3.8.2. Reformation
4. Experiments
4.1. Ostia Detection
4.2. Coronary Centerline Extraction
4.3. Curved Planar Reformation
5. Results
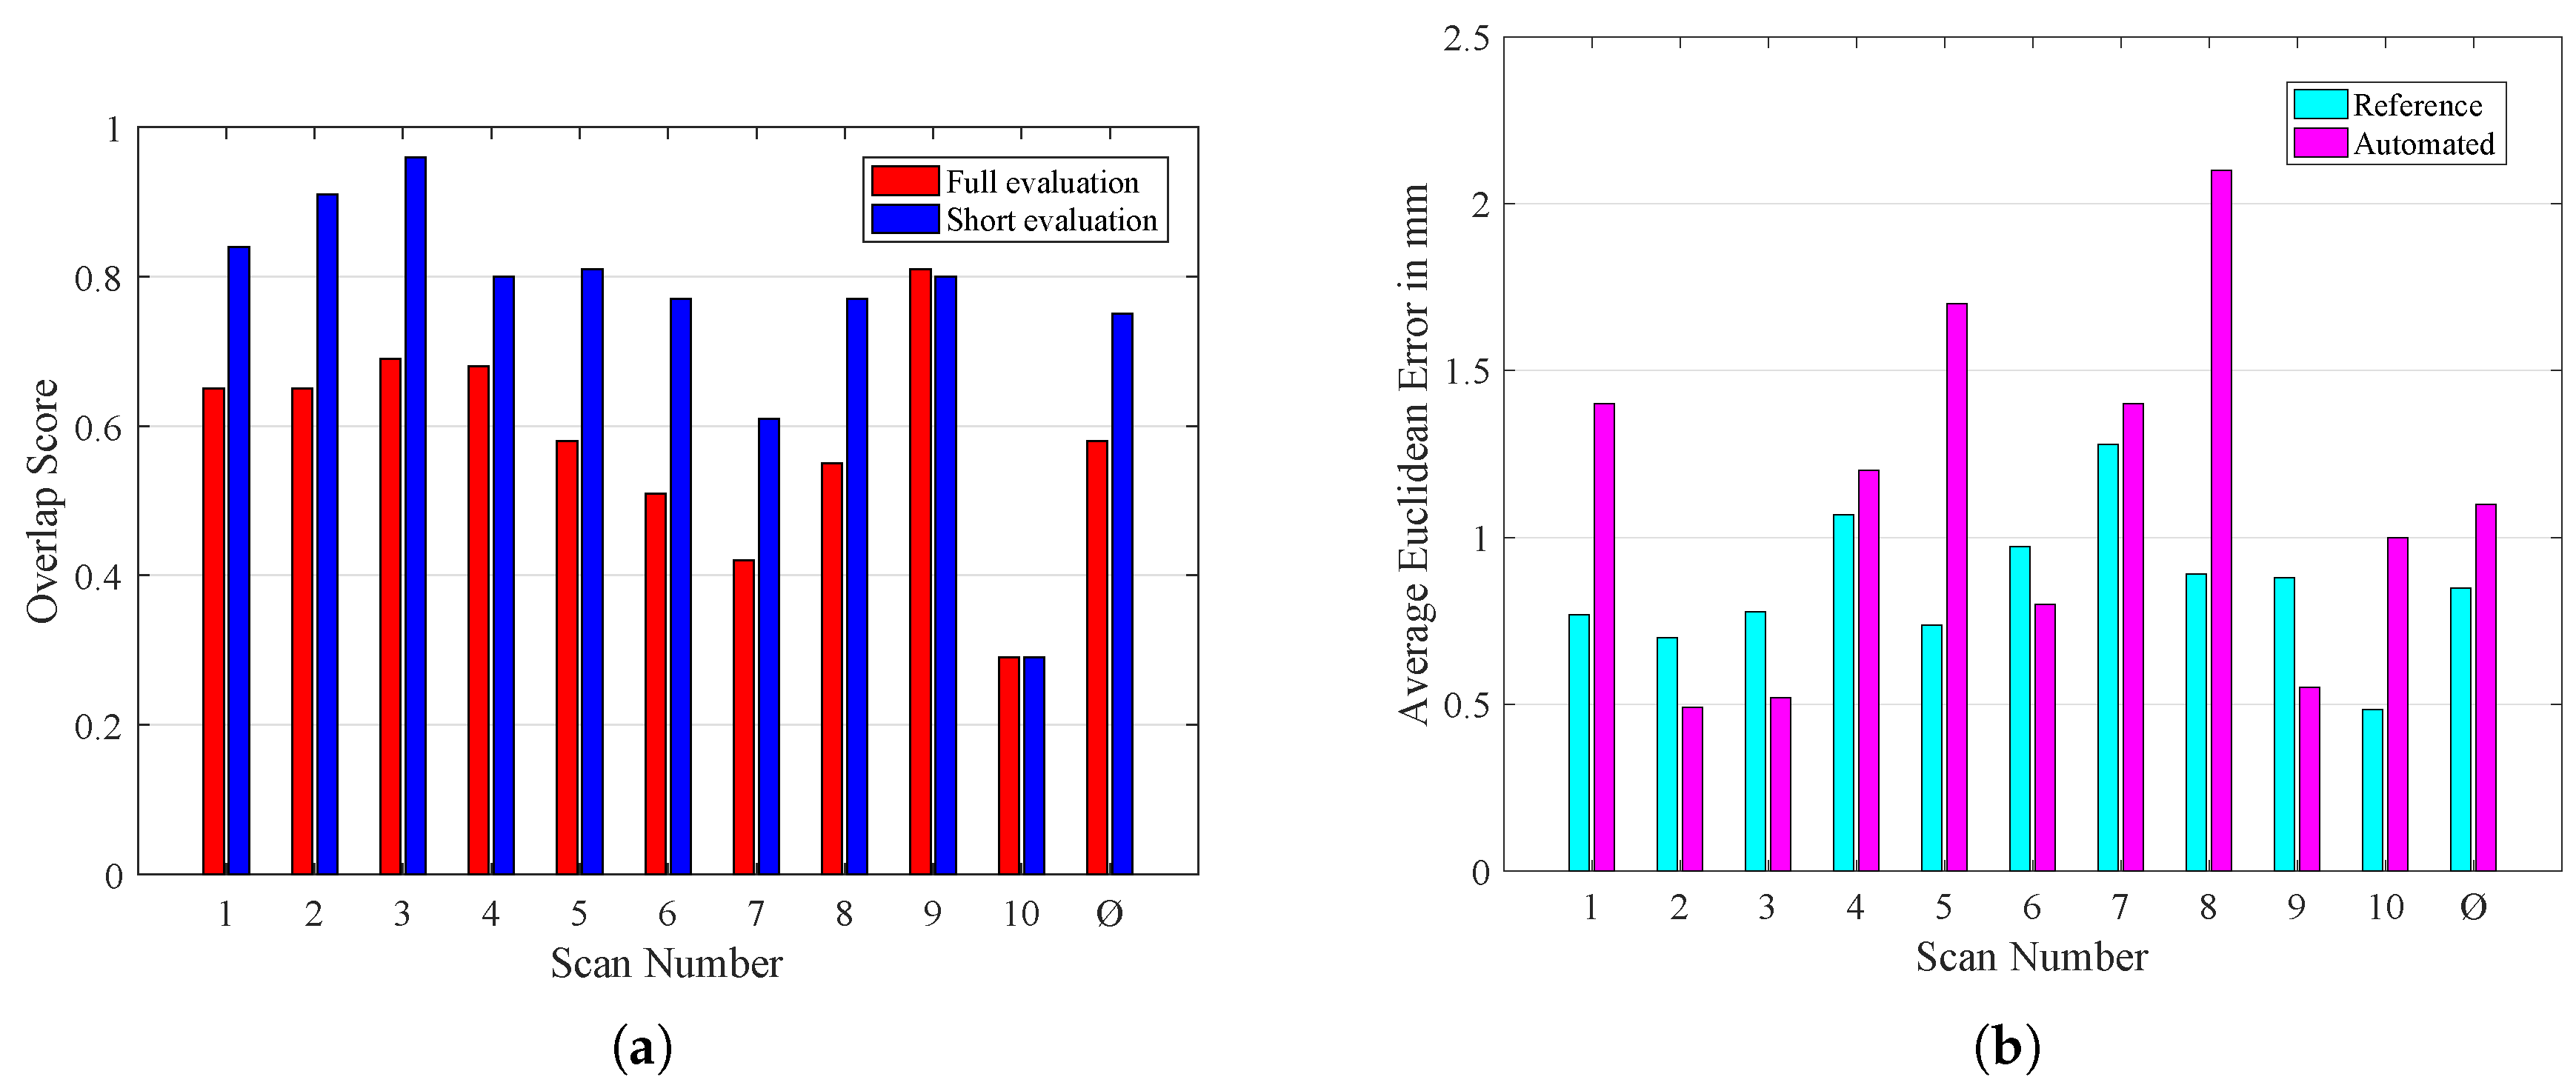
5.1. Ostia Detection
5.2. Coronary Centerline Extraction
5.3. Multiplanar Reformation
5.4. Curved Planar Reformation
6. Discussion
6.1. Data Acquisition
6.2. Ostia Detection
6.3. Centerline Extraction
6.4. Curved Planar Reformation
7. Conclusions
Author Contributions
Funding
Conflicts of Interest
References
- Heo, W.; Min, H.K.; Kang, D.K.; Jun, H.J.; Hwang, Y.H.; Jeon, J.H.; Lee, J.Y. The “High Take-Off” Left Main Coronary Artery in a Patient With Acute Type A Aortic Dissection. Circulation 2014, 130, e102–e103. [Google Scholar] [CrossRef] [PubMed]
- Eren, B.; Türkmen, N.; Gündogmus, U.N. Sudden death due to high take-off right coronary artery. Soud Lek 2013, 58, 45–46. [Google Scholar] [PubMed]
- Bille, K.; Figueiras, D.; Schamasch, P.; Kappenberger, L.; Brenner, J.I.; Meijboom, F.J.; Meijboom, E.J. Sudden cardiac death in athletes: The Lausanne Recommendations. Eur. J. Cardiovasc. Prev. Rehabil. 2006, 13, 859–875. [Google Scholar] [CrossRef] [PubMed]
- Virmani, R.; Chun, P.K.C.; Goldstein, R.E. Acute takeoffs of the coronary arteries along the aortic wall and congenital coronary ostial valve-like ridges: Association with sudden death. J. Am. Coll. Cardiol. 1984, 3, 766–771. [Google Scholar] [CrossRef]
- Vanhoenacker, P.K.; Heijenbrok-Kal, M.H.; Van Heste, R.; Decramer, I.; Van Hoe, L.R.; Wijns, W.; Hunink, M.G.M. Diagnostic Performance of Multidetector CT Angiography for Assessment of Coronary Artery Disease: Meta-analysis. Radiology 2007, 244, 419–428. [Google Scholar] [CrossRef] [PubMed]
- Sakuma, H. Coronary CT versus MR angiography: The role of MR angiography. Radiology 2011, 258, 340–349. [Google Scholar] [CrossRef] [PubMed]
- Pejkovic, B.; Krajnc, I.; Anderhuber, F. Anatomical Variations of Coronary Ostia, Aortocoronary Angles and Angles of Division of the Left Coronary Artery of the Human Heart. J. Int. Med. Res. 2008, 36, 914–922. [Google Scholar] [CrossRef] [PubMed] [Green Version]
- Oppelt, A. Imaging Systems for Medical Diagnostics: Fundamentals, Technical Solutions and Applications for Systems Applying Ionization Radiation, Nuclear Magnetic Resonance and Ultrasound; Publicis Corporate Publishing: Paris, France, 2011; p. 996. [Google Scholar]
- Kanitsar, A.; Fleischmann, D.; Wegenkittl, R.; Felkel, P.; Gröller, M.E. CPR-curved planar reformation. In Proceedings of the IEEE Visualization, VIS 2002, Boston, MA, USA, 27 October–1 November 2002; pp. 37–44. [Google Scholar] [CrossRef]
- Van Ooijen, P.M.A.; Irwan, R.; Slager, C.J.; Wentzel, J.J.; Schuurbiers, J.C.H.; Oomen, J.A.F.; Gijsen, F.J.H.; Krams, R.; van der Giessen, W.J.; Serruys, P.W.; et al. Multi-Dimensional Computed Coronary Visualization. In Coronary Radiology; Springer: Berlin/Heidelberg, Germany, 2004; pp. 227–282. [Google Scholar]
- Unberath, M.; Aichert, A.; Achenbach, S.; Maier, A. Consistency-based respiratory motion estimation in rotational angiography. Med. Phys. 2017, 44, e113–e124. [Google Scholar] [CrossRef] [PubMed] [Green Version]
- Manning, W.J.; Li, W.; Boyle, N.G.; Edelman, R.R. Fat-suppressed breath-hold magnetic resonance coronary angiography. Circulation 1993, 87, 94–104. [Google Scholar] [CrossRef] [PubMed]
- Griswold, M.A.; Jakob, P.M.; Heidemann, R.M.; Nittka, M.; Jellus, V.; Wang, J.; Kiefer, B.; Haase, A. Generalized Autocalibrating Partially Parallel Acquisitions (GRAPPA). Magn. Reson. Med. 2002, 47, 1202–1210. [Google Scholar] [CrossRef] [PubMed]
- Pruessmann, K.P.; Weiger, M.; Scheidegger, M.B.; Boesiger, P. SENSE: Sensitivity encoding for fast MRI. Magn. Reson. Med. 1999, 42, 952–962. [Google Scholar] [CrossRef] [Green Version]
- Lustig, M.; Donoho, D.; Pauly, J.M. Sparse MRI: The application of compressed sensing for rapid MR imaging. Magn. Reson. Med. 2007, 58, 1182–1195. [Google Scholar] [CrossRef] [PubMed] [Green Version]
- Boubertakh, R.; Prieto, C.; Batchelor, P.; Uribe, S.; Atkinson, D.; Eggers, H.; Sørensen, T.; Hansen, M.; Razavi, R.; Schaeffter, T. Whole-heart imaging using undersampled radial phase encoding (RPE) and iterative sensitivity encoding (SENSE) reconstruction. Magn. Reson. Med. 2009, 62, 1331–1337. [Google Scholar] [CrossRef] [PubMed] [Green Version]
- Akçakaya, M.; Basha, T.A.; Chan, R.H.; Rayatzadeh, H.; Kissinger, K.V.; Goddu, B.; Goepfert, L.A.; Manning, W.J.; Nezafat, R. Accelerated contrast-enhanced whole-heart coronary MRI using low-dimensional-structure self-learning and thresholding. Magn. Reson. Med. 2012, 67, 1434–1443. [Google Scholar] [CrossRef] [PubMed]
- Iyama, Y.; Nakaura, T.; Kidoh, M.; Kawahara, T.; Sakaino, N.; Harada, K.; Okuaki, T.; Yamashita, Y. Single-breath-hold whole-heart coronary MRA in healthy volunteers at 3.0-T MRI. Springerplus 2014, 3. [Google Scholar] [CrossRef] [PubMed]
- Edelman, R.R.; Giri, S.; Pursnani, A.; Botelho, M.P.F.; Li, W.; Koktzoglou, I. Breath-hold imaging of the coronary arteries using Quiescent-Interval Slice-Selective (QISS) magnetic resonance angiography: Pilot study at 1.5 Tesla and 3 Tesla. J. Cardiovasc. Magn. Reson. 2015, 17. [Google Scholar] [CrossRef] [PubMed]
- Etienne, A.; Botnar, R.M.; Van Muiswinkel, A.M.C.; Boesiger, P.; Manning, W.J.; Stuber, M. ”Soap-Bubble” visualization and quantitative analysis of 3D coronary magnetic resonance angiograms. Magn. Reson. Med. 2002, 48, 658–666. [Google Scholar] [CrossRef] [PubMed]
- Zheng, Y.; Tek, H.; Funka-Lea, G.; Zhou, S.K.; Vega-Higuera, F.; Comaniciu, D. Efficient detection of native and bypass coronary ostia in cardiac CT volumes: Anatomical vs. pathological structures. In Proceedings of the 14th International Conference on Medical Image Computing and Computer-Assisted Intervention, Toronto, ON, Canada, 18–22 September 2011; pp. 403–410. [Google Scholar] [CrossRef]
- Liu, L.; Shi, W.; Rueckert, D.; Hu, M.; Ourselin, S.; Zhuang, X. Coronary centerline extraction based on ostium detection and model-guided directional minimal path. In Proceedings of the 2014 IEEE 11th International Symposium on Biomedical Imaging (ISBI), Beijing, China, 29 April–2 May 2014; pp. 133–136. [Google Scholar] [CrossRef]
- Tek, H.; Gülsün, M.A.; Laguitton, S.; Grady, L.; Lesage, D.; Funka-Lea, G. Automatic Coronary Tree Modeling. MIDAS J. 2008, 7, 600. [Google Scholar]
- Gong, Z.; Shen, Z.; Zhang, D.; Wang, C.; Zhou, S. One-click detection of coronary artery ostia from three-dimensional CTA data. In Proceedings of the 2015 IEEE International Conference on Information and Automation, Lijiang, China, 8–10 August 2015; pp. 877–880. [Google Scholar] [CrossRef]
- Seada, N.A.; Mostafa, M.G.M. Automatic detection of coronaries ostia in computed tomography angiography volume data. Int. J. Res. Med. Sci. 2016, 4, 1–6. [Google Scholar] [CrossRef]
- Forman, C.; Piccini, D.; Grimm, R.; Hutter, J.; Hornegger, J.; Zenge, M.O. High-resolution 3D whole-heart coronary MRA: A study on the combination of data acquisition in multiple breath-holds and 1D residual respiratory motion compensation. Magn. Reson. Mater. Phys. Biol. Med. 2014, 27, 435–443. [Google Scholar] [CrossRef] [PubMed]
- Wetzl, J.; Schmidt, M.; Pontana, F.; Longère, B.; Lugauer, F.; Maier, A.; Hornegger, J.; Forman, C. Single-breath-hold 3-D CINE imaging of the left ventricle using Cartesian sampling. Magn. Reson. Mater. Physics. Biol. Med. 2017, 31, 19–31. [Google Scholar] [CrossRef] [PubMed]
- Liu, J.; Rapin, J.; Chang, T.C.; Lefebvre, A.; Zenge, M.; Mueller, E.; Nadar, M.S. Dynamic cardiac MRI reconstruction with weighted redundant Haar wavelets. In Proceedings of the 20th Annual Meeting ISMRM, Melbourne, Australia, 5 May 2012; International Society of Magnetic Resonance in Medicine: Melbourne, Australia, 2012; Volume 20, p. 4249. [Google Scholar]
- Woods, R.E.; Gonzalez, R.C. Real-Time Digital Image Enhancement. Proc. IEEE 1981, 69, 643–654. [Google Scholar] [CrossRef]
- Tomasi, C.; Manduchi, R. Bilateral Filtering for Gray and Color Images. In Proceedings of the Sixth International Conference on Computer Vision (IEEE Cat. No.98CH36271), Bombay, India, 7 January 1998; pp. 839–846. [Google Scholar] [CrossRef]
- Yoo, T.S. Insight into Images: Principles and Practice for Segmentation, Registration, and Image Analysis; AK Peters Ltd.: Natick, MA, USA, 2004. [Google Scholar]
- Gülsün, M.A.; Tek, H. Robust vessel tree modeling. Lect. Notes Comput. Sci. 2008, 5241 LNCS, 602–611. [Google Scholar] [CrossRef]
- Unberath, M.; Goppert, E.; Taubmann, O.; Maier, A. Mitigating Medialness Responses from Non-tubular Structures Using Entropy. In Proceedings of the 30th International Congress and Exhibition, Heidelberg, Germany, 21–25 June 2016; Lemke, H.U., Ed.; Springer: Berlin/Heidelberg, Germany, 2016; pp. 211–212. [Google Scholar]
- Sato, Y.; Nakajima, S.; Shiraga, N.; Atsumi, H.; Yoshida, S.; Koller, T.; Gerig, G.; Kikinis, R. Three-dimensional multi-scale line filter for segmentation and visualization of curvilinear structures in medical images. Med. Image Anal. 1998, 2, 143–168. [Google Scholar] [CrossRef]
- Soille, P. Morphological Image Analysis; Springer: Berlin/Heidelberg, Germany, 2004. [Google Scholar]
- Unberath, M.; Taubmann, O.; Hell, M.; Achenbach, S.; Maier, A. Symmetry, outliers, and geodesics in coronary artery centerline reconstruction from rotational angiography. Med. Phys. 2017, 44, 5672–5685. [Google Scholar] [CrossRef] [PubMed]
- Dijkstra, E.W. A note on two problems in connexion with graphs. Numer. Math. 1959, 1, 269–271. [Google Scholar] [CrossRef] [Green Version]
- Jandt, U.; Schäfer, D.; Grass, M.; Rasche, V. Automatic generation of 3D coronary artery centerlines using rotational X-ray angiography. Med. Image Anal. 2009, 13, 846–858. [Google Scholar] [CrossRef] [PubMed]
- Smith, L.I. A tutorial on Principal Components Analysis Introduction. Statistics 2002, 51, 52. [Google Scholar] [CrossRef]
- Hazewinkel, M. Encyclopaedia of Mathematics; Springer: Berlin/Heidelberg, Germany, 2002. [Google Scholar]
- Sujatha, B.; Sri Rama Krishna, K. An Analysis of Thinning & Skeletonization for Shape Representation. Int. J. Comput. Commun. Inf. Syst. 2010, 2, 976–1349. [Google Scholar]
- Schaap, M.; Metz, C.T.; van Walsum, T.; van der Giessen, A.G.; Weustink, A.C.; Mollet, N.R.; Bauer, C.; Bogunović, H.; Castro, C.; Deng, X.; et al. Standardized evaluation methodology and reference database for evaluating coronary artery centerline extraction algorithms. Med. Image Anal. 2009, 13, 701–714. [Google Scholar] [CrossRef] [PubMed] [Green Version]
- Dodge, J.T.; Brown, B.G.; Bolson, E.L.; Dodge, H.T. Lumen diameter of normal human coronary arteries. Influence of age, sex, anatomic variation, and left ventricular hypertrophy or dilation. Circulation 1992, 86, 232–246. [Google Scholar] [CrossRef] [PubMed]
- Forkert, N.D.; Schmidt-Richberg, A.; Fiehler, J.; Illies, T.; Möller, D.; Säring, D.; Handels, H.; Ehrhardt, J. 3D Cerebrovascular Segmentation Combining Fuzzy Vessel Enhancement and Level-Sets with Anisotropic Energy Weights. Magn. Reson. Imaging 2013, 31, 262–271. [Google Scholar] [CrossRef] [PubMed]
- Woźniak, T.; Strzelecki, M.; Majos, A.; Stefańczyk, L. 3D Vascular Tree Segmentation Using a Multiscale Vesselness Function and a Level Set Approach. Biocybern. Biomed. Eng. 2017, 37, 66–77. [Google Scholar] [CrossRef]
- Kocinski, M.; Materka, A.; Deistung, A.; Reichenbach, J.R. Centerline-Based Surface Modeling of Blood-Vessel Trees in Cerebral 3D MRA. In Proceedings of the 2016 Signal Processing: Algorithms, Architectures, Arrangements, and Applications (SPA), Poznan, Poland, 21–23 September 2016; pp. 85–90. [Google Scholar] [CrossRef]
- Schwemmer, C.; Forman, C.; Wetzl, J.; Maier, A.; Hornegger, J. CoroEval: A multi-platform, multi-modality tool for the evaluation of 3D coronary vessel reconstructions. Phys. Med. Biol. 2014, 59, 5163–5174. [Google Scholar] [CrossRef] [PubMed]


© 2018 by the authors. Licensee MDPI, Basel, Switzerland. This article is an open access article distributed under the terms and conditions of the Creative Commons Attribution (CC BY) license (http://creativecommons.org/licenses/by/4.0/).
Share and Cite
Stimpel, B.; Wetzl, J.; Forman, C.; Schmidt, M.; Maier, A.; Unberath, M. Automated Curved and Multiplanar Reformation for Screening of the Proximal Coronary Arteries in MR Angiography. J. Imaging 2018, 4, 124. https://0-doi-org.brum.beds.ac.uk/10.3390/jimaging4110124
Stimpel B, Wetzl J, Forman C, Schmidt M, Maier A, Unberath M. Automated Curved and Multiplanar Reformation for Screening of the Proximal Coronary Arteries in MR Angiography. Journal of Imaging. 2018; 4(11):124. https://0-doi-org.brum.beds.ac.uk/10.3390/jimaging4110124
Chicago/Turabian StyleStimpel, Bernhard, Jens Wetzl, Christoph Forman, Michaela Schmidt, Andreas Maier, and Mathias Unberath. 2018. "Automated Curved and Multiplanar Reformation for Screening of the Proximal Coronary Arteries in MR Angiography" Journal of Imaging 4, no. 11: 124. https://0-doi-org.brum.beds.ac.uk/10.3390/jimaging4110124