1. Introduction
In cultural heritage preservation, the structural health of ancient structures is assessed by monitoring and measuring missing or deformed structural elements, cracks and fissures. Visual inspection remains the most used technique to detect damages and evaluate their progress and severity. Nonetheless, such technique may be time consuming and expensive; also, access to critical locations may be difficult.
The recent advances in UAV-based technologies open the way to several applications: precision agriculture, search and rescue task, traffic control, crime prevention, to name a few of them. A drone endowed with a proper acquisition payload (e.g., optical or thermal cameras, depth sensors) allows to acquire, and possibly processing on board, many kind of data. The present work is a pre-application study focusing on requirements and specification of the UAV acquisition modalities. Two methods have been implemented and compared in order to assess the feasibility of a marker-based approach for the analysis of cracks in historical structures.
Our work is carried out in the framework of the MOSCARDO project (
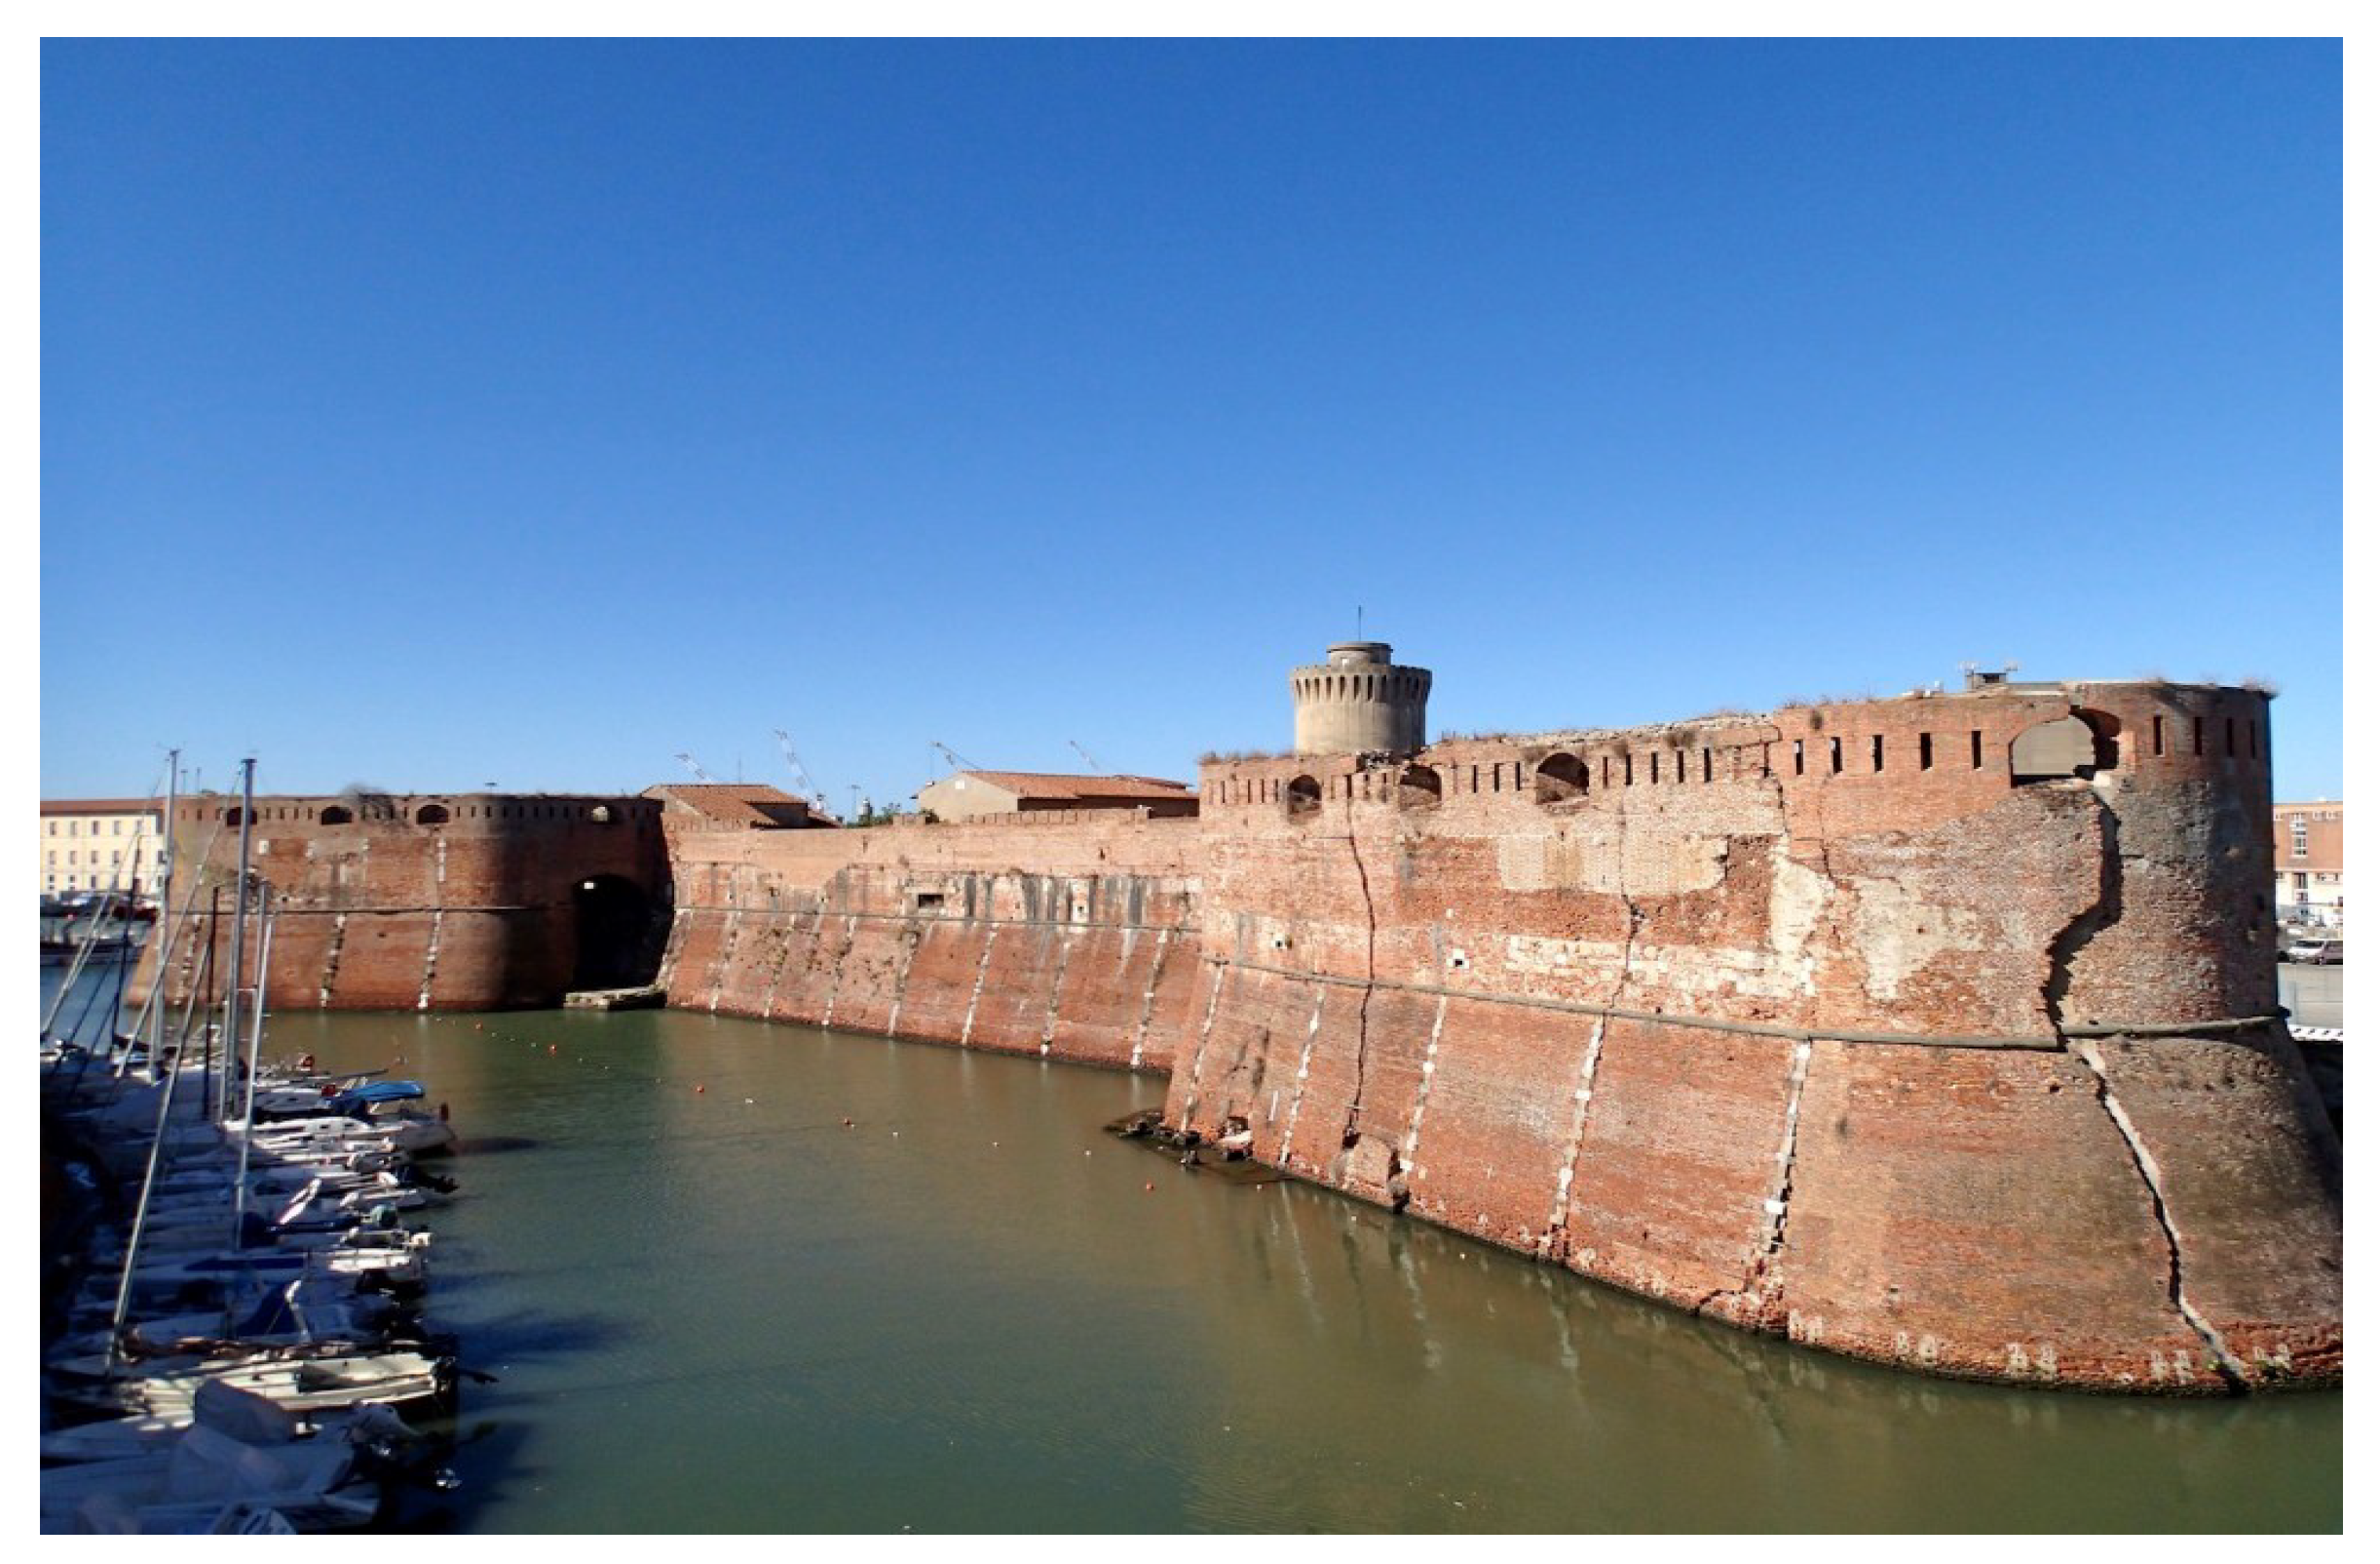
http://www.moscardo.it/), which aims at collecting and processing several structural data of historical sites, in order to provide a complete report about the structural health of architectural cultural heritage; data collected are also used to get a detailed 3D model of the historical site. The case study of Moscardo is the Fortezza Vecchia, an ancient fortress in Livorno (Italy): in particular, the walls of the fortress show some important cracks, which are difficult to be monitored, as they are partially surrounded by the sea (see
Figure 1). The inspection and monitoring of such structural damages would benefit a lot from the usage of UAV, by reducing risk, time and cost of the whole task.
2. State of the Art
State-of-the-art methods used for crack monitoring divide into two different groups: invasive and non-invasive methods. Here, we focus on non-invasive methods, which are more suitable to be applied in cultural heritage.
A large family of methods is based on close-range digital photogrammetry (see [
1] for a survey). At each acquisition, a 3D point cloud of the scene is estimated, and the crack is segmented. The most used tools to monitor over time the variation of the crack pattern are: (i)
conventional analysis, i.e., comparing the estimated 3D coordinates of the same points by using statistical tests [
2]; (ii) shape analysis, e.g., by matching surfaces [
3] or comparing their shape signatures [
4], or comparing a specific shape parameter (the surface area associated to each crack) complemented with a bootstrap testing to detect only statistical meaningful variations in crack opening [
5].
Other techniques belonging to this family aim at the automatic detection and measurement of the structure damages using image-based algorithms. In [
6], the authors refer to two procedures to automatically and specifically filter out the cracking patterns: the former evaluates the color level for each pixel, in order to enhance the structural discontinuities (unfortunately failing when the structure walls are not clear); the latter one is based on the detection of the edges (by applying a Gaussian Blur and subtracting the filtered image from the original one). In this work, the inspection is performed using a rotary wing octocopter micro air vehicle (MAV) and a high resolution digital camera; nonetheless, no quantitative analysis of cracks was performed.
In [
7,
8], Jahanshahi et al. proposed a method based on 3D reconstruction of the scene, image segmentation and binarization to isolate the pattern related to small cross-sectional structural defects. Two classifiers were trained to distinguish crack from non-crack patterns. The used approach was meant to be applied to images captured from any distance (20 m in their experimental tests) and acquired using any resolution and focal length (600 mm in their experimental tests). Nonetheless, the proposed method is suitable for detection of anomalies over homogeneous background (for instance, concrete).
Niemer and colleagues [
9] developed the so-called “Digital Rissmess-System” (DRS), a system based on a commercial camera and a dedicated software to monitor cracks and damages in civil structures. Such system is based on a cylindrical tube fixed to a chamber which allows for a constant multi-spectral illumination. The authors also proposed three approaches to extract crack parameters: (i) Fly–Fisher algorithm, which allows for automatically measuring crack dimensions and monitoring its opening over time; (ii) manual measurement of the crack size at a pre-selected point and evaluation of crack profile; and (iii) correlative approach, which deduces crack parameters by the roto-translation necessary to line up and join the two sides of the fissure.
Another family of non-invasive methods for structural defects monitoring exploits the so-called “reflective targets” or “markers” to “mark” the most critical point of a discontinuity [
10]. In the work of Nishiyama and colleagues [
11], such targets are described: they are made by glass droplets, so as to reflect the light as much as possible. Such targets are used to monitor the crack under the assumption of a planar displacement. Nonetheless, the markers can also be home-made; useful suggestions on their dimensions, materials, etc. can be taken from the study of Shortis et al. [
12].
The targets they are usually positioned over the crack at points of interest. A number of images are acquired; by means of photogrammetric techniques, the coordinates of the targets can be assessed, as well as the ones of their centroids. Any displacement identified by the coordinates of the targets is used to calculate the force field along the discontinuities of interest (tensile and shear forces). The main sources of error are due to the distance of the camera (the greater the distance of the camera, the lower the accuracy with which the crack width will be calculated) and the calculation of the centroids’ coordinates.
In [
10], Hough transform is used to detect markers and identify their geometric centers. Homography techniques are used to correct the perspective error and to identify the planar coordinates of the targets.
Benning et al. [
13] tested different structural elements of pre-stressed, reinforced and textile concrete. For the photogrammetric measurements, the surfaces were prepared by a grid of circular targets. Three digital cameras (Kodak DCS Pro 14n) were used to simultaneously capture images of the surface. The measurements were repeated in time intervals and the relative distances between adjacent targets were calculated, thus allowing for monitoring the cracks and discontinuities’ evolution. In addition, a Finite-Element-Module was developed, which simulated the test: thus, the results of photogrammetric measurements could be compared with the numeric tension calculation and iteratively improved.
To conclude, a comprehensive view of the main challenges related to cracks’ automatic detection in civil infrastructures performed with UAVs and image-based methods is provided by the works of Jahanshahi [
14] and Ellenberg [
15]. The former describes and evaluates, in particular, several image processing techniques, including enhancement, noise removal, registration, edge detection, line detection, morphological functions, color analysis, texture detection, wavelet transform, segmentation, clustering, and pattern recognition. In addition, the issue related to the noise due to the edges of doors, windows, and buildings, which are sharpened when edge detection algorithms are performed, is addressed. In [
15], the main issues related to image acquisition performed with UAVs are reported: the environmental conditions (the wind in particular), the setting of camera parameters, the UAV GPS position and angle of orientation.
3. Methodology
The aim of the present study is to develop a sort of improved 3D tell-tale; even if loosing in measurement accuracy we aimed at recovering a complete 3D information, along with the possibility of tracking over time a simple representation of the variations of the fissure pattern. Such representation is made of: (i) the set of the distances between the barycenters of each pair of markers, and (ii) the angle variations between the reference frame associated with each marker. Under the assumption that the fiducial markers are placed along the crack in the points most stressed, hence, subject to variations, this analysis may be the base of a reliable long-term crack monitoring.
In our experimentation, for simplicity, we considered only some distances between the pair of markers, and simulated a planar motion; nonetheless, the described methods can easily be applied, as it is, to a 3D variation of the marker configuration. In addition, all the pairs of markers can be considered for the distance variation analysis, in order to provide more complete information about the inspected area.
We used the ArUco fiducial markers: they are black and white square planar coded markers [
16] and can be robustly detected under a wide range of conditions; in addition, such markers are the fundamental ingredient for a fast, accurate and robust camera localization [
17].
Localizing the camera with respect to the markers in a single image means that we associate with each marker a rigid 3D transformation, given by a 3 × 3 rotation matrix rotation matrix
and a 3 × 1 translation vector
:
maps the camera reference system into the marker reference system, while
translates the origin of the camera reference system into the origin of the marker reference system (marker barycenter). For a reference of the basic concepts about the estimation of the intrinsic and extrinsic camera parameters, see [
18].
After calibrating the camera, the image are rectified (using the camera calibration matrix, i.e., intrinsic parameters). The first method (Rt) is inspired by [
11]. They estimate the 2D displacement by converting an arbitrary image of a reflective target to one facing the target via perspective projection, while we recover the 3D displacement between markers using the camera pose estimation. In more detail, the marker is detected using the ArUco library; as the marker is a planar object, the transformation between points expressed in the marker frame and projected points into the image plane expressed in the normalized camera frame is a homography. A planar homography
relates the transformation between two 3D planes (e.g., the 3D plane of the marker and its image projection),
and
can be estimated up to a scale factor (after normalization
H is a 3 × 3 matrix with eight degrees of freedom).
is estimated using the Direct Linear Transform (DLT) algorithm, followed by a polar decomposition, to get the rotation matrix
and the translation vector
. Hence,
and
are used to assess the distances between pairs of marker barycenters, and to estimate the markers’ orientation.
The second method used to analyse a crack variation is a marker-based Simultaneous Localization and Mapping (MM, [
17]). The distance between a pair the markers is computed following the procedure described in [
17]: a set of six frames of the same scene is acquired and at each frame the graph-pose is estimated minimizing the re-projection error in the detection of the marker corners. The output of the algorithm are the 3D coordinates of the corners with marker ids. The resulting distances between the markers’ barycenter are then computed.
Table 1 shows the distances between three pairs of markers.
4. Experimentation
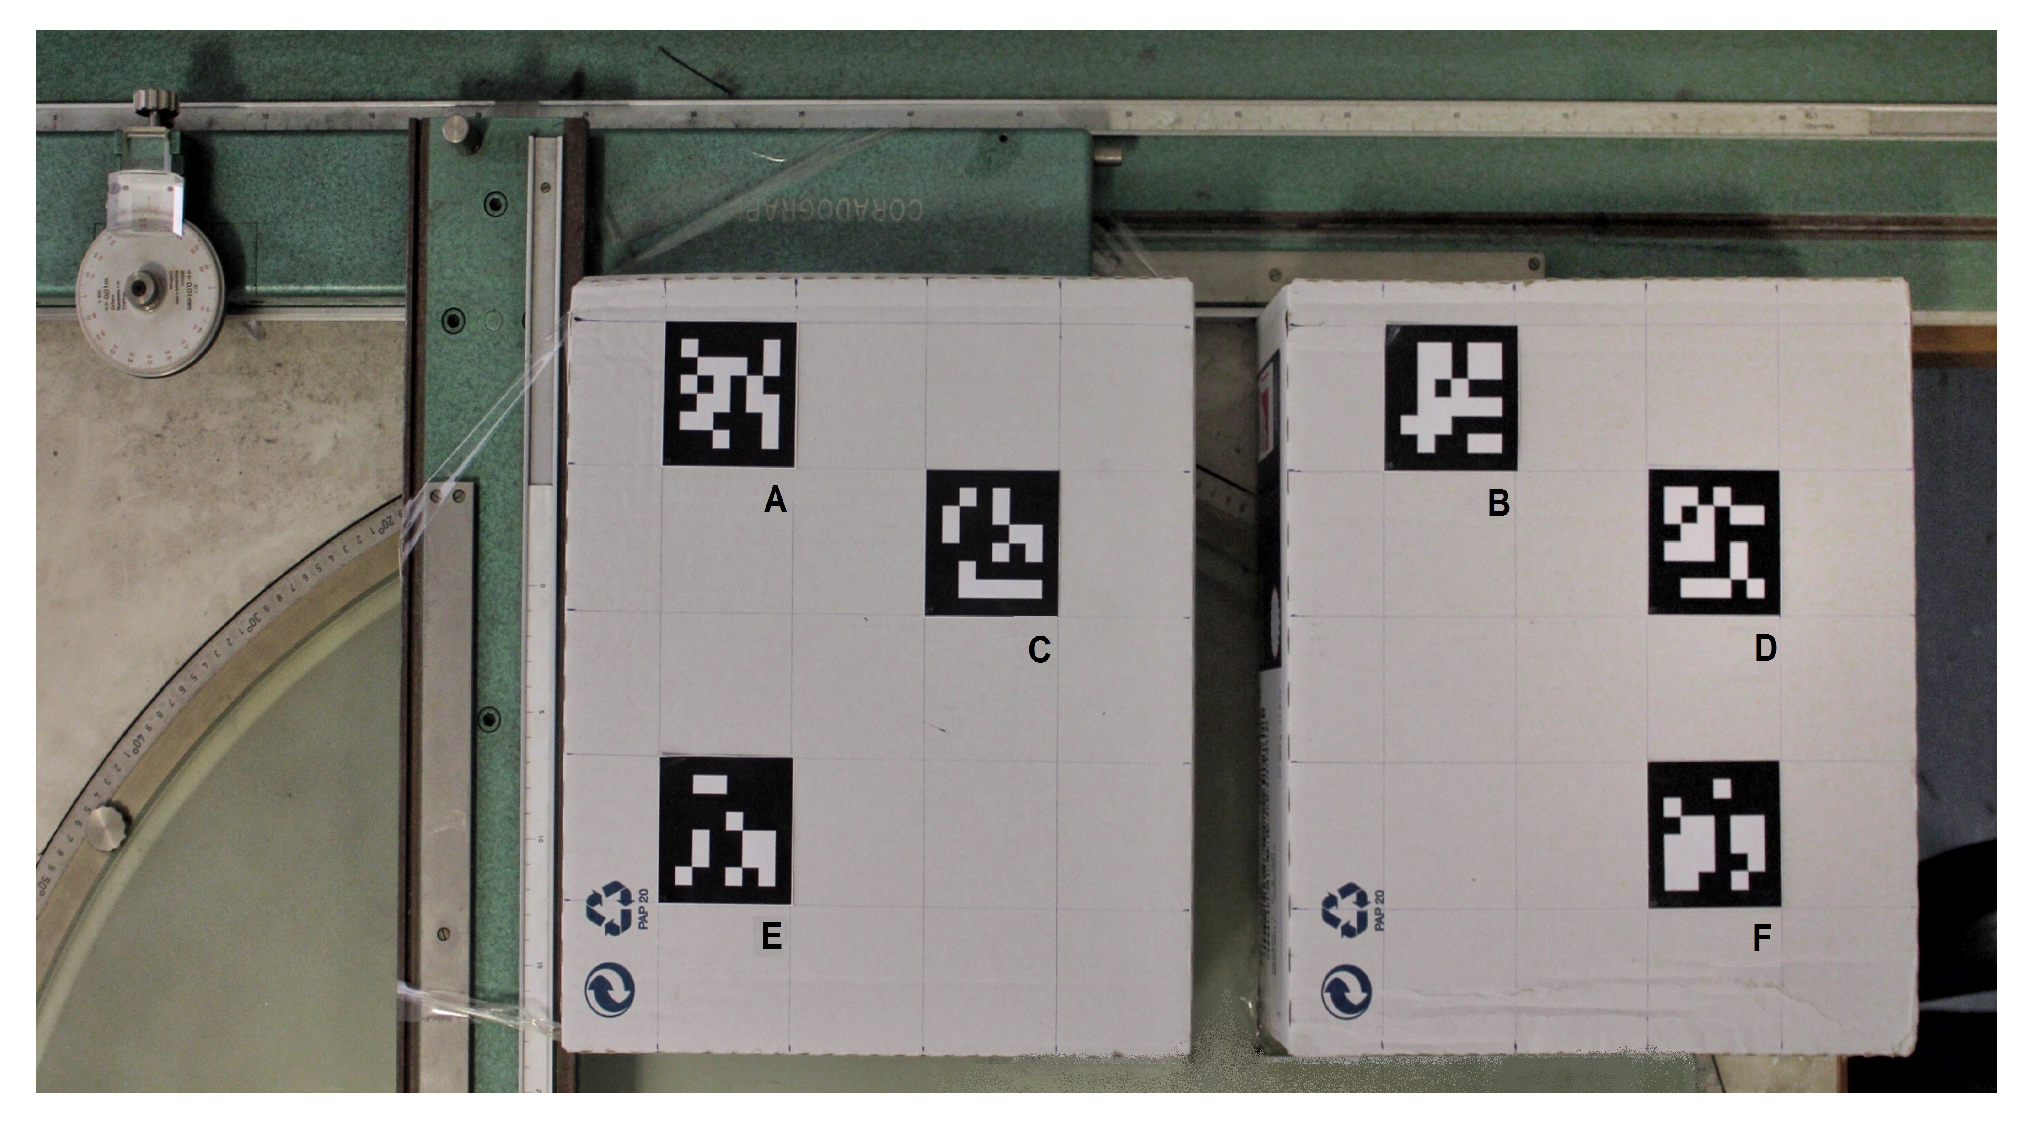
In order to test the ArUco marker detection and their position evaluation, we performed some tests in our laboratory. The camera Canon Eos M (with focal length of 24 mm, and image resolution of
pixel) has been calibrated twice: once using a ChArUco board, once using a standard chessboard. The re-projection error estimated was of 1.55 px in the first case, and of 0.76 in the other. Six planar markers, with side length of 5.5 cm, were fixed on two identical boxes (three markers on left, three on right). The left box was allowed sliding integral with a mobile axis of a coordinatographer, while the right one was fixed to the table (
Figure 2). The certified accuracy of the coordinatographer is of 0.1 mm.
Images were acquired at about 150 cm from the coordinatographer table. The crack opening Was sampled in 10 steps: 5 steps by 5 mm, and other 5 steps by 1 mm, by moving the left box far from the right one along one axis.
Hardware
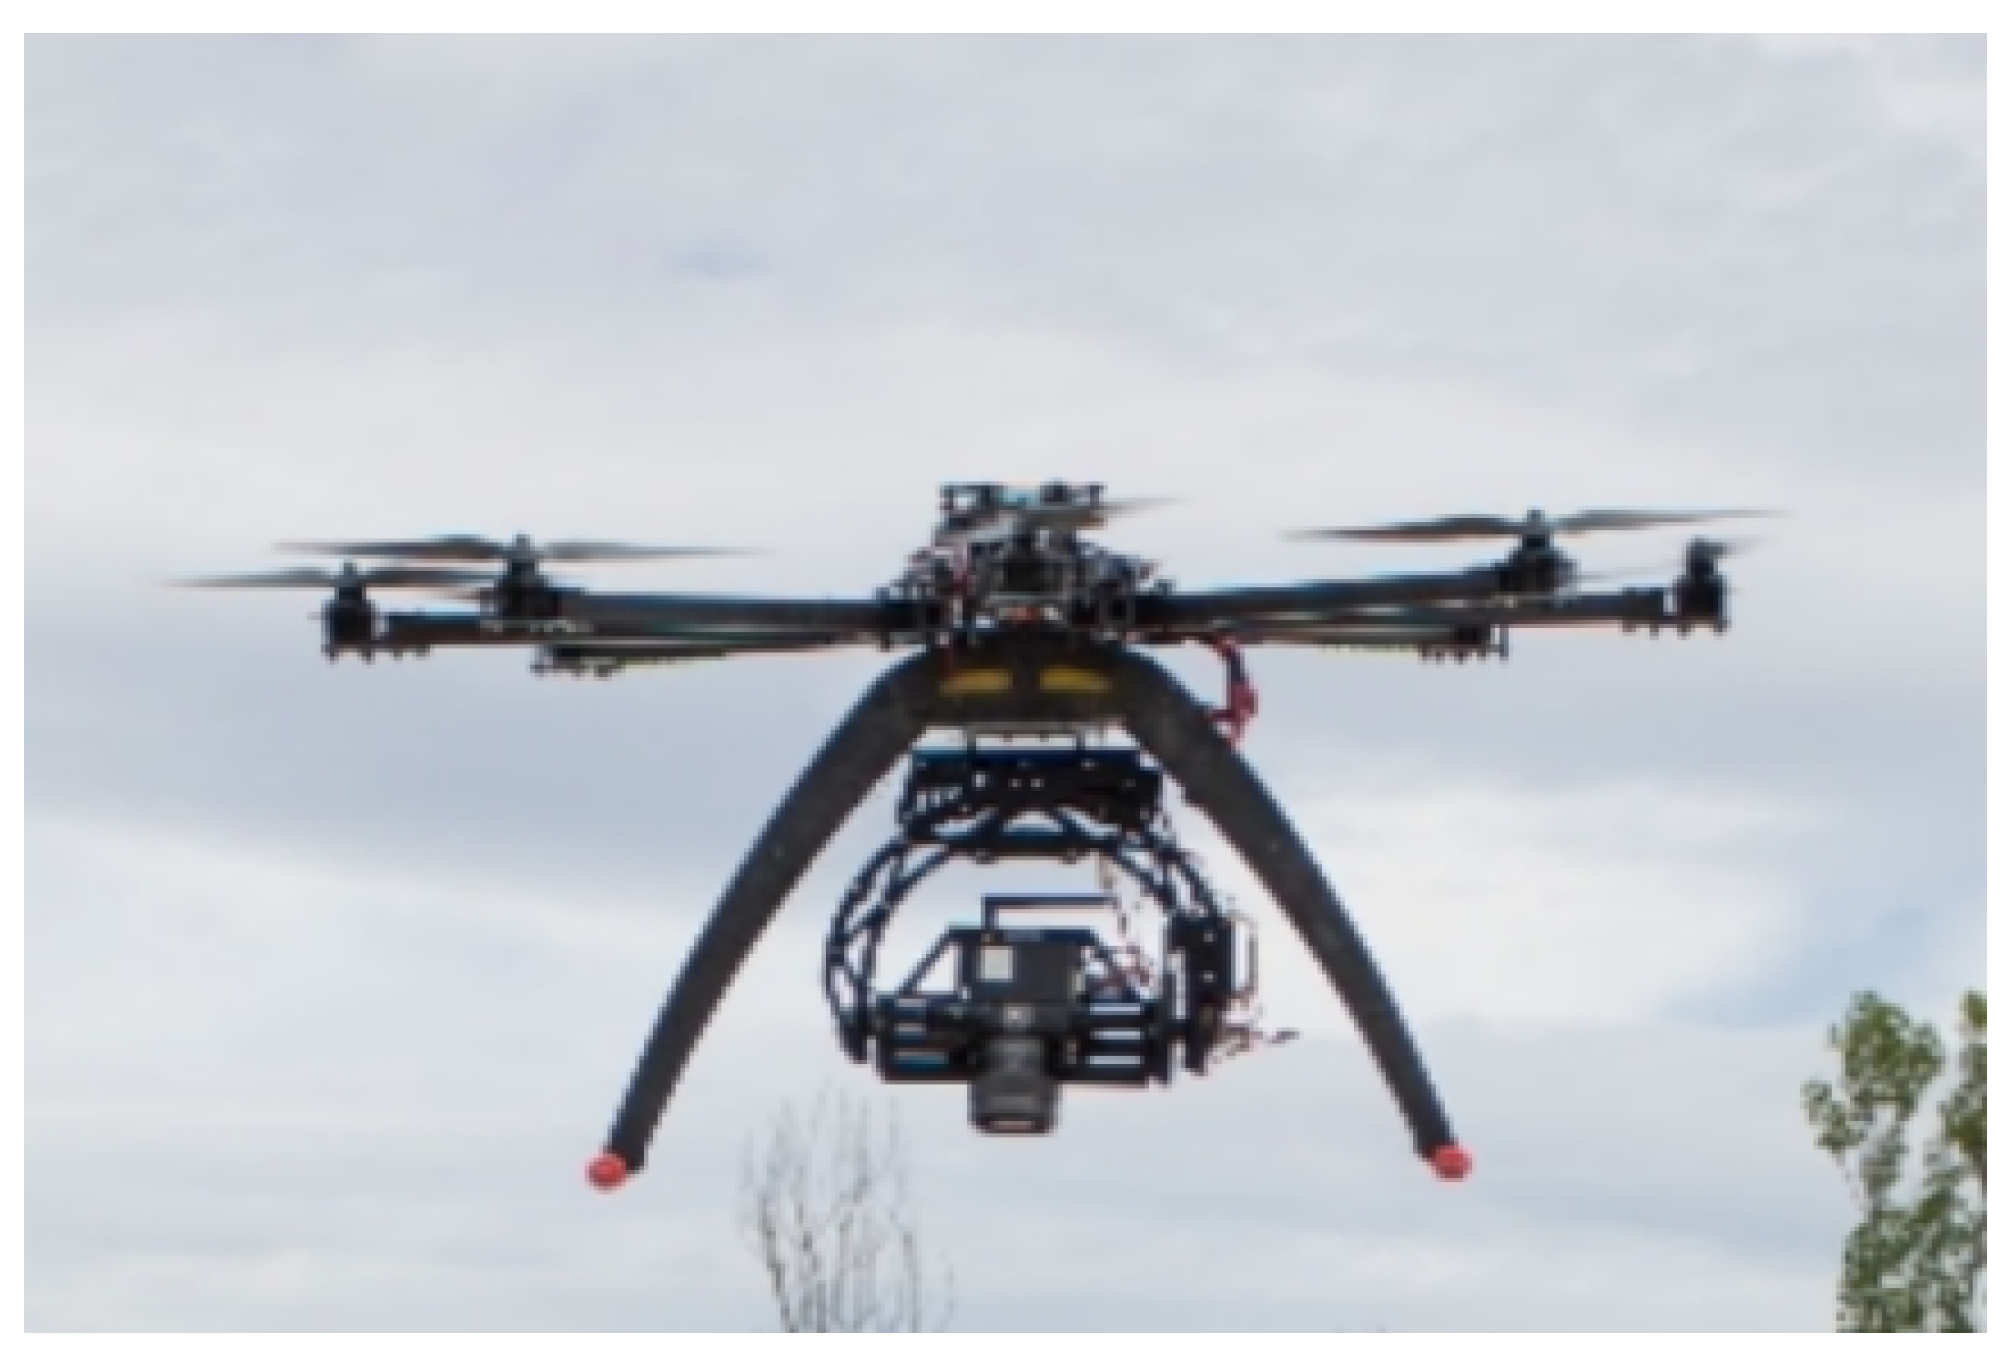
The data acquisition system is made up by several optical and electronic devices mounted on the custom ISTI-CNR drone: it is a Micro Air Vehicle designed and assembled in the Institute of Information Science and Technologies of the National Research Council of Italy. This drone has two flight modes: the usual free flight mode, controlled by the pilot, and the programmed flight mode, when the drone flight is based on a predefined set of GPS coordinates of way-points. The latter modality is quite interesting, for our purpose, as it allows for repeating the same flight over time; hence, it may support the creation of a large dataset of the site of interest over time. In the original setting on the bottom of the drone, there is a stabilized component, named gimbal, hosting a digital camera for video recording, as shown in
Figure 3. The optical camera used is the Canon EOS M (Canon Inc, Japan), a 18 Mega-pixel mirror-less with a sensor APS-C of
mm (aspect ratio 3:2). The maximum video resolution is of
pixel at 30 fps. It weighs 298 g and has dimensions
mm. The focal length varies in the range 18–55 mm.
5. Results
The experimentation consisted of two steps: a camera calibration, followed by the estimation of the 3D position of the markers. In more detail, the camera calibration was made using two chessboards: the standard one, and the ChArUco chessboard (using the ArUco library [
16,
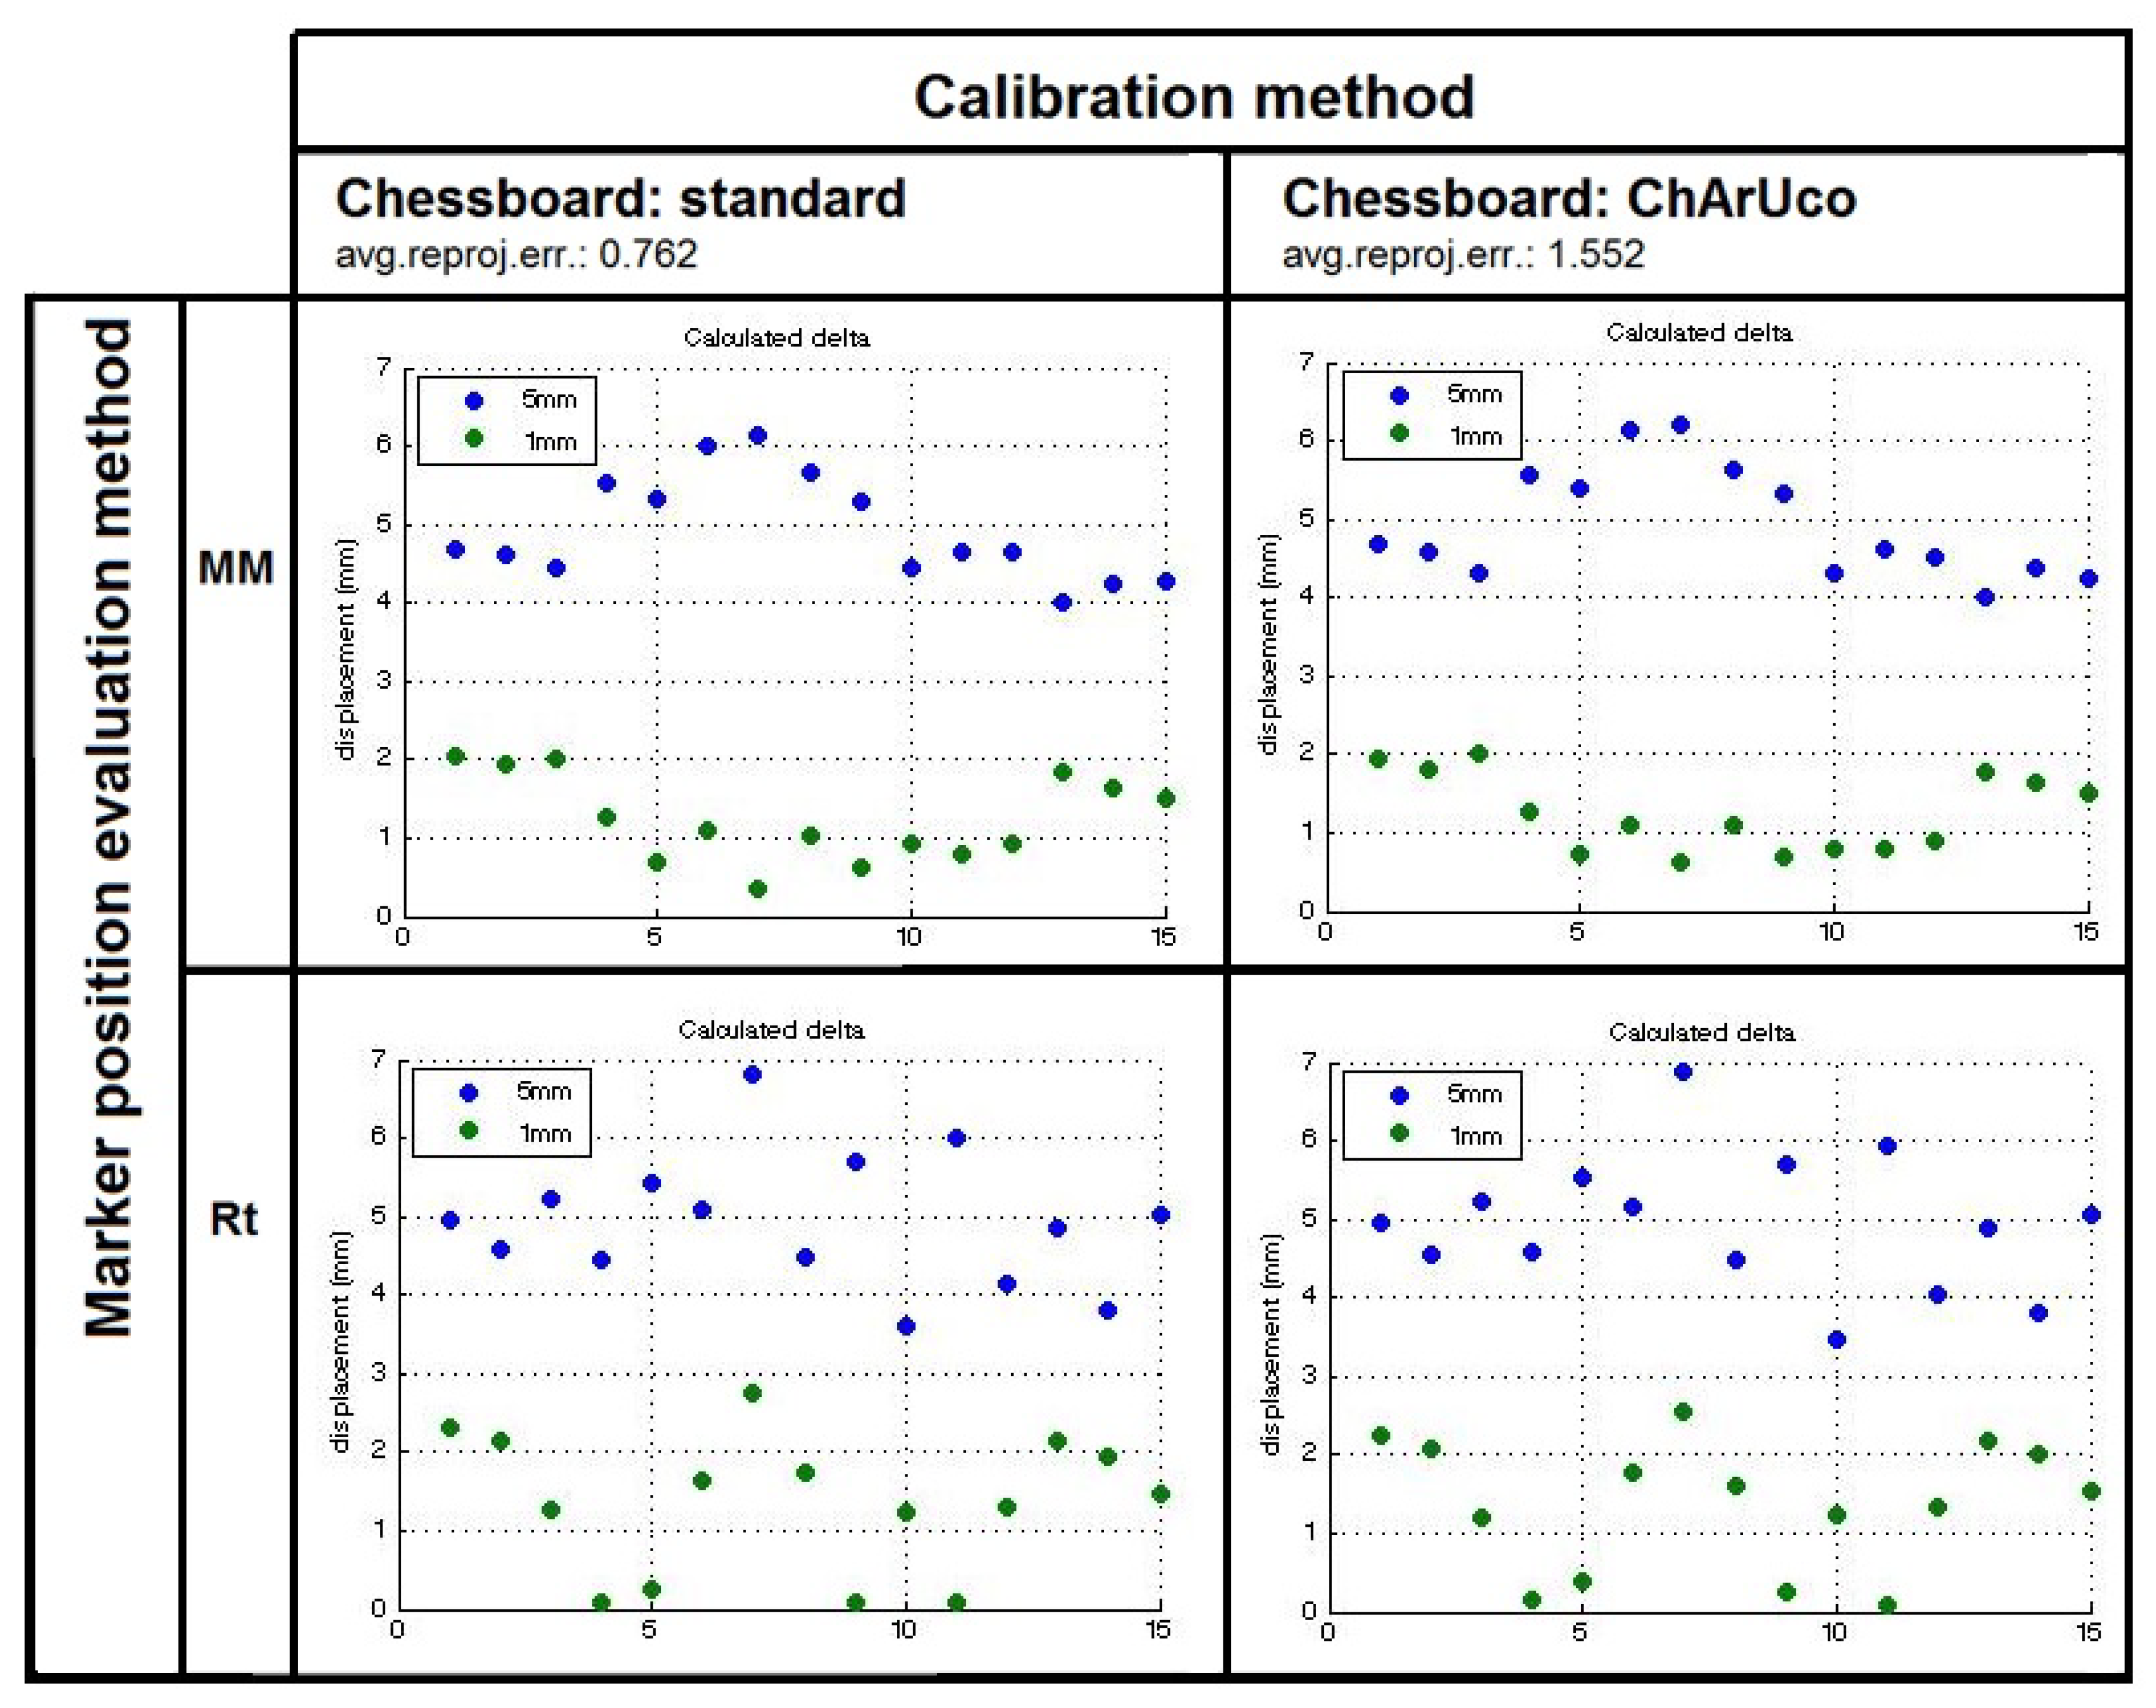
19]). The standard method showed a better average reprojection error: 0.76 vs 1.55 pixels. Concerning the second step, we compared two algorithms: the first one (referred to as Rt) uses the 3D translation vectors directly estimated from the camera pose parameters, and the second one is the marker-based SLAM (referred to as MM [
17]), which minimizes the reprojection error for the detection of each marker, taking advantage of the simultaneous detection of all the markers in the scene.
The tests showed that: (i) a good calibration of the optical cameras is important; (ii) planar markers (e.g., ArUco markers) are able to provide an accurate measurement of the distance variations over time (the estimated error is less than 1 mm); and (iii) the analysis provides a smart representation of the crack pattern, not only about the 2D displacement (tensile and shear), but a complete three-dimensional information.
In
Figure 4, the output of the two methods are plotted, highlighting that MM is a more robust than Rt against the reprojection error of camera calibration. In addition,
Table 2 shows that the measurements computed with MM had a lower standard deviation.
The experimentation performed showed that the simultaneous localization and mapping from planar marker (MM method) is quite a stable method, able to provide an accuracy of less than 1 mm with only six images of the scene, not strongly depending on calibration.
6. Discussion
This study is focused on marker-based methods because they seem to fit better the requirements of a long-term monitoring through UAV. `Long-term’, in this case, means a minimum of a year, in order to capture the seasonal changes, including temperature, lighting, humidity, and also the vegetation variation. All these factors potentially affect any marker-less feature point detection (e.g., those based on SIFT or SURF) in the inspected scene, hence making difficult an accurate segmentation of the crack over time. Regarding the acquisition modalities, it seems essential to have the drone stable and close to the target (from 150 to 200 cm), in order to get high resolution images without blur. In addition, a regular illumination would play a role in the marker detection and recognition: sharp shadows or poor lighting could interfere or make impossible the marker detection. Moreover, the configuration of the markers installed along a crack may affect greatly the accuracy of the analysis, based on the valuation of the distance variations between (pair of) markers. However, this dependence on markers’ location along the damaged area may be turned into a strength: a specialized team may support the identification of the points more subject to physical stress, in order to be labeled with markers. It is noteworthy that very few images were required to run each algorithm: six images for each marker configuration. Hopefully, increasing the number of images would result in a better repeatability of the measurements for both methods (Rt and MM). Even if there exist other important features of the crack pattern (such as the crack area and elongation, as in [
5]) which can be monitored, in our opinion, the 3D variations of the crack may complement those features, also providing a simple and effective representation of the crack.
7. Conclusions
Our conclusion is that it is possible and useful to use UAV for the long-term monitoring of crack patterns of architectural heritage, in order to prevent collapses or to schedule maintenance work. This is true especially when target environments are surrounded by water or challenging terrain as in Fortezza Vecchia in Livorno: UAV-based methods for structural monitoring may be practical and feasible even when the environmental and structural context makes it difficult or impossible to implement ground-based approaches usually adopted in Cultural Heritage, e.g., short-range laser-scanning.
The next step of the validation is to acquire several sequences of images of the cracks of the Fortezza Vecchia in Livorno using the UAV. Those high resolution images will be acquired by the camera mounted on the UAV, hovering close to the target. Increasing the number of samples for any acquisition (only six images have been acquired in our test for each marker configuration) would result in a reduction of the measurement error. Simultaneously, we plan to both improve the marker localization, by using the ChArUco diamond markers instead of the single markers. A diamond marker is a chessboard composed of 3 × 3 squares and four ArUco markers inside the white squares. The detection of a diamond marker takes advantage of the known relative position of the markers in it, and it will increase robustness and accuracy of the marker pose estimation.
Author Contributions
Conceptualization, ALL; Investigation and Methodology, D.G., D.M. and M.A.P.; Resources and Software, G.R.L. and M.T.; Validation, D.G. and M.A.P.; Writing – original draft, D.G. and M.A.P.; Writing-Rewiew & Editing: D.G., D.M. and M.A.P.; Supervision & Funding acquisition, D.M.
Funding
This research is being funded by the Tuscany Region in the framework of the Project “MOSCARDO” (FAR-FAS 2014).
Conflicts of Interest
The authors declare no conflict of interest. The founding sponsors had no role in the design of the study; in the collection, analyses, or interpretation of data; in the writing of the manuscript, and in the decision to publish the results.
References
- Remondino, F.; El-Hakim, S. Image-based 3D modelling: A review. Photogramm. Rec. 2006, 21, 269–291. [Google Scholar] [CrossRef]
- Welsch, W.; Heunecke, O. Models and Terminology for the Analysis of Geodetic Monitoring Observations. In Proceedings of the FIG 10th International Symposium on Deformation Measurements, Orange, CA, USA, 19–22 March 2001; International Federation of Surveyors: Copenhagen, Denmark, 2001; Volume 25, p. 22. [Google Scholar]
- Gruen, A.; Akca, D. Least square 3D surface and curve matching. ISPRS J. Photogramm. Remote Sens. 2005, 59, 151–174. [Google Scholar] [CrossRef]
- Cardone, A.; Gupta, S.; Karnik, M. A survey of shape similarity assessment algorithms for product desing and manifacturing applications. J. Comput. Inf. Sci. Eng. 2003, 3, 109–118. [Google Scholar] [CrossRef]
- Armesto, J.; Arias, P.; Roca, J.; Lorenzo, H. Monitoring and assessing structural damage in historical buildings. Photogramm. Rec. 2006, 21, 269–291. [Google Scholar]
- Eschmann, C.; Kuo, C.M.; Kuo, C.H.; Boller, C. Unmanned Aircraft Systems for Remote Building Inspection and Monitoring. In Proceedings of the 6th European Workshop on Structural Health Monitoring, Dresden, Germany, 3–6 July 2012. [Google Scholar]
- Jahanshahi, M.R.; Masri, S.F.; Padgett, C.W.; Sukhatme, G.S. An innovative methodology for detection and quantification of cracks through incorporation of depth perception. Mach. Vis. Appl. 2011, 24, 227–241. [Google Scholar] [CrossRef]
- Jahanshahi, M.R.; Masri, S.F. A new methodology for non-contact accurate crack width measurement through photogrammetry for automated structural safety evaluation. Smart Mater. Struct. 2013, 22, 035019. [Google Scholar] [CrossRef]
- Niemeier, W.; Riedel, B.; Fraser, C.; Neuss, H.; Stratmann, R.; Ziem, E. New Digital Crack Monitoring System or Measuring and Documentation of Width of Cracks in Concrete Structures. In Proceedings of the 13th FIG Symposium on Deformation Measurements and Analysis, Lnec, Lisbon, 12–15 May 2008. [Google Scholar]
- Valença, J.; Dias-da Costa, D.; Júlio, E.; Araújo, H.; Costa, H. Automatic crack monitoring using photogrammetry and image processing. Measurement 2013, 46, 433–441. [Google Scholar] [CrossRef]
- Nishiyama, S.; Minakata, N.; Kikuchi, T.; Yano, T. Improved digital photogrammetry technique for crack monitoring. Adv. Eng. Inform. 2015, 29, 851–858. [Google Scholar] [CrossRef]
- Shortis, M.R.; Seager, J.W. A practical target recognition system for close range photogrammetry. Photogramm. Rec. 2014, 29, 337–355. [Google Scholar] [CrossRef]
- Benning, W.; Görtz, S.; Lange, J.; Schwermann, R.; Chudoba, R. Development of an algorithm for automatic analysis of deformation of reinforced concrete structures using photogrammetry. VDI Ber. 2003, 1757, 411–418. [Google Scholar]
- Jahanshahi, M.R.; Kelly, J.S.; Masri, S.F.; Sukhatme, G.S. A survey and evaluation of promising approaches for automatic image-based defect detection of bridge structures. Struct. Infrastruct. Eng. 2009, 5, 455–486. [Google Scholar] [CrossRef]
- Ellenberg, A.; Kontsos, A.; Bartoli, I.; Pradhan, A. Masonry Crack Detection Application of an Unmanned Aerial Vehicle. In Proceedings of the ASCE 2014 Computing in Civil and Building Engineering, Orlando, FL, USA, 23–25 June 2014. [Google Scholar]
- Garrido-Jurado, S.; noz Salinas, R.M.; Madrid-Cuevas, F.; Marín-Jiménez, M. Automatic generation and detection of highly reliable fiducial markers under occlusion. Pattern Recognit. 2014, 47, 2280–2292. [Google Scholar] [CrossRef]
- Munoz-Salinas, R.; Marin-Jimenez, M.J.; Yeguas-Bolivar, E.; Medina-Carnicer, R. Mapping and localization from planar markers. Pattern Recognit. 2018, 73, 158–171. [Google Scholar] [CrossRef] [Green Version]
- Hartley, R.; Zisserman, A. Multiple View Geometry in Computer Vision; Cambridge University Press: Cambridge, UK, 2003. [Google Scholar]
- Garrido-Jurado, S.; noz Salinas, R.M.; Madrid-Cuevas, F.; Medina-Carnicer, R. Generation of fiducial marker dictionaries using mixed integer linear programming. Pattern Recognit. 2016, 51, 481–491. [Google Scholar] [CrossRef]
© 2018 by the authors. Licensee MDPI, Basel, Switzerland. This article is an open access article distributed under the terms and conditions of the Creative Commons Attribution (CC BY) license (http://creativecommons.org/licenses/by/4.0/).


 ,
, 


