Real-Time In Vivo Imaging of the Developing Pupal Wing Tissues in the Pale Grass Blue Butterfly Zizeeria maha: Establishing the Lycaenid System for Multiscale Bioimaging


Abstract
:1. Introduction
2. Materials and Methods
2.1. Butterflies
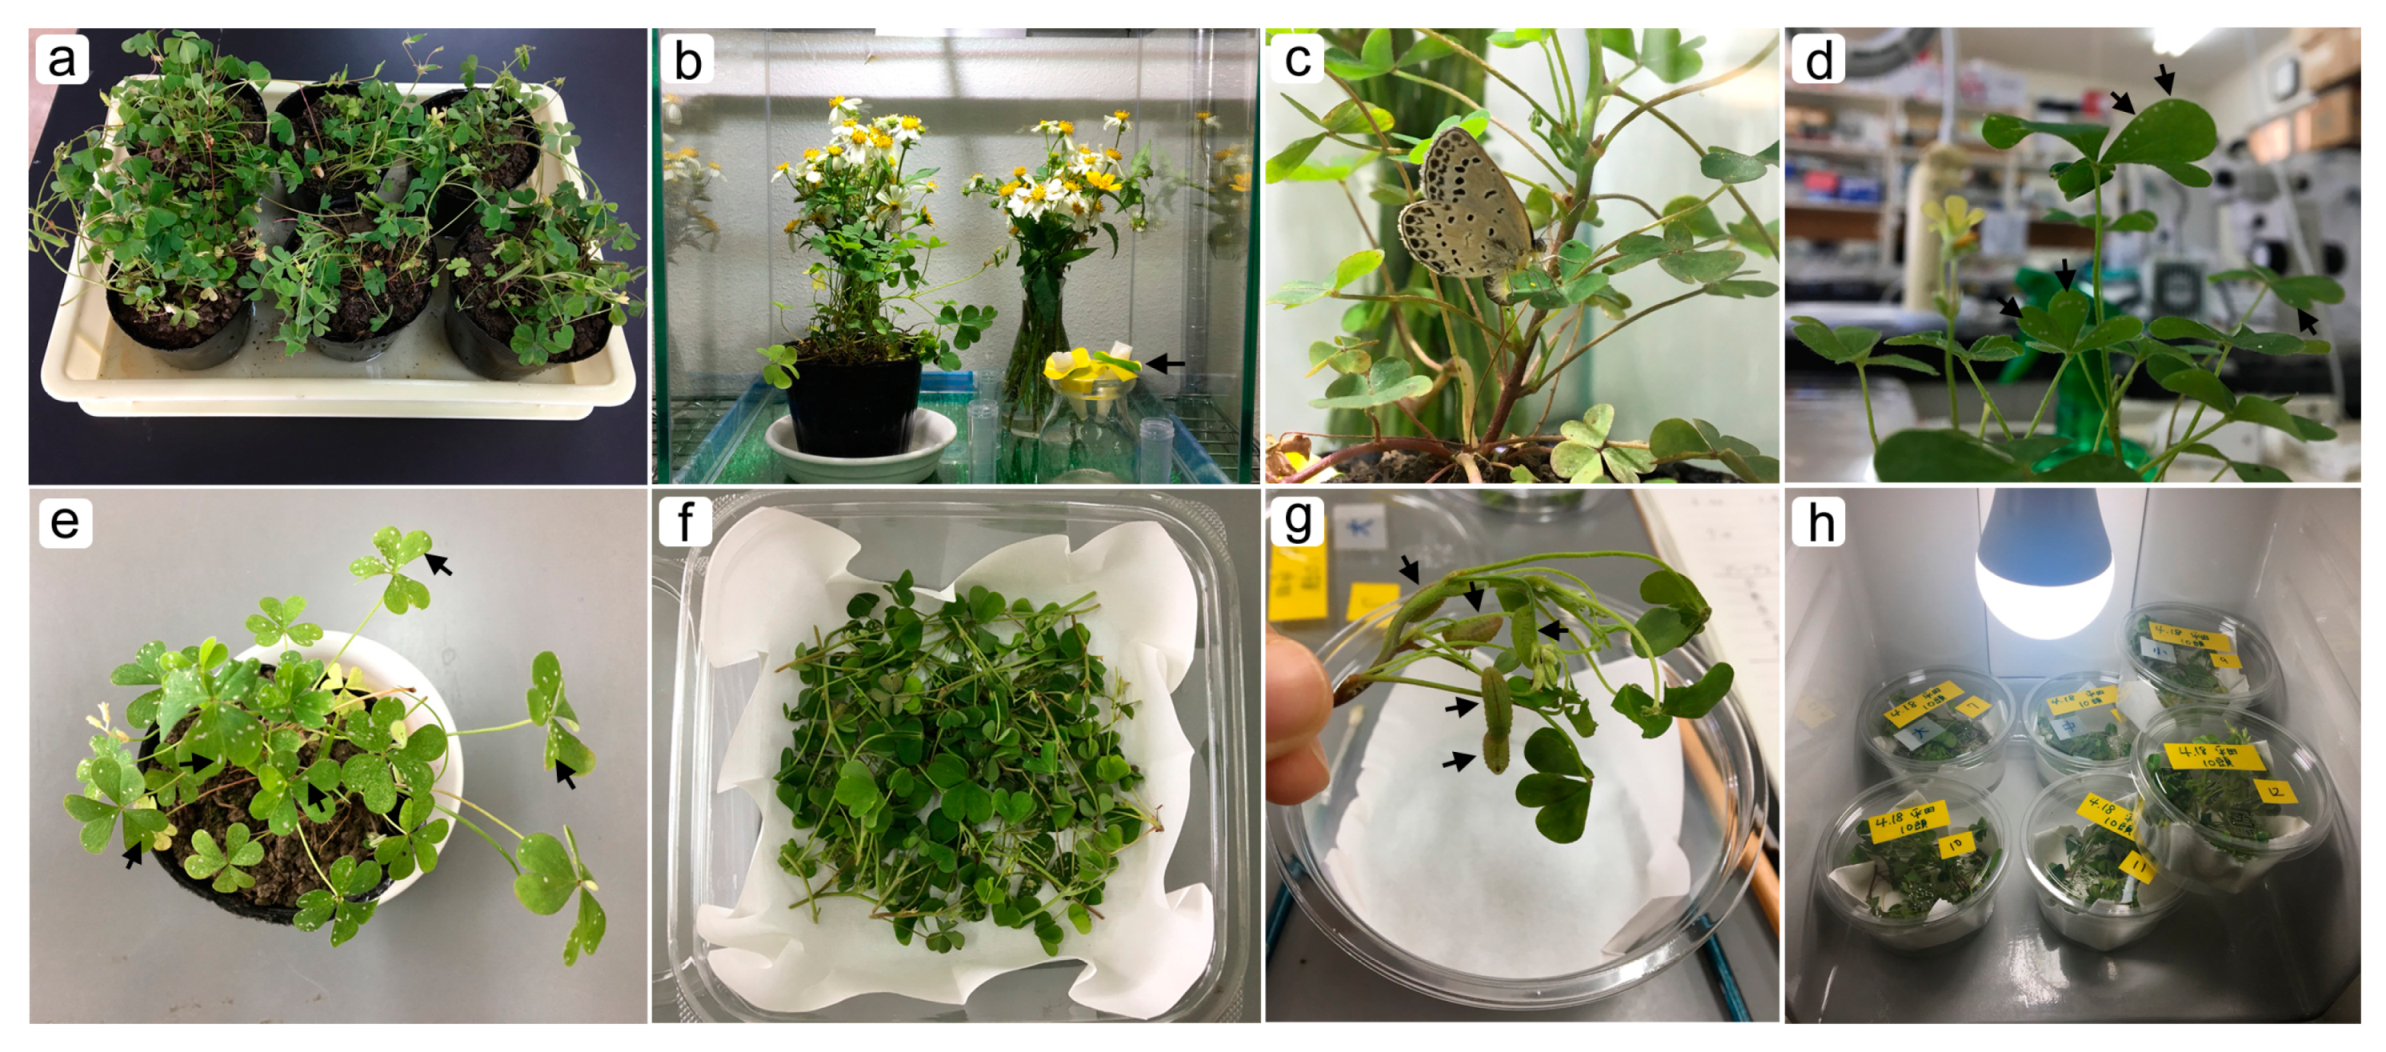
2.2. Rearing
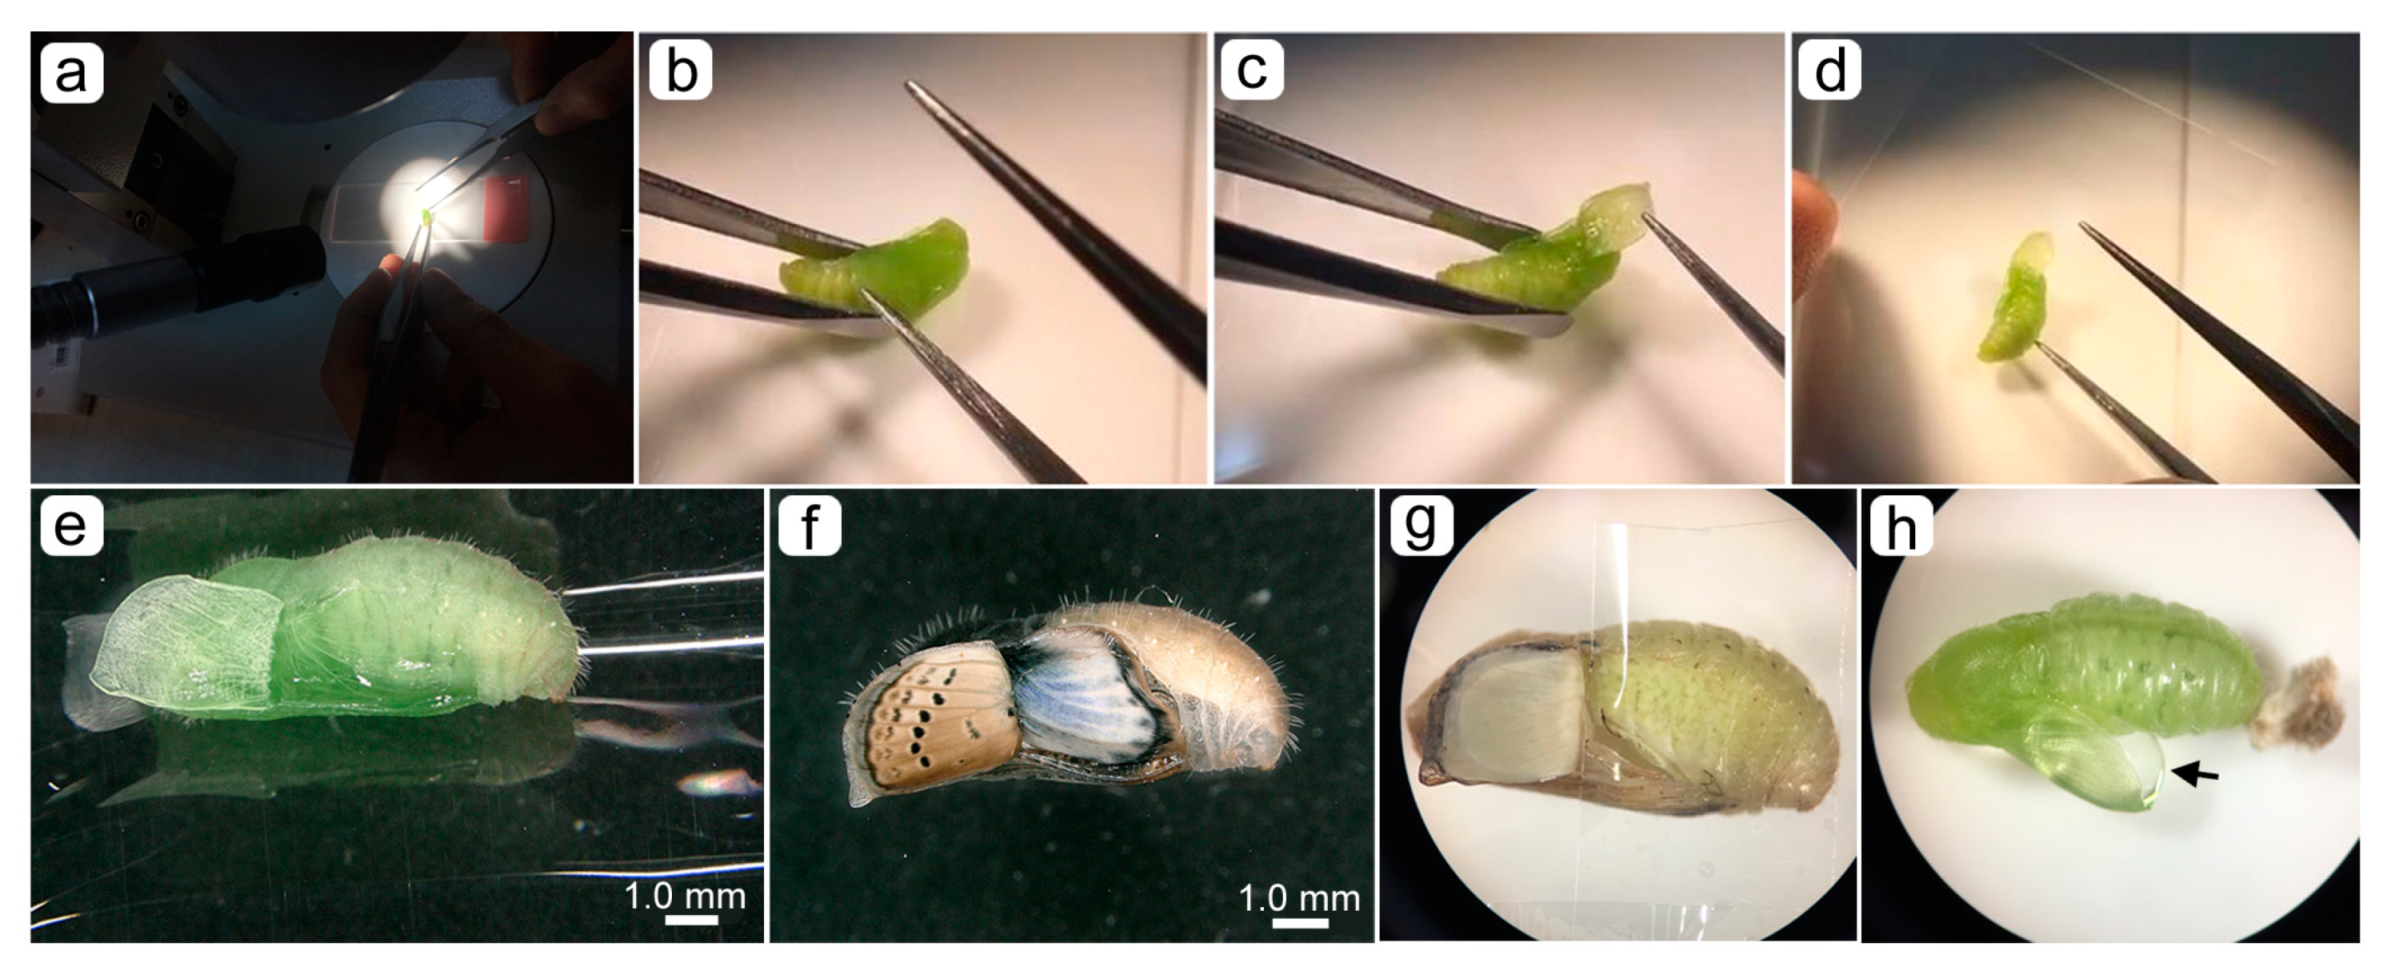
2.3. Surgical Manipulations, Staining and Mounting
2.4. Fluorescent Dyes
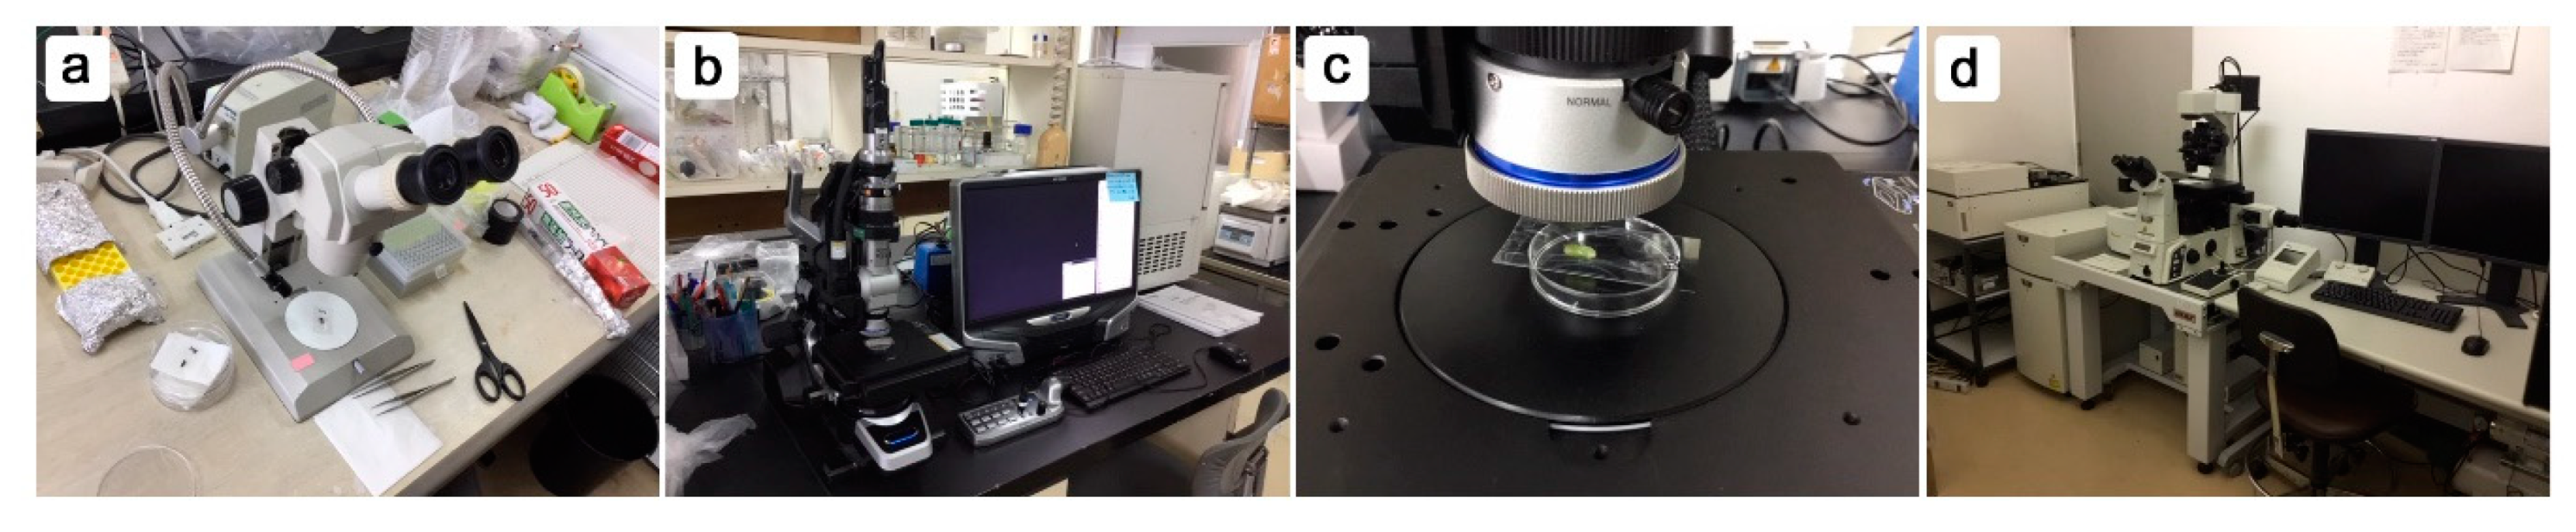
2.5. Microscopes, Image Acquisition, Editing and Analyses
3. Results
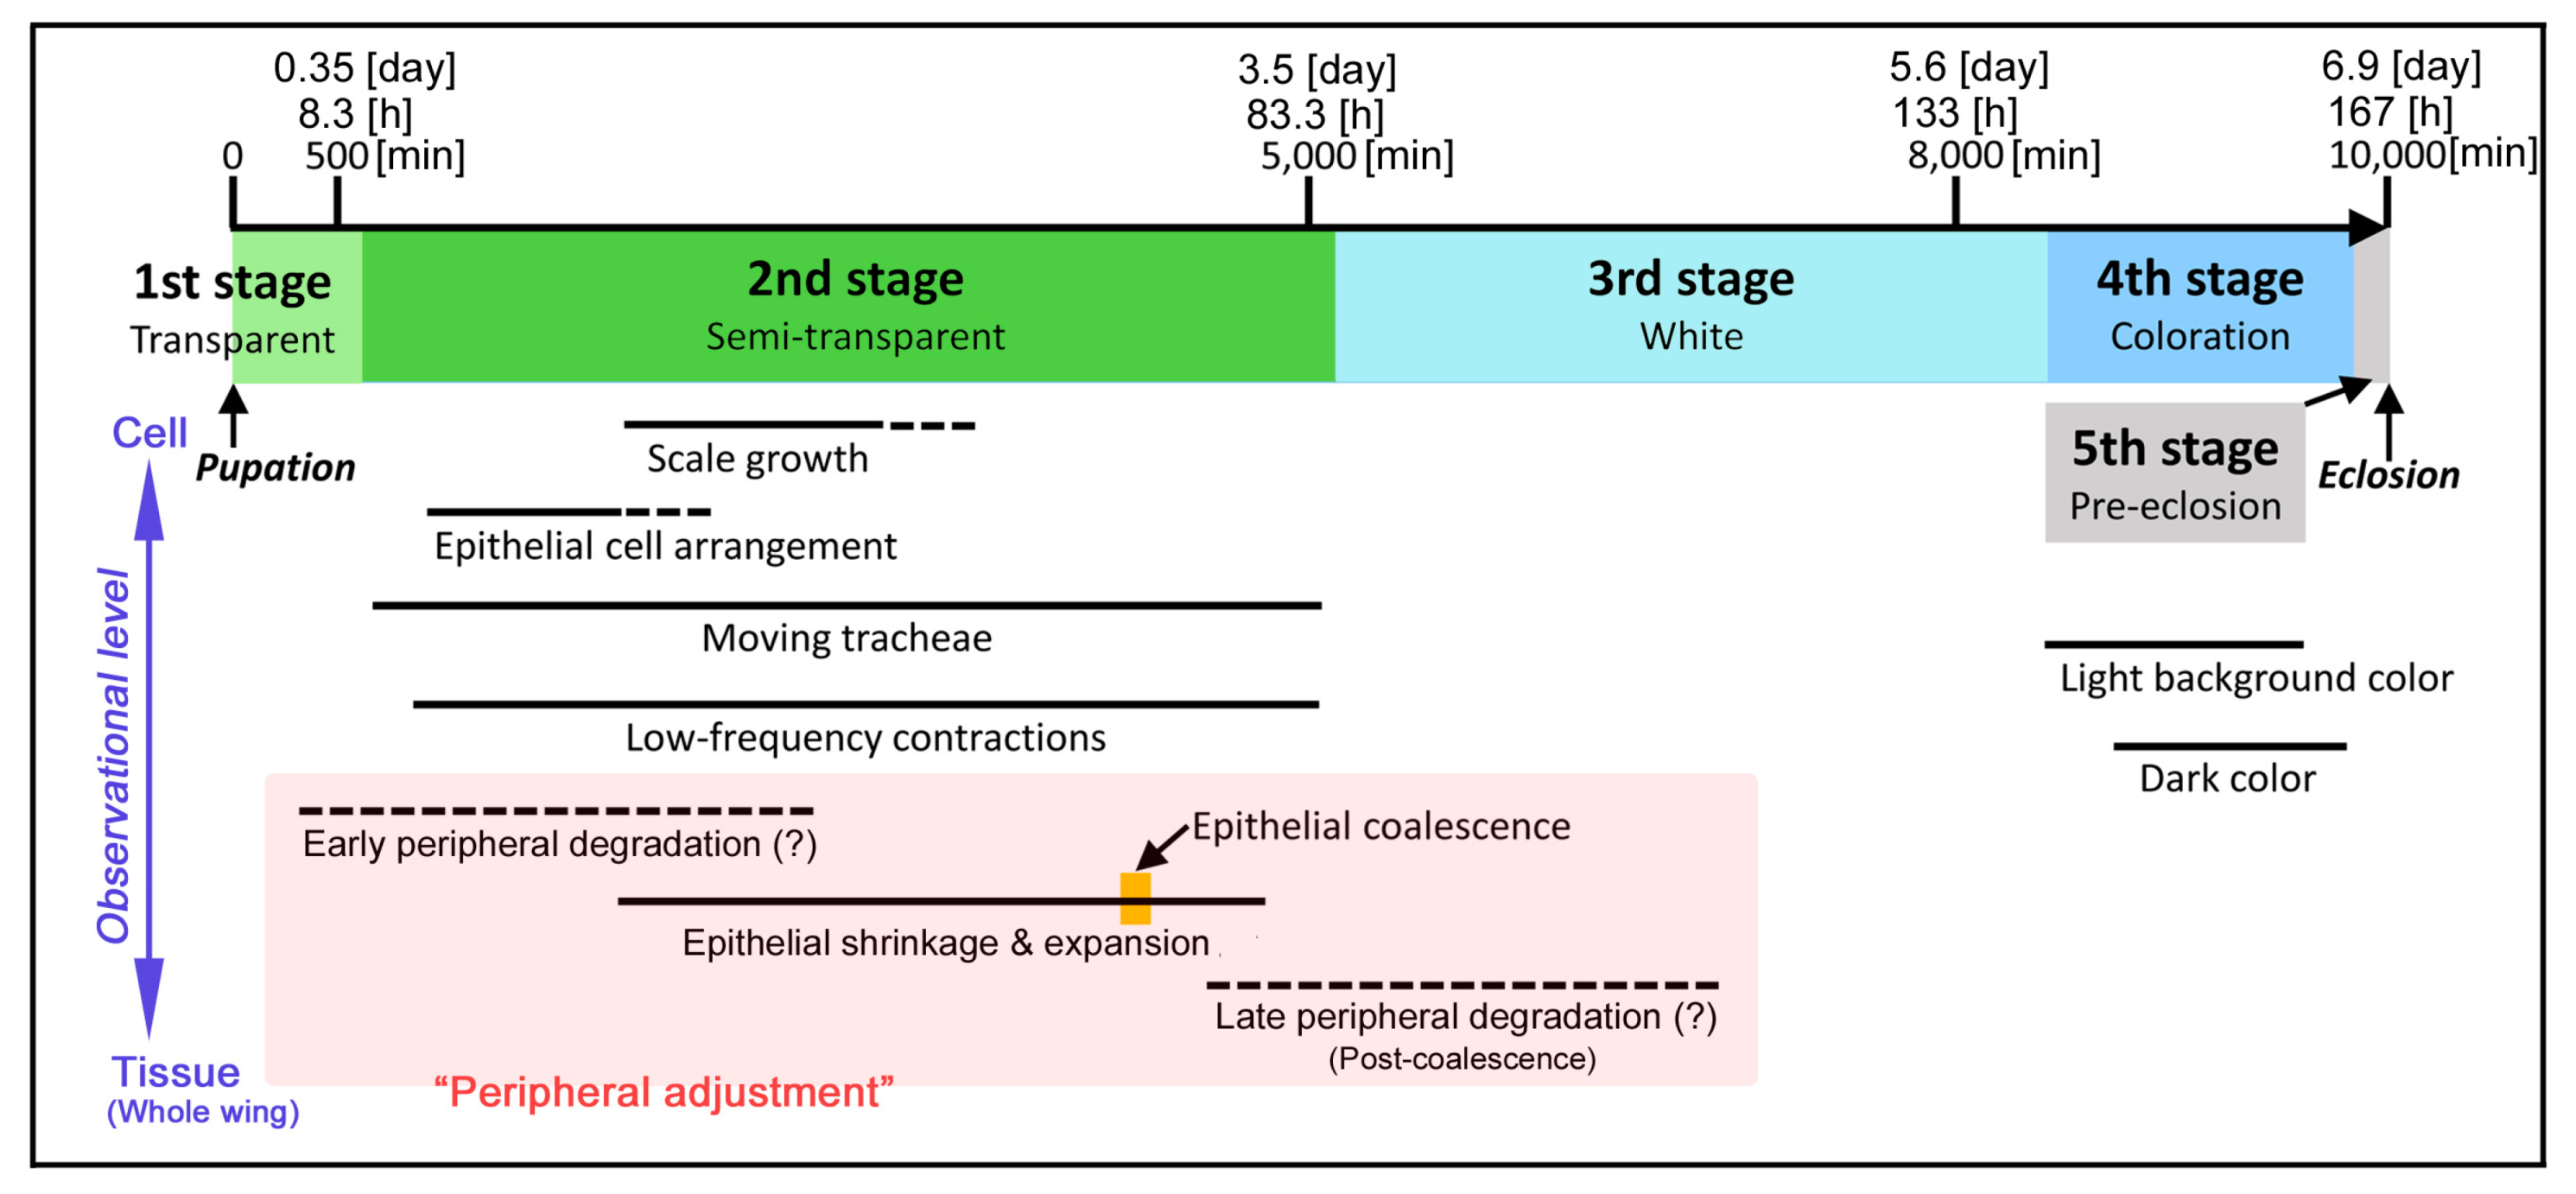
3.1. Whole Wing Dynamics and Peripheral Adjustment
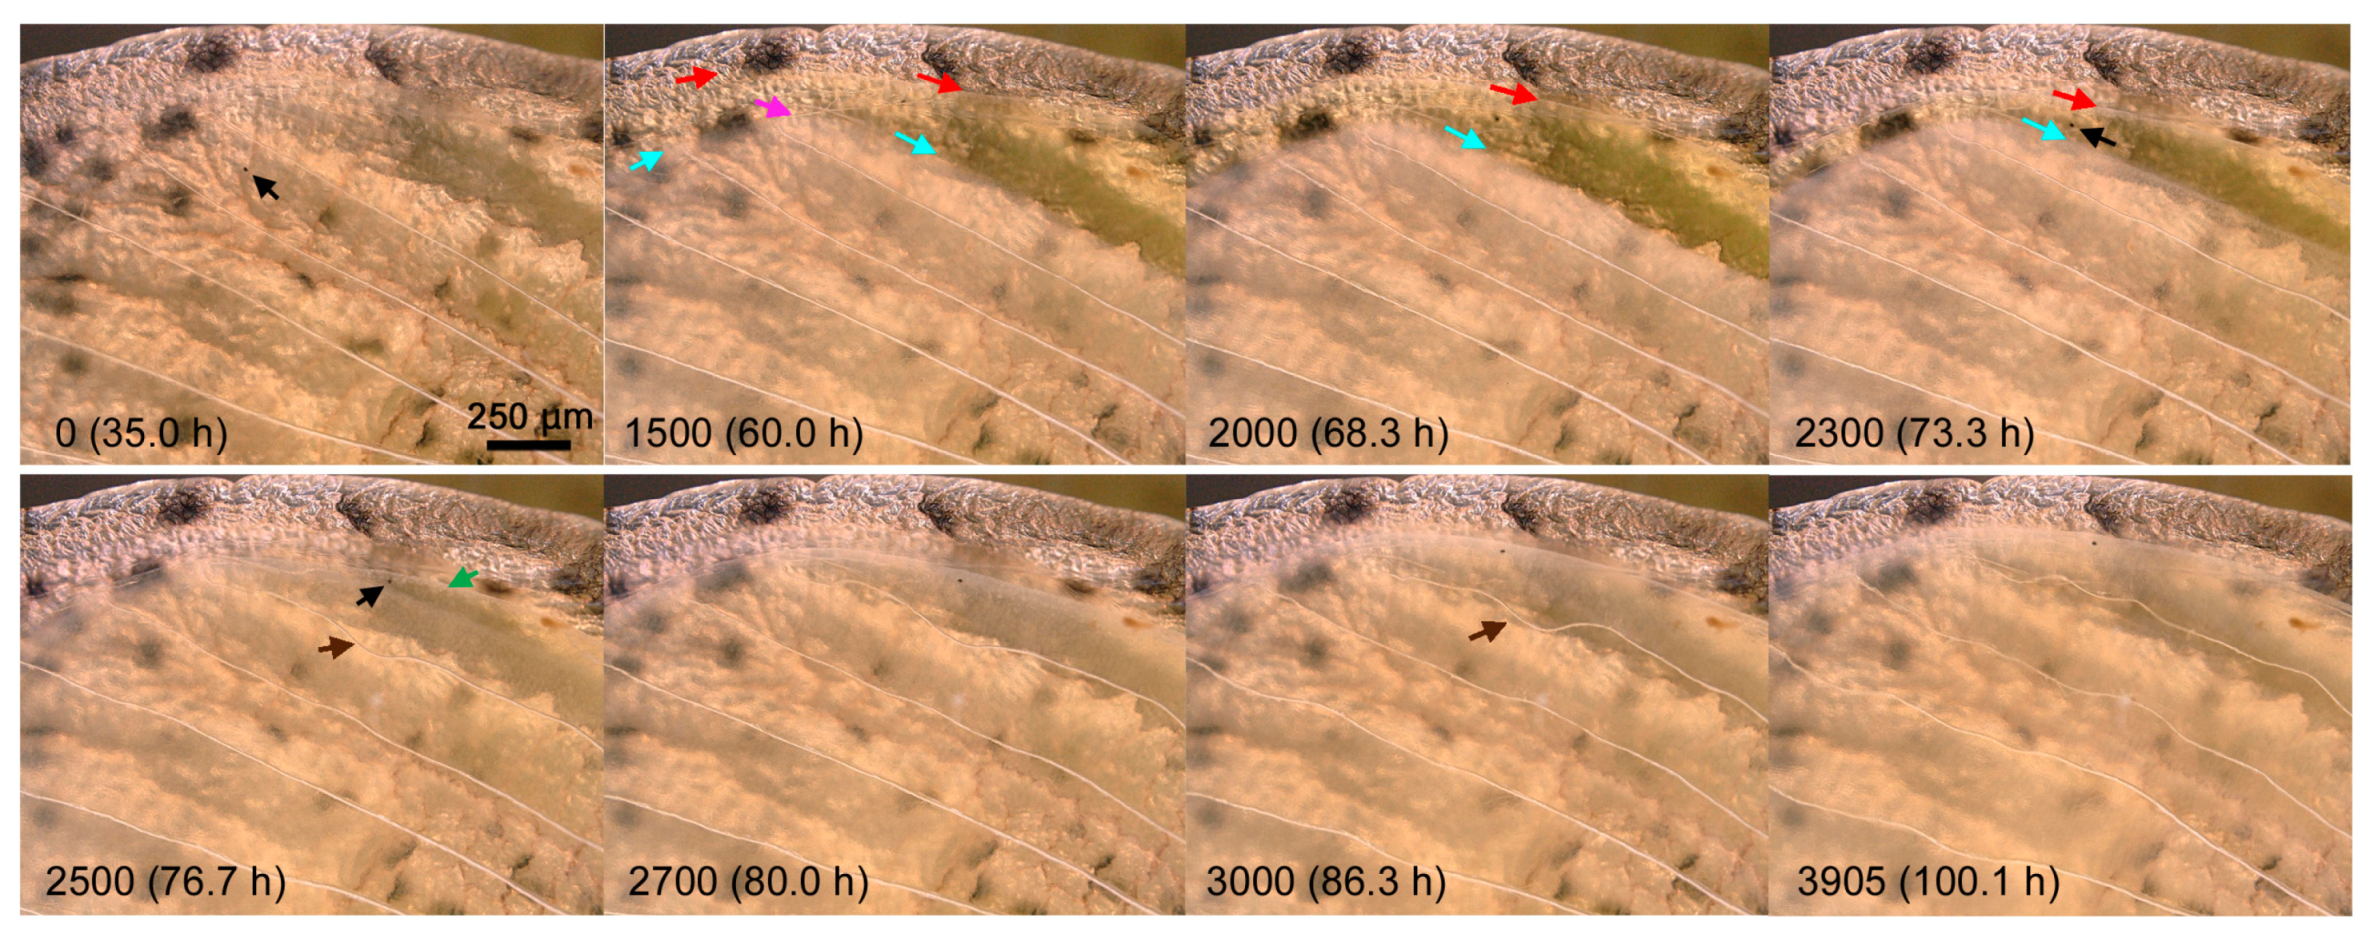
3.2. Compartmental Dynamics and Scale-Bud Evagination
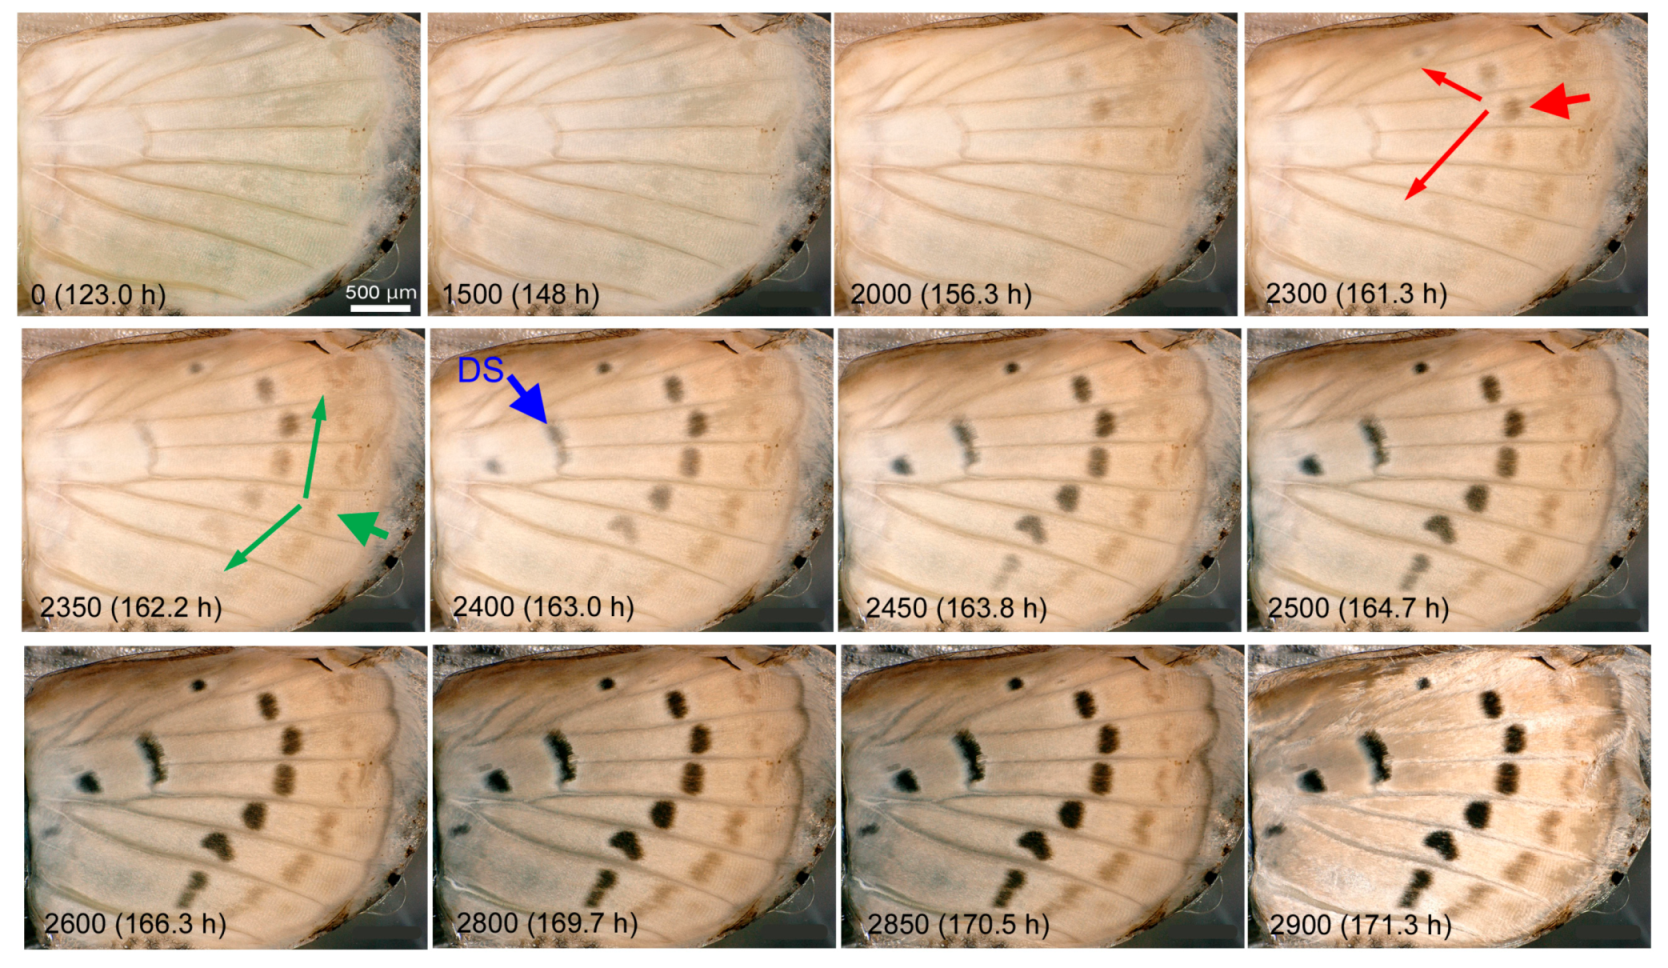
3.3. Coloration Sequence
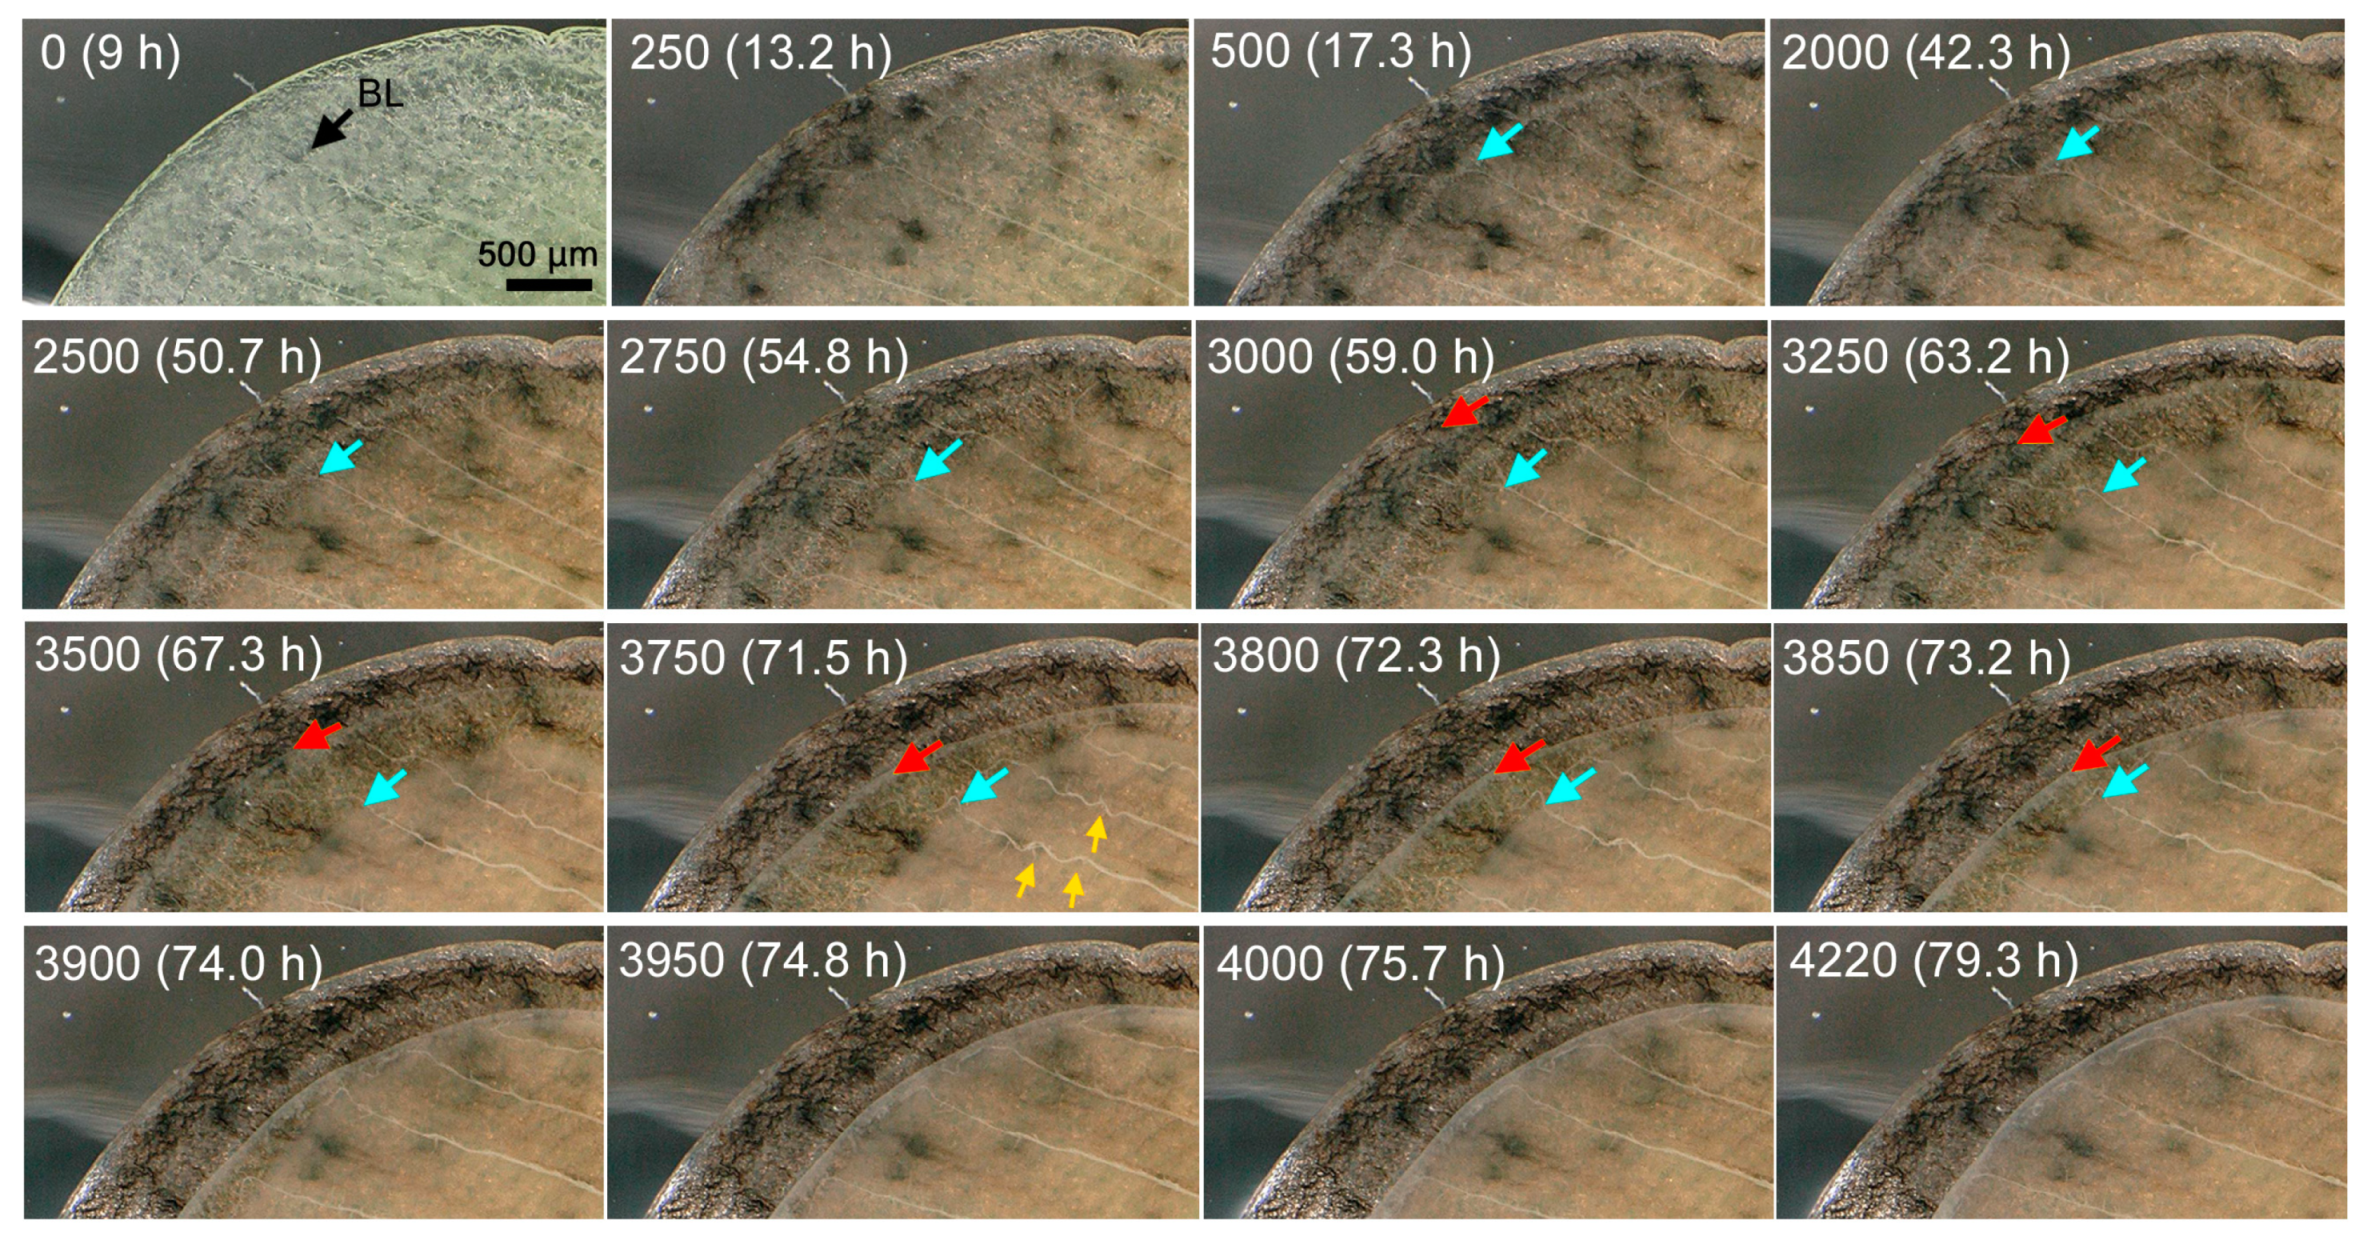
3.4. Cellular Clusters and Dents of the Epithelium
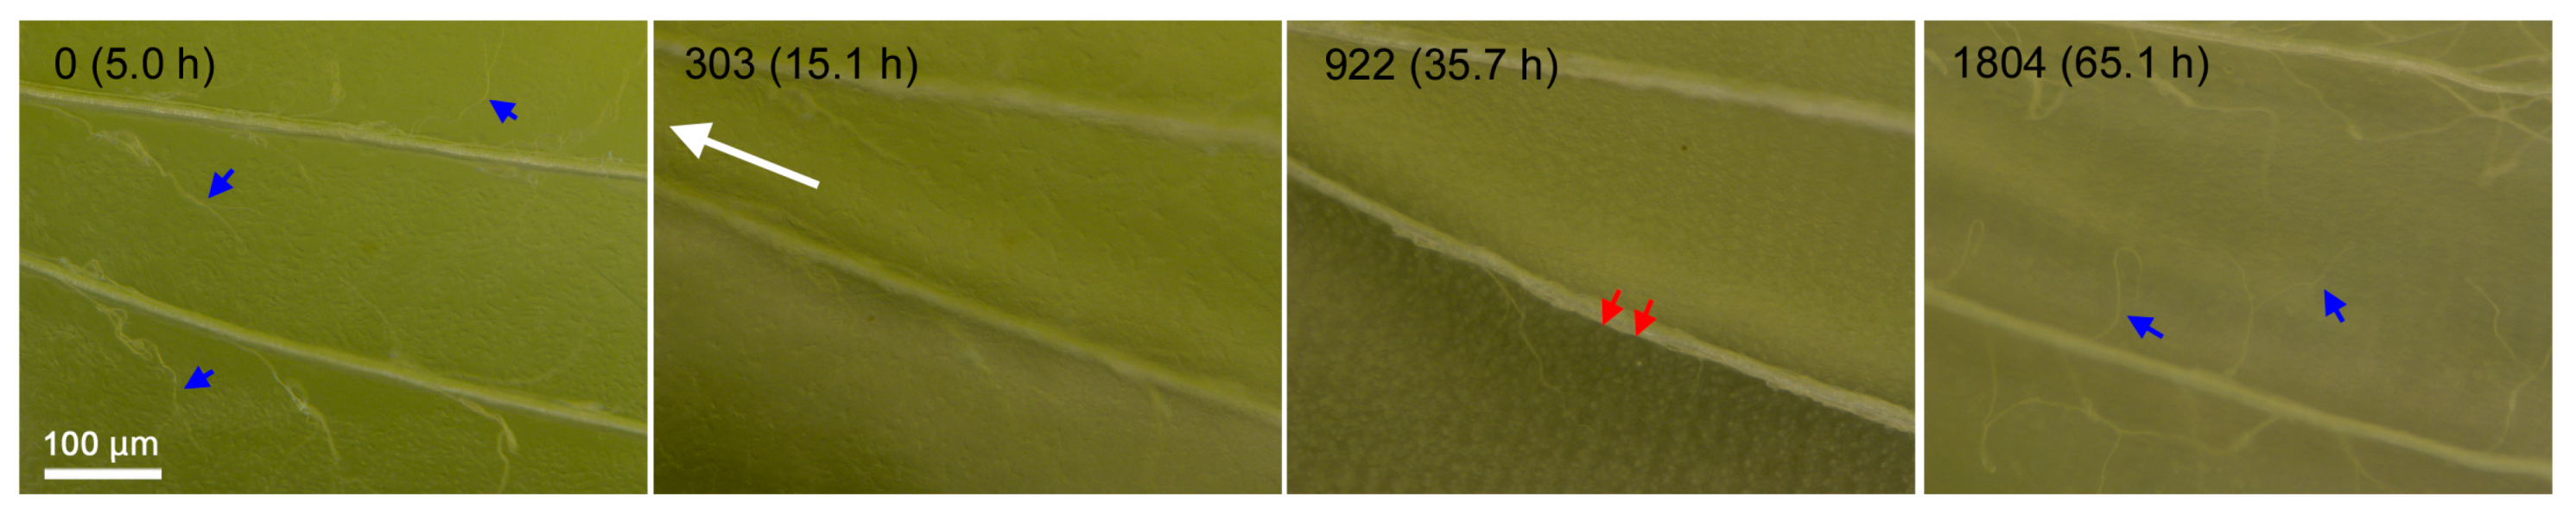
3.5. Cellular Morphology and Distributions of Organelles
4. Discussion
5. Conclusions
Supplementary Materials
Author Contributions
Funding
Acknowledgments
Conflicts of Interest
Appendix A

Appendix B

Appendix C

References
- Spemann, H.M.; Mangold, H. Über Induktion von Embryonalanlagen durch Implantation artfremder Organisatoren. Arch. Mikroskopische Anatomie Entwicklungsmechank 1924, 100, 599–638, (Translated and reprinted in Hamburger, V. Induction of embryonic primordia by implantation of organizers from a different species. Int. J. Dev. Biol. 2001, 45, 13–38). [Google Scholar] [CrossRef]
- Vogt, W. Gestaltungsanalyse am Amphibienkeim mit örtlicher Vitalfärbung. II. Teil Gastrulation und Mesodermbildung bei Urodelen und Anuren. Wilhelm Roux Arch. Entwicklungsmech. Org. 1929, 120, 384–706. [Google Scholar] [CrossRef] [PubMed]
- Fehon, R.G.; Johansen, K.; Rebay, I.; Artavanis-Tsakonas, S. Complex cellular and subcellular regulation of notch expression during embryonic and imaginal development of Drosophila: Implications for notch function. J. Cell Biol. 1991, 113, 657–669. [Google Scholar] [CrossRef]
- Stricker, S.A.; Centonze, V.E.; Paddock, S.W.; Schatten, G. Confocal microscopy of fertilization-induced calcium dynamics in sea urchin eggs. Dev. Biol. 1992, 149, 370–380. [Google Scholar] [CrossRef]
- LaMantia, A.S.; Pomeroy, S.L.; Purves, D. Vital imaging of glomeruli in the mouse olfactory bulb. J. Neurosci. 1992, 12, 976–988. [Google Scholar] [CrossRef] [Green Version]
- Chalfie, M.; Tu, Y.; Euskirchen, G.; Ward, W.W.; Prasher, D.C. Green fluorescent protein as a marker for gene expression. Science 1994, 263, 802–805. [Google Scholar] [CrossRef] [PubMed]
- Affolter, M. Seeing is believing, or how GFP changed my approach to science. Curr. Top. Dev. Biol. 2016, 116, 1–16. [Google Scholar] [PubMed]
- Papaioannou, V.E. Concepts of cell lineage in mammalian embryos. Curr. Top. Dev. Biol. 2016, 117, 195–198. [Google Scholar]
- Lawrence, P.A. The Making of a Fly: The Genetics of Animal Design; Blackwell Scientific Publications: Oxford, UK, 1992; ISBN 0-632-03048-8. [Google Scholar]
- Gilbert, S.F.; Barresi, M.J.F. Developmental Biology, 11th ed.; Sinauer Associates: Sunderland, MA, USA, 2016; ISBN 978-1-60535-470-5. [Google Scholar]
- Nijhout, H.F. The Development and Evolution of Butterfly Wing Patterns; Smithsonian Institution Press: Washington, DC, USA, 1991; ISBN 0-87474-917-4. [Google Scholar]
- Kusaba, K.; Otaki, J.M. Positional dependence of scale size and shape in butterfly wings: Wing-wide phenotypic coordination of color-pattern elements and background. J. Insect Physiol. 2009, 55, 174–182. [Google Scholar] [CrossRef]
- Dhungel, B.; Otaki, J.M. Local pharmacological effects of tungstate on the color-pattern determination of butterfly wings: A possible relationship between the eyespot and parafocal element. Zool. Sci. 2009, 26, 758–764. [Google Scholar] [CrossRef]
- Adhikari, K.; Otaki, J.M. A single-wing removal method to assess correspondence between gene expression and phenotype in butterflies. The case of Distal-less. Zool. Sci. 2016, 33, 13–20. [Google Scholar] [CrossRef] [PubMed]
- Otaki, J.M. Contact-mediated eyespot color-pattern changes in the peacock pansy butterfly: Contributions of mechanical force and extracellular matrix to morphogenic signal propagation. In Lepidoptera; Perveen, F.K., Ed.; InTech: Rijeka, Croatia, 2017; pp. 83–102. ISBN 978-953-51-3659-0. [Google Scholar]
- Iwata, M.; Ohno, Y.; Otaki, J.M. Real-time in vivo imaging of butterfly wing development: Revealing the cellular dynamics of the pupal wing tissue. PLoS ONE 2014, 9, e89500. [Google Scholar] [CrossRef] [PubMed]
- Ohno, Y.; Otaki, J.M. Live cell imaging of butterfly pupal and larval wings in vivo. PLoS ONE 2015, 10, e0128332. [Google Scholar] [CrossRef] [PubMed]
- Ohno, Y.; Otaki, J.M. Spontaneous long-range calcium waves in developing butterfly wings. BMC Dev. Biol. 2015, 15, 17. [Google Scholar] [CrossRef] [PubMed]
- Iwasaki, M.; Ohno, Y.; Otaki, J.M. Butterfly eyespot organiser: In vivo imaging of the prospective focal cells in pupal wing tissues. Sci. Rep. 2017, 7, 40705. [Google Scholar] [CrossRef]
- Iwata, M.; Tsutsumi, M.; Otaki, J.M. Developmental dynamics of butterfly wings: Real-time in vivo whole-wing imaging of twelve butterfly species. Sci. Rep. 2018, 8, 16848. [Google Scholar] [CrossRef]
- Ando, T.; Fujiwara, H. Electroporation-mediated somatic transgenesis for rapid functional analysis in insects. Development 2013, 140, 454–458. [Google Scholar] [CrossRef]
- Nishikawa, H.; Iijima, T.; Kajitani, R.; Yamaguchi, J.; Ando, T.; Suzuki, Y.; Sugano, S.; Fujiyama, A.; Kosugi, S.; Hirakawa, H.; et al. A genetic mechanism for female-limited Batesian mimicry in Papilio butterfly. Nat. Genet. 2015, 47, 405–409. [Google Scholar] [CrossRef]
- Nardi, J.B.; Magee-Adams, S.M. Formation of scale spacing patterns in a moth wing. I. Epithelial feet may mediate cell rearrangement. Dev. Biol. 1986, 116, 278–290. [Google Scholar] [CrossRef]
- Iwata, M.; Hiyama, A.; Otaki, J.M. System-dependent regulations of colour-pattern development: A mutagenesis study of the pale grass blue butterfly. Sci. Rep. 2013, 3, 2379. [Google Scholar] [CrossRef]
- Iwata, M.; Taira, W.; Hiyama, A.; Otaki, J.M. The lycaenid central symmetry system: Color pattern analysis of the pale grass blue butterfly Zizeeria maha. Zool. Sci. 2015, 32, 233–239. [Google Scholar] [CrossRef]
- Nijhout, H.F. Elements of butterfly wing patterns. J. Exp. Zool. 2001, 291, 213–225. [Google Scholar] [CrossRef]
- Otaki, J.M. Color pattern analysis of nymphalid butterfly wings: Revision of the nymphalid groundplan. Zool. Sci. 2012, 29, 568–576. [Google Scholar] [CrossRef]
- Hiyama, A.; Iwata, M.; Otaki, J.M. Rearing the pale grass blue Zizeeria maha (Lepidoptera, Lycaenidae): Toward the establishment of a lycaenid model system for butterfly physiology and genetics. Entomol. Sci. 2010, 13, 293–301. [Google Scholar] [CrossRef]
- Otaki, J.M.; Hiyama, A.; Iwata, M.; Kudo, T. Phenotypic plasticity in the range-margin population of the lycaenid butterfly Zizeeria maha. BMC Evol. Biol. 2010, 10, 252. [Google Scholar] [CrossRef] [PubMed]
- Hiyama, A.; Taira, W.; Otaki, J.M. Color-pattern evolution in response to environmental stress in butterflies. Front. Genet. 2012, 3, 15. [Google Scholar] [CrossRef]
- Hiyama, A.; Nohara, C.; Kinjo, S.; Taira, W.; Gima, S.; Tanahara, A.; Otaki, J.M. The biological impacts of the Fukushima nuclear accident on the pale grass blue butterfly. Sci. Rep. 2012, 2, 570. [Google Scholar] [CrossRef] [PubMed]
- Hiyama, A.; Taira, W.; Sakauchi, K.; Otaki, J.M. Sampling efficiency of the pale grass blue butterfly Zizeeria maha (Lepidoptera: Lycaenidae): A versatile indicator species for environmental risk assessment in Japan. J. Asia-Pacific Entomol. 2018, 21, 609–615. [Google Scholar] [CrossRef]
- Otaki, J.M.; Taira, W. Current status of the blue butterfly in Fukushima research. J. Hered. 2018, 109, 178–187. [Google Scholar] [CrossRef]
- Otaki, J.M. Understanding low-dose exposure and field effects to resolve the field-laboratory paradox: Multifaceted biological effects from the Fukushima nuclear accident. In New Trends in Nuclear Science; Awwad, N.S., AlFaify, S.A., Eds.; IntechOpen: London, UK, 2018; pp. 49–71. ISBN 978-1-78984-656-0. [Google Scholar]
- Schneider, C.A.; Rasband, W.S.; Eliceiri, K.W. NIH Image to ImageJ: 25 years of image analysis. Nat. Methods 2012, 9, 671–675. [Google Scholar] [CrossRef] [Green Version]
- Süffert, F. Die Ausbildung des imaginalen Flügelschnittes in der Schmetterlingspuppe. Z. Morphol. Öekol. Tiere 1929, 14, 338–359. [Google Scholar] [CrossRef]
- Dohrmann, C.; Nijhout, H.F. Development of the wing margin in Precis coenia (Lepidoptera: Nymphalidae). J. Res. Lepid. 1988, 27, 151–159. [Google Scholar]
- Kodama, R.; Yoshida, A.; Mitsui, T. Programmed cell-death at the periphery of the pupal wing of the butterfly, Pieris rapae. Roux’s Arch. Dev. Biol. 1995, 204, 418–426. [Google Scholar] [CrossRef] [PubMed]
- Fujiwara, H.; Ogai, S. Ecdysteroid-induced programmed cell death and cell proliferation during pupal wing development of the silkworm, Bombyx mori. Dev. Gene Evol. 2001, 211, 118–123. [Google Scholar] [CrossRef]
- Macdonald, W.P.; Martin, A.; Reed, R.D. Butterfly wings shaped by a molecular cookie cutter: evolutionary radiation of lepidopteran wing shapes associated with a derived Cut/wingless wing margin boundary system. Evol. Dev. 2010, 12, 296–304. [Google Scholar] [CrossRef]
- Nijhout, H.F.; McKenna, K.Z. Wing morphogenesis in Lepidoptera. Prog. Biophys. Mol. Biol. 2018, 137, 88–94. [Google Scholar] [CrossRef]
- Nardi, J.B.; Norby, S.W. Evocation of venation pattern in the wing of a moth, Manduca sexta. J. Morphol. 1987, 193, 53–62. [Google Scholar] [CrossRef]
- Nardi, J.B.; Ujhelyi, E. Transformations of epithelial monolayers during wing development of Manduca sexta. Arthropod Struct. Dev. 2001, 30, 145–157. [Google Scholar] [CrossRef]
- Otaki, J.M.; Ogasawara, T.; Yamamoto, H. Morphological comparison of pupal wing cuticle patterns in butterflies. Zool. Sci. 2005, 22, 21–34. [Google Scholar] [CrossRef] [PubMed]
- Taira, W.; Otaki, J.M. Butterfly wings are three-dimensional: Pupal cuticle focal spots and their associated structures in Junonia butterflies. PLoS ONE 2016, 11, e0146348. [Google Scholar] [CrossRef]
- Taira, W.; Kinjo, S.; Otaki, J.M. The marginal band system in nymphalid butterfly wings. Zool. Sci. 2015, 32, 38–46. [Google Scholar] [CrossRef] [PubMed]
- Otaki, J.M. Self-similarity, distortion waves, and the essence of morphogenesis: A generalized view of color pattern formation in butterfly wings. In Diversity and Evolution of Butterfly Wing Patterns: An Integrated Approach; Sekimura, T., Nijhout, H.F., Eds.; Springer: Singapore, 2017; pp. 119–152. ISBN 978-981-10-4955-2. [Google Scholar]
- Otaki, J.M. Long-range effects of wing physical damage and distortion on eyespot color patterns in the hindwing of the blue pansy butterfly Junonia orithya. Insects 2018, 9, 195. [Google Scholar] [CrossRef] [PubMed]
- Otaki, J.M. Color-pattern analysis of eyespots in butterfly wings: A critical examination of morphogen gradient models. Zool. Sci. 2011, 28, 403–413. [Google Scholar] [CrossRef] [PubMed]
- Otaki, J.M. Generation of butterfly wing eyespot patterns: A model for morphological determination of eyespot and parafocal element. Zool. Sci. 2011, 28, 817–827. [Google Scholar] [CrossRef] [PubMed]
- Otaki, J.M. Artificially induced changes of butterfly wing colour patterns: Dynamic signal interactions in eyespot development. Sci. Rep. 2011, 1, 111. [Google Scholar] [CrossRef]
- Otaki, J.M. Structural analysis of eyespots: Dynamics of morphogenic signals that govern elemental positions in butterfly wings. BMC Syst. Biol. 2012, 6, 17. [Google Scholar] [CrossRef]
- Iwata, M.; Otaki, J.M. Insights into eyespot color-pattern formation mechanisms from color gradients, boundary scales, and rudimentary eyespots in butterfly wings. J. Insect Physiol. 2019, 114, 68–82. [Google Scholar] [CrossRef] [PubMed]
- Dhungel, B.; Ohno, Y.; Matayoshi, R.; Otaki, J.M. Baculovirus-mediated gene transfer in butterfly wings in vivo: An efficient expression system with an anti-gp64 antibody. BMC Biotechnol. 2013, 13, 27. [Google Scholar] [CrossRef]
- Dhungel, B.; Ohno, Y.; Matayoshi, R.; Iwasaki, M.; Taira, W.; Adhikari, K.; Otaki, J.M. Distal-less induces Elemental color patterns in Junonia butterfly wings. Zool. Lett. 2016, 2, 4. [Google Scholar] [CrossRef]


© 2019 by the authors. Licensee MDPI, Basel, Switzerland. This article is an open access article distributed under the terms and conditions of the Creative Commons Attribution (CC BY) license (http://creativecommons.org/licenses/by/4.0/).
Share and Cite
Hirata, K.; Otaki, J.M. Real-Time In Vivo Imaging of the Developing Pupal Wing Tissues in the Pale Grass Blue Butterfly Zizeeria maha: Establishing the Lycaenid System for Multiscale Bioimaging. J. Imaging 2019, 5, 42. https://0-doi-org.brum.beds.ac.uk/10.3390/jimaging5040042
Hirata K, Otaki JM. Real-Time In Vivo Imaging of the Developing Pupal Wing Tissues in the Pale Grass Blue Butterfly Zizeeria maha: Establishing the Lycaenid System for Multiscale Bioimaging. Journal of Imaging. 2019; 5(4):42. https://0-doi-org.brum.beds.ac.uk/10.3390/jimaging5040042
Chicago/Turabian StyleHirata, Kanako, and Joji M. Otaki. 2019. "Real-Time In Vivo Imaging of the Developing Pupal Wing Tissues in the Pale Grass Blue Butterfly Zizeeria maha: Establishing the Lycaenid System for Multiscale Bioimaging" Journal of Imaging 5, no. 4: 42. https://0-doi-org.brum.beds.ac.uk/10.3390/jimaging5040042