
Automated Detection and Diagnosis of Diabetic Retinopathy: A Comprehensive Survey

 ,
,
Abstract
:1. Introduction
- No Apparent Retinopathy: No abnormalities.
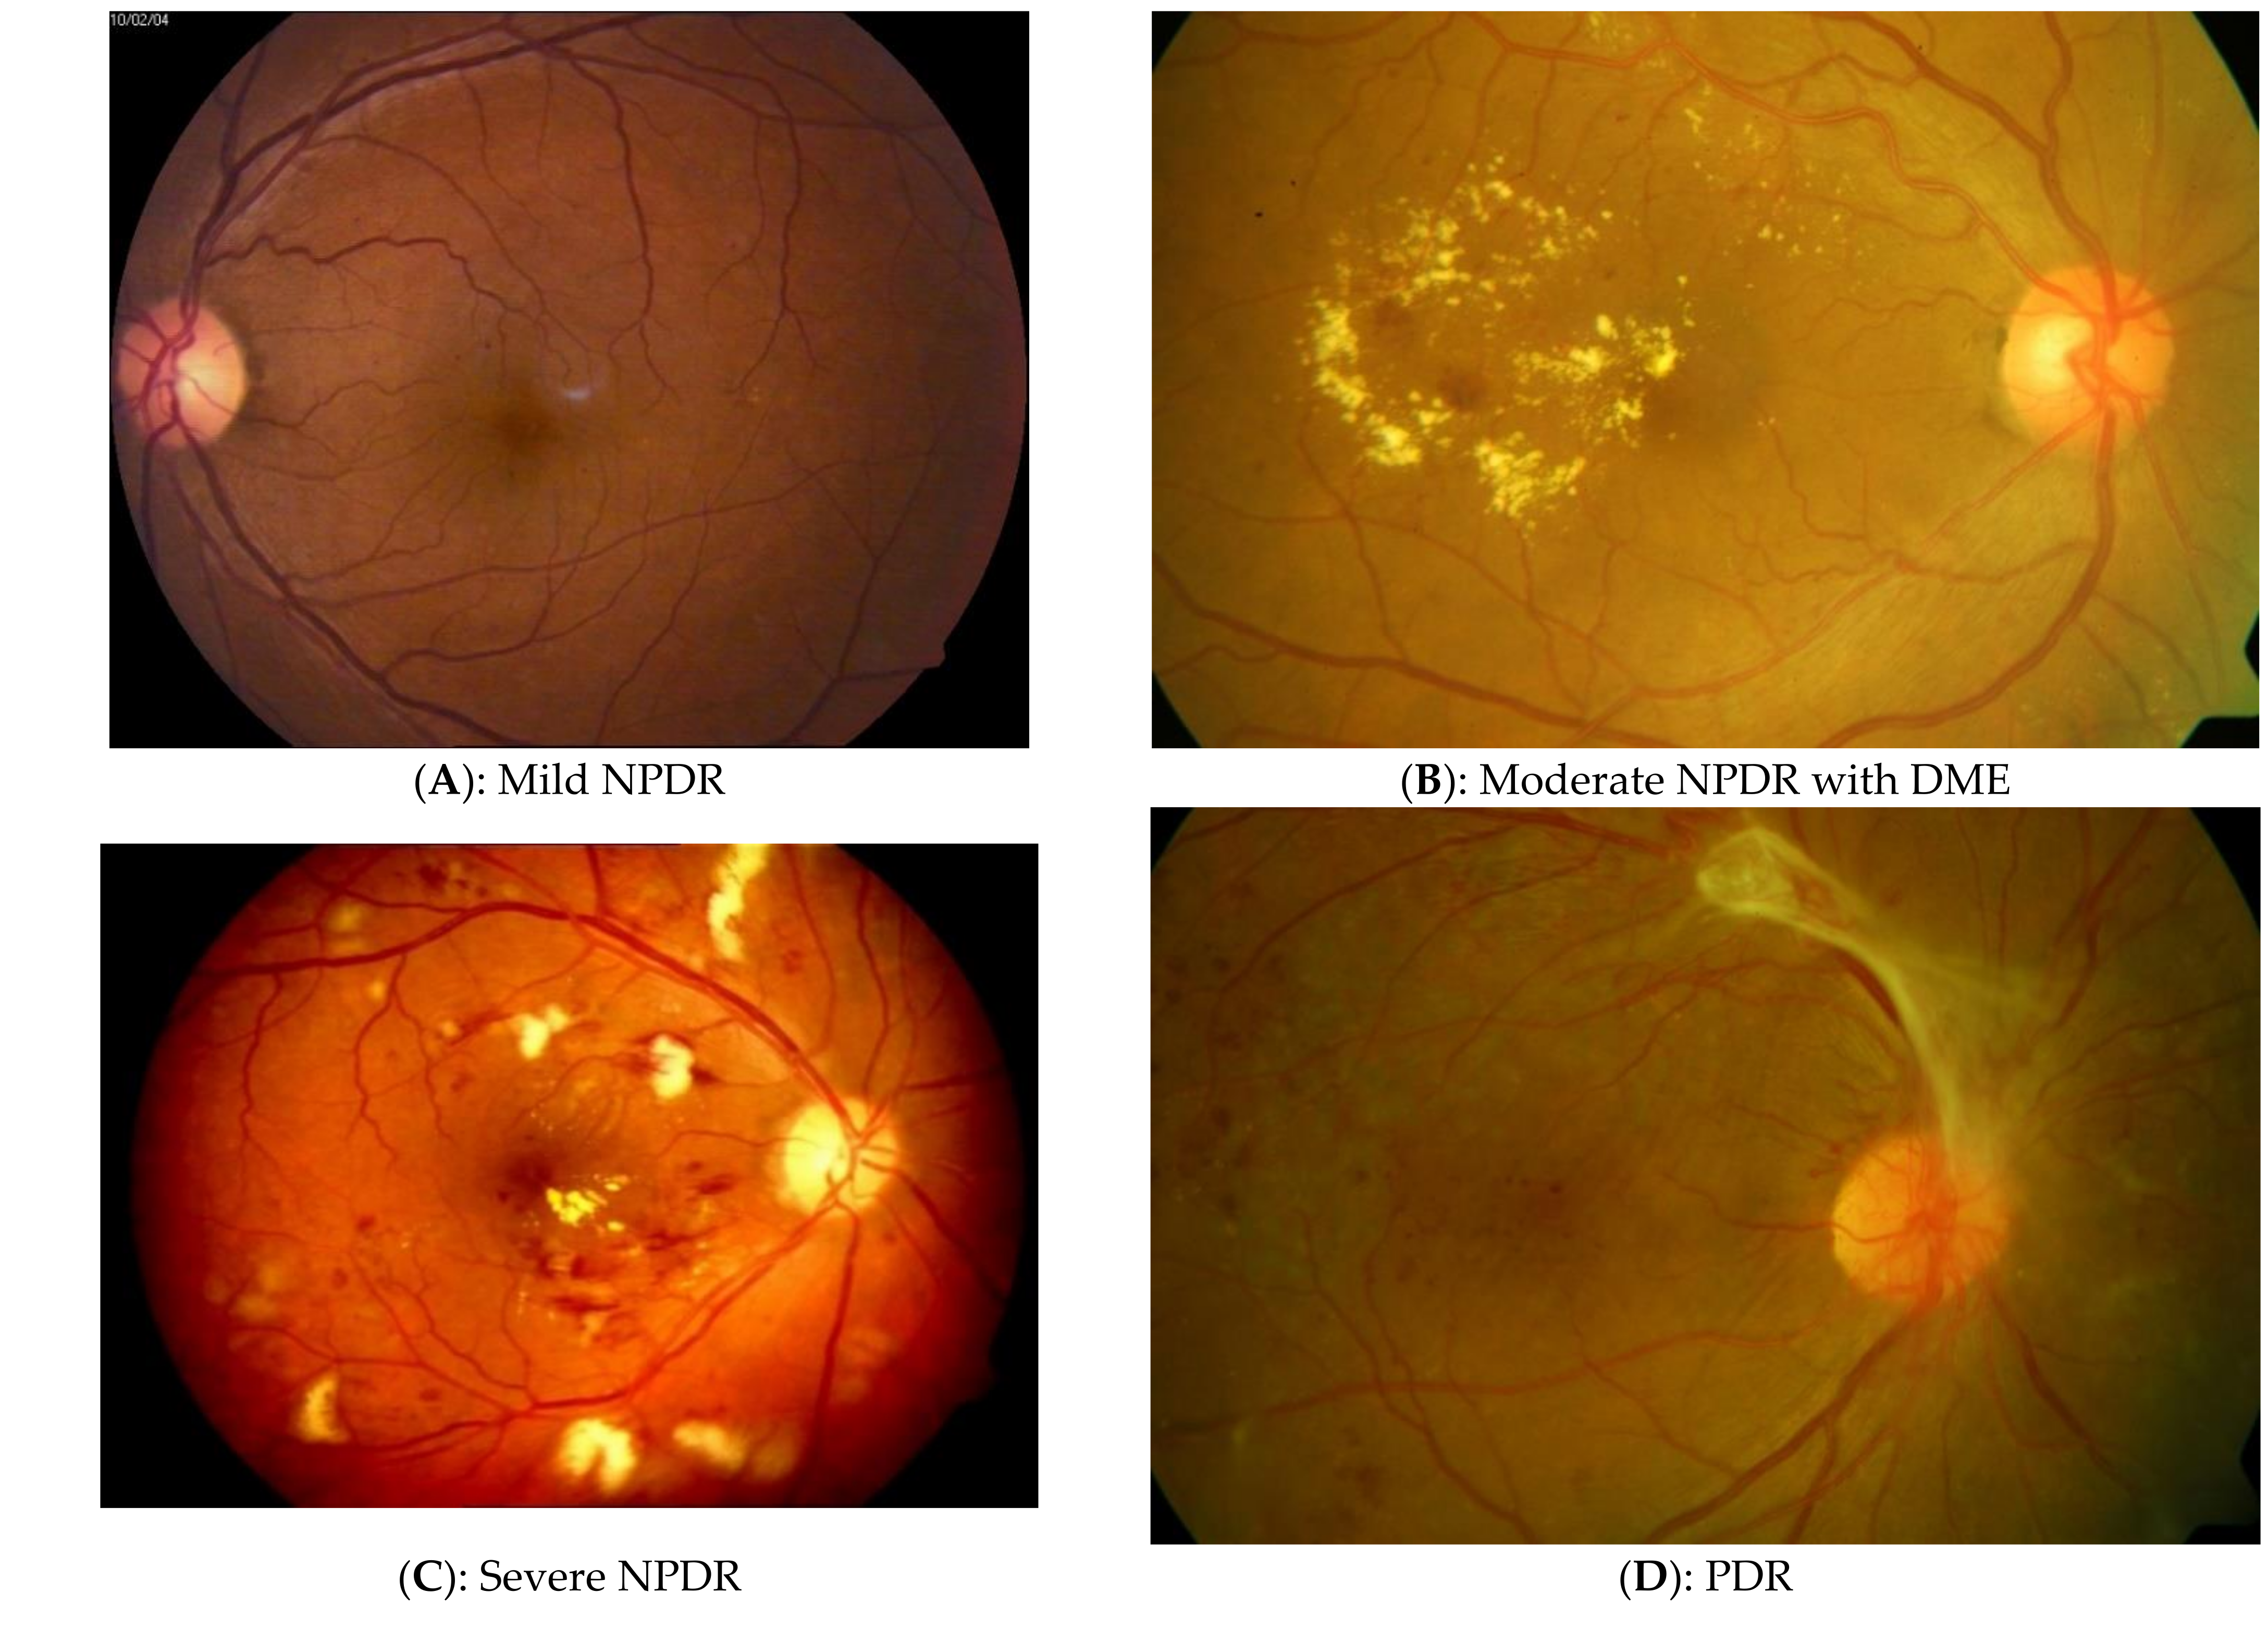
- Mild Non-Proliferative Diabetic Retinopathy (NPDR): This is the first stage of diabetic retinopathy, specifically characterized by tiny areas of swelling in retinal blood vessels known as Microaneurysms (MA) [8]. There is an absence of profuse bleeding in retinal nerves and if DR is detected at this stage, it can help save the patient’s eyesight with proper medical treatment (Figure 1A).
- Moderate NPDR: When left unchecked, mild NPDR progresses to a moderate stage when there is blood leakage from the blocked retinal vessels. Additionally, at this stage, Hard Exudates (Ex) may exist (Figure 1B). Furthermore, the dilation and constriction of venules in the retina causes Venous Beadings (VB) which are visible ophthalmospically [8].
- Severe NPDR: A larger number of retinal blood vessels are blocked in this stage, causing over 20 Intra-retinal Hemorrhages (IHE; Figure 1C) in all 4 fundus quadrants or there are Intra-Retinal Microvascular Abnormalities (IRMA) which can be seen as bulges of thin vessels. IRMA appears as small and sharp-border red spots in at least one quadran. Furthermore, there can be a definite evidence of VB in over 2 quadrants [8].
- Proliferative Diabetic Retinopathy (PDR): This is an advanced stage of the disease that occurs when the condition is left unchecked for an extended period of time. New blood vessels form in the retina and the condition is termed Neovascularization (NV). These blood vessels are often fragile, with a consequent risk of fluid leakage and proliferation of fibrous tissue [8]. Different functional visual problems occur at PDR, such as blurriness, reduced field of vision, and even complete blindness in some cases (Figure 1D).
2. Methods
2.1. Literature Search Details
- PubMed: Publications from MEDLINE (https://pubmed.ncbi.nlm.nih.gov/ accessed on date 14 June 2021)
- IEEE Xplore: IEEE conference & journals (https://0-ieeexplore-ieee-org.brum.beds.ac.uk/Xplore/home.jsp accessed on 14 June 2021)
- PUBLONS: Publications from Web of Science (https://publons.com/about/home/ accessed on 14 June 2021)
- SPIE digital library: Conference & journals from SPIE (https://www.spiedigitallibrary.org/ accessed on 14 June 2021)
- Google Scholar: Conference and journal proceedings from multiple databases (https://scholar.google.co.in/ accessed on 14 June 2021).
- Using the predefined set of keywords and logical operators, a small set of papers were identified in this time range (2016–2021).
- Using a manual search strategy, the papers falling outside the scope of this review were eliminated.
- The duplicate articles (i.e., the papers occurring in multiple databases) were eliminated to obtain the set of unique articles.
2.2. Dataset Search Details
- 4.
- The original papers and websites associated with each dataset were analyzed and a systematic, tabular representation of all available information was created.
- 5.
- The Google dataset search and different forums were checked for missing dataset entries and step 2 was repeated for all original datasets found.
- 6.
- A final comprehensive list of datasets and its details was generated and represented in Table 1.
3. Results
3.1. Dataset Search Results
- Public open access (OA) datasets with high quality DR grades.
- DR datasets, that can be accessed upon request, i.e., can be accessed by filling necessary agreements and forms for fair usage; they are a sub-type of (OA) databases and are termed Access Upon Request (AUR) in the table.
- Private datasets from different institutions that are not publicly accessible or require explicit permission can access are termed Not Open Access (NOA).
3.2. Diabetic Retinopathy Classification
3.2.1. Machine Learning Approaches
3.2.2. Deep Learning Approaches
3.3. Diabetic Retinopathy Lesion Segmentation
3.3.1. Machine Learning and Un-Machine Learning Approaches
3.3.2. Deep Learning Approaches
4. Conclusions
Author Contributions
Funding
Institutional Review Board Statement
Informed Consent Statement
Data Availability Statement
Acknowledgments
Conflicts of Interest
References
- Steinmetz, J.D.; A Bourne, R.R.; Briant, P.S.; Flaxman, S.R.; Taylor, H.R.B.; Jonas, J.B.; Abdoli, A.A.; Abrha, W.A.; Abualhasan, A.; Abu-Gharbieh, E.G.; et al. Causes of blindness and vision impairment in 2020 and trends over 30 years, and prevalence of avoidable blindness in relation to VISION 2020: The Right to Sight: An analysis for the Global Burden of Disease Study. Lancet Glob. Health 2021, 9, e144–e160. [Google Scholar] [CrossRef]
- Oh, K.; Kang, H.M.; Leem, D.; Lee, H.; Seo, K.Y.; Yoon, S. Early detection of diabetic retinopathy based on deep learning and ultra-wide-field fundus images. Sci. Rep. 2021, 11, 1897. [Google Scholar] [CrossRef] [PubMed]
- Early Treatment Diabetic Retinopathy Study Research Group. Grading Diabetic Retinopathy from Stereoscopic Color Fundus Photographs-An Extension of the Modified Airlie House Classification: ETDRS Report Number 10. Ophthalmology 1991, 98, 786–806. [Google Scholar] [CrossRef]
- Horton, M.B.; Brady, C.J.; Cavallerano, J.; Abramoff, M.; Barker, G.; Chiang, M.F.; Crockett, C.H.; Garg, S.; Karth, P.; Liu, Y.; et al. Practice Guidelines for Ocular Telehealth-Diabetic Retinopathy, Third Edition. Telemed. E-Health 2020, 26, 495–543. [Google Scholar] [CrossRef] [PubMed]
- Solomon, S.D.; Goldberg, M.F. ETDRS Grading of Diabetic Retinopathy: Still the Gold Standard? Ophthalmic Res. 2019, 62, 190–195. [Google Scholar] [CrossRef] [PubMed]
- Wilkinson, C.; Ferris, F.; Klein, R.; Lee, P.; Agardh, C.D.; Davis, M.; Dills, D.; Kampik, A.; Pararajasegaram, R.; Verdaguer, J.T. Proposed international clinical diabetic retinopathy and diabetic macular edema disease severity scales. Ophthalmology 2003, 110, 1677–1682. [Google Scholar] [CrossRef]
- Rajalakshmi, R.; Prathiba, V.; Arulmalar, S.; Usha, M. Review of retinal cameras for global coverage of diabetic retinopathy screening. Eye 2021, 35, 162–172. [Google Scholar] [CrossRef]
- Qureshi, I.; Ma, J.; Abbas, Q. Recent Development on Detection Methods for the Diagnosis of Diabetic Retinopathy. Symmetry 2019, 11, 749. [Google Scholar] [CrossRef] [Green Version]
- Chandran, A.; Mathai, A. Diabetic Retinopathy for the Clinician; Jaypee Brothers: Chennai, India, 2009; Volume 1, p. 79. [Google Scholar]
- Ludwig, C.A.; Perera, C.; Myung, D.; Greven, M.A.; Smith, S.J.; Chang, R.T.; Leng, T. Automatic Identification of Referral-Warranted Diabetic Retinopathy Using Deep Learning on Mobile Phone Images. Transl. Vis. Sci. Technol. 2020, 9, 60. [Google Scholar] [CrossRef]
- Hsu, W.; Pallawala, P.M.D.S.; Lee, M.L.; Eong, K.-G.A. The role of domain knowledge in the detection of retinal hard exudates. In Proceedings of the 2001 IEEE Computer Society Conference on Computer Vision and Pattern Recognition. CVPR 2001, Kauai, HI, USA, 8–14 December 2001; Volume 2. [Google Scholar]
- Teo, Z.L.; Tham, Y.-C.; Yu, M.C.Y.; Chee, M.L.; Rim, T.H.; Cheung, N.; Bikbov, M.M.; Wang, Y.X.; Tang, Y.; Lu, Y.; et al. Global Prevalence of Diabetic Retinopathy and Projection of Burden through 2045. Ophthalmology 2021. [Google Scholar] [CrossRef]
- Derwin, D.J.; Selvi, S.T.; Singh, O.J.; Shan, P.B. A novel automated system of discriminating Microaneurysms in fundus images. Biomed. Signal Process. Control 2020, 58, 101839. [Google Scholar] [CrossRef]
- Sivaprasad, S.; Raman, R.; Conroy, D.; Wittenberg, R.; Rajalakshmi, R.; Majeed, A.; Krishnakumar, S.; Prevost, T.; Parameswaran, S.; Turowski, P.; et al. The ORNATE India Project: United Kingdom–India Research Collaboration to tackle visual impairment due to diabetic retinopathy. Eye 2020, 34, 1279–1286. [Google Scholar] [CrossRef] [PubMed]
- Majumder, S.; Elloumi, Y.; Akil, M.; Kachouri, R.; Kehtarnavaz, N. A deep learning-based smartphone app for real-time detection of five stages of diabetic retinopathy. In Real-Time Image Processing and Deep Learning; International Society for Optics and Photonics: Bellingham, WA, USA, 2020; Volume 11401, p. 1140106. [Google Scholar] [CrossRef]
- Bilal, A.; Sun, G.; Li, Y.; Mazhar, S.; Khan, A.Q. Diabetic Retinopathy Detection and Classification Using Mixed Models for a Disease Grading Database. IEEE Access 2021, 9, 23544–23553. [Google Scholar] [CrossRef]
- Qian, X.; Kang, H.; Li, R.; Lu, G.; Du, Z.; Shung, K.K.; Humayun, M.S.; Zhou, Q. In Vivo Visualization of Eye Vasculature Using Super-Resolution Ultrasound Microvessel Imaging. IEEE Trans. Biomed. Eng. 2020, 67, 2870–2880. [Google Scholar] [CrossRef]
- Ouahabi, A.; Taleb-Ahmed, A. Deep learning for real-time semantic segmentation: Application in ultrasound imaging. Pattern Recognit. Lett. 2021, 144, 27–34. [Google Scholar] [CrossRef]
- Leopold, H.; Zelek, J.; Lakshminarayanan, V. Deep Learning Methods Applied to Retinal Image Analysis in Signal Processing and Machine Learning for Biomedical Big Data. Sejdic, E., Falk, T., Eds.; CRC Press: Boca Raton, FL, USA, 2018; p. 329. [Google Scholar] [CrossRef]
- Sengupta, S.; Singh, A.; Leopold, H.A.; Gulati, T.; Lakshminarayanan, V. Ophthalmic diagnosis using deep learning with fundus images—A critical review. Artif. Intell. Med. 2020, 102, 101758. [Google Scholar] [CrossRef] [PubMed]
- Leopold, H.; Sengupta, S.; Singh, A.; Lakshminarayanan, V. Deep Learning on Optical Coherence Tomography for Ophthalmology. In State-of-the-Art in Neural Networks; Elsevier: New York, NY, USA, 2021. [Google Scholar]
- Hormel, T.T.; Hwang, T.S.; Bailey, S.T.; Wilson, D.J.; Huang, D.; Jia, Y. Artificial intelligence in OCT angiography. Prog. Retin. Eye Res. 2021, 100965. [Google Scholar] [CrossRef] [PubMed]
- Methley, A.M.; Campbell, S.; Chew-Graham, C.; McNally, R.; Cheraghi-Sohi, S. PICO, PICOS and SPIDER: A comparison study of specificity and sensitivity in three search tools for qualitative systematic reviews. BMC Health Serv. Res. 2014, 14, 1–10. [Google Scholar] [CrossRef] [Green Version]
- Moher, D.; Liberati, A.; Tetzlaff, J.; Altman, D.G.; Altman, D.; Prisma Group. Preferred reporting items for systematic reviews and meta-analyses: The PRISMA statement. PLoS Med. 2009, 6, e1000097. [Google Scholar] [CrossRef] [Green Version]
- Khan, S.M.; Liu, X.; Nath, S.; Korot, E.; Faes, L.; Wagner, S.K.; A Keane, P.; Sebire, N.J.; Burton, M.J.; Denniston, A.K. A global review of publicly available datasets for ophthalmological imaging: Barriers to access, usability, and generalisability. Lancet Digit. Health 2021, 3, e51–e66. [Google Scholar] [CrossRef]
- Chetoui, M.; Akhloufi, M.A. Explainable end-to-end deep learning for diabetic retinopathy detection across multiple datasets. J. Med. Imaging 2020, 7, 7–25. [Google Scholar] [CrossRef]
- Somaraki, V.; Broadbent, D.; Coenen, F.; Harding, S. Finding Temporal Patterns in Noisy Longitudinal Data: A Study in Diabetic Retinopathy. In Advances in Data Mining. Applications and Theoretical Aspects; Springer: New York, NY, USA, 2010; Volume 6171, pp. 418–431. [Google Scholar]
- Zhou, Y.; Wang, B.; Huang, L.; Cui, S.; Shao, L. A Benchmark for Studying Diabetic Retinopathy: Segmentation, Grading, and Transferability. IEEE Trans. Med Imaging 2021, 40, 818–828. [Google Scholar] [CrossRef]
- Drive-Grand Challenge Official Website. Available online: https://drive.grand-challenge.org/ (accessed on 23 May 2021).
- Kauppi, T.; Kalesnykiene, V.; Kamarainen, J.; Lensu, L.; Sorri, I. DIARETDB0: Evaluation Database and Methodology for Diabetic Retinopathy Algorithms. Mach Vis Pattern Recognit Res Group, Lappeenranta Univ Technol Finland. 2006, pp. 1–17. Available online: http://www.siue.edu/~sumbaug/RetinalProjectPapers/DiabeticRetinopathyImageDatabaseInformation.pdf (accessed on 25 May 2021).
- Kauppi, T.; Kalesnykiene, V.; Kamarainen, J.-K.; Lensu, L.; Sorri, I.; Raninen, A.; Voutilainen, R.; Uusitalo, H.; Kalviainen, H.; Pietila, J. The diaretdb1 diabetic retinopathy database and evaluation protocol. In Proceedings of the British Machine Vision Conference 2007, Coventry, UK, 10–13 September 2007; pp. 61–65. [Google Scholar] [CrossRef] [Green Version]
- Hsieh, Y.-T.; Chuang, L.-M.; Jiang, Y.-D.; Chang, T.-J.; Yang, C.-M.; Yang, C.-H.; Chan, L.-W.; Kao, T.-Y.; Chen, T.-C.; Lin, H.-C.; et al. Application of deep learning image assessment software VeriSee™ for diabetic retinopathy screening. J. Formos. Med. Assoc. 2021, 120, 165–171. [Google Scholar] [CrossRef]
- Giancardo, L.; Meriaudeau, F.; Karnowski, T.P.; Li, Y.; Garg, S.; Tobin, K.W.; Chaum, E. Exudate-based diabetic macular edema detection in fundus images using publicly available datasets. Med. Image Anal. 2012, 16, 216–226. [Google Scholar] [CrossRef] [PubMed]
- Alipour, S.H.M.; Rabbani, H.; Akhlaghi, M.; Mehridehnavi, A.; Javanmard, S.H. Analysis of foveal avascular zone for grading of diabetic retinopathy severity based on curvelet transform. Graefe’s Arch. Clin. Exp. Ophthalmol. 2012, 250, 1607–1614. [Google Scholar] [CrossRef]
- Alipour, S.H.M.; Rabbani, H.; Akhlaghi, M. Diabetic Retinopathy Grading by Digital Curvelet Transform. Comput. Math. Methods Med. 2012, 2012, 1–11. [Google Scholar] [CrossRef] [Green Version]
- Esmaeili, M.; Rabbani, H.; Dehnavi, A.; Dehghani, A. Automatic detection of exudates and optic disk in retinal images using curvelet transform. IET Image Process. 2012, 6, 1005–1013. [Google Scholar] [CrossRef]
- Prentasic, P.; Loncaric, S.; Vatavuk, Z.; Bencic, G.; Subasic, M.; Petković, T. Diabetic retinopathy image database(DRiDB): A new database for diabetic retinopathy screening programs research. In Proceedings of the 2013 8th International Symposium on Image and Signal Processing and Analysis (ISPA), Trieste, Italy, 4–6 September 2013; pp. 711–716. [Google Scholar]
- Decencière, E.; Cazuguel, G.; Zhang, X.; Thibault, G.; Klein, J.-C.; Meyer, F.; Marcotegui, B.; Quellec, G.; Lamard, M.; Danno, R.; et al. TeleOphta: Machine learning and image processing methods for teleophthalmology. IRBM 2013, 34, 196–203. [Google Scholar] [CrossRef]
- Odstrcilik, J.; Kolar, R.; Budai, A.; Hornegger, J.; Jan, J.; Gazarek, J.; Kubena, T.; Cernosek, P.; Svoboda, O.; Angelopoulou, E. Retinal vessel segmentation by improved matched filtering: Evaluation on a new high-resolution fundus image database. IET Image Process. 2013, 7, 373–383. [Google Scholar] [CrossRef]
- Hu, Q.; Abràmoff, M.D.; Garvin, M.K. Automated Separation of Binary Overlapping Trees in Low-Contrast Color Retinal Images. In Medical Image Computing and Computer-Assisted Intervention; Lecture Notes in Computer Science; Mori, K., Sakuma, I., Sato, Y., Barillot, C., Navab, N., Eds.; Springer: Berlin/Heidelberg, Germany, 2013; Volume 8150. [Google Scholar] [CrossRef]
- Pires, R.; Jelinek, H.F.; Wainer, J.; Valle, E.; Rocha, A. Advancing Bag-of-Visual-Words Representations for Lesion Classification in Retinal Images. PLoS ONE 2014, 9, e96814. [Google Scholar] [CrossRef]
- Sevik, U.; Köse, C.; Berber, T.; Erdöl, H. Identification of suitable fundus images using automated quality assessment methods. J. Biomed. Opt. 2014, 19, 046006. [Google Scholar] [CrossRef]
- Alipour, S.H.M.; Rabbani, H.; Akhlaghi, M. A new combined method based on curvelet transform and morphological operators for automatic detection of foveal avascular zone. Signal Image Video Process. 2014, 8, 205–222. [Google Scholar] [CrossRef]
- Decencière, E.; Zhang, X.; Cazuguel, G.; Lay, B.; Cochener, B.; Trone, C.; Gain, P.; Ordóñez-Varela, J.-R.; Massin, P.; Erginay, A.; et al. Feedback on a publicly distributed image database: The MESSIDOR database. Image Anal. Ster. 2014, 33, 231. [Google Scholar] [CrossRef] [Green Version]
- Bala, M.P.; Vijayachitra, S. Early detection and classification of microaneurysms in retinal fundus images using sequential learning methods. Int. J. Biomed. Eng. Technol. 2014, 15, 128. [Google Scholar] [CrossRef]
- Srinivasan, P.P.; Kim, L.; Mettu, P.S.; Cousins, S.W.; Comer, G.M.; Izatt, J.A.; Farsiu, S. Fully automated detection of diabetic macular edema and dry age-related macular degeneration from optical coherence tomography images. Biomed. Opt. Express 2014, 5, 3568–3577. [Google Scholar] [CrossRef] [Green Version]
- Kaggle.com. Available online: https://www.kaggle.com/c/diabetic-retinopathy-detection/data (accessed on 26 May 2021).
- People.duke.edu Website. Available online: http://people.duke.edu/~sf59/software.html (accessed on 26 May 2021).
- Holm, S.; Russell, G.; Nourrit, V.; McLoughlin, N. DR HAGIS—A fundus image database for the automatic extraction of retinal surface vessels from diabetic patients. J. Med. Imaging 2017, 4, 014503. [Google Scholar] [CrossRef] [Green Version]
- Takahashi, H.; Tampo, H.; Arai, Y.; Inoue, Y.; Kawashima, H. Applying artificial intelligence to disease staging: Deep learning for improved staging of diabetic retinopathy. PLoS ONE 2017, 12, e0179790. [Google Scholar] [CrossRef] [Green Version]
- Rotterdam Ophthalmic Data Repository. re3data.org. Available online: https://www.re3data.org/repository/r3d (accessed on 22 June 2021).
- Ting, D.S.W.; Cheung, C.Y.-L.; Lim, G.; Tan, G.S.W.; Quang, N.D.; Gan, A.; Hamzah, H.; Garcia-Franco, R.; Yeo, I.Y.S.; Lee, S.Y.; et al. Development and Validation of a Deep Learning System for Diabetic Retinopathy and Related Eye Diseases Using Retinal Images From Multiethnic Populations With Diabetes. JAMA 2017, 318, 2211–2223. [Google Scholar] [CrossRef]
- Porwal, P.; Pachade, S.; Kamble, R.; Kokare, M.; Deshmukh, G.; Sahasrabuddhe, V.; Meriaudeau, F. Indian diabetic retinopathy image dataset (IDRiD): A database for diabetic retinopathy screening research. Data 2018, 3, 25. [Google Scholar] [CrossRef] [Green Version]
- Gholami, P.; Roy, P.; Parthasarathy, M.K.; Lakshminarayanan, V. OCTID: Optical coherence tomography image database. Comput. Electr. Eng. 2020, 81, 106532. [Google Scholar] [CrossRef]
- Abdulla, W.; Chalakkal, R.J. University of Auckland Diabetic Retinopathy (UoA-DR) Database-End User Licence Agreement. Available online: https://auckland.figshare.com/articles/journal_contribution/UoA-DR_Database_Info/5985208 (accessed on 28 May 2021).
- Kaggle.com. Available online: https://www.kaggle.com/c/aptos2019-blindness-detection (accessed on 23 May 2021).
- Ali, A.; Qadri, S.; Mashwani, W.K.; Kumam, W.; Kumam, P.; Naeem, S.; Goktas, A.; Jamal, F.; Chesneau, C.; Anam, S.; et al. Machine Learning Based Automated Segmentation and Hybrid Feature Analysis for Diabetic Retinopathy Classification Using Fundus Image. Entropy 2020, 22, 567. [Google Scholar] [CrossRef] [PubMed]
- Díaz, M.; Novo, J.; Cutrín, P.; Gómez-Ulla, F.; Penedo, M.G.; Ortega, M. Automatic segmentation of the foveal avascular zone in ophthalmological OCT-A images. PLoS ONE 2019, 14, e0212364. [Google Scholar] [CrossRef]
- ODIR-2019. Available online: https://odir2019.grand-challenge.org/ (accessed on 22 June 2021).
- Li, T.; Gao, Y.; Wang, K.; Guo, S.; Liu, H.; Kang, H. Diagnostic assessment of deep learning algorithms for diabetic retinopathy screening. Inf. Sci. 2019, 501, 511–522. [Google Scholar] [CrossRef]
- Li, F.; Liu, Z.; Chen, H.; Jiang, M.; Zhang, X.; Wu, Z. Automatic Detection of Diabetic Retinopathy in Retinal Fundus Photographs Based on Deep Learning Algorithm. Transl. Vis. Sci. Technol. 2019, 8, 4. [Google Scholar] [CrossRef] [Green Version]
- Benítez, V.E.C.; Matto, I.C.; Román, J.C.M.; Noguera, J.L.V.; García-Torres, M.; Ayala, J.; Pinto-Roa, D.P.; Gardel-Sotomayor, P.E.; Facon, J.; Grillo, S.A. Dataset from fundus images for the study of diabetic retinopathy. Data Brief. 2021, 36, 107068. [Google Scholar] [CrossRef]
- Wei, Q.; Li, X.; Yu, W.; Zhang, X.; Zhang, Y.; Hu, B.; Mo, B.; Gong, D.; Chen, N.; Ding, D.; et al. Learn to Segment Retinal Lesions and Beyond. In Proceedings of the 2020 25th International Conference on Pattern Recognition (ICPR), Milan, Italy, 10–15 January 2021; pp. 7403–7410. [Google Scholar]
- Noor-Ul-Huda, M.; Tehsin, S.; Ahmed, S.; Niazi, F.A.; Murtaza, Z. Retinal images benchmark for the detection of diabetic retinopathy and clinically significant macular edema (CSME). Biomed. Tech. Eng. 2018, 64, 297–307. [Google Scholar] [CrossRef]
- Ohsugi, H.; Tabuchi, H.; Enno, H.; Ishitobi, N. Accuracy of deep learning, a machine-learning technology, using ultra–wide-field fundus ophthalmoscopy for detecting rhegmatogenous retinal detachment. Sci. Rep. 2017, 7, 9425. [Google Scholar] [CrossRef]
- Abràmoff, M.D.; Lou, Y.; Erginay, A.; Clarida, W.; Amelon, R.; Folk, J.C.; Niemeijer, M. Improved Automated Detection of Diabetic Retinopathy on a Publicly Available Dataset Through Integration of Deep Learning. Investig. Ophthalmol. Vis. Sci. 2016, 57, 5200–5206. [Google Scholar] [CrossRef] [PubMed] [Green Version]
- Kafieh, R.; Rabbani, H.; Hajizadeh, F.; Ommani, M. An Accurate Multimodal 3-D Vessel Segmentation Method Based on Brightness Variations on OCT Layers and Curvelet Domain Fundus Image Analysis. IEEE Trans. Biomed. Eng. 2013, 60, 2815–2823. [Google Scholar] [CrossRef]
- Gargeya, R.; Leng, T. Automated Identification of Diabetic Retinopathy Using Deep Learning. Ophthalmology 2017, 124, 962–969. [Google Scholar] [CrossRef]
- Gulshan, V.; Peng, L.; Coram, M.; Stumpe, M.C.; Wu, D.; Narayanaswamy, A.; Venugopalan, S.; Widner, K.; Madams, T.; Cuadros, J.; et al. Development and Validation of a Deep Learning Algorithm for Detection of Diabetic Retinopathy in Retinal Fundus Photographs. JAMA 2016, 316, 2402–2410. [Google Scholar] [CrossRef] [PubMed]
- Sahlsten, J.; Jaskari, J.; Kivinen, J.; Turunen, L.; Jaanio, E.; Hietala, K.; Kaski, K. Deep Learning Fundus Image Analysis for Diabetic Retinopathy and Macular Edema Grading. Sci. Rep. 2019, 9, 10750. [Google Scholar] [CrossRef] [Green Version]
- Gadekallu, T.R.; Khare, N.; Bhattacharya, S.; Singh, S.; Maddikunta, P.K.R.; Ra, I.-H.; Alazab, M. Early Detection of Diabetic Retinopathy Using PCA-Firefly Based Deep Learning Model. Electron. 2020, 9, 274. [Google Scholar] [CrossRef] [Green Version]
- Mansour, R.F. Deep-learning-based automatic computer-aided diagnosis system for diabetic retinopathy. Biomed. Eng. Lett. 2017, 8, 41–57. [Google Scholar] [CrossRef] [PubMed]
- Paradisa, R.H.; Sarwinda, D.; Bustamam, A.; Argyadiva, T. Classification of Diabetic Retinopathy through Deep Feature Extraction and Classic Machine Learning Approach. In Proceedings of the 2020 3rd International Conference on Information and Communications Technology (ICOIACT), Yogyakarta, Indonesia, 24–25 November 2020; pp. 377–381. [Google Scholar]
- Elswah, D.K.; Elnakib, A.A.; Moustafa, H.E.-D. Automated Diabetic Retinopathy Grading using Resnet. In Proceedings of the National Radio Science Conference, NRSC, Cairo, Egypt, 8–10 September 2020; pp. 248–254. [Google Scholar]
- Sandhu, H.S.; Elmogy, M.; Sharafeldeen, A.; Elsharkawy, M.; El-Adawy, N.; Eltanboly, A.; Shalaby, A.; Keynton, R.; El-Baz, A. Automated Diagnosis of Diabetic Retinopathy Using Clinical Biomarkers, Optical Coherence Tomography, and Optical Coherence Tomography Angiography. Am. J. Ophthalmol. 2020, 216, 201–206. [Google Scholar] [CrossRef] [PubMed]
- Somasundaram, S.K.; Alli, P. A Machine Learning Ensemble Classifier for Early Prediction of Diabetic Retinopathy. J. Med. Syst. 2017, 41, 201. [Google Scholar]
- Liu, Z.; Wang, C.; Cai, X.; Jiang, H.; Wang, J. Discrimination of Diabetic Retinopathy From Optical Coherence Tomography Angiography Images Using Machine Learning Methods. IEEE Access 2021, 9, 51689–51694. [Google Scholar] [CrossRef]
- Levenkova, A.; Kalloniatis, M.; Ly, A.; Ho, A.; Sowmya, A. Lesion detection in ultra-wide field retinal images for diabetic retinopathy diagnosis. In Medical Imaging 2018: Computer-Aided Diagnosis; International Society for Optics and Photonics: Bellingham, WA, USA, 2018; Volume 10575, p. 1057531. [Google Scholar]
- Rajalakshmi, R.; Subashini, R.; Anjana, R.M.; Mohan, V. Automated diabetic retinopathy detection in smartphone-based fundus photography using artificial intelligence. Eye 2018, 32, 1138–1144. [Google Scholar] [CrossRef]
- Riaz, H.; Park, J.; Choi, H.; Kim, H.; Kim, J. Deep and Densely Connected Networks for Classification of Diabetic Retinopathy. Diagnostics 2020, 10, 24. [Google Scholar] [CrossRef] [Green Version]
- Quellec, G.; Charrière, K.; Boudi, Y.; Cochener, B.; Lamard, M. Deep image mining for diabetic retinopathy screening. Med Image Anal. 2017, 39, 178–193. [Google Scholar] [CrossRef] [Green Version]
- Sayres, R.; Taly, A.; Rahimy, E.; Blumer, K.; Coz, D.; Hammel, N.; Krause, J.; Narayanaswamy, A.; Rastegar, Z.; Wu, D.; et al. Using a Deep Learning Algorithm and Integrated Gradients Explanation to Assist Grading for Diabetic Retinopathy. Ophthalmology 2019, 126, 552–564. [Google Scholar] [CrossRef] [Green Version]
- Hua, C.-H.; Huynh-The, T.; Kim, K.; Yu, S.-Y.; Le-Tien, T.; Park, G.H.; Bang, J.; Khan, W.A.; Bae, S.-H.; Lee, S. Bimodal learning via trilogy of skip-connection deep networks for diabetic retinopathy risk progression identification. Int. J. Med. Inform. 2019, 132, 103926. [Google Scholar] [CrossRef] [PubMed]
- Pao, S.-I.; Lin, H.-Z.; Chien, K.-H.; Tai, M.-C.; Chen, J.-T.; Lin, G.-M. Detection of Diabetic Retinopathy Using Bichannel Convolutional Neural Network. J. Ophthalmol. 2020, 2020, 1–7. [Google Scholar] [CrossRef] [PubMed]
- Shankar, K.; Sait, A.R.W.; Gupta, D.; Lakshmanaprabu, S.; Khanna, A.; Pandey, H.M. Automated detection and classification of fundus diabetic retinopathy images using synergic deep learning model. Pattern Recognit. Lett. 2020, 133, 210–216. [Google Scholar] [CrossRef]
- Singh, A.; Sengupta, S.; Lakshminarayanan, V. Explainable Deep Learning Models in Medical Image Analysis. J. Imaging 2020, 6, 52. [Google Scholar] [CrossRef]
- Singh, A.; Sengupta, S.; Rasheed, M.A.; Jayakumar, V.; Lakshminarayanan, V. Uncertainty aware and explainable diagnosis of retinal disease. In Medical Imaging 2021: Imaging Informatics for Healthcare, Research, and Applications; International Society for Optics and Photonics: Bellingham, WA, USA, 2021; Volume 11601, p. 116010J. [Google Scholar]
- Singh, A.; Jothi Balaji, J.; Rasheed, M.A.; Jayakumar, V.; Raman, R.; Lakshminarayanan, V. Evaluation of Explainable Deep Learning Methods for Ophthalmic Diagnosis. Clin. Ophthalmol. 2021, 15, 2573–2581. [Google Scholar] [CrossRef]
- Keel, S.; Wu, J.; Lee, P.Y.; Scheetz, J.; He, M. Visualizing Deep Learning Models for the Detection of Referable Diabetic Retinopathy and Glaucoma. JAMA Ophthalmol. 2019, 137, 288–292. [Google Scholar] [CrossRef]
- Chandrakumar, T.; Kathirvel, R. Classifying Diabetic Retinopathy using Deep Learning Architecture. Int. J. Eng. Res. 2016, 5, 19–24. [Google Scholar] [CrossRef]
- Colas, E.; Besse, A.; Orgogozo, A.; Schmauch, B.; Meric, N. Deep learning approach for diabetic retinopathy screening. Acta Ophthalmol. 2016, 94. [Google Scholar] [CrossRef]
- Wong, T.Y.; Bressler, N.M. Artificial Intelligence With Deep Learning Technology Looks Into Diabetic Retinopathy Screening. JAMA 2016, 316, 2366–2367. [Google Scholar] [CrossRef] [PubMed]
- Wang, Z.; Yin, Y.; Shi, J.; Fang, W.; Li, H.; Wang, X. Zoom-in-Net: Deep Mining Lesions for Diabetic Retinopathy Detection. In Proceedings of the Transactions on Petri Nets and Other Models of Concurrency XV, Quebec City, QC, Canada, 11–13 September 2017; pp. 267–275. [Google Scholar]
- Benson, J.; Maynard, J.; Zamora, G.; Carrillo, H.; Wigdahl, J.; Nemeth, S.; Barriga, S.; Estrada, T.; Soliz, P. Transfer learning for diabetic retinopathy. Image Process. 2018, 70, 105741Z. [Google Scholar]
- Chakrabarty, N. A Deep Learning Method for the detection of Diabetic Retinopathy. In Proceedings of the 2018 5th IEEE Uttar Pradesh Section International Conference on Electrical, Electronics and Computer Engineering (UPCON), Gorakhpur, India, 2–4 November 2018; pp. 1–5. [Google Scholar]
- Costa, P.; Galdran, A.; Smailagic, A.; Campilho, A. A Weakly-Supervised Framework for Interpretable Diabetic Retinopathy Detection on Retinal Images. IEEE Access 2018, 6, 18747–18758. [Google Scholar] [CrossRef]
- Dai, L.; Fang, R.; Li, H.; Hou, X.; Sheng, B.; Wu, Q.; Jia, W. Clinical Report Guided Retinal Microaneurysm Detection With Multi-Sieving Deep Learning. IEEE Trans. Med. Imaging 2018, 37, 1149–1161. [Google Scholar] [CrossRef] [PubMed]
- Dutta, S.; Manideep, B.C.; Basha, S.M.; Caytiles, R.D.; Iyengar, N.C.S.N. Classification of Diabetic Retinopathy Images by Using Deep Learning Models. Int. J. Grid Distrib. Comput. 2018, 11, 99–106. [Google Scholar] [CrossRef]
- Kwasigroch, A.; Jarzembinski, B.; Grochowski, M. Deep CNN based decision support system for detection and assessing the stage of diabetic retinopathy. In Proceedings of the 2018 International Interdisciplinary PhD Workshop (IIPhDW), Świnoujście, Poland, 9–12 May 2018; pp. 111–116. [Google Scholar] [CrossRef]
- Islam, M.R.; Hasan, M.A.M.; Sayeed, A. Transfer Learning based Diabetic Retinopathy Detection with a Novel Preprocessed Layer. In Proceedings of the 2020 IEEE Region 10 Symposium (TENSYMP), Dhaka, Bangladesh, 5–7 June 2020; pp. 888–891. [Google Scholar]
- Zhang, S.; Wu, H.; Wang, X.; Cao, L.; Schwartz, J.; Hernandez, J.; Rodríguez, G.; Liu, B.J.; Murthy, V. The application of deep learning for diabetic retinopathy prescreening in research eye-PACS. Imaging Inform. Healthc. Res. Appl. 2018, 10579, 1057913. [Google Scholar] [CrossRef]
- Fang, M.; Zhang, X.; Zhang, W.; Xue, J.; Wu, L. Automatic classification of diabetic retinopathy based on convolutional neural networks. In Proceedings of the 2018 International Conference on Image and Video Processing, and Artificial Intelligence, Shanghai, China, 15–17 August 2018; Volume 10836, p. 1083608. [Google Scholar]
- Arcadu, F.; Benmansour, F.; Maunz, A.; Willis, J.; Haskova, Z.; Prunotto, M. Deep learning algorithm predicts diabetic retinopathy progression in individual patients. NPJ Digit. Med. 2019, 2, 92. [Google Scholar] [CrossRef]
- Bellemo, V.; Lim, Z.W.; Lim, G.; Nguyen, Q.D.; Xie, Y.; Yip, M.Y.T.; Hamzah, H.; Ho, J.; Lee, X.Q.; Hsu, W.; et al. Artificial intelligence using deep learning to screen for referable and vision-threatening diabetic retinopathy in Africa: A clinical validation study. Lancet Digit. Health 2019, 1, e35–e44. [Google Scholar] [CrossRef] [Green Version]
- Chowdhury, M.M.H.; Meem, N.T.A. A Machine Learning Approach to Detect Diabetic Retinopathy Using Convolutional Neural Network; Springer: Singapore, 2019; pp. 255–264. [Google Scholar]
- Govindaraj, V.; Balaji, M.; Mohideen, T.A.; Mohideen, S.A.F.J. Eminent identification and classification of Diabetic Retinopathy in clinical fundus images using Probabilistic Neural Network. In Proceedings of the 2019 IEEE International Conference on Intelligent Techniques in Control, Optimization and Signal Processing (INCOS), Tamilnadu, India, 11–13 April 2019; pp. 1–6. [Google Scholar]
- Gulshan, V.; Rajan, R.; Widner, K.; Wu, D.; Wubbels, P.; Rhodes, T.; Whitehouse, K.; Coram, M.; Corrado, G.; Ramasamy, K.; et al. Performance of a Deep-Learning Algorithm vs Manual Grading for Detecting Diabetic Retinopathy in India. JAMA Ophthalmol. 2019, 137, 987–993. [Google Scholar] [CrossRef] [PubMed] [Green Version]
- Hathwar, S.B.; Srinivasa, G. Automated Grading of Diabetic Retinopathy in Retinal Fundus Images using Deep Learning. In Proceedings of the 2019 IEEE International Conference on Signal and Image Processing Applications (ICSIPA), Kuala Lumpur, Malaysia, 17–19 September 2019; pp. 73–77. [Google Scholar]
- He, J.; Shen, L.; Ai, X.; Li, X. Diabetic Retinopathy Grade and Macular Edema Risk Classification Using Convolutional Neural Networks. In Proceedings of the 2019 IEEE International Conference on Power, Intelligent Computing and Systems (ICPICS), Shenyang, China, 12–14 July 2019; pp. 463–466. [Google Scholar]
- Jiang, H.; Yang, K.; Gao, M.; Zhang, D.; Ma, H.; Qian, W. An Interpretable Ensemble Deep Learning Model for Diabetic Retinopathy Disease Classification. In Proceedings of the 2019 41st Annual International Conference of the IEEE Engineering in Medicine and Biology Society (EMBC, Berlin, Germany, 23–27 July 2019; 2019, pp. 2045–2048. [Google Scholar]
- Li, X.; Hu, X.; Yu, L.; Zhu, L.; Fu, C.-W.; Heng, P.-A. CANet: Cross-Disease Attention Network for Joint Diabetic Retinopathy and Diabetic Macular Edema Grading. IEEE Trans. Med. Imaging 2020, 39, 1483–1493. [Google Scholar] [CrossRef] [Green Version]
- Metan, A.C.; Lambert, A.; Pickering, M. Small Scale Feature Propagation Using Deep Residual Learning for Diabetic Reti-nopathy Classification. In Proceedings of the 2019 IEEE 4th International Conference on Image, Vision and Computing (ICIVC), Xiamen, China, 5–7 July 2019; pp. 392–396. [Google Scholar]
- Nagasawa, T.; Tabuchi, H.; Masumoto, H.; Enno, H.; Niki, M.; Ohara, Z.; Yoshizumi, Y.; Ohsugi, H.; Mitamura, Y. Accuracy of ultrawide-field fundus ophthalmoscopy-assisted deep learning for detecting treatment-naïve proliferative diabetic retinopathy. Int. Ophthalmol. 2019, 39, 2153–2159. [Google Scholar] [CrossRef] [PubMed] [Green Version]
- Qummar, S.; Khan, F.G.; Shah, S.; Khan, A.; Shamshirband, S.; Rehman, Z.U.; Khan, I.A.; Jadoon, W. A Deep Learning Ensemble Approach for Diabetic Reti-nopathy Detection. IEEE Access 2019, 7, 150530–150539. [Google Scholar] [CrossRef]
- Bora, A.; Balasubramanian, S.; Babenko, B.; Virmani, S.; Venugopalan, S.; Mitani, A.; Marinho, G.D.O.; Cuadros, J.; Ruamviboonsuk, P.; Corrado, G.S.; et al. Predicting the risk of developing diabetic retinopathy using deep learning. Lancet Digit. Health 2021, 3, e10–e19. [Google Scholar] [CrossRef]
- Sengupta, S.; Singh, A.; Zelek, J.; Lakshminarayanan, V. Cross-domain diabetic retinopathy detection using deep learning. Appl. Mach. Learn. 2019, 11139, 111390V. [Google Scholar] [CrossRef]
- Ting, D.S.W.; Cheung, C.Y.; Nguyen, Q.; Sabanayagam, C.; Lim, G.; Lim, Z.W.; Tan, G.S.W.; Soh, Y.Q.; Schmetterer, L.; Wang, Y.X.; et al. Deep learning in estimating prevalence and systemic risk factors for diabetic retinopathy: A multi-ethnic study. npj Digit. Med. 2019, 2, 24. [Google Scholar] [CrossRef] [Green Version]
- Zeng, X.; Chen, H.; Luo, Y.; Ye, W. Automated Diabetic Retinopathy Detection Based on Binocular Siamese-Like Convolutional Neural Network. IEEE Access 2019, 7, 30744–30753. [Google Scholar] [CrossRef]
- Araújo, T.; Aresta, G.; Mendonça, L.; Penas, S.; Maia, C.; Carneiro, Â.; Mendonça, A.M.; Campilho, A. DR|GRADUATE: Uncertainty-aware deep learning-based diabetic retinopathy grading in eye fundus images. Med. Image Anal. 2020, 63, 101715. [Google Scholar] [CrossRef] [PubMed]
- Gadekallu, T.R.; Khare, N.; Bhattacharya, S.; Singh, S.; Maddikunta, P.K.R. Deep neural networks to predict diabetic reti-nopathy. J. Ambient. Intell. Hum. Comput. 2020. [Google Scholar] [CrossRef]
- Gayathri, S.; Krishna, A.K.; Gopi, V.P.; Palanisamy, P. Automated Binary and Multiclass Classification of Diabetic Retinopathy Using Haralick and Multiresolution Features. IEEE Access 2020, 8, 57497–57504. [Google Scholar] [CrossRef]
- Jiang, H.; Xu, J.; Shi, R.; Yang, K.; Zhang, D.; Gao, M.; Ma, H.; Qian, W. A Multi-Label Deep Learning Model with Interpretable Grad-CAM for Diabetic Retinopathy Classification. In Proceedings of the 42nd Annual International Conference of the IEEE Engineering in Medicine & Biology Society (EMBC), Montreal, QC, Canada, 20–24 July 2020; Volume 2020, pp. 1560–1563. [Google Scholar]
- Lands, A.; Kottarathil, A.J.; Biju, A.; Jacob, E.M.; Thomas, S. Implementation of deep learning based algorithms for diabetic retinopathy classification from fundus images. In Proceedings of the 2020 4th International Conference on Trends in Electronics and Informatics (ICOEI)(48184), Tirunelveli, India, 15–17 June 2020; pp. 1028–1032. [Google Scholar]
- Memari, N.; Abdollahi, S.; Ganzagh, M.M.; Moghbel, M. Computer-assisted diagnosis (CAD) system for Diabetic Retinopathy screening using color fundus images using Deep learning. In Proceedings of the 2020 IEEE Student Conference on Research and Development (SCOReD), Batu Pahat, Malaysia, 27–29 September 2020; pp. 69–73. [Google Scholar]
- Narayanan, B.N.; Hardie, R.C.; De Silva, M.S.; Kueterman, N.K. Hybrid machine learning architecture for automated detection and grading of retinal images for diabetic retinopathy. J. Med. Imaging 2020, 7, 034501. [Google Scholar] [CrossRef]
- Patel, R.; Chaware, A. Transfer Learning with Fine-Tuned MobileNetV2 for Diabetic Retinopathy. In Proceedings of the 2020 International Conference for Emerging Technology (INCET), Belgaum, India, 5–7 June 2020; pp. 1–4. [Google Scholar]
- Samanta, A.; Saha, A.; Satapathy, S.C.; Fernandes, S.L.; Zhang, Y.-D. Automated detection of diabetic retinopathy using convolutional neural networks on a small dataset. Pattern Recognit. Lett. 2020, 135, 293–298. [Google Scholar] [CrossRef]
- Serener, A.; Serte, S. Geographic variation and ethnicity in diabetic retinopathy detection via deep learning. Turkish J. Electr. Eng. Comput. Sci. 2020, 28, 664–678. [Google Scholar] [CrossRef]
- Shaban, M.; Ogur, Z.; Mahmoud, A.; Switala, A.; Shalaby, A.; Abu Khalifeh, H.; Ghazal, M.; Fraiwan, L.; Giridharan, G.; Sandhu, H.; et al. A convolutional neural network for the screening and staging of diabetic retinopathy. PLoS ONE 2020, 15, e0233514. [Google Scholar] [CrossRef]
- Singh, R.K.; Gorantla, R. DMENet: Diabetic Macular Edema diagnosis using Hierarchical Ensemble of CNNs. PLoS ONE 2020, 15, e0220677. [Google Scholar] [CrossRef] [Green Version]
- Thota, N.B.; Reddy, D.U. Improving the Accuracy of Diabetic Retinopathy Severity Classification with Transfer Learning. In Proceedings of the 2020 IEEE 63rd International Midwest Symposium on Circuits and Systems (MWSCAS), Springfield, MA, USA, 9–12 August 2020; pp. 1003–1006. [Google Scholar] [CrossRef]
- Wang, X.-N.; Dai, L.; Li, S.-T.; Kong, H.-Y.; Sheng, B.; Wu, Q. Automatic Grading System for Diabetic Retinopathy Diagnosis Using Deep Learning Artificial Intelligence Software. Curr. Eye Res. 2020, 45, 1550–1555. [Google Scholar] [CrossRef]
- Wang, J.; Bai, Y.; Xia, B. Simultaneous Diagnosis of Severity and Features of Diabetic Retinopathy in Fundus Photography Using Deep Learning. IEEE J. Biomed. Health Inform. 2020, 24, 3397–3407. [Google Scholar] [CrossRef] [PubMed]
- Zhang, W.; Zhao, X.J.; Chen, Y.; Zhong, J.; Yi, Z. DeepUWF: An Automated Ultra-Wide-Field Fundus Screening System via Deep Learning. IEEE J. Biomed. Health Inform. 2021, 25, 2988–2996. [Google Scholar] [CrossRef] [PubMed]
- Abdelmaksoud, E.; El-Sappagh, S.; Barakat, S.; AbuHmed, T.; Elmogy, M. Automatic Diabetic Retinopathy Grading System Based on Detecting Multiple Retinal Lesions. IEEE Access 2021, 9, 15939–15960. [Google Scholar] [CrossRef]
- Gangwar, A.K.; Ravi, V. Diabetic Retinopathy Detection Using Transfer Learning and Deep Learning. In Evolution in Computational Intelligence; Springer: Singapore, 2020; pp. 679–689. [Google Scholar] [CrossRef]
- He, A.; Li, T.; Li, N.; Wang, K.; Fu, H. CABNet: Category Attention Block for Imbalanced Diabetic Retinopathy Grading. IEEE Trans. Med. Imaging 2021, 40, 143–153. [Google Scholar] [CrossRef]
- Khan, Z.; Khan, F.G.; Khan, A.; Rehman, Z.U.; Shah, S.; Qummar, S.; Ali, F.; Pack, S. Diabetic Retinopathy Detection Using VGG-NIN a Deep Learning Architecture. IEEE Access 2021, 9, 61408–61416. [Google Scholar] [CrossRef]
- Saeed, F.; Hussain, M.; Aboalsamh, H.A. Automatic Diabetic Retinopathy Diagnosis Using Adaptive Fine-Tuned Convolu-tional Neural Network. IEEE Access 2021, 9, 41344–44359. [Google Scholar] [CrossRef]
- Wang, Y.; Yu, M.; Hu, B.; Jin, X.; Li, Y.; Zhang, X.; Zhang, Y.; Gong, D.; Wu, C.; Zhang, B.; et al. Deep learning-based detection and stage grading for optimising diagnosis of diabetic retinopathy. Diabetes/Metab. Res. Rev. 2021, 37, 3445. [Google Scholar] [CrossRef]
- Wang, S.; Wang, X.; Hu, Y.; Shen, Y.; Yang, Z.; Gen, M.; Lei, B. Diabetic Retinopathy Diagnosis Using Multichannel Generative Adver-sarial Network with Semisupervision. IEEE Trans. Autom. Sci. Eng. 2021, 18, 574–585. [Google Scholar] [CrossRef]
- Datta, N.S.; Dutta, H.S.; Majumder, K. Brightness-preserving fuzzy contrast enhancement scheme for the detection and clas-sification of diabetic retinopathy disease. J. Med. Imaging 2016, 3, 014502. [Google Scholar] [CrossRef] [Green Version]
- Lin, G.-M.; Chen, M.-J.; Yeh, C.-H.; Lin, Y.-Y.; Kuo, H.-Y.; Lin, M.-H.; Chen, M.-C.; Lin, S.D.; Gao, Y.; Ran, A.; et al. Transforming Retinal Photographs to Entropy Images in Deep Learning to Improve Automated Detection for Diabetic Retinopathy. J. Ophthalmol. 2018, 2018, 1–6. [Google Scholar] [CrossRef] [PubMed] [Green Version]
- Panigrahi, P.K.; Mukhopadhyay, S.; Pratiher, S.; Chhablani, J.; Mukherjee, S.; Barman, R.; Pasupuleti, G. Statistical classifiers on local binary patterns for optical diagnosis of diabetic retinopathy. Nanophotonics 2018, 10685, 106852Y. [Google Scholar] [CrossRef]
- Pour, A.M.; Seyedarabi, H.; Jahromi, S.H.A.; Javadzadeh, A. Automatic Detection and Monitoring of Diabetic Retinopathy Using Efficient Convolutional Neural Networks and Contrast Limited Adaptive Histogram Equalization. IEEE Access 2020, 8, 136668–136673. [Google Scholar] [CrossRef]
- Ramchandre, S.; Patil, B.; Pharande, S.; Javali, K.; Pande, H. A Deep Learning Approach for Diabetic Retinopathy detection using Transfer Learning. In Proceedings of the 2020 IEEE International Conference for Innovation in Technology (INOCON), Bangluru, India, 6–8 November 2020; pp. 1–5. [Google Scholar]
- Bhardwaj, C.; Jain, S.; Sood, M. Deep Learning–Based Diabetic Retinopathy Severity Grading System Employing Quadrant Ensemble Model. J. Digit. Imaging 2021. [Google Scholar] [CrossRef]
- Elloumi, Y.; Ben Mbarek, M.; Boukadida, R.; Akil, M.; Bedoui, M.H. Fast and accurate mobile-aided screening system of moderate diabetic retinopathy. In Proceedings of the Thirteenth International Conference on Machine Vision, Rome, Italy, 2–6 November 2020; Morgan Kaufmann Publishers Inc.: San Francisco, CA, USA, 2021; Volume 11605, p. 116050U. [Google Scholar]
- Eladawi, N.; Elmogy, M.; Fraiwan, L.; Pichi, F.; Ghazal, M.; Aboelfetouh, A.; Riad, A.; Keynton, R.; Schaal, S.; El-Baz, A. Early Diagnosis of Diabetic Retinopathy in OCTA Images Based on Local Analysis of Retinal Blood Vessels and Foveal Avascular Zone. In Proceedings of the 2018 24th International Conference on Pattern Recognition (ICPR), Beijing, China, 20–24 August 2018; pp. 3886–3891. [Google Scholar]
- Islam, K.T.; Wijewickrema, S.; O’Leary, S. Identifying Diabetic Retinopathy from OCT Images using Deep Transfer Learning with Artificial Neural Networks. In Proceedings of the 2019 IEEE 32nd International Symposium on Computer-Based Medical Systems (CBMS), Cordoba, Spain, 5–7 June 2019; pp. 281–286. [Google Scholar] [CrossRef]
- Le, D.; Alam, M.N.; Lim, J.I.; Chan, R.P.; Yao, X. Deep learning for objective OCTA detection of diabetic retinopathy. Ophthalmic Technol. 2020, 11218, 112181P. [Google Scholar] [CrossRef]
- Singh, A.; Sengupta, S.; Mohammed, A.R.; Faruq, I.; Jayakumar, V.; Zelek, J.; Lakshminarayanan, V. What is the Optimal Attribution Method for Explainable Ophthalmic Disease Classification? In Lecture Notes in Computer Science (Including Subseries Lecture Notes in Artificial Intelligence and Lecture Notes in Bioinformatics); Springer: Cham, Switzerland, 2020; pp. 21–31. [Google Scholar]
- Singh, A.; Mohammed, A.R.; Zelek, J.; Lakshminarayanan, V. Interpretation of deep learning using attributions: Application to ophthalmic diagnosis. Appl. Mach. Learn. 2020, 11511, 115110A. [Google Scholar] [CrossRef]
- Shah, S.A.A.; Laude, A.; Faye, I.; Tang, T.B. Automated microaneurysm detection in diabetic retinopathy using curvelet transform. J. Biomed. Opt. 2016, 21, 101404. [Google Scholar] [CrossRef] [PubMed] [Green Version]
- Huang, H.; Ma, H.; van Triest, H.J.W.; Wei, Y.; Qian, W. Automatic detection of neovascularization in retinal images using extreme learning machine. Neurocomputing 2018, 277, 218–227. [Google Scholar] [CrossRef]
- Kaur, J.; Mittal, D. A generalized method for the segmentation of exudates from pathological retinal fundus images. Biocybern. Biomed. Eng. 2018, 38, 27–53. [Google Scholar] [CrossRef]
- Imani, E.; Pourreza, H.-R. A novel method for retinal exudate segmentation using signal separation algorithm. Comput. Methods Programs Biomed. 2016, 133, 195–205. [Google Scholar] [CrossRef]
- Holmberg, O.; Köhler, N.D.; Martins, T.; Siedlecki, J.; Herold, T.; Keidel, L.; Asani, B.; Schiefelbein, J.; Priglinger, S.; Kortuem, K.U.; et al. Self-supervised retinal thickness prediction enables deep learning from unlabelled data to boost classification of diabetic retinopathy. Nat. Mach. Intell. 2020, 2, 719–726. [Google Scholar] [CrossRef]
- Guo, Y.; Camino, A.; Wang, J.; Huang, D.; Hwang, T.; Jia, Y. MEDnet, a neural network for automated detection of avascular area in OCT angiography. Biomed. Opt. Express 2018, 9, 5147–5158. [Google Scholar] [CrossRef]
- Lam, C.; Yu, C.; Huang, L.; Rubin, D. Retinal Lesion Detection With Deep Learning Using Image Patches. Investig. Opthalmology Vis. Sci. 2018, 59, 590–596. [Google Scholar] [CrossRef]
- Benzamin, A.; Chakraborty, C. Detection of hard exudates in retinal fundus images using deep learning. In Proceedings of the 2018 Joint 7th International Conference on Informatics, Electronics & Vision (ICIEV) and 2018 2nd International Conference on Imaging, Vision & Pattern Recognition (icIVPR), Kitakyushu, Japan, 25–29 June 2018; pp. 465–469. [Google Scholar]
- Orlando, J.I.; Prokofyeva, E.; del Fresno, M.; Blaschko, M. An ensemble deep learning based approach for red lesion detection in fundus images. Comput. Methods Programs Biomed. 2018, 153, 115–127. [Google Scholar] [CrossRef] [Green Version]
- Eftekhari, N.; Pourreza, H.-R.; Masoudi, M.; Ghiasi-Shirazi, K.; Saeedi, E. Microaneurysm detection in fundus images using a two-step convolutional neural network. Biomed. Eng. Online 2019, 18, 1–16. [Google Scholar] [CrossRef] [Green Version]
- Wu, Q.; Cheddad, A. Segmentation-based Deep Learning Fundus Image Analysis. In Proceedings of the 2019 Ninth International Conference on Image Processing Theory, Tools and Applications (IPTA), Istanbul, Turkey, 6–9 November 2019; pp. 1–5. [Google Scholar]
- Yan, Z.; Han, X.; Wang, C.; Qiu, Y.; Xiong, Z.; Cui, S. Learning Mutually Local-Global U-Nets For High-Resolution Retinal Lesion Segmentation In Fundus Images. In Proceedings of the 2019 IEEE 16th International Symposium on Biomedical Imaging (ISBI 2019), Venice, Italy, 8–11 April 2019; pp. 597–600. [Google Scholar] [CrossRef] [Green Version]
- Qiao, L.; Zhu, Y.; Zhou, H. Diabetic Retinopathy Detection Using Prognosis of Microaneurysm and Early Diagnosis System for Non-Proliferative Diabetic Retinopathy Based on Deep Learning Algorithms. IEEE Access 2020, 8, 104292–104302. [Google Scholar] [CrossRef]
- Xu, Y.; Zhou, Z.; Li, X.; Zhang, N.; Zhang, M.; Wei, P. FFU-Net: Feature Fusion U-Net for Lesion Segmentation of Diabetic Ret-inopathy. Biomed. Res. Int. 2021, 2021, 6644071. [Google Scholar] [PubMed]
- ElTanboly, A.H.; Palacio, A.; Shalaby, A.M.; Switala, A.E.; Helmy, O.; Schaal, S.; El-Baz, A. An automated approach for early detection of diabetic retinopathy using SD-OCT images. Front. Biosci. Elit. 2018, 10, 197–207. [Google Scholar]
- Sandhu, H.S.; Eltanboly, A.; Shalaby, A.; Keynton, R.S.; Schaal, S.; El-Baz, A. Automated diagnosis and grading of diabetic reti-nopathy using optical coherence tomography. Investig. Ophthalmol. Vis. Sci. 2018, 59, 3155–3160. [Google Scholar] [CrossRef] [PubMed] [Green Version]


| Dataset | No. of Image | Device Used | Access | Country | Year | No. of Subjects | Type | Format | Remarks |
|---|---|---|---|---|---|---|---|---|---|
| DRIVE [29] | 40 | Canon CR5 non-mydriatic 3CCD camera with a 45° FOV | OA | Netherlands | 2004 | 400 | Fundus | JPEG | Retinal vessel segmentation and ophthalmic diseases |
| DIARETDB0 [30] | 130 | 50° FOV DFC | OA | Finland | 2006 | NR | Fundus | PNG | DR detection and grading |
| DIARETDB1 [31] | 89 | 50° FOV DFC | OA | Finland | 2007 | NR | Fundus | PNG | DR detection and grading |
| National Taiwan University Hospital [32] | 30 | Heidelberg retina tomography with Rostock corneal module | OA | Japan | 2007–2017 | 30 | Fundus | TIFF | DR, pseudo exfoliation |
| HEI-MED [33] | 169 | Visucam PRO fundus camera (Zeiss, Germany) | OA | USA | 2010 | 910 | Fundus | JPEG | DR detection and grading |
| 19 CF [34] | 60 | NR | OA | Iran | 2012 | 60 | Fundus | JPEG | DR detection |
| FFA Photographs & CF [35] | 120 | NR | OA | Iran | 2012 | 60 | FFA | JPEG | DR grading and lesion detection |
| Fundus Images with Exudates [36] | 35 | NR | OA | Iran | 2012 | NR | Fundus | JPEG | Lesion detection |
| DRiDB [37] | 50 | Zeiss VISUCAM 200 DFC at a 45° FOV | AUR | Croatia | 2013 | NR | Fundus | BMP files | DR grading |
| eOphtha [38] | 463 | NR | OA | France | 2013 | NR | Fundus | JPEG | Lesion detection |
| Longitudinal DR screening data [27] | 1120 | Topcon TRC-NW65 with a 45 degrees field of view | OA | Netherlands | 2013 | 70 | Fundus | JPEG | DR grading |
| 22 HRF [39] | 45 | CF-60UVi camera (Canon) | OA | Germany and Czech Republic | 2013 | 45 | Fundus | JPEG | DR detection |
| RITE [40] | 40 | Canon CR5 non-mydriatic 3CCD camera with a 45° FOV | AUR | Netherlands | 2013 | Same As Drive | Fundus | TIFF | Retinal vessel segmentation and ophthalmic diseases |
| DR1 [41] | 1077 | TRC-50× mydriatic camera Topcon | OA | Brazil | 2014 | NR | Fundus | TIFF | DR detection |
| DR2 [41] | 520 | TRC-NW8 retinography (Topcon) with a D90 camera (Nikon, Japan) | OA | Brazil | 2014 | NR | Fundus | TIFF | DR detection |
| DRIMDB [42] | 216 | CF-60UVi fundus camera (Canon) | OA | Turkey | 2014 | NR | Fundus | JPEG | DR detection and grading |
| FFA Photographs [43] | 70 | NR | OA | Iran | 2014 | 70 | FFA | JPEG | DR grading and Lesion detection |
| MESSIDOR 1 [44] | 1200 | Topcon TRC NW6 non-mydriatic retinography, 45° FOV | OA | France | 2014 | NR | Fundus | TIFF | DR and DME grading |
| Lotus eyecare hospital [45] | 122 | Canon non-mydriatic Zeiss fundus camera 90° FOV | NOA | India | 2014 | NR | Fundus | JPEG | DR detection |
| Srinivasan [46] | 3231 | SD-OCT (Heidelberg Engineering, Germany) | OA | USA | 2014 | 45 | OCT | TIFF | DR detection and grading, DME, AMD |
| EyePACS [47] | 88,702 | Centervue DRS (Centervue, Italy), Optovue iCam (Optovue, USA), Canon CR1/DGi/CR2 (Canon), and Topcon NW (Topcon) | OA | USA | 2015 | NR | Fundus | JPEG | DR grading |
| Rabbani [48] | 24 images & 24 videos | Heidelberg SPECTRALIS OCT HRA system | OA | USA | 2015 | 24 | OCT | TIFF | Diabetic Eye diseases |
| DR HAGIS [49] | 39 | TRC-NW6s (Topcon), TRC-NW8 (Topcon), or CR-DGi fundus camera (Canon) | OA | UK | 2016 | 38 | Fundus | JPEG | DR, HT, AMD and Glaucoma |
| JICHI DR [50] | 9939 | AFC-230 fundus camera (Nidek) | OA | Japan | 2017 | 2740 | Fundus | JPEG | DR grading |
| Rotterdam Ophthalmic Data Repository DR [51] | 1120 | TRC-NW65 non-mydriatic DFC (Topcon) | OA | Netherlands | 2017 | 70 | Fundus | PNG | DR detection |
| Singapore National DR Screening Program [52] | 494,661 | NR | NOA | Singapore | 2017 | 14,880 | Fundus | JPEG | DR, Glaucoma and AMD |
| IDRID [53] | 516 | NR | OA | India | 2018 | NR | Fundus | JPEG | DR grading and lesion segmentation |
| OCTID [54] | 500+ | Cirrus HD-OCT machine (Carl Zeiss Mediatec) | OA | Multi ethnic | 2018 | NR | OCT | JPEG | DR, HT, AMD |
| UoA-DR [55] | 200 | Zeiss VISUCAM 500 Fundus Camera FOV 45° | AUR | India | 2018 | NR | Fundus | JPEG | DR grading |
| APTOS [56] | 5590 | DFC | OA | India | 2019 | NR | Fundus | PNG | DR grading |
| CSME [57] | 1445 | NIDEK non-mydriatic AFC-330 auto-fundus camera | NOA | Pakistan | 2019 | NR | Fundus | JPEG | DR grading |
| OCTAGON [58] | 213 | DRI OCT Triton (Topcon) | AUR | Spain | 2019 | 213 | OCTA | JPEG & TIFF | DR detection |
| ODIR-2019 [59] | 8000 | Fundus camera (Canon), Fundus camera (ZEISS), and Fundus camera (Kowa) | OA | China | 2019 | 5000 | Fundus | JPEG | DR, HT, AMD and Glaucoma |
| OIA-DDR [60] | 13,673 | NR | OA | China | 2019 | 9598 | NR | JPEG | DR grading and lesion segmentation |
| Zhongshan Hospital and First People’s Hospital [61] | 19,233 | Multiple colour fundus camera | NOA | China | 2019 | 5278 | Fundus | JPEG | DR grading and lesion segmentation |
| AGAR300 [62] | 300 | 45° FOV | OA | India | 2020 | 150 | Fundus | JPEG | DR grading and MA detection |
| Bahawal Victoria Hospital [57] | 2500 | Vision Star, 24.1 Megapixel Nikon D5200 camera | NOA | Pakistan | 2020 | 500 | Fundus | JPEG | DR grading |
| Retinal Lesions [63] | 1593 | Selected from EPACS dataset | AUR | China | 2020 | NR | Fundus | JPEG | DR grading and lesion segmentation |
| Dataset of fundus images for the study of DR [64] | 757 | Visucam 500 camera of the Zeiss brand | OA | Paraguay | 2021 | NR | Fundus | JPEG | DR grading |
| FGADR [60] | 2842 | NR | OA | UAE | 2021 | NR | Fundus | JPEG | DR and DME grading |
| Optos Dataset (Tsukazaki Hospital) [65] | 13,047 | 200 Tx ultra-wide-field device (Optos, UK) | NOA | Japan | NR | 5389 | Fundus | JPEG | DR, Glaucoma, AMD, and other eye diseases |
| MESSIDOR 2 [66] | 1748 | Topcon TRC NW6 non-mydriatic retinography 45° FOV | AUR | France | NR | 874 | Fundus | TIFF | DR and DME grading |
| Noor hospital [67] | 4142 | Heidelberg SPECTRALIS SD-OCT imaging system | NOA | Iran | NR | 148 | OCT | TIFF | DR detection |
| Author, Year | Dataset | Grading Details | Pre-Processing | Method | Accuracy | Sensitivity | Specificity | AUC |
|---|---|---|---|---|---|---|---|---|
| Abràmoff, 2016 [66] | MESSIDOR 2 | Detect RDR and vtDR | No | DCNN: IDx-DR X2.1. ML: RF | NA | 96.80% | 87.00% | 0.98 |
| Chandrakumar, 2016 [90] | EyePACS, DRIVE, STARE | Grade DR based on ICDR scale | Yes | DCNN | STARE and DRIVE: 94% | NA | NA | NA |
| Colas, 2016 [91] | EyePACS | Grade DR based on ICDR scale | No | DCNN | NA | 96.20% | 66.60% | 0.94 |
| Gulshan, 2016 [69] | EyePACS, MESSIDOR 2 | Detect DR based on ICDR scale, RDR and referable DME | Yes | DCNN | NA | EyePACS: 97.5% | EyePACS: 93.4% | EyePACS: 0.99 |
| Wong, 2016 [92] | EYEPACS, MESSIDOR 2 | Detect RDR, Referable DME (RDME) | No | DCNN | NA | 90% | 98% | 0.99 |
| Gargeya, 2017 [68] | EyePACS, MESSIDOR 2, eOphtha | Detect DR or non-DR | Yes | DCNN | NA | EyePACS: 94% | EyePACS: 98% | EyePACS: 0.97 |
| Somasundaram, 2017 [76] | DIARETDB1 | Detect PDR, NPDR | No | ML: t-SNE and ML-BEC | NA | NA | NA | NA |
| Takahashi, 2017 [50] | Jichi Medical University | Grade DR with the Davis grading scale (NPDR, severe DR, PDR) | No | DCNN: Modified GoogLeNet | 81% | NA | NA | NA |
| Ting, 2017 [52] | SiDRP | Detect RDR, vtDR, glaucoma, AMD | No | DCNN | NA | RDR: 90.5% vtDR: 100% | RDR: 91.6% vtDR: 91.1% | RDR: 0.93 vtDR: 0.95 |
| Quellec, 2017 [81] | EyePACS, eOphta, DIARETDB 1 | Grade DR based on ICDR | Yes | DCNN: L2-regularized o-O DCNN | NA | 94.60% | 77% | 0.955 |
| Wang, 2017 [93] | EyePACS, MESSIDOR 1 | Grade DR based on ICDR scale | Yes | Weakly supervised network to classify image and extract high resolution image patches containing a lesion | MESSIDOR 1: RDR: 91.1% | NA | NA | MESSIDOR 1: RDR: 0.957 |
| Benson, 2018 [94] | Vision Quest Biomedical database | Grade DR based on ICDR scale + scars detection | Yes | DCNN: Inception v3 | NA | 90% | 90% | 0.95. |
| Chakrabarty, 2018 [95] | High-Resolution Fundus (HRF) Images | Detect DR | Yes | DCNN | 91.67% | 100% | 100% | F1 score: 1 |
| Costa, 2018 [96] | MESSIDOR 1 | Grade DR based on ICDR scale | No | Multiple Instance Learning (MIL) | NA | NA | NA | 0.9 |
| Dai, 2018 [97] | DIARETDB1 | MA, HE, CWS, Ex detection | Yes | DCNN: Multi-sieving CNN(image to text mapping) | 96.10% | 87.80% | 99.70% | F1 score: 0.93 |
| Dutta, 2018 [98] | EyePACS | Mild NPDR, Moderate NPDR, Severe NPDR, PDR | Yes | DCNN: VGGNet | 86.30% | NA | NA | NA |
| Kwasigroch, 2018 [99] | EyePACS | Grade DR based on ICDR scale | Yes | DCNN: VGG D | 81.70% | 89.50% | 50.50% | NA |
| Levenkova, 2018 [78] | UWF (Ultra-Wide Field) | Detect CWS, MA, HE, Ex | No | DCNN, SVM | NA | NA | NA | 0.80 |
| Mansour, 2018 [72] | EyePACS | Grade DR based on ICDR scale | Yes | DCNN, ML: AlexNet, LDA, PCA, SVM, SIFT | 97.93% | 100% | 0.93 | NA |
| Rajalakshmi, 2018 [7] | Smartphone-based imaging device | Detect DR and vtDR Grade DR based on ICDR scale | No | DCNN | NA | DR: 95.8% vtDR: 99.1% | DR: 80.2% vtDR: 80.4% | NA |
| Robiul Islam, 2018 [100] | APTOS 2019 | Grade DR based on ICDR scale | Yes | DCNN: VGG16 | 91.32% | NA | NA | NA |
| Zhang, 2018 [101] | EyePACS | Grade DR based on ICDR scale | Yes | DCNN: Resnet-50 | NA | 61% | 84% | 0.83 |
| Zhang, 2018 [102] | EyePACS | Grade DR based on ICDR scale | No | DCNN | 82.10% | 76.10% | 0.855 | Kappa score: 0.66 |
| Arcadu, 2019 [103] | 7 FOV images of RIDE and RISE datasets | 2 step grading based on ETDRS | No | DCNN: Inception v3 | NA | 66% | 77% | 0.68 |
| Bellemo, 2019 [104] | Kitwe Central Hospital, Zambia | Grade DR based on ICDR scale | No | DCNN: Ensemble of Adapted VGGNet & Resenet | NA | RDR: 92.25% vtDR: 99.42% | RDR: 89.04% | RDR: 0.973 vt DR: 0.934 |
| Chowdhury, 2019 [105] | EyePACS | Grade DR based on ICDR scale | Yes | DCNN: Inception v3 | 2 Class: 61.3% | NA | NA | NA |
| Govindaraj, 2019 [106] | MESSIDOR 1 | Detect DR | Yes | Probabilistic Neural Network | 98% | Almost 90% from chart | Almost 97% from chart | F1 score: almost 0.97 |
| Gulshan, 2019 [107] | Aravind Eye Hospital and Sankara Nethralaya, India | Grade DR based on ICDR scale | No | DCNN | NA | Aravind: 88.9% SN: 92.1% | Aravind: 92.2% SN: 95.2% | Quadratic weighted K scores: Aravind: 0.85 SN: 0.91 |
| Hathwar, 2019 [108] | EyePACS, IDRID | Detect DR | Yes | DCNN: Xception-TL | NA | 94.30% | 95.50% | Kappa score: 0.88 |
| He, 2019 [109] | IDRID | Detect DR grade and DME risk | Yes | DCNN: AlexNet | DR grade: 65% | NA | NA | NA |
| Hua, 2019 [83] | Kyung Hee University Medical Center | Grade DR based on ICDR scale | No | DCNN: Tri-SDN | 90.60% | 96.50% | 82.10% | 0.88 |
| Jiang, 2019 [110] | Beijing Tongren Eye Center | DR or Non-DR | Yes | DCNN: Inception v3, Resnet152 and Inception-Resnet-v2 | Integrated model: 88.21% | Integrated model: 85.57% | Integrated model: 90.85% | 0.946 |
| Li, 2019 [111] | IDRID, MESSIDOR 1 | Grade DR based on ICDR scale | No | DCNN: Attention network based on ResNet50 | DR: 92.6%, DME: 91.2% | DR: 92.0%, DME: 70.8% | NA | DR: 0.96 DME: 0.92 |
| Li, 2019 [61] | Shanghai Zhongshan Hospital (SZH) and Shanghai First People’s Hospital (SFPH), China, MESSIDOR 2 | Grade DR based on ICDR scale | Yes | DCNN: Inception v3 | 93.49% | 96.93% | 93.45% | 0.9905 |
| Metan, 2019 [112] | EyePACS | Grade DR based on ICDR scale | Yes | DCNN: ResNet | 81% | NA | NA | NA |
| Nagasawa, 2019 [113] | Saneikai Tsukazaki Hospital and Tokushima University Hospital, Japan | Detect PDR | Yes | DCNN: VGG-16 | NA | PDR: 94.7% | PDR: 97.2% | PDR: 0.96 |
| Qummar, 2019 [114] | EyePACS | Grade DR based on ICDR scale | Yes | DCNN: Ensemble of (Resnet50, Inception v3, Xception, Dense121, Dense169) | 80.80% | 51.50% | 86.72% | F1 score: 0.53 |
| Ruamviboonsuk, 2019 [115] | Thailand national DR screening program dataset | Grade DR based on ICDR and detect RDME | No | DCNN | NA | DR: 96.8% | DR: 95.6% | DR: 0.98 |
| Sahlsten, 2019 [70] | Private dataset | Detect DR based on multiple grading systems, RDR and DME | Yes | DCNN: Inception-v3 | NA | 89.60% | 97.40% | 0.98 |
| Sayres, 2019 [82] | EyePACS | Grade DR based on ICDR | No | DCNN | 88.40% | 91.50% | 94.80% | NA |
| Sengupta, 2019 [116] | EyePACS, MESSIDOR 1 | Grade DR based on ICDR scale | Yes | DCNN: Inception-v3 | 90. 4% | 90% | 91.94% | NA |
| Ting, 2019 [117] | SiDRP, SiMES, SINDI, SCES, BES, AFEDS, CUHK, DMP Melb, with 2 FOV | Grade DR based on ICDR scale | Yes | DCNN | NA | NA | NA | Detect DR: 0.86 RDR: 0.96 |
| Zeng, 2019 [118] | EyePACS | Grade DR based on ICDR scale | Yes | DCNN: Inception v3 | NA | 82.2% | 70.7% | 0.95 |
| Ali, 2020 [57] | Bahawal Victoria Hospital, Pakistan. | Grade DR based on ICDR scale | Yes | ML: SMO, Lg, MLP, LMT, Lg employed on selected post-optimized hybrid feature datasets | MLP: 73.73% LMT: 73.00 SLg: 73.07 SMO: 68.60 Lg: 72.07% | NA | NA | MLP: 0.916 LMT: 0.919 SLg: 0.921 SMO: 0.878 Lg: 0.923 |
| Araujo, 2020 [119] | EyePACS, MESSIDOR 2, IDRID, DMR, SCREEN-DR, DR1, DRIMDB, HRF | Grade DR based on ICDR scale | Yes | DCNN | NA | NA | NA | Kappa score: EyePAC: 0.74 |
| Chetoui, 2020 [26] | EyePACS, MESSIDOR 1, 2, eOphta, UoA-DR from the University of Auckland research, IDRID, STARE, DIARETDB0, 1 | Grade DR based on ICDR scale | Yes | DCNN: Inception-ResNet v2 | 97.90% | 95.80% | 97.10% | 98.60% |
| Elswah, 2020 [74] | IDRID | Grade DR based on ICDR scale | Yes | DCNN: ResNet 50 + NN or SVM | NN: 88% SVM: 65% | NA | NA | NA |
| Gadekallu, 2020 [71] | DR Debrecen dataset collection of 20 features of MESSIDOR 1 | DR or Non-DR | Yes | DCNN ML: PCA + Firefly | 97% | 92% | 95% | NA |
| Gadekallu, 2020 [120] | DR Debrecen dataset | Detect DR | Yes | ML: PCA+ grey wolf optimization (GWO) + DNN | 97.30% | 91% | 97% | NA |
| Gayathri, 2020 [121] | MESSIDOR 1, EyePACS, DIARETDB0 | Grade DR based on ICDR scale | NA | Wavelet Transform, SVM, RF | MESSIDOR 1: 99.75% | MESSIDOR 1: 99.8% | MESSIDOR 1: 99.9% | NA |
| Jiang, 2020 [122] | MESSIDOR 1 | Image-wise label the presence of MA, HE, Ex, CWS | Yes | DCNN: ResNet 50 based | MA: 89.4% HE: 98.9% Ex: 92.8% CWS: 88.6% Normal: 94.2% | MA: 85.5% HE: 100% Ex: 93.3% CWS: 94.6% Normal: 93.9% | MA: 90.7% HE: 98.6% Ex: 92.7% CWS: 86.8% Normal: 94.4% | MA: 0.94 HE: 1 Ex: 0.97 CWS: 0.97 Normal: 0.98 |
| Lands, 2020 [123] | APTOS 2019, APTOS 2015 | Grade DR based on ICDR scale | Ye | DCNN: DensNet 169 | 93% | NA | NA | Kappa score: 0.8 |
| Ludwig, 2020 [10] | EyePACS, APTOS, MESSIDOR 2, EYEGO | Detect RDR | Yes | DCNN: DenseNet201 | NA | MESSIDOR 2: 87% | MESSIDOR 2: 80% | MESSIDOR 2: 0.92 |
| Majumder, 2020 [15] | EyePACS, APTOS 2019 | Grade DR based on ICDR scale | Yes | CNN | 88.50% | NA | NA | NA |
| Memari, 2020 [124] | MESSIDOR 1, HEI-MED | Detect DR | Yes | DCNN | NA | NA | NA | NA |
| Narayanan, 2020 [125] | APTOS 2019 | Detect and grade DR based on ICDR scale | Yes | DCNN: AlexNet, ResNe, VGG16, Inception v3 | 98.4% | NA | NA | 0.985 |
| Pao, 2020 [84] | EyePACS | Grade DR based on ICDR scale | Yes | CNN: bichannel customized CNN | 87.83% | 77.81% | 93.88% | 0.93 |
| Paradisa, 2020 [73] | DIARETDB 1 | Grade DR based on ICDR scale | Yes | ResNet-50 for extraction and SVM, RF, KNN, and XGBoost as classifiers | SVM: 99%, KNN: 100% | SVM: 99%, KNN: 100% | NA | NA |
| Patel, 2020 [126] | EyePACS | Grade DR based on ICDR scale | Yes | DCNN: MobileNet v2 | 91.29% | NA | NA | NA |
| Riaz, 2020 [80] | EyePACS, MESSIDOR 2 | NA | Yes | DCNN | NA | EyePACS: 94.0% | EyePACS: 97.0% | EyePAC: 0.98 |
| Samanta, 2020 [127] | EyePACS | Grade DR based on ICDR scale | Yes | DCNN: DenseNet121 based | 84.1% | NA | NA | NA |
| Serener, 2020 [128] | EyePACS, MESSIDOR 1, eOphta, HRF, IDRID | Grade DR based on ICDR scale | Yes | DCNN: ResNet 18 | Country: EyePACS: 65% Continent: EyePACS + HRF: 80% | Country: EyePACS: 17% Continent: EyePACS + HRF: 80% | Country: EyePACS: 89% Continent: EyePACS + HRF: 80% | NA |
| Shaban, 2020 [129] | APTOS | Grade DR to non-DR, moderate DR, and severe DR | Yes | DCNN | 88% | 87% | 94% | 0.95 |
| Shankar, 2020 [85] | MESSIDOR 1 | Grade DR based on ICDR scale | Yes | DCNN: Histogram-based segmentation + SDL | 99.28% | 98.54% | 99.38% | NA |
| Singh, 2020 [130] | IDRID, MESSIDOR 1 | Grade DME in 3 levels | Yes | DCNN: Hierarchical Ensemble of CNNs (HE-CNN) | 96.12% | 96.32% | 95.84% | F1 score: 0.96 |
| Thota, 2020 [131] | EyePACS | NA | Yes | DCNN: VGG16 | 74% | 80.0% | 65.0% | 0.80 |
| Wang, 2020 [132] | 2 Eye hospitals, DIARETDB1, EyePACS, IDRID | MA, HE, EX | Yes | DCNN | MA: 99.7% HE: 98.4% EX: 98.1% Grading: 91.79% | Grading: 80.58% | Grading: 95.77% | Grading: 0.93 |
| Wang, 2020 [133] | Shenzhen, Guangdong, China | Grade DR severity based on ICDR scale and detect MA, IHE, SRH, HE, CWS, VAN, IRMA, NVE, NVD, PFP, VPH, TRD | No | DCNN: Multi-task network using channel-based attention blocks | NA | NA | NA | Kappa score: Grading: 0.80 DR feature: 0.64 |
| Zhang, 2020 [134] | 3 Hospitals in China | Classify to retinal tear & retinal detachment, DR and pathological myopia | Yes | DCNN: InceptionResNetv2 | 93.73% | 91.22% | 96.19% | F1 score: 0.93 |
| Abdelmaksoud, 2021 [135] | EyePACS, MESSIDOR 1, eOphta, CHASEDB 1, HRF, IDRID, STARE, DIARETDB0, 1 | Yes | U-Net + SVM | 95.10% | 86.10% | 86.80% | 0.91 | |
| Bora, 2021 [115] | EyePACS | Grade DR based on ICDR scale | No | DCNN: Inception v3 | NA | NA | NA | Three FOV: 0·79 One FOV: 0·70 |
| Gangwar, 2021 [136] | APTOS 2019, MESSIDOR 1 | Grade DR based on ICDR scale | Yes | DCNN: Inception ResNet v2 | APTOS:82.18%MESSIDOR 1: 72.33% | NA | NA | NA |
| He, 2021 [137] | DDR, MESSIDOR 1, EyePACS | Grade DR based on ICDR scale | No | DCNN: MobileNet 1 with attention blocks | MESSIDOR 1: 92.1% | MESSIDOR 1: 89.2% | MESSIDOR 1: 91% | F1 score: MESSIDOR 1: 0.89 |
| Hsieh, 2021 [32] | National Taiwan University Hospital (NTUH), Taiwan, EyePACS | Detect any DR, RDR and PDR | Yes | DCNN: Inception v4 for any DR and RDR and ResNet for PDR | Detect DR: 90.7% RDR: 90.0% PDR: 99.1% | Detect DR: 92.2% RDR: 99.2% PDR: 90.9% | Detect DR: 89.5% RDR: 90.1% PDR: 99.3% | 0.955 |
| Khan, 2021 [138] | EyePACS | Grade DR based on ICDR scale | Yes | DCNN: customized highly nonlinear scale-invariant network | 85% | 55.6% | 91.0% | F1 score: 0.59 |
| Oh, 2021 [2] | 7 FOV fundus images of Catholic Kwandong University, South Korea | Detect DR | Yes | DCNN: ResNet 34 | 83.38% | 83.38% | 83.41% | 0.915 |
| Saeed, 2021 [139] | MESSIDOR, EyePACS | Grade DR based on ICDR scale | No | DCNN: ResNet GB | EyePACS: 99.73% | EyePACS: 96.04% | EyePACS: 99.81% | EyePACS: 0.98 |
| Wang, 2021 [140] | EyePACS, images from Peking Union Medical College Hospital, China | Detect RDR with lesion-based segmentation of PHE, VHE, NV, CWS, FIP, IHE, IRMA and MA, then staging based on ICDR scale | No | DCNN: Inception v3 | NA | EyePACS: 90.60% | EyePACS: 80.70% | EyePACS: 0.943 |
| Wang. 2021 [141] | MESSIDOR 1 | Grade DR based on ICDR scale | Yes | DCNN: Multichannel-based GAN with semi super- vision | RDR: 93.2%, DR Grading: 84.23% | RDR: 92.6% | RDR: 91.5% | RDR: 0.96 |
| Author, Year | Dataset | Pre-Processing Technique | Method | Accuracy |
|---|---|---|---|---|
| Datta, 2016 [142] | DRIVE, STARE, DIARETDB0, DIARETDB1 | Yes, Contrast optimization | Image processing | NA |
| Lin, 2018 [143] | EyePACS | Yes, Convert to entropy images | DCNN | Original image: 81.8% Entropy images: 86.1% |
| Mukhopadhyay, 2018 [144] | Prasad Eye Institute, India | Yes, Local binary patterns | ML: Decision tree, KNN | KNN: 69.8% |
| Pour, 2020 [145] | MESSIDOR 1, 2, IDRID | Yes, CLAHE | DCNN: EfficientNet-B5 | NA |
| Ramchandre, 2020 [146] | APTOS 2019 | Yes, Image augmentation with AUGMIX | DCNN: EfficientNetb3, SEResNeXt32x4d | EfficientNetb3: 91.4% SEResNeXt32x4d: 85.2% |
| Shankar, 2020 [85] | MESSIDOR 1 | Yes, CLAHE | DCNN: Hyperparameter Tuning Inception-v4 (HPTI-v4) | 99.5% |
| Bhardwaj, 2021 [147] | DRIVE, STARE, MESSIDOR 1, DIARETDB1, IDRID, ROC | Yes, Image contrast enhancement and OD localization | DCNN: InceptionResNet v2 | 93.3% |
| Bilal, 2021 [16] | IDRID | Yes, Adaptive histogram equalization and contrast stretching | ML: SVM + KNN + Binary Tree | 98.1% |
| Elloumi, 2021 [148] | DIARETDB1 | Yes, Optic disc location, fundus image partitioning | ML: SVM, RF, KNN | 98.4% |
| Author, Year | Dataset | Grading Details | Preprocessing | Method | Accuracy | Sensitivity | Specificity | AUC |
|---|---|---|---|---|---|---|---|---|
| Eladawi, 2018 [149] | OCTA images, University of Louisville, USA | Detect DR | Yes | ML: Vessel segmentation, Local feature extraction, SVM | 97.3% | 97.9% | 96.4% | 0.97 |
| Islam, 2019 [150] | Kermani OCT dataset | NA | Yes | DCNN: DenseNet 201 | 98.6% | 0.986 | 0.995 | NA |
| Le, 2020 [151] | Private OCTA dataset | Grade DR | No | DCNN: VGG16 | 87.3% | 83.8% | 90.8% | 0.97 |
| Sandhu, 2020 [75] | OCT. OCTA, clinical and demographical data, University of Louisville Clinical Center, USA | Detect mild and moderate DR | Yes | ML: RF | 96.0% | 100.0% | 94.0% | 0.96 |
| Liu, 2021 [77] | Private OCTA dataset | Detect DR | Yes | Logistic Regression (LR), LR regularized with the elastic net (LR-EN), SVM and XGBoost | LR-EN: 80.0% | LR-EN: 82.0% | LR-EN: 84.0% | LR-EN: 0.83 |
| Author, Year | Dataset | Considered Lesions | Preprocessing | Segmentation Method | Sensitivity/Specificity | AUC |
|---|---|---|---|---|---|---|
| Imani, 2016 [157] | DIARETDB1, HEI-MED, eOphta | Ex | Yes | Dynamic decision thresholding, morphological feature extraction, smooth edge removal | 89.01%/99.93% | 0.961 |
| Shah, 2016 [154] | ROC | MA | Yes | Curvelet transform and rule-based classifier | 48.2%/NA | NA |
| Quellec, 2017 [81] | EyePACS, eOphta, DIARETDB1 | CWS, Ex, HE, MA | Yes | DCNN: o-O solution | DIARETDB1: CWS: 62.4%/NA Ex: 55.2%/NA HE: 44.9%/NA MA: 31.6%/NA | EyePACS: 0.955 |
| Huang, 2018 [155] | MESSIDOR 1, DIARETDB0, 1 | NV | Yes | ELM | NA/NA | ACC: 89.2% |
| Kaur, 2018 [156] | STARE, eOphta, MESSIDOR 1, DIARETDB1, private dataset | Ex, CWS | Yes | Dynamic decision thresholding | 94.8%/99.80% | ACC: 98.43% |
| Lam, 2018 [160] | EyePACS, eOphta | Ex, MA, HE, NV | NA | DCNN: AlexNet, VGG16, GoogLeNet, ResNet, and Inception-v3 | NA/NA | EyePACS: 0.99 ACC: 98.0% |
| Benzamin, 2018 [161] | IDRID | Ex | Yes | DCNN | 98.29%/41.35% | ACC: 96.6% |
| Orlando, 2018 [162] | eOphtha, DIARETDB1, MESSIDOR 1 | MA, HE | Yes | ML: RF | NA/NA | 0.93 |
| Eftekhari, 2019 [163] | ROC, eOphta | MA | Yes | DCNN: Two level CNN, thresholded probability map | NA/NA | ROC: 0.660 |
| Wu, 2019 [164] | HRF | Blood vessels, optic disc and other regions | Yes | DCNN: AlexNet, GoogleNet, Resnet50, VGG19 | NA/NA | AlexNet: 0.94 ACC: 95.45% |
| Yan, 2019 [165] | IDRID | Ex, MA, HE, CWS | Yes | DCNN: Global and local Unet | NA/NA | Ex: 0.889 MA: 0.525 HE: 0.703 CWS: 0.679 |
| Qiao, 2020 [166] | IDRID | MA | Yes | DCNN | 98.4%/97.10% | ACC: 97.8% |
| Wang, 2021 [141] | EyePACS, images from Peking Union Medical College Hospital | Detect RDR with lesion-based segmentation of PHE, VHE, NV, CWS, FIP, IHE, Ex, MA | No | DCNN: Inception v3 and FCN 32s | PHE: 60.7%/90.9% Ex: 49.5%/87.4% VHE: 28.3%/84.6% NV: 36.3%/83.7% CWS: 57.3%/80.1% FIP: 8.7%/78.0% IHE: 79.8%/57.7% MA: 16.4%/49.8% | NA |
| Wei, 2021 [63] | EyePACS | MA, IHE, VHE, PHE, Ex, CWS, FIP, NV | Yes | DCNN: Transfer learning from Inception v3 | NA/NA | NA |
| Xu, 2021 [167] | IDRID | Ex, MA, HE, CWS | Yes | DCNN: Enhanced Unet named FFUnet | Ex: 87.55%/NA MA: 59.33%/NA HE: 73.42%/NA CWS: 79.33%/NA | IOU: Ex:0.84 MA: 0.56 HE: 0.73 CWS: 0.75 |
| Author, Year | Dataset | Considered Lesions | Pre-Processing | Segmentation Method | Sensitivity | Specificity | AUC |
|---|---|---|---|---|---|---|---|
| Guo, 2018 [159] | UW-OCTA private dataset | Avascular area | Yes | DCNN | Control: 100.0% Diabetes without DR: 99.0% Mild to moderate DR: 99.0% Severe DR: 100.0% | Control: 84.0% Diabetes without DR: 77.0% Mild to moderate DR: 85.0% Severe DR: 68.0% | ACC:Control: 89.0% Diabetes without DR: 79% Mild to moderate DR: 87% Severe DR: 76.0% |
| ElTanboly, 2018 [168] | OCT and OCTA images of University of Louisville | 12 different retinal layers & segmented OCTA plexuses | No | SVM | NA | NA | ACC: 97.0% |
| ElTanboly, 2018 [168] | SD-OCT images of KentuckyLions Eye Center | 12 distinct retinal layers | Yes | Statistical analysis and extraction of features such as tortuosity, reflectivity, and thickness for 12 retinal layers | NA | NA | ACC: 73.2% |
| Sandhu, 2018 [169] | OCT images of University of Louisville, USA | 12 layers; quantifies the reflectivity, curvature, and thickness | Yes | DCNN: 2 Stage deep CNN | 92.5% | 95.0% | ACC: 93.8% |
| Holmberg, 2020 [158] | OCT from Helmholtz Zentrum München, Fundus from EyePACS | Segment retinal thickness map, Grade DR based on ICDR scale | No | DCNN: On OCT: Retinal layer segmentation with Unet On fundus: Self supervised learning, ResNet50 | NA | NA | IOU: on OCT: 0.94 |
Publisher’s Note: MDPI stays neutral with regard to jurisdictional claims in published maps and institutional affiliations. |
© 2021 by the authors. Licensee MDPI, Basel, Switzerland. This article is an open access article distributed under the terms and conditions of the Creative Commons Attribution (CC BY) license (https://creativecommons.org/licenses/by/4.0/).
Share and Cite
Lakshminarayanan, V.; Kheradfallah, H.; Sarkar, A.; Jothi Balaji, J. Automated Detection and Diagnosis of Diabetic Retinopathy: A Comprehensive Survey. J. Imaging 2021, 7, 165. https://0-doi-org.brum.beds.ac.uk/10.3390/jimaging7090165
Lakshminarayanan V, Kheradfallah H, Sarkar A, Jothi Balaji J. Automated Detection and Diagnosis of Diabetic Retinopathy: A Comprehensive Survey. Journal of Imaging. 2021; 7(9):165. https://0-doi-org.brum.beds.ac.uk/10.3390/jimaging7090165
Chicago/Turabian StyleLakshminarayanan, Vasudevan, Hoda Kheradfallah, Arya Sarkar, and Janarthanam Jothi Balaji. 2021. "Automated Detection and Diagnosis of Diabetic Retinopathy: A Comprehensive Survey" Journal of Imaging 7, no. 9: 165. https://0-doi-org.brum.beds.ac.uk/10.3390/jimaging7090165