Reconstruction of a Rollover Crash for Thoracic Injury Etiology Investigation


Transport and Road Safety (TARS), University of New South Wales, Old Main Building (K15), Sydney, NSW 2052, Australia
*
Author to whom correspondence should be addressed.
Safety 2017, 3(4), 27; https://0-doi-org.brum.beds.ac.uk/10.3390/safety3040027
Submission received: 4 May 2017
/
Revised: 6 October 2017
/
Accepted: 17 November 2017
/
Published: 22 November 2017
Abstract
:The cause of serious and fatal thoracic injuries in passenger vehicle rollover crashes is currently not well understood. Previous research on thoracic injuries resulting from rollover crashes have focused primarily on statistical analysis of crash data. This study seeks to develop a better understanding of where in the rollover sequence thoracic injuries may occur. To do this, a real-world passenger vehicle rollover crash where the driver sustained serious bilateral thoracic injuries was reconstructed. Multi-body analysis was used to determine the vehicle’s pre-trip trajectory and to obtain the vehicle’s position and kinematics at the point of trip. This information was then used to prescribe the motion of the vehicle in a finite element analysis. A finite element model of the EuroSID-2re anthropomorphic test device was placed in the driver’s seat. Four simulations, each with the anthropomorphic test device positioned in different postures, were performed. Rib deflection, spinal acceleration, and thoracic impact velocity were obtained from the anthropomorphic test device and compared to existing thoracic injury assessment reference values. From the analysis, lateral thoracic impact velocity indicates that a serious thoracic injury is likely to have occurred when the driver impacted the centre console during the vehicle’s fourth quarter-turn.
1. Introduction
Rollover crashes occur infrequently; however, when they do, they are more likely to result in a fatality than frontal, rear, or side impact crashes [1,2]. When a rollover occurs the head, spine, and thorax are the three most commonly injured body regions [3,4,5,6]. Of these three body regions, injury to the thorax is the least well researched.
Previous research on thoracic injuries resulting from rollover crashes have focused on statistical analysis of existing crash data [1,7,8] with limited studies conducted with computer simulations [9]. The statistical studies have identified the most common thoracic organ injured and sources of thoracic injury in rollover crashes. However, the etiology of thoracic injuries in rollover crashes is still not well understood [8].
The objective of this study is to reconstruct a real-world rollover crash in order to develop a better understanding of the etiology of thoracic injuries in a rollover crash. Specifically, the study focussed on developing an understanding of the occupant’s kinematics during a rollover that may result in an occupant sustaining an AIS3+ (Abbreviated Injury Scale score >3) thoracic injury. To achieve this objective, computer reconstruction and analysis was performed of a rollover crash involving a 1996 Ford Explorer Sports Utility Vehicle (SUV) where the driver sustained multiple AIS3+ thoracic injuries that was selected from the United States of America’s (USA) National Automotive Sampling System (NASS) Crashworthiness Data System (CDS).
2. Method
2.1. Selection of Rollover Crash
NASS-CDS data from 2001 to 2012, inclusive, was obtained and queried in SAS Enterprise Guide 5.1 [10] with the following filters: a single-vehicle tripped rollover crash with four or less quarter-turns occurred where the front seated occupants were sixteen years or older; occupants were restrained and contained in the vehicle; the vehicle did not contact another object prior to, during or after rolling over; no airbags were deployed; and the occupant sustained at least one serious thoracic injury as measured by the Abbreviated Injury Scale (AIS). Rollover crashes were limited to rollovers where a vehicle underwent four or less quarter-turns to allow easier identification of where in the rollover phase a thoracic injury may have occurred. The vehicles considered in this study were second (1995–2001) and third (2002–2005) generation models of the Sports Utility Vehicle (SUV).
From a thoracic injury perspective, it was preferable that a serious (i.e., AIS3+) thoracic injury was attributed to the door interior as it has been identified as one of the most frequently cited sources of thoracic injury for rollover crashes for far-side rollovers. However, no cases suitable for modelling were found where an AIS3+ thoracic injury was attributed to the door interior. As such, this criterion was extended to include AIS3+ thoracic injuries, which were attributed to other frequently cited sources of injuries, such as the seatbelt and center console [8,11].
2.2. Rollover Crash Case Description
The NASS-CDS case selected for reconstruction in this study is Case Number 2006-41-176. The vehicle involved in the rollover crash was a 1996 second generation three-door Ford Explorer, which, according to the NASS-CDS case report, underwent four quarter-turns over an estimated 10 m distance. It is noted that this case was selected as it was the only case that satisfied the aforementioned filtering criteria where clear photos of the vehicle and crash scene were available to facilitate the crash and crash scene reconstruction.
Three occupants were seated in the vehicle: one in the driver’s seat, one in the front passenger’s seat, and one in the second row right seat. Only the driver, a male who was 38 years at the time of the crash with unspecified height and weight, was documented to have sustained injuries from the crash (Table 1). It is noted that the driver’s AIS3+ injuries pertain only to the thorax (Table 2).
2.3. Crash Modelling
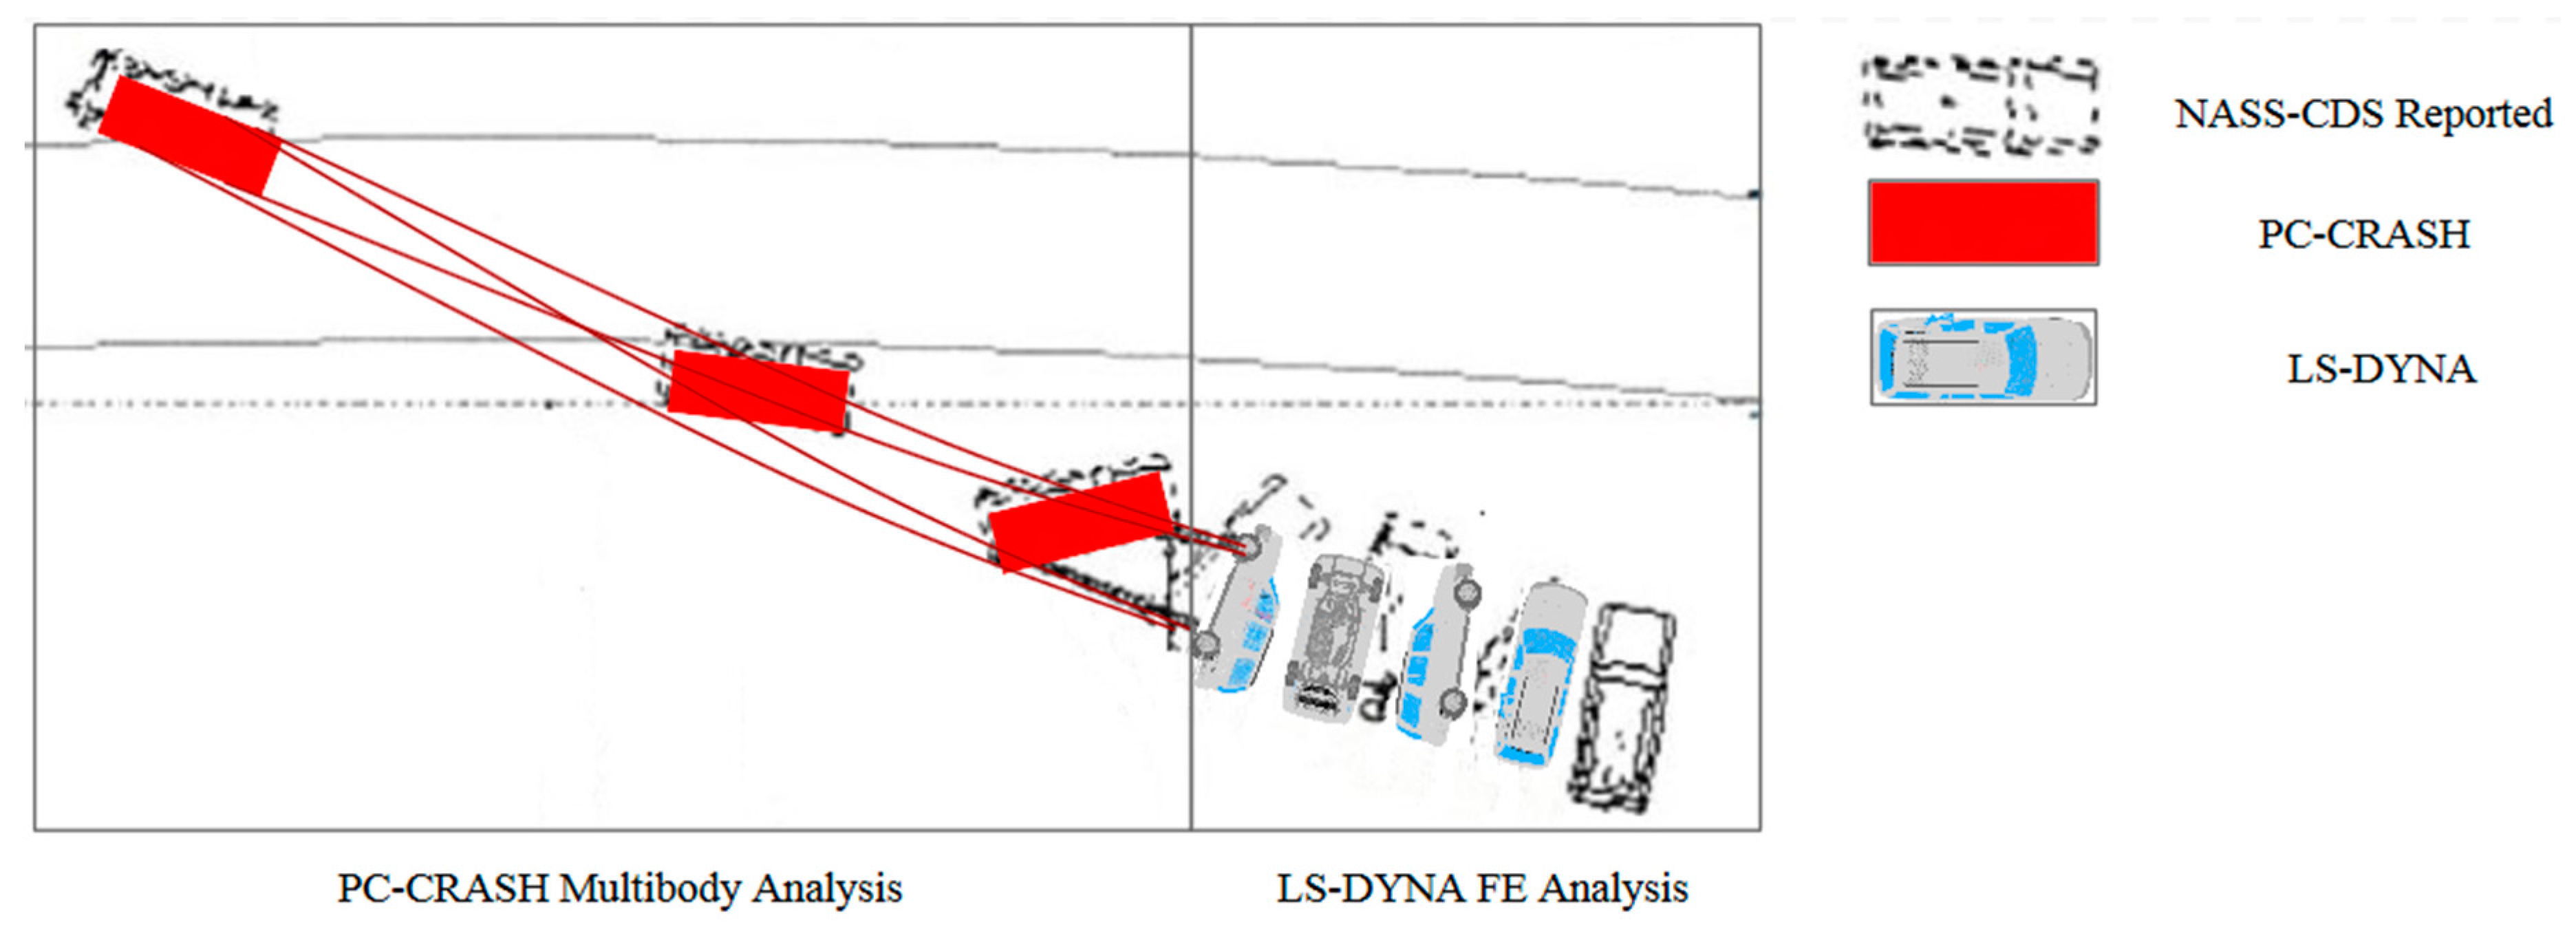
A combined computer modelling approach was performed to reconstruct the rollover crash. PC-CRASH [12], a multi-body three-dimensional dynamic trajectory model, was used to model the vehicle’s trajectory from a point upstream of the vehicle’s trip location to the point where the vehicle came to a stop (Figure 1). The reconstruction in PC-CRASH was guided by commonly used reconstruction techniques and vehicle characteristics during rollover crashes [13,14,15,16,17,18,19]. Scene diagrams, scene photographs, and roadway design guidelines [20] were used to reconstruct the road geometry where the rollover occurred. Vehicle dimensions, inertial properties, and suspension properties were obtained from existing literature [21,22]. Vehicle tyre properties were obtained from published data and applied to the simulation via the easy tyre model option in PC-CRASH [23,24]. The vehicle model was then located upstream of tyre marks and an initial velocity was applied based on the NASS-CDS reported vehicle travel speed of 72 km/h, the reported rollover distance of 10 m and four quarter-turns the vehicle underwent during the rollover phase, and the effective deceleration rates [14,15,25]. Steering and acceleration input was then applied based on the reported vehicle trajectory, and this was guided by available literature on realistic driver response [18,26,27,28]. Friction polygons were used to define friction between the vehicle and the ground during the rollover phase as guided by existing literature [18,23,25,29]. The aforementioned parameters were adjusted until the vehicle’s trajectory from the loss of control to the vehicle coming to rest matched the yaw marks, point of trip, quarter-turns, and rollover distance as documented in the NASS-CDS case report as closely as possible.
In the second part of the crash modelling (Figure 1), an FE simulation was performed with LS-DYNA. An FE model of the third generation SUV is publically available and was validated against full-scale front and side impact tests as well as quasi-static roof strength tests [30,31]. This model was previously modified to match the roof strength of the second generation SUV [6], which was then used in this study. Three ballasts of 75 kg were added to represent the mass of each occupant in their seated positions. This mass is similar to that of anthropomorphic test devices (ATDs) above the 50th percentile. This combined approach of using PC-CRASH and LS-DYNA to reconstruct a vehicle rollover takes advantage of the strengths of each model. That is, PC-CRASH is able to accurately model the vehicle’s trajectory with low computational time, and LS-DYNA is able to more accurately calculate the vehicle’s and occupant’s kinematics but with significantly greater computational time [6].
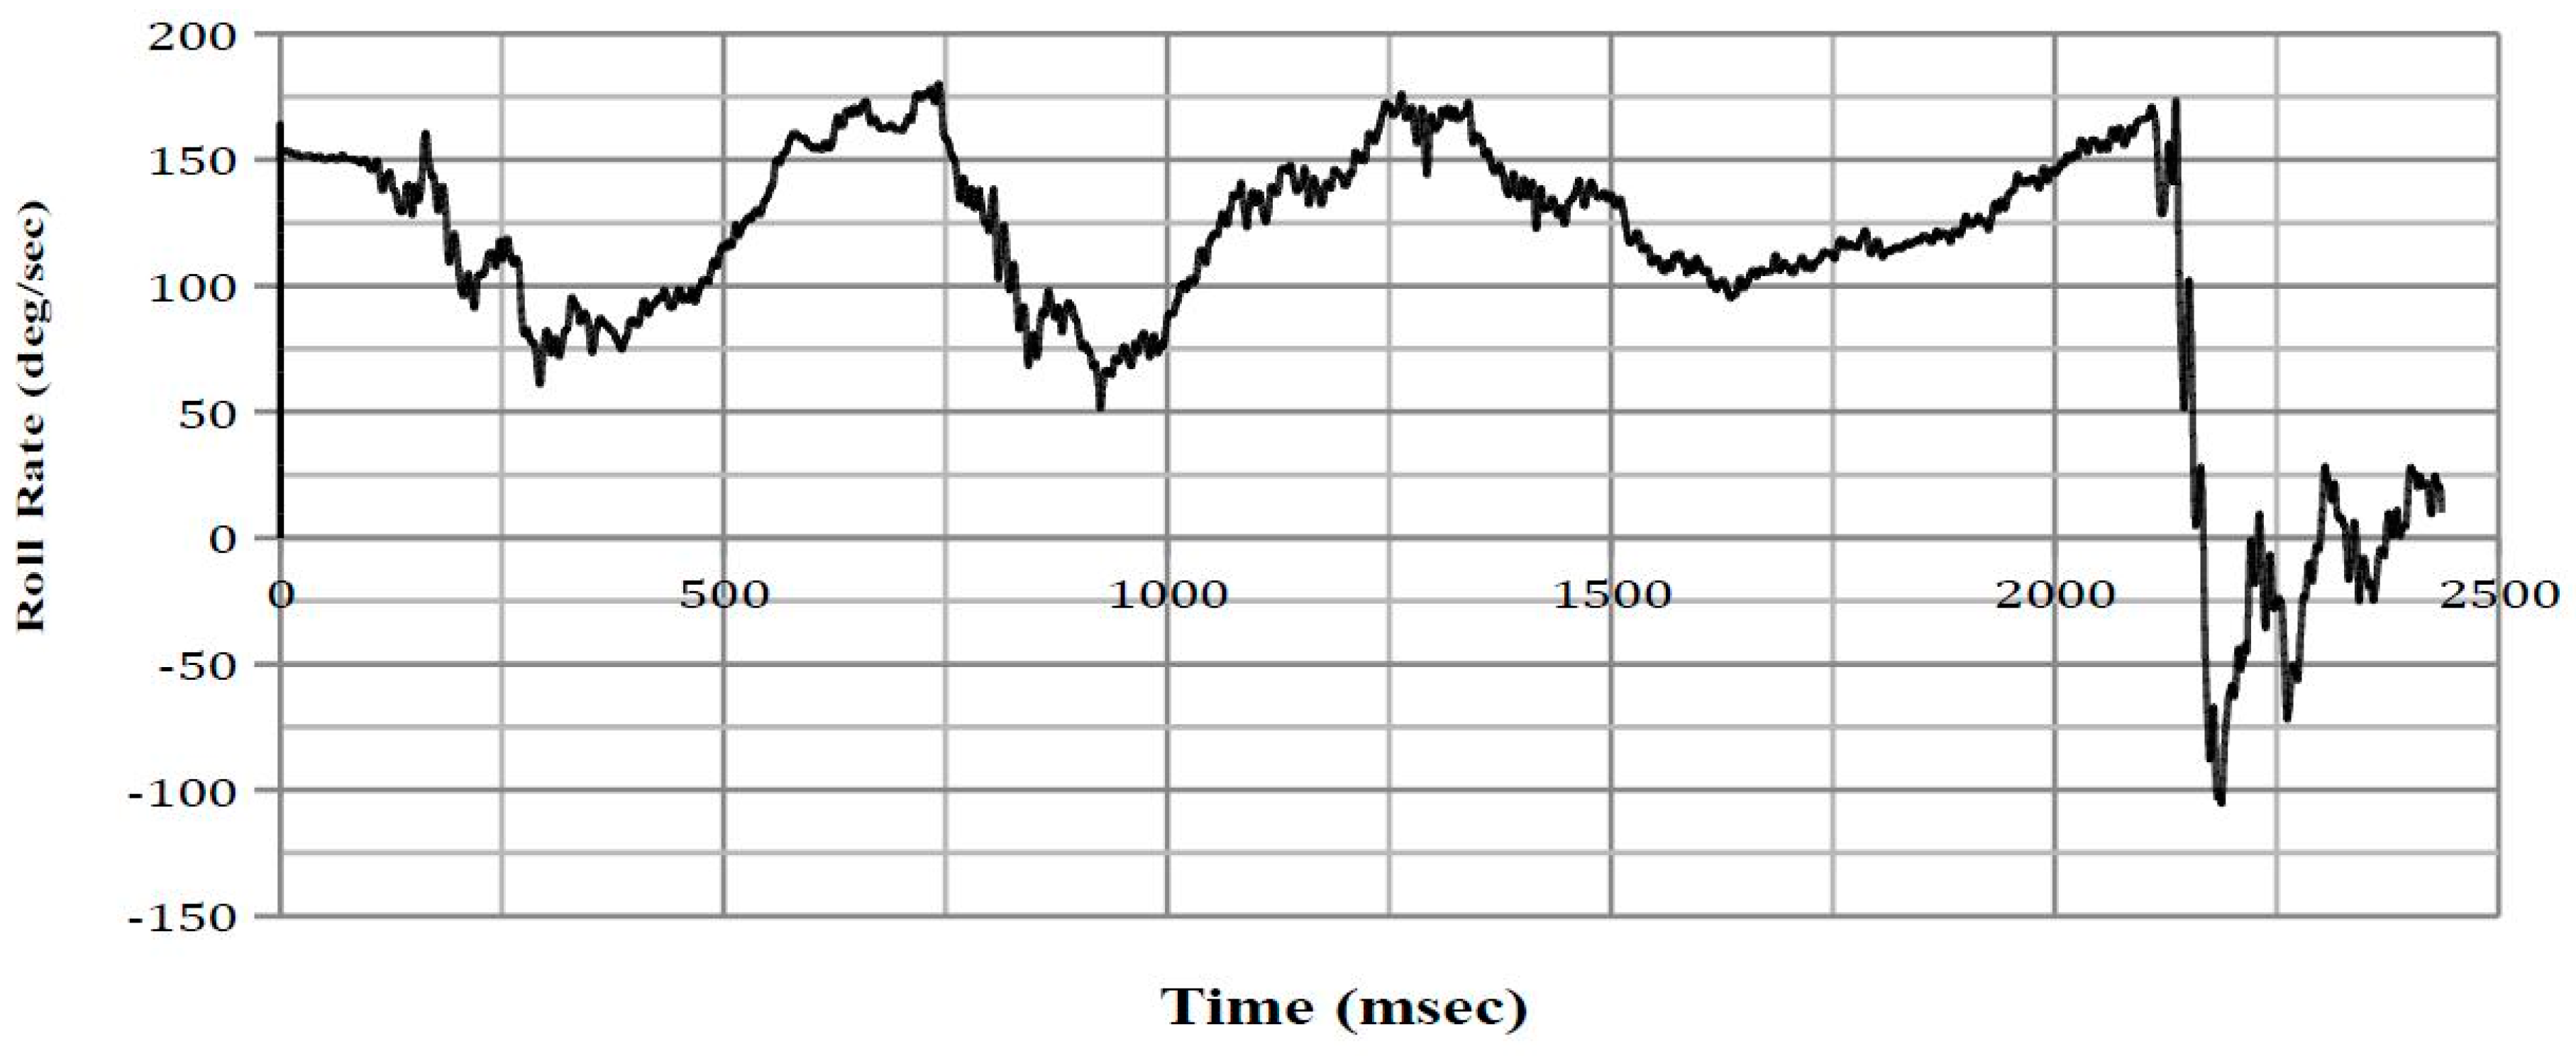
The vehicle kinematics at the point of trip from PC-CRASH was used to define the initial conditions of the FE simulation of the rollover event. For the purpose of this study, the point of trip was defined as the point where the vehicle had rotated by ninety degrees about its longitudinal axis. A global system was defined with the positive x-, y- and z-axis’ pointing east, north, and up, respectively. The vehicle’s local coordinate system followed the Society of Automotive Engineer (SAE) standard definition with the positive x-axis pointing forward of the vehicle along the longitudinal axis, the positive y-axis pointing to the right of the vehicle along the transverse axis, and the positive z-axis pointing downwards of the vehicle along the vertical axis of the vehicle [32]. It is also noted that the vehicle’s linear velocity and roll rate was filtered with SAE Channel Filter Class (CFC) 60 [32,33]. The vehicle’s kinematics at the point of trip is presented in Table 3.
The reconstructed rollover was assessed for accuracy qualitatively and quantitatively. Quantitative assessments were performed by comparing vehicle intrusion and rollover distance to the values documented in the NASS-CDS case report. A qualitative assessment was performed by comparing FE vehicle damage to the photos of the actual vehicle in the NASS-CDS case report.
2.4. Anthropometric Test Device Selection
One of the main criteria in the selection of an appropriate FE ATD was its capability of measuring lateral thoracic injury as the driver in the case sustained AIS3+ bilateral thoracic injuries attributed to the seatbelt. The ATDs considered were the USSID, EuroSID-2, EuroSID-2re, and WorldSID. The EuroSID-2re is currently used in the United States (US) side impact tests due to its improved biofidelity compared to the USSID ATD [34,35] and has improved response and is more sensitive to oblique impact tests compared to the EuroSID-2 [36]. Although the WorldSID has been shown to be more biofidelic than the EuroSID-2re [37,38] it does not have as an extensive injury criteria and associated injury risk curves for lateral thoracic impacts as the EuroSID-2re [39]. As such, the EuroSID-2re [40] ATD was selected for use in this study.
It is noted that the NASS-CDS case reported that the driver’s bilateral thoracic injuries were attributed to the seatbelt. From a review of currently available literature, no side impact ATDs have been designed to measure lateral thoracic injury due to seatbelt contact. Thus, it is plausible that the EuroSID-2re may not measure injurious lateral thoracic loads from the seatbelt. However, it is noted that the NASS-CDS case report states that the seatbelt was a “possible” rather than “certain” cause of the driver’s bilateral thoracic injuries. As such, these injuries may have resulted from impact with other vehicle interior components such as the door interior or centre console.
2.5. Anthropomorphic Test Device Positioning
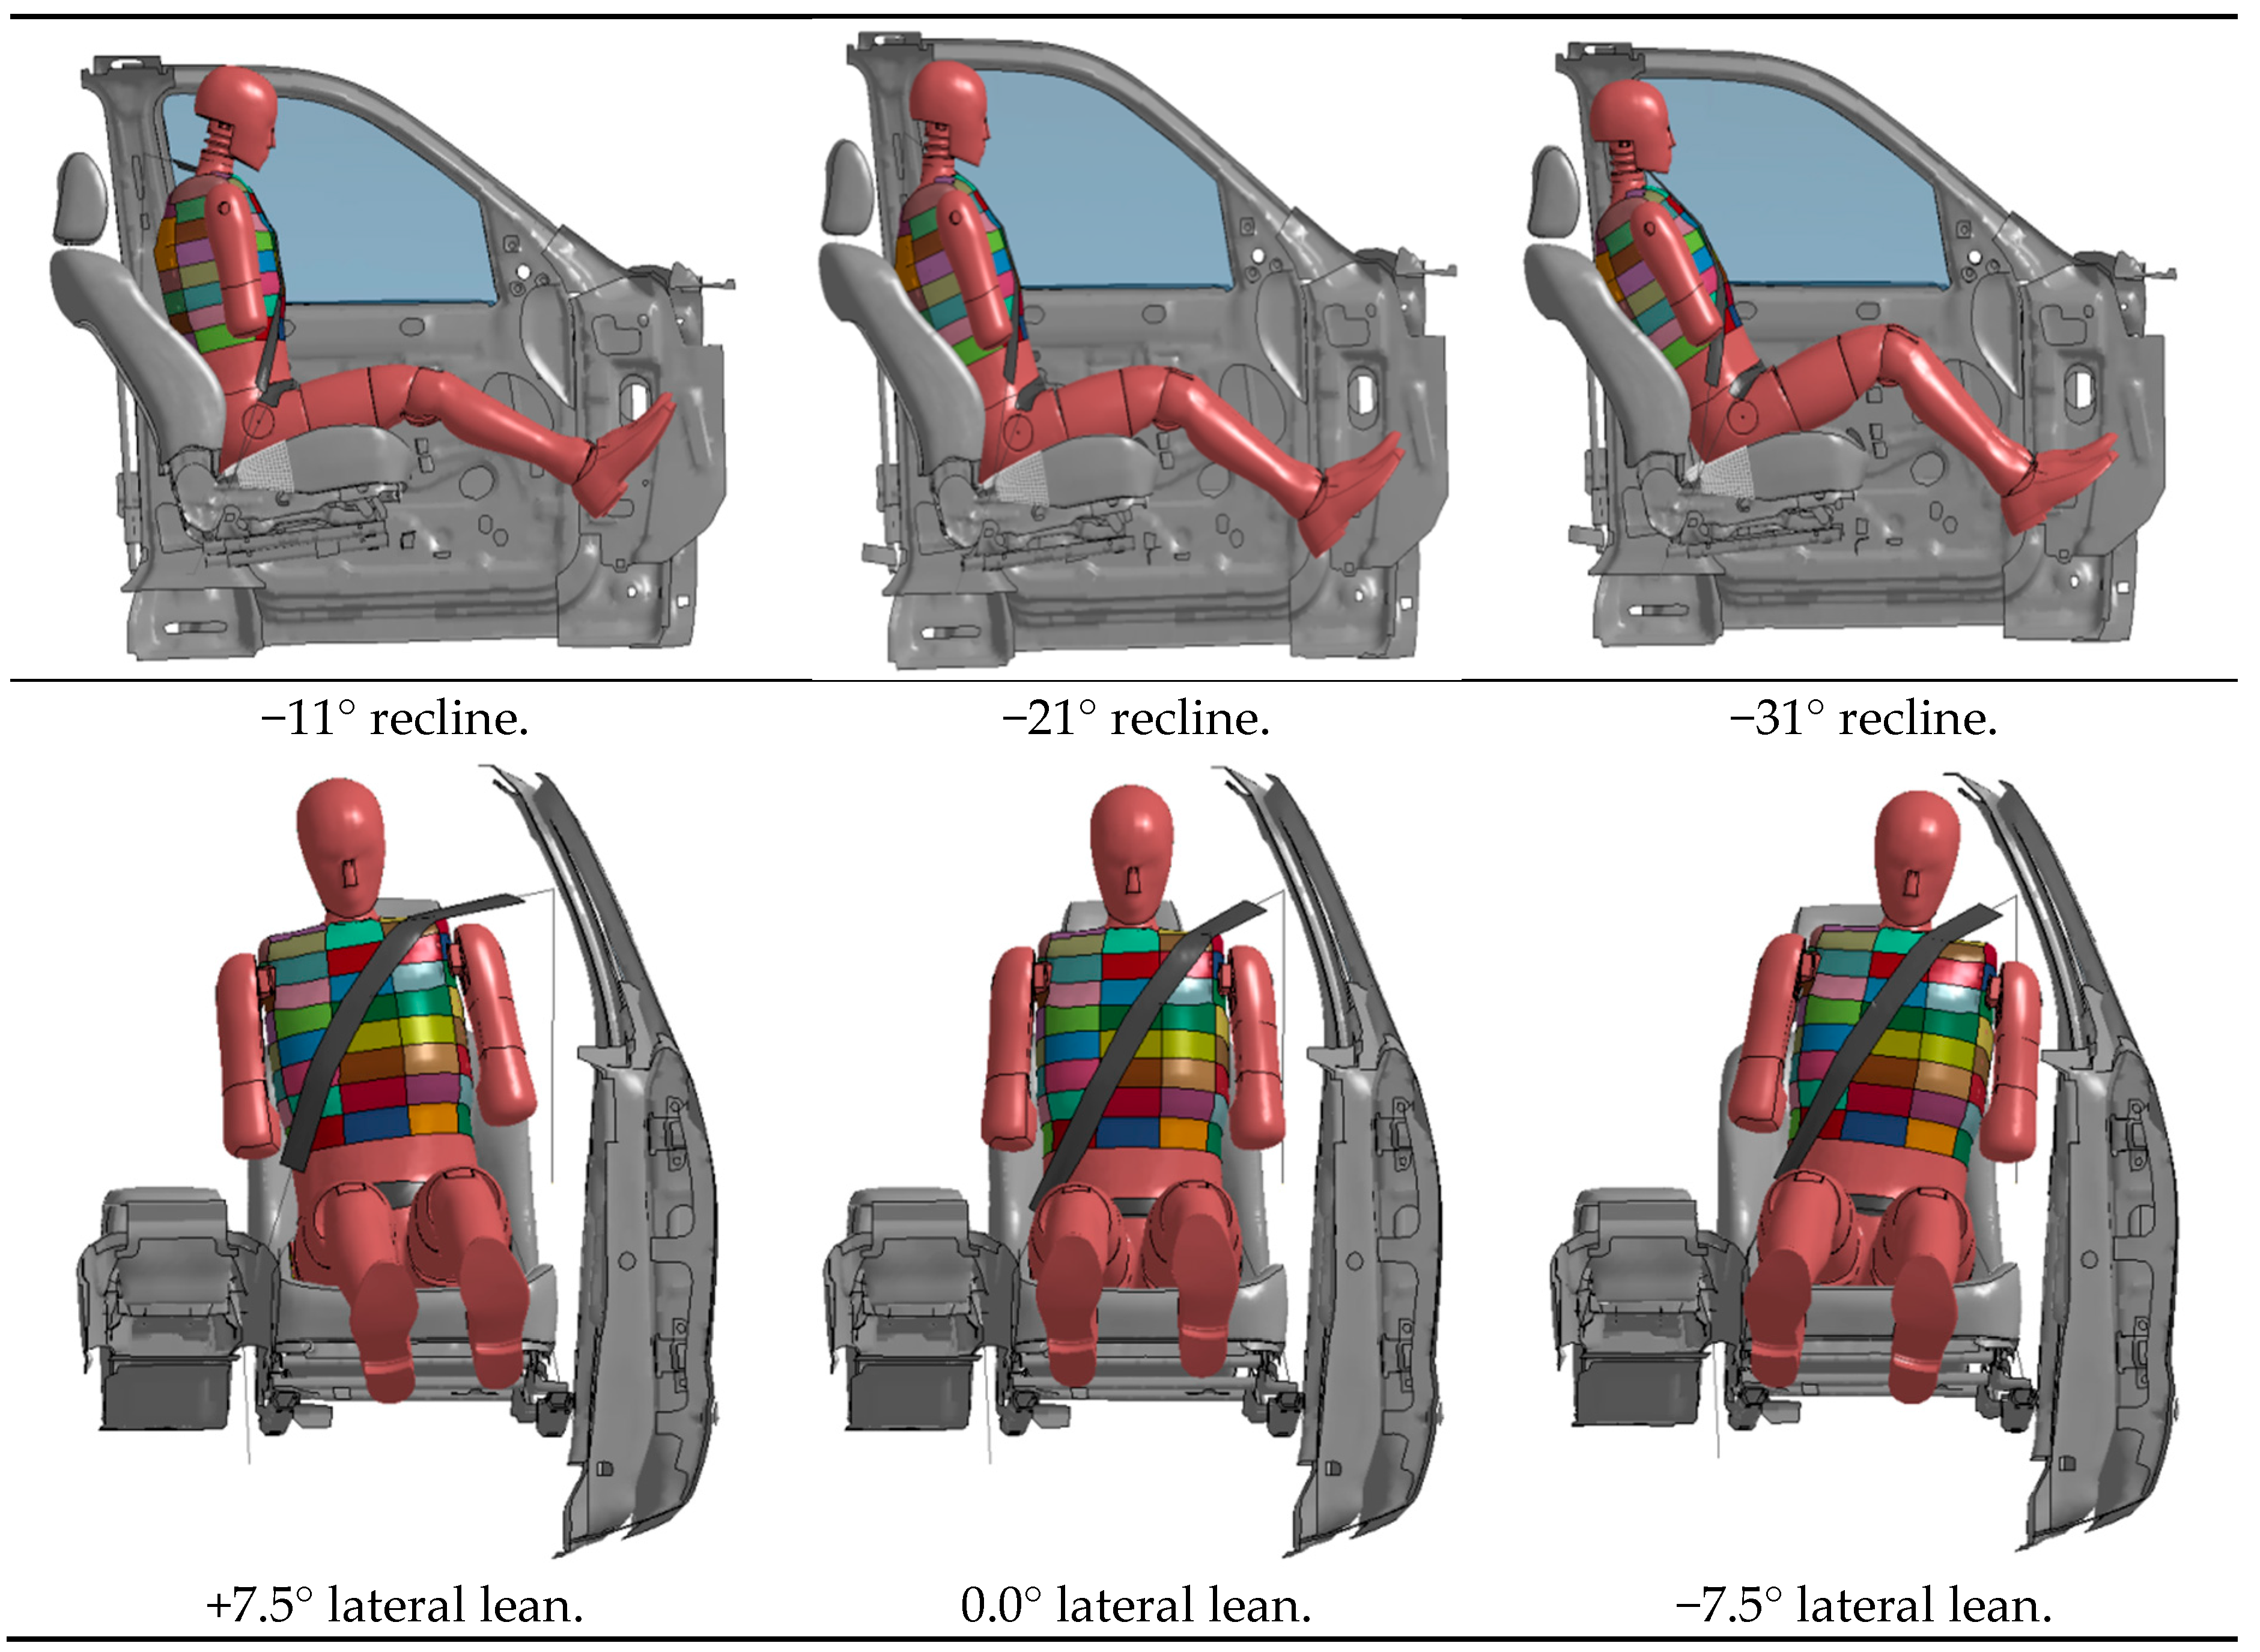
The seat was located mid-track and the B-pillar D-ring was positioned in the “full up” as documented in the NASS-CDS case report. The posture of the ATD in the driver’s seat of the SUV FE model was guided by previous studies [41,42]. That is, the anterior–posterior recline and lateral lean angles of the EuroSID-2re, relative to the vertical axis, were based on the anterior–posterior recline and lateral lean angles of Post Mortem Human Surrogates (PHMS) and ATDs from the studies performed by Lessley et al. [43] and Zhang et al. [41] when their buck, representing a vehicle, was rotated by 90 degrees. A total of nine different postures were attempted for this current study (Table 4). In all postures, the ATD was placed so that the ATD’s back and gluteus maximus contacted the seatback and seat base, respectively. Figure 2 shows the ATD’s anterior–posterior recline and lateral lean angles, respectively. For ease of reference and clarity, the nine postures are titled Position 1 to Position 9 henceforth (Table 4).
In all nine simulations, the seatbelt was located firmly across the thorax and the lap of the ATD. The seatbelt retractor was locked as the vehicle had rotated by more than 15° [44]. Although previous studies have indicated that the seatbelt retractor can unlock during a rollover [45,46,47], taking this into account is beyond the scope of this study.
2.6. Injury Assessment Reference Values
The ATD kinematics from each rollover simulation was examined and the points of impact between the ATD’s thorax and vehicle interior components were identified. The following Injury Assessment Reference Values (IARVs) were used to evaluate the probability of an AIS3+ thoracic injury occurring from thoracic to vehicle interior impact: rib deflection, upper spinal acceleration, lower spinal acceleration, and Average Spinal Acceleration-10 (ASA-10). These IARVs were chosen, as injury risk curves have previously been developed relating the y-axis’s spinal acceleration and rib displacement measured by the dummy’s accelerometers and string potentiometers respectively to results from cadaveric studies [39]. Further, these IARVs have been shown to be sound predictors of lateral thoracic injuries [39]. The coordinate system for the aforementioned IARVs was an ATD local system with the positive x-axis pointing anteriorly, the positive y-axis pointing laterally to the right, and the positive z-axis pointing caudally. Although the EuroSID-2re used in this study was instrumented for left thoracic impacts, spinal acceleration measurements were also obtained for right side impacts, as this provides an indication as to whether any right side impacts may be injurious.
ASA-10 was calculated according to the method described by Cavanaugh et al. [48] and the probability of an AIS3+ thoracic injury was assessed with the equation developed by Kuppa et al. [39].
Additionally, lateral thoracic impact velocity [49] was used in the assessment for potential AIS3+ thoracic injury. In order to measure lateral thorax impact velocity, nodes on the ATD’s lateral thorax were tracked for y-axis velocity relative to the ATD’s local coordinate system.
To identify the node or nodes which were subjected to peak lateral velocity during the rollover simulation, each completed simulation was viewed to identify the areas where the thorax had deformed upon impact with the vehicle’s interiors. The node located closest to the centre of each deformed area was then identified. This node and eight adjacent nodes were selected, thus forming a 3 × 3 node matrix. The time–history y-axis velocity from each of these nine nodes was then plotted. From this plot, the node with the peak lateral velocity was identified. The peak lateral velocity was then expressed as a probability of an occupant sustaining an AIS3+ thoracic injury through previously developed injury risk curves [49].
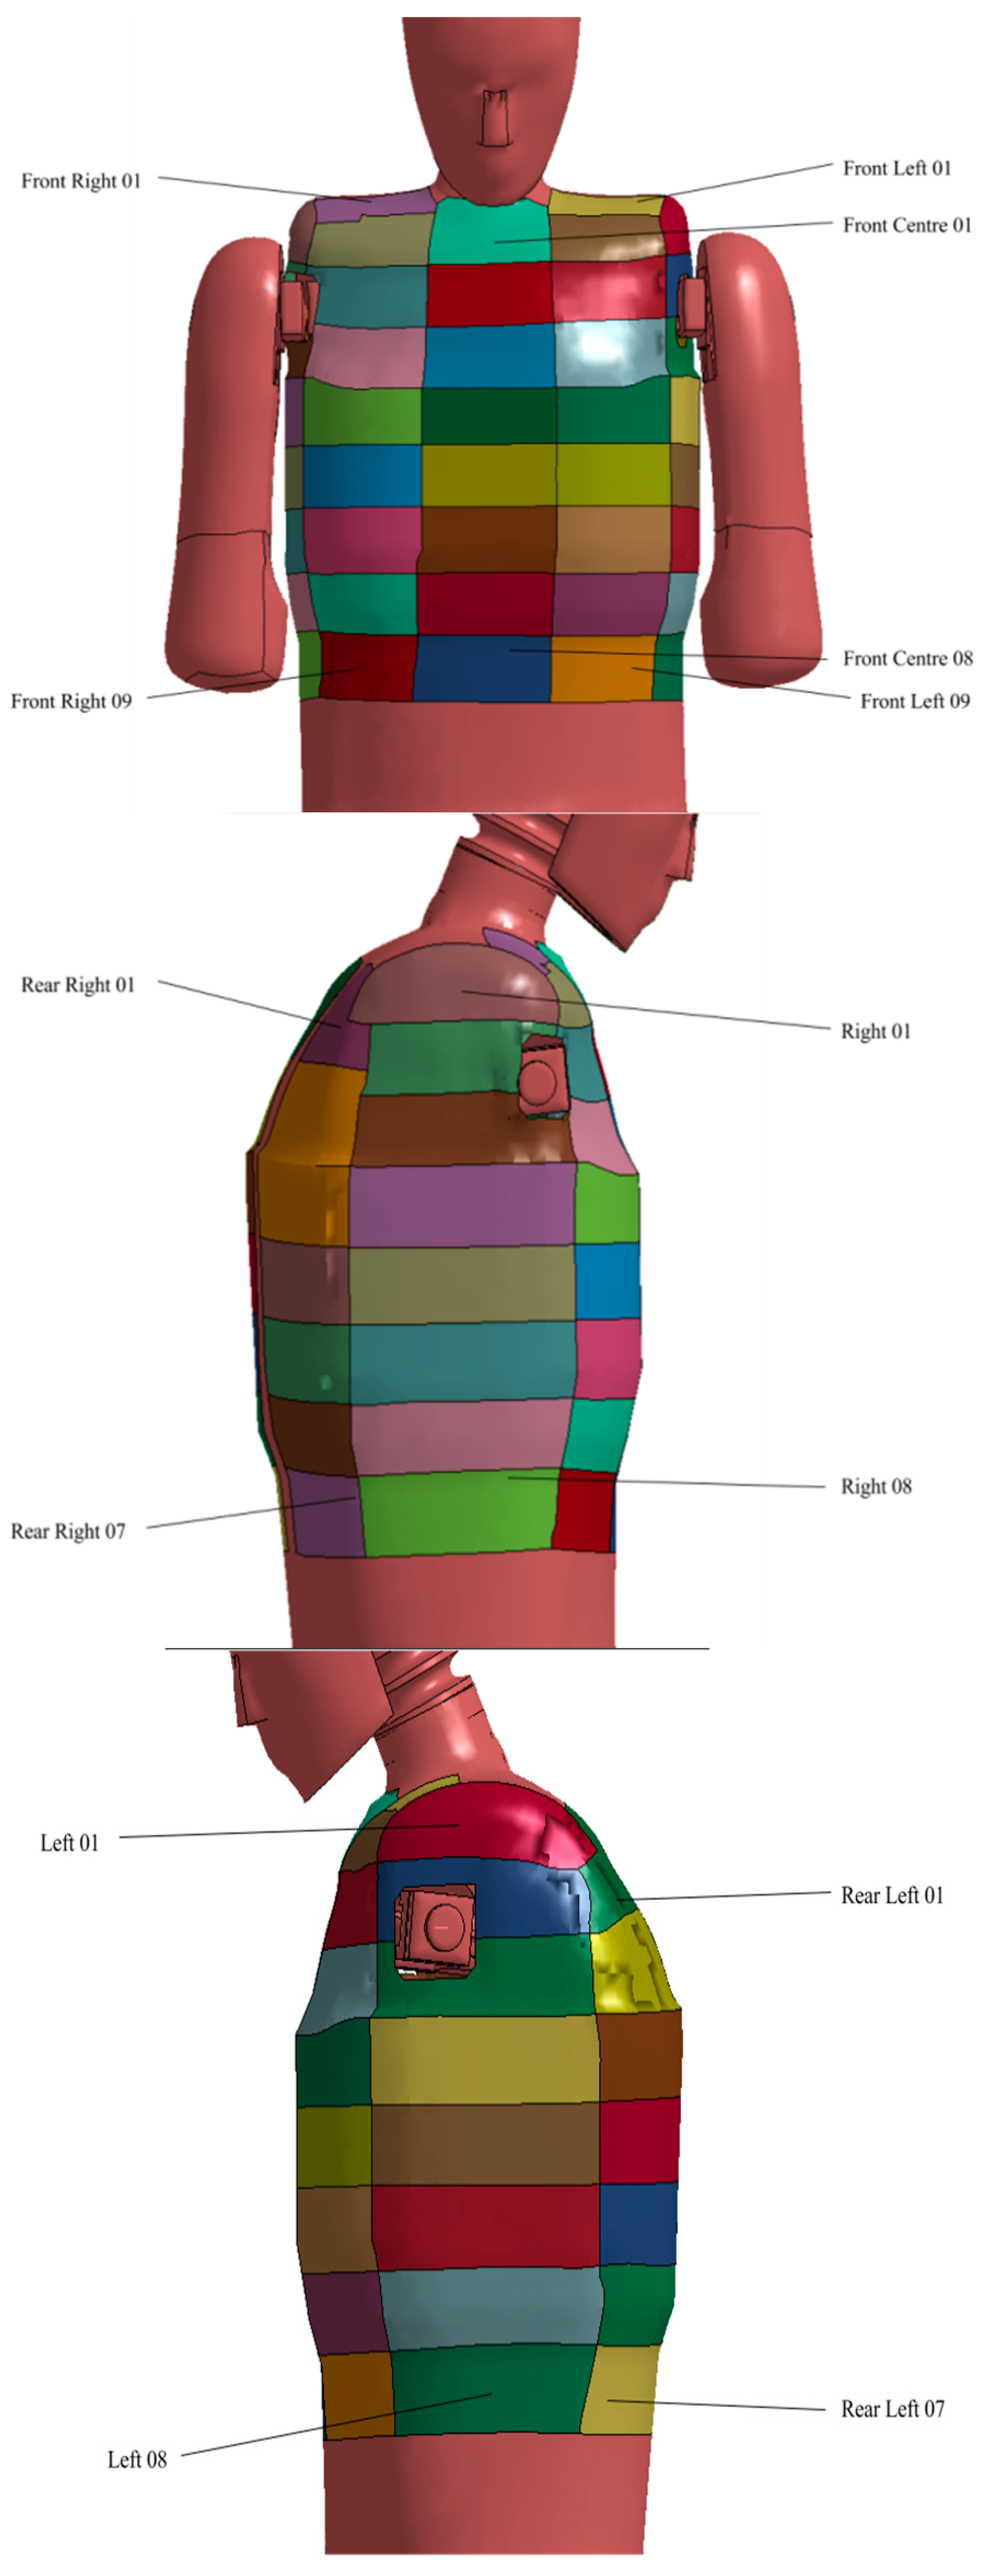
In addition to the five aforementioned IARVs, the ATD resultant thoracic force measurements were also obtained. In order to obtain thoracic force measurements, the thorax was divided into 56 segments (Figure 3) and the resultant force on each segment was obtained. Where thoracic deformations were observed to have occurred due to contact with the seatbelt or impact against vehicle interior components, the deformed segment’s time–history resultant force was plotted and the peak resultant force identified.
Seatbelt axial force was also measured during the simulation. The axial forces were measured at the lap belt’s left and right end and bottom and top of the sash. The peak axial force from each of these four points was obtained from the time–history plots.
Spinal acceleration was filtered with SAE CFC 180 [32] except for ASA-10 where a Butterworth (BW) 300 filter was applied [48]. Deflection was filtered with SAE CFC600 [32]. It is noted that SAE J211 [32] does not specify the CFC for force and velocity. As such, SAE CFC600 was applied for force [38] and SAE CFC180 was applied for velocity [50].
3. Results
The qualitative and quantitative results from the FE vehicle simulation are presented first followed by the quantitative results from the FE ATD.
3.1. Finite Element Vehicle Selection
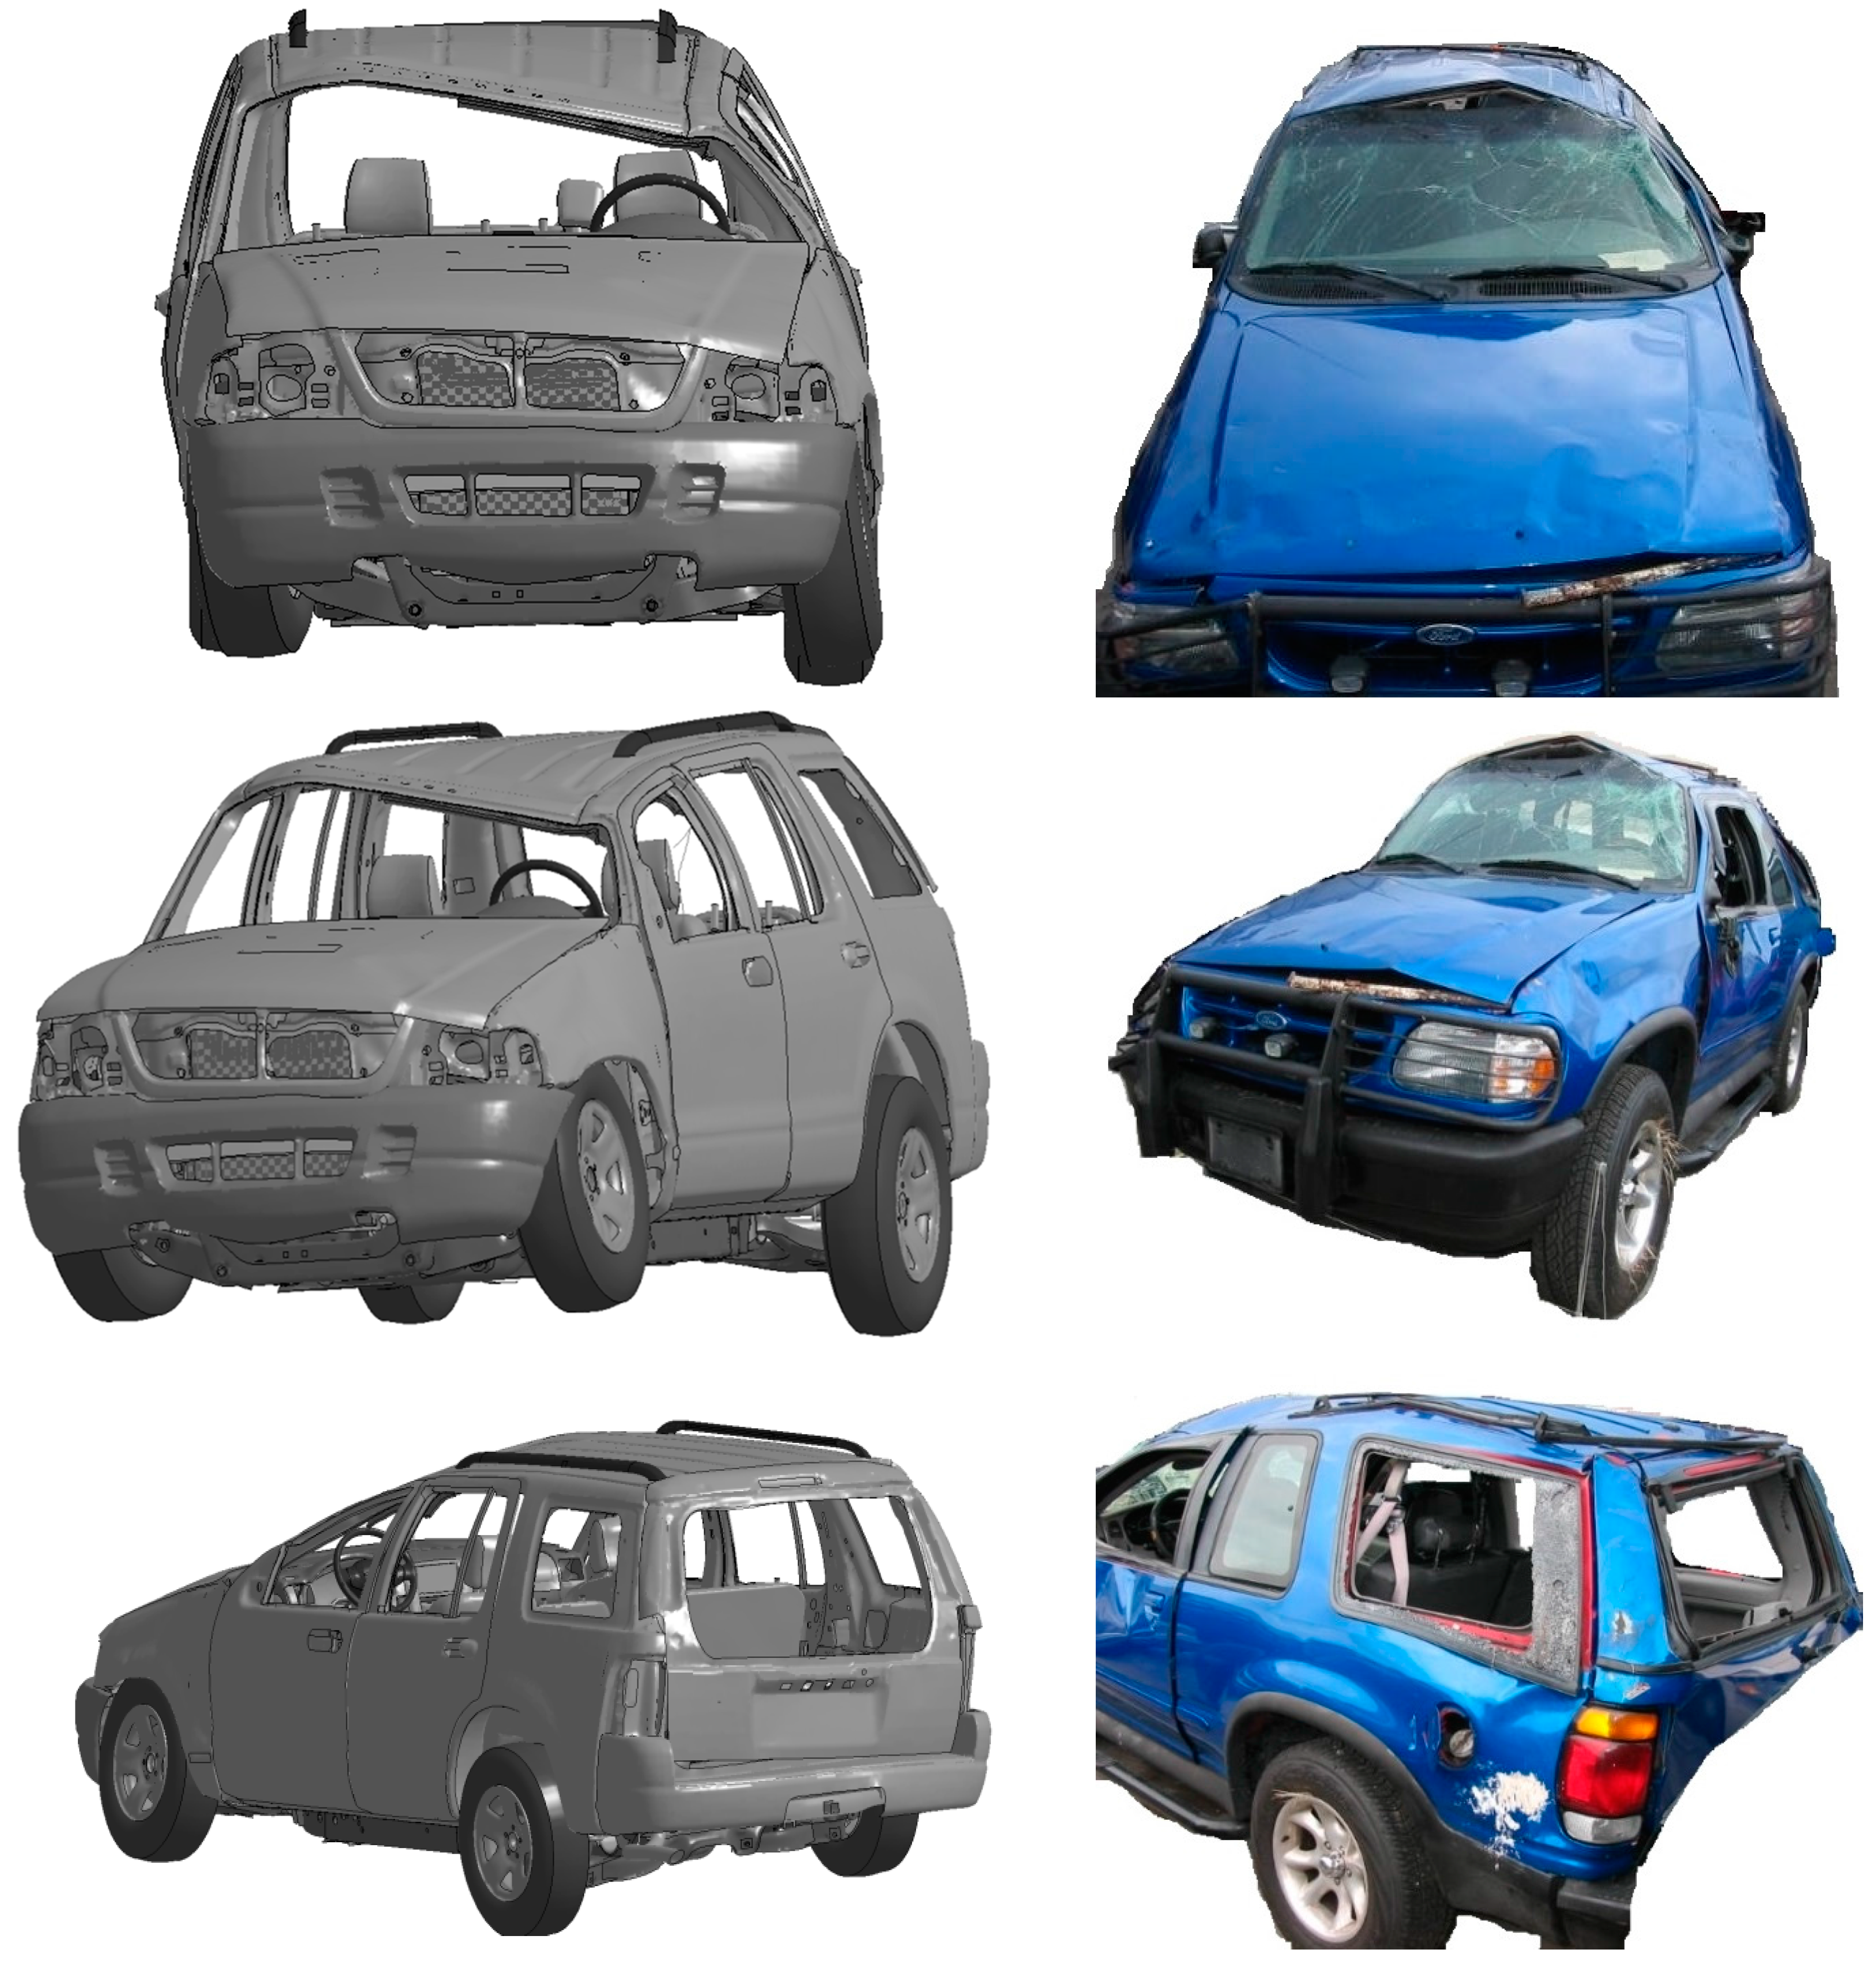
The trip conditions obtained from the PC-CRASH simulations and used in the FE analysis resulted in a four-quarter-turn rollover over a distance of 8 m. A plot of the vehicle global x-axis velocity and vehicle x-axis roll rate and roll angle is presented in Appendix A. It is noted that, apart from the skid marks, the point of trip, and the vehicle’s final position, no other details were available from the NASS-CDS scene diagrams for comparison with the reconstructed trajectory. However, the key impact points between the FE vehicle model and the ground surface could be compared to the NASS-CDS case vehicle photos (Figure 4a,b). In the FE simulation, the right A-pillar was the first vehicle structure to contact the ground and correlated with the location and direction of the damage pattern of the case vehicle (Figure 4a). The subsequent impact occurred at the left A-pillar and left B-pillar (Figure 4b). Corresponding photos from the case vehicle are also presented in Figure 4a,b.
A quantitative assessment of the vehicle damage was performed by comparing the NASS-CDS reported intrusion and crush direction to the corresponding intrusion and crush direction from the FE model (Table 5).
The roof damage of the case vehicle and the FE model is presented in Figure 5.
3.2. Finite Element Anthropomorphic Test Device Simulation
Of nine simulations that were performed for this current study, only four ran to completion. The other five simulations terminated due to unresolvable EuroSID-2re instabilities. The simulations that ran to completion were with the ATD in Positions 1, 2, 5 and 8.
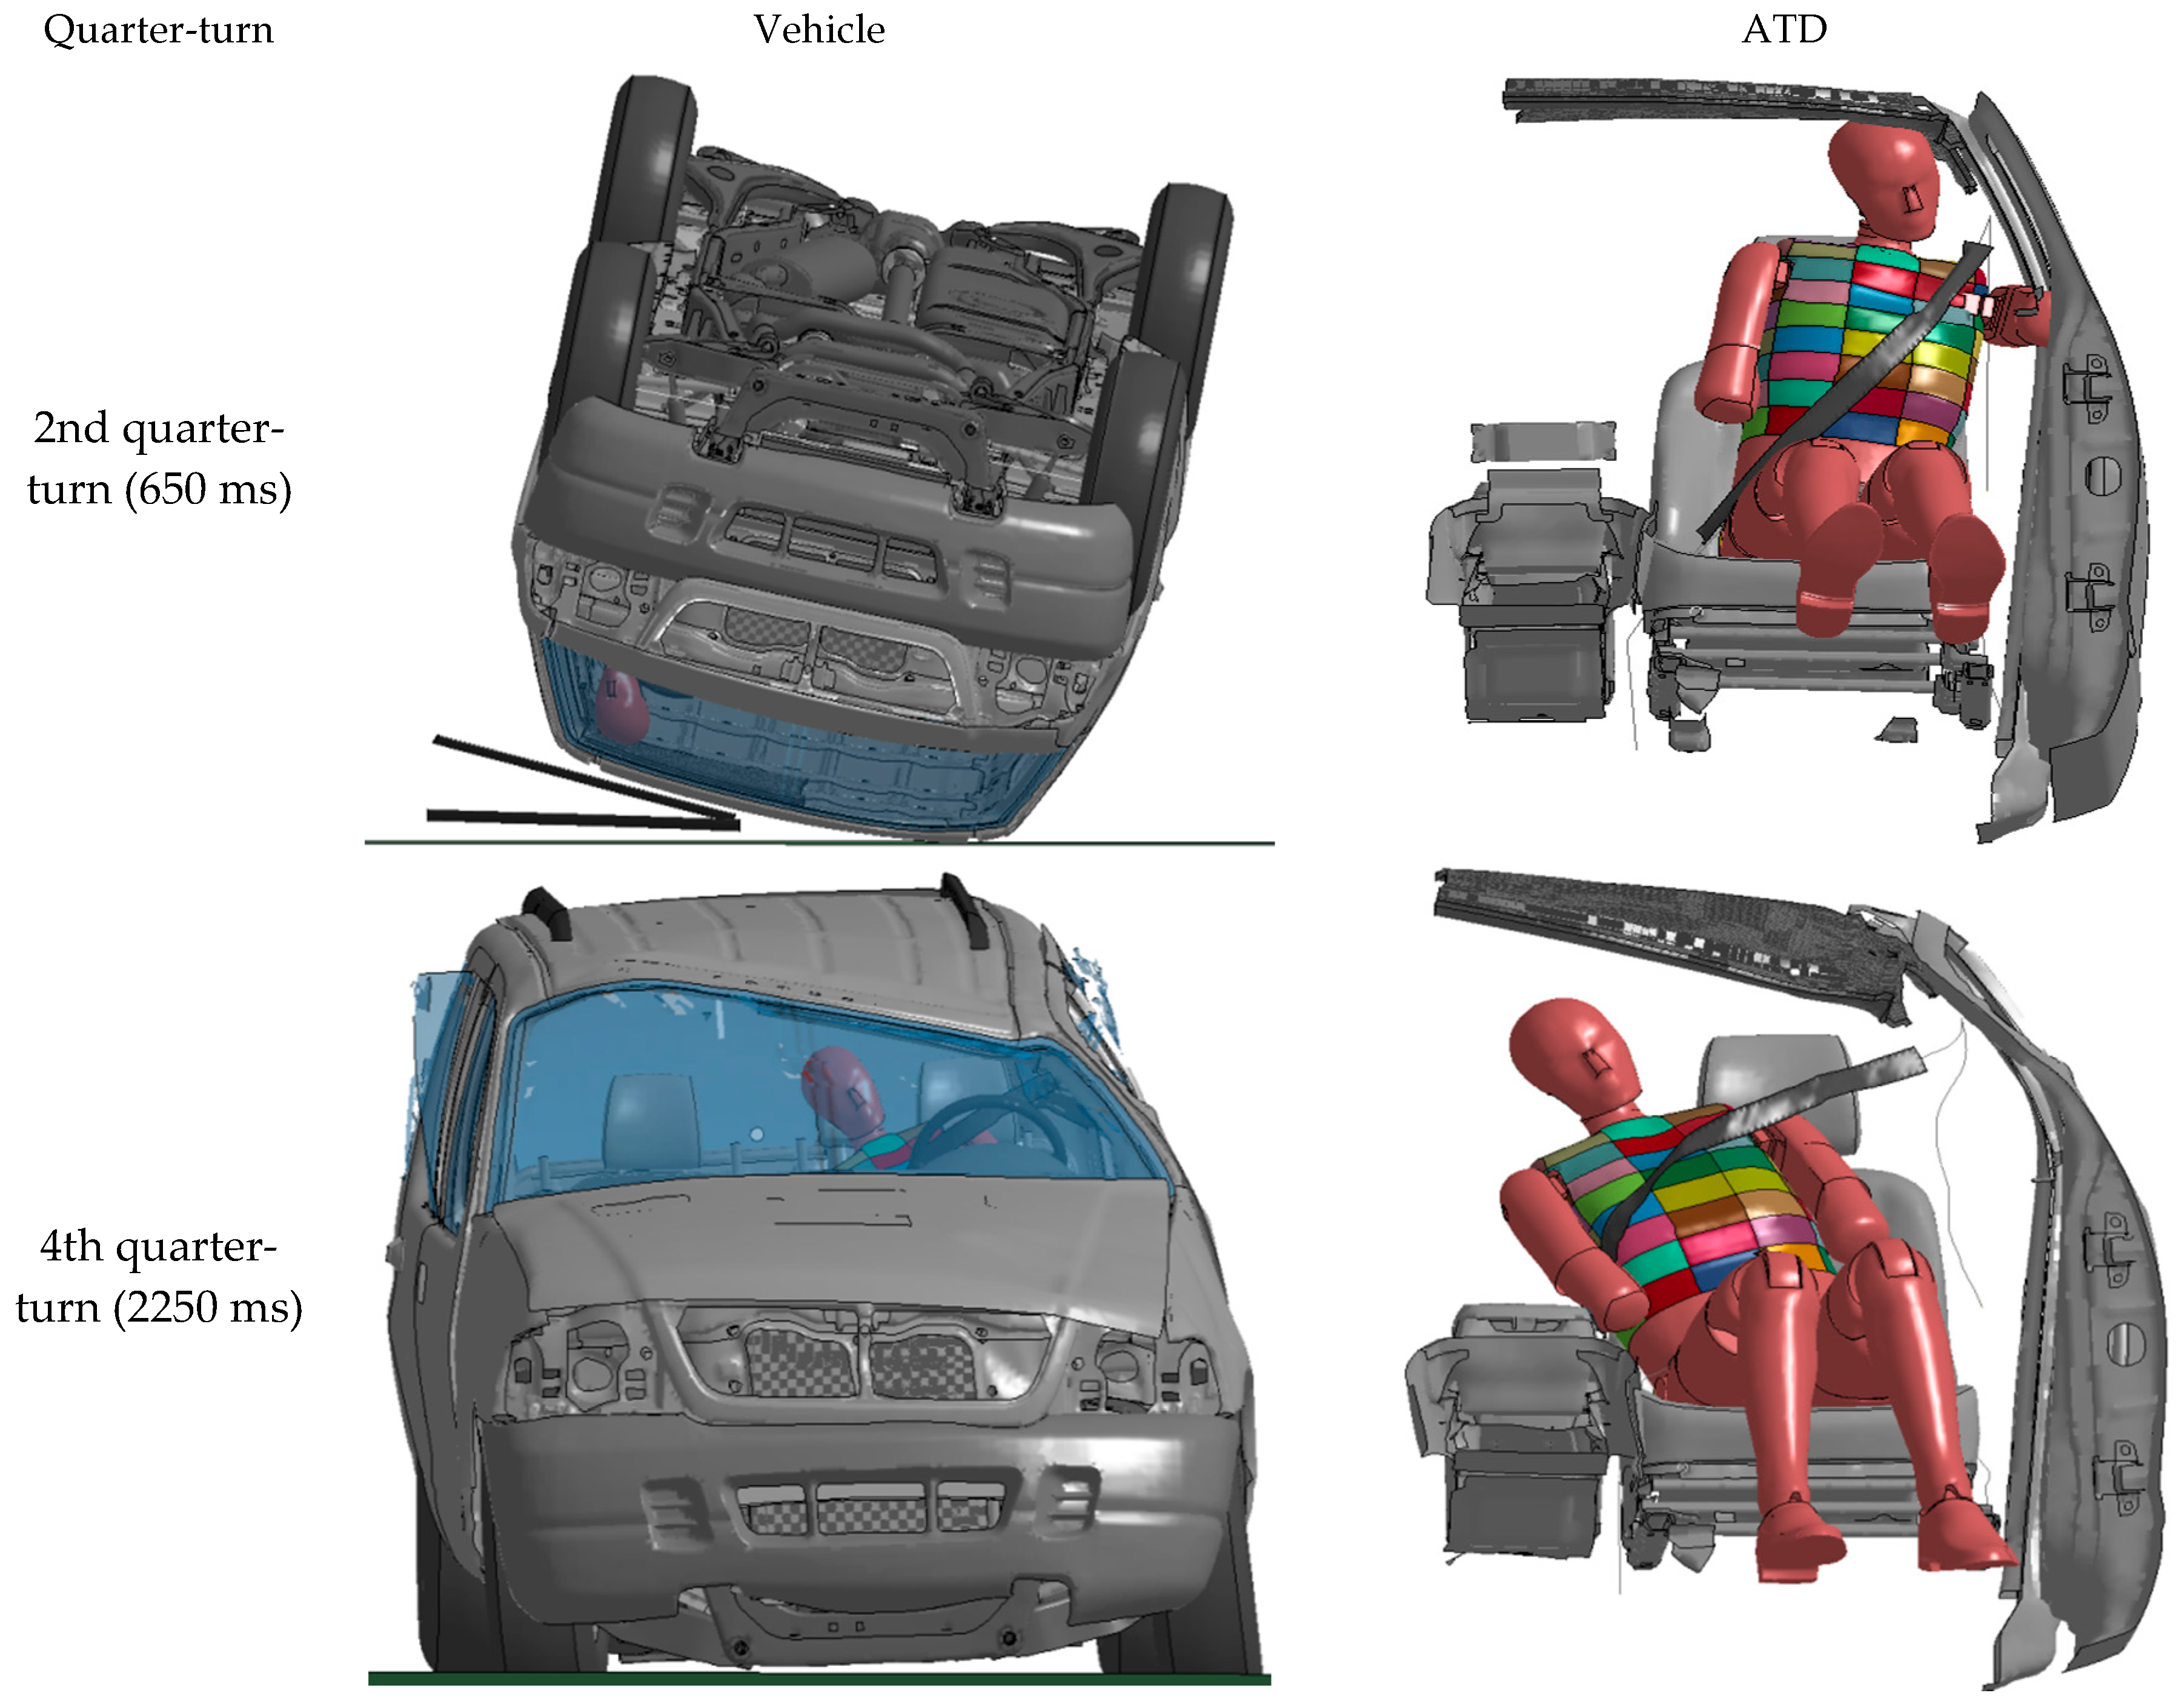
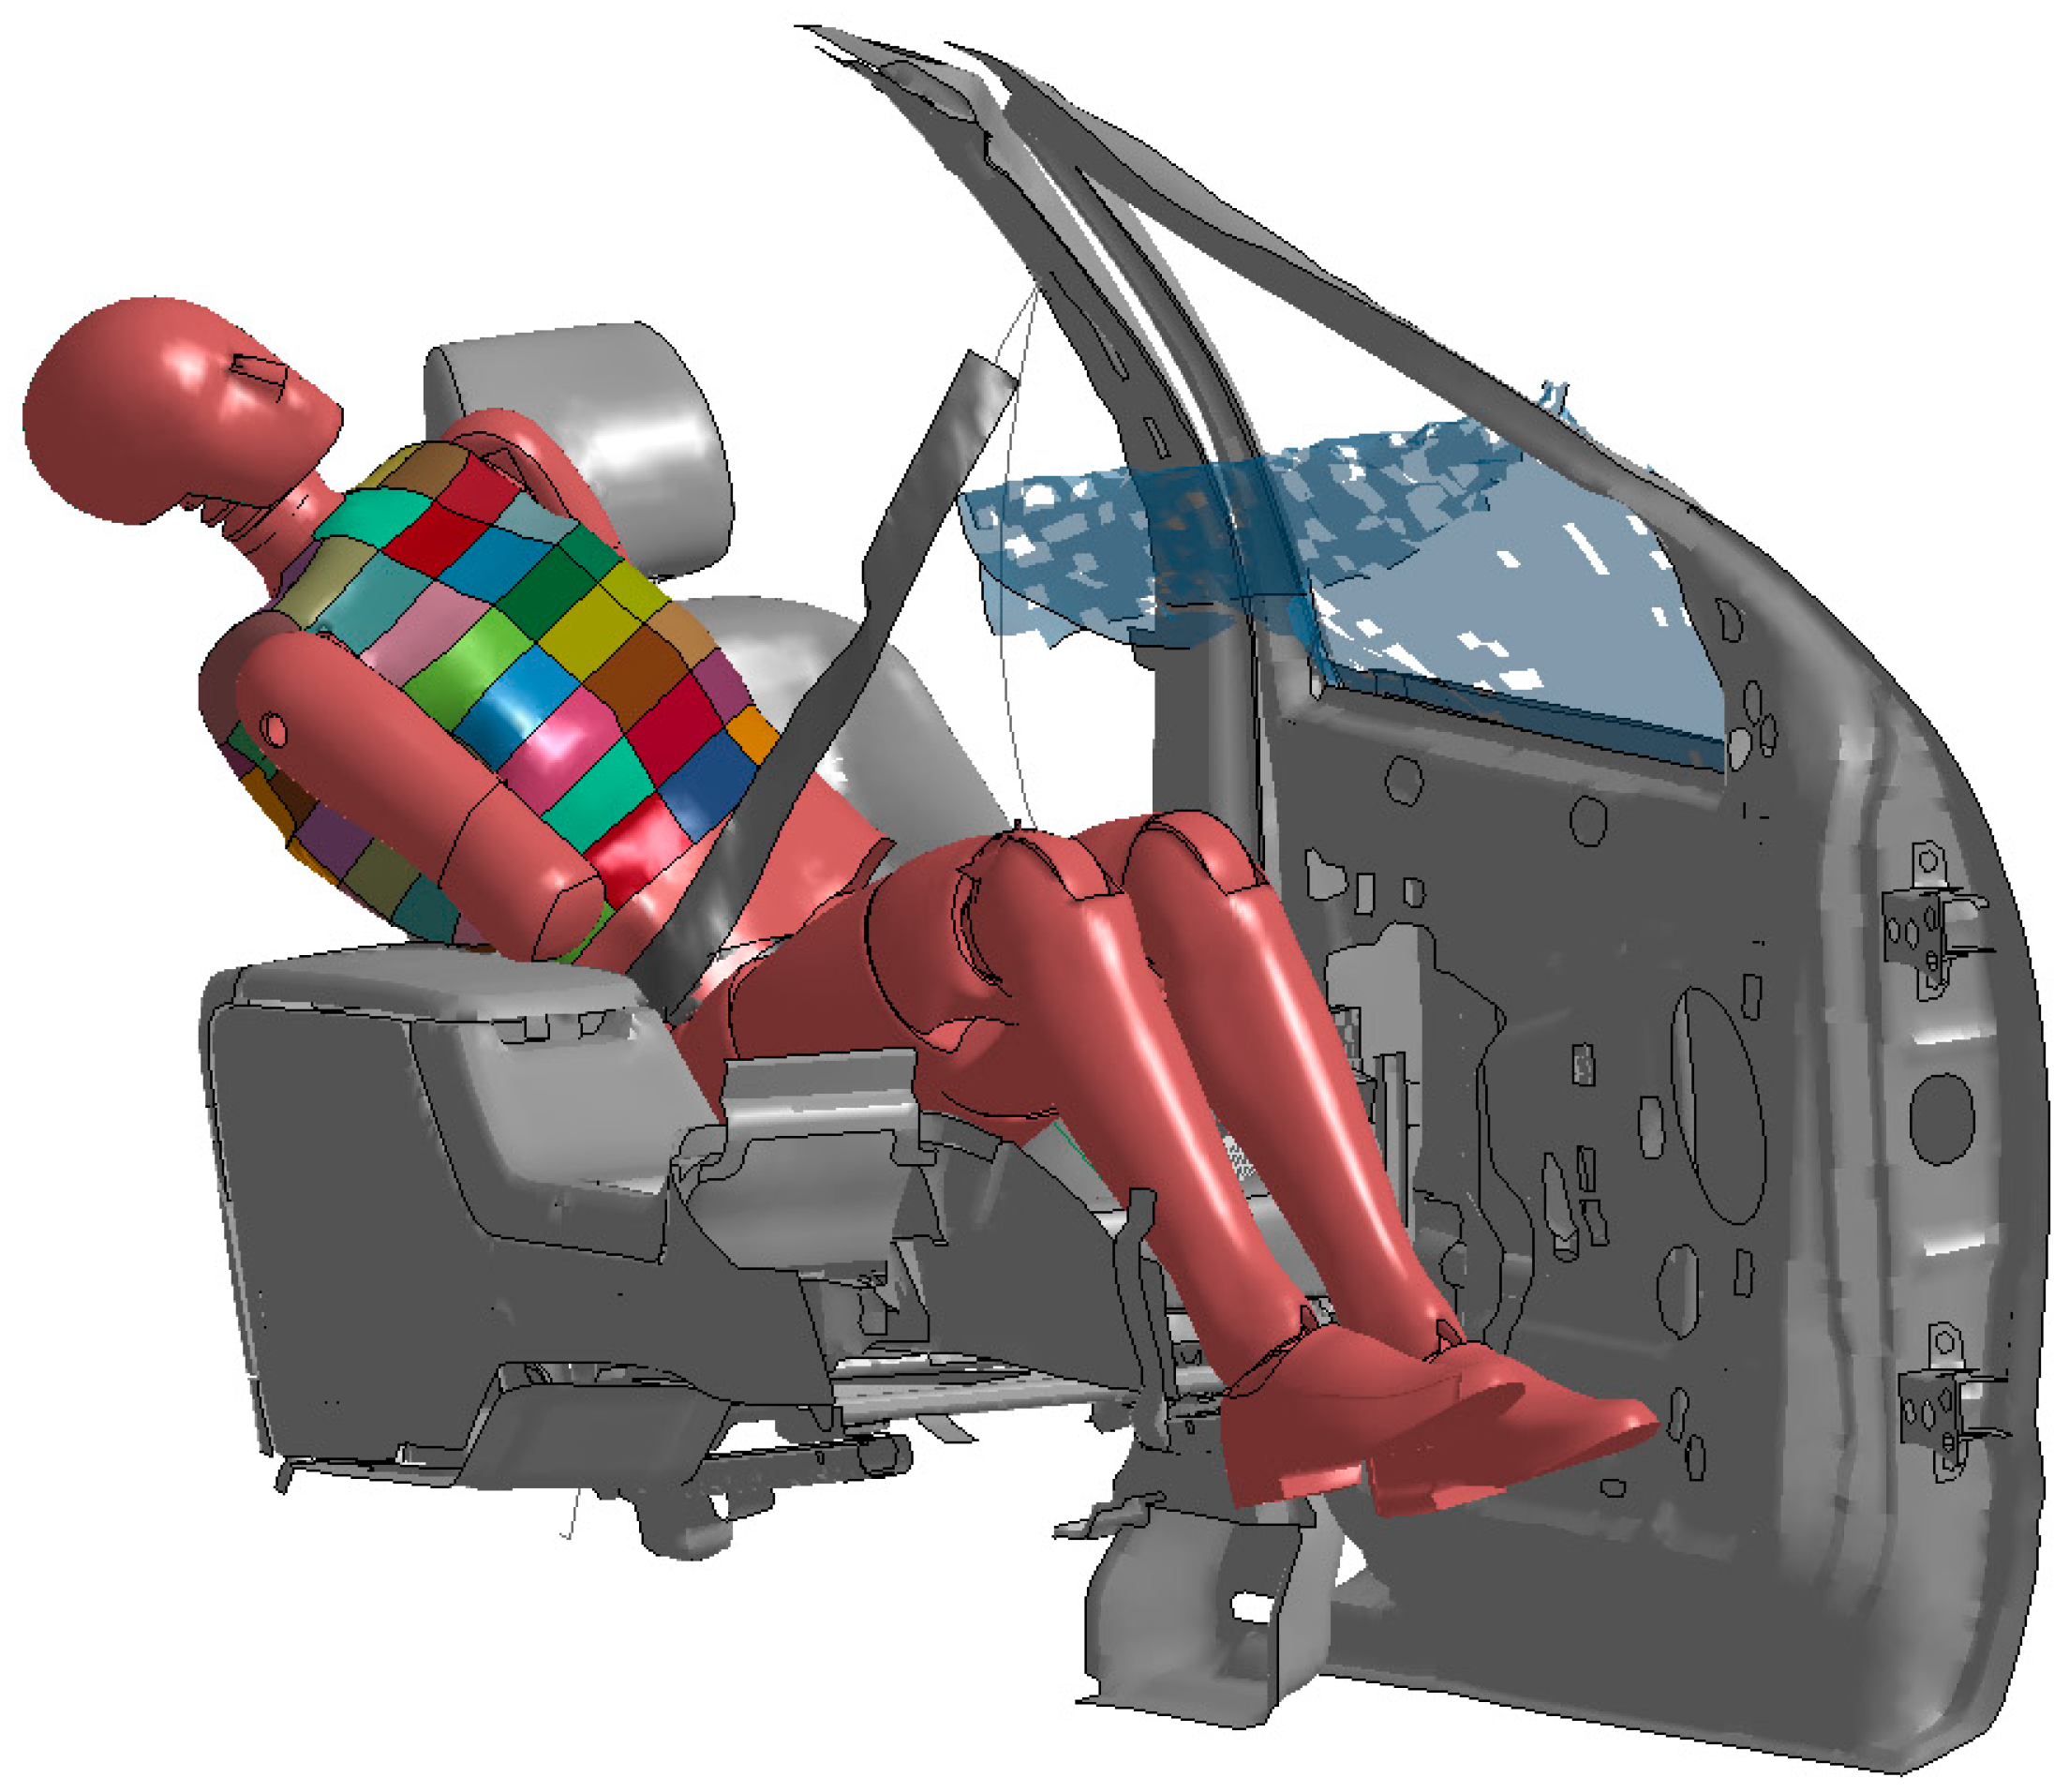
In all four simulations, the only significant thorax to vehicle interior impact was with the centre console that occurred during the vehicle’s fourth quarter-turn (2100 to 2400 ms) as the vehicle’s right wheels contacted the ground. This wheel-to-ground contact resulted in the dummy traversing from outboard to inboard and the right thorax impacting the centre console. This impact with the centre console (Figure 6) became a focus of this investigation.
At no other point during the rollover was the lateral part of the thorax observed to either have impacted with vehicle interior components or deform due to the seatbelt. However, it was observed that there was potential for the left thorax to impact the vehicle interior at the second to third quarter-turn (550 to 1150 ms). This point in the rollover was also a focus for this investigation.
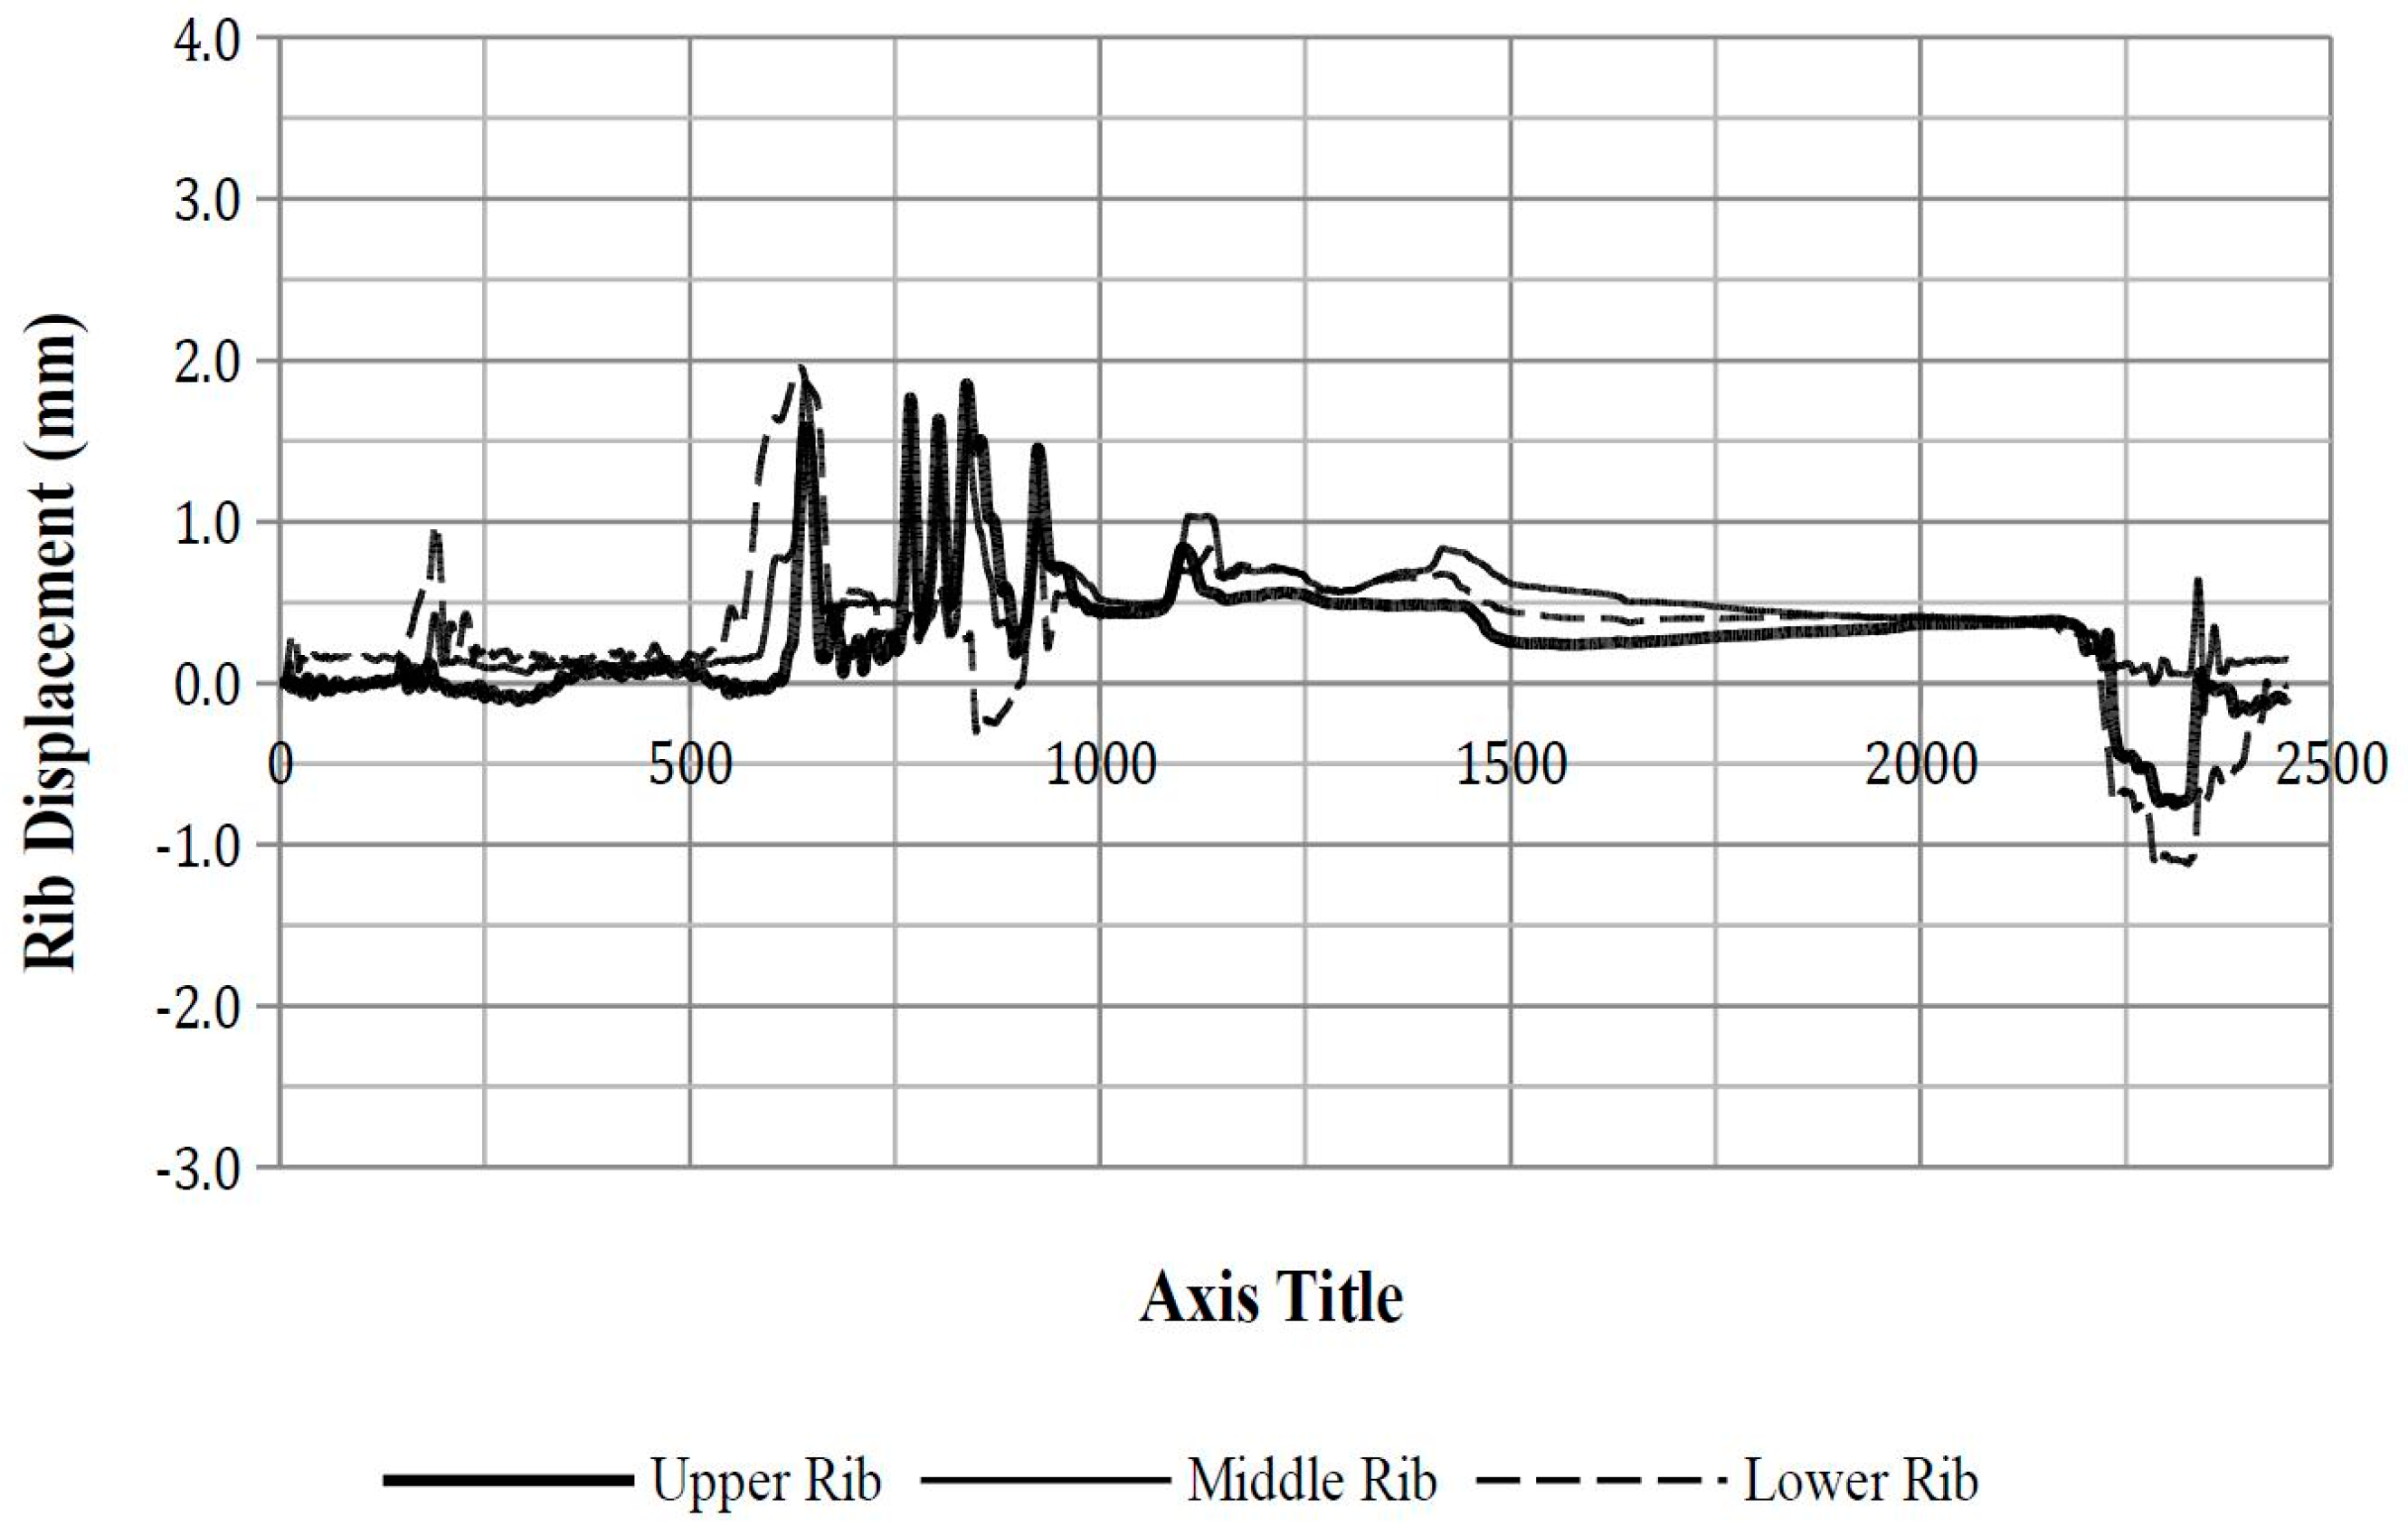
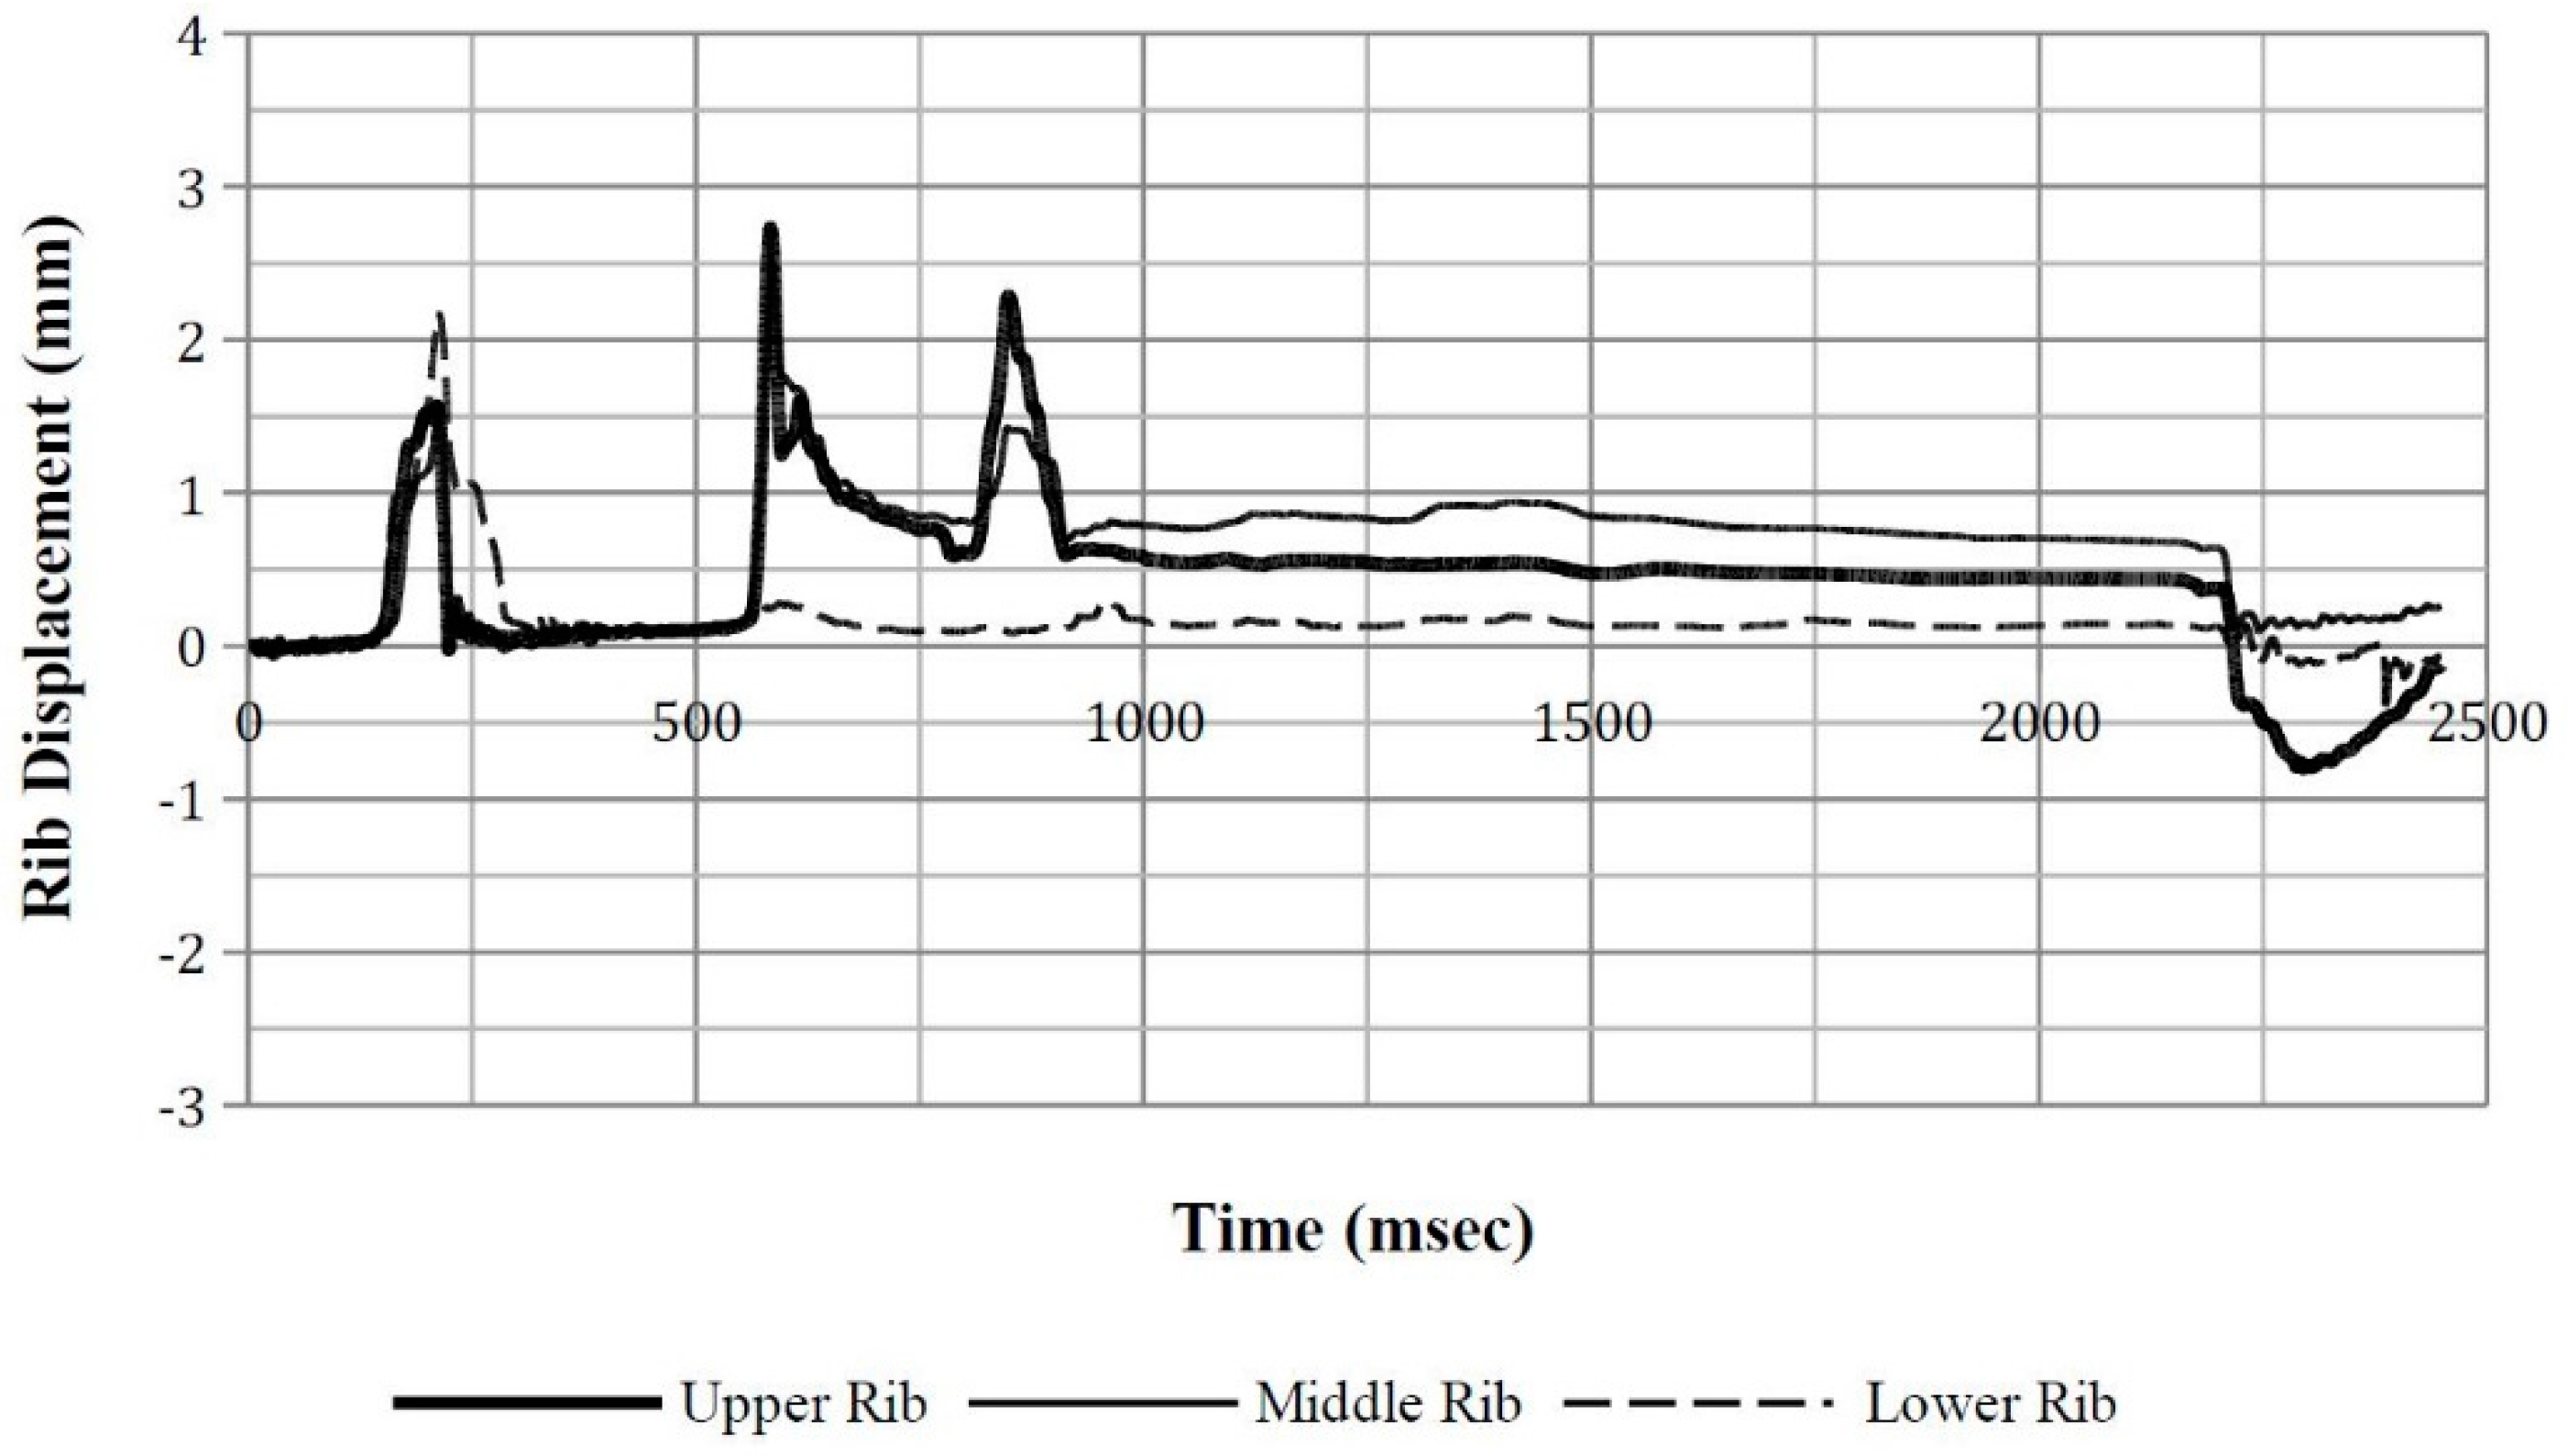
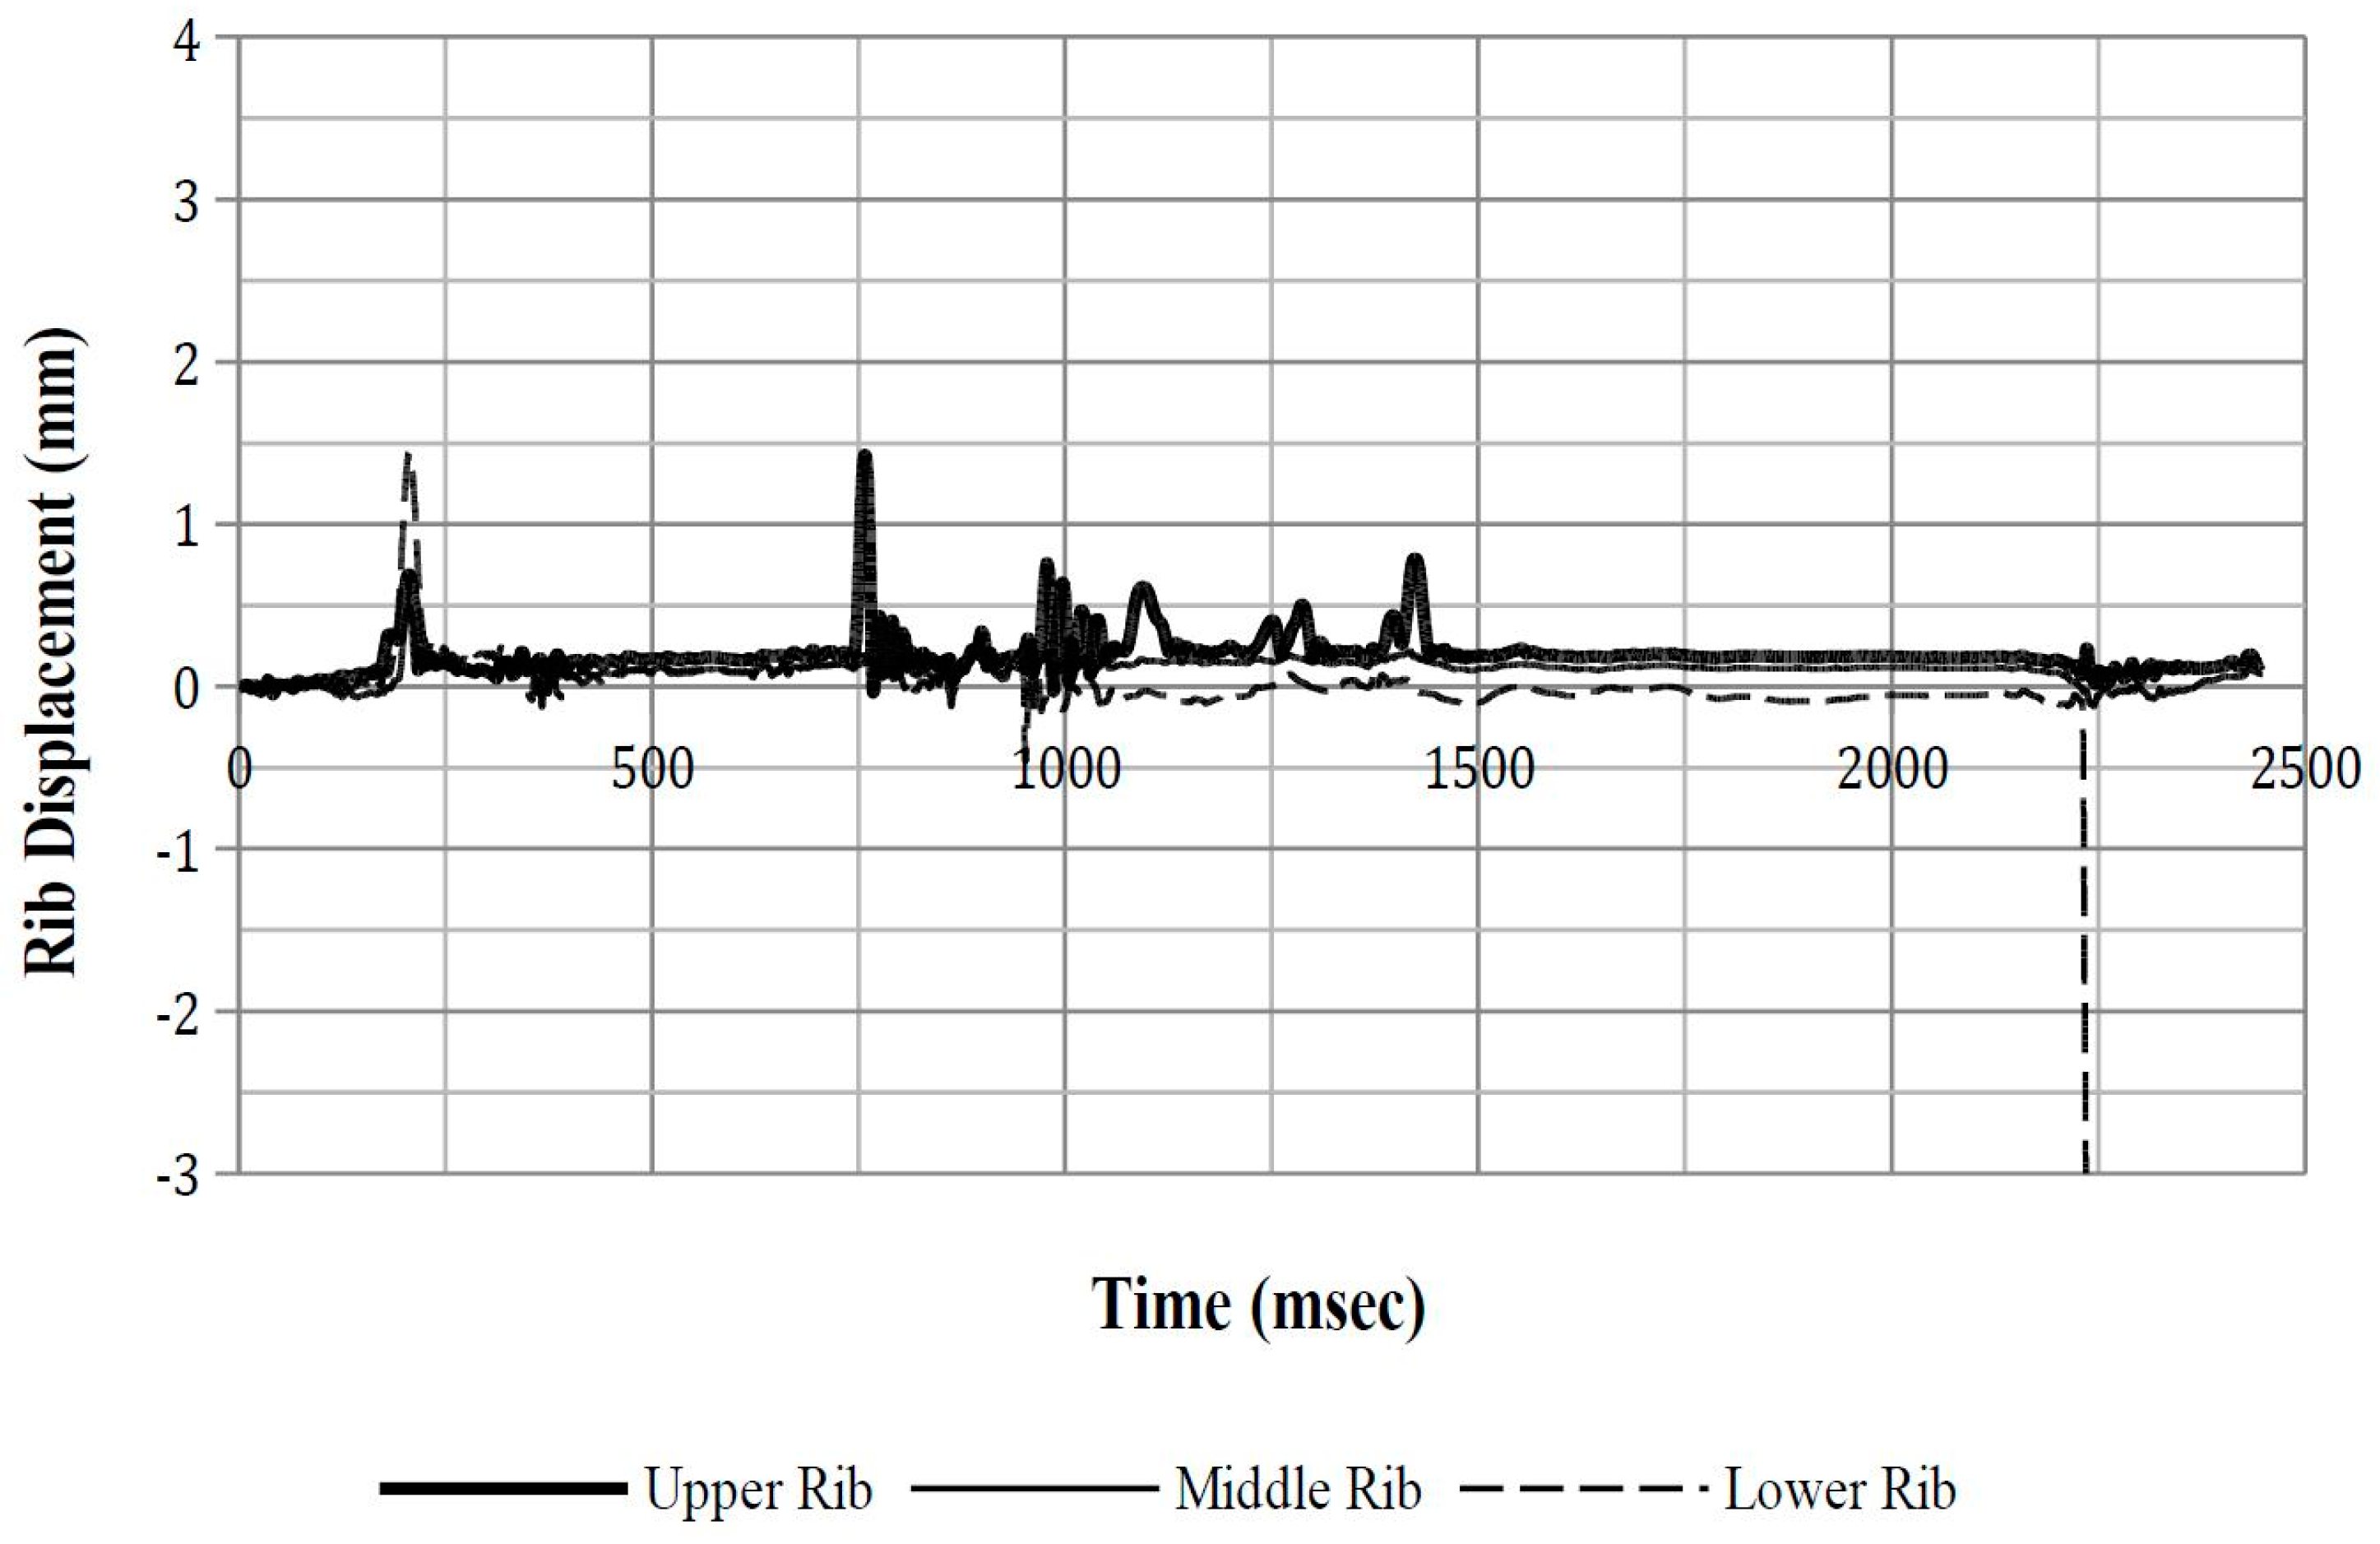
3.2.1. Rib Deflection
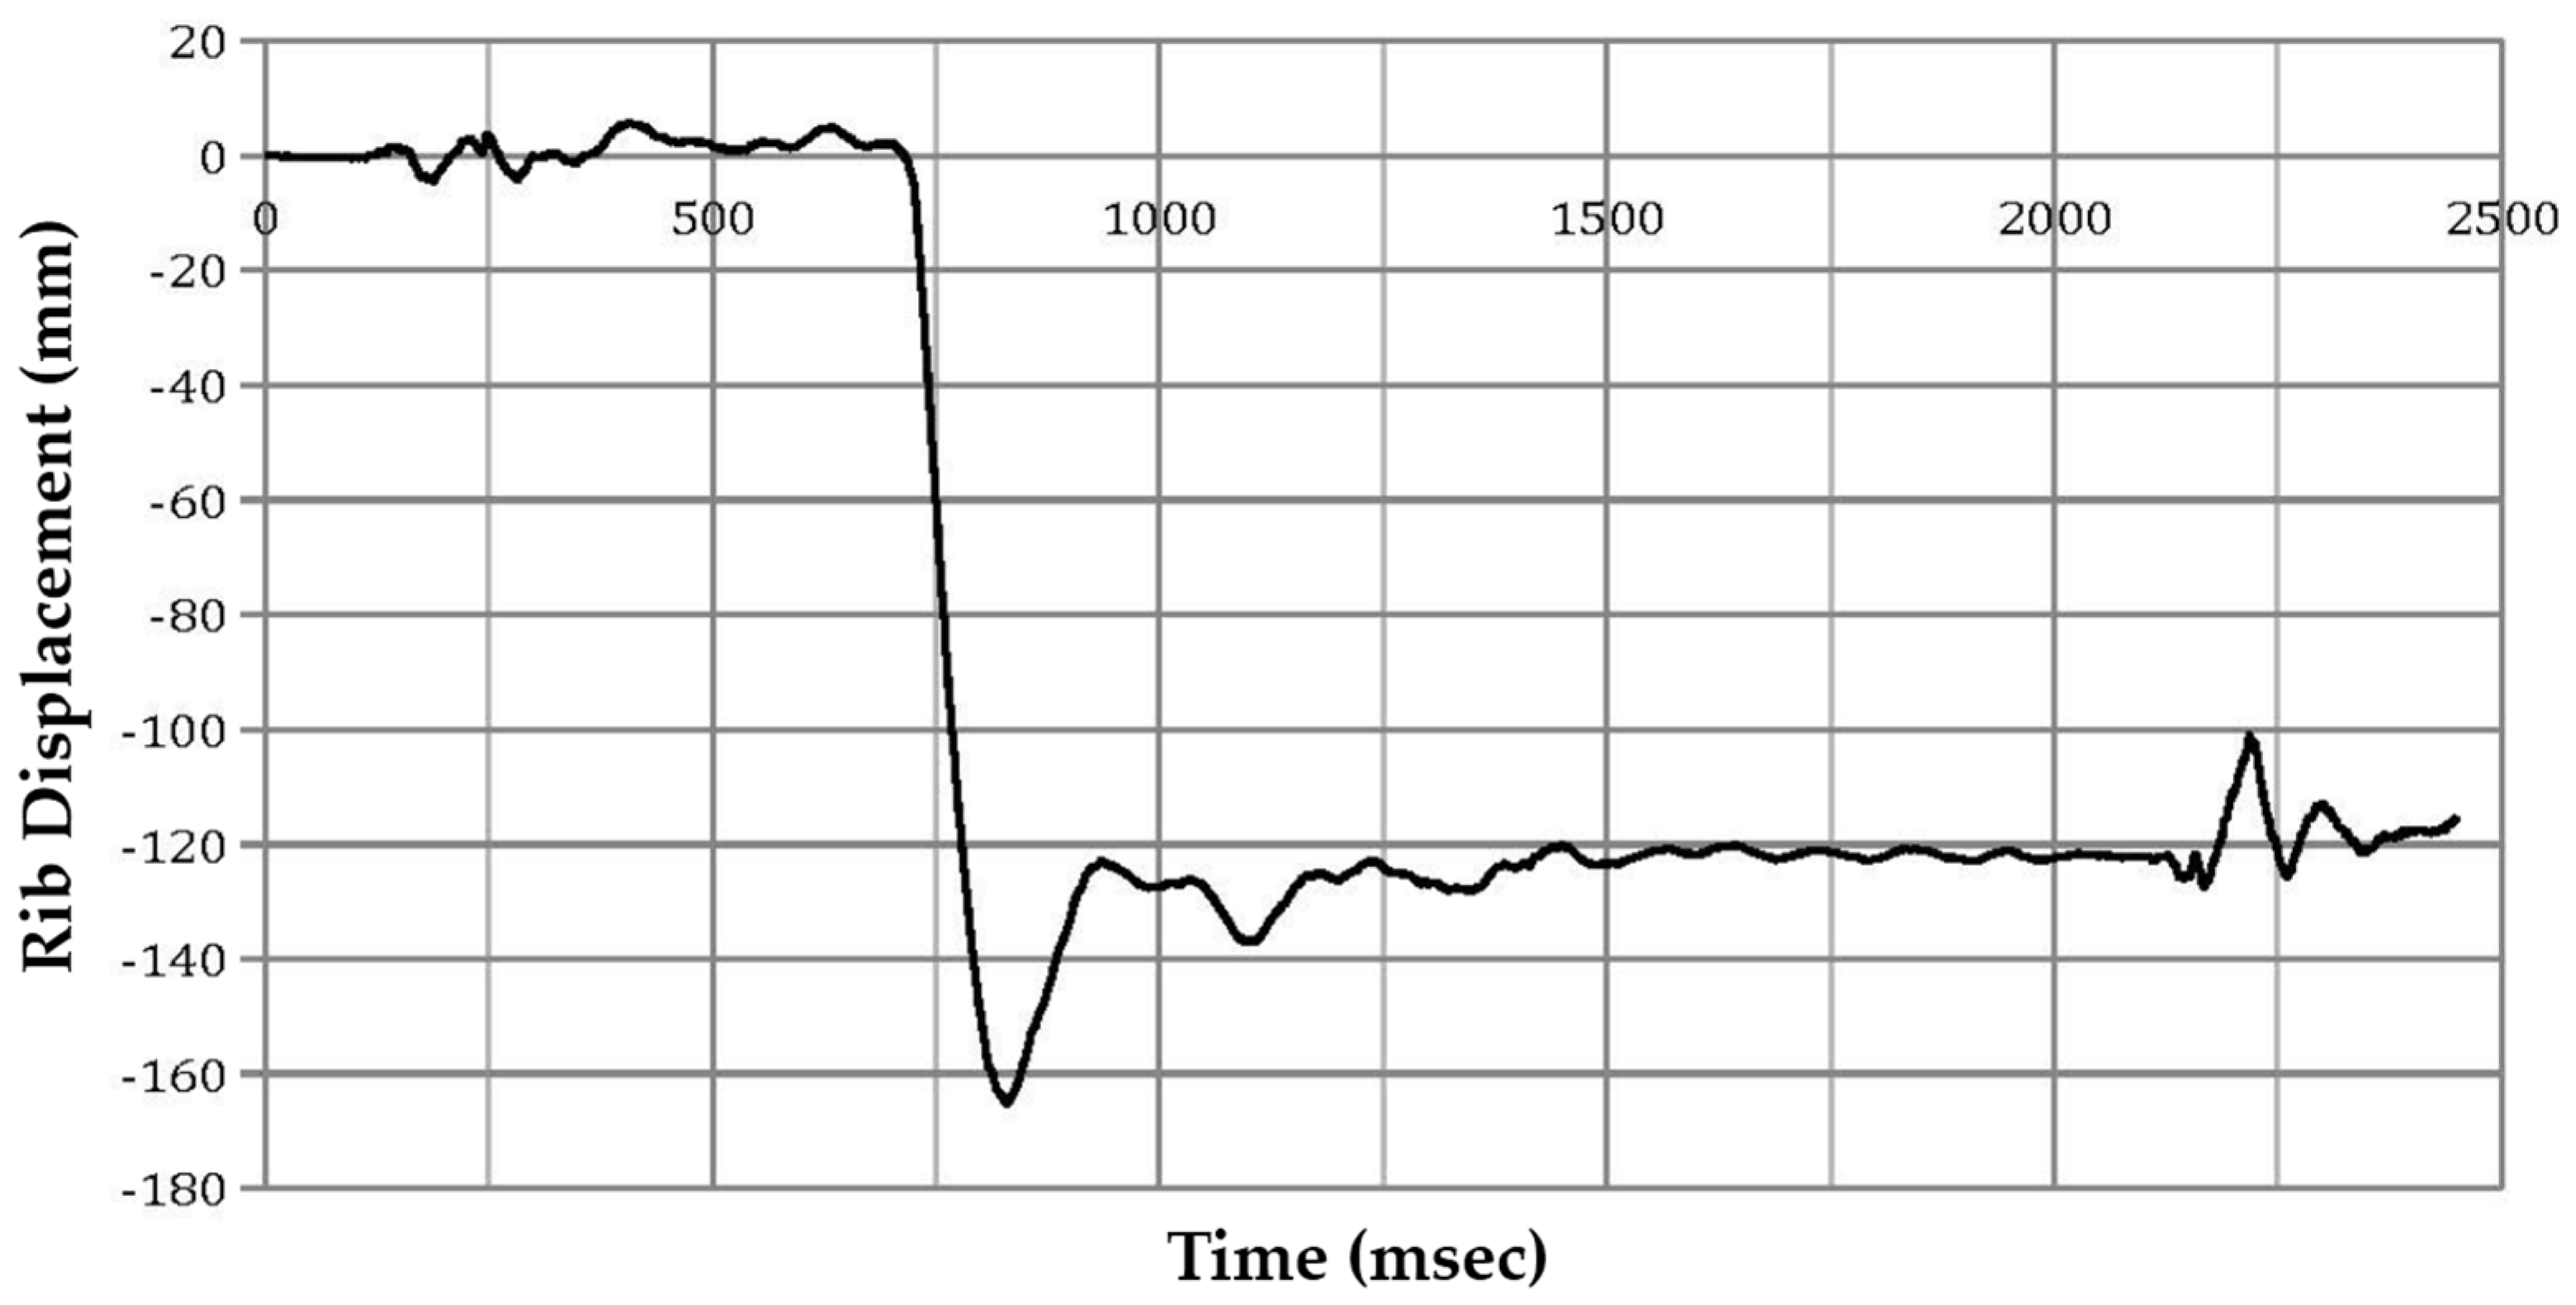
The maximum rib deflections are presented in Table 6 along with the corresponding time and probability of an AIS3+ thoracic injury. A time–history plot of rib deflection is provided in Appendix C.
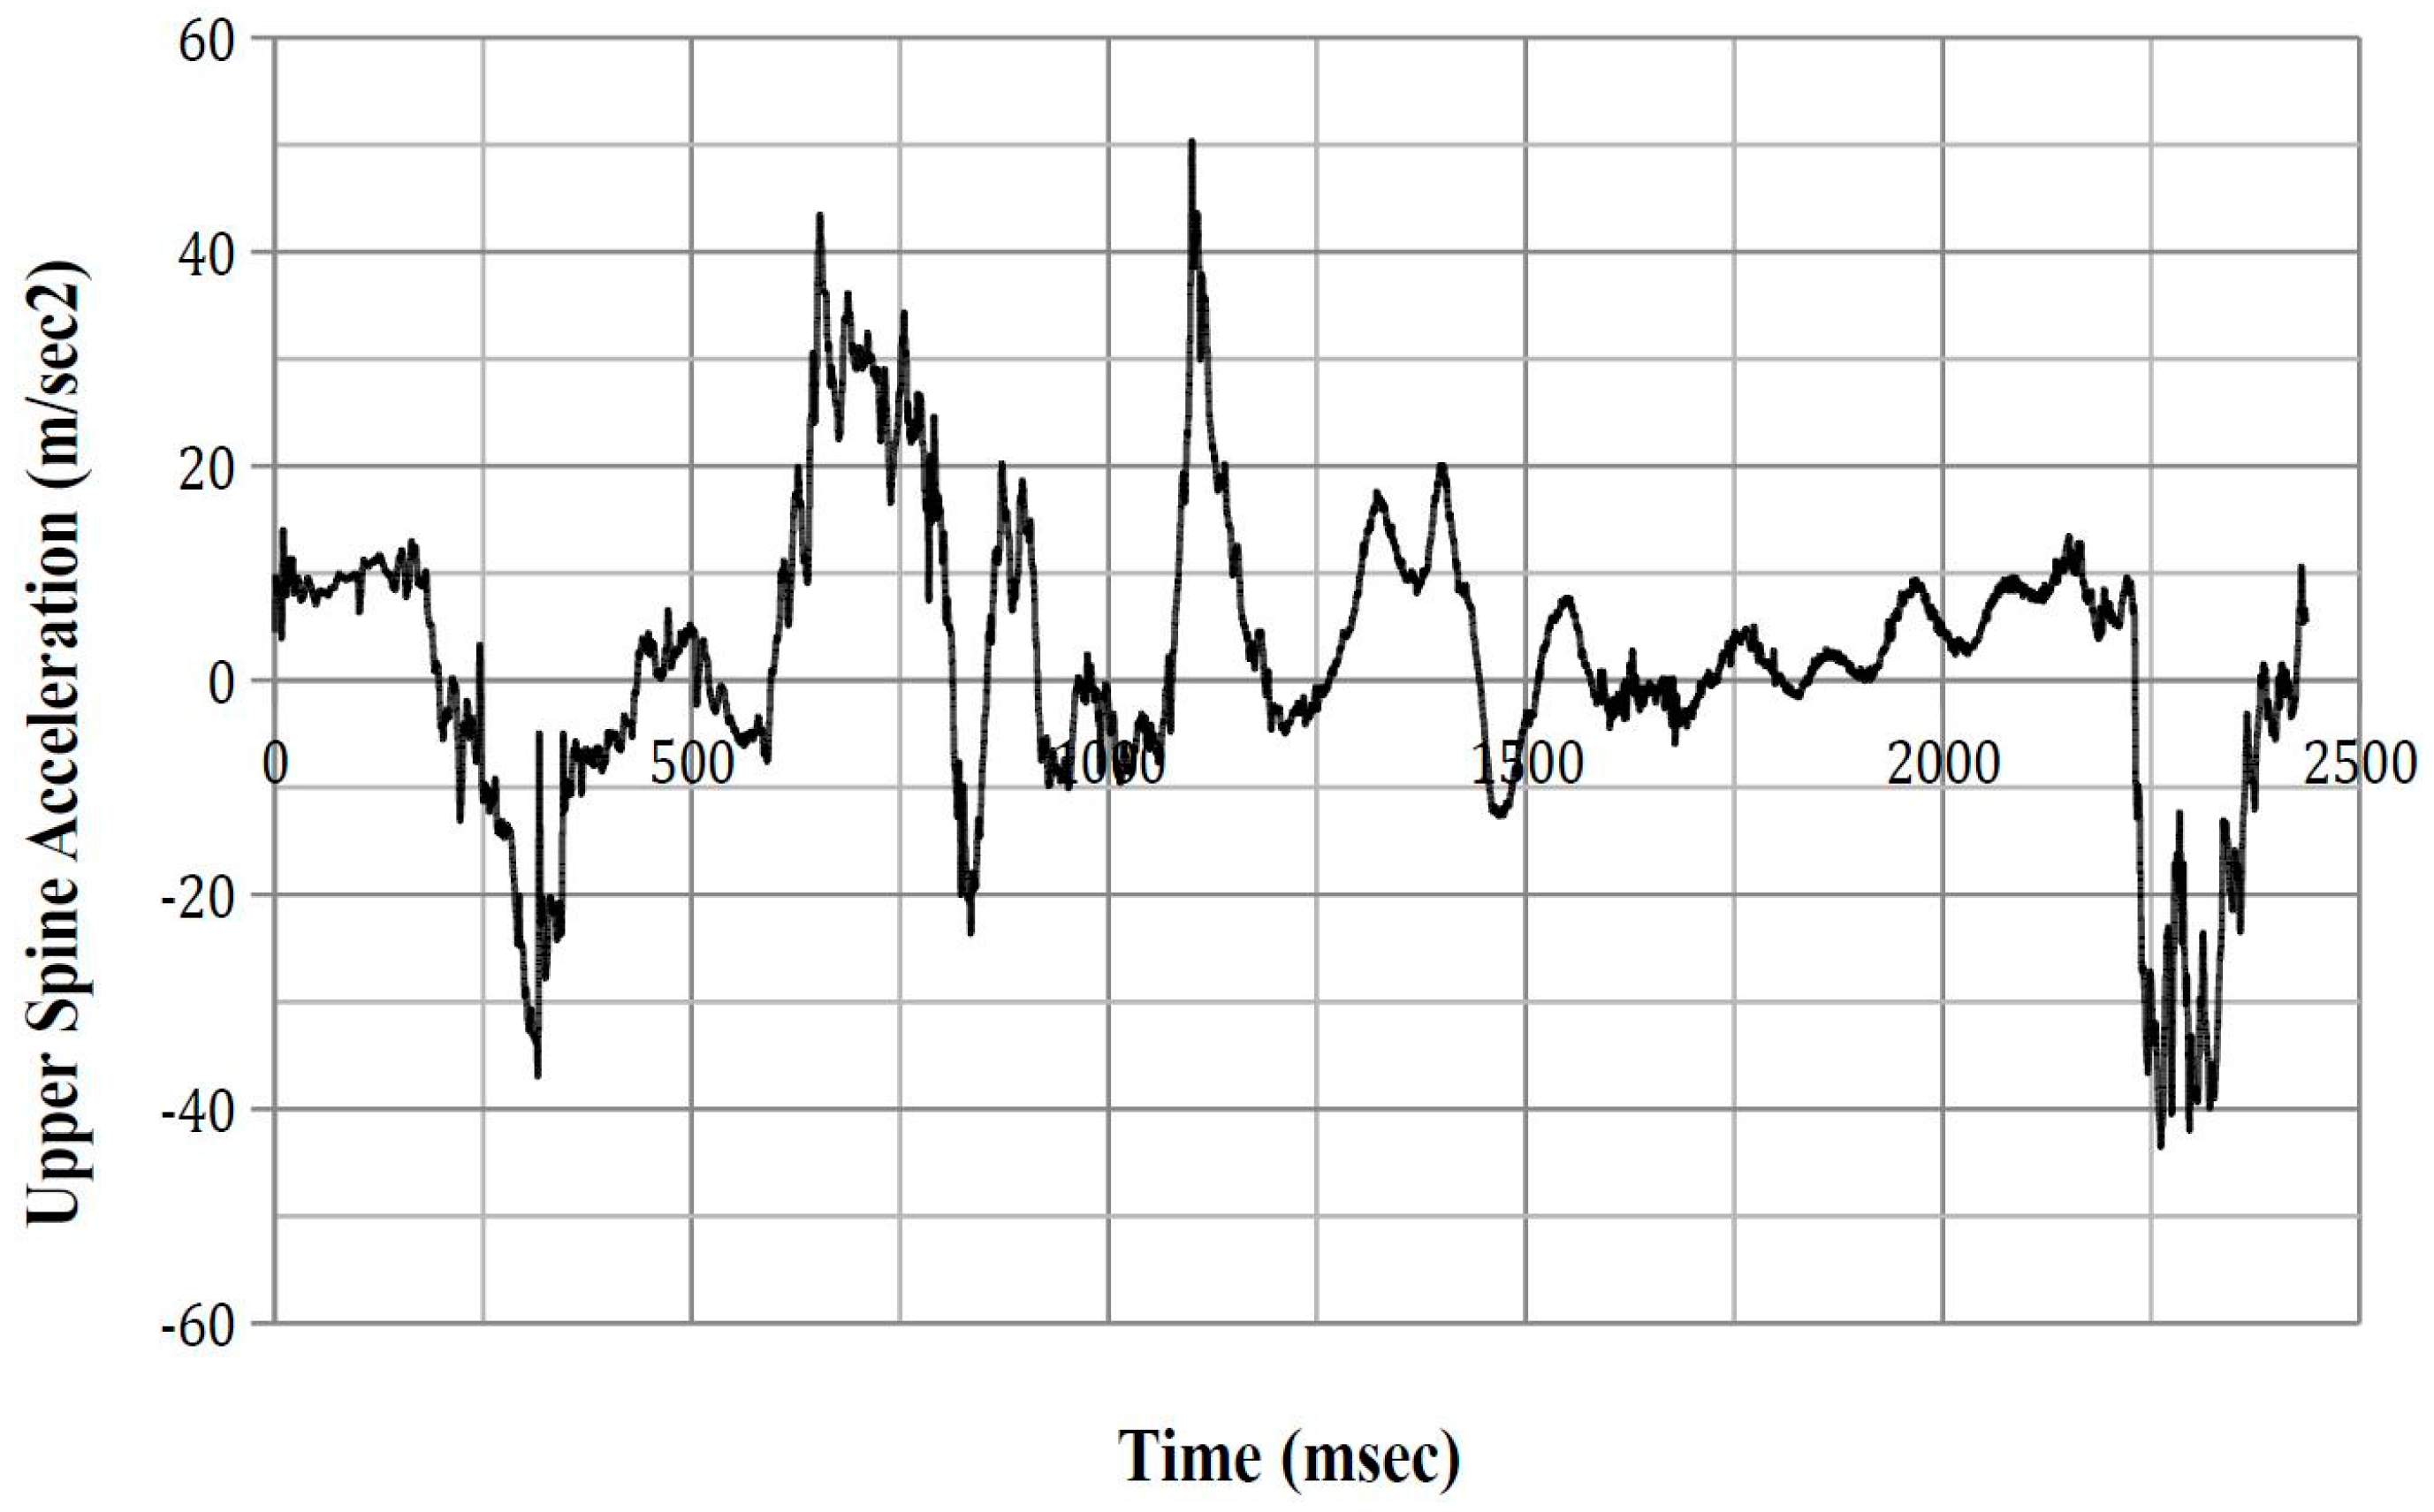
3.2.2. Upper and Lower Spinal Acceleration
The peak upper and lower spinal accelerations when the ATD contacted the left vehicle interior and impacted the centre console are presented in Table 7 and Table 8, respectively. A time–history plot of the upper and lower spinal acceleration for each ATD position is presented in Appendix D and Appendix E, respectively.
3.2.3. ASA-10
ASA-10 results are presented below (Table 9) with time–history plots presented in Appendix F.
3.2.4. Lateral Thorax Impact Velocity
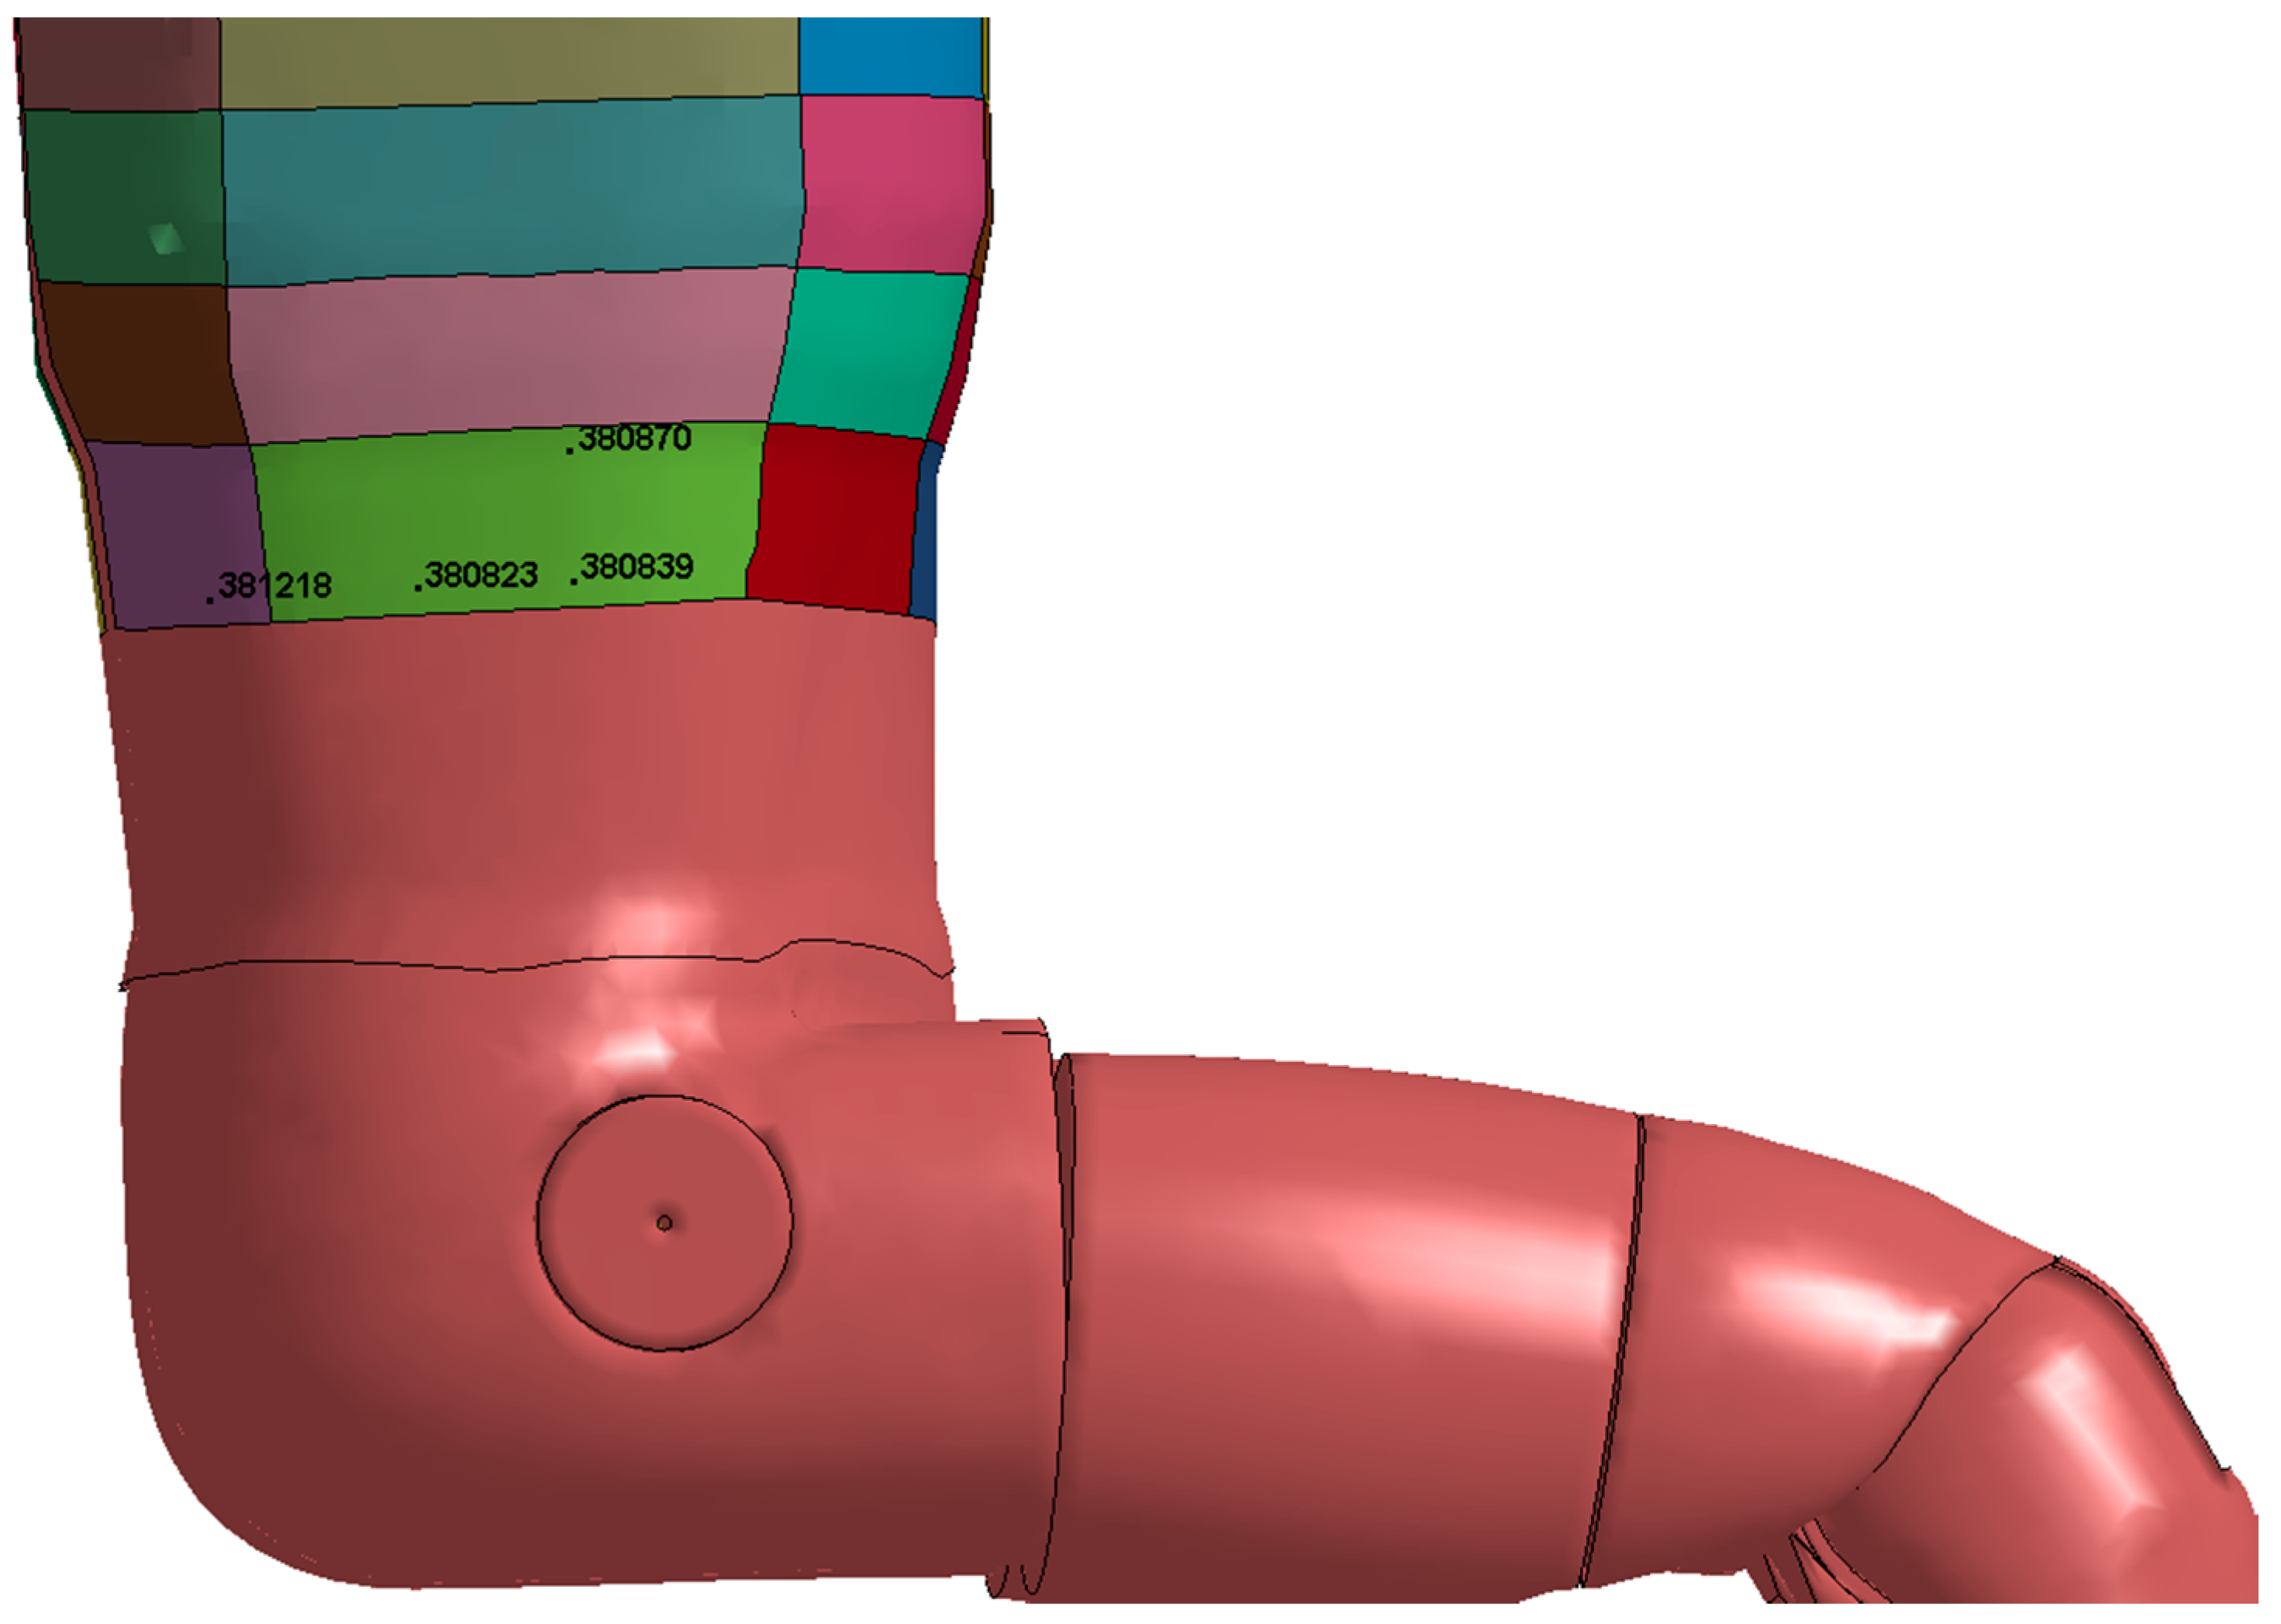
The peak lateral thorax impact velocity from each simulation is presented in Table 10. Figure 7 indicates the location of the Node IDs references in the table. A time–history plot of impact velocity for these nodes is presented in Appendix G.
3.2.5. Thorax Force
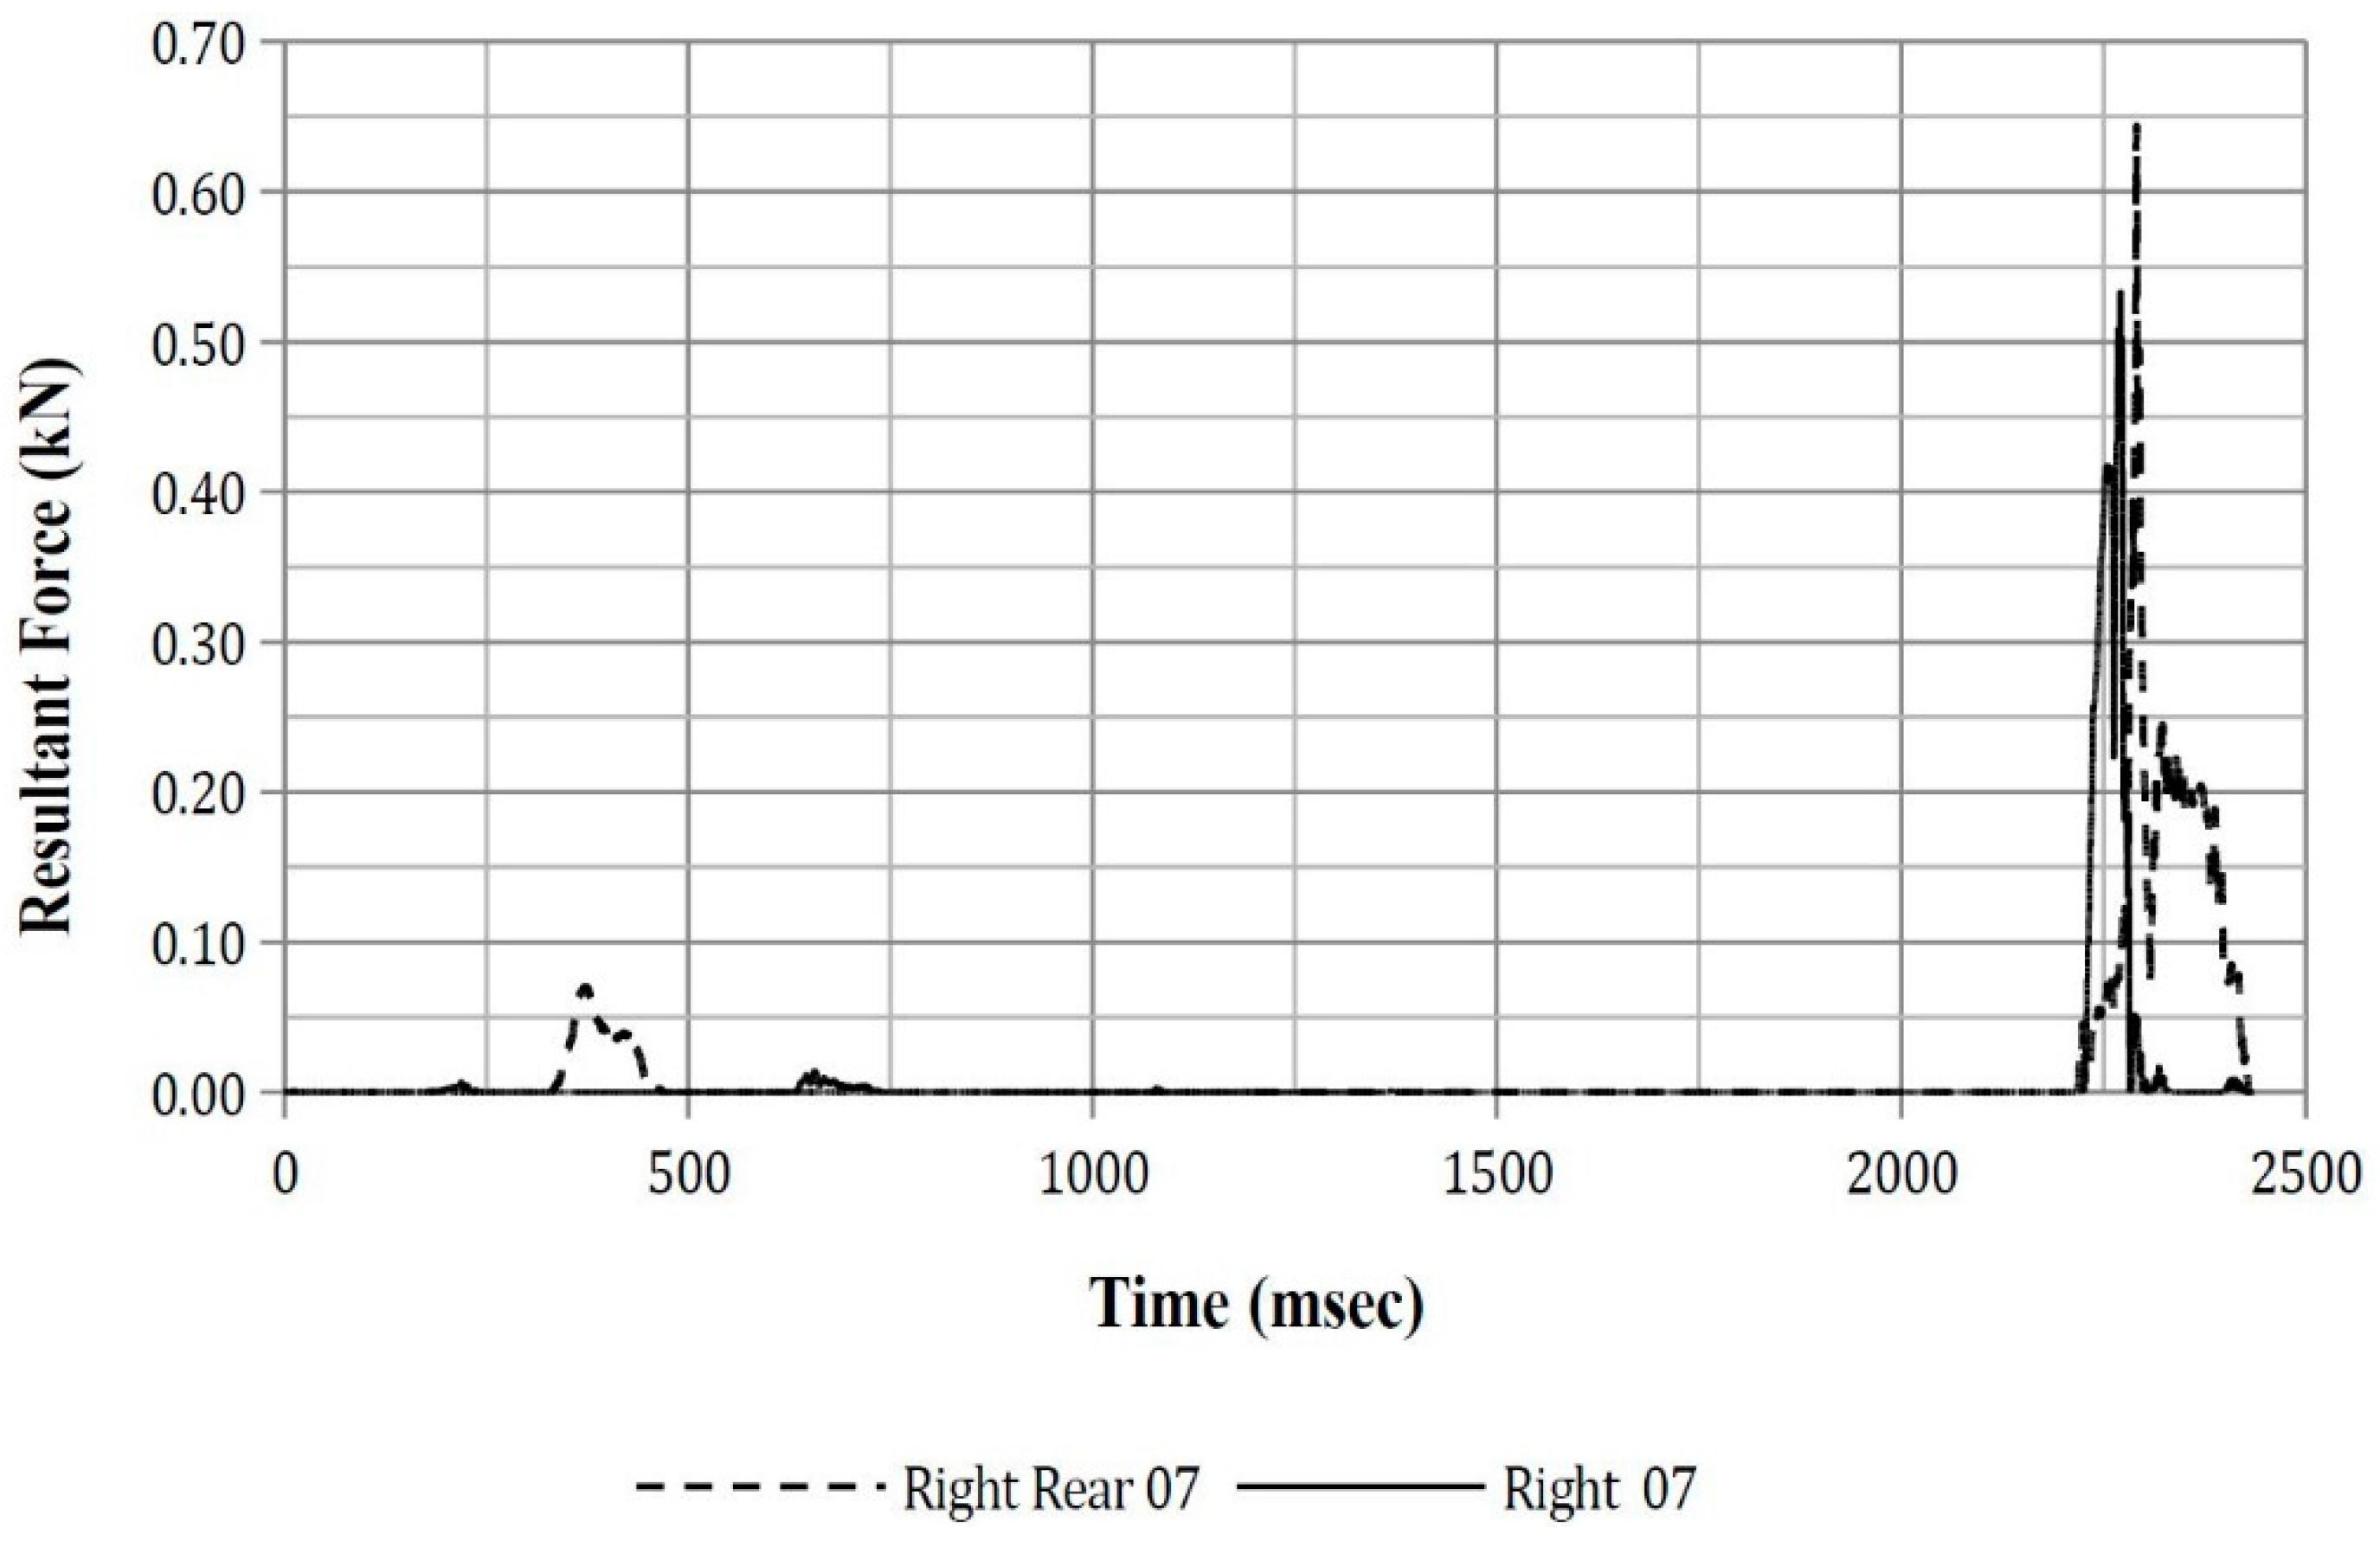
The peak resultant force from the four simulations is presented in Table 11 and the peak resultant force from thorax to centre console impact is presented in Table 12. A time–history plot of the resultant thoracic force for each of the thorax segment referred to in Table 11 and Table 12 is presented in Appendix H.
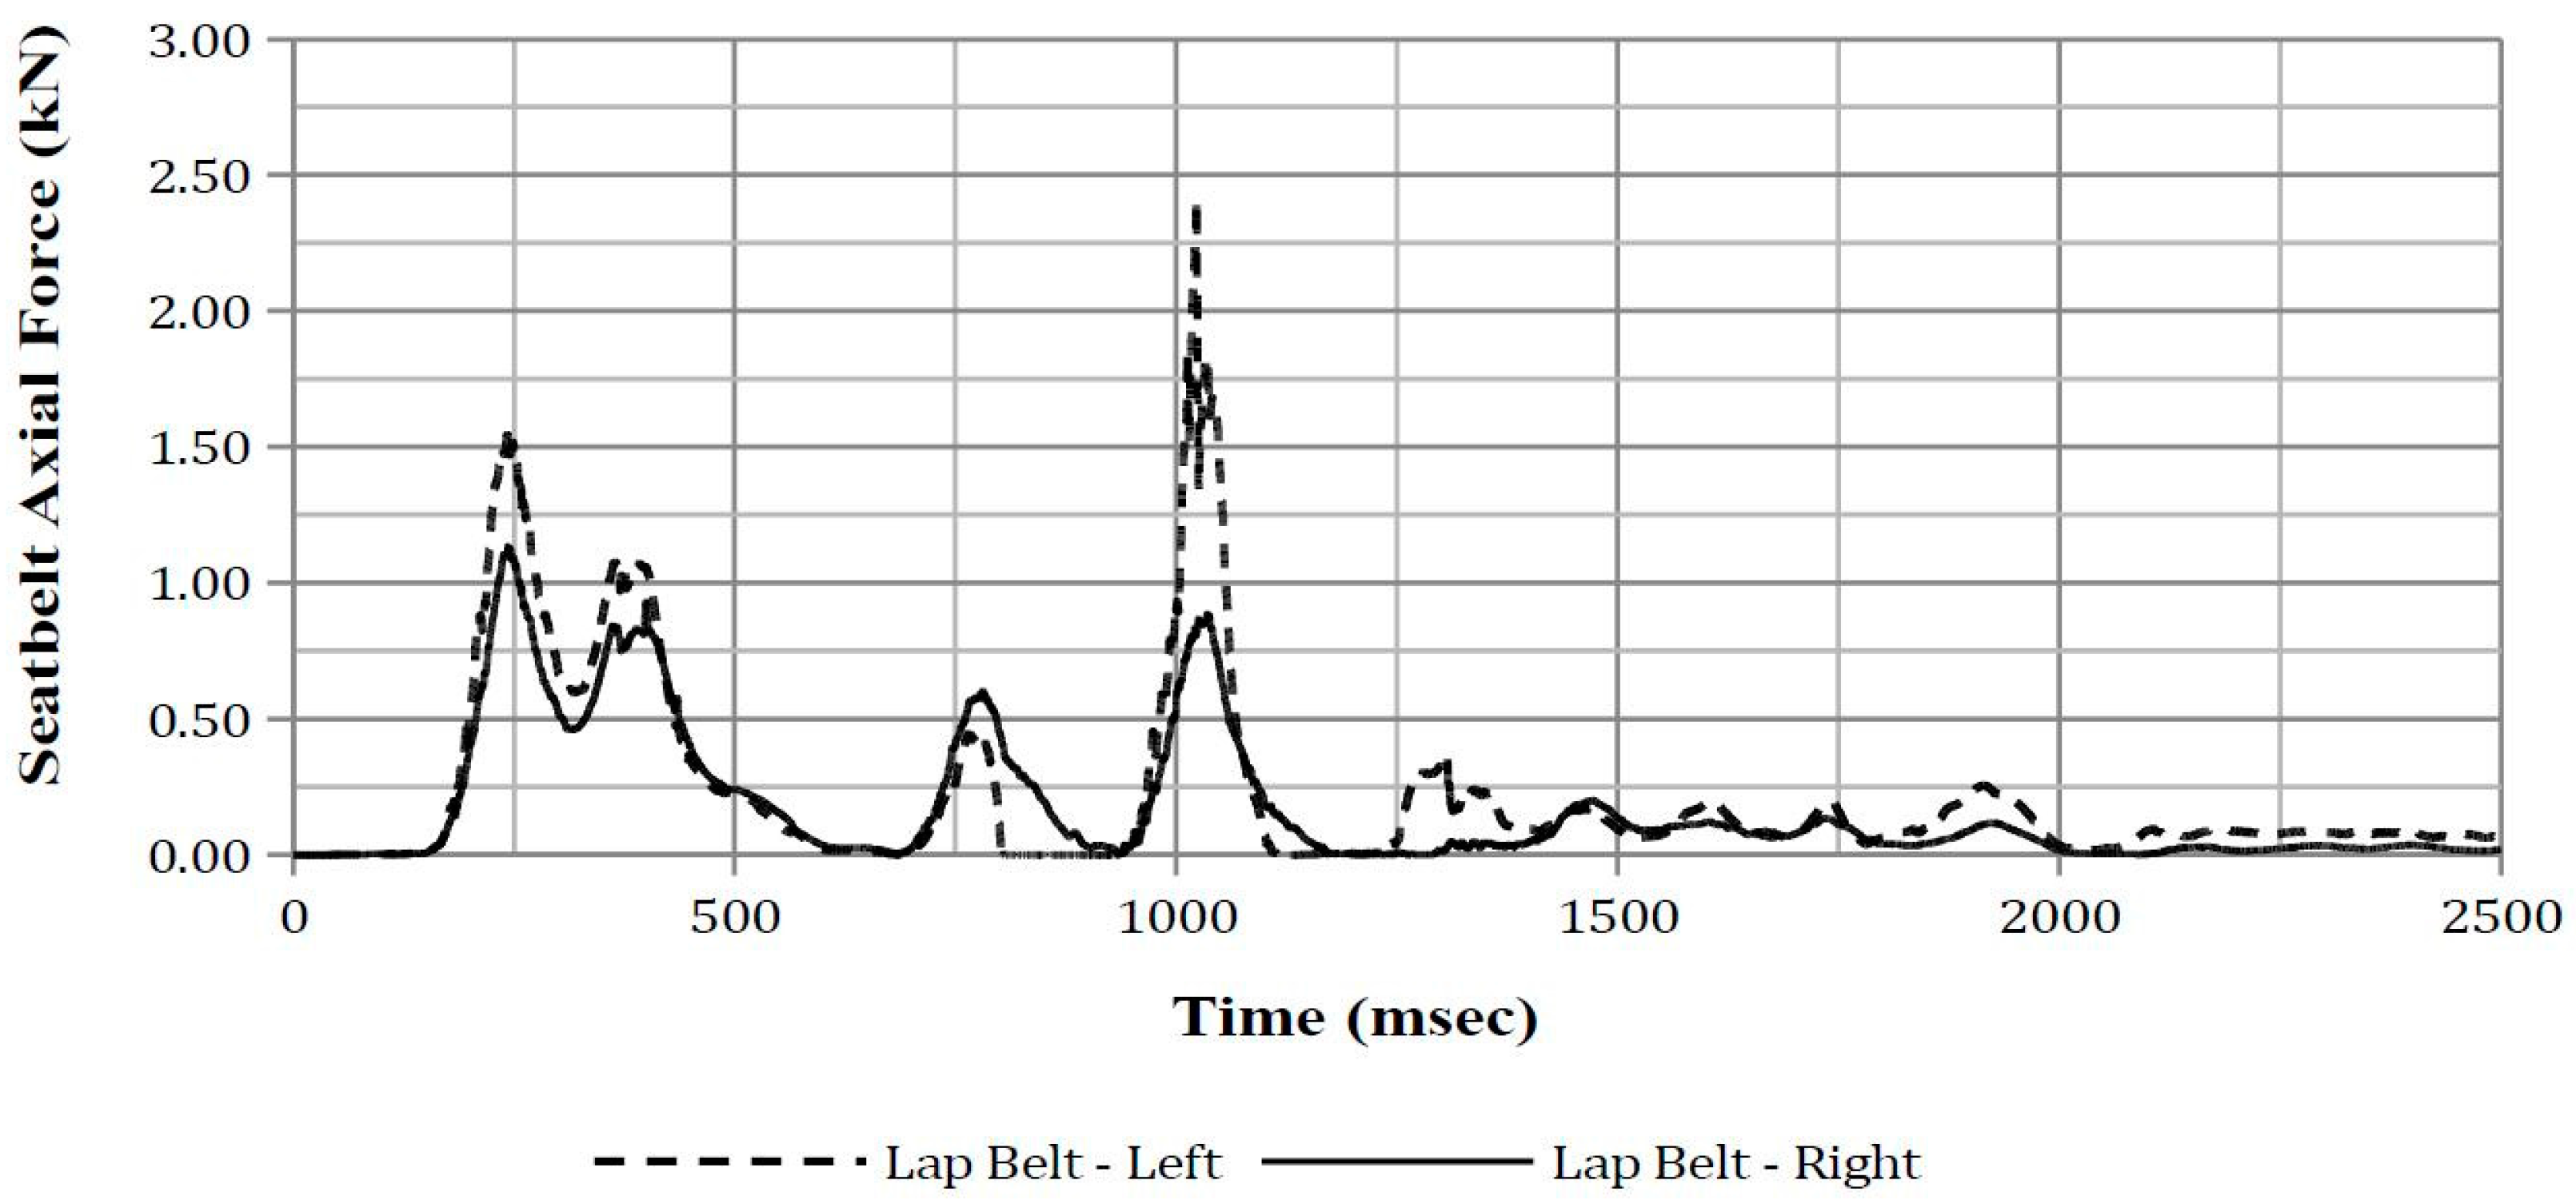
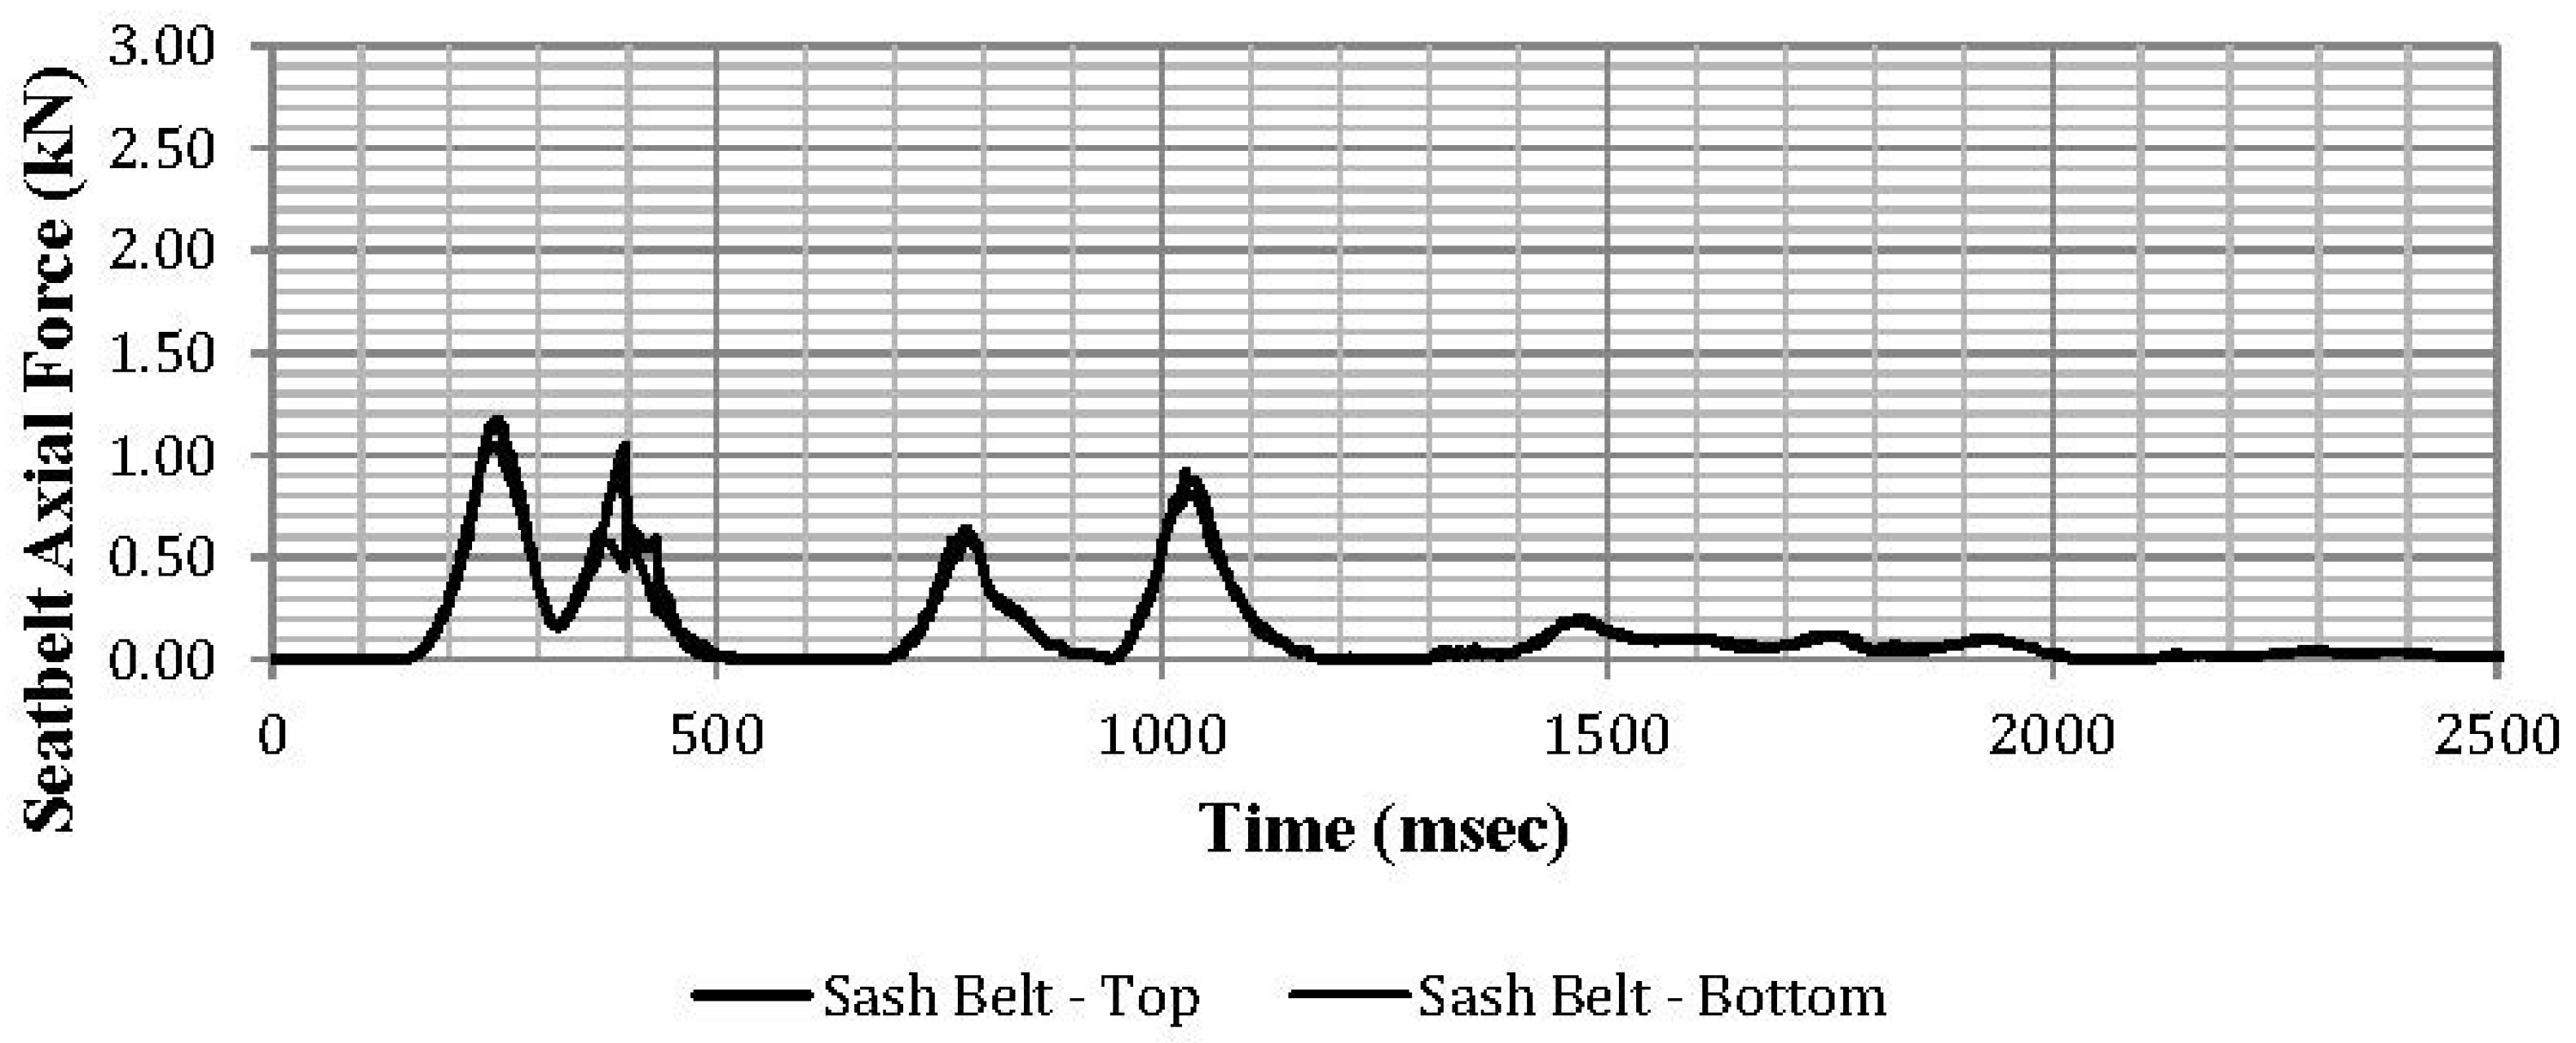
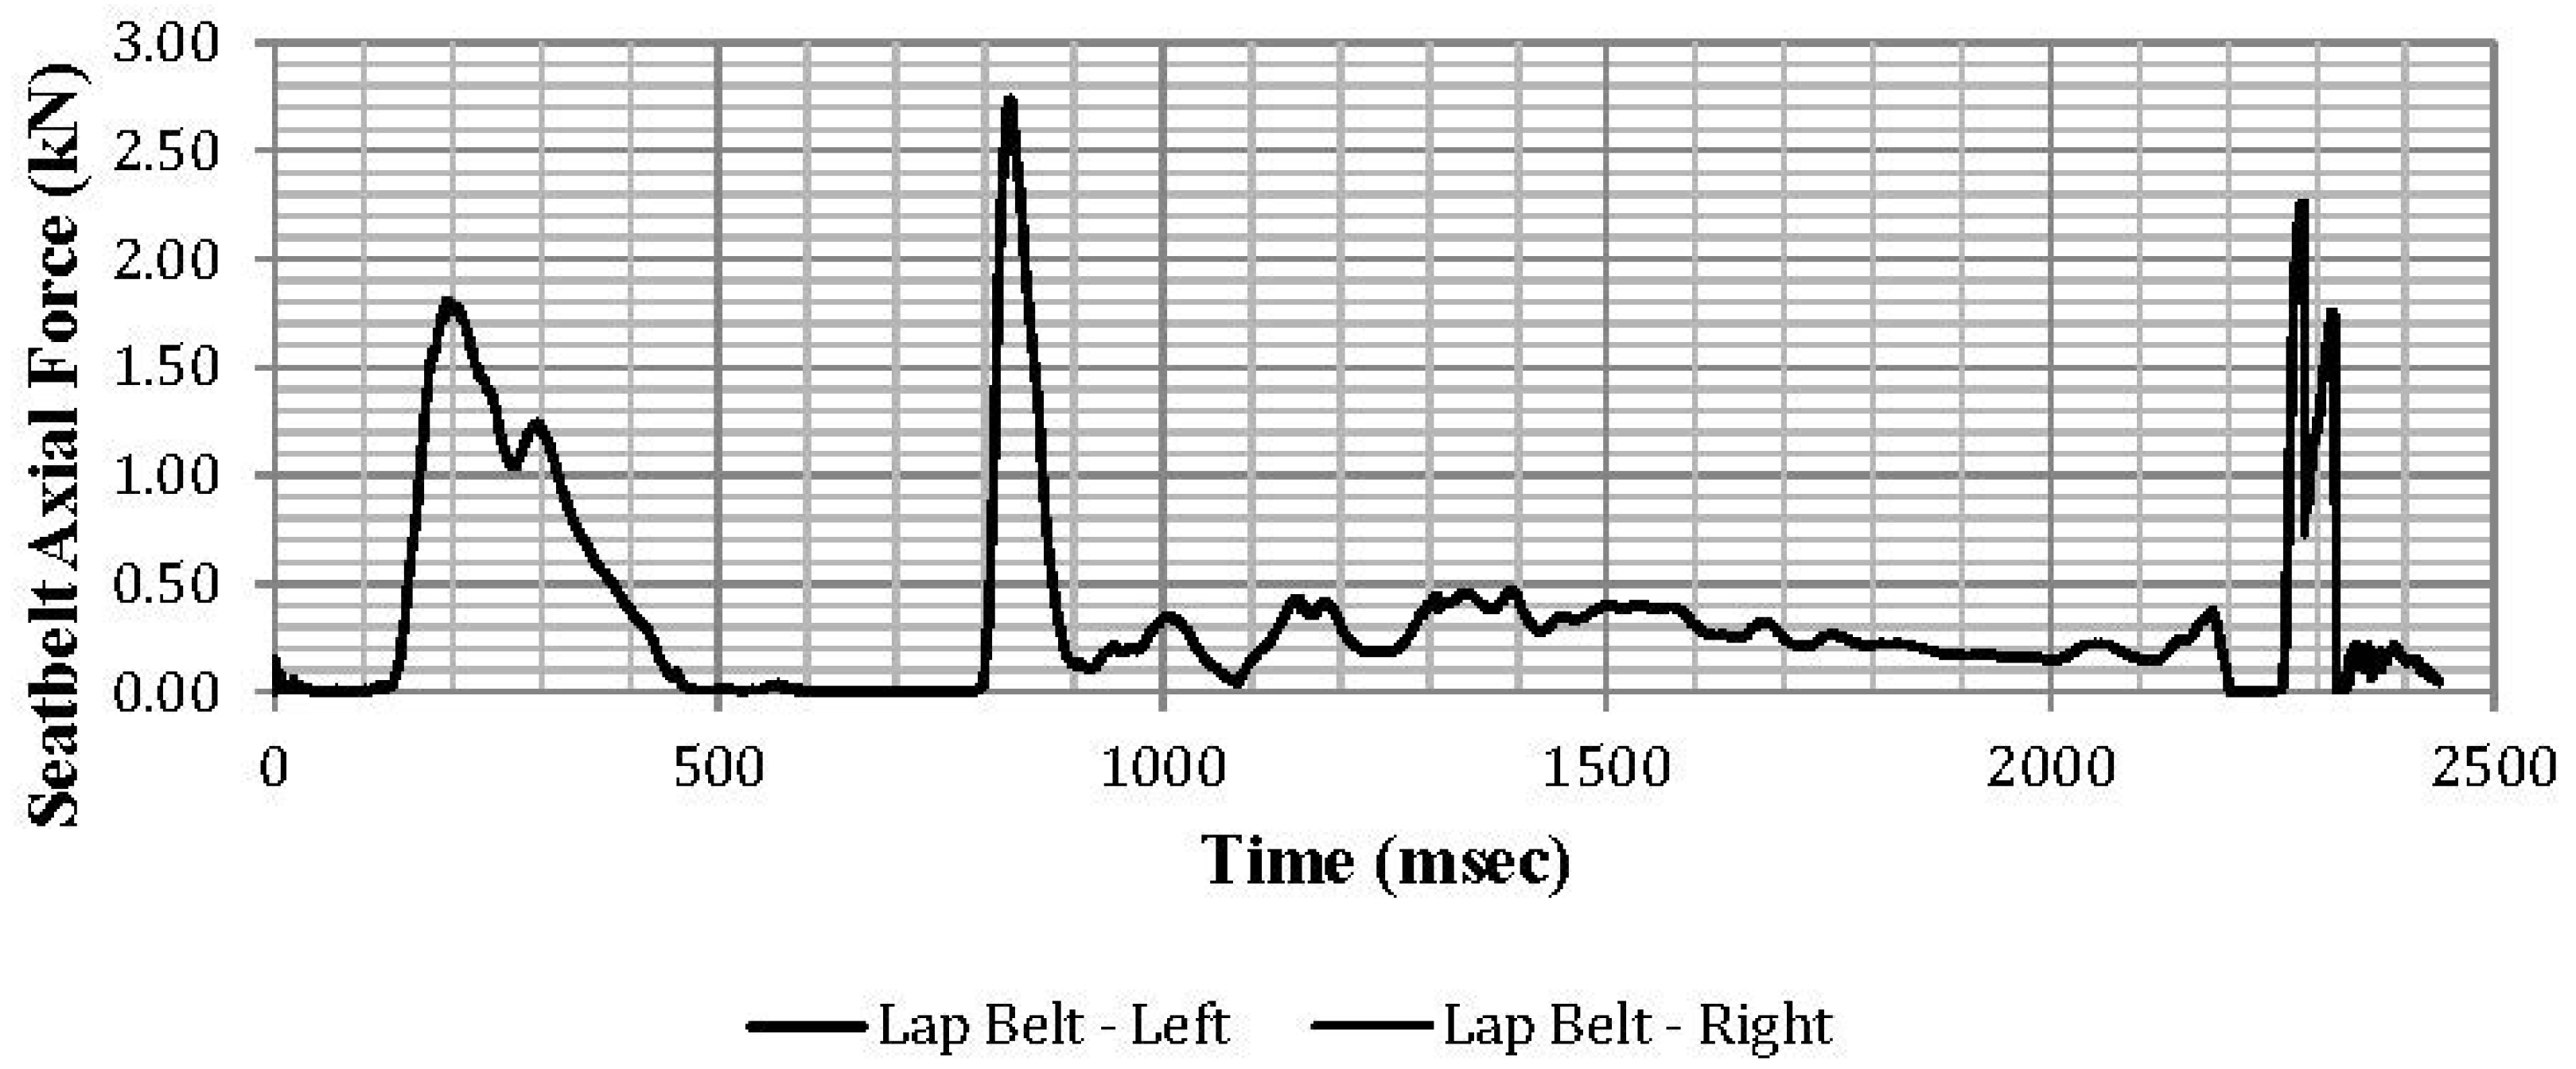
3.2.6. Seatbelt Axial Force
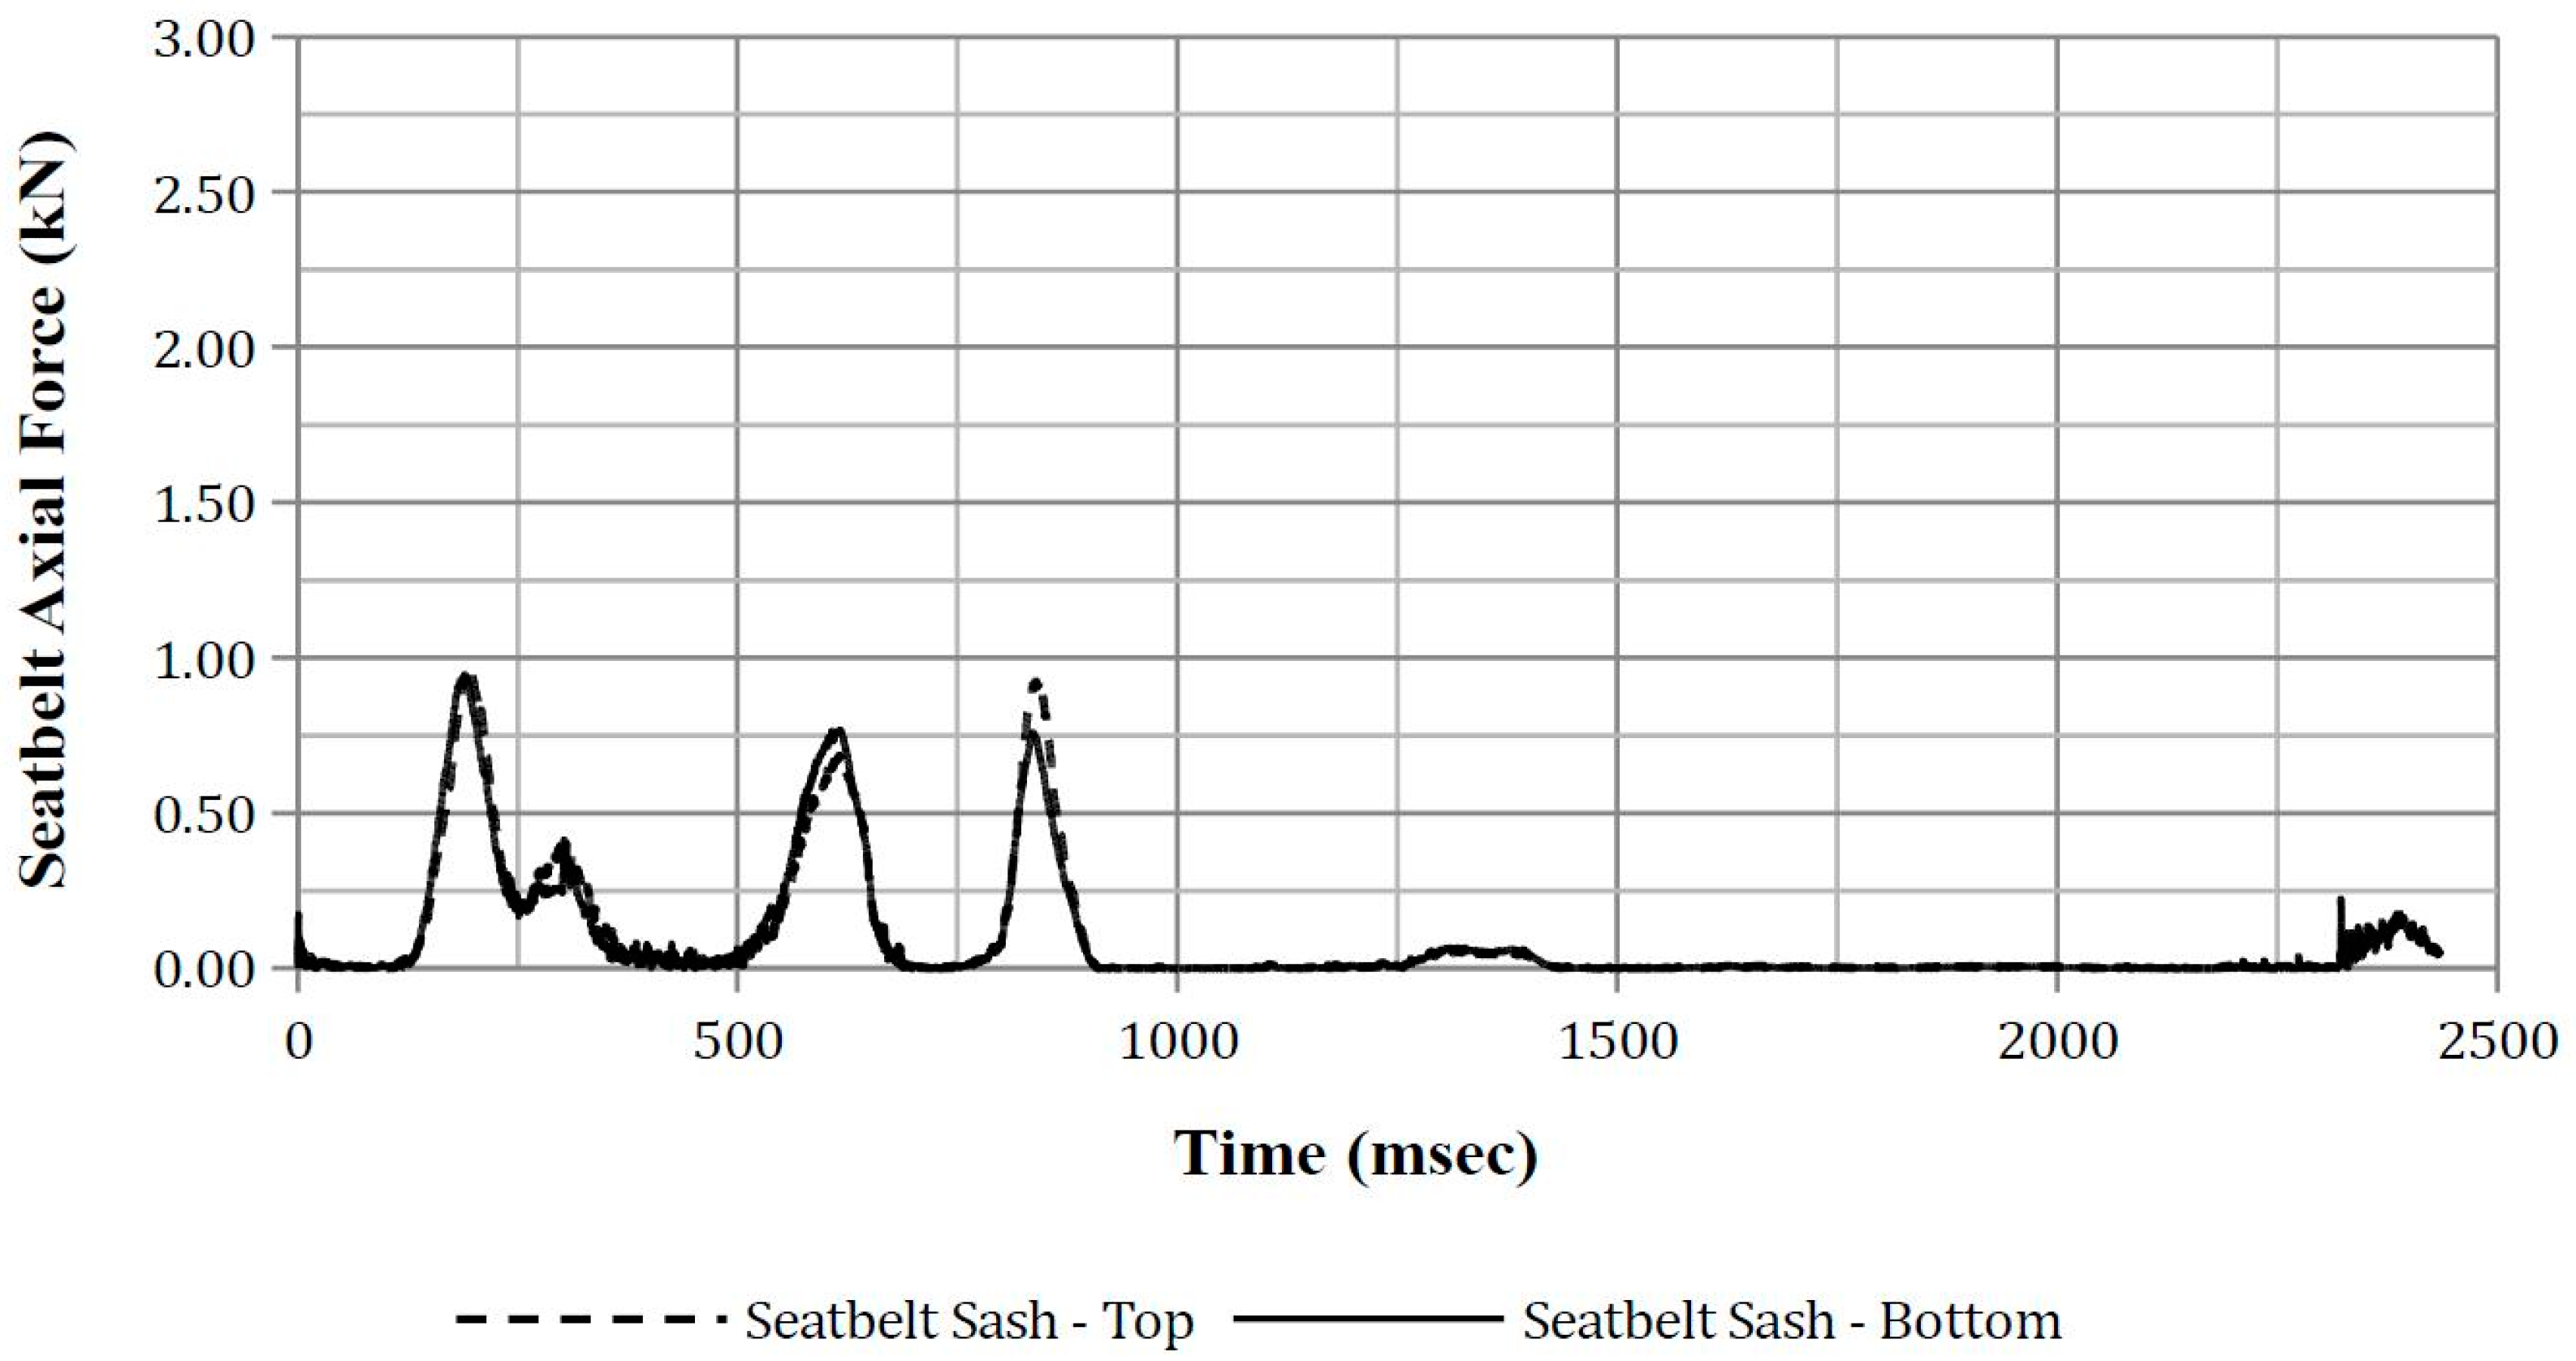
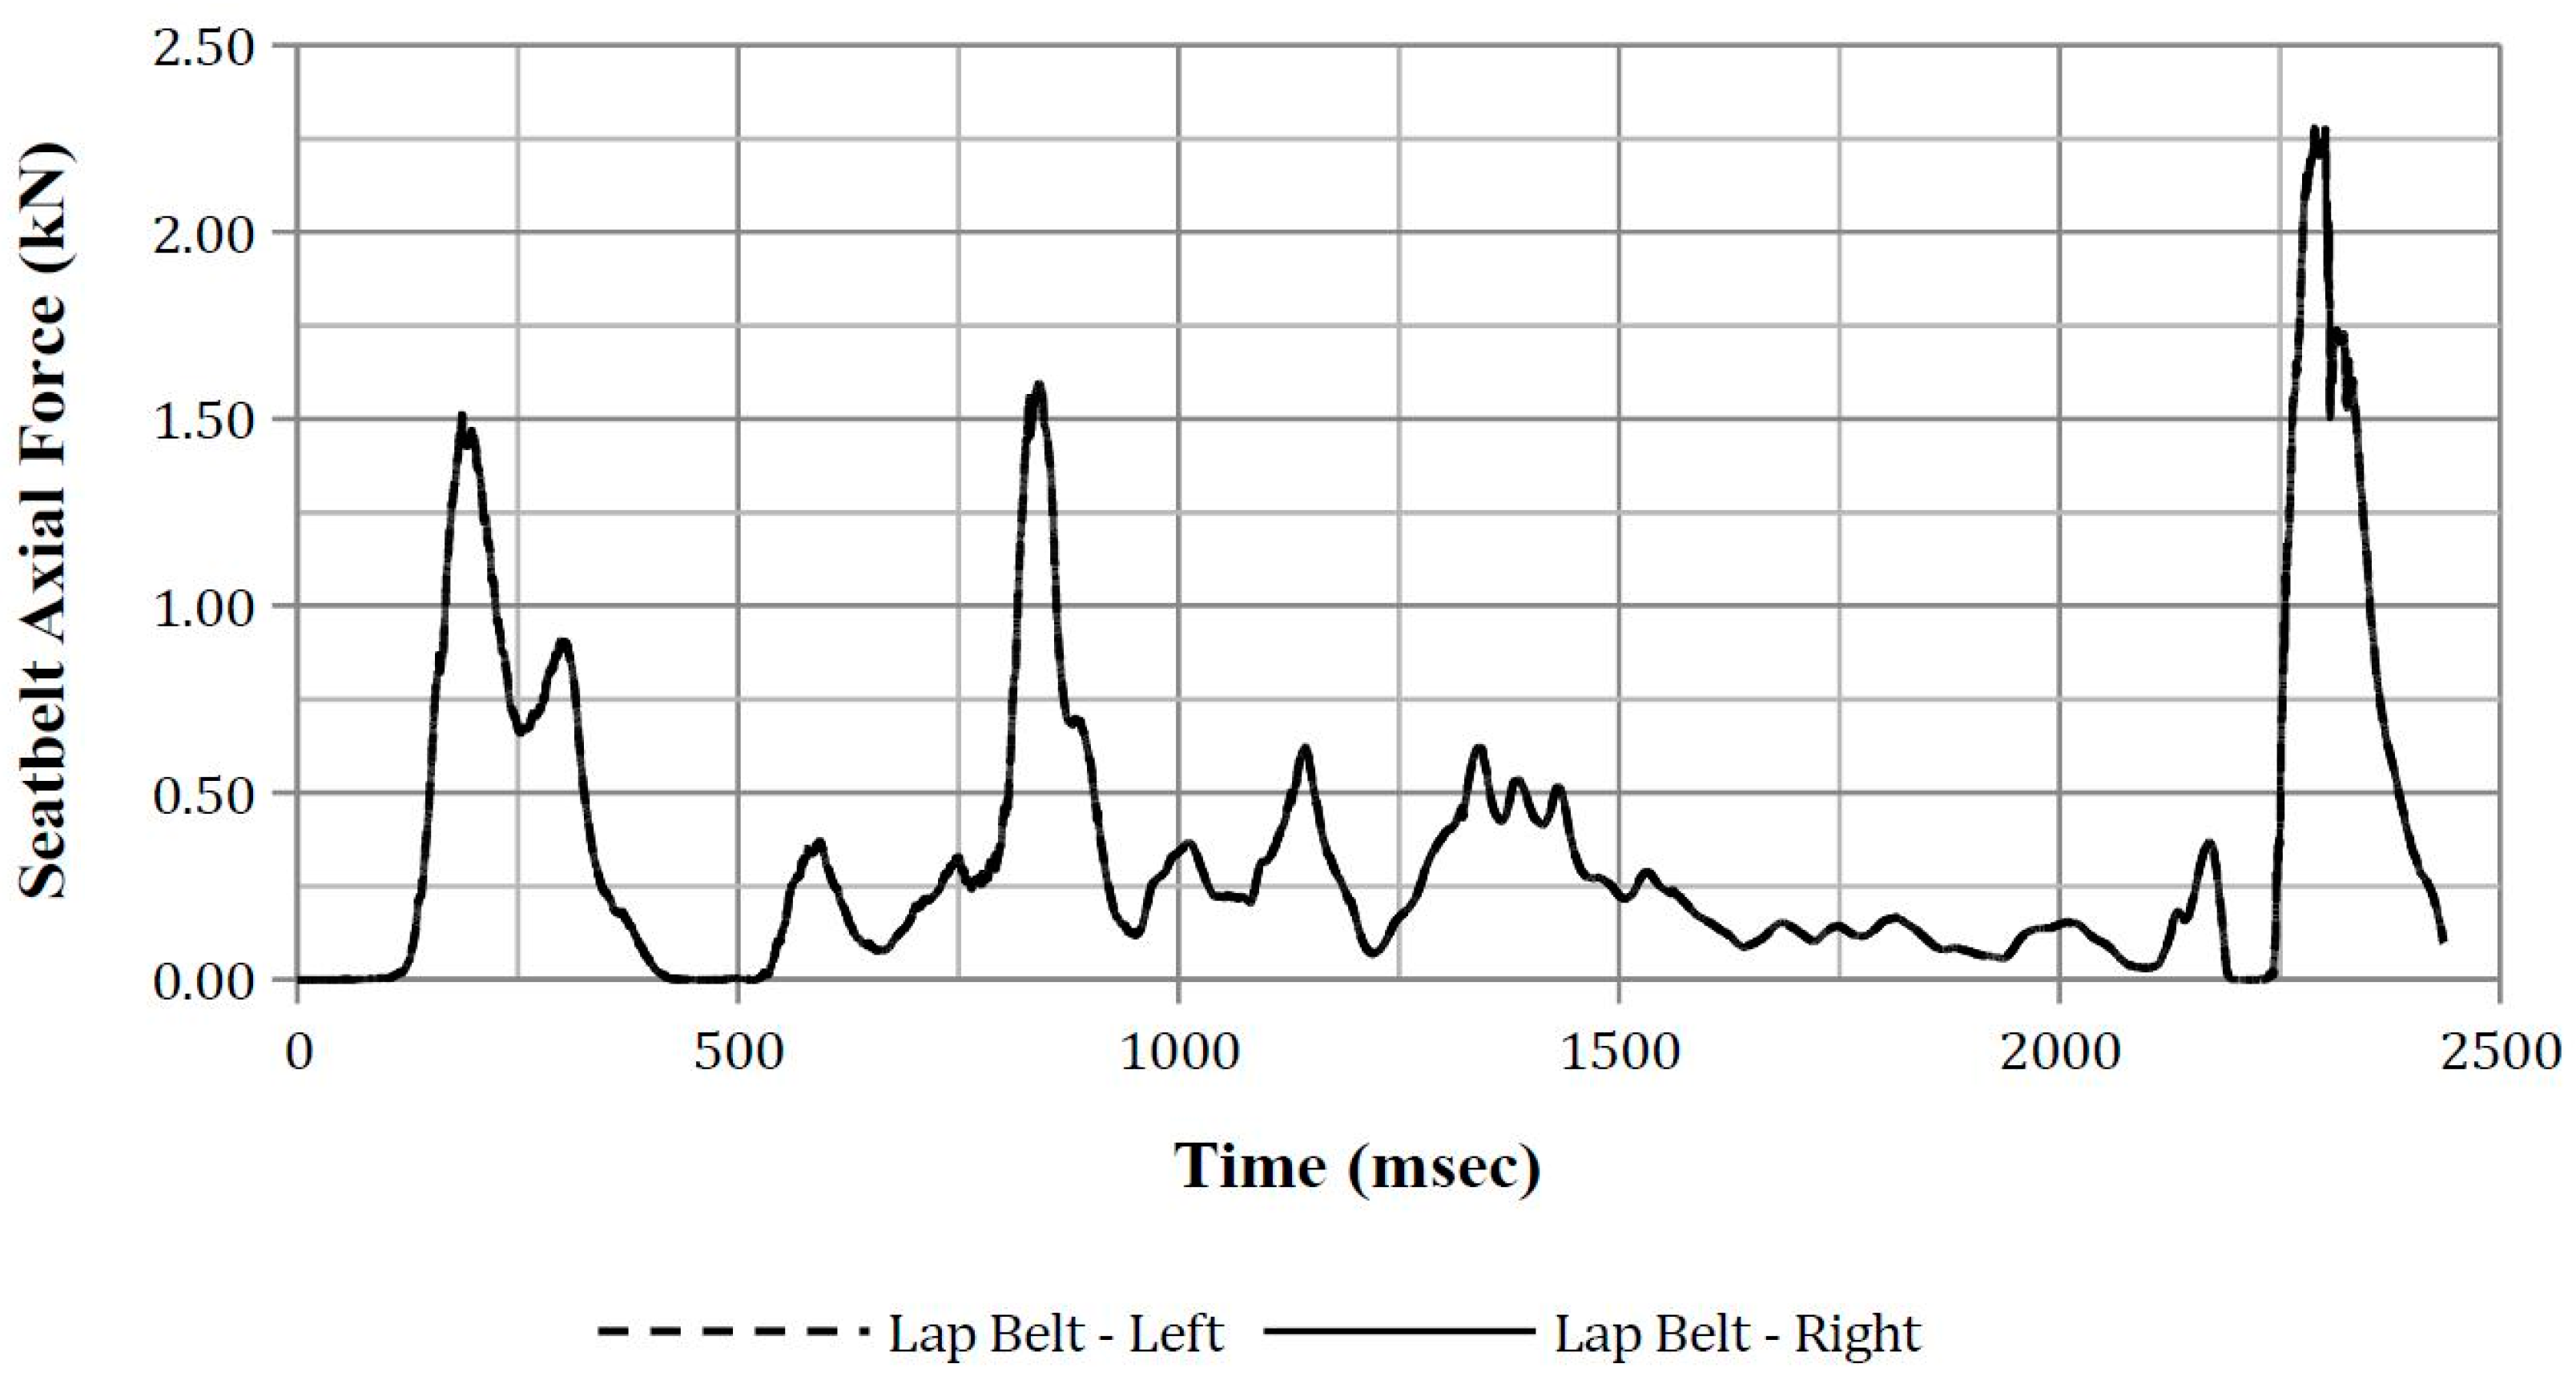
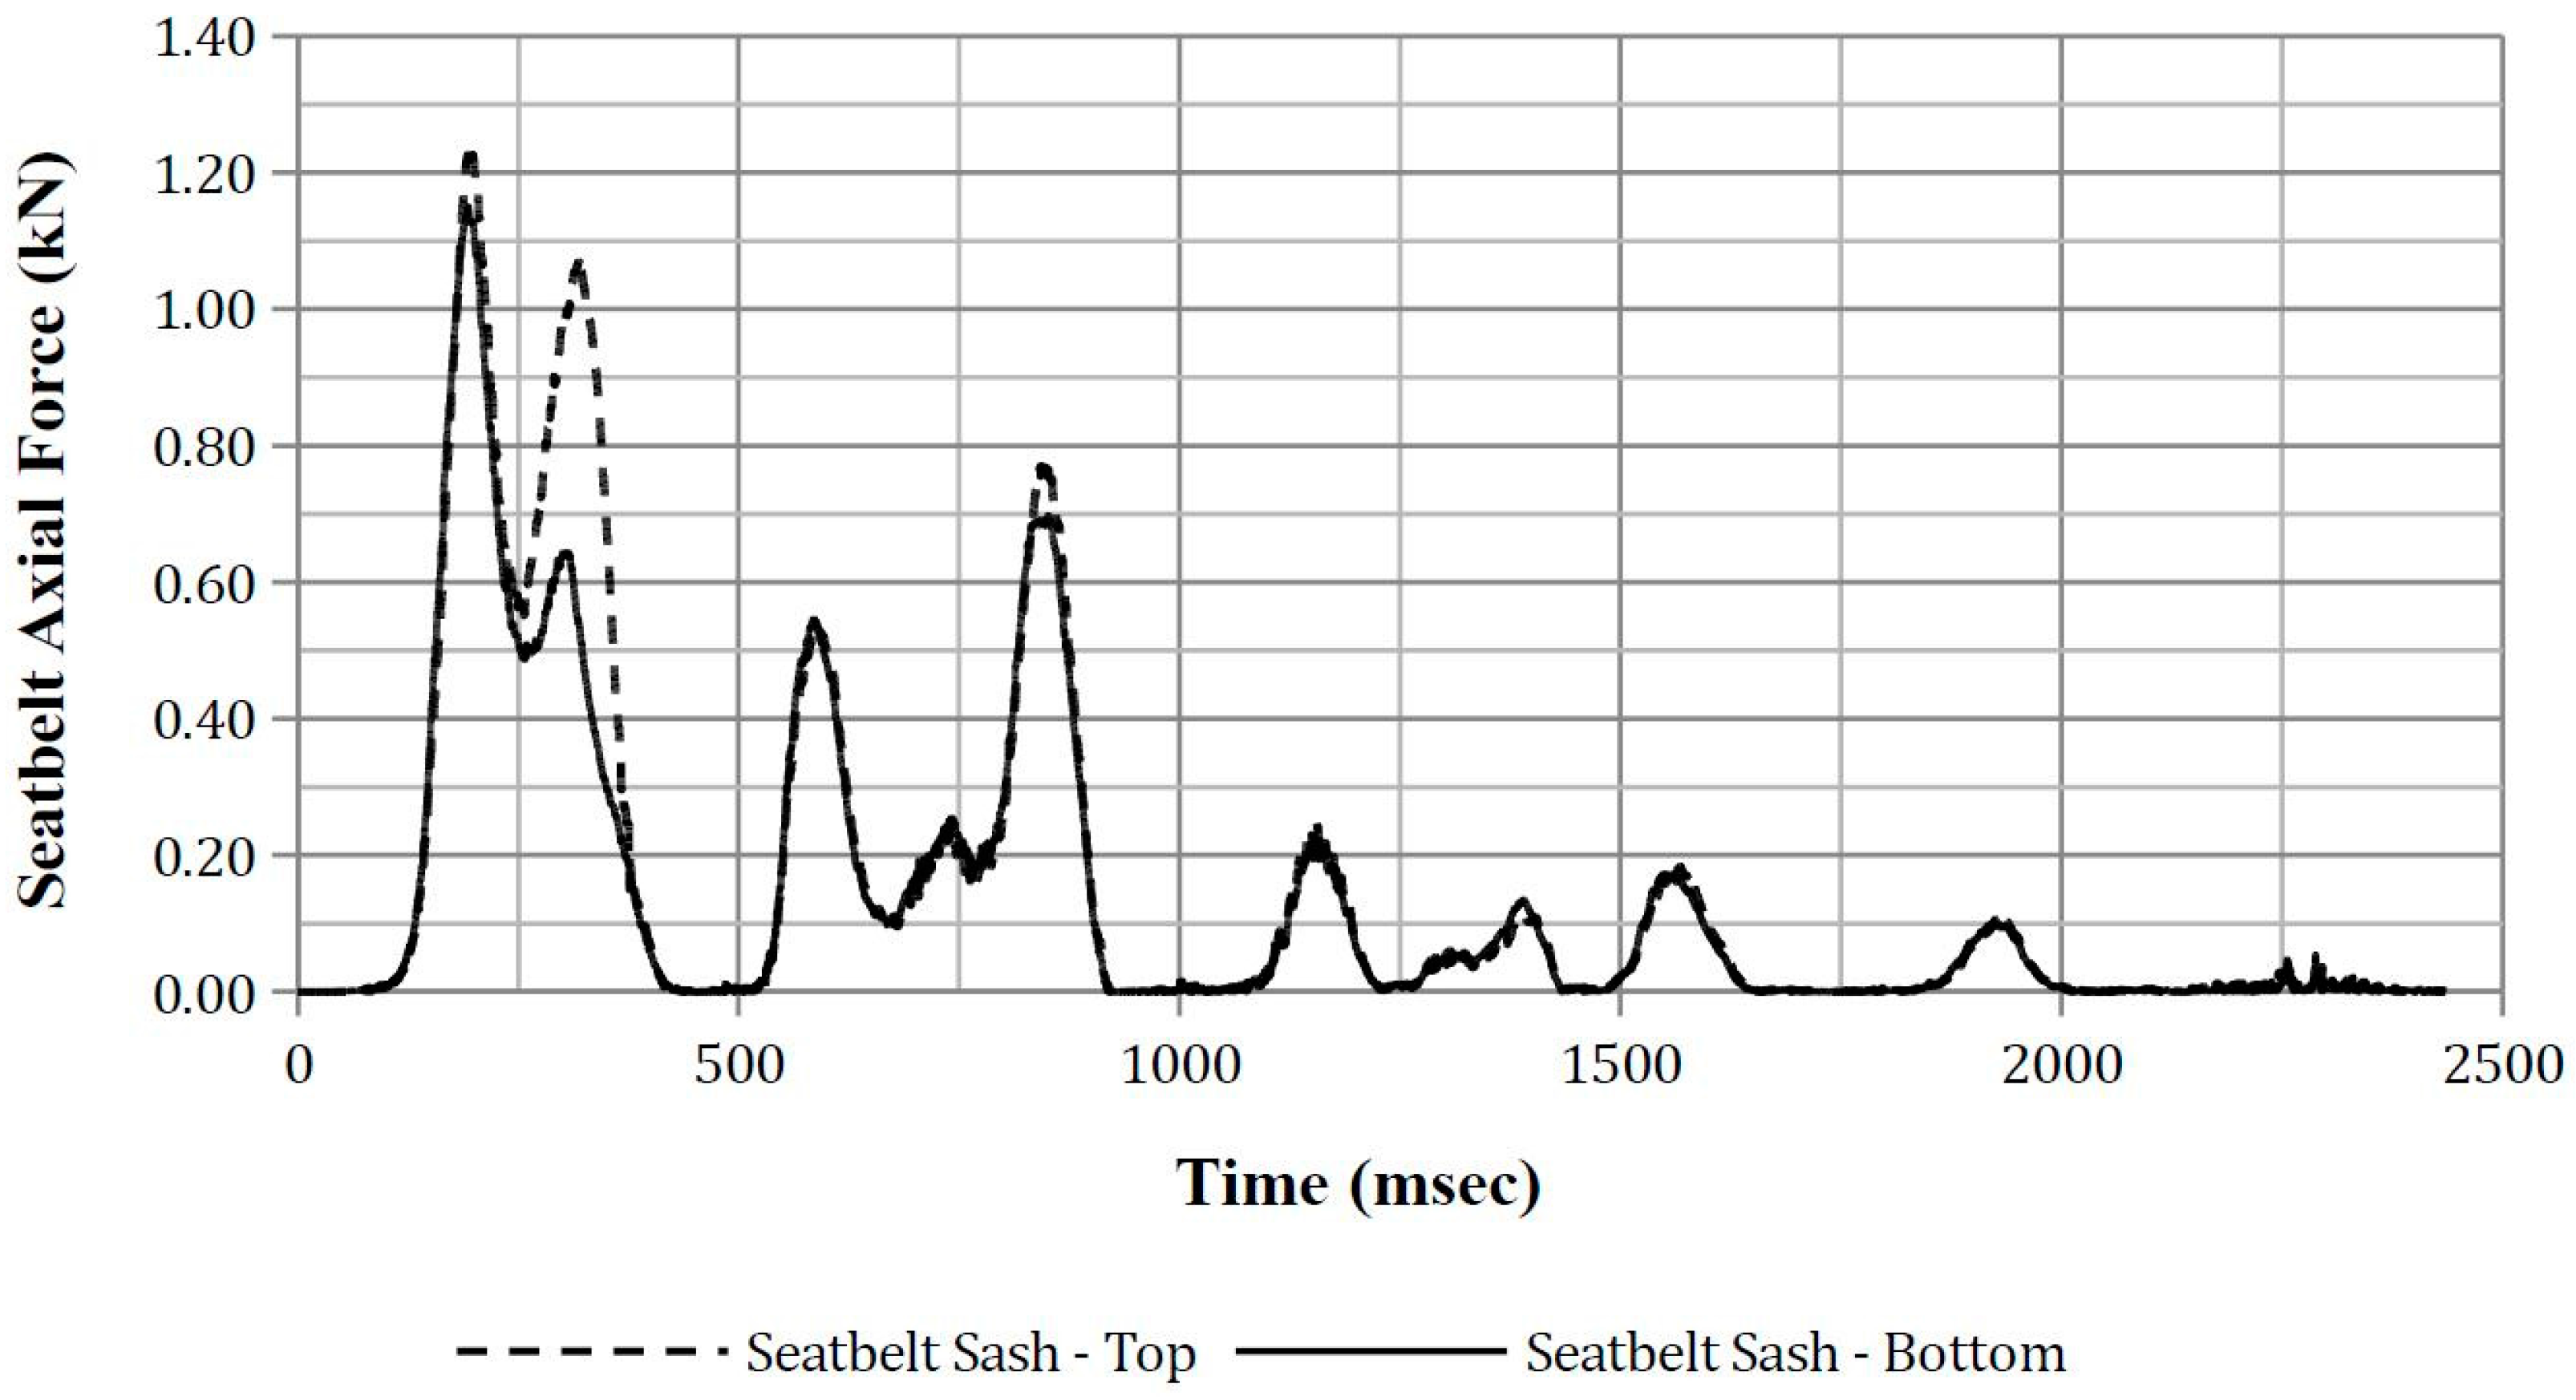
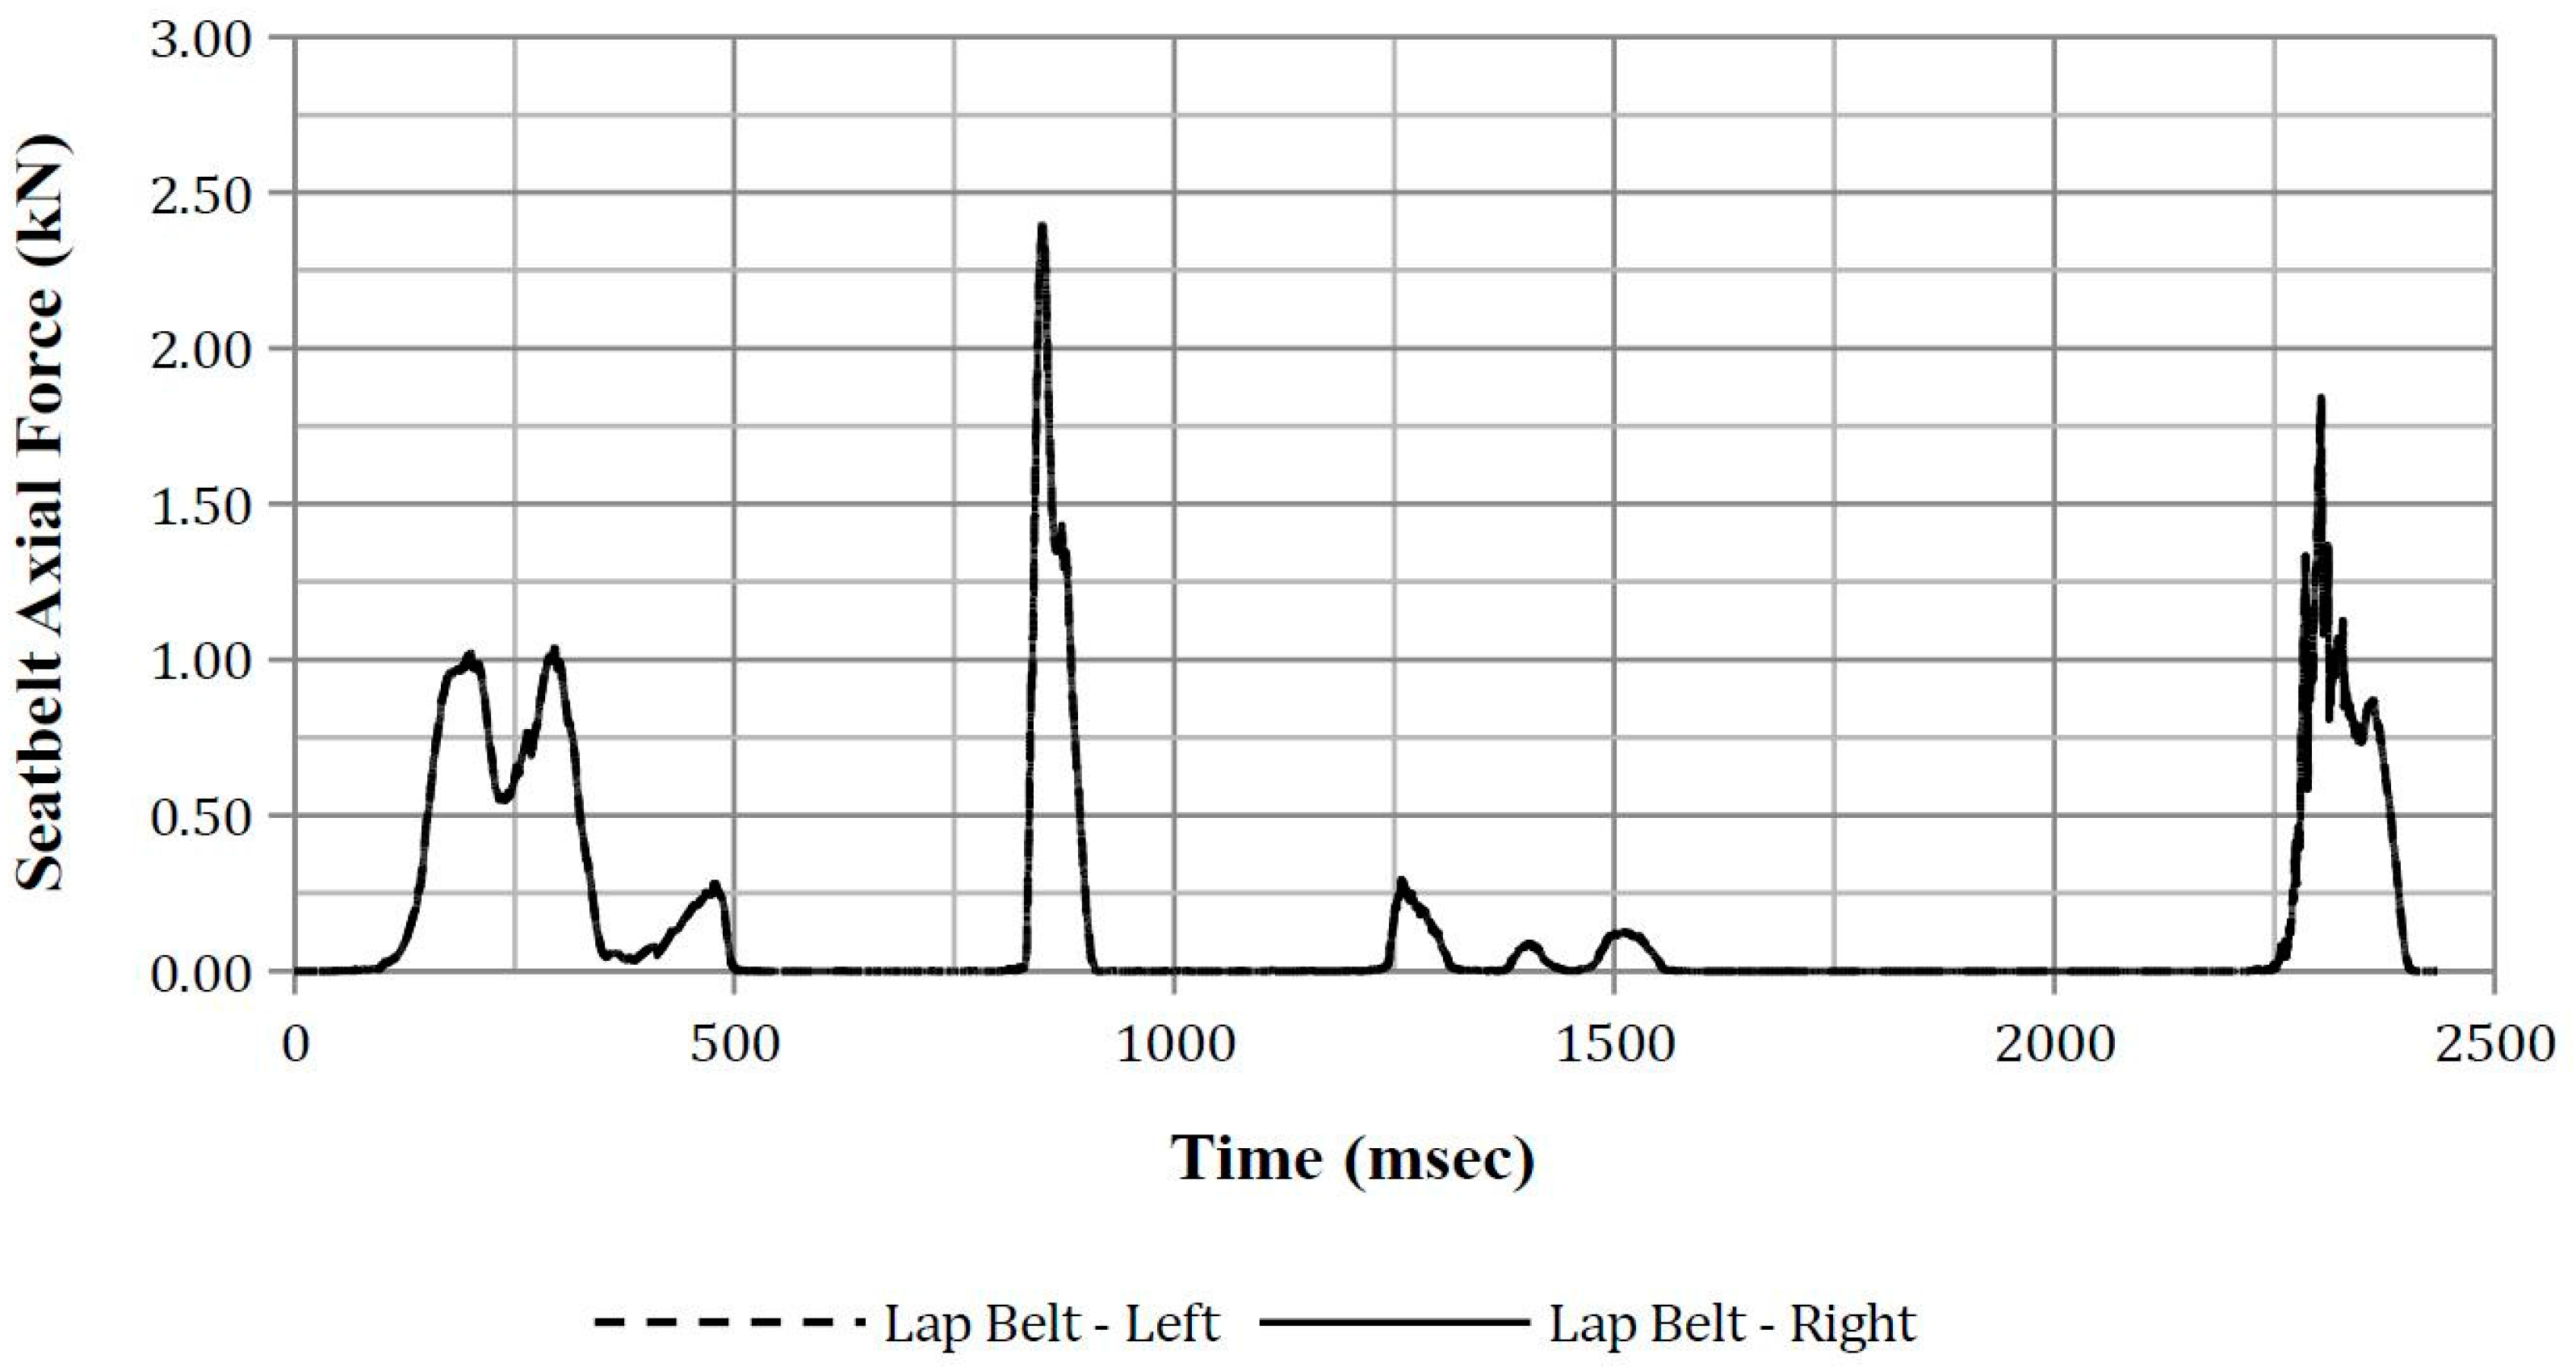
The peak seatbelt axial forces from the four simulations are presented in Table 13 and Table 14 for the lap and sash belt, respectively. A time–history plot of seatbelt axial force is presented in Appendix I.
4. Discussion
4.1. Finite Element Vehicle Simulation
The FE simulation resulted in the vehicle rollover occurring over a distance of 8 m. This was 2 m shorter than that reported in the NASS-CDS case report of 10 m. A number of variables were altered in order to increase the roll distance which included increasing and decreasing the vehicle-to-ground friction coefficient, increasing the vehicle’s roll rate and increasing the vehicle’s transverse velocity. However, it was not possible to increase the roll distance from 8 to 10 m without a resulting increase in quarter-turns. However, from the analysis of vehicle intrusion (Table 5), it is noted that the FE model’s left A and B-pillar intrusion is similar to that reported by NASS-CDS in both magnitude and direction.
4.2. Finite Element Anthropomorphic Test Device Simulation
The results from rib deflection, upper and lower spinal acceleration, and ASA-10 indicate a low probability that an AIS3+ lateral thoracic injury had occurred. However, impact velocity indicates that an AIS3+ thoracic injury may have occurred during the fourth quarter-turn and is discussed below.
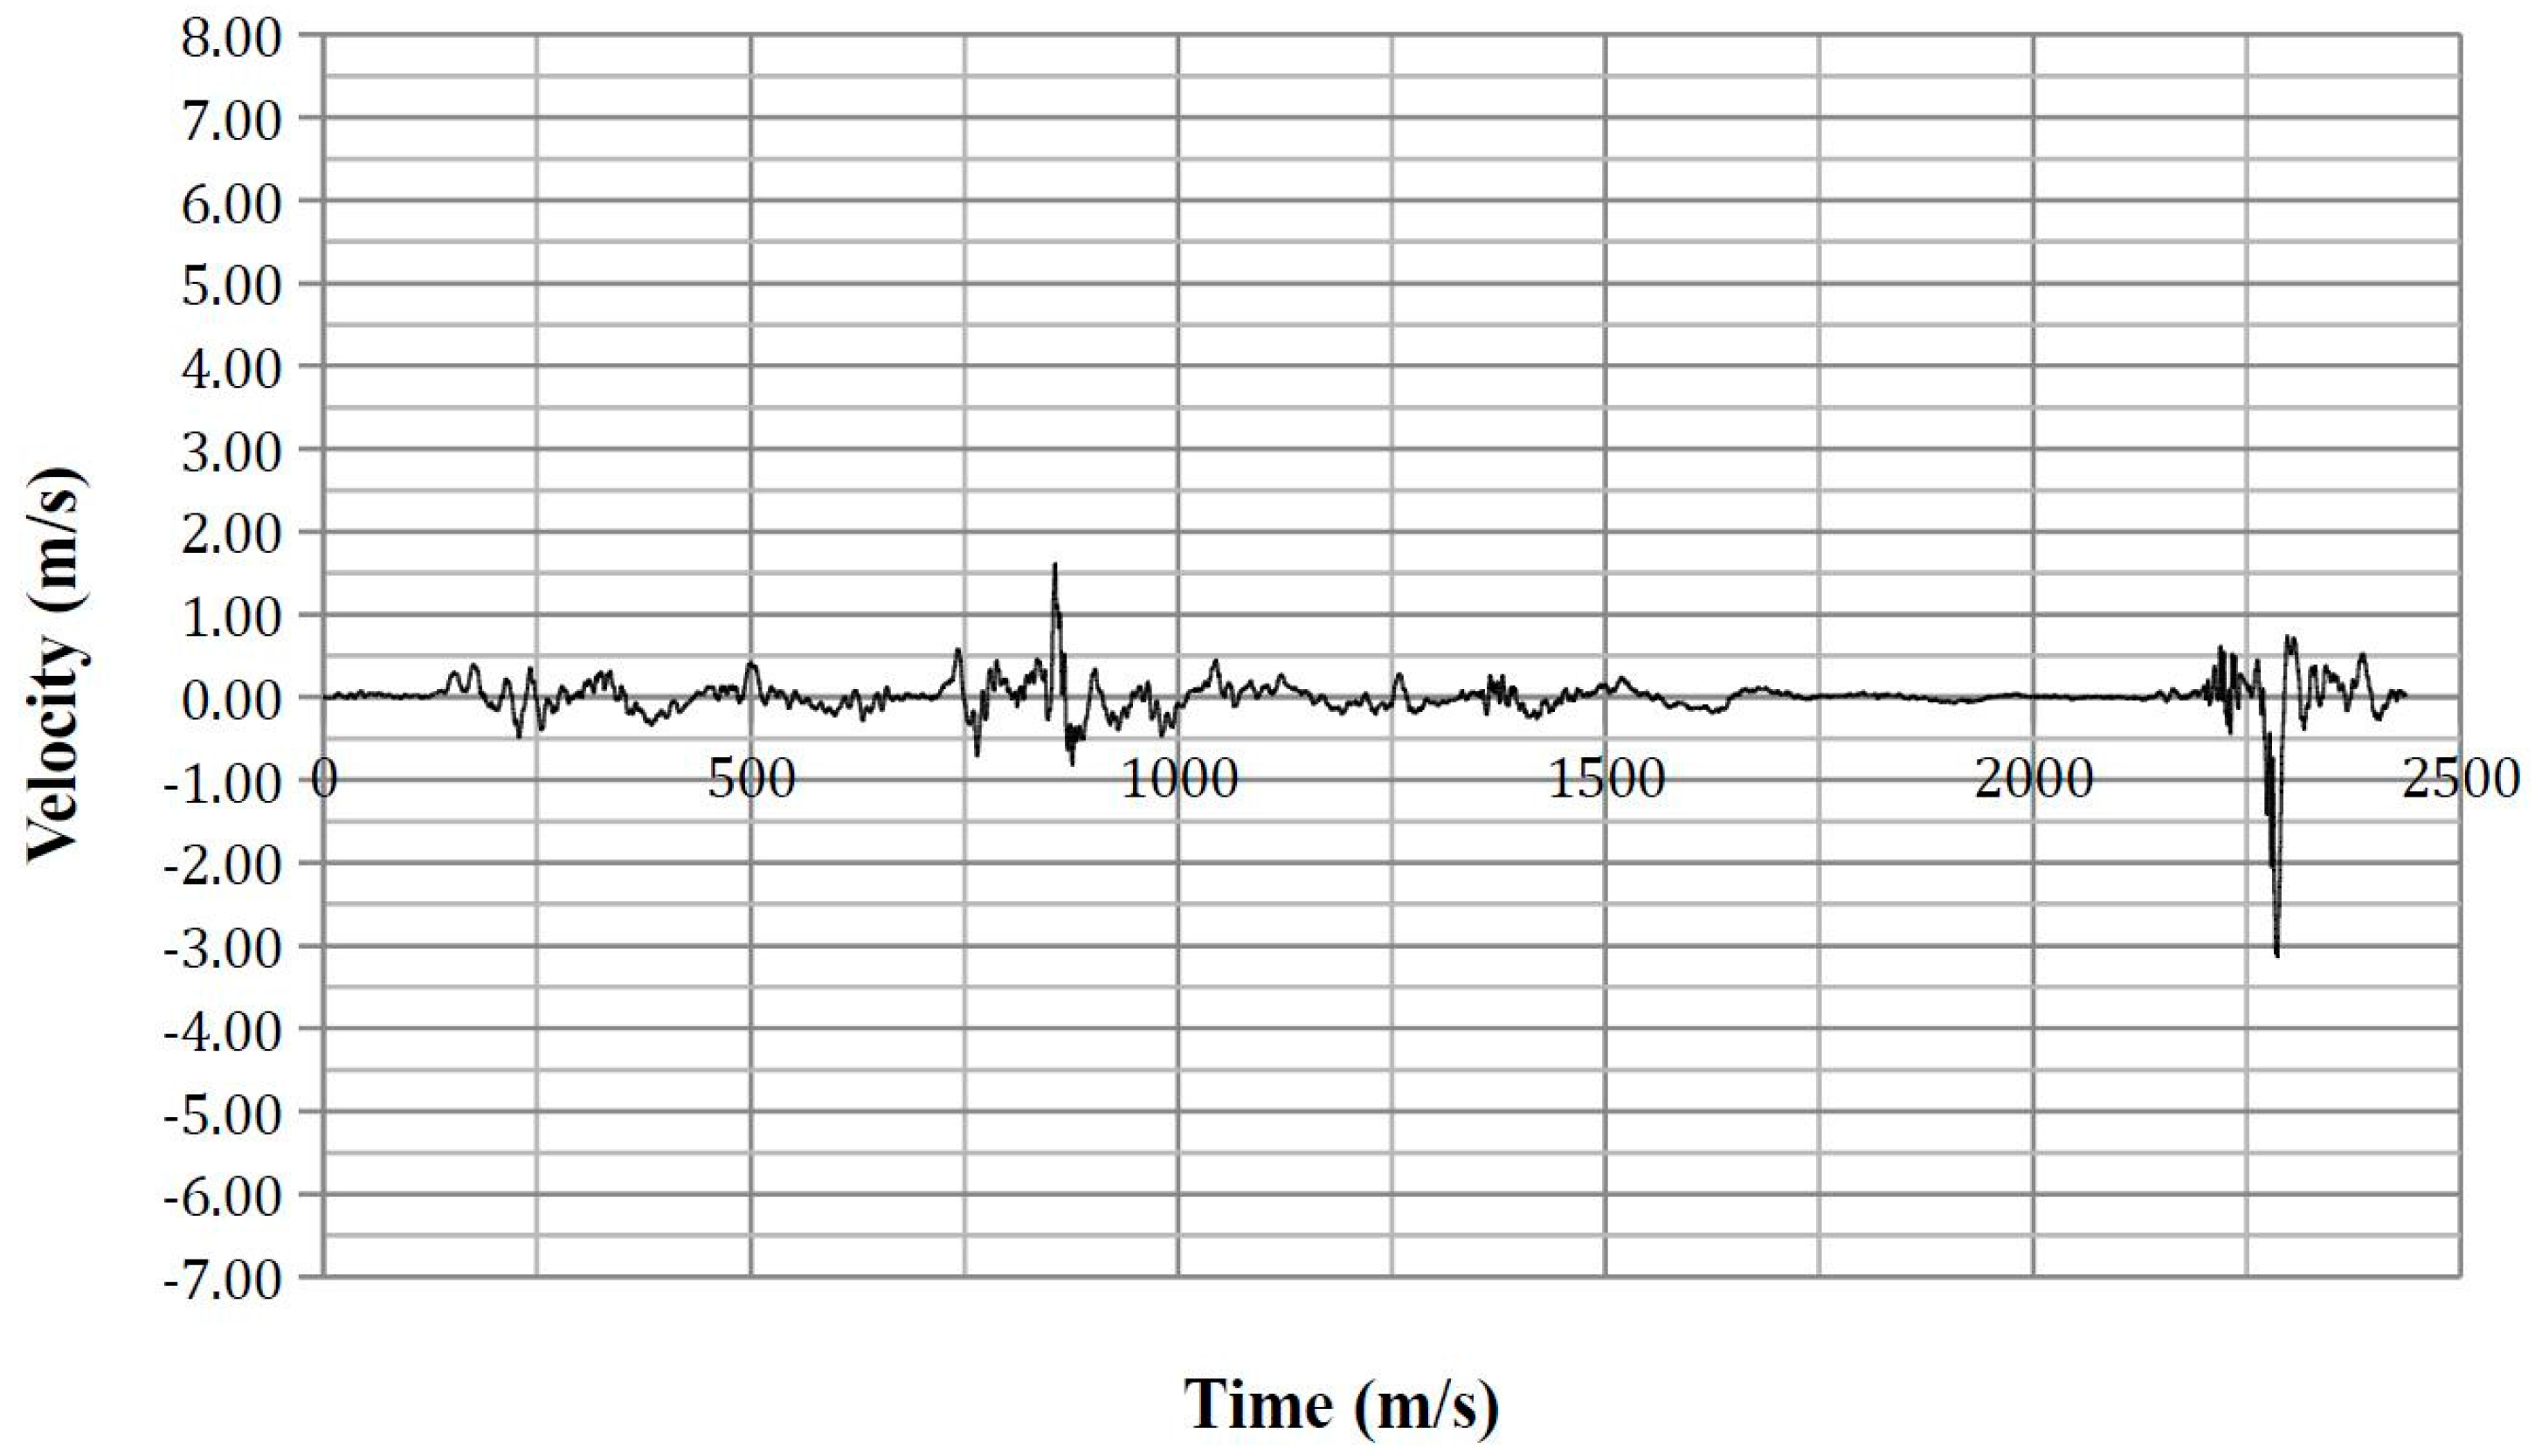
In all four simulations, the right thorax impacted the centre console between 2200 and 2400 ms. Of the four ATD positions, the ATD in Position 1 was subjected to the highest lateral thoracic impact velocity of 4.95 m/s when the ATD impacted the centre console (Figure 8). This impact velocity corresponds to a probability of an AIS3+ thoracic injury of 0.31. This indicates that the driver’s AIS3+ thoracic injury may have occurred due to contact with the centre console, a finding similar to that by Tahan et al. [9] Previous studies by Robbins et al. [51] found that a blunt lateral thorax impact velocity of 4.2 m/s resulted in PMHSs sustaining between two (AIS 2) and seven (AIS 4) rib fractures, while Viano et al. [52] found that blunt lateral thoracic impacts of 3.62 m/s was sufficient to result in a PMHS sustaining 2 rib fractures (AIS 2). These reported injuries are similar to that sustained by the driver despite the impact velocities being lower than that in the reconstruction. Further, it is also noted that a significant decrease in the vehicle’s lateral velocity (Appendix A) was also observed to have occurred when the ATD impacts the centre console, which suggests that a significant decrease in lateral velocity may be associated with an occupant sustaining a lateral thoracic injury.
From the lateral thoracic impact graphs in Appendix G, it is noted that peak lateral thoracic impact velocities of up to 6 m/s were observed. However, this was due to the ATD head and left shoulder impacting the vehicle’s roof rail interior and left door interior, respectively, and not the thorax impacting vehicle’s interior.
It was also observed that a change in ATD lateral lean angle of 7.5° from Position 1 to Position 2 resulted in a decrease in maximum observed lateral thoracic impact velocity from 4.95 to 3.66 m/s and that the nodes that registered these velocities are located on the Right 08 thorax segment. These impact velocity values correspond to a probability of an AIS3+ lateral thoracic injury of 0.31 and 0.17, respectively. This result suggests that the probability of an occupant sustaining a thoracic injury during a rollover is sensitive to the ATD position at the point of trip.
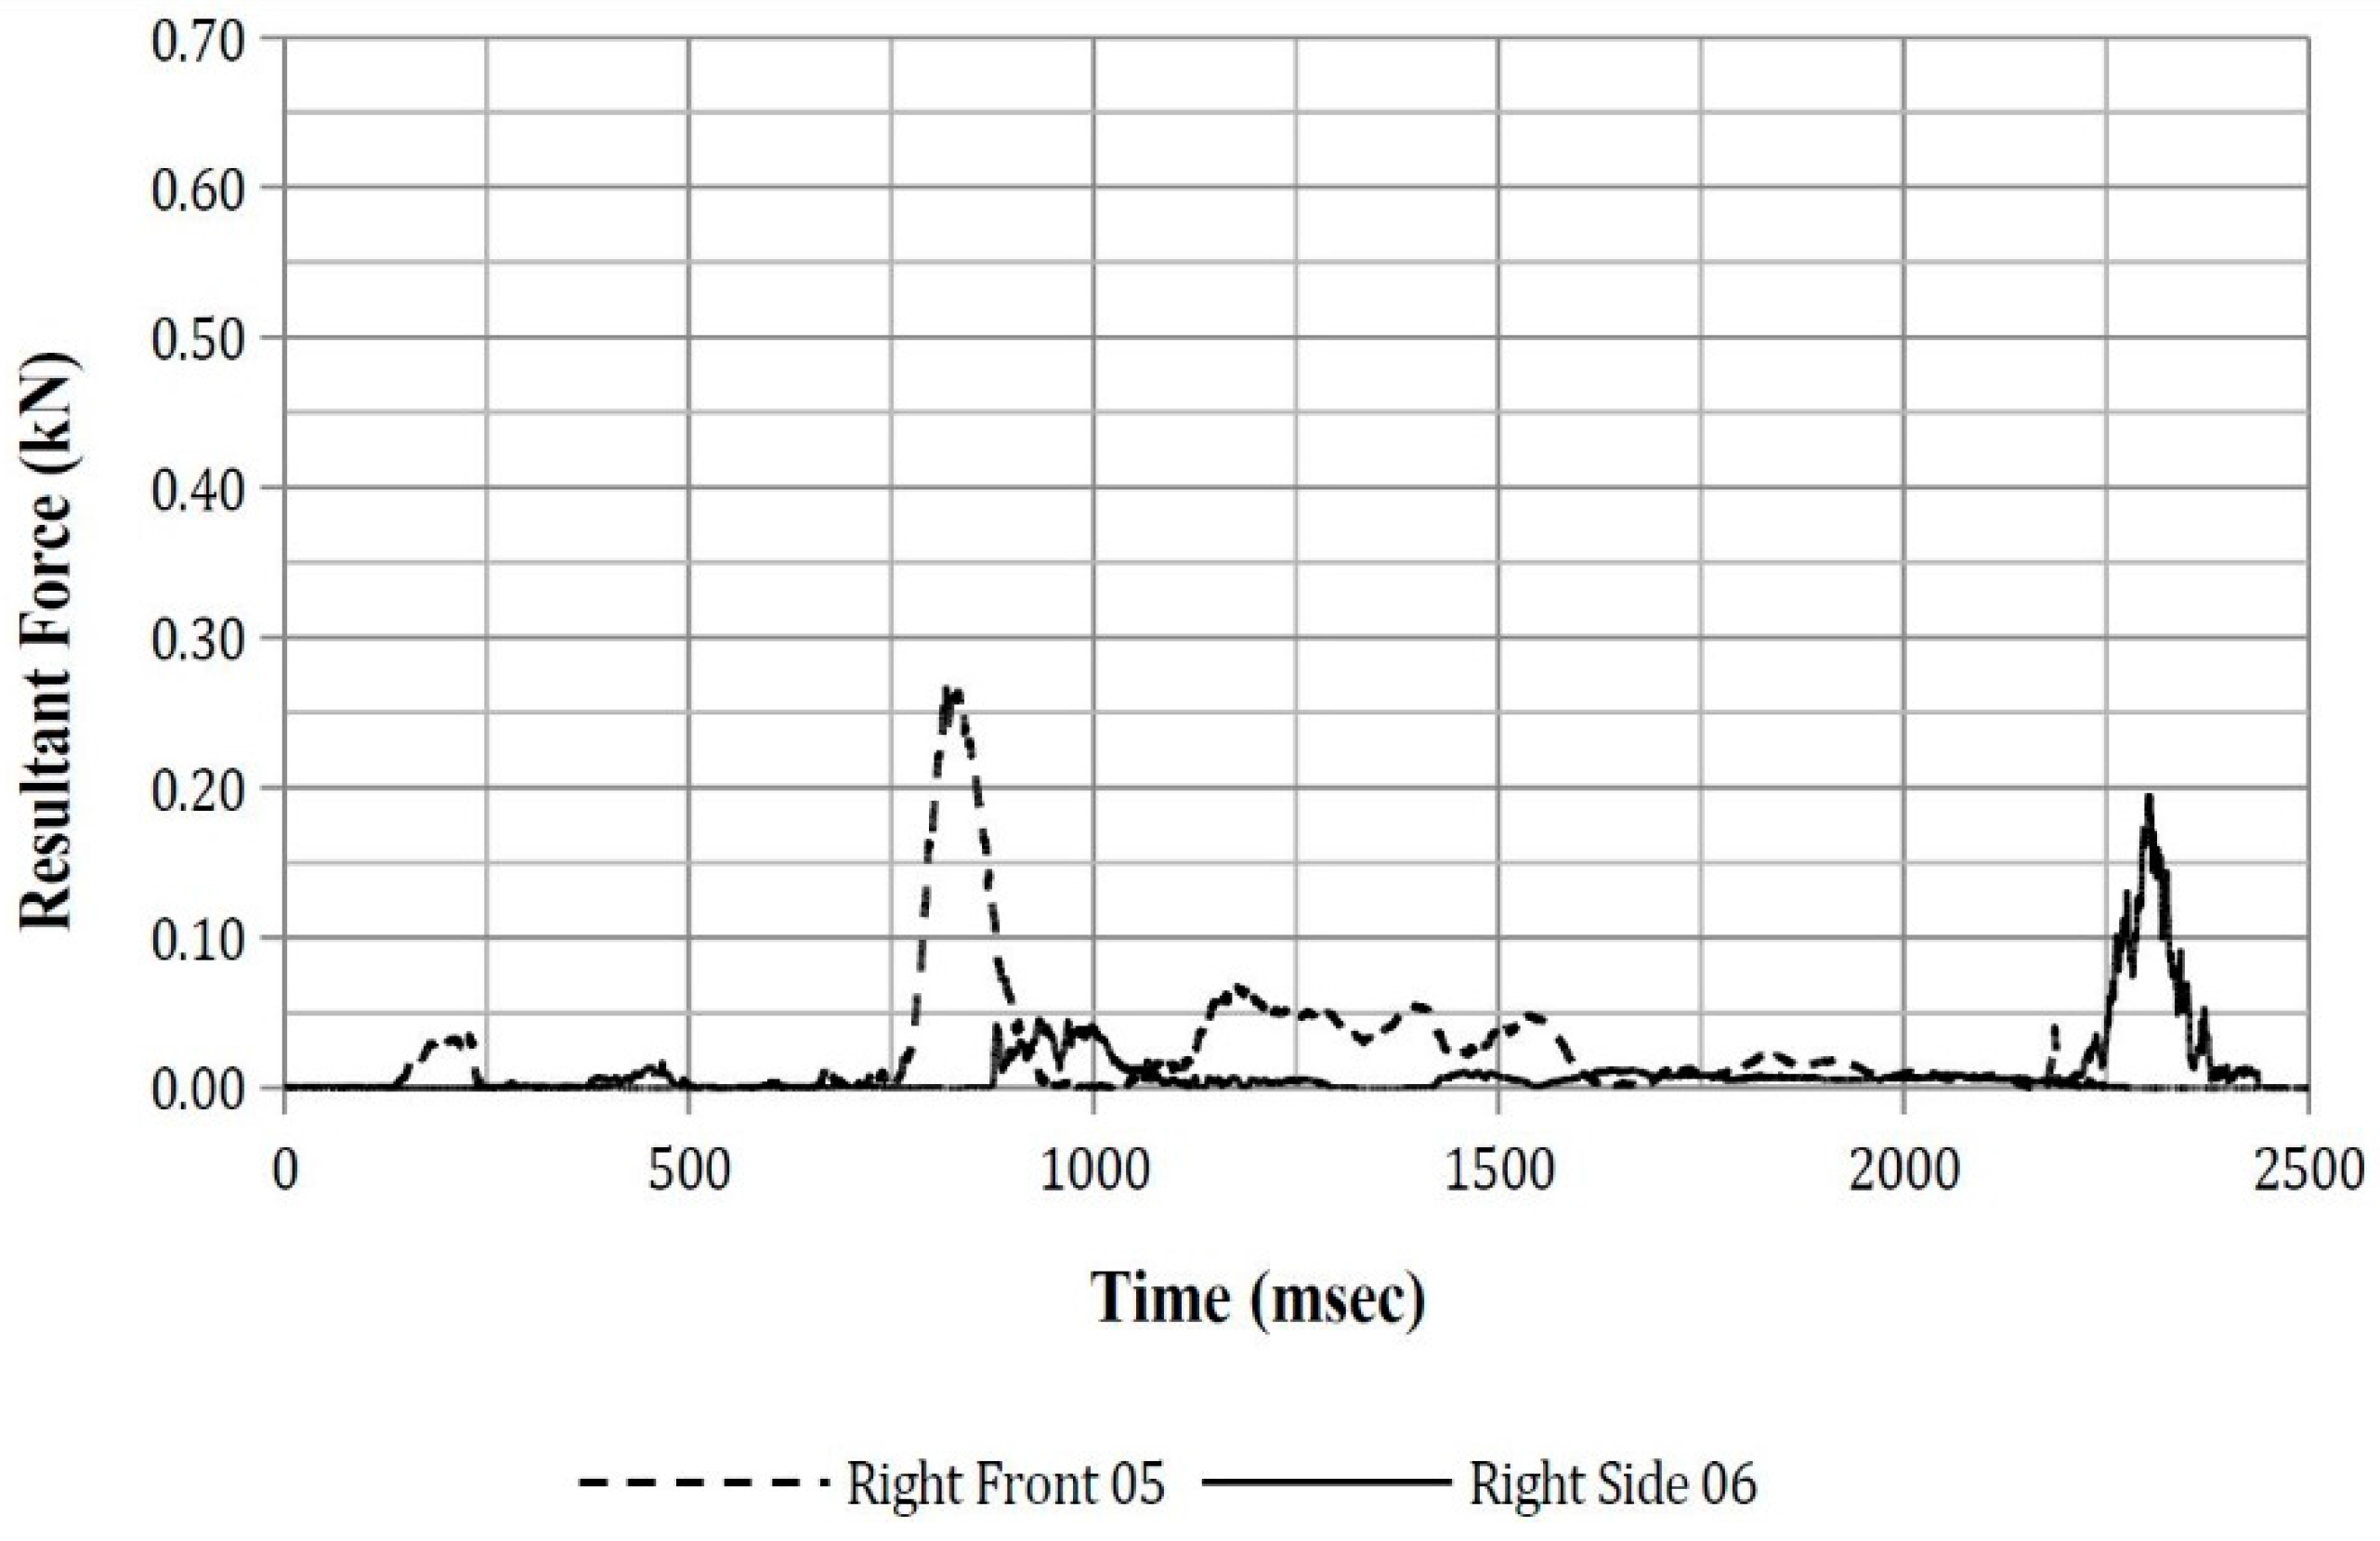
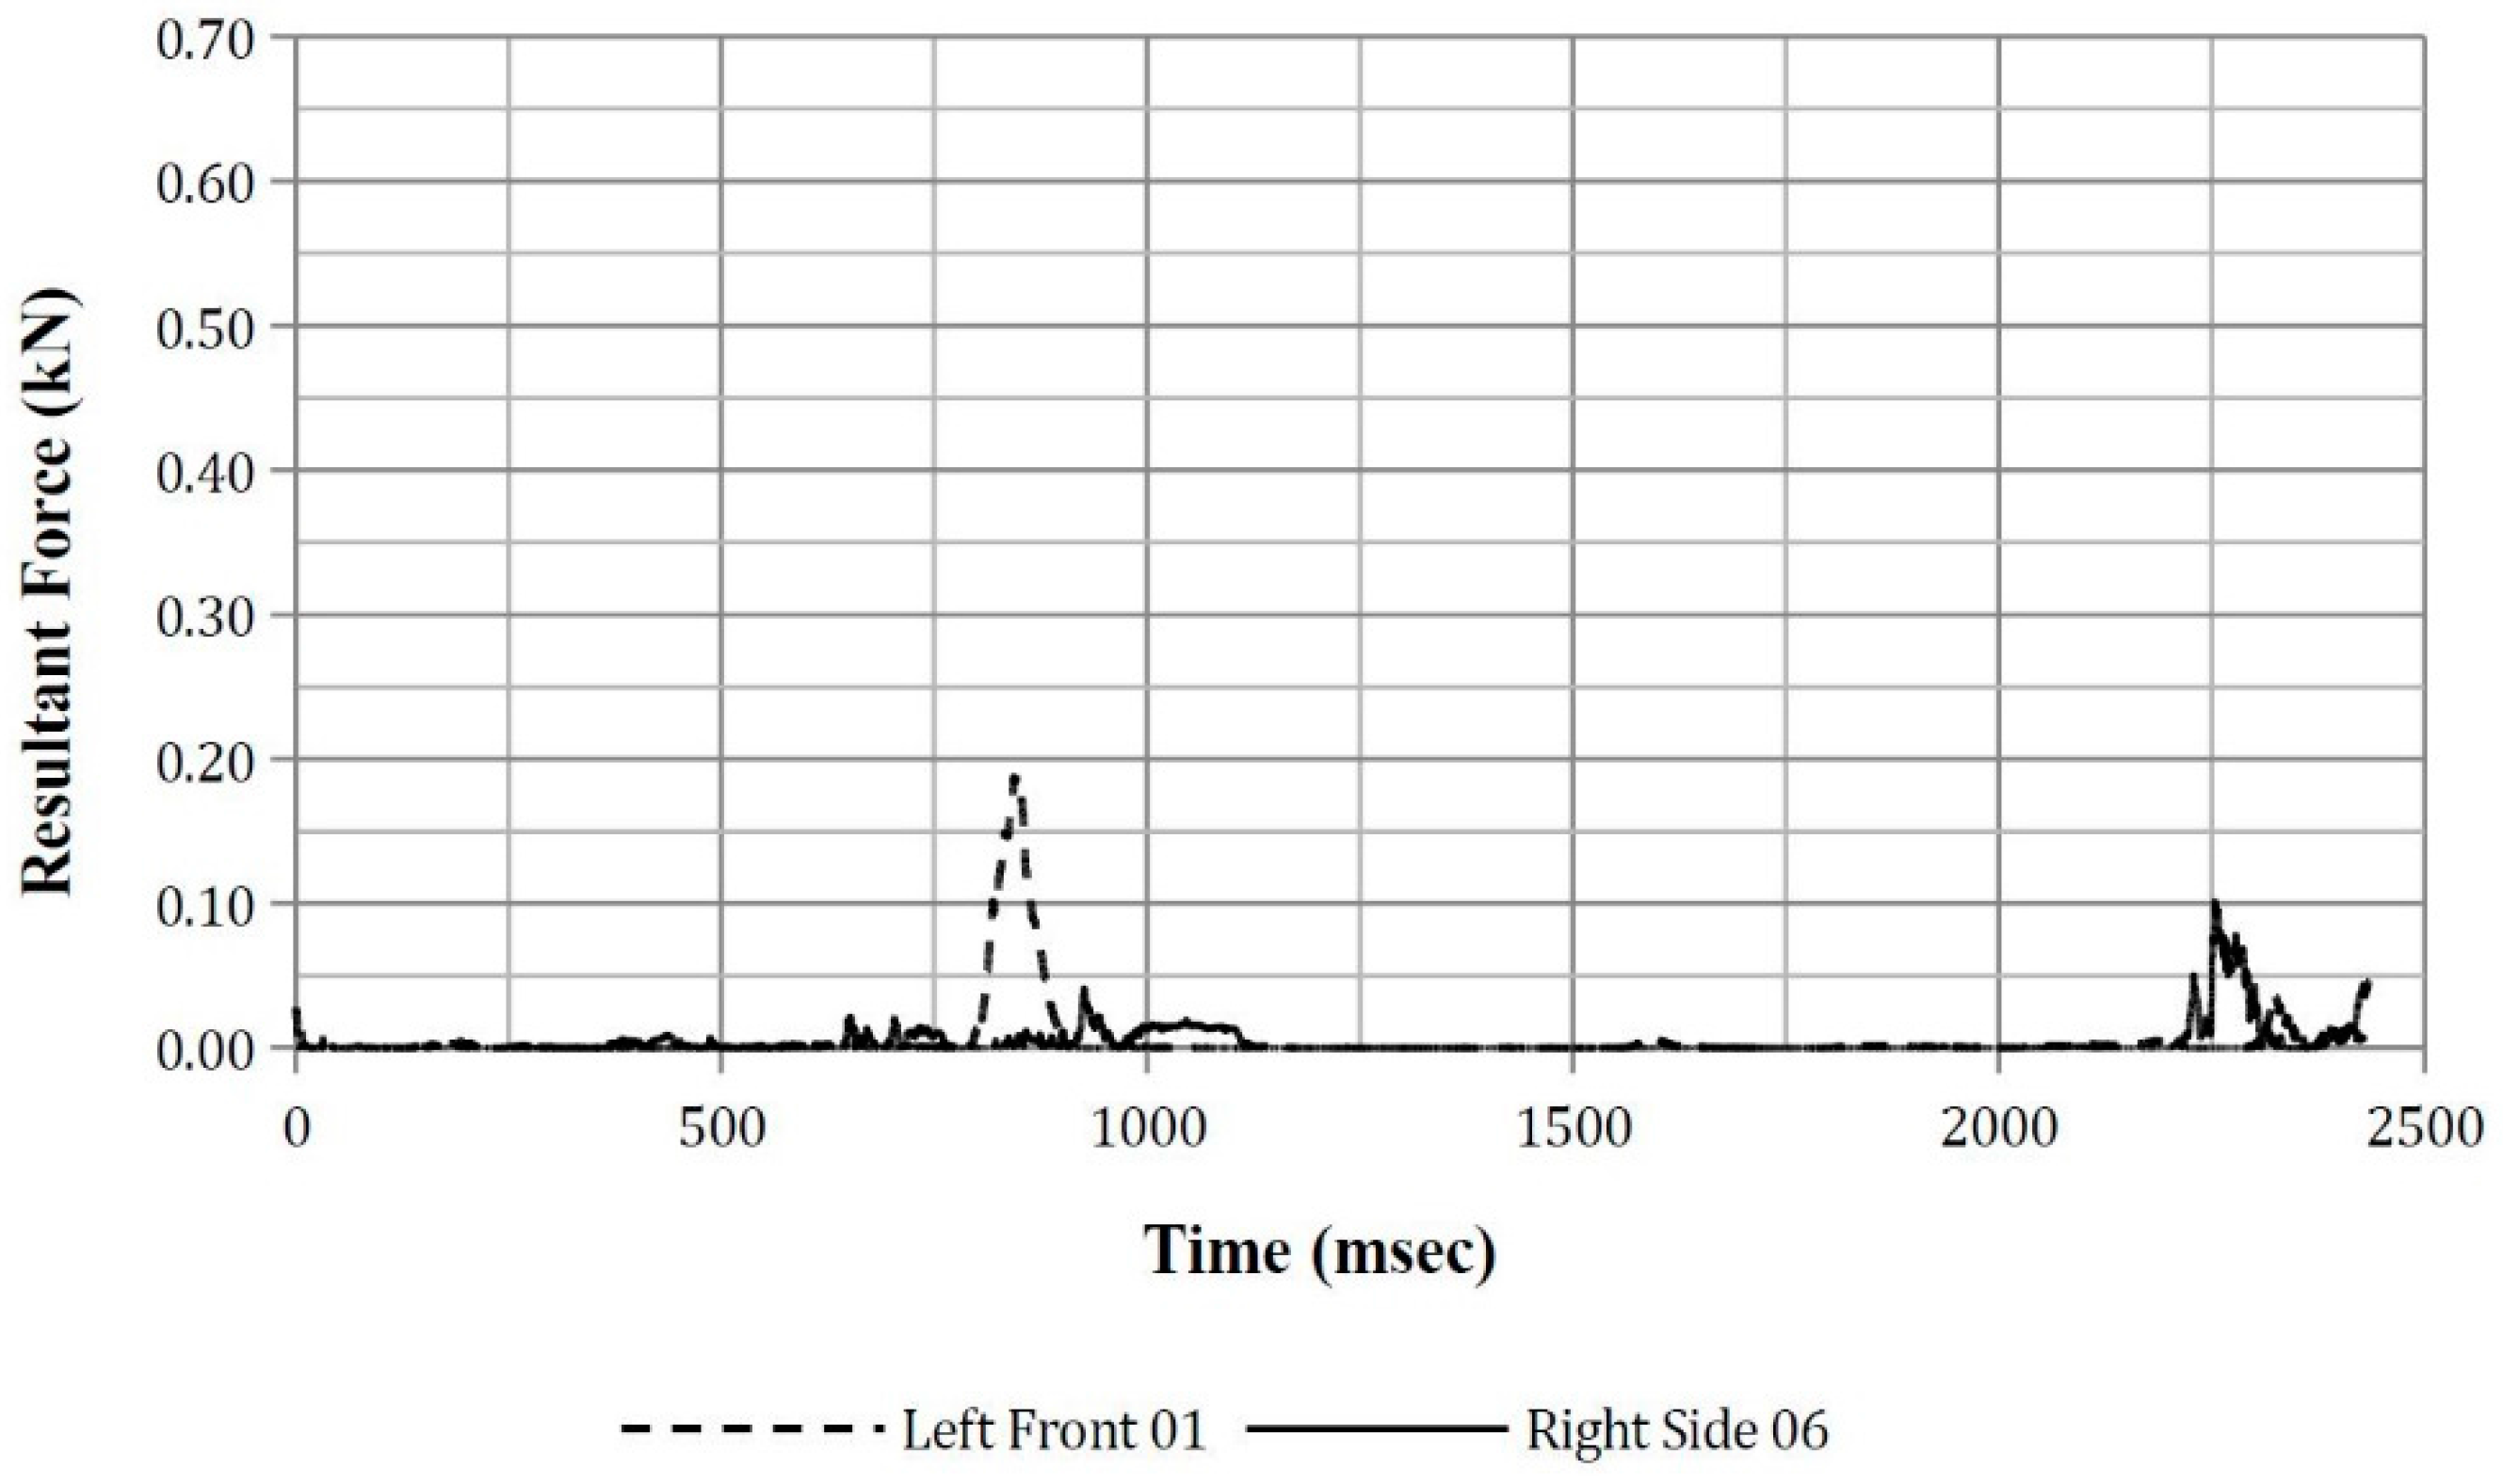
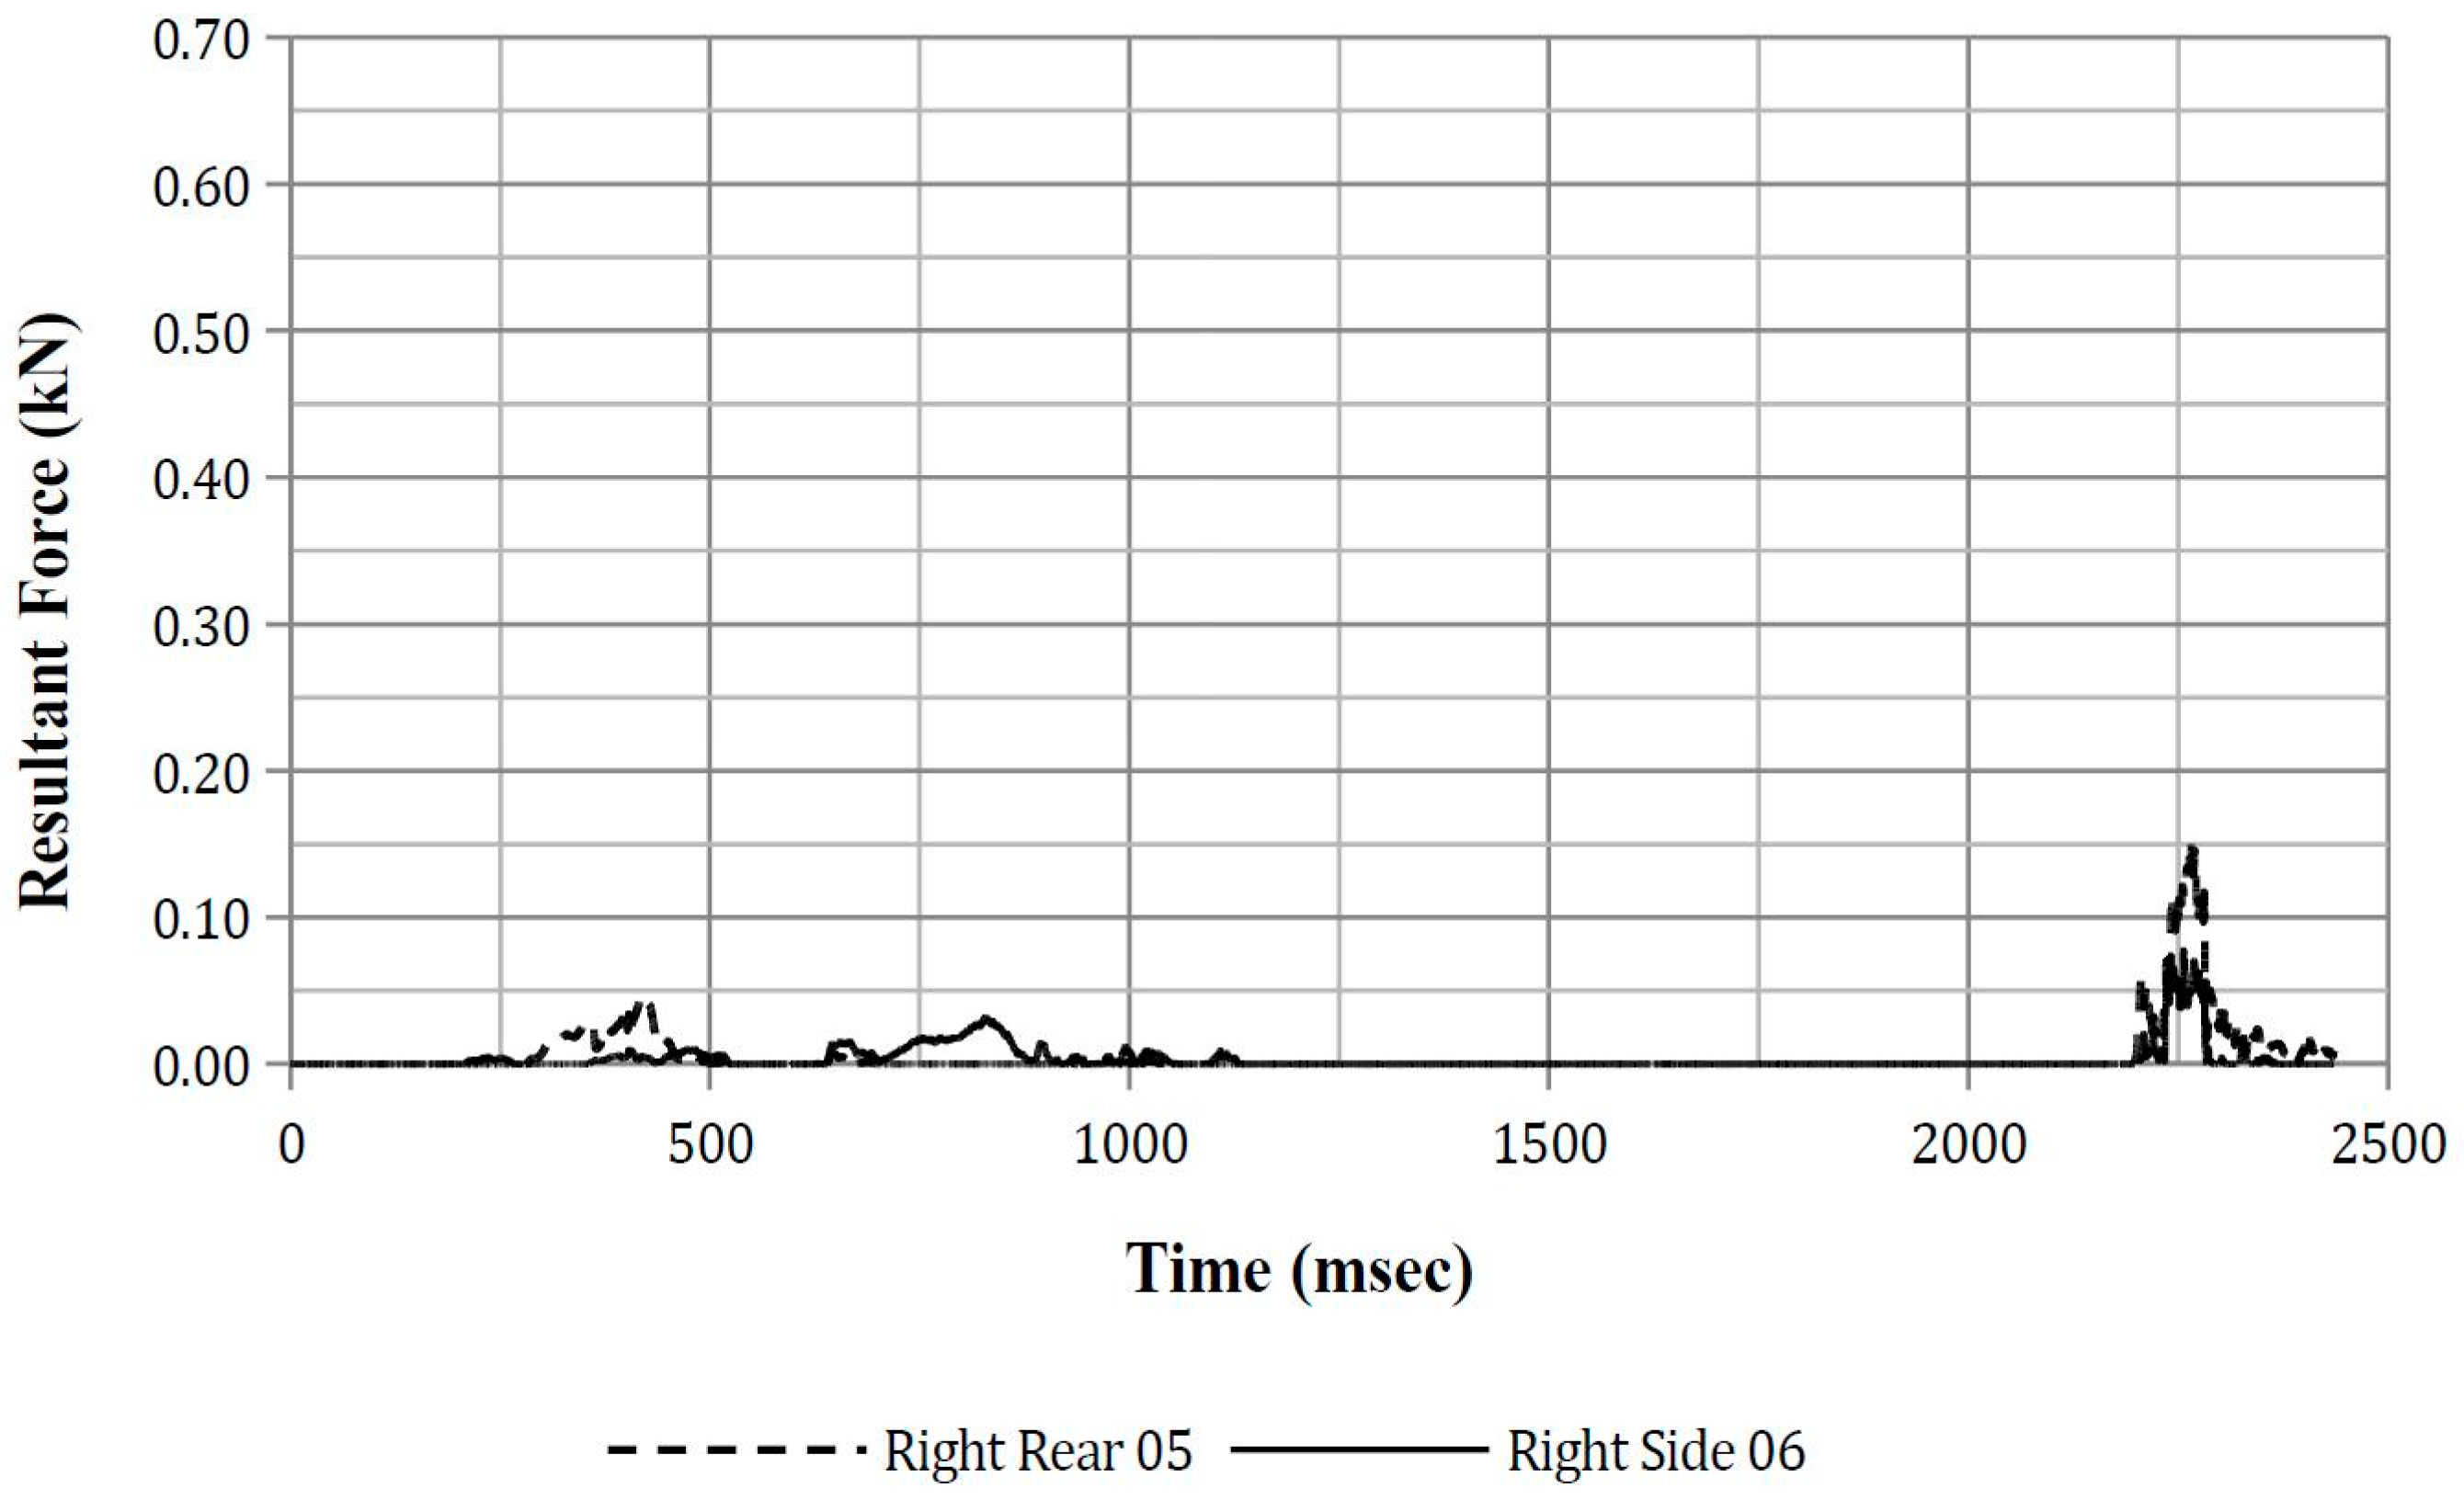
The highest thoracic resultant force for impacts not involving the centre console was 0.27 kN, which occurred at 826 ms for the ATD at Position 1. This force was due to the seatbelt pressing against the thorax’s Right Front 05 thorax segment. However, it is noted that this force is substantially lower than those required to result in a thoracic injury [53].
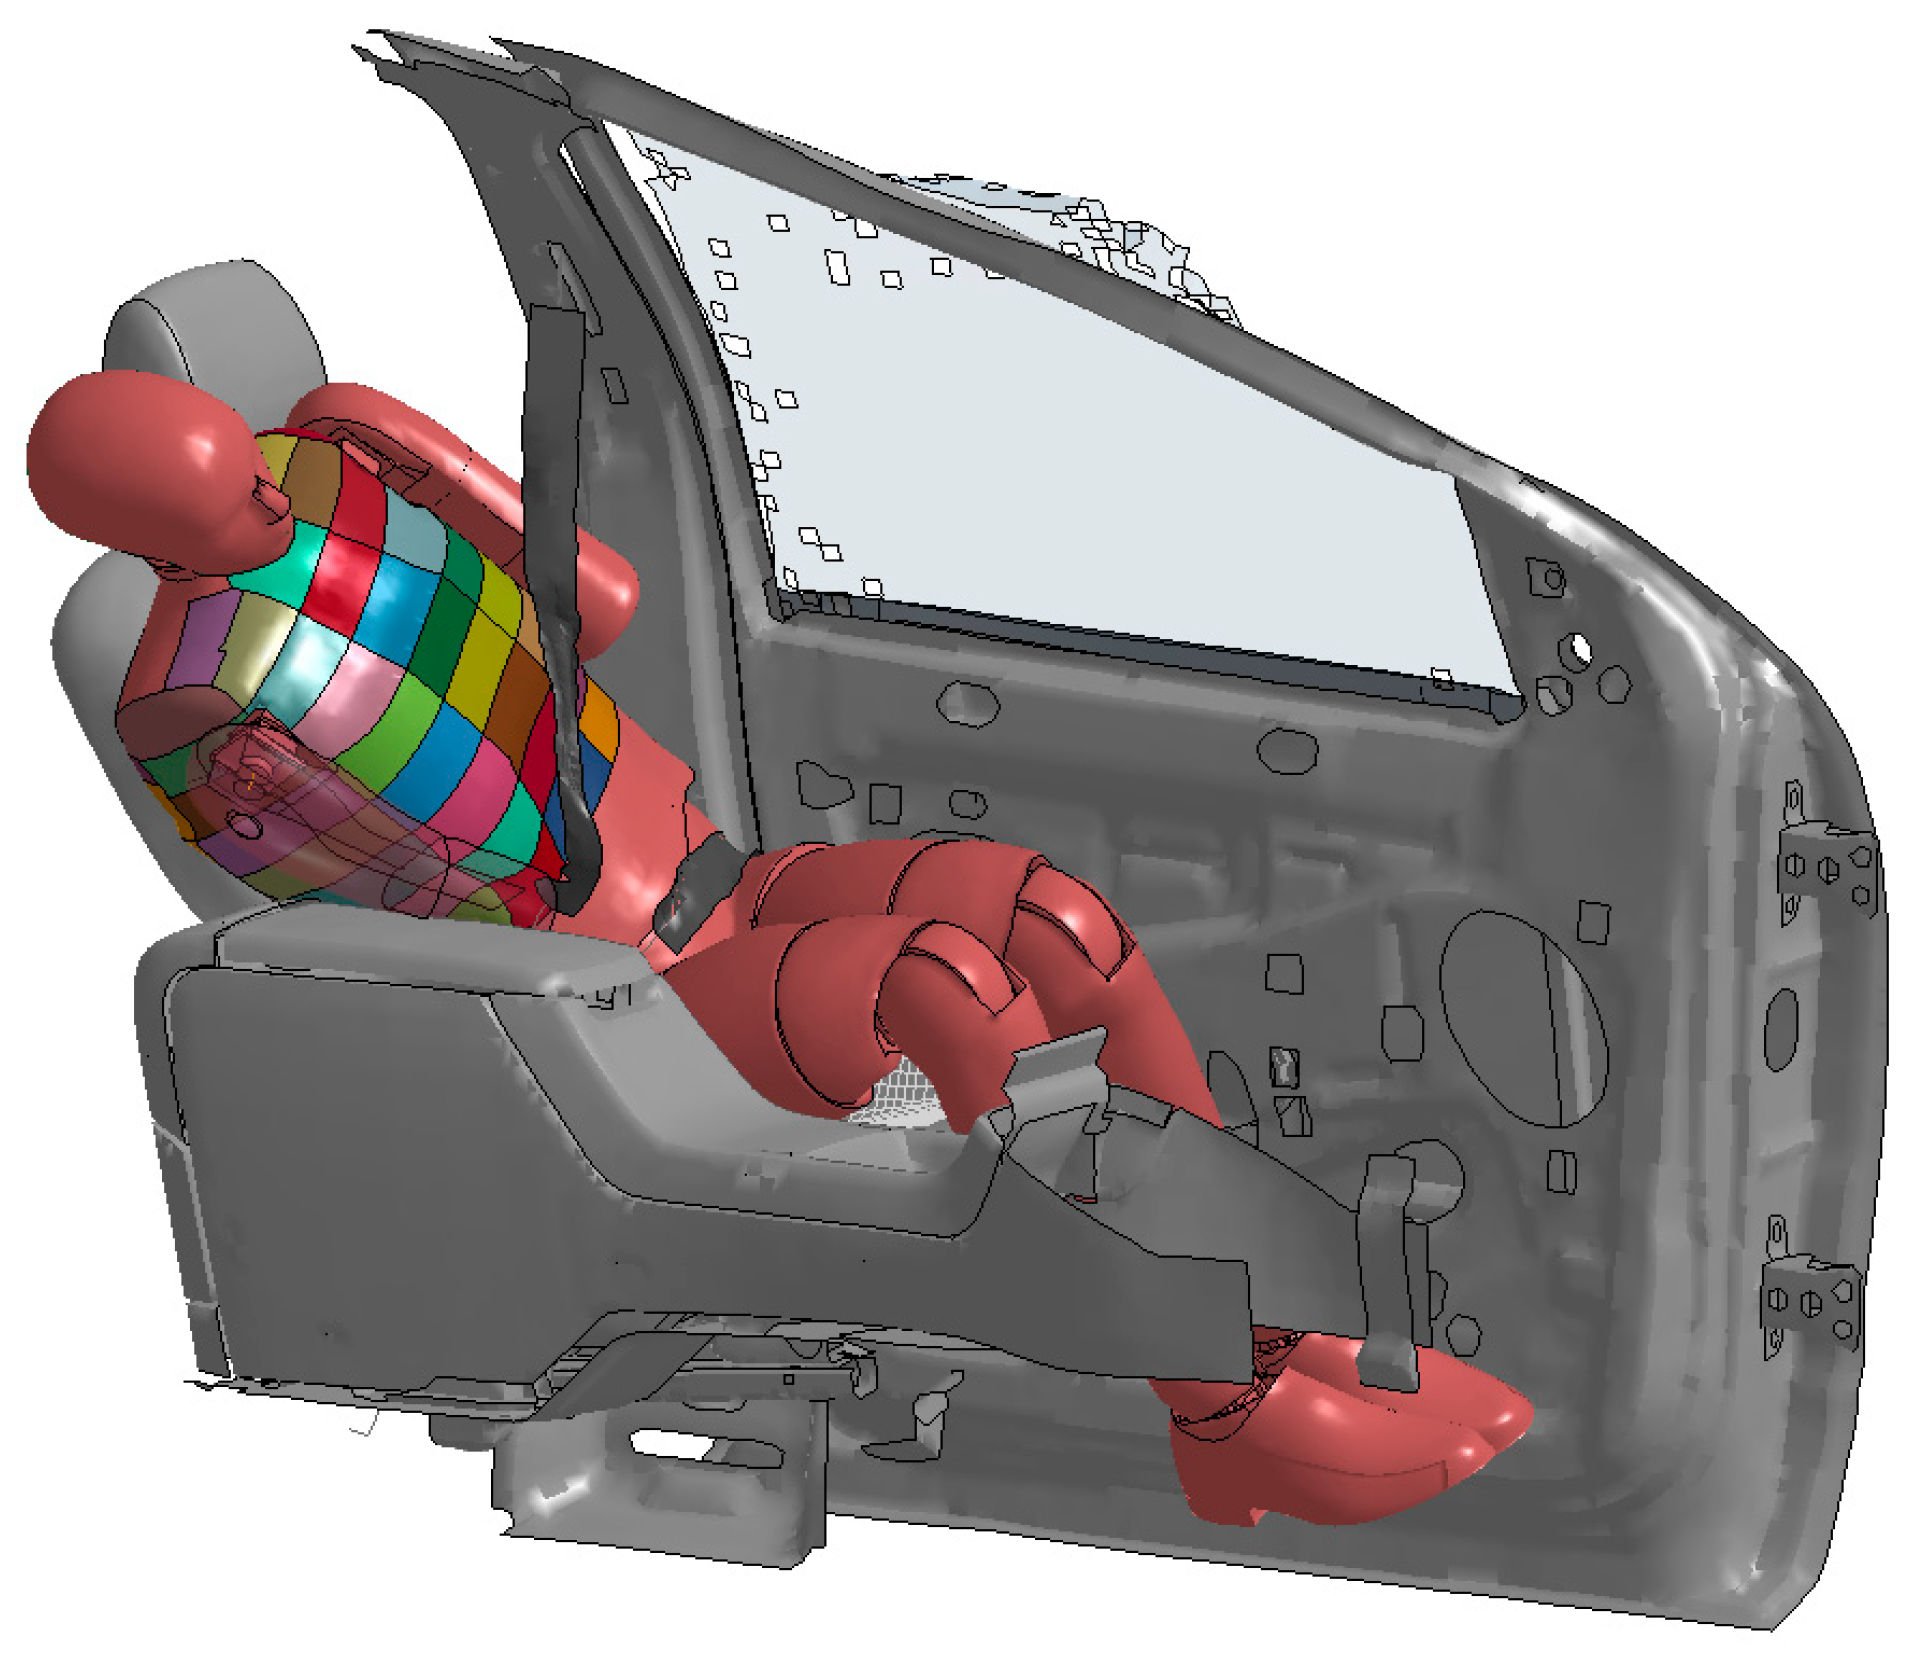
The highest thoracic resultant force due to the impact with the centre console was observed to be 0.53 kN at 2270 ms (Figure 9). Existing literature indicate that a lateral thoracic force of 7.4 kN and 10.2 kN results in an AIS0 and AIS3+ lateral thoracic injury, respectively [53,54]. Other studies estimated that a 5.5 kN lateral impact force results in a 25% probability of an AIS4+ thoracic injury [53,55]. The observed force of 0.53 kN is less than the reported injurious forces. Thus, lateral thoracic injury was not likely to have occurred due to the thorax’s impact with the centre console. However, force may not be a suitable criteria for thoracic injuries as it does not take into account the viscous nature of the thorax nor does it take into account the area to which the force is applied [53].
The maximum lap belt axial forces were observed to be between 2.28 and 2.74 kN and occurred during the second to third quarter-turn. The maximum observed axial force from this study are noted to be approximately three times higher than those measured in previous studies [56]. These observed higher axial belt forces is a reflection of the ATD pelvis moving upwards (i.e., away from the seat cushion) and towards the door and is restrained by the lap belt. It is noted that, when the ATD was in Position 5, the maximum lap belts axial force occurred during the fourth quarter-turn. This peak load was due to the lap belt being sufficiently taut, thus restraining the ATD as the right wheels impact the ground, which resulted in the ATD traversing and pivoting inboard.
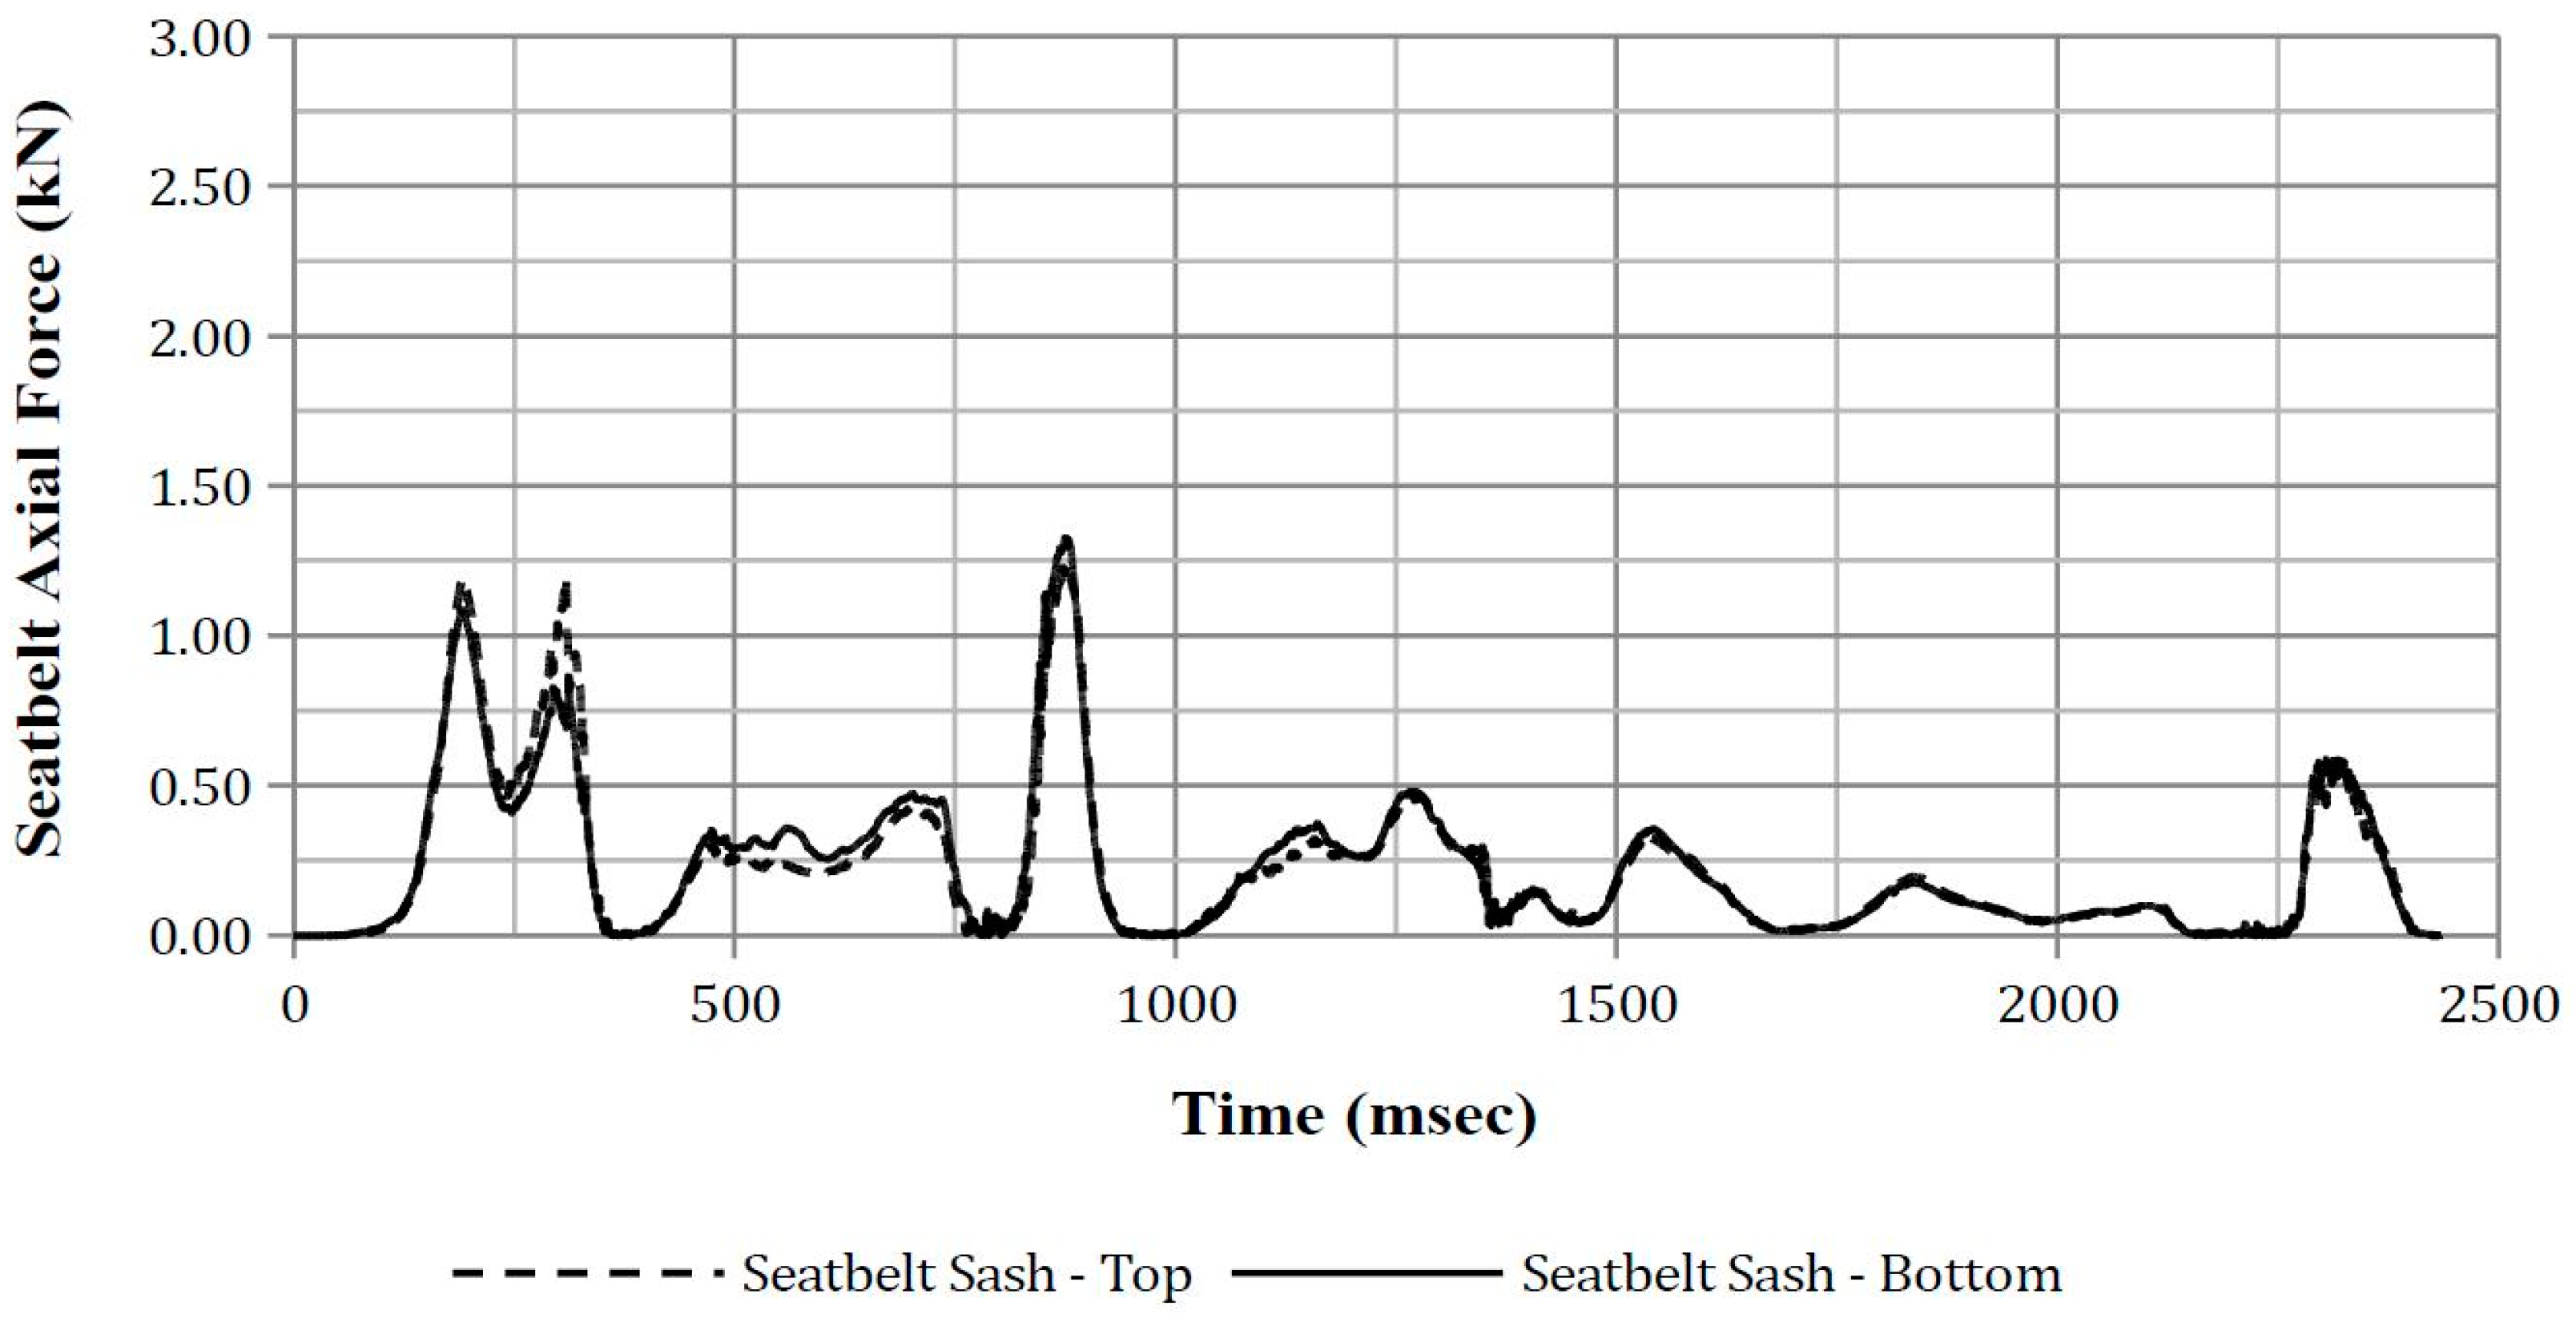
The maximum sash belt axial forces for the ATD in Positions 1, 2, and 5 were observed to be between 0.95 and 1.23 kN. These peak forces occurred as the vehicle rotated just beyond ninety degrees and the ATD’s thorax was partially restrained from moving anteriorly by the sash belt. The maximum sash belt axial force for the ATD in Position 8 was observed to be 1.33 kN and occurred while the vehicle was inverted and while the ATD’s head was being pushed inboard and rearwards by the roof rail. This resulted in the thorax pivoting forwards and pressing against the locked seatbelt sash, thus resulting in the observed loads. This observed axial force is similar to the sash belt axial forces observed in previous studies [56].
No existing literature is available to allow a comparison of the observed sash belt axial forces to real-world axial sash belt forces during an inversion to determine if thoracic injuries were likely to have occurred due to the observed forces. However, it is noted that the observed sash belt axial loads from this study are significantly lower than the reported 3.3 kN force to the sternum and 8.8 kN force distributed to the shoulder and chest required to cause minor injury in frontal crashes [53,57].
Thoracic Trauma Index (TTI) was also considered; however, no injury risk curves or IARVs exists for the EuroSID-2 or EuroSID-2re ATDs. As such, TTI was not used in this current study.
The NASS-CDS case report has noted that the seatbelt was a “possible” cause of lateral thoracic injuries in this crash. This study has not been able to confirm that the seatbelt was the cause of these injuries. However, this study shows that right thoracic injuries may have occurred from impact with the centre console. It is not certain as to how the left thoracic injuries may have occurred as the simulations do not indicate that the left thorax had come into contact with the driver’s door interior nor was the seatbelt a potential cause of this injury. However, it is noted that bilateral thoracic injuries can occur from unilateral thoracic impacts [58].
Previous studies have observed that the seatbelt sash can sometimes slide below the shoulder to the upper arm and thorax [3,59]. This was not observed to have occurred in the four FE simulations.
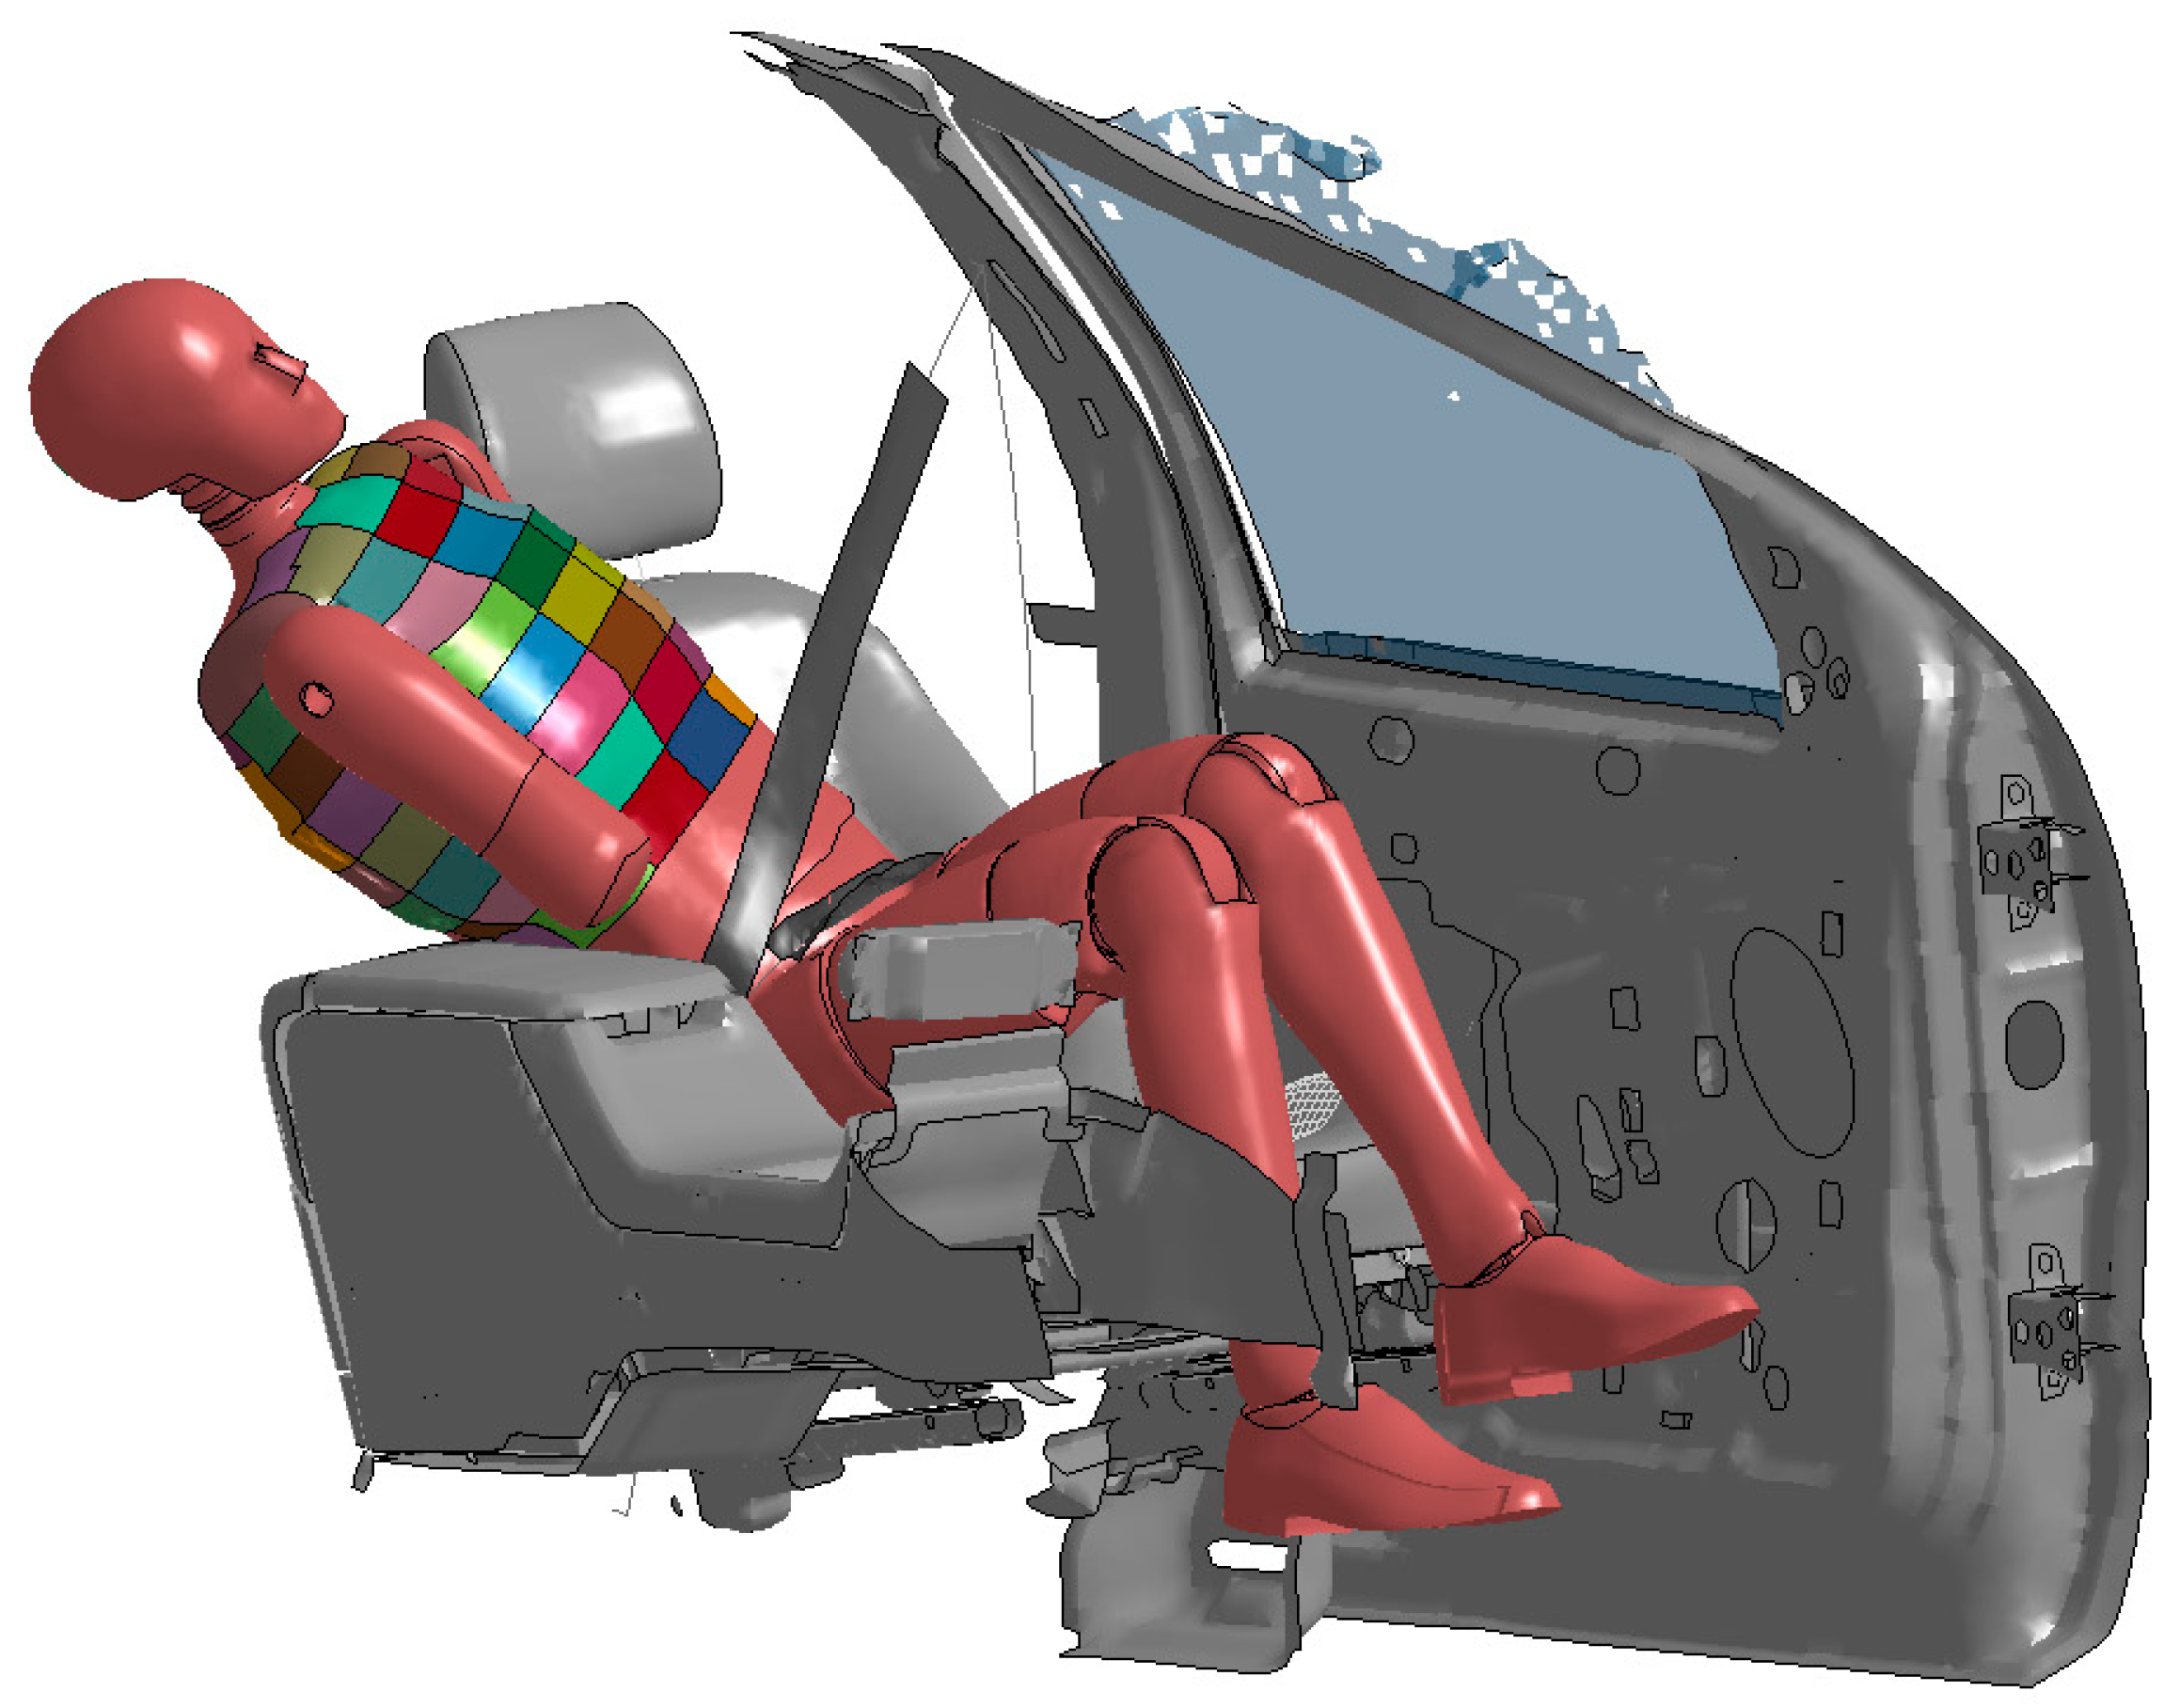
The ATD was observed to rotate about its z-axis during the rollover and to impact the centre console at an oblique angle. For example, Figure 10 shows the ATD right rear thorax impacting the centre console. Current side impact dummies do not adequately measure injurious accelerations, velocities, or forces under oblique loading conditions [50,60]. Oblique thoracic impact testing has been identified as important in side impact testing as the thorax of ATDs has been observed to rotate about their vertical axis during these crash tests [34]. Additionally, previous studies have also hypothesised that less chest compression is required to result in serious thoracic injury in oblique impacts compared to lateral impacts given the same impact velocity [57]. The results from this study indicate that developing an ATD capable of measuring injurious oblique thoracic impacts will be useful in rollover crash testing where lateral thoracic injury is to be studied.
The NASS-CDS case report noted that contusions were identified on the driver’s left and central abdomen and that these injuries were attributed to the seatbelt (Table 2). These injuries suggest that submarining may have occurred. If so, the driver’s kinematics would potentially be different to that of the ATD in the FE simulations as the lap belt was not observed to have risen up from the pelvis nor the ATD observed to have submarined in any of the four completed FE simulations. This potential kinematic difference between the actual crash and the simulation may have affected the outcomes of this study.
4.3. Additional Finite Element Vehicle and Anthropomorphic Test Device Simulation for Door Impact
From the four completed simulations, it was observed that the ATD’s head had contacted the vehicle’s roof interior and/or vehicle’s roof rail interior during the second quarter-turn. At this point in the rollover, the vehicle’s left roof rail contacts the ground and continues to roll onto the roof. It was hypothesised that the ATD’s head contact with the vehicle’s roof liner and/or roof rail interior may have prevented the ATD’s thorax from contacting the driver’s door interior. Further, it was also hypothesised that the ATD’s arm contact with the driver’s door glazing, which had shattered but not broken away from the door, may also have prevented the thorax from contacting the driver’s door interior. To explore these hypotheses further, an additional simulation was performed where the ATD’s head and driver’s door glazing were removed. This simulation was performed with the ATD in Position 2. The results from the simulation indicate that, with the head removed, the left shoulder contacted the B-pillar interior and prevented the thorax from contacting the driver’s door interior. As such, the removal of the ATD’s head and driver’s door glazing did not result in the thorax contacting the driver’s door interior.
5. Conclusions
A real-world rollover crash where the driver of an SUV sustained AIS3+ bilateral thoracic injuries was reconstructed using a combination of PC-CRASH, a multi-body three-dimensional dynamic trajectory model, and LS-DYNA, a finite element model. PC-CRASH was used to replicate the vehicle’s pre-trip trajectory up to the point of trip. The vehicle kinematics and position at the point of trip was then obtained from PC-CRASH and assigned as the initial conditions to the FE vehicle model. This FE model was then used to simulate the rollover phase of the crash. A EuroSID-2re ATD was then placed in the driver’s seat of the FE vehicle model in four different postures. The data obtained from the ATD was assessed to determine if the reported AIS3+ bilateral thoracic injuries could be replicated.
Lateral thoracic impact velocity indicates that there is a 0.31 probability that an AIS3+ thoracic injury occurred during the fourth quarter-turn when the ATD impacted the centre console with a velocity of 4.95 m/s. Previous studies have indicated that a blunt lateral thoracic impact velocity between 3.62 and 4.6 m/s resulted in PMHSs sustaining multiple rib fractures corresponding to an AIS 2 to AIS 4 injury severity. These injuries are similar to those sustained by the driver in the real-world crash. Further, the ATD thorax impact with the centre console is observed to have coincided with a significant decrease in the vehicle’s lateral velocity. Thus, a significant decrease in a rollover vehicle’s lateral velocity may be associated with an occupant flailing into the vehicle’s interior and, as a result, sustaining AIS3+ thoracic injuries.
The ATD left thorax had the potential of contacting the driver’s door interior during the second to third quarter-turn. However, the three considered injury criteria (i.e., spinal acceleration, rib deflection, and lateral thoracic impact velocity) indicate that serious lateral thorax injury was not likely to have occurred at this instance in the rollover sequence.
The limitations of this study should be noted. Firstly, the reconstruction of the rollover relied on limited information from the NASS-CDS report, such as the reported 10 m rollover distance and direction the vehicle was facing during the trip and the final resting position as indicated on the scene diagram. Secondly, the FE vehicle model is that of a three-door Ford Explorer, while the actual vehicle is a five-door Ford Explorer. The difference in overall vehicle length between these two models may have effected the results from the simulation. Thirdly, the resultant deformation in the FE model is slightly different to that of the real-world vehicle. Fourthly, side impact ATDs were not designed to be used in rollover crash testing. For example, the EuroSID-2re used in this reconstruction was instrumented for left thoracic impacts thus may not allow for accurate bilateral injury assessment. Further, side impact ATDs are currently not designed to measure oblique thoracic impacts that occurred in the FE simulations. Fifthly, the gouging of the ground by the vehicle was not replicated in this study.
Future studies may be directed to performing further parametric studies to understand how occupant posture affects the outcome of thoracic injuries. Parametric studies should also focus on vehicle-to-ground contact during the second to third and fourth quarter-turn to determine how vehicle kinematics are related to injurious lateral thoracic injuries at these points in the rollover phase. This study has also highlighted that an ATD with biofidelic oblique lateral impact response is required for rollover crash testing and future studies should also be directed to this area. Thus, future studies may also consider using a WorldSID ATD as previous studies have indicated that this ATD is better at responding to oblique loading [37]. Future studies should also be directed to studying the relationship between significant changes in vehicle kinematics and occupant flailing into and impacting vehicle interior components, thus potentially resulting in serious thoracic injuries.
Acknowledgments
The authors would like to thank the Australian federal government’s Australian Research Council for providing funds to carry out this research through the Linkage Projects grant scheme (No. LP110100069). The authors also thank the industry partners for providing funding, namely, the New South Wales state government’s Centre for Road Safety, the Victorian state government’s third-party insurer Transport Accident Commission (TAC), the West Australian state government’s Office of Road Safety, BHP Billiton and Korea Automotive Testing & Research Institute (KATRI).
Author Contributions
Tana Tan, Mario Mongiardini and Raphael Grzebieta conceived the experiment. Tana Tan and Mario Mongiardini designed the experiment. Tana Tan performed the experiments and analysed the data. Garrett Mattos contributed LS-DYNA codes to the experiment. Tana Tan wrote the paper.
Conflicts of Interest
The authors declare no conflict of interest.
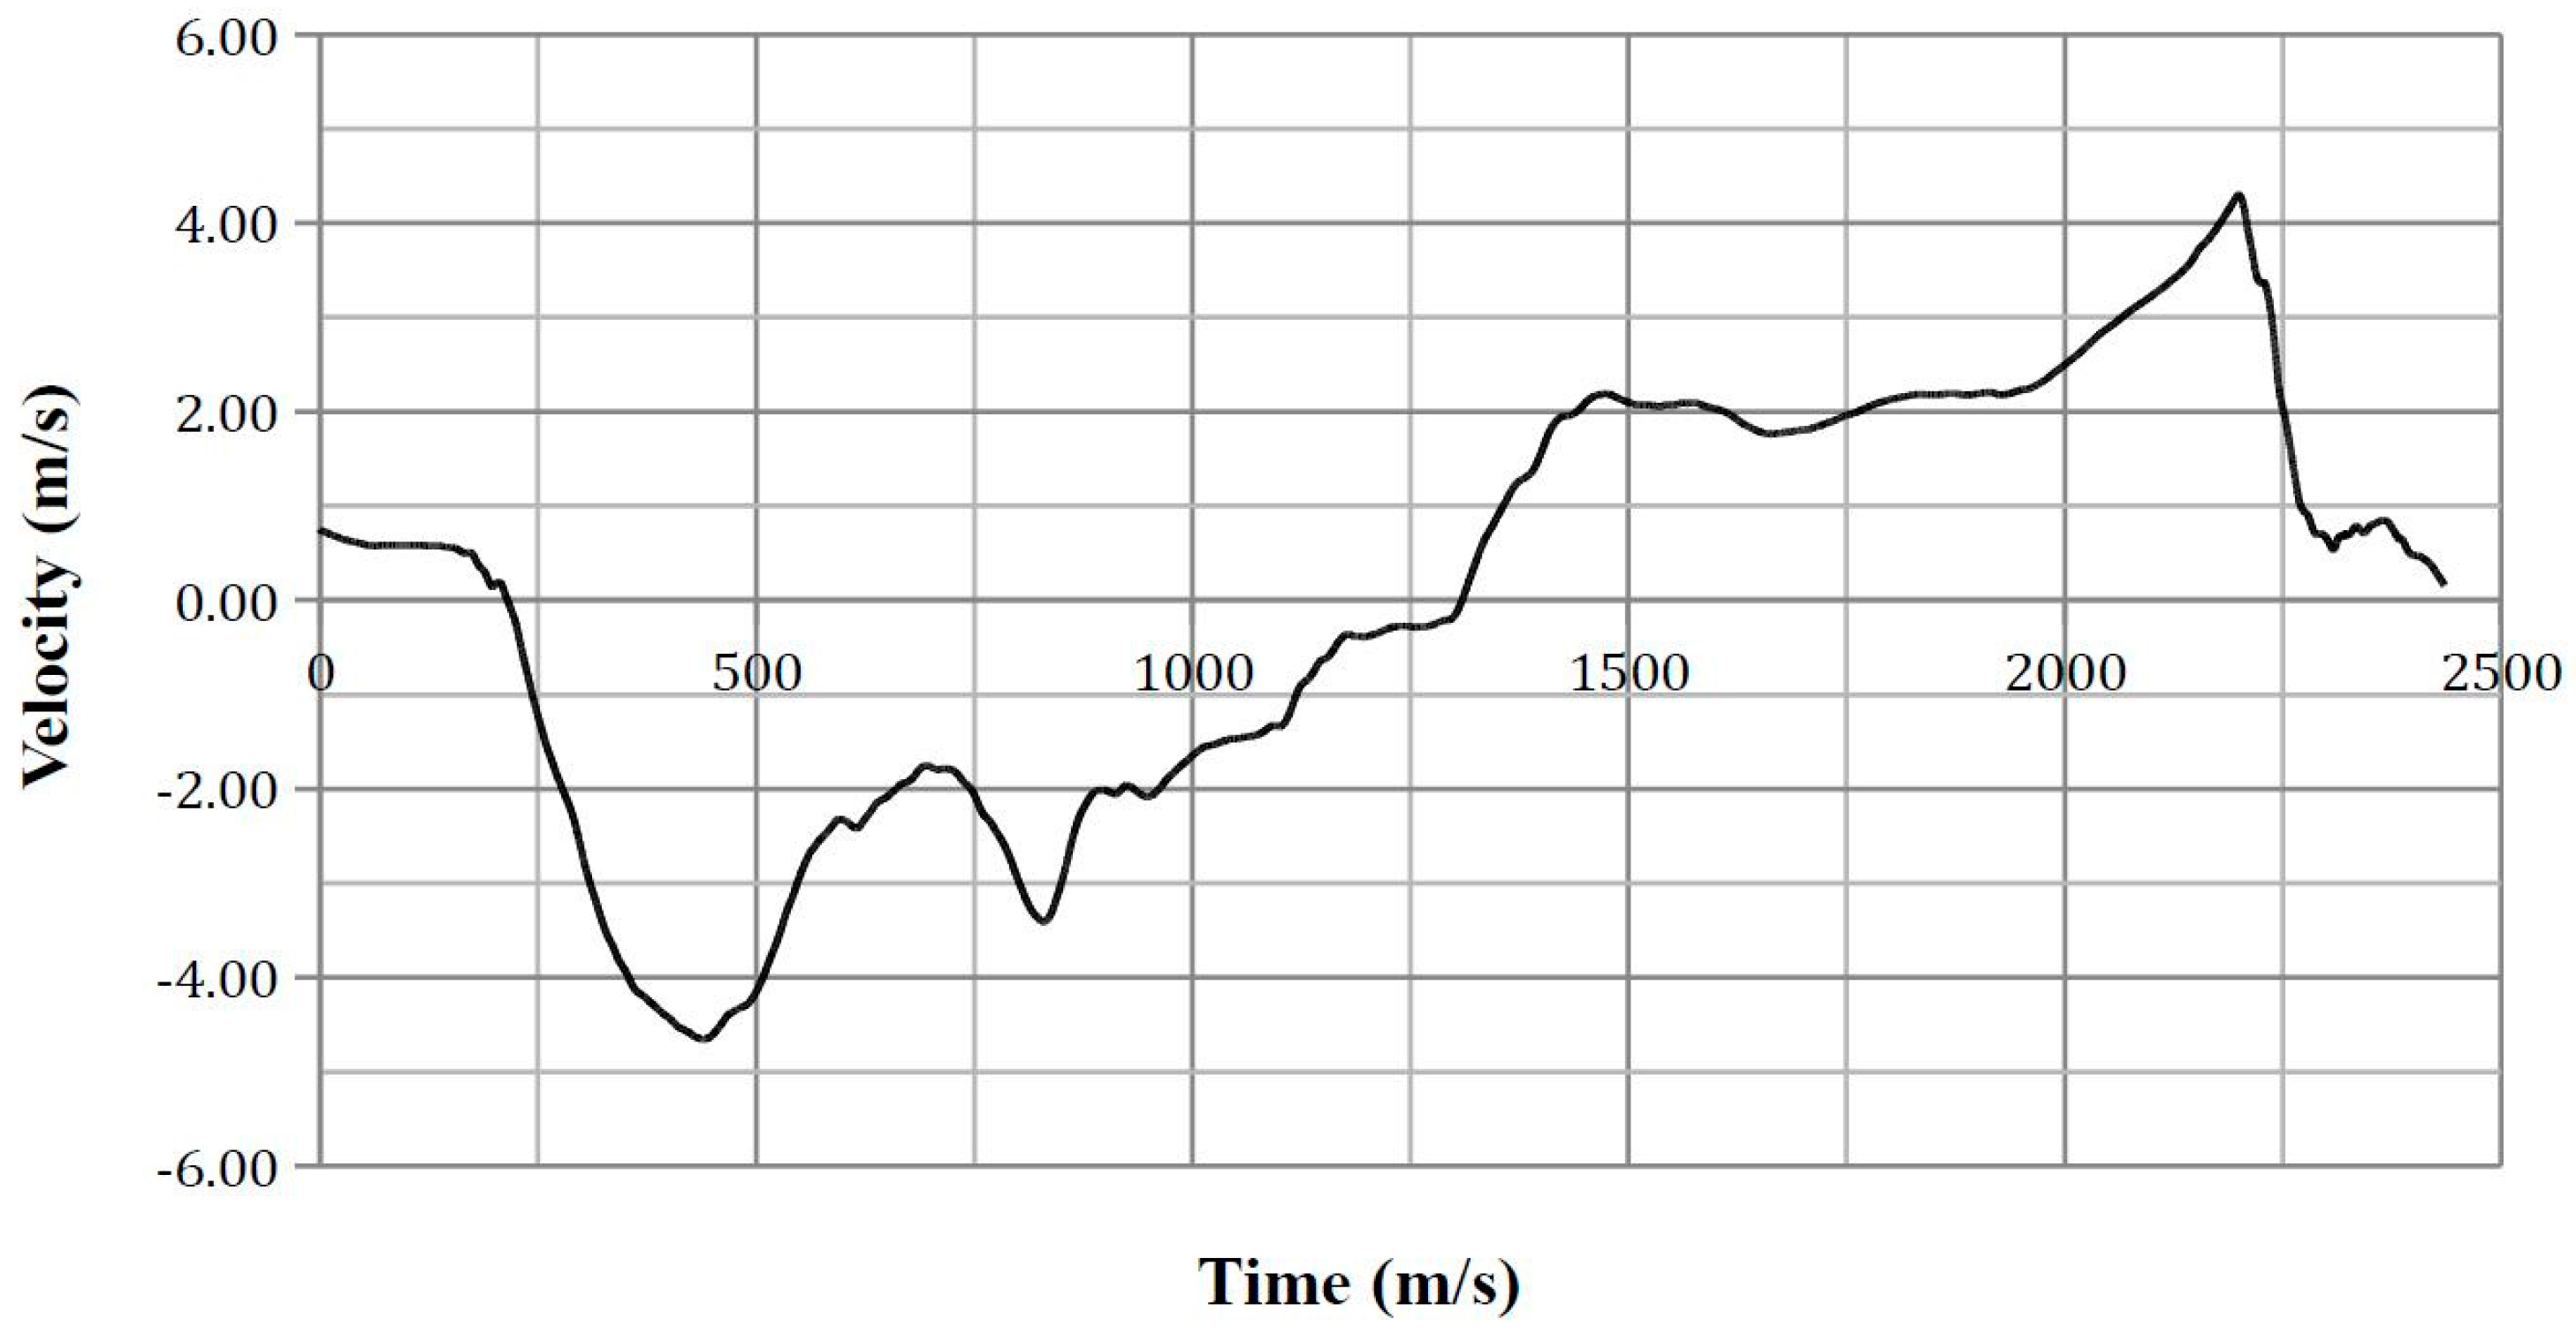
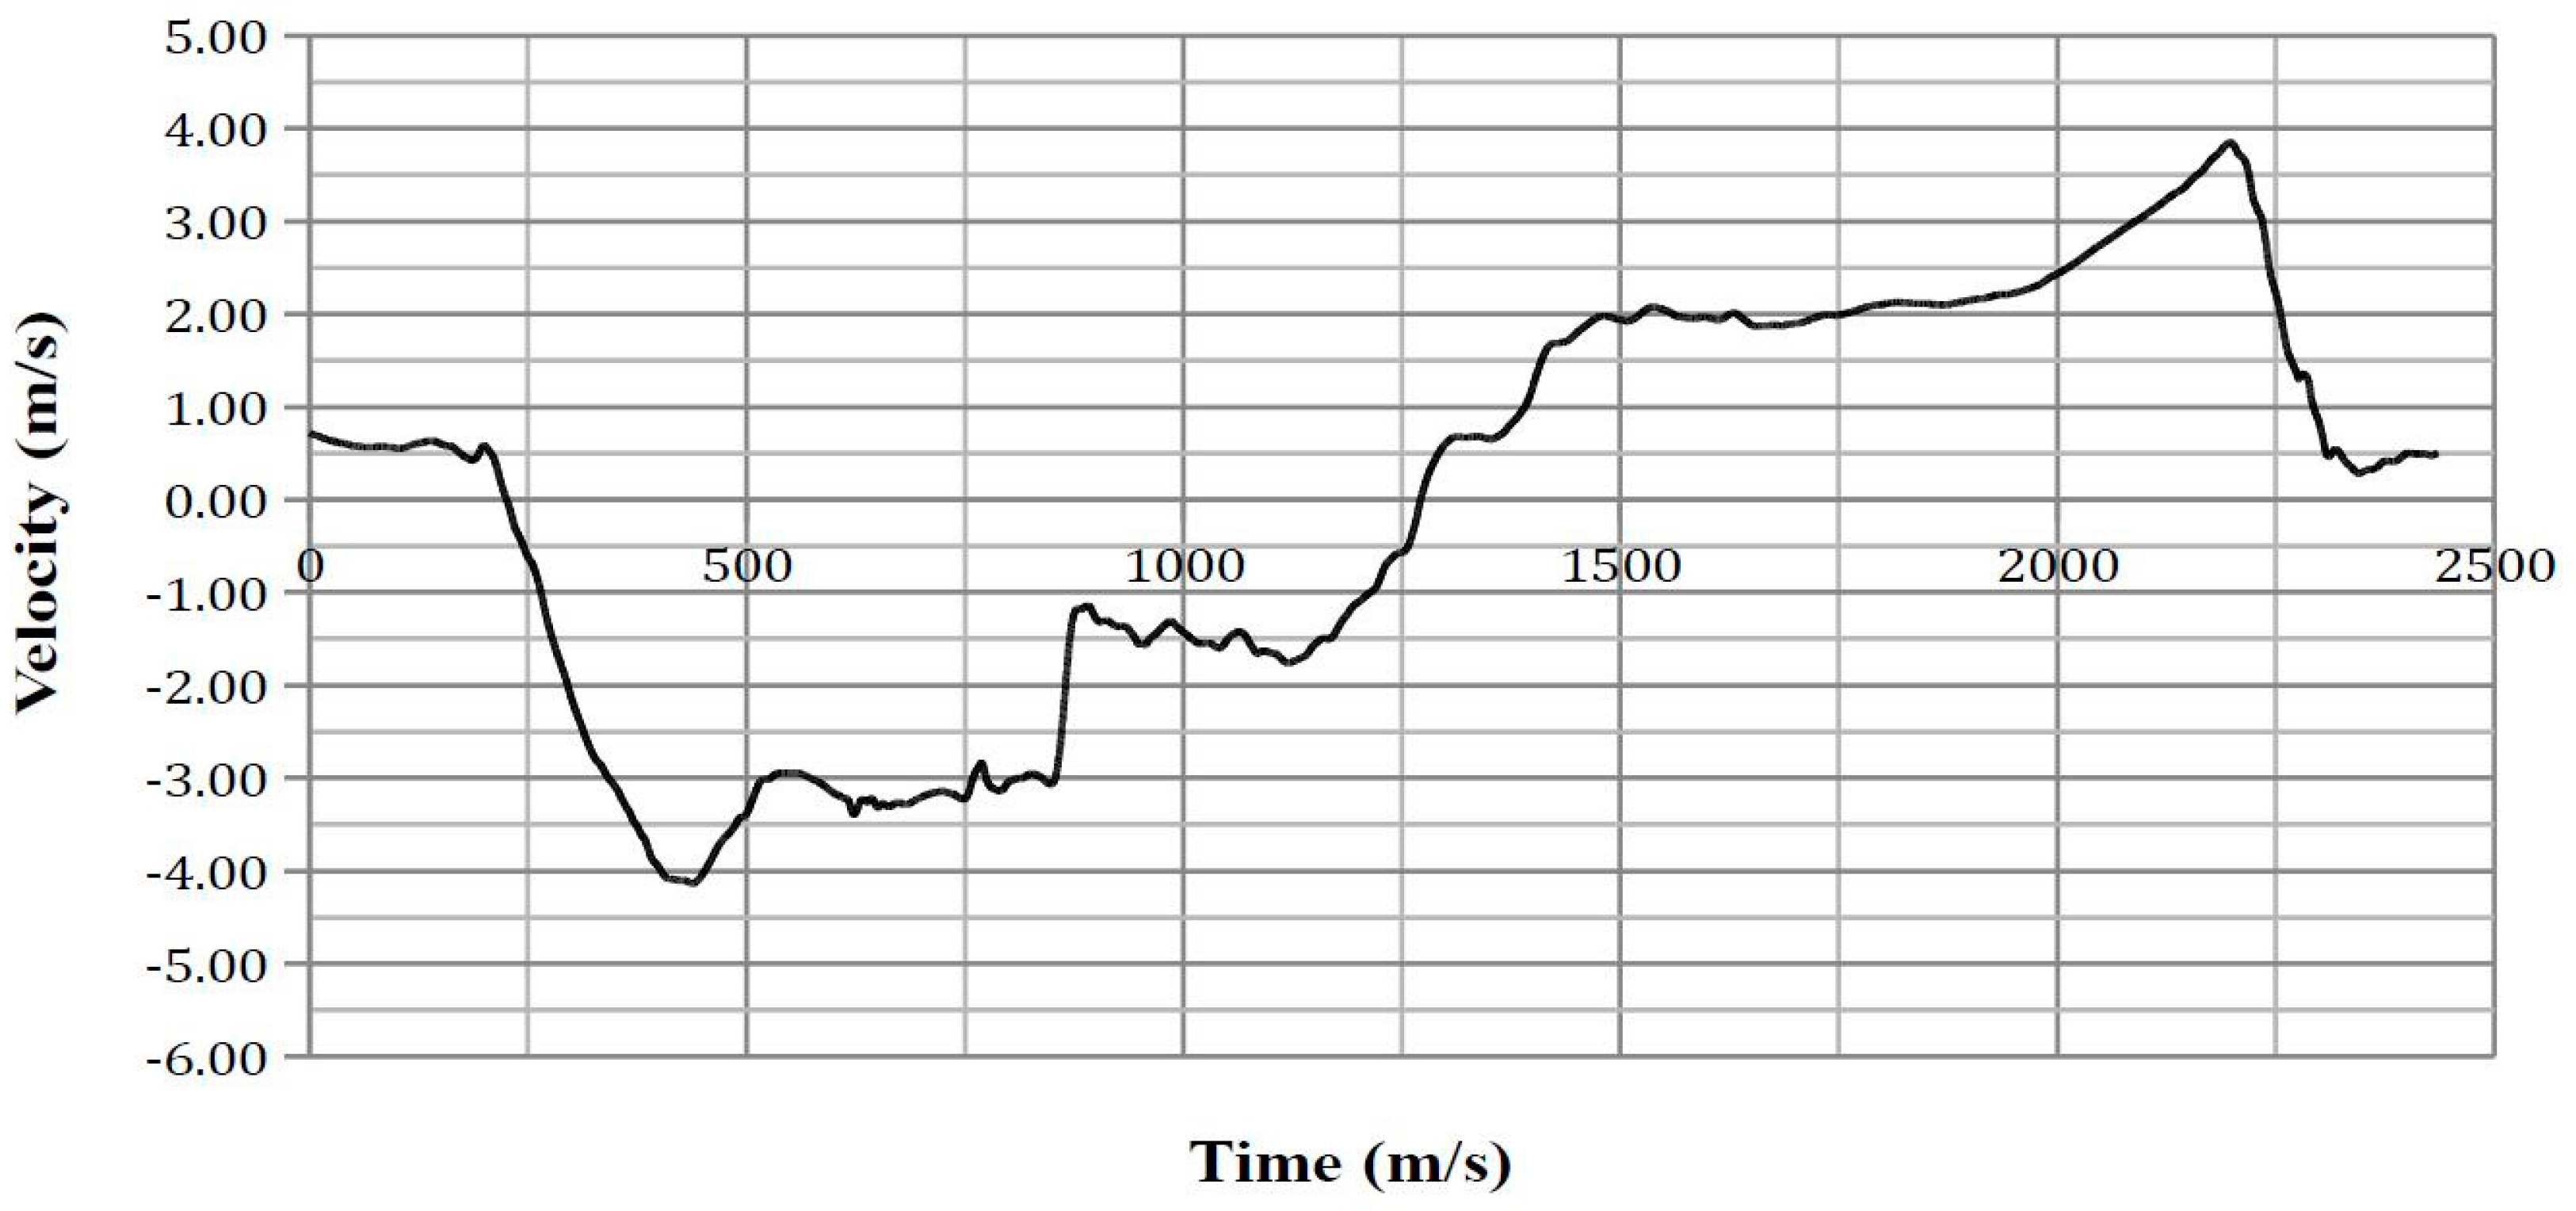
Appendix A
Vehicle kinematics time-history plots.
Figure A1.
Vehicle centre of gravity lateral velocity (relative to the global x-axis).

Figure A2.
Vehicle centre of gravity roll rate (relative to the vehicle x-axis).

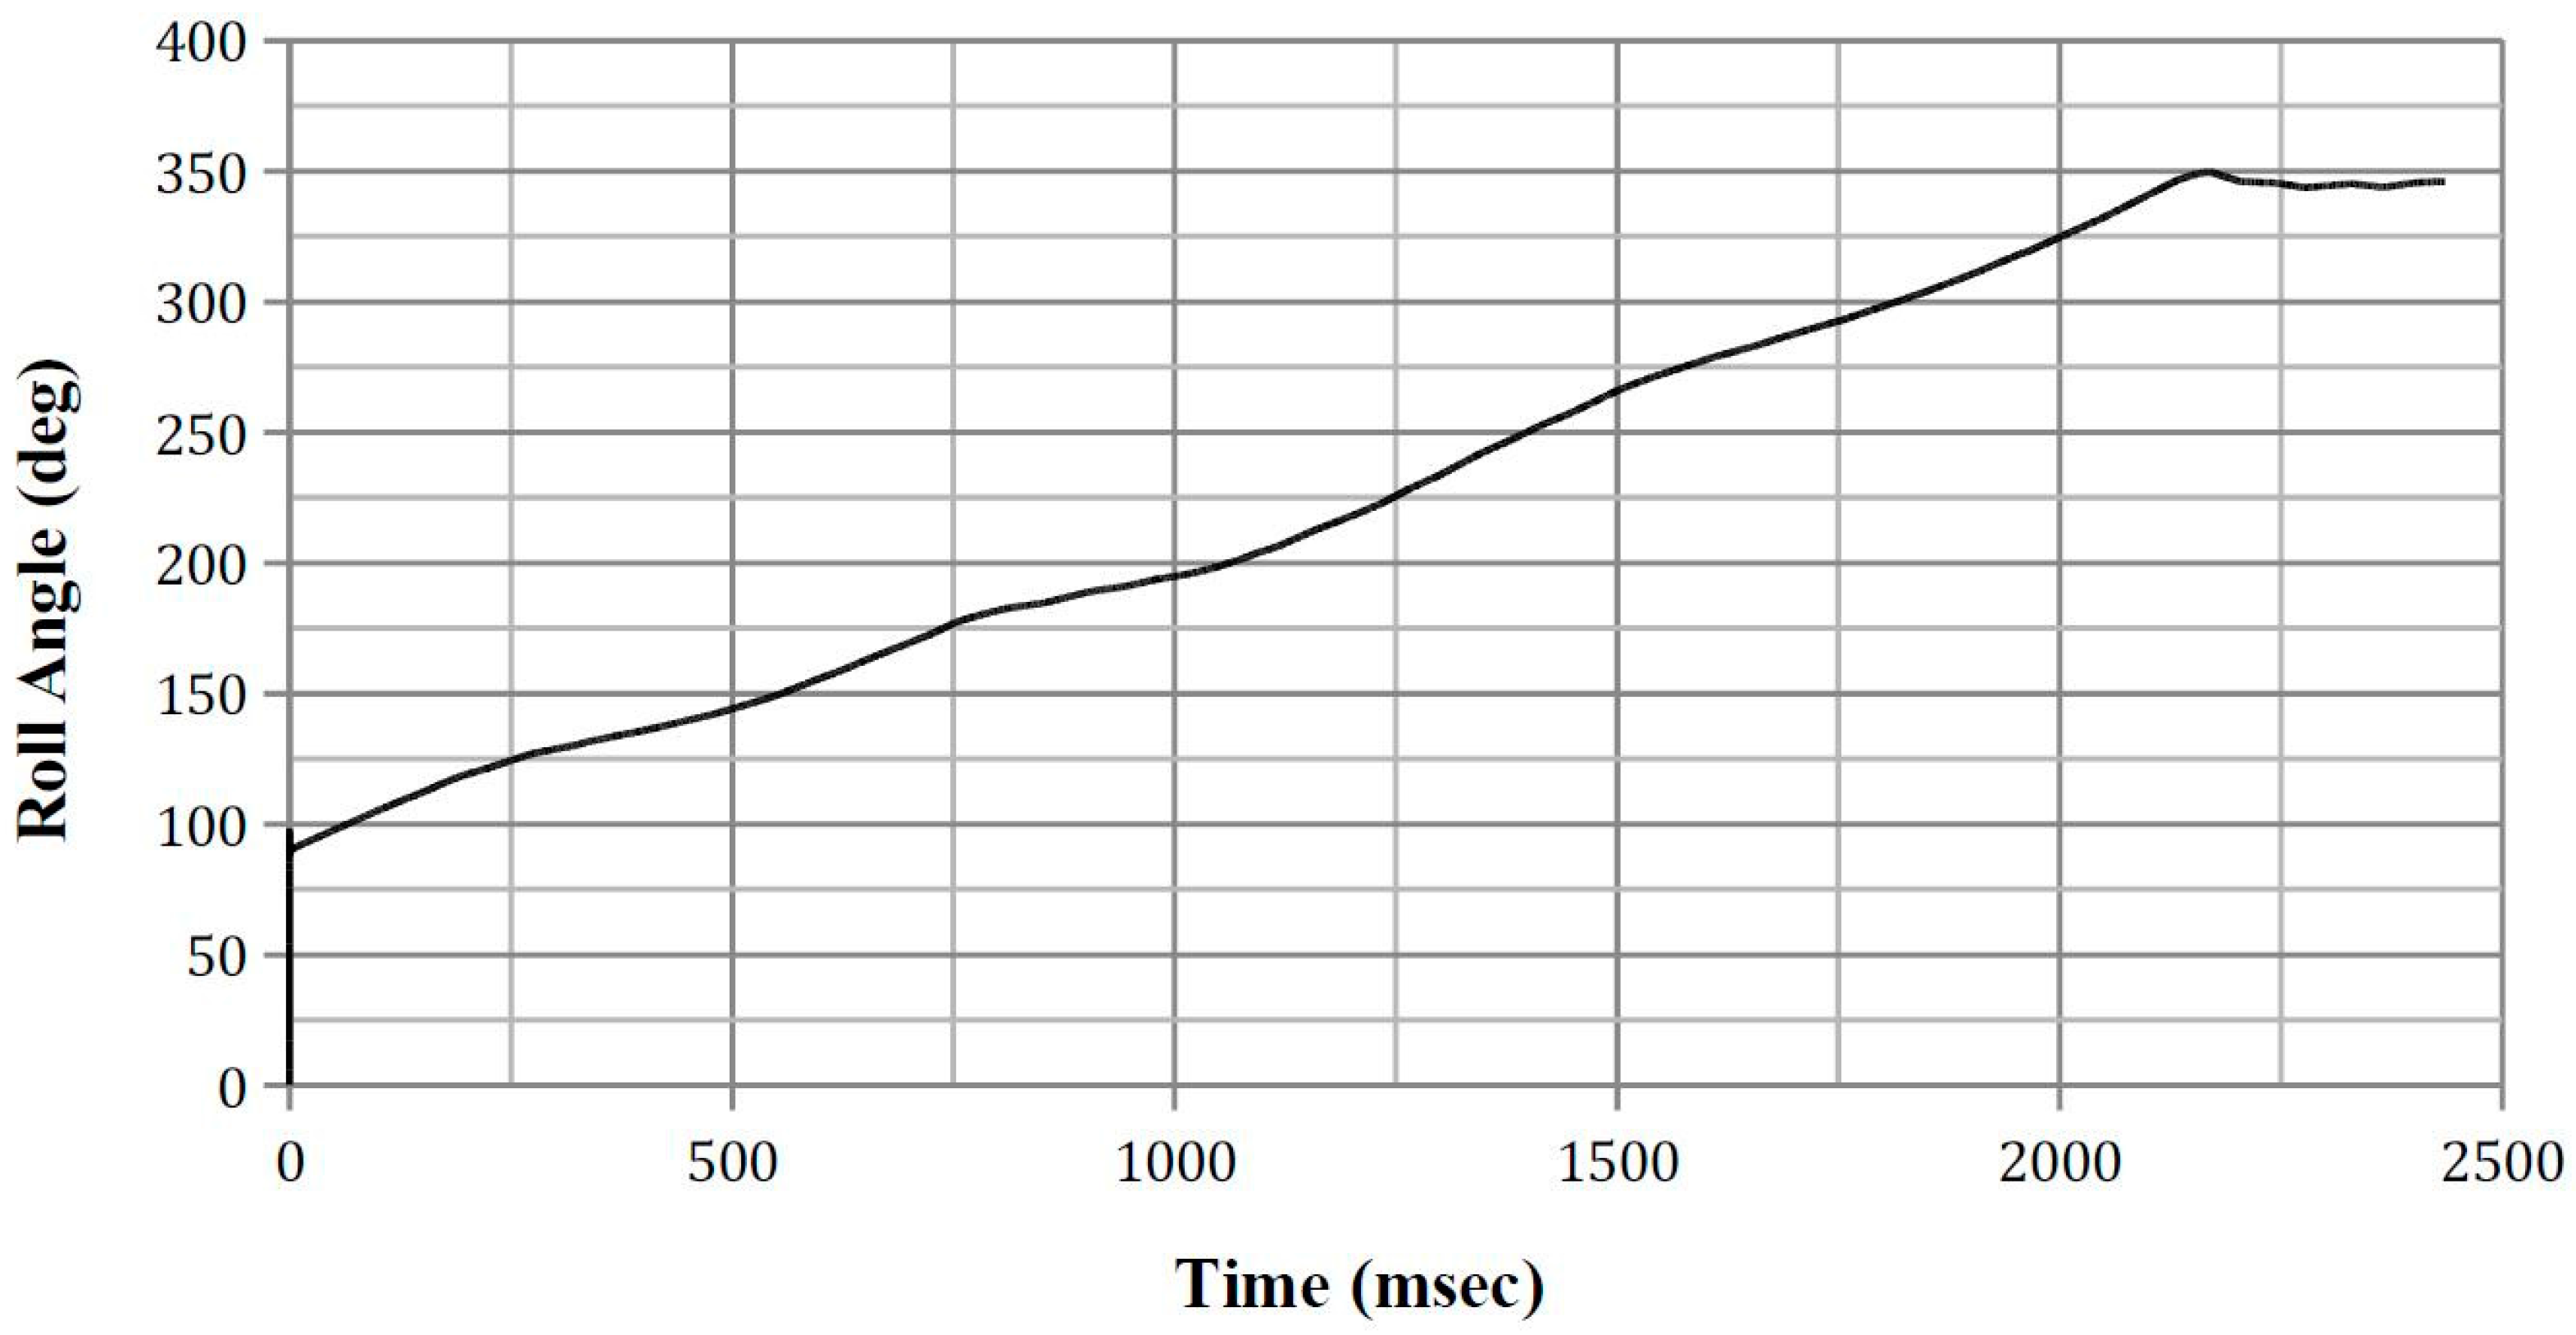
Figure A3.
Vehicle centre of gravity roll angle (relative to the vehicle’s x-axis).

Appendix B
Roof deformation time-history plots.
Figure A4.
Left A-pillar deformation.

Figure A5.
Left B-pillar deformation.

Appendix C
Upper, middle, and lower rib deflection time-history plots.
Figure A6.
ATD Position 1 rib displacement.

Figure A7.
ATD Position 2 rib displacement.

Figure A8.
ATD Position 5 rib displacement.

Figure A9.
ATD Position 8 rib displacement.

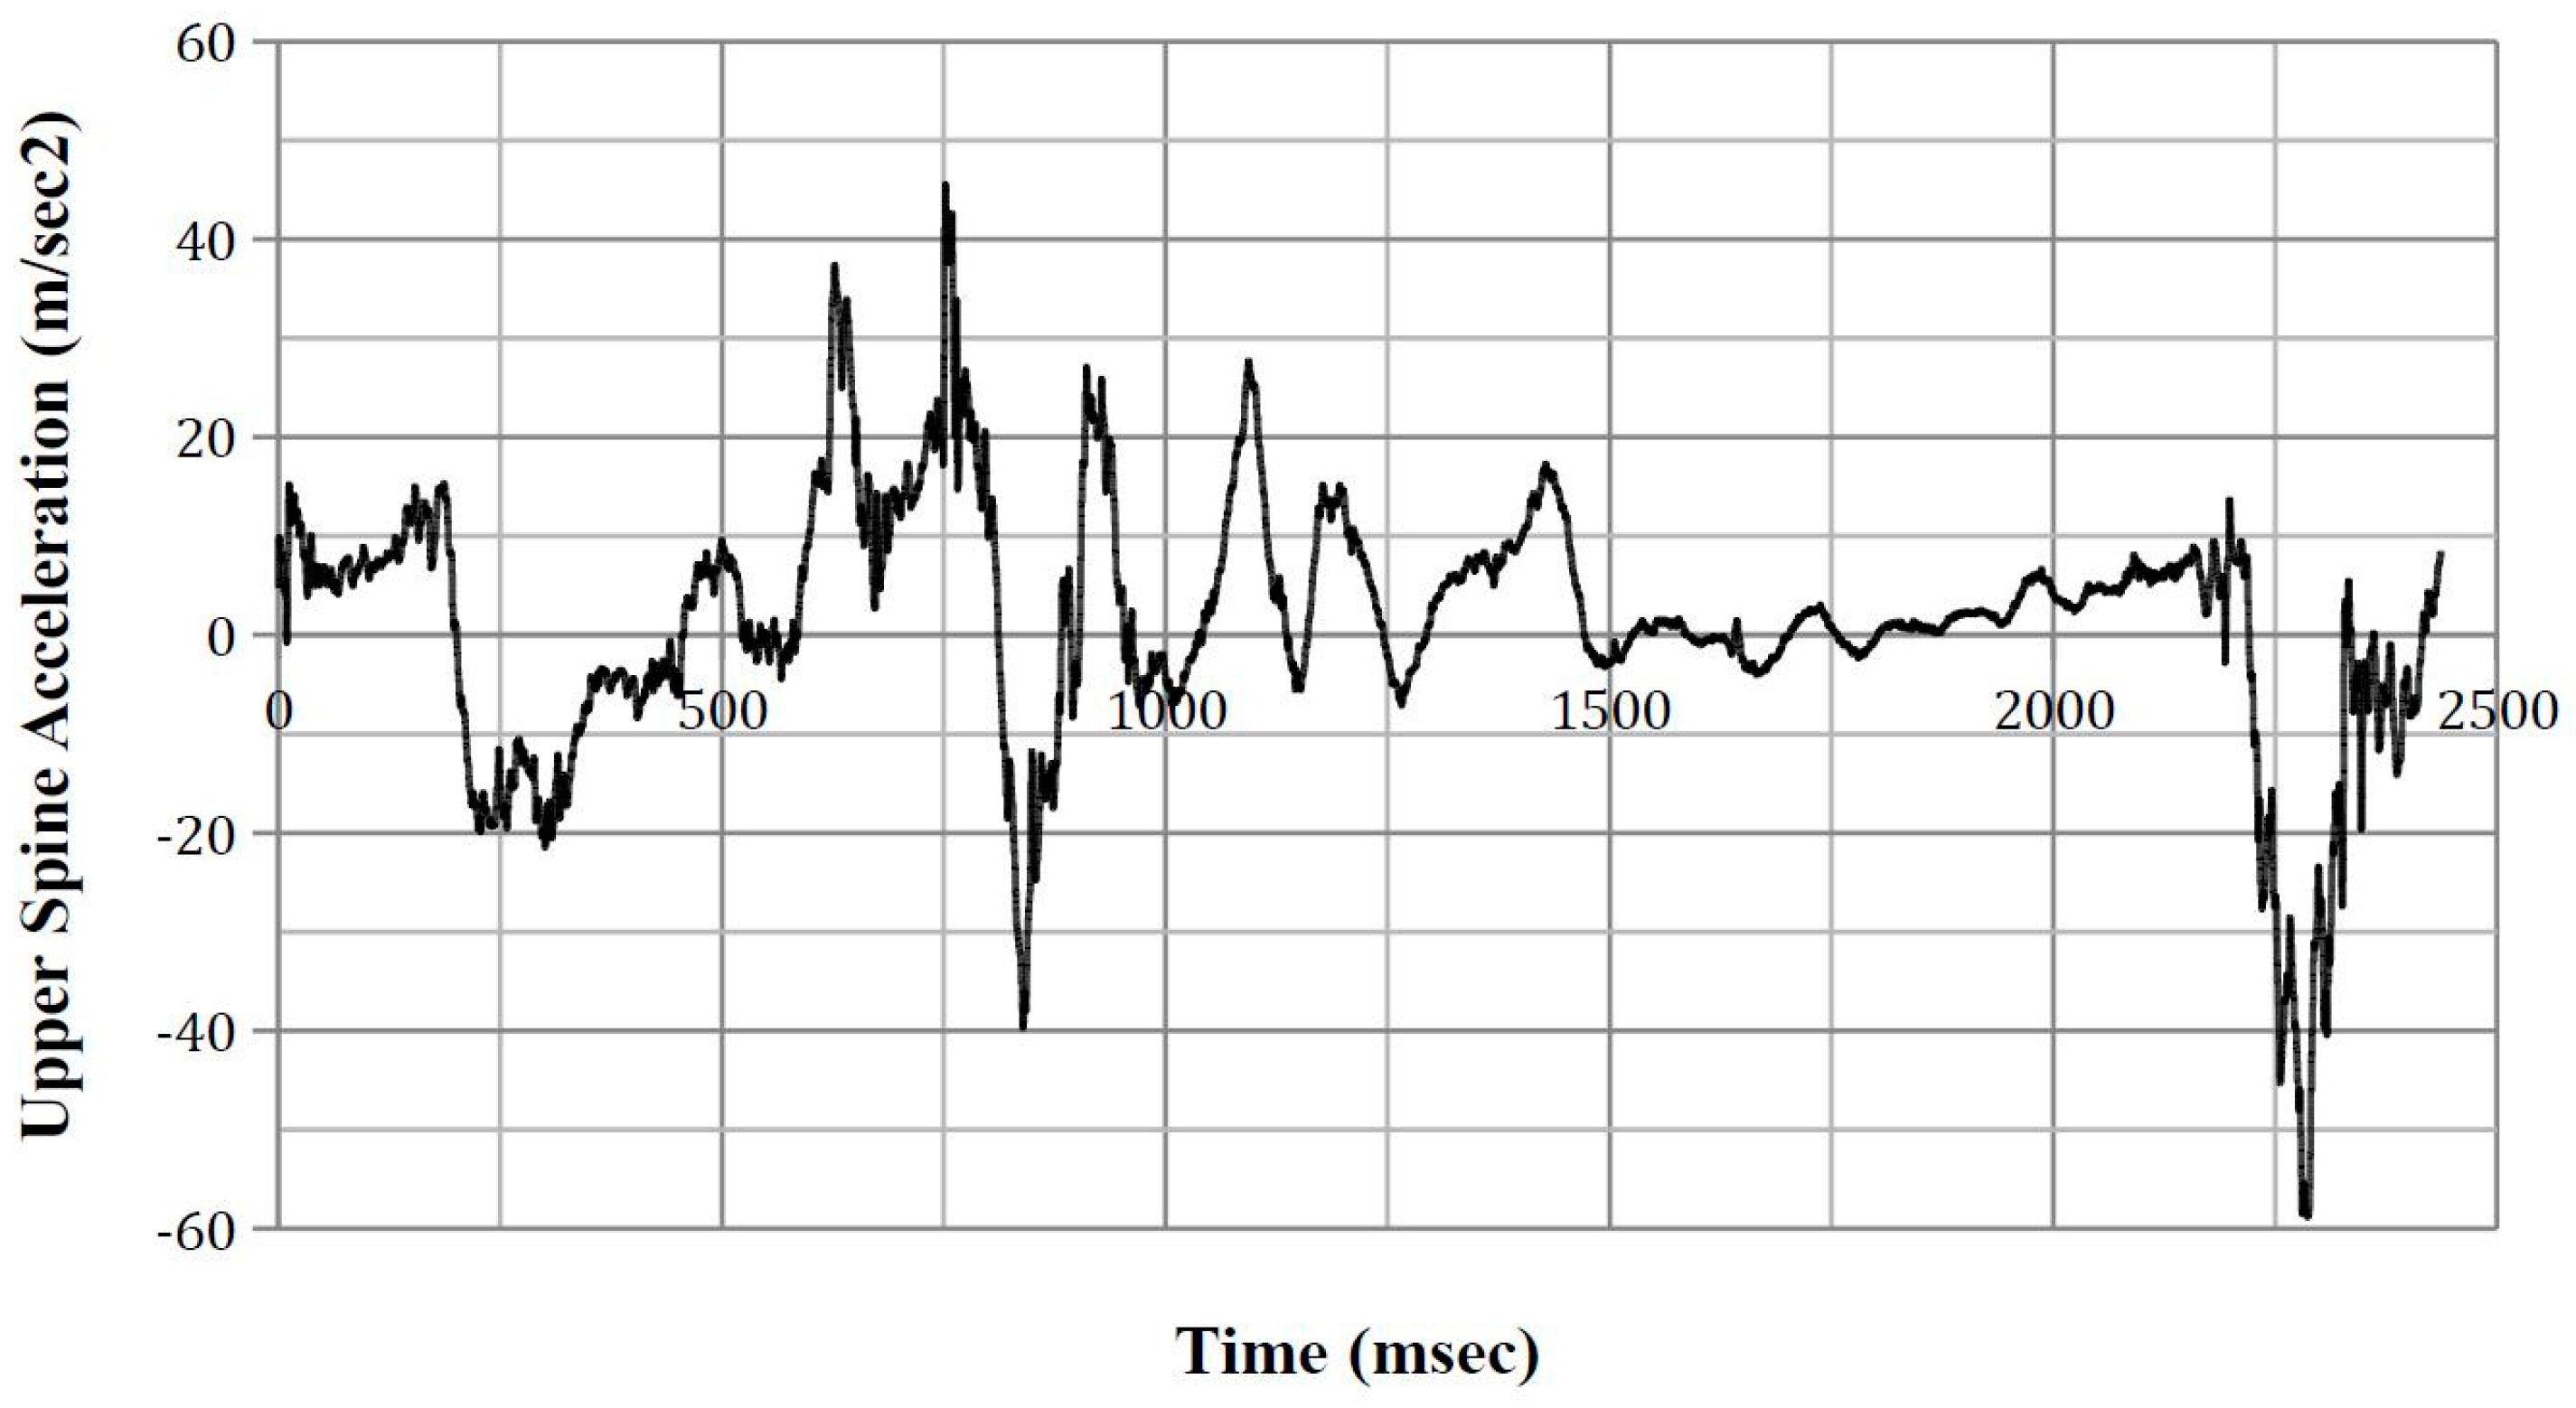
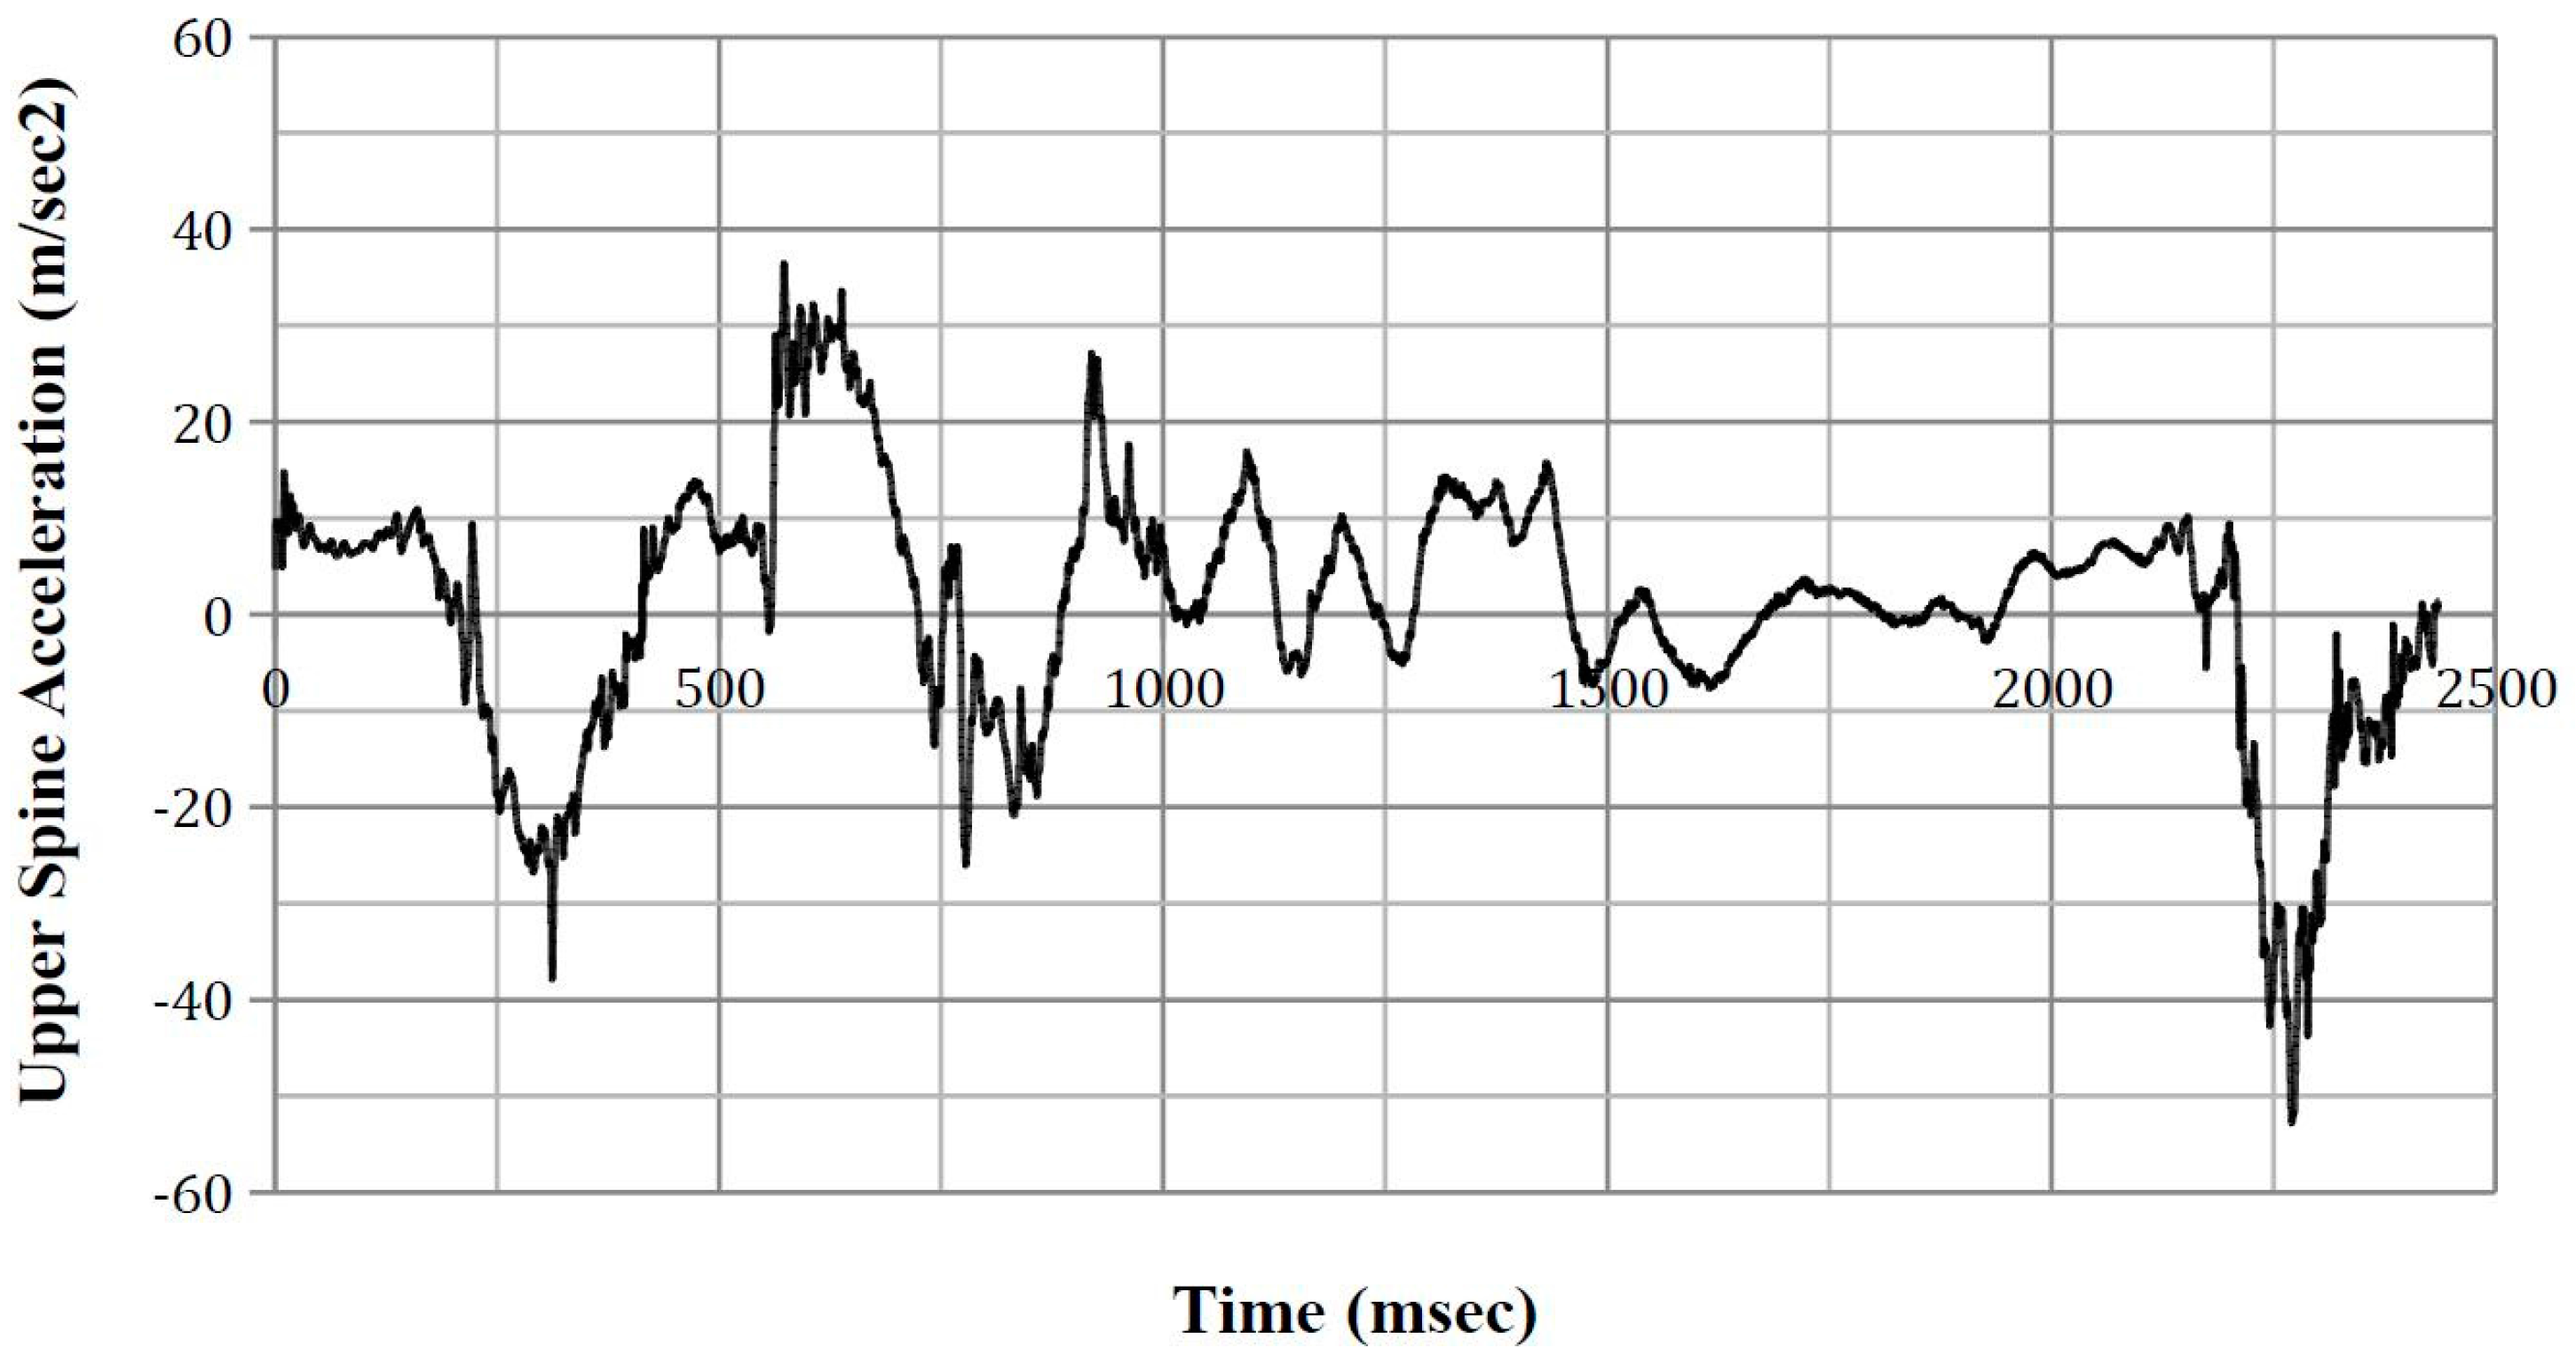
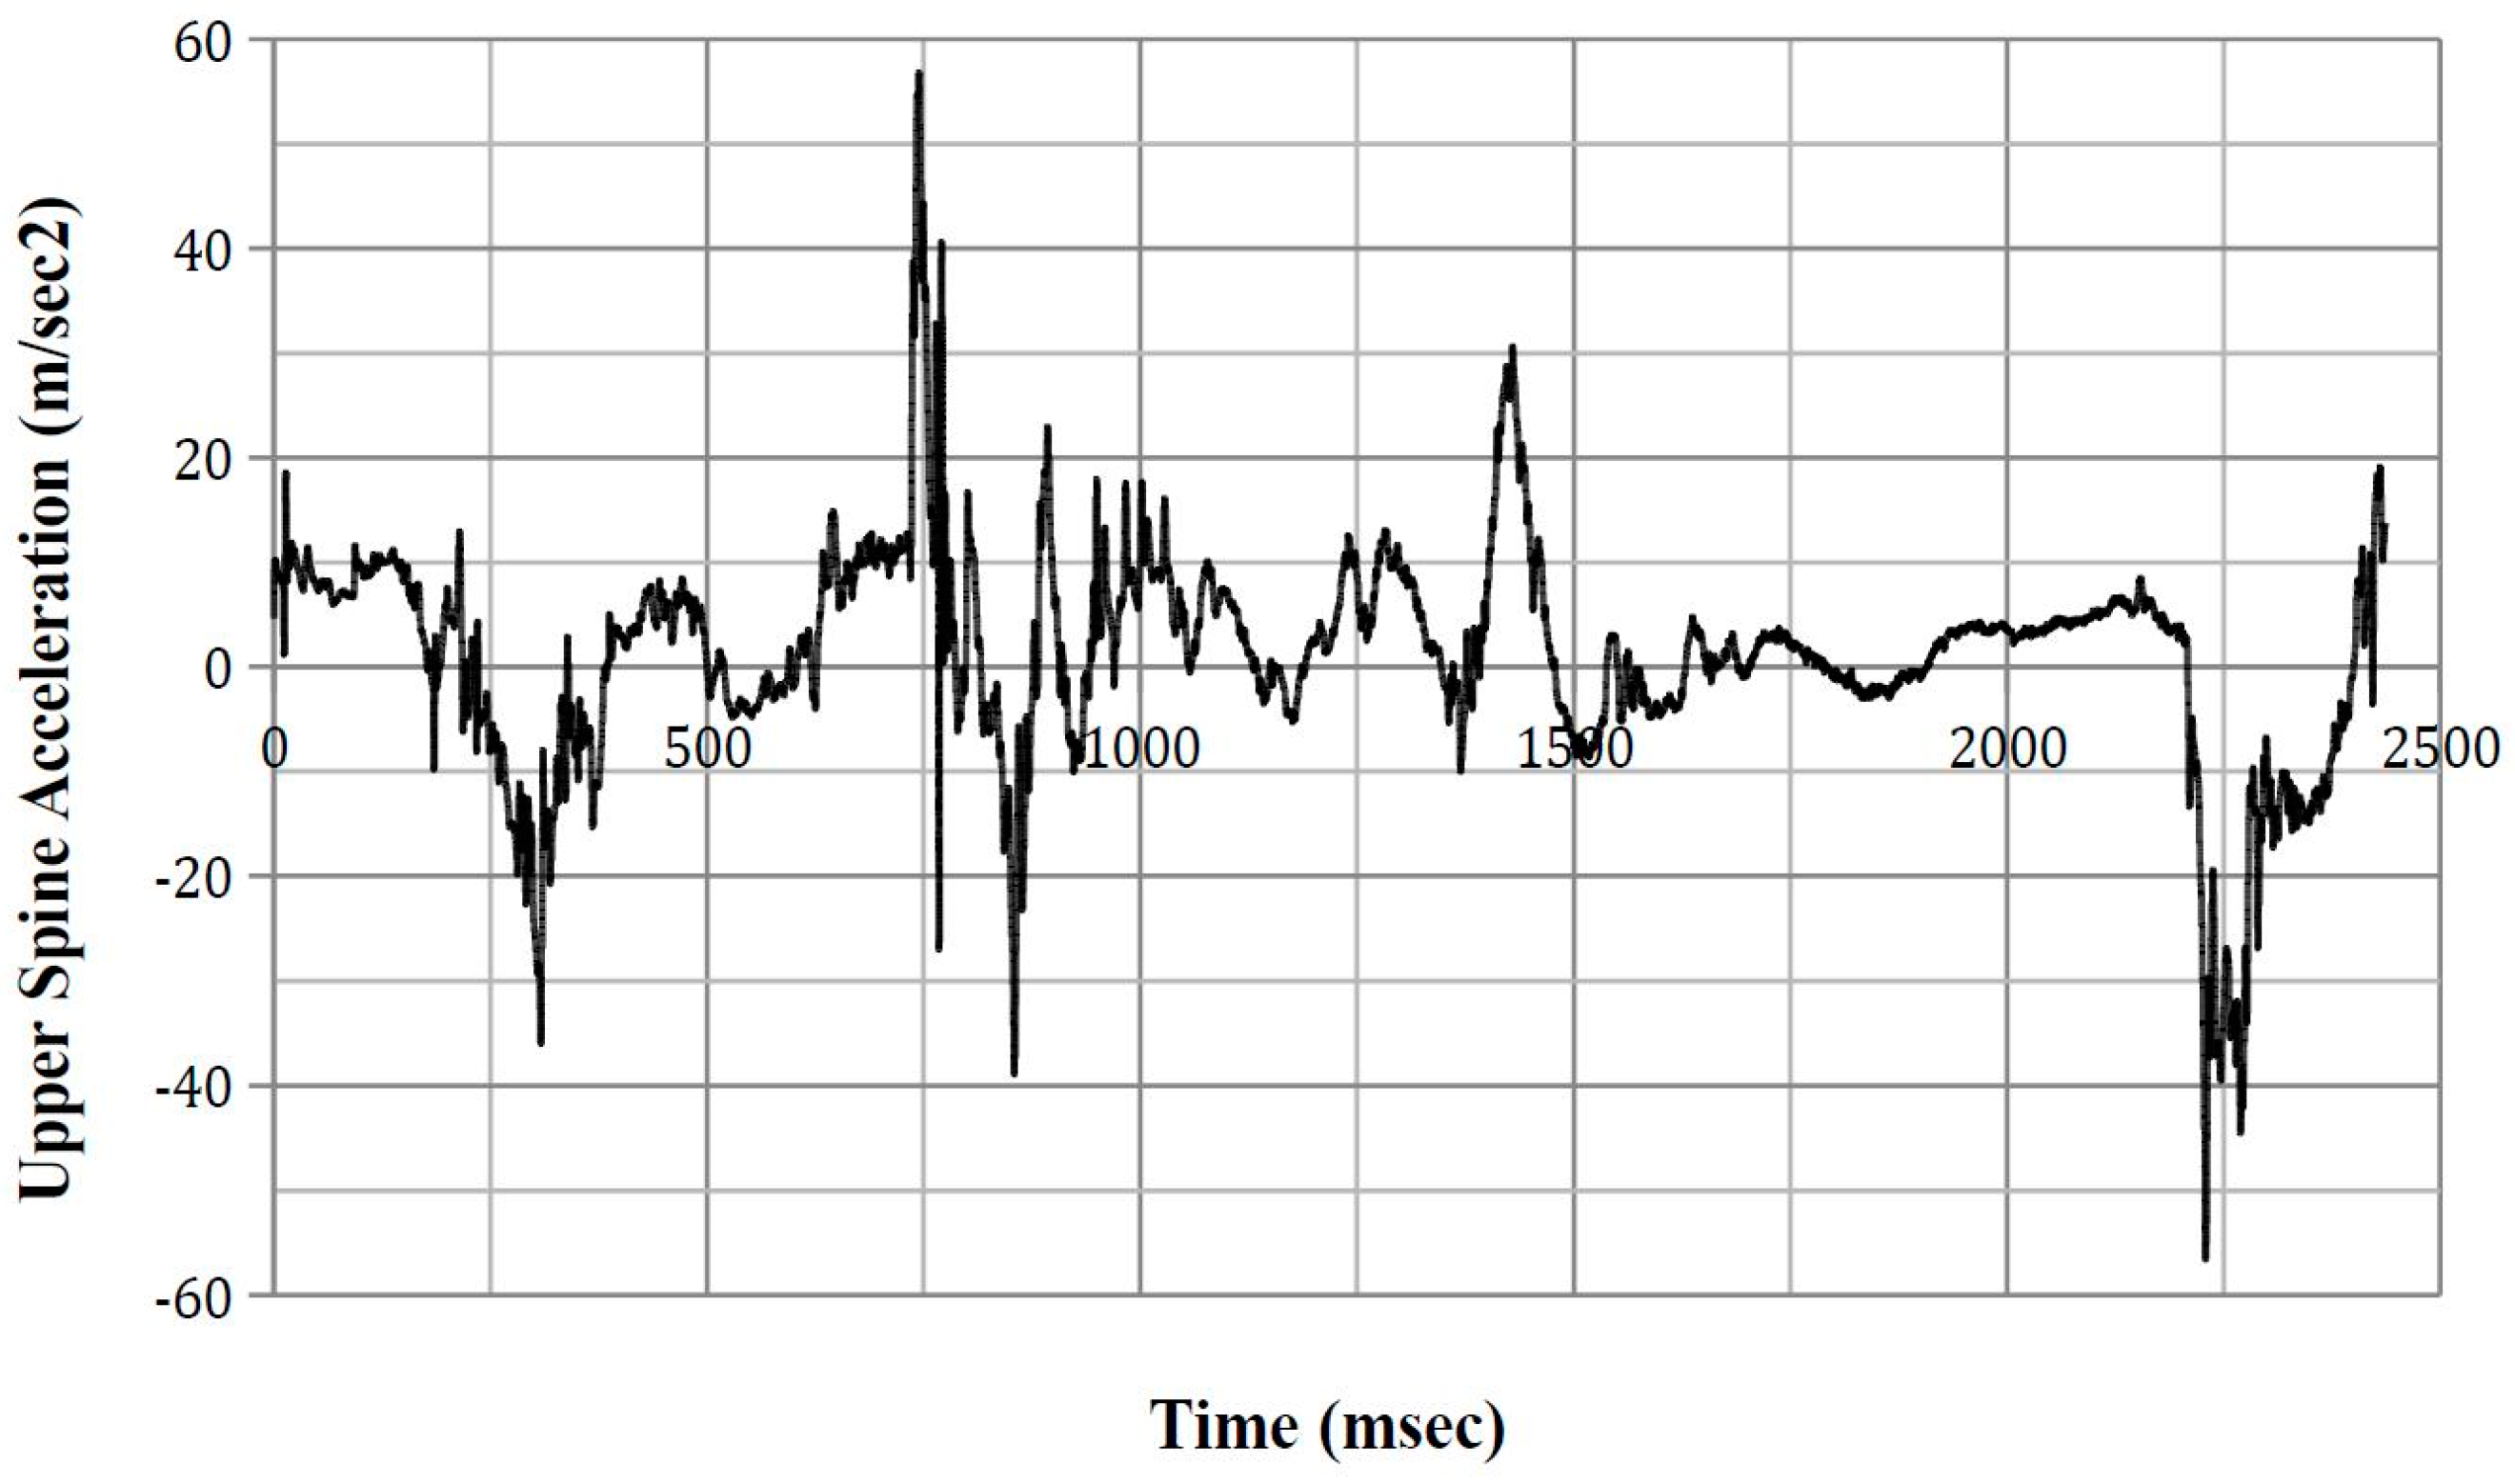
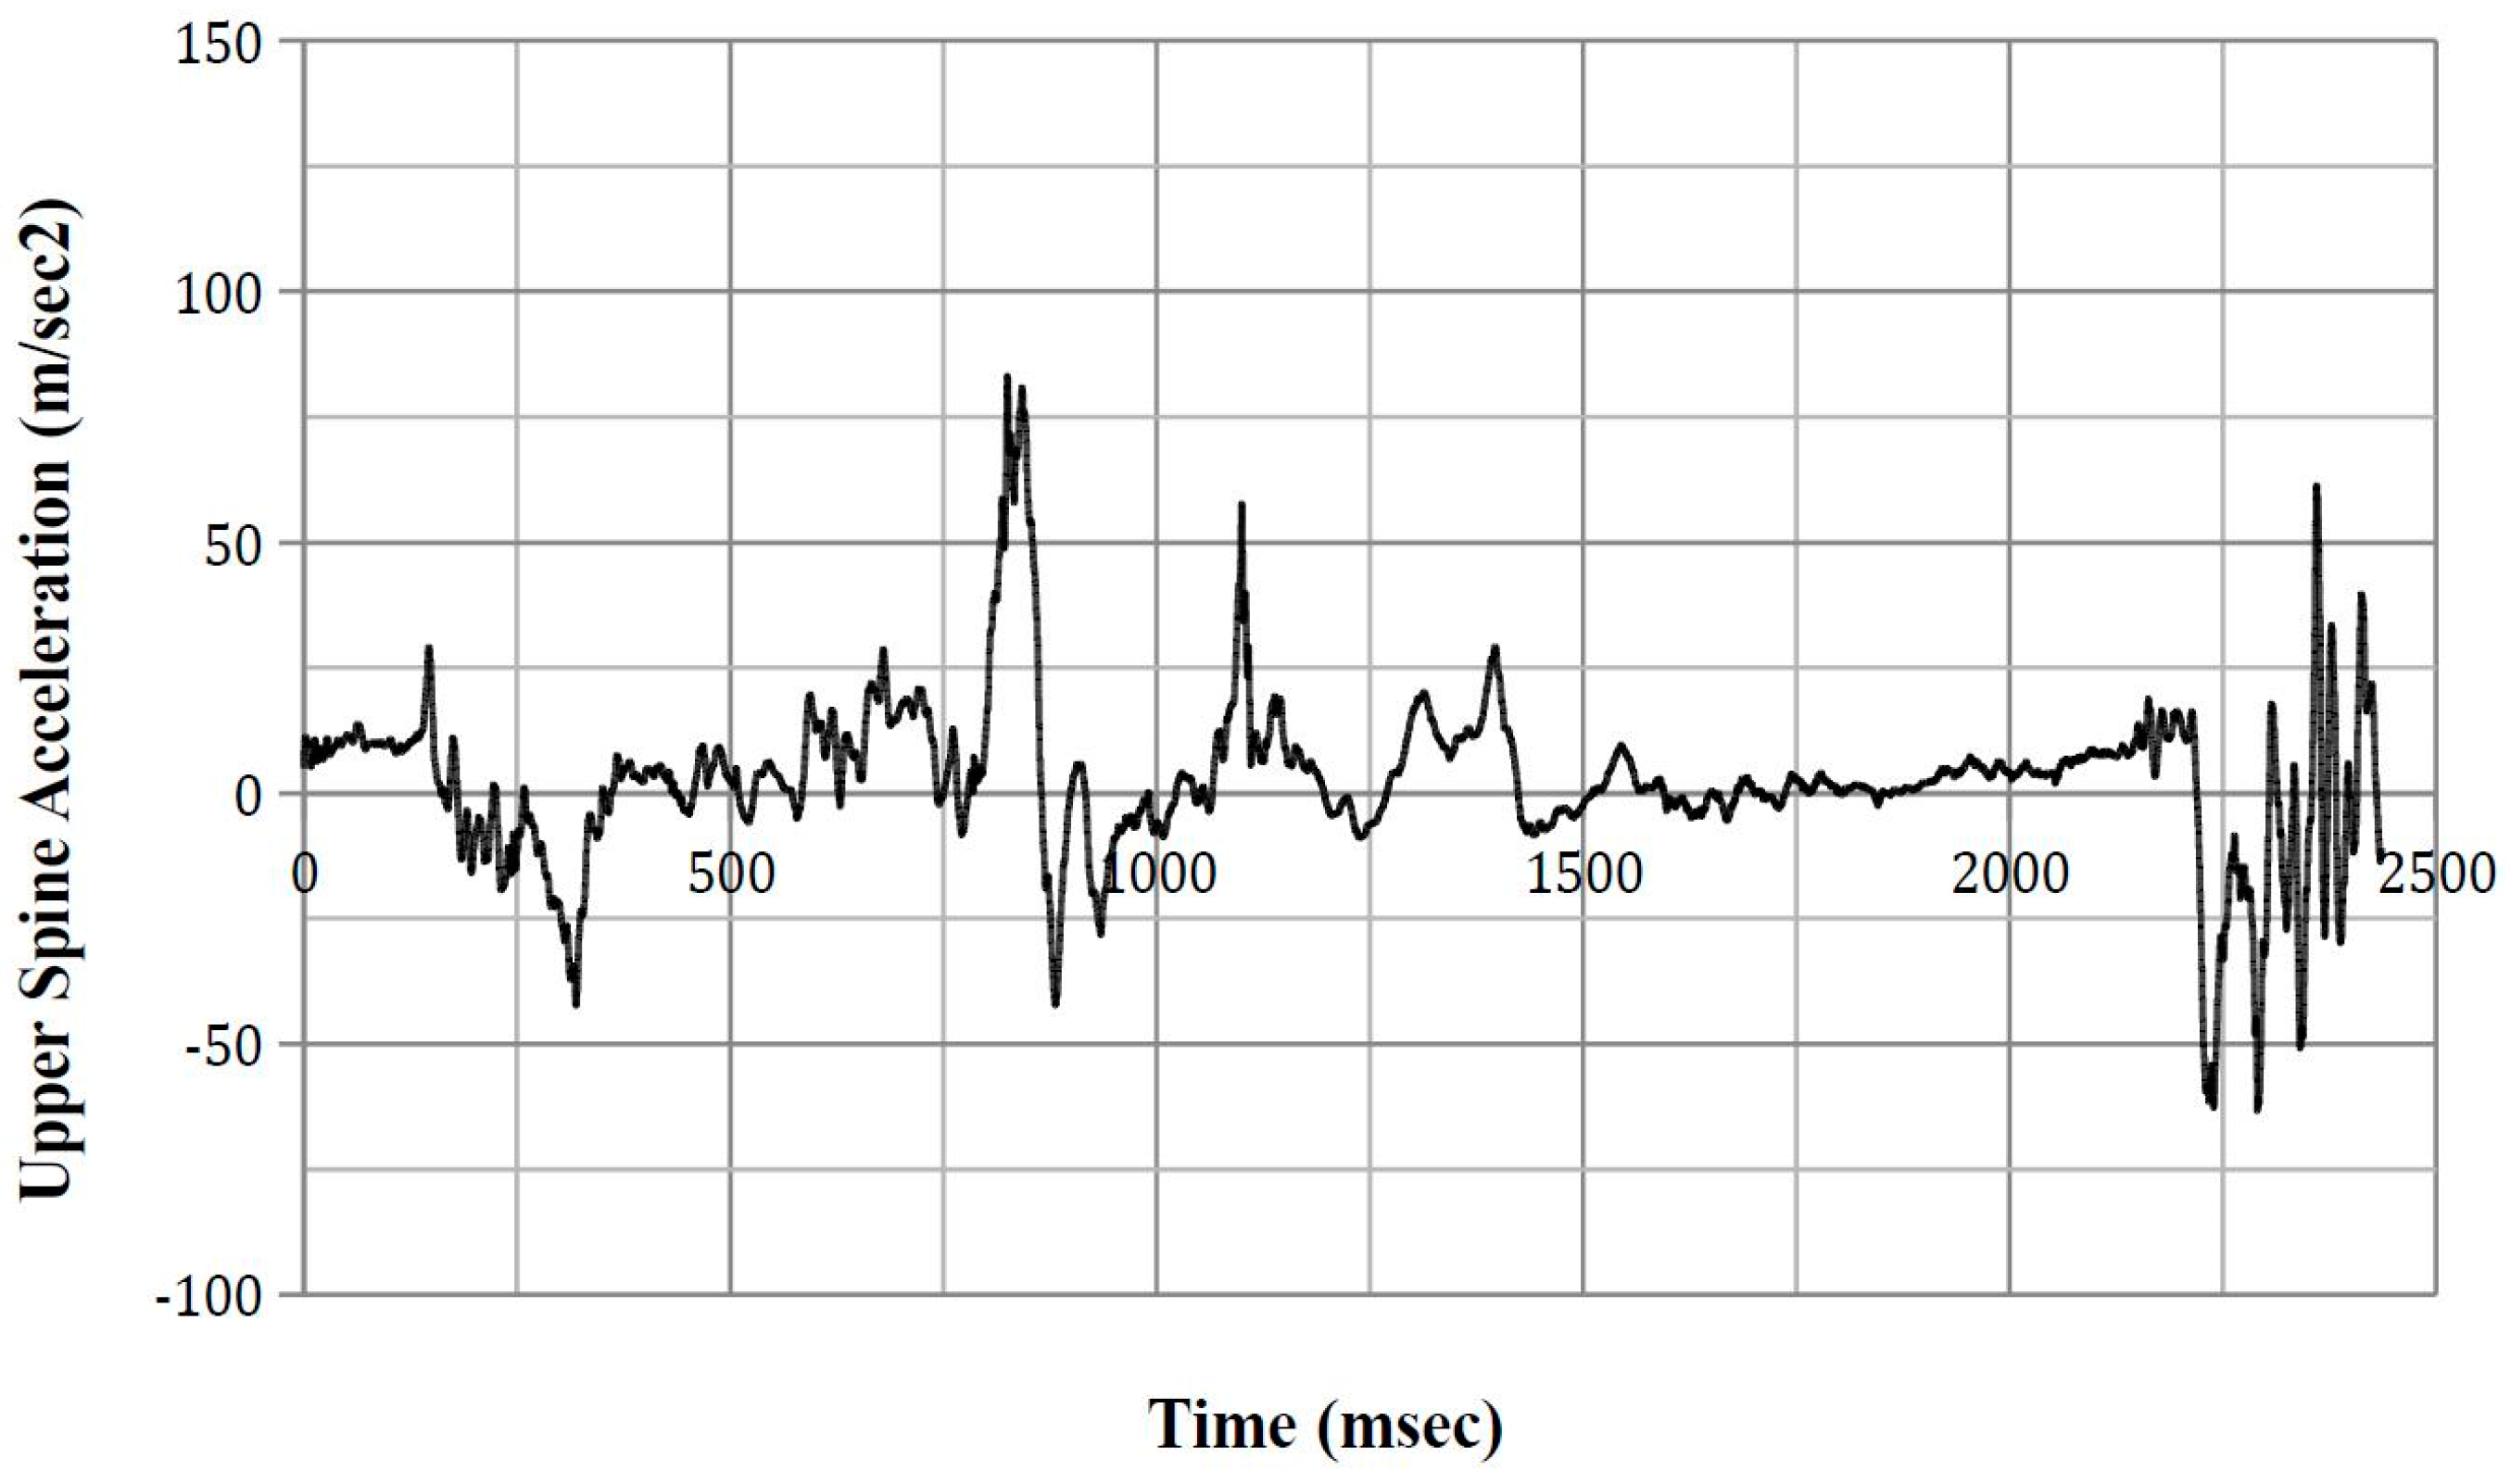
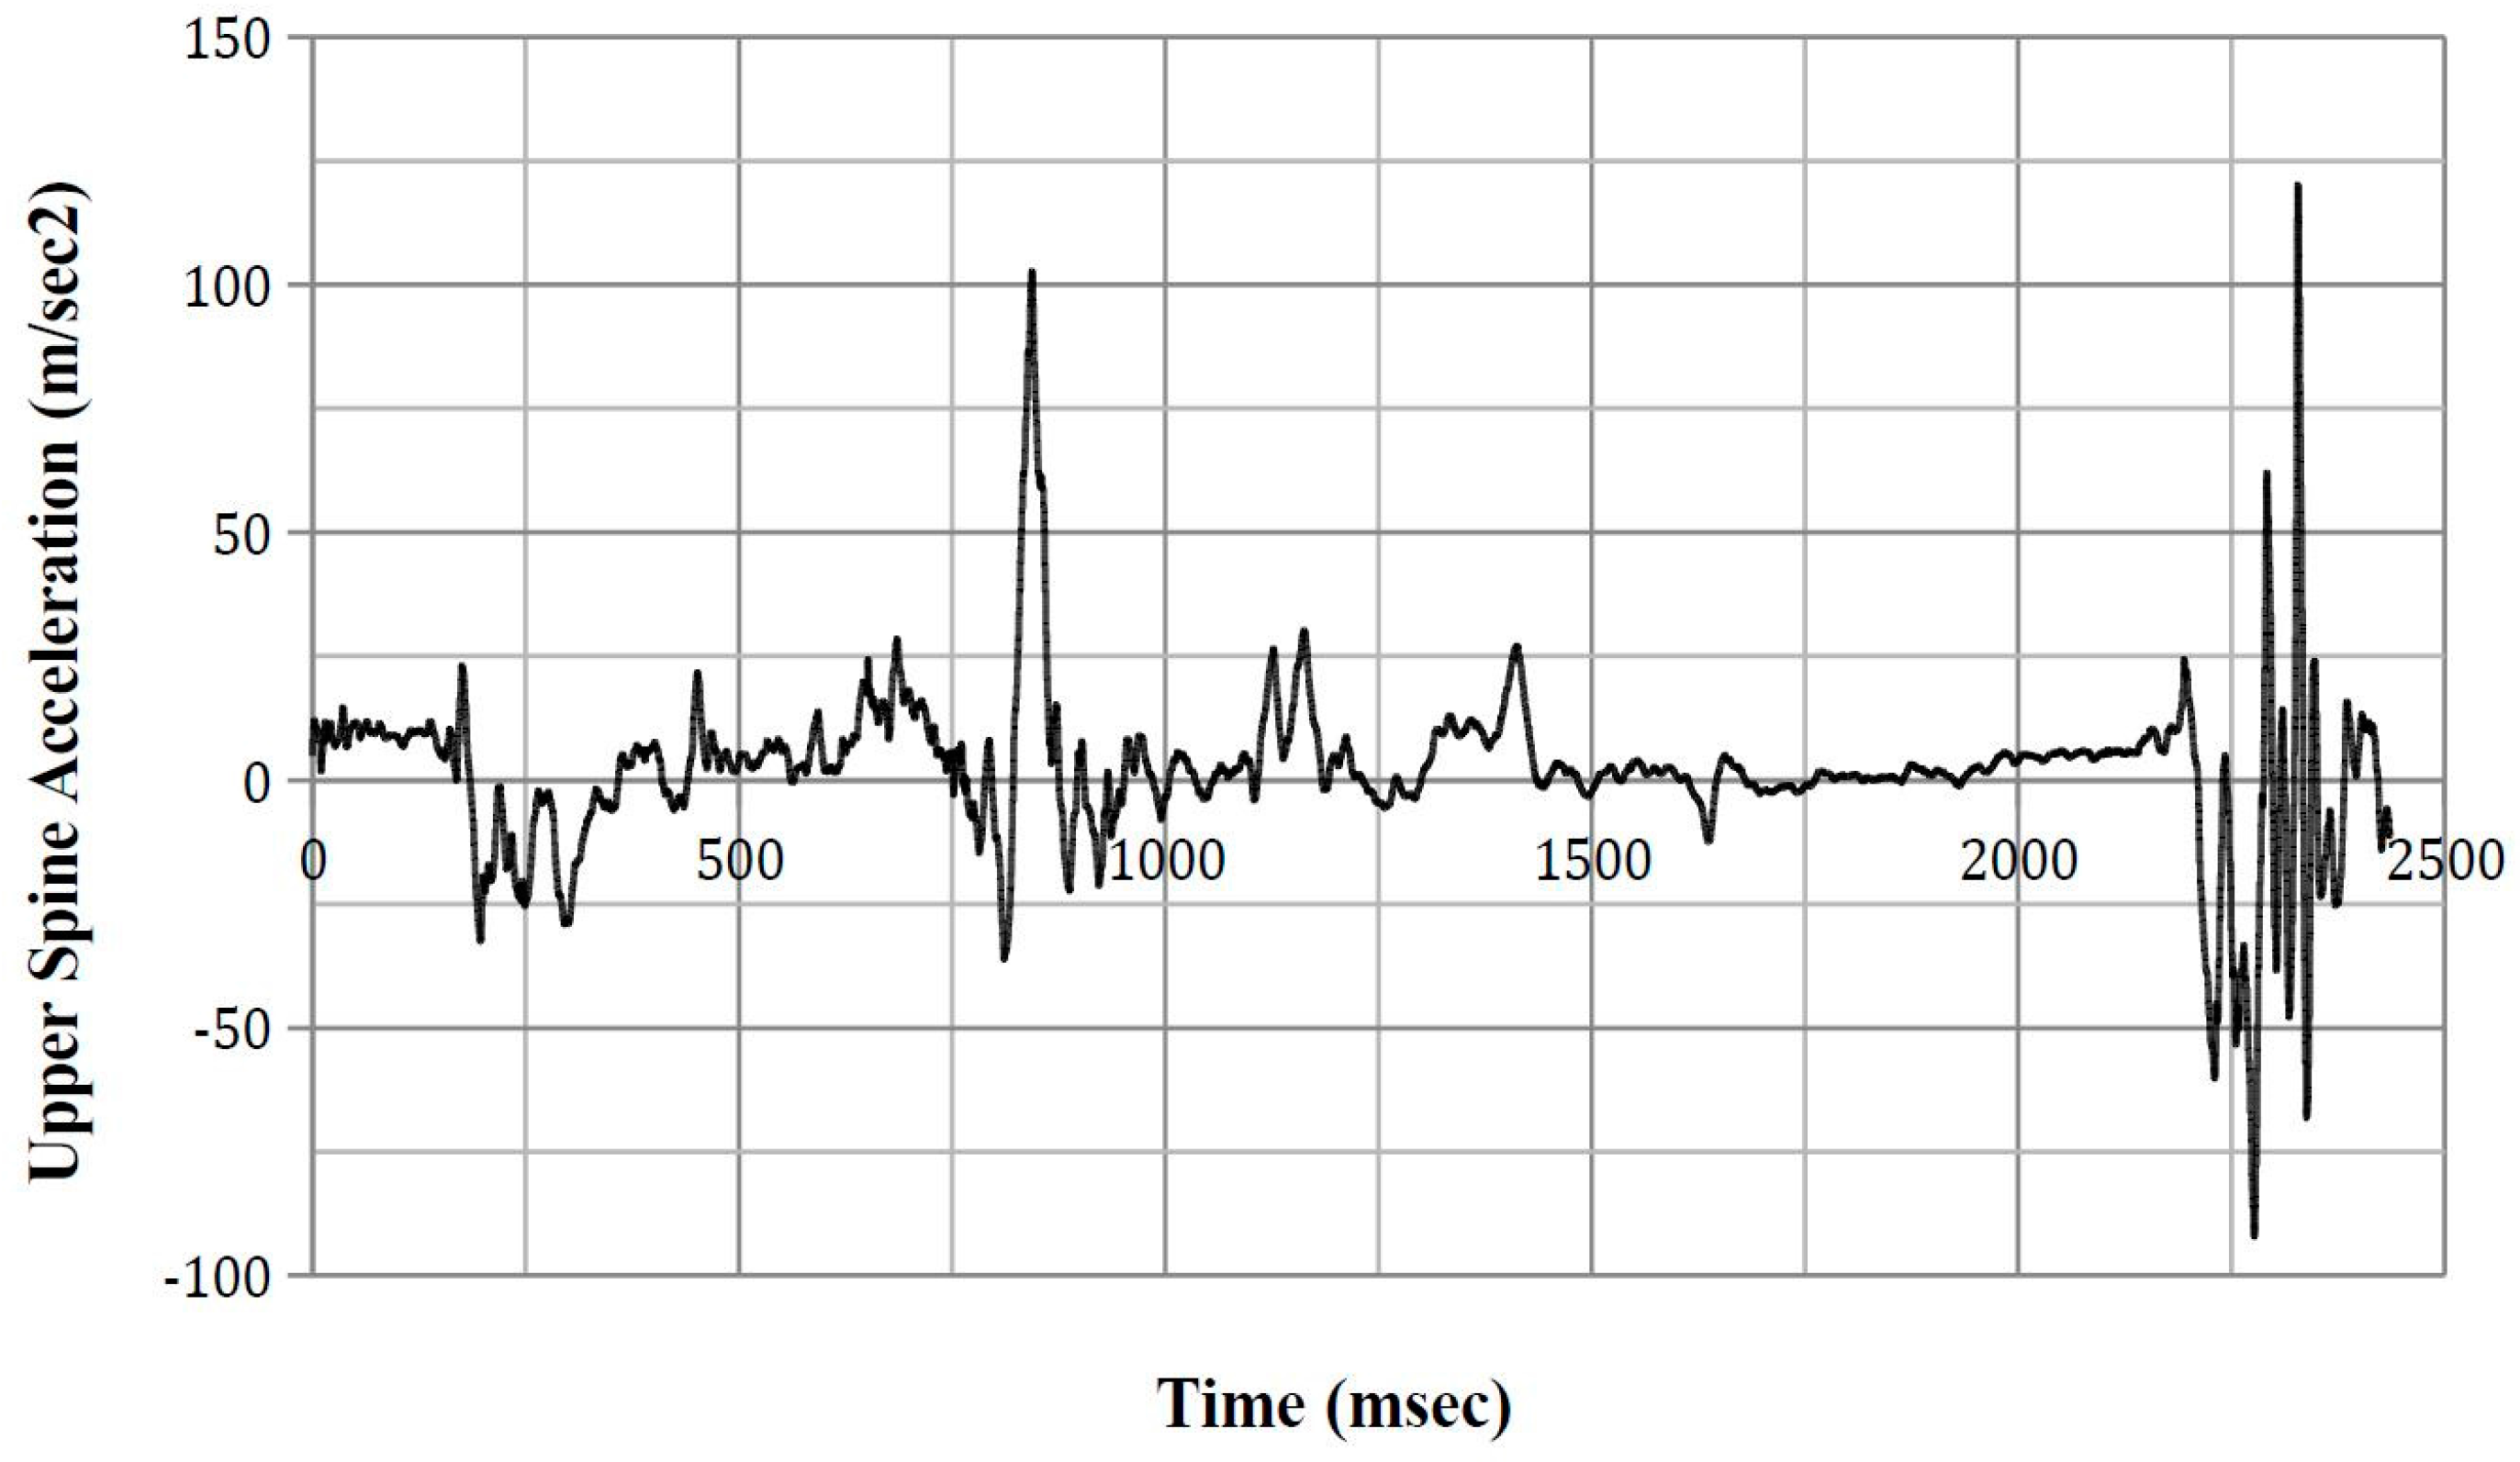
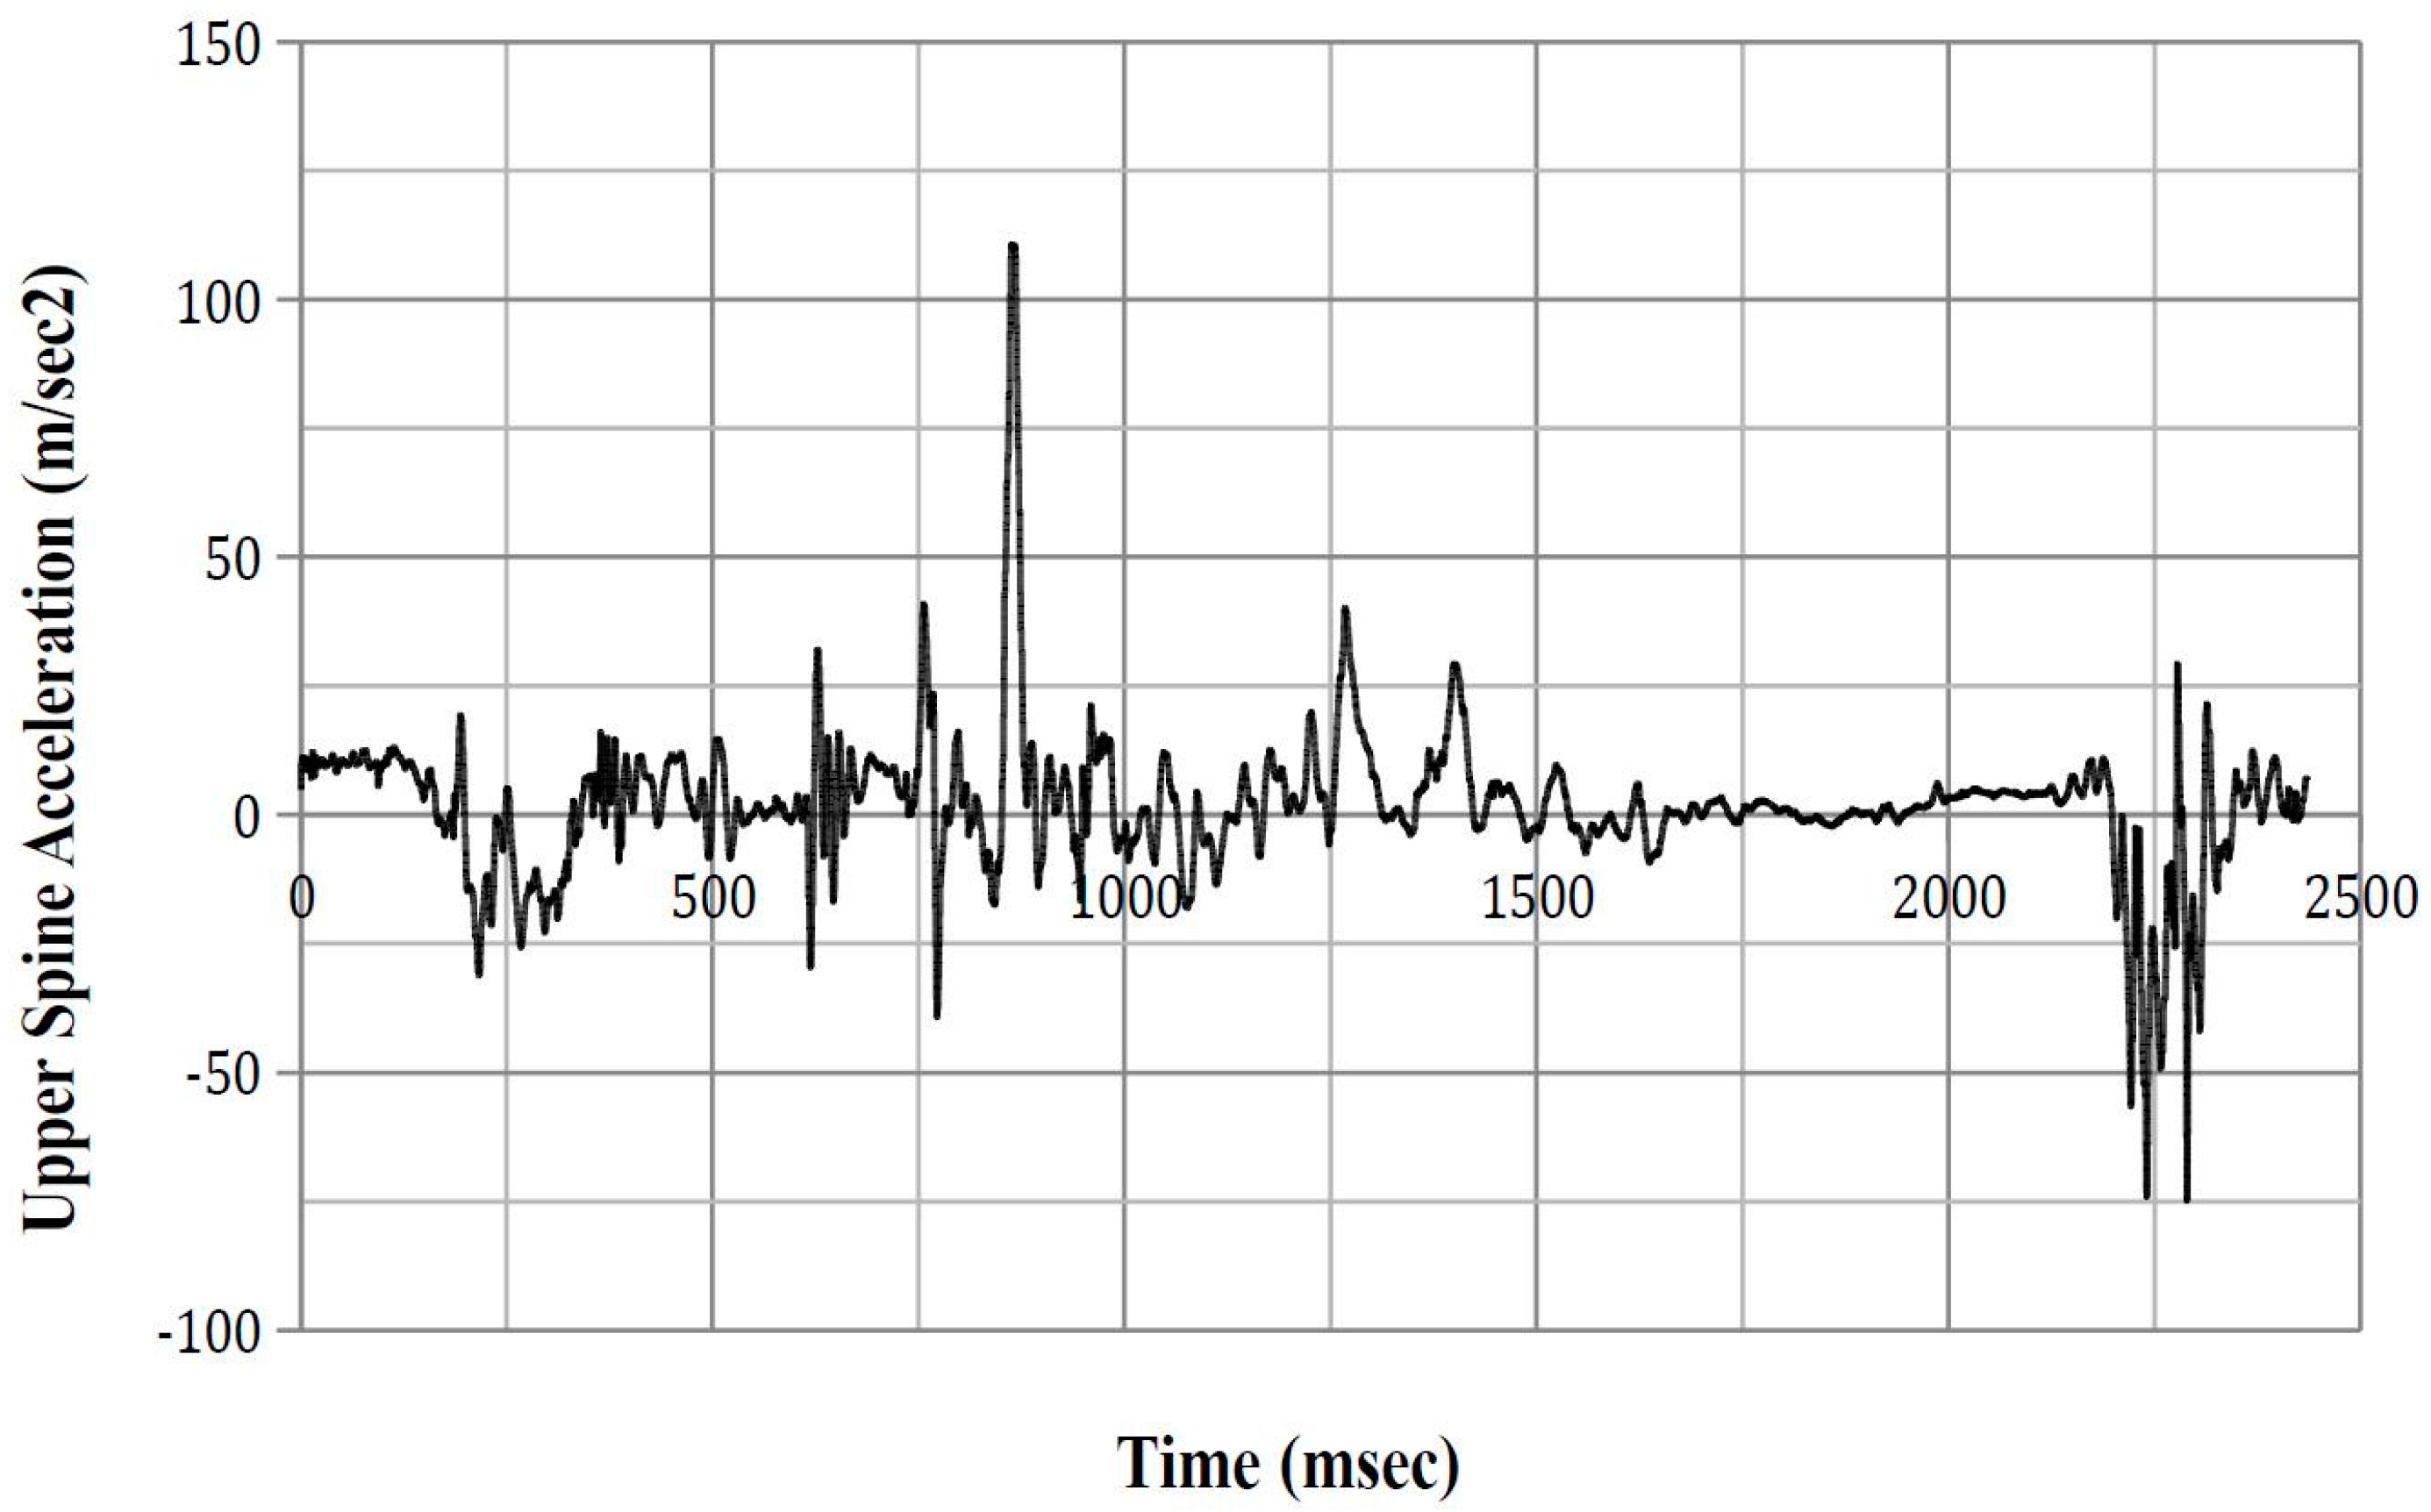
Appendix D
Upper spinal acceleration time-history plots.
Figure A10.
ATD Position 1 upper spine acceleration.

Figure A11.
ATD Position 2 upper spine acceleration.

Figure A12.
ATD Position 5 upper spine acceleration.

Figure A13.
ATD Position 8 upper spine acceleration.

Appendix E
Lower spinal acceleration time-history plots.
Figure A14.
ATD Position 1 lower spine acceleration.

Figure A15.
ATD Position 2 lower spine acceleration.

Figure A16.
ATD Position 5 lower spine acceleration.

Figure A17.
ATD Position 8 lower spine acceleration.

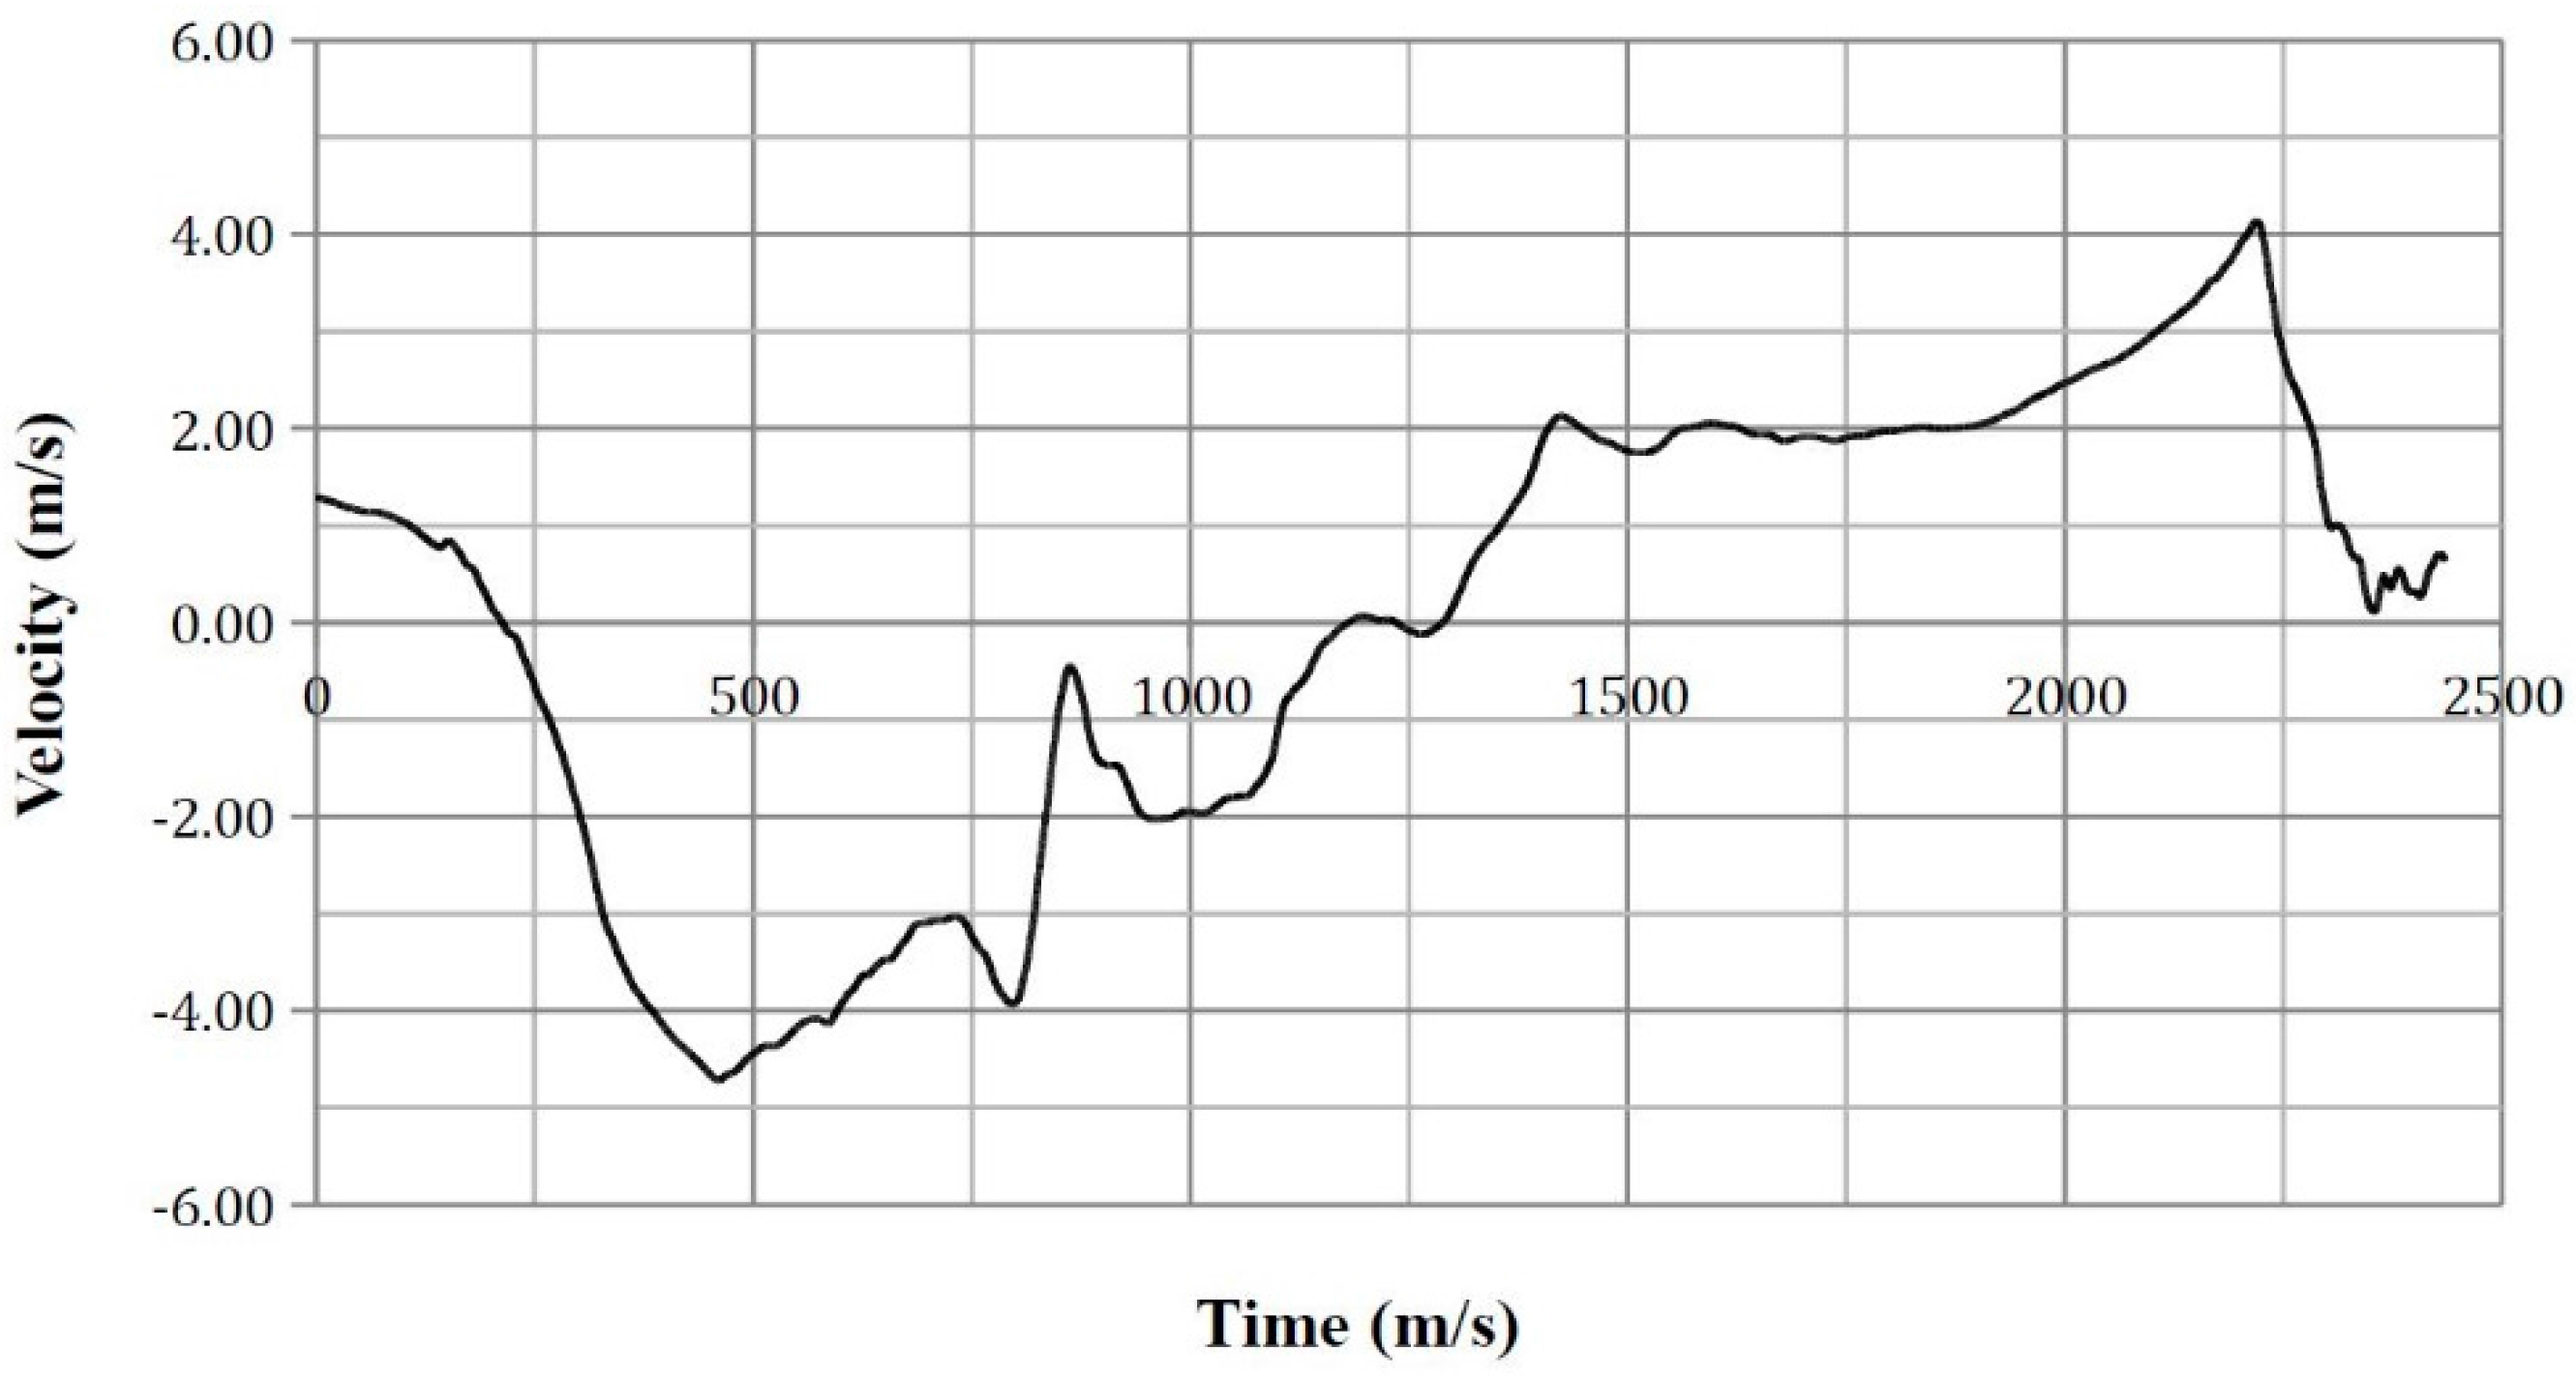
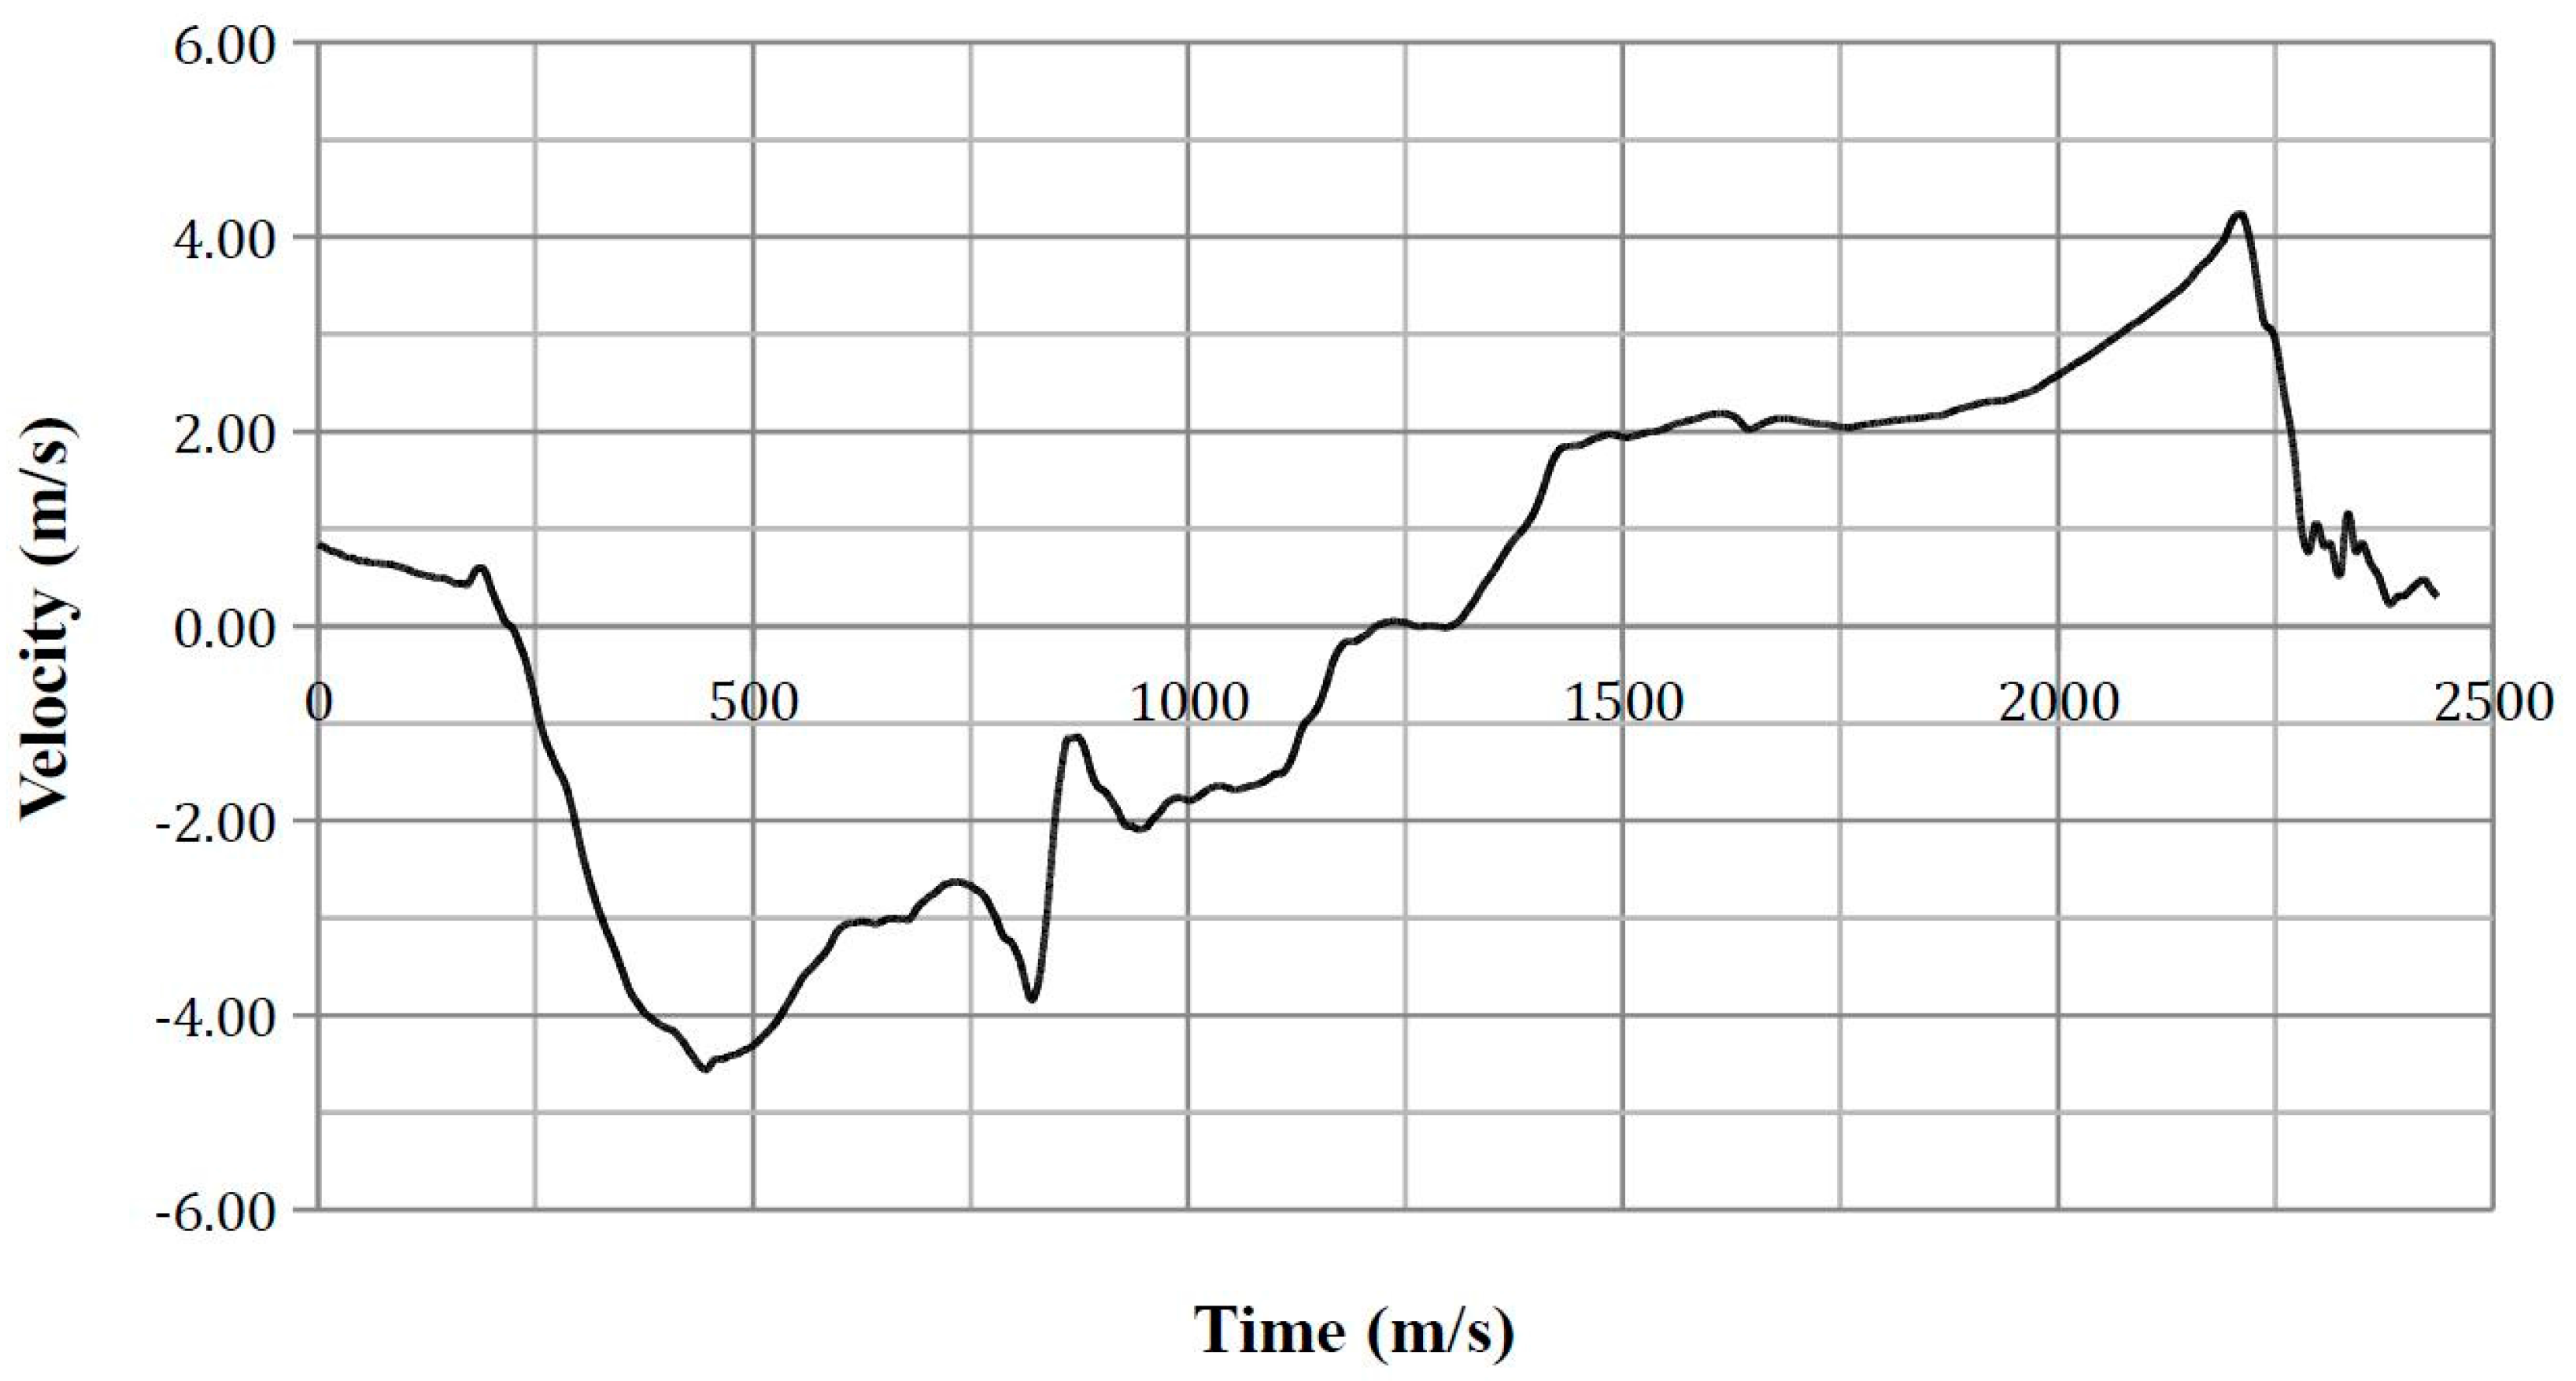
Appendix F
Y-axis velocity plots used in calculating ASA-10.
Figure A18.
ATD Position 1 lower spine y-axis velocity.

Figure A19.
ATD Position 2 lower spine y-axis velocity.

Figure A20.
ATD Position 5 lower spine y-axis velocity.

Figure A21.
ATD Position 8 lower spine y-axis velocity.

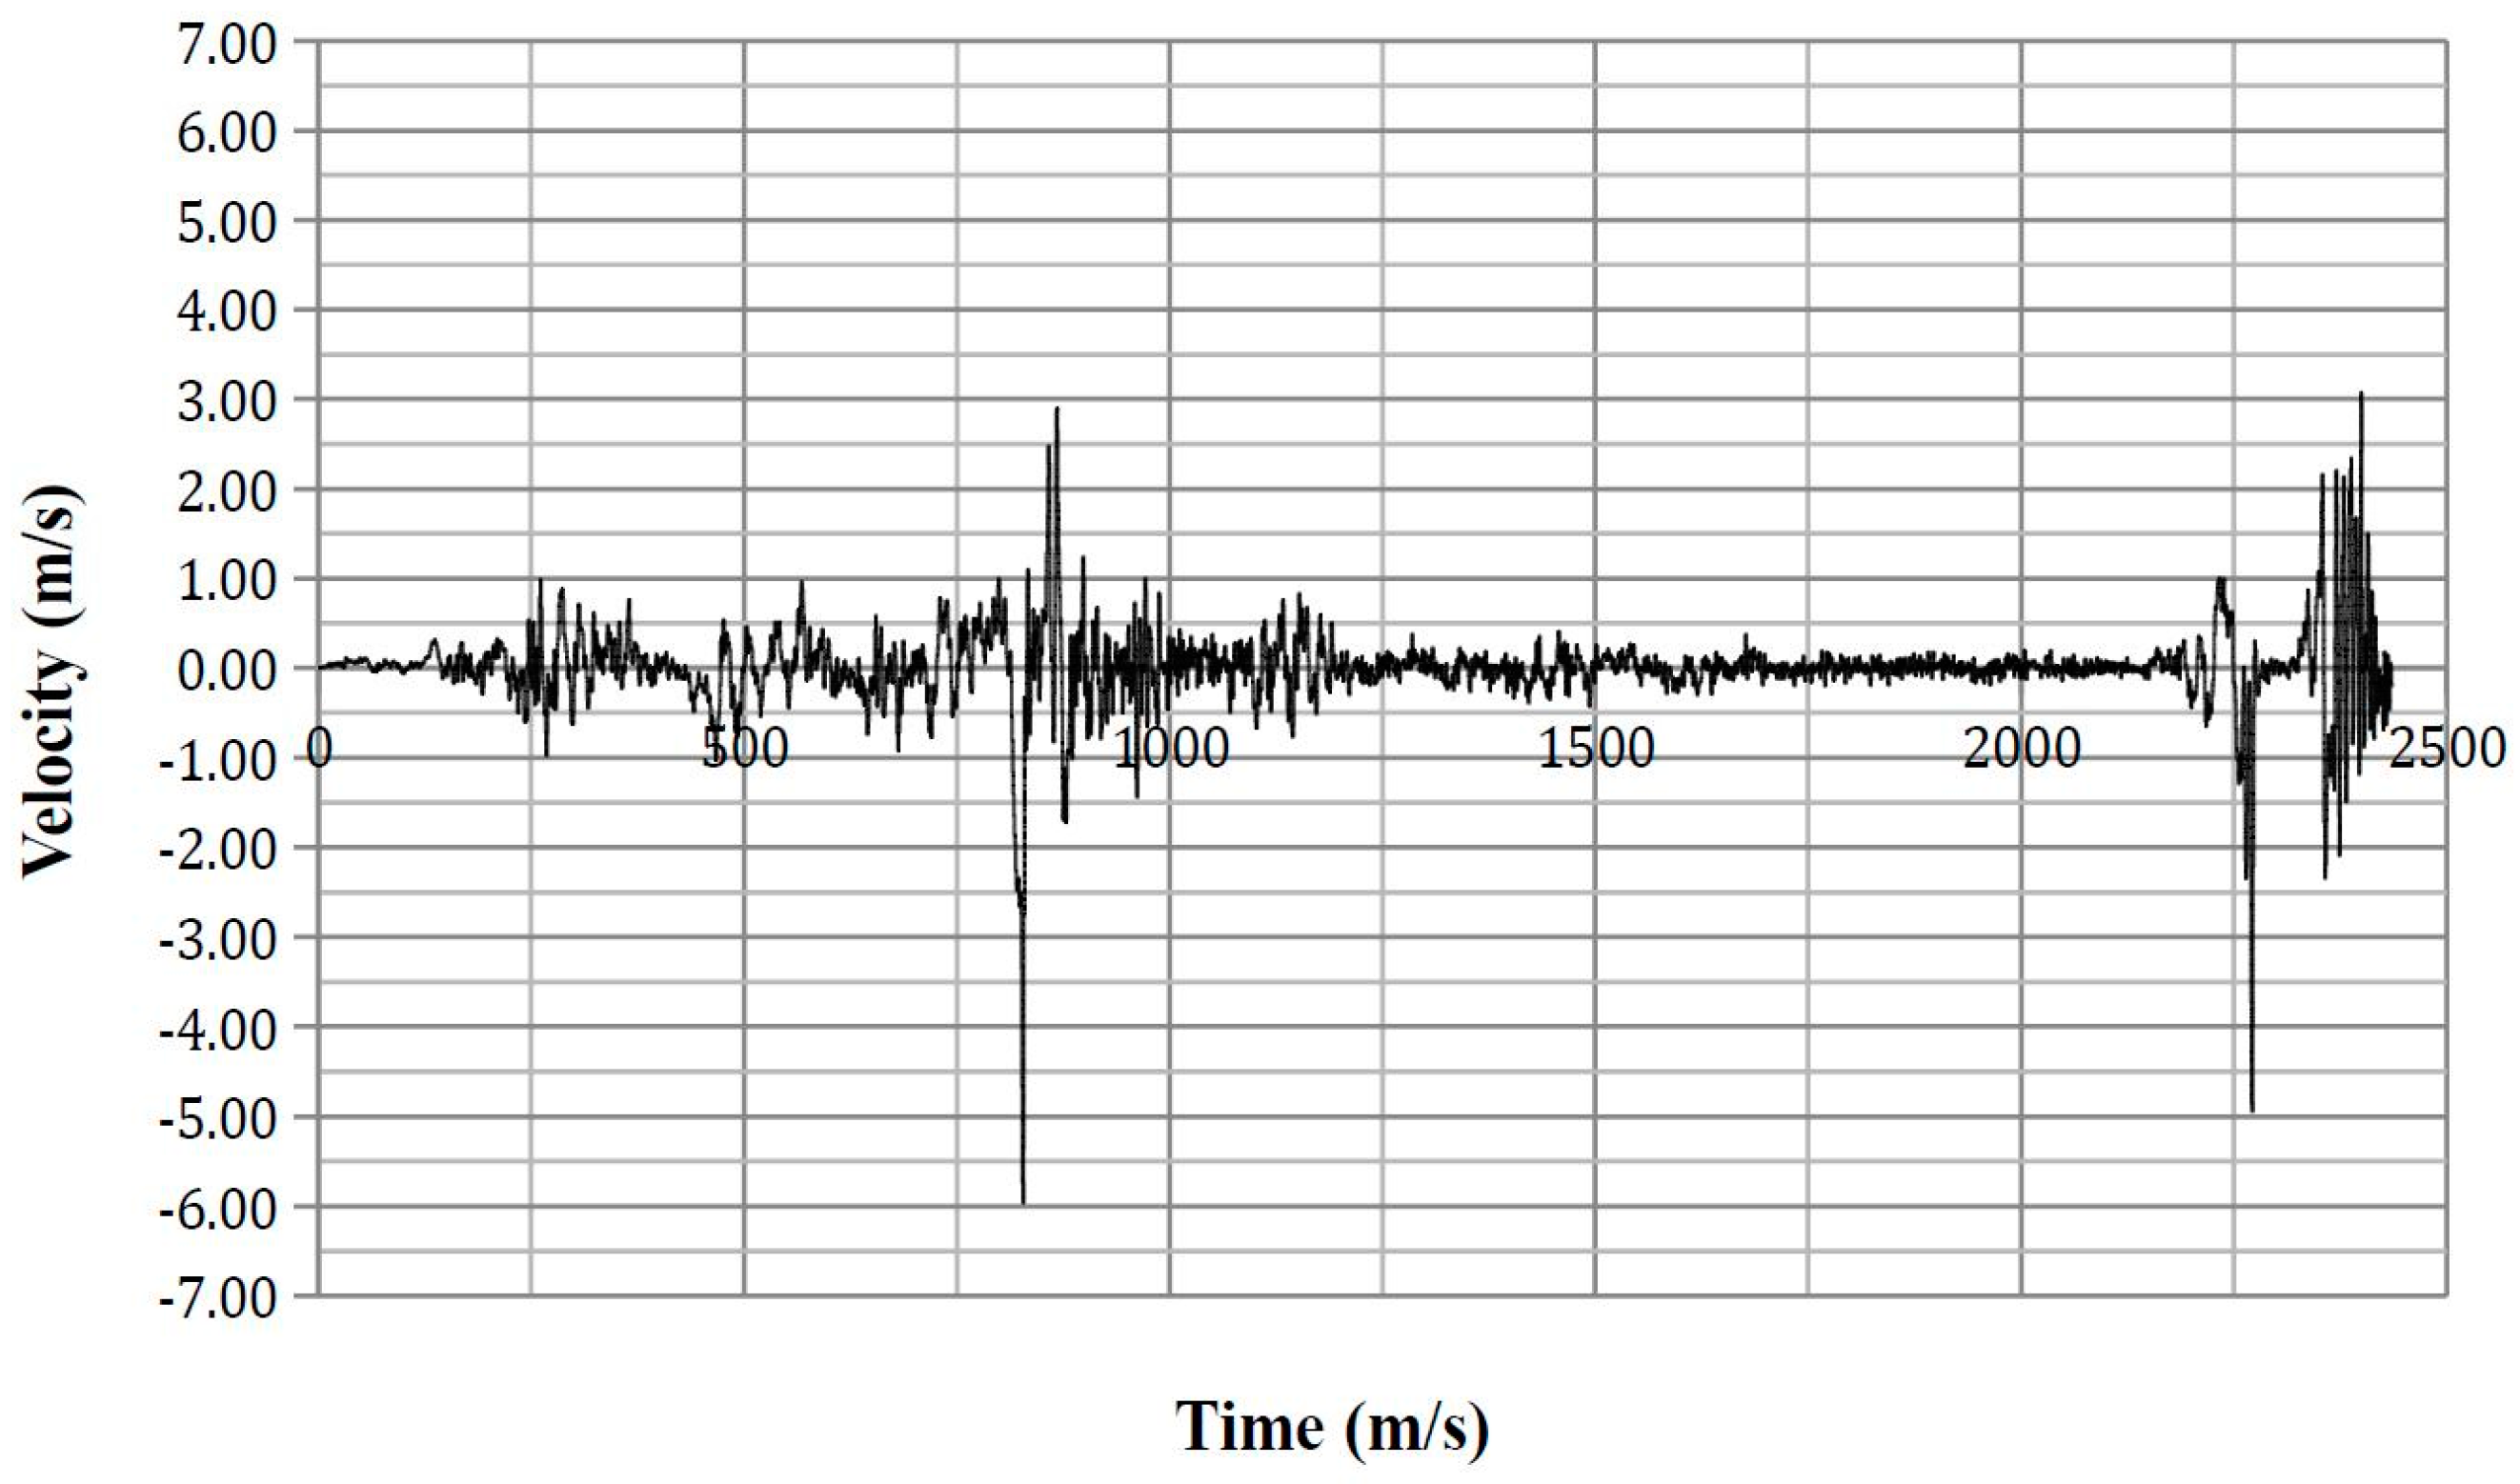
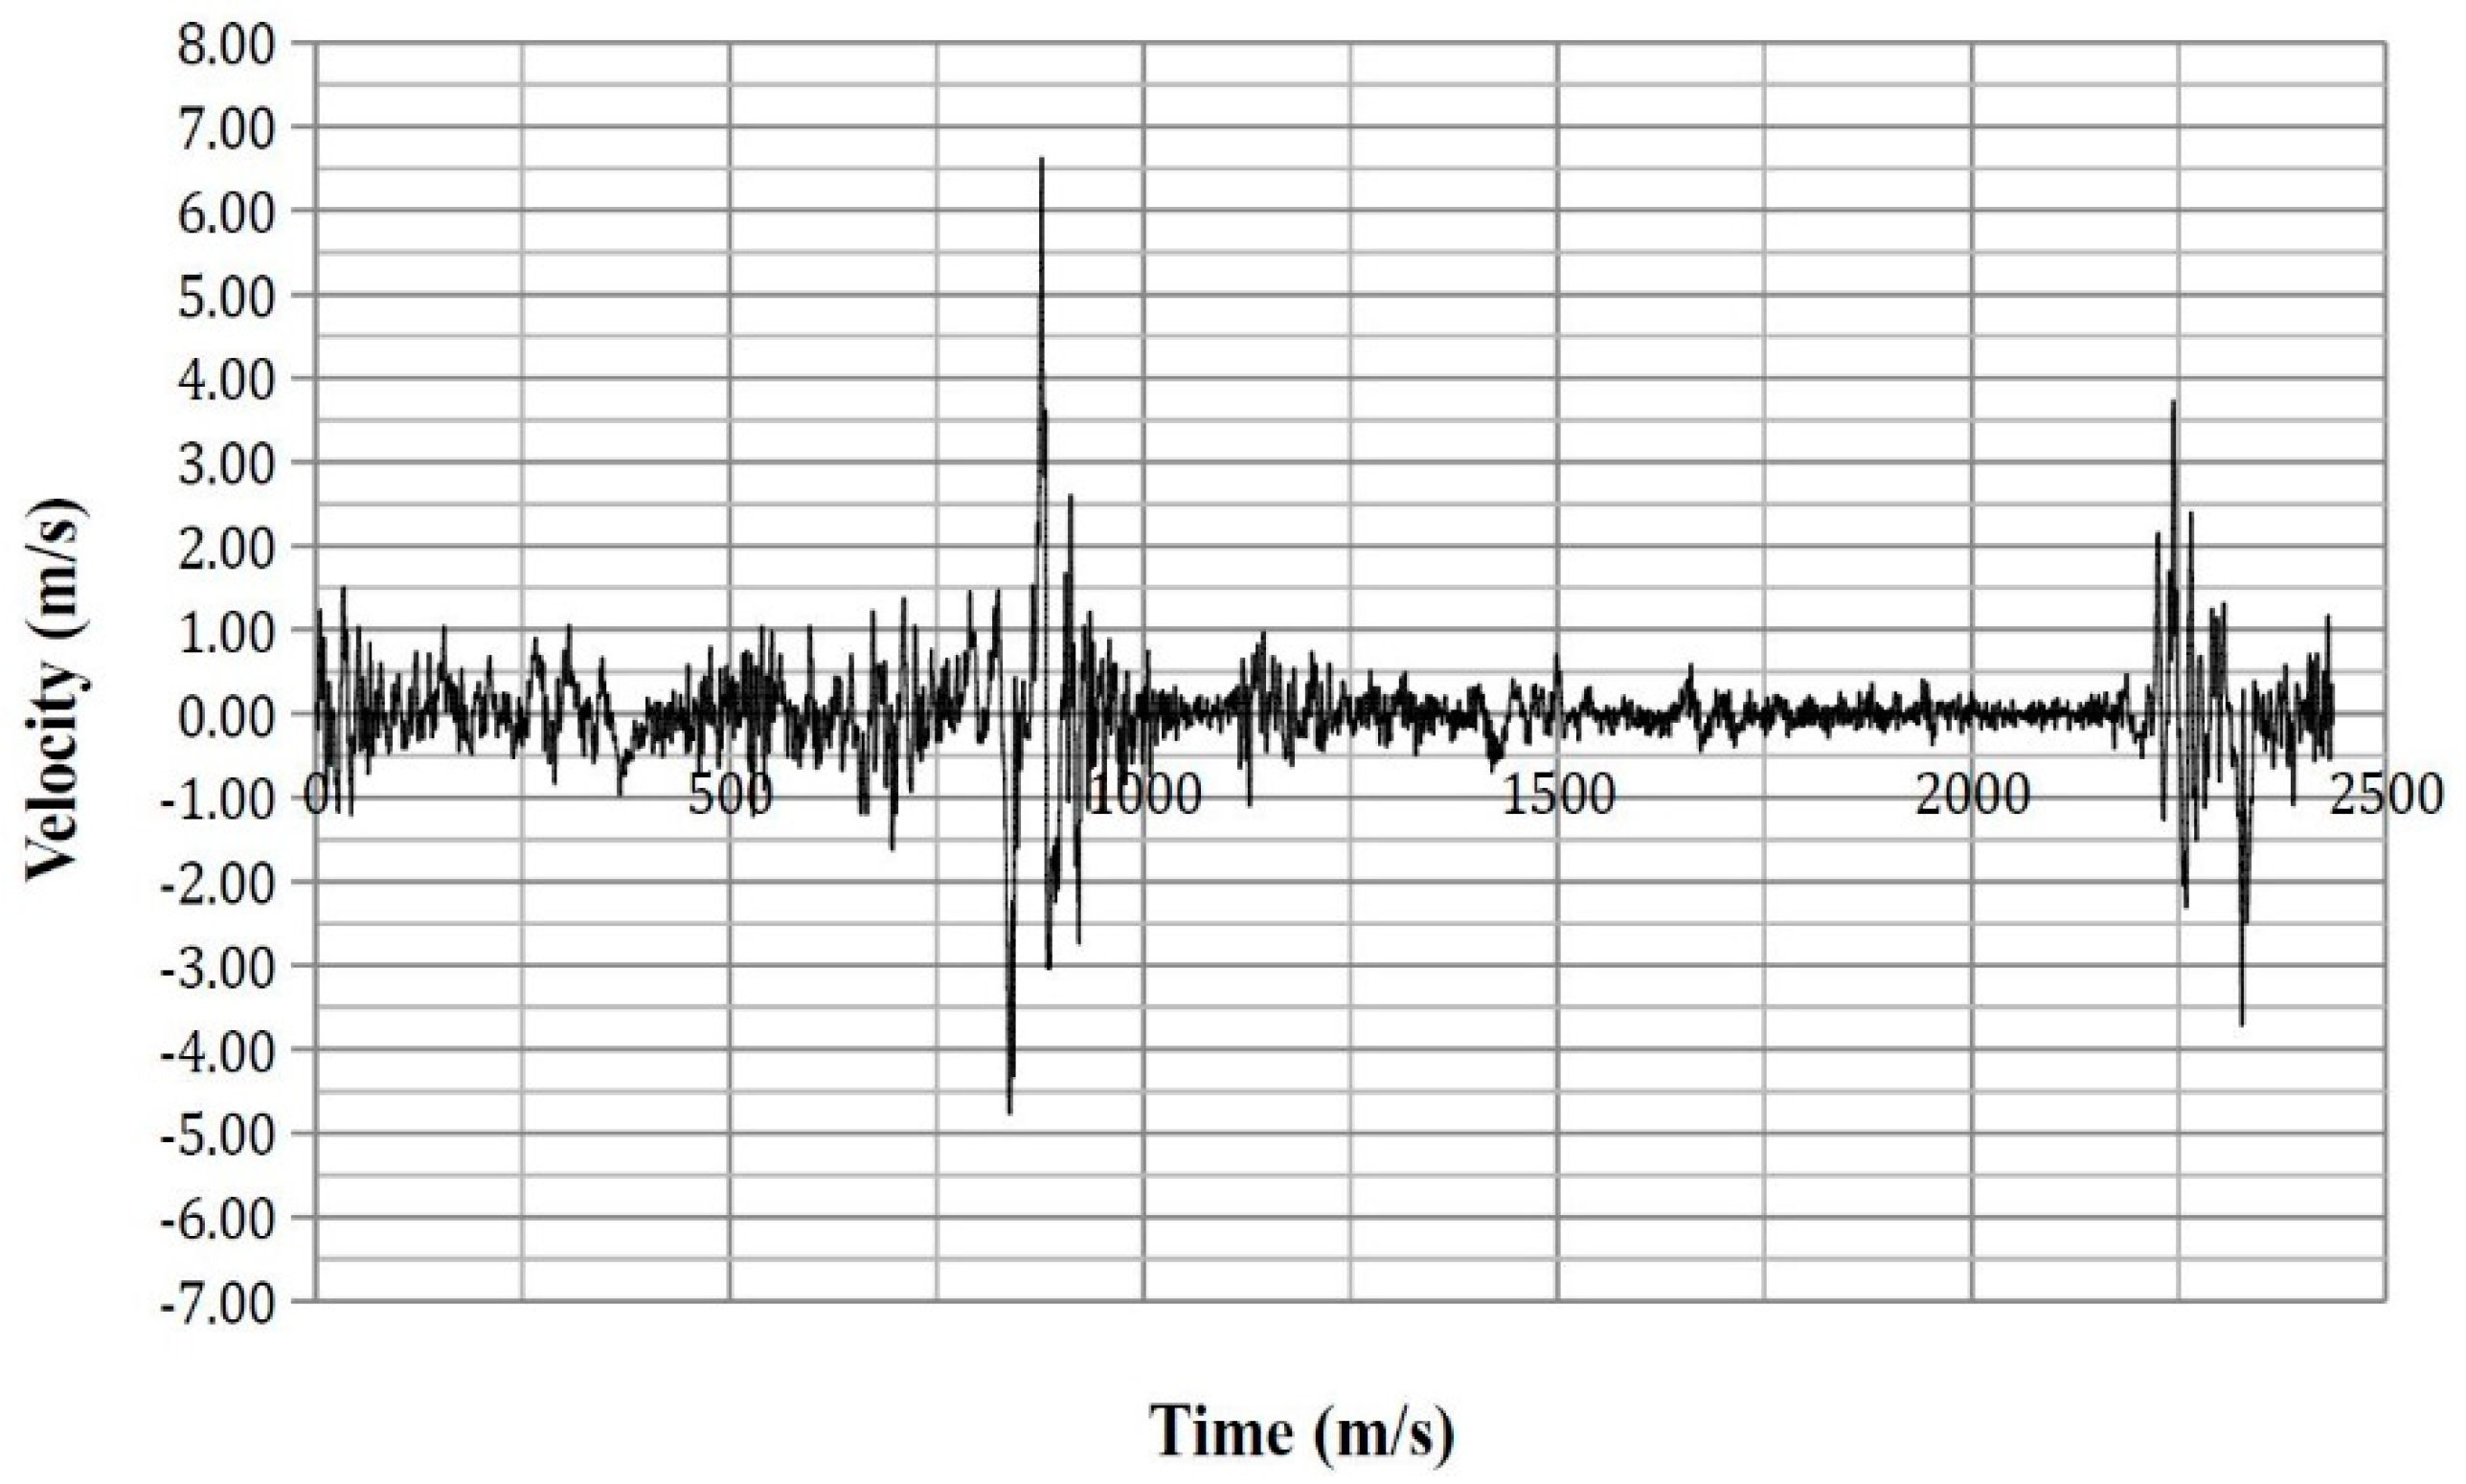
Appendix G
Lateral thoracic impact velocity time-history plots.
Figure A22.
ATD Position 1 y-axis velocity for Node 380839.

Figure A23.
ATD Position 2 y-axis velocity for Node 380823.

Figure A24.
ATD Position 5 y-axis velocity for Node 380870.

Figure A25.
ATD Position 8 y-axis velocity for Node 381218.

Appendix H
Maximum thoracic force time-history plots.
Figure A26.
ATD Position 1 thorax resultant force.

Figure A27.
ATD Position 2 thorax resultant force.

Figure A28.
ATD Position 5 thorax resultant force.

Figure A29.
ATD Position 8 thorax resultant force.

Appendix I
Seatbelt axial force for lap belt and sash time-history plots.
Figure A30.
ATD Position 1 lap belt axial force.

Figure A31.
ATD Position 1 sash belt axial force.

Figure A32.
ATD Position 2 lap belt axial force.

Figure A33.
ATD Position 2 sash belt axial force.

Figure A34.
ATD Position 5 lap belt axial force.

Figure A35.
ATD Position 5 sash belt axial force.

Figure A36.
ATD Position 8 lap belt axial force.

Figure A37.
ATD Position 8 sash belt axial force.

References
- Bedewi, P.G.; Godrick, D.A.; Digges, K.; Bahouth, G.T. An Investigation of Occupant Injury in Rollovers: NASS-CDS Analysis of Injury Severity and Source by Rollover Attributes. In Proceedings of the 18th International Technical Conference on the Enhanced Safety of Vehicles, Nagoya, Japan, 19–22 May 2003. [Google Scholar]
- National Highway Traffic Safety Administration (NHTSA). Traffic Safety Facts 2012; US Department of Transportation: Washington, DC, USA, 2012.
- Parenteau, C.; Gopal, M.; Viano, D. Near- and far-side adult front passenger kinematics in a vehicle rollover. In Proceedings of the 45th Stapp Car Crash Conference, San Antonio, TX, USA, 15–17 November 2001. [Google Scholar]
- Conroy, C.; Hoyt, D.B.; Eastman, B.A.; Erwin, S.; Pacyna, S.; Holbrook, T.L.; Vaughan, T.; Sise, M.; Kennedy, F.; Velky, T. Rollover crashes: Predicting serious injury based on occupant, vehicle and crash characteristics. Accid. Anal. Prev. 2006, 38, 835–842. [Google Scholar] [CrossRef] [PubMed]
- Ridella, S.; Eigen, A.M.; Kerrigan, J.; Crandall, J. An analysis of injury type and distribution of belted, non-ejected occupants involved in rollover crashes. In Proceedings of the SAE Government and Industry Meeting, Washington, DC, USA, 26–29 January 2010. [Google Scholar]
- Mattos, G.; Mongiardini, M.; Grzebieta, R.; McIntosh, A. Reconstruction of rollovers resulting in serious head injury. In Proceedings of the International Crashworthiness Conference, Kuching, Malaysia, 25–28 August 2014. [Google Scholar]
- NHTSA. An Analysis of Motor Vehicle Rollover Crashes and Injury Outcomes; US Department of Transportation: Washington, DC, USA, 2007; p. 88.
- Bambach, M.R.; Grzebieta, R.H.; McIntosh, A.S. Thoracic injuries to contained and restrained occupants in single-vehicle pure rollover crashes. Accid. Anal. Prev. 2013, 50, 115–121. [Google Scholar] [CrossRef] [PubMed]
- Tahan, F.; Digges, K.; Kan, C.-D.; Grzebieta, R.; Bambach, M. Potential thoracic injuries in a rollover crash reproduction. In Proceedings of the International Crashworthiness Conference, Kuching, Malaysia, 25–28 August 2014. [Google Scholar]
- SAS Institute. SAS Enterprise Guide, version 5.1; SAS Institute: Cary, NC, USA.
- Tan, T.; Grzebieta, R.; Bambach, M.; Olivier, J.; McIntosh, A. A case-control study of vehicle panel damage and thoracic injury in rollover crashes. Int. J. Crashworthiness 2016, 21, 366–381. [Google Scholar] [CrossRef]
- Datentechnik, S. PC-CRASH Operating Manual Version 9.1; MEA Forensic: Linz, Austria, 2011. [Google Scholar]
- Warner, M.H.; Warner, C.Y.; Crosby, C.L. Roadway Asphalt Damage Force Analysis fAccident Reconstruction; SAE International: Warrendale, PA, USA, 2008. [Google Scholar]
- Luepke, P.A.; Carter, J.W.; Henry, K.C.; Germane, G.J.; Smith, J.W. Rollover crash tests on dirt: An examination of rollover dynamics. SAE Int. J. Passeng. Cars-Mech. Syst. 2008, 1, 18–30. [Google Scholar] [CrossRef]
- Altman, S.; Santistevan, D.; Hitchings, C.; Wallingford, J.G.; Greenlees, B. A Comparison of Rollover Characteristics for Passenger Cars, Light Duty Trucks and Sport Utility Vehicles; SAE International: Warrendale, PA, USA, 2002. [Google Scholar]
- Eger, R.; Kiencke, U. Modelling of rollover sequence. Control Eng. Pract. 2003, 11, 209–216. [Google Scholar] [CrossRef]
- Cooperrider, N.K.; Hammoud, S.A.; Colwell, J. Characteristics of Soil-Tripped Rollovers; SAE International: Warrendale, PA, USA, 1998. [Google Scholar]
- Jones, I.S.; Wilson, L.A. Techniques for the Reconstruction of Rollover Accidents Involving Sport Utility Vehicles, Light Trucks and Minivans; SAE International: Warrendale, PA, USA, 2000. [Google Scholar]
- Steffan, H.; Moser, A. How to Use PC-CRASH to Simulate Rollover Crashes; SAE Technical Paper: Warrendale, PA, USA, 2004. [Google Scholar]
- American Association of State Highway and Transportation Officials. Roadside Design Guide, 4th ed.; AASHTO: Washington, WA, USA, 2011. [Google Scholar]
- Bixel, R.A.; Heydinger, G.J.; Guenther, D.A. Measured Vehicle Center-of-Gravity Locations—Including NHTSA’s Data Through 2008 NCAP; SAE International: Warrendale, PA, USA, 2010. [Google Scholar]
- Heydinger, G.J.; Bixel, R.A.; Garrott, W.R.; Pyne, M.; Howe, J.G.; Guenther, D.A. Measured Vehicle Inertial Parameters-Nhtsa’s Data Through November 1998; SAE International: Warrendale, PA, USA, 1999. [Google Scholar]
- Fukushima, T.; Shitamichi, M.; Torigaki, T.; Sokusai, H.; Nishi, M.; Miyachi, T. Parameter identification of sled test method to simulate vehicle soil trip rollover dynamic accurately by numerical simulation considering soil-vehicle interaction. SAE Int. J. Trans. Saf. 2013, 1, 334–351. [Google Scholar] [CrossRef]
- Kiefer, A.; Bilek, D.; Moser, A.; Webb, A. A Comparison Study between Pc-Crash Simulation and Instrumented Handling Maneuvers; SAE International: Warrendale, PA, USA, 2011. [Google Scholar]
- Arndt, M.W.; Arndt, S.M.; Stevens, D. Drag factors from rollover crash testing for crash reconstructions. In Proceedings of the ASME 2011 International Mechanical Engineering Congress and Exposition, Denver, CO, USA, 11–17 November 2011; American Society of Mechanical Engineers: New York, NY, USA; pp. 77–90. [Google Scholar]
- Kim, T.; Bollapragada, V.; Kerrigan, J.; Crandall, J.; Clauser, M. Effects of Types of Vehicles and Maneuvers on Vehicle Kinematics during Steering-Induced Soil-Trip Rollovers. In Proceedings of the 23rd International Technical Conference on the Enhanced Safety of Vehicles (ESV), Seoul, Korea, 27–30 May 2013. [Google Scholar]
- Carr, L.; Liebbe, R.; Crimeni, J.; Johnston, M. Motor Vehicle Driver Characteristics—Crash Avoidance Behavior; SAE International: Warrendale, PA, USA, 2007. [Google Scholar]
- Orlowski, K.; Moffatt, E.; Bundorf, R.; Holcomb, M. Reconstruction of Rollover Collisions; SAE Technical Paper: Warrendale, PA, USA, 1989. [Google Scholar]
- Warner, C.Y.; Smith, G.C.; James, M.B.; Germane, G.J. Friction Applications in Accident Reconstruction; SAE Technical Paper: Warrendale, PA, USA, 1983. [Google Scholar]
- NCAC, G.W.U. Ford explorer detailed model. 2007. [Google Scholar]
- Tahan, F.; Yan, L.; Digges, K. Sensitivity study of jordan rollover system and unconstrained model: Sensitivity at varying test bed mass and yaw angles. Trans. Res. Rec. J. Trans. Res. Board 2012, 59–68. [Google Scholar] [CrossRef]
- SAE. J211-1 Instrumentation for Impact Test; Society of Automotive Engineers: Warrendale, PA, USA, 2014. [Google Scholar]
- Asay, A.; Woolley, R. Rollover Testing of Sport Utility Vehicles (SUVs) on an Actual Highway; Society of Automotive Engineers, SAE: Warrendale, PA, USA, 2010. [Google Scholar] [CrossRef]
- Yoganandan, N.; Humm, J.R.; Pintar, F.A.; Brasel, K.H.; Rudd, R.W.; Ridella, S.A. Thoraco-abdominal deflection responses of post mortem human surrogates in side impacts. Stapp Car Crash J. 2012, 56, 49. [Google Scholar] [PubMed]
- NHTSA. Anthropomorphic test devices: ES-2re side impact crash test dummy. Fed. Regist. 2004, 69, 55550–55571. [Google Scholar]
- Wismans, J.; Bermond, F.; Gertosio, G.; Kreuzinger, T.; Roberts, A.; Ratingen, M.; Svensson, M.Y.; Bortenschlager, K.; Öhrn, H.; Page, M. Technical Note on the EuroSID-2 with Rib Extensions (ES-2re); European Enhanced Vehicle-Safety Committee (EEVC): Brussels, Belgium, 2006. [Google Scholar]
- Yoganandan, N.; Humm, J.R.; Pintar, F.A.; Brasel, K. Region-specific deflection responses of WorldSID and ES2-re devices in pure lateral and oblique side impacts. Stapp Car Crash J. 2011, 55, 351. [Google Scholar] [PubMed]
- Yoganandan, N.; Pintar, F.A. Response of side impact dummies in sled tests. Accid. Anal. Prev. 2005, 495–503. [Google Scholar] [CrossRef] [PubMed]
- Kuppa, S. Injury Criteria for Side Impact Dummies; National Transportation Biomechanics Research Centre, National Highway Traffic Safety Administration: Washington, WA, USA, 2004.
- LSTC. EuroSID-2re 50th percentile with rib extensions. 2015. [Google Scholar]
- Zhang, Q.; Lessley, D.J.; Riley, P.; Toczyski, J.; Lockerby, J.; Foltz, P.; Overby, B.; Seppi, J.; Crandall, J.R.; Kerrigan, J.R. Occupant kinematics in laboratory rollover tests: ATD response and biofidelity. Stapp Car Crash J. 2014, 58, 317. [Google Scholar] [PubMed]
- Toczyski, J.; Zhang, Q.; Foltz, P.; Overby, B.; Bolton, J.; White, J.; Moors, J.; Cochran, J.; Roberts, C.; Crandall, J. Dynamic validation of rollover buck roof structure. In Proceedings of the 24th International Technical Conference on the Enhanced Safety of Vehicles (ESV), Gothenburg, Sweden, 8–11 June 2015. [Google Scholar]
- Lessley, D.J.; Riley, P.; Zhang, Q.; Foltz, P.; Overby, B.; Heltzel, S.; Sochor, M.; Crandall, J.; Kerrigan, J.R. Occupant kinematics in laboratory rollover tests: PMHS response. Stapp Car Crash J. 2014, 58, 251. [Google Scholar] [PubMed]
- NHTSA. Laboratory Test Procedure for FMVSS 209—Seat Belt Assemblies; US Department of Transportation: Washington, DC, USA, 2007.
- Eisentraut, D.K.; Muzzy, W.H.; Cantor, A.; D’Aulerio, L.A.; Whitman, G.R.; Brown, K.A.; Markushewski, M.L. Assessment of Timely Retractor Lockup in Automotive Seat Belt Systems; SAE International: Warrendale, PA, USA, 1997. [Google Scholar]
- Rains, G.C.; Kanianthra, J.N. Determination of the Significance of Roof Crush on Head and Neck Injury to Passenger Vehicle Occupants in Rollover Crashes; SAE International: Warrendale, PA, USA, 1995. [Google Scholar]
- Meyer, S.E.; Hock, D.; Forrest, S.; Herbst, B.; Sances, A., Jr.; Kumaresan, S. Motor vehicle seat belt restraint system analysis during rollover. Biomed. Sci. Instrum. 2002, 39, 229–240. [Google Scholar]
- Cavanaugh, J.M.; Zhu, Y.; Huang, Y.; King, A.I. Injury and Response of the Thorax in Side Impact Cadaveric Tests; SAE Technical Paper: Warrendale, PA, USA, 1993; pp. 199–221. [Google Scholar]
- Tan, T.; Grzebieta, R.; McIntosh, A. Review of flail-space’s lateral impact velocity criterion for thoracic impacts. J. Trans. Saf. Secur. 2016, 9, 239–258. [Google Scholar] [CrossRef]
- Beusenberg, M.; Keown, M.; Yoganandan, N. Improved thorax behaviour of the EuroSID and effects on thorax injury assessment on the basis of pendumum impacts. In Proceedings of the International Technical Conference on the Enhanced Safety of Vehicles, Amsterdam, The Netherlands, 4–7 June 2001. [Google Scholar]
- Robbins, D.H.; Lehman, R.J.; Augustyn, K. Prediction of thoracic injuries as a function of occupant kinematics. In Proceedings of the 7th International Technical Conference on the Enhanced Safety of Vehicles, Paris, France, 5–8 June 1979; pp. 374–383. [Google Scholar]
- Viano, D.C. Biomechanical responses and injuries in blunt lateral impact. In Proceedings of the 33 Stapp Car Crash Conference, Washington, DC, USA, 4–6 October 1989; pp. 113–142. [Google Scholar]
- Schmitt, K.-U.; Niederer, P.F.; Muser, M.H.; Walz, F. Trauma Biomechanics: Introduction to Accidental Injury, 2nd ed.; Springer: Leipzig, Germany, 2004; p. 210. [Google Scholar]
- Tarriere, C.; Walfische, G.; Fayon, A.; Got, C.; Patel, A.; Delmas, A. Synthesis of human tolerances obtained from lateral impact simulations. In Proceedings of the 7th International ESV Conference, Paris, France, 5 June 1979; pp. 359–373. [Google Scholar]
- Viano, D.C.; Lau, I.V.; Andrzejak, D.V. Biomechanics of injury in lateral impacts. Accid. Anal. Prev. 1989, 21, 535–551. [Google Scholar] [CrossRef]
- Bidez, M.W.; Cochran, J.E., Jr.; King, D.; Burke, D.S. Occupant dynamics in rollover crashes: Influence of roof deformation and seat belt performance on probable spinal column injury. Ann. Biomed. Eng. 2007, 35, 1973–1988. [Google Scholar] [CrossRef] [PubMed]
- Yoganandan, N.; Nahum, A.M.; Melvin, J.W. Accidental Injury: Biomechanics and Prevention; Springer: New York, NY, USA, 2014. [Google Scholar]
- Yoganandan, N.; Pintar, F.; Humm, J.; Rudd, R. Injuries in full-scale vehicle side impact moving deformable barrier and pole tests using postmortem human subjects. Traffic Inj. Prev. 2015, 16, S224–S230. [Google Scholar] [CrossRef] [PubMed]
- McCoy, R.W.; Chou, C.C. A Study of Kinematics of Occupants Restrained with Seat Belt Systems in Component Rollover Tests; SAE Technical Paper: Warrendale, PA, USA, 2007. [Google Scholar]
- Van Ratingen, M.R. Development and evaluation of the ES-2 side impact dummy. In Proceedings of the International Technical Conference on the Enhanced Safety of Vehicles, Amsterdam, The Netherlands, 4–7 June 2001; National Highway Traffic Safety Administration: Washington, WA, USA. [Google Scholar]
Figure 1.
Overlay of the PC-CRASH the LS-DYNA simulations, and the NASS-CDS scene diagram.

Figure 2.
Anthropomorphic test device (ATD) anterior–posterior recline angles relative to the vertical axis (top) and ATD lateral lean angles relative to the vertical axis (bottom).
Figure 2.
Anthropomorphic test device (ATD) anterior–posterior recline angles relative to the vertical axis (top) and ATD lateral lean angles relative to the vertical axis (bottom).

Figure 3.
Thorax divided into segments for force measurements. Only the top and bottom segments are titled. Segments were numbered sequentially starting from “01” at the top.
Figure 3.
Thorax divided into segments for force measurements. Only the top and bottom segments are titled. Segments were numbered sequentially starting from “01” at the top.

Figure 4.
Finite element (FE) vehicle model during key ground impacts (left) with corresponding vehicle damage (right).
Figure 4.
Finite element (FE) vehicle model during key ground impacts (left) with corresponding vehicle damage (right).

Figure 5.
Roof damage of the FE model (left) and the case vehicle (right).

Figure 6.
Vehicle position at the 2nd and 4th quarter-turn (left) and corresponding ATD posture (right). ATD originally in Position 2 and ATD figures have been righted for clarity.
Figure 6.
Vehicle position at the 2nd and 4th quarter-turn (left) and corresponding ATD posture (right). ATD originally in Position 2 and ATD figures have been righted for clarity.

Figure 7.
Location of node IDs referenced in Table 10.
Figure 7.
Location of node IDs referenced in Table 10.

Figure 8.
Position 1—ATD impacting the centre console at 2300 ms.

Figure 9.
Position 8—ATD with the right thorax impacting the centre console at 2300 ms.

Figure 10.
Position 2—ATD at 2300 ms with right thorax impacting against the centre console.


Table 1.
Summary of the driver’s injuries with an Abbreviated Injury Scale (AIS) score <3.
| Body Region | Injury | Aspect | AIS | Source | Confidence |
|---|---|---|---|---|---|
| Head | Facial skin lacerations | Superior/Upper | 1 | Flying glass | Possible |
| Head | Facial skin abrasion | Superior/Upper | 1 | Roof left side rail | Possible |
| Thorax & Abdomen | Back skin contusion | Right | 1 | Seat back | Probable |
| Thorax & Abdomen | Chest skin contusion | Central | 1 | Belt restraint webbing/buckle | Possible |
| Thorax & Abdomen | Chest skin abrasion | Central | 1 | Belt restraint webbing/buckle | Possible |
| Thorax & Abdomen | Abdomen skin contusion | Left | 1 | Belt restraint webbing/buckle | Possible |
| Thorax & Abdomen | Abdomen skin abrasion | Central | 1 | Belt restraint webbing/buckle | Possible |
| Thorax & Abdomen | Myocardium contusion | (Not specified) | 1 | Belt restraint webbing/buckle | Possible |
| Lower Extremity | Lower extremity contusion | Bilateral | 1 | Knee bolster | Possible |
| Lower Extremity | Lower leg abrasion | Bilateral | 1 | Knee bolster | Probable |
Table 2.
Summary of the driver's AIS3+ injuries (injuries with an AIS score >3).
| Body Region | Injury | Aspect | AIS | Source | Confidence |
|---|---|---|---|---|---|
| Thorax | Rib cage fracture (2–3 ribs) with bilateral hemo-/pneumothorax. More rib fractures on the right than left thorax. | Bilateral | 3 | Belt restraint webbing/buckle | Possible |
| Thorax | Lung contusion | Bilateral | 4 | Belt restraint webbing/buckle | Possible |
Table 3.
Vehicle kinematics at the point of trip.
| Title | Title |
|---|---|
| Roll (°) | 90.00 |
| Pitch (°) | 4.50 |
| Yaw (°) | 32.06 |
| Roll rate (°/s) | 152.41 |
| Pitch rate (°/s) | 68.75 |
| Yaw rate (°/s) | −4.01 |
| Horizontal velocity (km/h) | 27.75 |
| Vertical velocity (km/h) | −0.67 |
Table 4.
Anthropomorphic test device (ATD) positions.
| ATD Posture Title | Anterior–Posterior Lean Angle (°) | Lateral Lean Angle (°) |
|---|---|---|
| Position 1 | −11.0 | −7.5 |
| Position 2 | −11.0 | 0.0 |
| Position 3 | −11.0 | +7.5 |
| Position 4 | −21.0 | −7.5 |
| Position 5 | −21.0 | 0.0 |
| Position 6 | −21.0 | +7.5 |
| Position 7 | −31.0 | −7.5 |
| Position 8 | −31.0 | 0.0 |
| Position 9 | −31.0 | +7.5 |
Table 5.
NASS-CDS Reported Vehicle Intrusion and FE Model Measured Intrusion.
| Intruded Component | Crush Direction | NASS-CDS Reported Intrusion (cm) | FE Model Measured Intrusion (cm) |
|---|---|---|---|
| Left A-Pillar | Vertical | 10 | 11.8 |
| Left B-Pillar | Vertical | 5 | 3.4 |
Table 6.
Rib deflection.
| ATD Position | Rib | Maximum Deflection (mm) | Time of Peak Deflection (ms) | Vehicle Quarter-Turn | Probability of AIS3+ Lateral Thoracic Injury |
|---|---|---|---|---|---|
| Position 1 | Upper Rib | 0.05 | 1099 | 3rd | 0.10 |
| Middle Rib | 2.01 | 1132 | 3rd | 0.12 | |
| Lower Rib | 1.82 | 1129 | 3rd | 0.12 | |
| Position 2 | Upper Rib | 1.85 | 834 | 3rd | 0.12 |
| Middle Rib | 1.86 | 637 | 2nd | 0.12 | |
| Lower Rib | 1.96 | 632 | 2nd | 0.12 | |
| Position 5 | Upper Rib | 2.73 | 580 | 2nd | 0.13 |
| Middle Rib | 2.51 | 582 | 2nd | 0.12 | |
| Lower Rib | 2.17 | 210 | 2nd | 0.12 | |
| Position 8 | Upper Rib | 1.43 | 755 | 3rd | 0.12 |
| Middle Rib | 0.48 | 204 | 2nd | 0.11 | |
| Lower Rib | 1.44 | 204 | 2nd | 0.12 |
Table 7.
Upper spinal acceleration results.
| ATD Position | Peak Upper Spinal Acceleration (g) | Time of Peak Acceleration (ms) | Vehicle Quarter-Turn | Probability of AIS3+ Lateral Thoracic Injury |
|---|---|---|---|---|
| Position 1 | 5.14 | 1099 | 3rd | 0.20 |
| −4.44 | 2261 | 4th | 0.19 | |
| Position 2 | 4.64 | 751 | 3rd | 0.19 |
| −5.99 | 2286 | 4th | 0.21 | |
| Position 5 | 3.72 | 573 | 2nd | 0.19 |
| −5.39 | 2270 | 4th | 0.20 | |
| Position 8 | 5.79 | 774 | 3rd | 0.20 |
| −5.77 | 2228 | 4th | 0.21 |
Table 8.
Lower spinal acceleration results
| ATD Position | Peak Lower Spinal Acceleration (g) | Time of Peak Acceleration (ms) | Vehicle Quarter-Turn | Probability of AIS3+ Lateral Thoracic Injury |
|---|---|---|---|---|
| Position 1 | 8.48 | 824 | 3rd | 0.15 |
| −6.47 | 2289 | 4th | 0.14 | |
| Position 2 | 10.48 | 843 | 3rd | 0.15 |
| −9.40 | 2276 | 4th | 0.15 | |
| Position 5 | 3.42 | 856 | 3rd | 0.13 |
| −9.27 | 2241 | 4th | 0.15 | |
| Position 8 | 11.28 | 862 | 3rd | 0.15 |
| −7.63 | 2289 | 4th | 0.14 |
Table 9.
Average Spinal Acceleration-10 (ASA-10) results.
| ATD Position | Start Time of Pulse | End Time of Pulse | ASA (g) | Vehicle Quarter-Turn | Probability of AIS3+ Lateral Thoracic Injury |
|---|---|---|---|---|---|
| Position 1 | 818 | 857 | 6.89 | 3rd | 0.14 |
| 1985 | 2147 | 0.57 | 4th | 0.11 | |
| Position 2 | 831 | 858 | 8.44 | 3rd | 0.15 |
| 1895 | 2177 | 0.56 | 4th | 0.11 | |
| Position 5 | - | - | - | - | - |
| 1814 | 2151 | 0.46 | 4th | 0.11 | |
| Position 8 | 857 | 873 | 9.31 | 3rd | 0.15 |
| 1978 | 2155 | 0.66 | 4th | 0.11 |
Table 10.
Lateral thorax impact velocity.
| ATD Position | Node ID | Peak Lateral Thorax Impact Velocity (m/s) | Time of Peak Impact Velocity (ms) | Vehicle Quarter-Turn | Probability of AIS3+ Lateral Thoracic Injury |
|---|---|---|---|---|---|
| Position 1 | 380839 | −4.95 | 2271 | 4th | 0.31 |
| Position 2 | 380823 | −3.66 | 2326 | 4th | 0.17 |
| Position 5 | 380870 | −3.31 | 2266 | 4th | 0.14 |
| Position 8 | 381218 | −3.14 | 2285 | 4th | 0.13 |
Table 11.
Peak thoracic force and pressure.
| ATD Position | Thorax Segment | Peak Force (kN) |
|---|---|---|
| Position 1 | Right Front 05 | 0.27 |
| Position 2 | Left Front 01 | 0.19 |
| Position 5 | Right Rear 05 | 0.15 |
| Position 8 | Right Rear 07 | 0.64 |
Table 12.
Peak thoracic force and pressure from right thorax to centre console impact.
| ATD Position | Thorax Segment | Peak Force (kN) |
|---|---|---|
| Position 1 | Right Side 06 | 0.19 |
| Position 2 | Right Side 06 | 0.10 |
| Position 5 | Right Side 06 | 0.08 |
| Position 8 | Right Side 07 | 0.53 |
Table 13.
Peak lap belt axial forces.
| ATD Position | Left Lap Belt Peak Force (kN) | Time of Peak Force (ms) | Vehicle Quarter-Turn | Right Lap Belt Peak Force (kN) | Time of Peak Force (ms) | Vehicle Quarter-Turn |
|---|---|---|---|---|---|---|
| Position 1 | 2.38 | 817 | 3rd | 1.13 | 193 | 2nd |
| Position 2 | 2.74 | 827 | 3rd | 2.74 | 827 | 3rd |
| Position 5 | 2.28 | 2289 | 4th | 2.28 | 2289 | 4th |
| Position 8 | 2.39 | 850 | 3rd | 2.39 | 850 | 3rd |
Table 14.
Peak sash belt axial forces.
| ATD Position | Sash Bottom Peak Force (kN) | Time of Peak Force (ms) | Vehicle Quarter-Turn | Sash Top Peak Force (kN) | Time of Peak Force (ms) | Vehicle Quarter-Turn |
|---|---|---|---|---|---|---|
| Position 1 | 1.05 | 198 | 2nd | 1.18 | 201 | 2nd |
| Position 2 | 0.95 | 189 | 2nd | 0.95 | 194 | 2nd |
| Position 5 | 1.15 | 192 | 2nd | 1.23 | 195 | 2nd |
| Position 8 | 1.33 | 875 | 3rd | 1.24 | 876 | 3rd |
© 2017 by the authors. Licensee MDPI, Basel, Switzerland. This article is an open access article distributed under the terms and conditions of the Creative Commons Attribution (CC BY) license (http://creativecommons.org/licenses/by/4.0/).
Share and Cite
MDPI and ACS Style
Tan, T.; Mongiardini, M.; Grzebieta, R.; Mattos, G. Reconstruction of a Rollover Crash for Thoracic Injury Etiology Investigation. Safety 2017, 3, 27. https://0-doi-org.brum.beds.ac.uk/10.3390/safety3040027
AMA Style
Tan T, Mongiardini M, Grzebieta R, Mattos G. Reconstruction of a Rollover Crash for Thoracic Injury Etiology Investigation. Safety. 2017; 3(4):27. https://0-doi-org.brum.beds.ac.uk/10.3390/safety3040027
Chicago/Turabian StyleTan, Tana, Mario Mongiardini, Raphael Grzebieta, and Garrett Mattos. 2017. "Reconstruction of a Rollover Crash for Thoracic Injury Etiology Investigation" Safety 3, no. 4: 27. https://0-doi-org.brum.beds.ac.uk/10.3390/safety3040027
Note that from the first issue of 2016, this journal uses article numbers instead of page numbers. See further details here.