Article

Development of a Preliminary Model for Evaluating Occupational Health and Safety Risk Management Maturity in Small and Medium-Sized Enterprises

1
Industrial Engineering Department, School of Engineering, Université du Québec à Trois-Rivières, Trois-Rivières, QC G9A 5H7, Canada
2
Research Institute on SMEs, Université du Québec à Trois-Rivières, QC G9A 5H7, Canada
*
Author to whom correspondence should be addressed.
Submission received: 24 October 2017 / Revised: 12 January 2018 / Accepted: 23 January 2018 / Published: 1 February 2018

Abstract

:
Management of occupational health and safety (OHS) risks is a crucial component of any business. Numerous investigations have shown that work-related injuries and deaths occur disproportionately in small-to-medium-sized enterprises (SMEs) and that this is clearly due to deficient management of OHS risks. The main goal of this work is to develop a base of indicators suitable for evaluating OHS risk management maturity in industrial SMEs. A preliminary model is then proposed for this evaluation, based on a small number of relevant indicators selected from a careful bibliographic review. The work begins with a critical review of the literature and analysis of known concepts, methods, tools and models of measurement of risk analysis maturity in order to extract relevant indicators. The most suitable indicators are then grouped to form the basis of a preliminary model for evaluating OHS risk management maturity in the SME setting. Our findings will help managers of SMEs make sound decisions in their quest to improve the OHS performance of their businesses.

1. Introduction

In 2014, workplace accidents and conditions were the direct cause of 2.3 million deaths around the world [1]. About 350,000 of these were due to accidents while the rest were the result of work-related diseases. Analyses show that feasible interventions could have made these numbers much lower and that their associated economic cost is close to 4% of global gross domestic product [2].
In 2015, about 87,600 work-related lesions were recorded in Québec [3], where workplace accidents and work-related illnesses do not follow the same trend, the period of 2007 to 2012 in particular showing a drop of −4.8% per year for accidents and an increase of 2.7% per year for illnesses [4]. An alarming increase in workplace fatalities since 2014 suggests that occupational health and safety (OHS) management is being neglected or is becoming dysfunctional in the Québec workplace [5]. The remarkable variability of the number of work-related fatalities per year is not new. Although data are incomplete, the trend appears to be the same or possibly worse in Québec small-to-medium-sized enterprises (SMEs), which make up the majority of the economic fabric of the province.
Based on the frequency of injuries and fatalities [6], the workplace appears to be considerably more dangerous in small companies than in large companies [7,8]. In Europe, 82% of work-related injuries or lesions and 90% of those leading to death occur in SMEs [2].
The economic and social impact of work-related injuries and illnesses occurring in the SME context has been well documented in various studies [2,9,10,11]. In addition to direct human suffering, productivity suffers and employee attitudes worsen. Taking factors such as these into consideration, the annual economic loss due to workplace accidents in Canada is estimated at $19 billion [12].
SMEs generally aim to grow, thrive, increase the wealth of their owners, improve their methods and increase the satisfaction of their customers. In order to do this, they search constantly for means and assets that will maintain their competitiveness. One of these assets is an effective system of OHS management [13]. In recent years, a variety of standards have been developed in order to promote risk management, for example, ISO 31 000 [14], CAN/CSA-Z1000 [15], OHSAS 18001 [16] and so on. Risk management is a fundamental component of business success in terms of economics, societal factors and environmental protection [17]. As a decision aid tool, risk management represents means of ensuring the long-term viability of any organization and this is becoming more and more obvious as the performance of SMEs improves [18], as noted already a generation ago [19]. Under conditions of rapid socioeconomic evolution, management of OHS risks in particular may be viewed as a wise strategic initiative [20]. In fact, SMEs need to improve their recognition and management of the various types of risk that are present in their work environments [21,22]. It was pointed out years ago that OHS deficiencies in SMEs are strongly associated with inadequate management of the occupational risks confronting these businesses [23]. It has since been re-stated that the limited ability of SMEs to evaluate OHS risks must be addressed with urgency [21]. Various authors have noted that SMEs suffer from persistent lagging maturity in the realm of OHS risk management [7,8,20,24]. They point out several factors that appear to influence OHS risk management in SMEs, including insufficient economic, technological and human resources, the onerous nature of OHS regulations, absence of such regulations, bureaucracy, inadequate training or unavailability of training, poor communication or lack of communication between managers and workers.
The main goal of this article is to develop a base of measurable indicators of OHS risk management maturity better adapted for use in SMEs. In addition, we shall focus on certain indicators that have rarely been applied until now. And finally, it was deemed necessary in the context of this study to focus on predictive indicators of occupational risk of lesions and their possible associations with proactive indicators. We shall conclude by proposing a preliminary model for measuring OHS risk management maturity based on a small number of relevant measurable indicators.
The article is organized as follows: We begin by presenting the research problem in Section 2, followed by a detailed description of the research methodology in Section 3. The results of the literature review are presented in Section 4, in terms of the most relevant risk management maturity evaluation models and the list of indicators suitable for measuring OHS risk management maturity in SMEs. In this section, we also provide the details of the preliminary model used for this measurement. In Section 5, we discuss the results and limitations of the study. Finally, our conclusion is provided in Section 6.

2. Research Problem

The research problem comprises three principal elements (Figure 1), summarized below in our presentation of the challenges confronting OHS in the SME setting. We then describe briefly a few known OHS risk management tools and methods before focusing on measurable indicators of OHS risk management maturity.

2.1. Occupational Health and Safety in the SME Setting

For a few decades now, the number and the strategic importance of SMEs has been increasing in the global economy [25]. However, behind this success lie various difficulties associated with an environment characterized by several constraints, these being primarily financial, regulatory or related to competitiveness, OHS, quality and so on [7,24] and often posing considerable challenges to these businesses. SMEs in general are constantly in search of new assets and competitive advantages [18,19]. For this reason, the effectiveness of OHS risk management represents a crucial aspect to be taken into consideration in the SME setting.

2.2. OHS Risk Management Tools and Methods

Like all other aspects of governance, OHS risk management requires a system of measurement in order to be conducted effectively. SMEs do not have at their disposal OHS measurement tools and methods that are adapted to their work environments and scales of operation [8,24]. Among the factors cited to explain the unavailability of tools suitable for measuring their maturity level are insufficient economic, technological and human resources, the adopted managerial mode and efforts oriented towards productivity and quality to the detriment of OHS [26]. Although SMEs generally have limited resources and operate under multiple pressures, they can implement measures based on simple approaches to improving risk management [7,24].

2.3. Measurable Indicators OHS Risk Management Maturity

OHS risk management in the SME setting requires indicators that provide measurements of relevant parameters [27,28,29]. This is important for effective management, facilitates decision-making and solicits the commitment of company staff to the implementation of effective measures [30,31].
Solutions to problems experienced by large corporations with the effectiveness of risk management have been the subject of intensive reflection in recent years [32], while little attention has been devoted to the SME context, in spite of confirmed difficulties in this aspect of business management. The key factors influencing risk management in SMEs have been considered on a fragmentary basis or a few at a time (e.g., culture, communication, etc.)

3. Materials and Methods

The methodology of the present study comprised two principal steps: (1) a survey of publications in order to identify the most relevant risk management maturity analysis models and to collect indicators suitable for evaluating this maturity and (2) proposing a model of maturity evaluation adapted to OHS risk management in SMEs.

3.1. Review of the Literature

The literature on indicators and measurements of OHS risk management maturity was surveyed using the databases Google Scholar, Scopus, ABI/INFORM Global, Institut de recherche Robert-Sauvé en santé et en sécurité du travail (IRSST, Québec) and Commission des normes, de l’équité, de la santé et de la sécurité du travail (CNESST, Québec). Among the documents thus retrieved, we focused on articles published in scientific journals, conference articles, research reports, theses and memoirs, standards, regulations and legislative or legal documents. In order not to exclude potentially interesting indicators, the search was extended to subject areas such as quality management, software development, project portfolio management and organizational management. Furthermore, in view of the disparate definitions and the limited number of studies on SMEs, the search was extended to businesses of all sizes in all sectors. We also took into consideration aspects related to competitive benchmarking in SMEs.
Figure 2 shows the various sources of the indicators included in the preliminary list. These were retrieved using keywords such as management, safety, indicators, leading, maturity, performance, model, SME, benchmarking and so on. We also used the corresponding keywords in French to query the databases of the IRSST (Québec), CNESST (Québec) and INRS (France).
Having compiled a list of the risk management maturity indicators and measuring tools described in the literature, we then grouped them into two broad categories: reactive indicators and proactive indicators. Obtaining the preliminary list fulfilled our main objective. This provided the base for proposing a preliminary model of OHS risk management maturity evaluation.

3.2. Development of the Preliminary Model of Risk Management Maturity Evaluation

The development of the risk management maturity evaluation model consisted of two steps. The first step involved compiling the preliminary list of maturity indicators and grouping these into four families associated with risk management processes, companies and their managerial staff, individual workers, tasks and resources. These four families make up the base of the preliminary model. The maturity indicators are supported with examples of measured values. The second step involved using the four families in conjunction with relevant models identified in the literature in order to propose a preliminary model of risk management maturity evaluation better adapted to SMEs.
Our approach to developing this model was drawn primarily from the works of Jia et al. [33] and Cienfuegos [34] and is based on the notion of maturity levels, which are based in turn on the theory of organizational learning described by Argyris and Schön [35].

4. Results

4.1. Risk Management Maturity Measurement Models

“Maturity” is complicated and slippery concept, since its definition depends largely on the context to which it is being applied, on how it is being used and on the individual who is evaluating it. For our purposes, maturity in the context of the SME setting means reaching a certain level of effectiveness and performance with regard to management of OHS risks. Measurement of the level of risk management maturity is fundamental to self-evaluation and improvement. As Kaplan and Norton [28] put it, “You can’t manage what you can’t measure”.
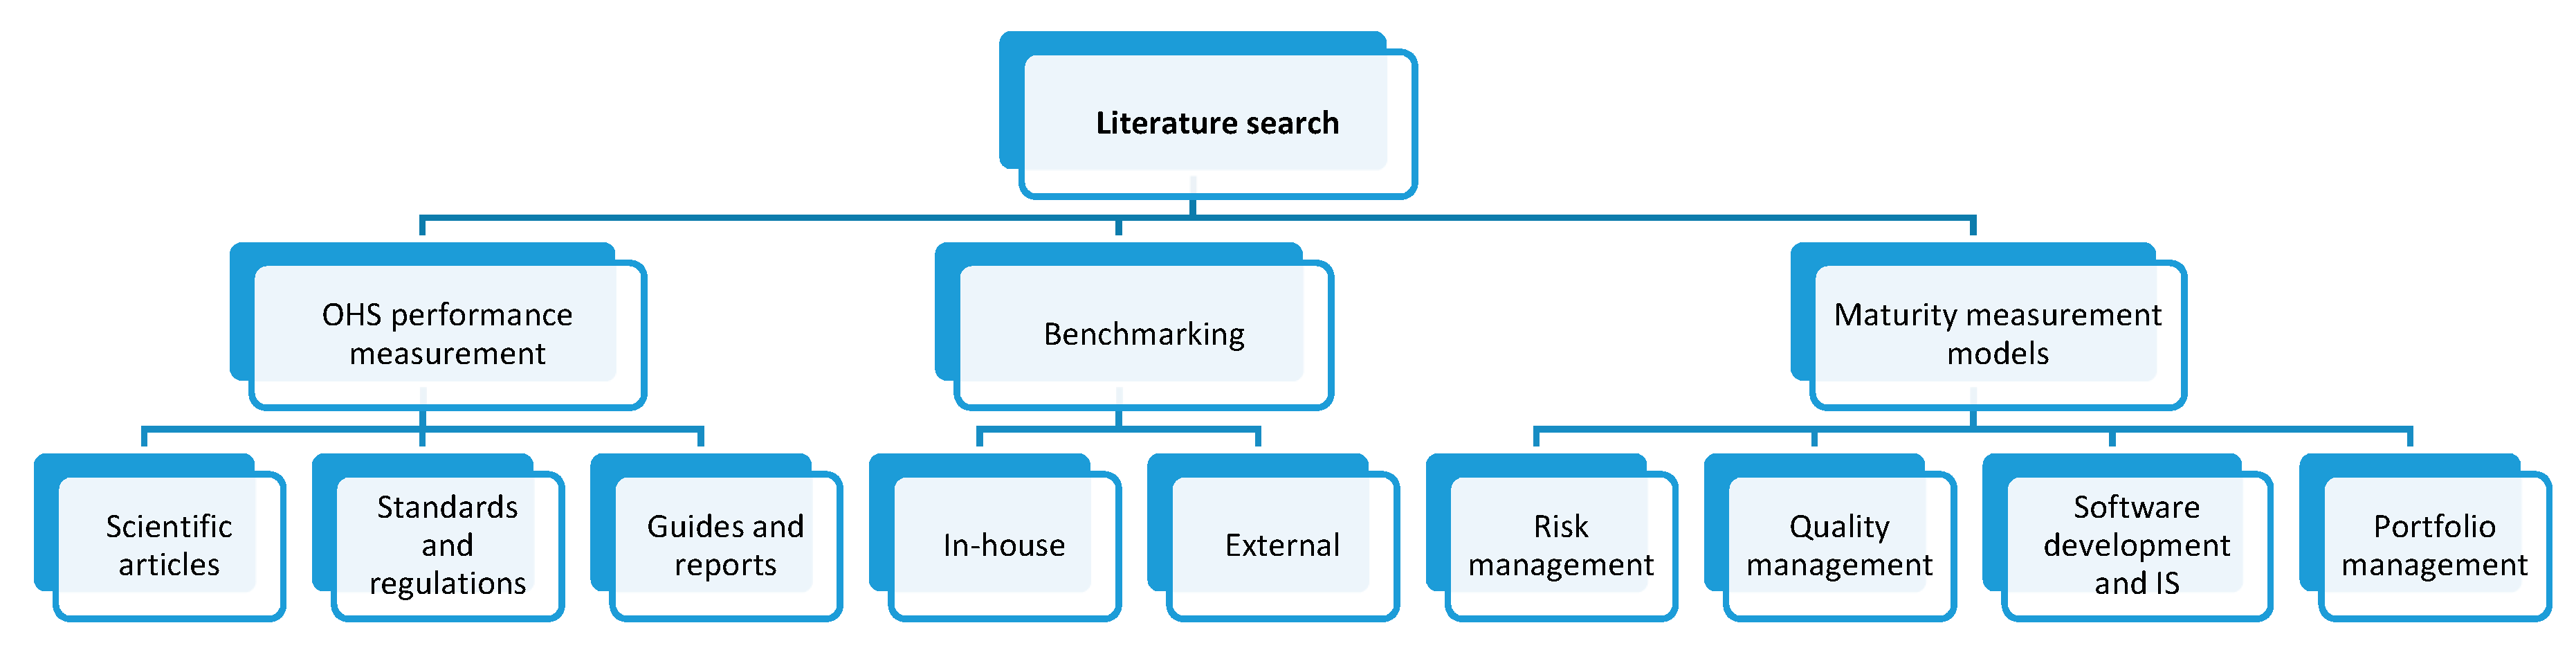
In order to evaluate OHS risk management maturity, many SMEs use benchmarking, which is, according to Moriarty and Smallman ([31], p. 498), “an exemplar-driven teleological process operating within an organization with the objective of intentionally changing an existing state of affairs into a superior state of affairs.” In commerce, benchmarking is divided into two broad categories, namely in-house and external. The in-house variety engages branches, departments or services within the same company. It consists usually of comparing these divisions in order to improve practices. Being limited in this manner is considered a weakness. In contrast, external benchmarking relies on comparison to competitors and thus provides a way of revealing opportunities for improvement [27]. It is used widely in research on SMEs [36,37]. With regard to risk management, all companies prefer external references [27]. It has been believed for a long time that competitive benchmarking leads to better results [38]. This approach makes it easier for companies to identify good practices, discover innovative improvements, learn who their competitors are and what advantages they have and find the best measurement tools and methods. In a study involving 8 companies focused on reducing occupational injuries, it was found that benchmarking led to improved OHS risk management performance and brought average reductions of 77% in the incidence of lesions [39]. The importance of benchmarking to OHS had been demonstrated earlier using measurable indicators of performance and factors known to affect OHS management [40]. Among these factors were inspections, meetings, regulatory framework, training, communication, collaboration, workplace relations and resources.
Performance evaluations should focus both on means (or processes) and on results [41]. Performance can be described also in terms of “practices” and “quantifiable measurements.” Practices are descriptions of behaviours that lead to deviations in performance. These may be associated with processes, organizational structures, management systems, human factors or strategic approaches. Quantifiable measurements refer to indicators associated with company performance, technical performance (productivity) and efficiency (human input). The relevance of these measurements must be reviewed continually. Several factors that influence benchmarking in this context have been identified, including communication, training, commitment and involvement of upper management (leadership), worker participation, development of policies and effective setting of goals, systematic approach to management and decision-making, continuous improvement, teamwork and programs of recognition and appreciation of effort [42].
During the past decade, several models and technological tools have been developed for the measurement of “risk management maturity.” The growing interest of researchers in these models is reflected in the number of articles published, particularly during the years 2009 and 2010 [32]. Prior to this, a “maturity model” had been defined as “a simplified representation of the evolution that an organization’s capacity for sound judgment and responsiveness may undergo in a given field of skill” ([43], p. 49). A model of risk management maturity was later characterized as a means of helping businesses to determine their current level of maturity, to understand their strengths and weaknesses and to implement suitable measures in order to improve their level of performance [33].
Several “maturity measurement models” appear to have originated from the quality management maturity grid, first proposed in 1979 by Crosby [44]. This device is used to raise awareness of the general need for a sustained, long-term quality program in all companies. It defines five progressive levels corresponding to increasing awareness of requirements with respect to quality, namely uncertainty, alertness, awareness, wisdom and certainty [45]. Maturity measurement models often have similar structures [44]. They are based on definition of an ensemble of process areas, of which the control is evaluated within an organization in terms of maturity level. Among the models discussed in the literature, one of the most relevant appears to be the capability maturity integration model, used notably to improve commercial software development processes [46]. Another is the organizational project management maturity model (OPM3) developed by the Project Management Institute (PMI®) [47]. Also well-known are the control objectives for information and related technology (COBIT) model, used to manage the security, reliability and compliance risks inherent in information systems [48] and the risk management capability maturity model for complex production systems (COPS).
It should be noted that the Mellon model developed at the Carnegie Institute of Software Engineering was revised and corrected in 1997 [44,
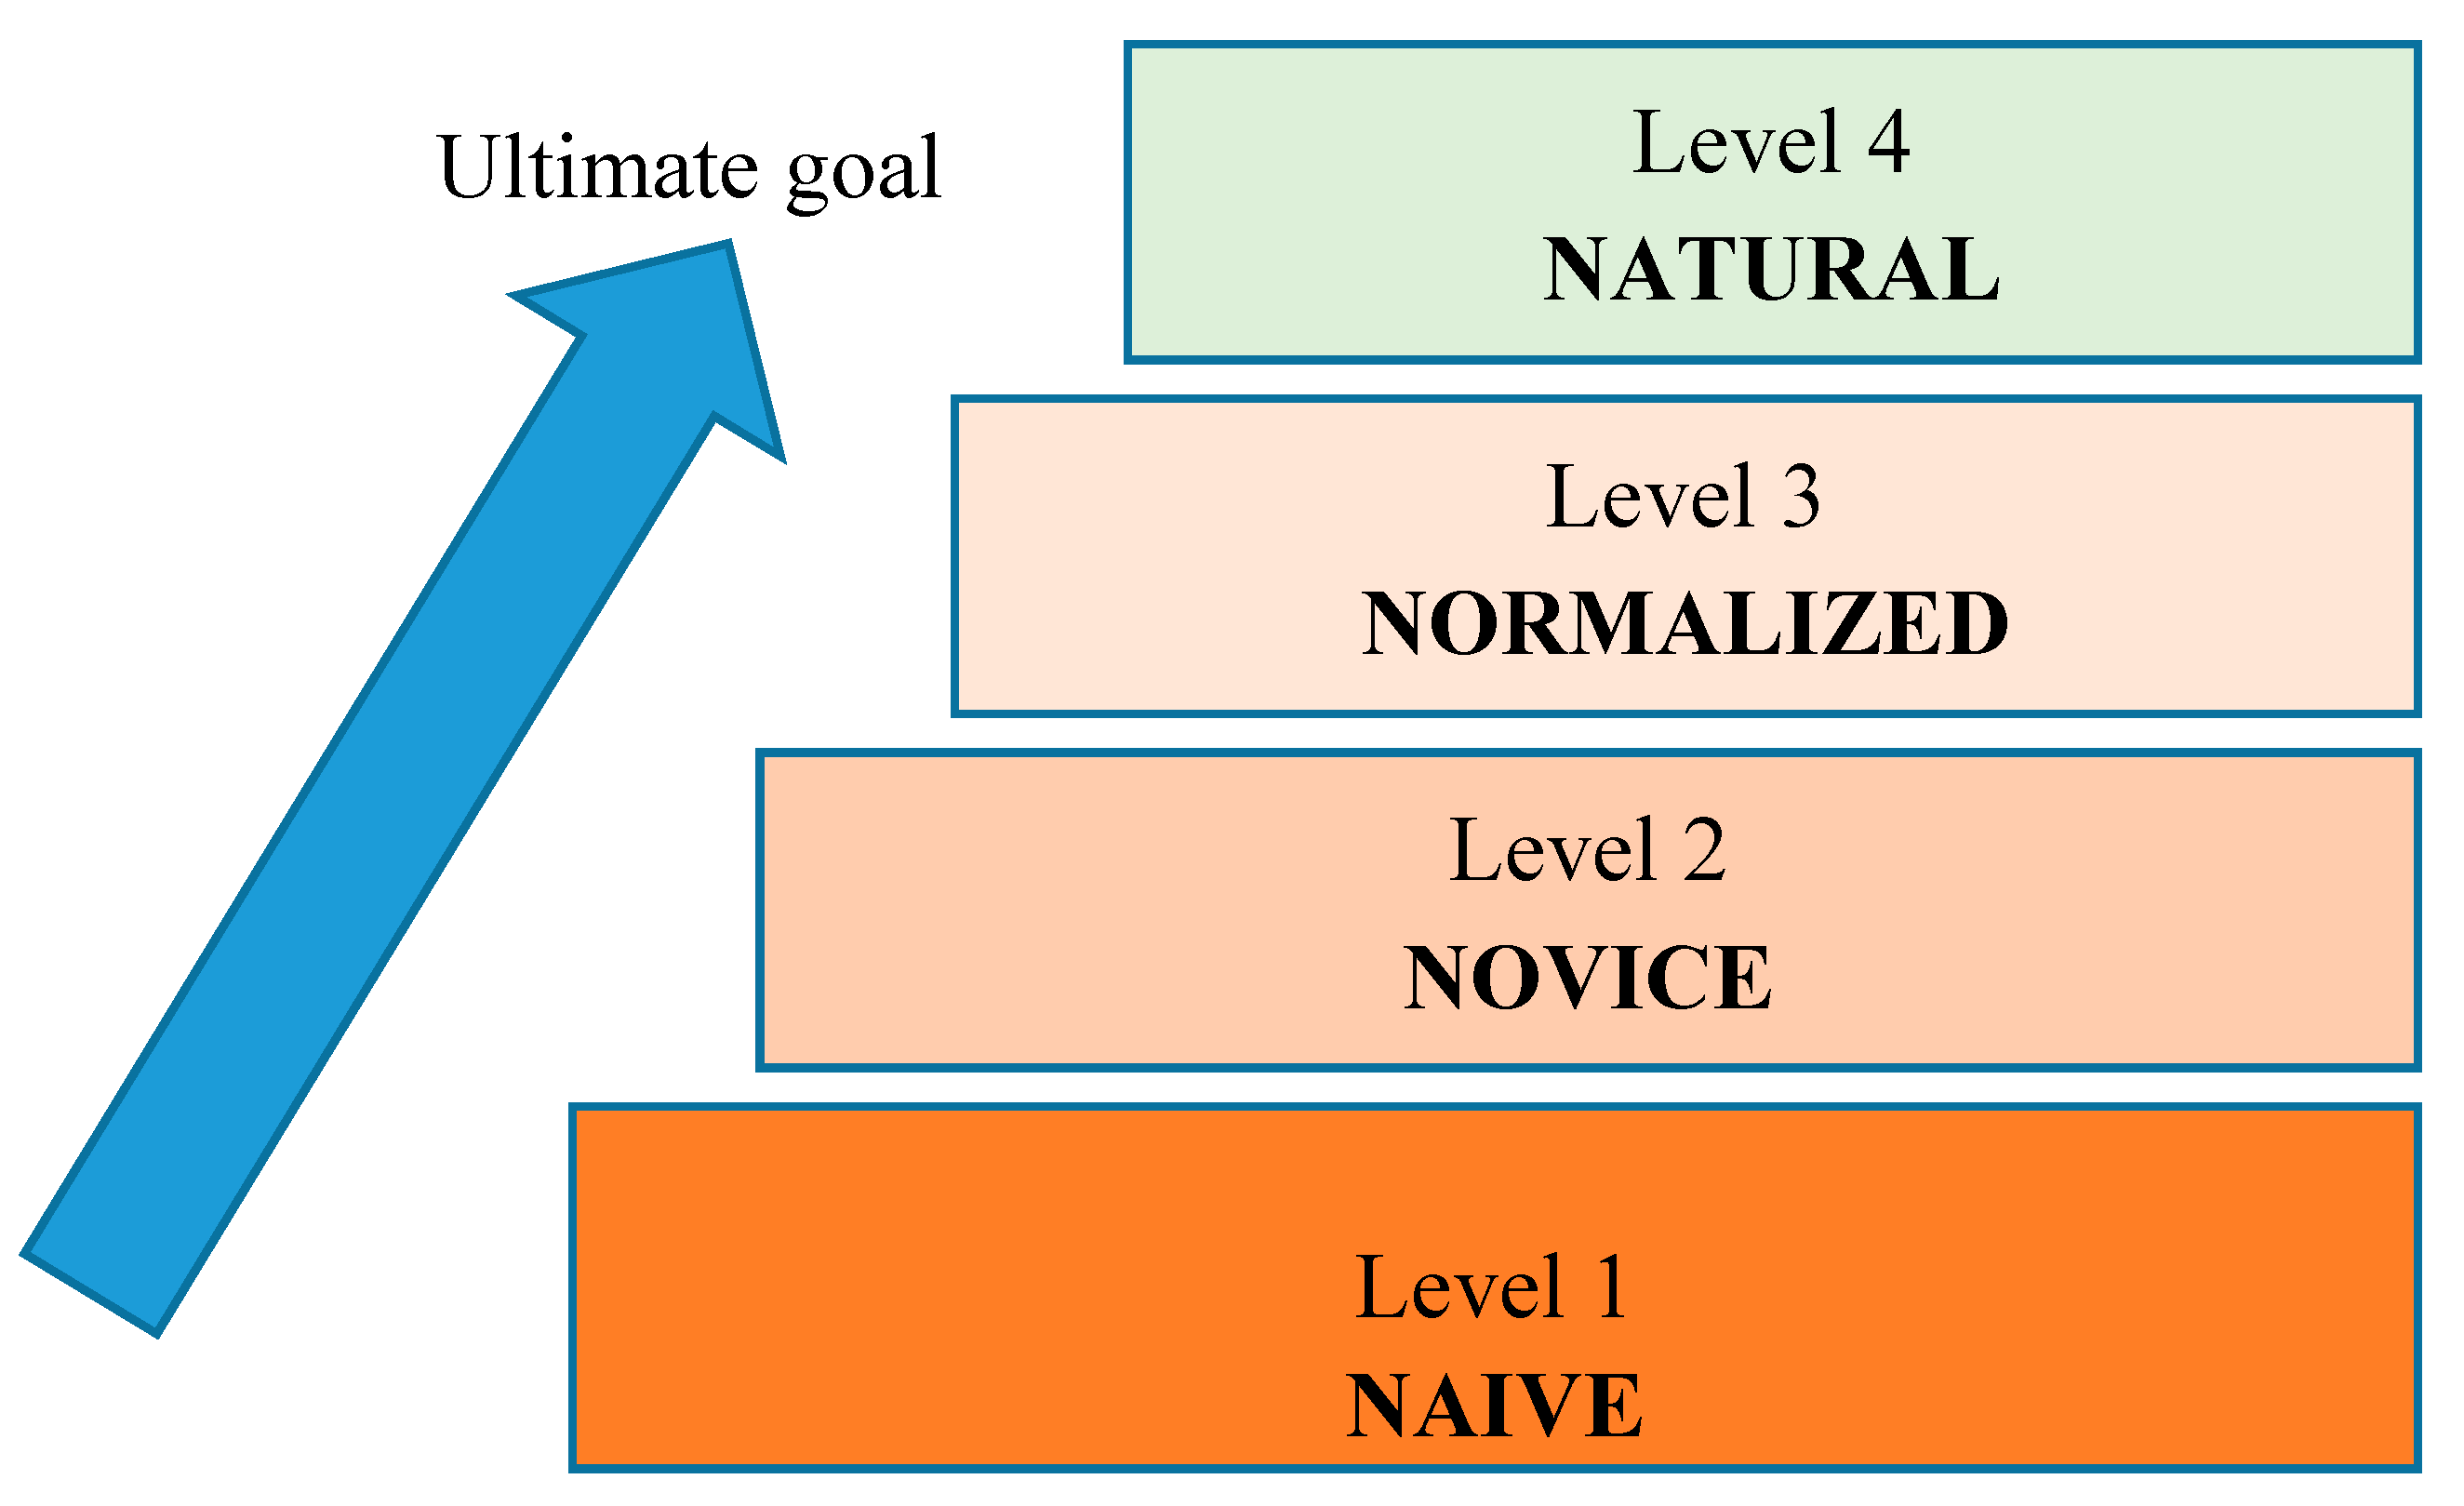
49]. The capability maturity model (CMM) was thus proposed, which features a simple structure that facilitates evaluation of the risk management processes of a business, based on indicators (culture, behaviour, etc.) suggested by observation. These composite indicators facilitate communication of results, particularly by using plain language and a common reference system. The CMM model describes an organization using four levels (Figure 3) of increasing risk management capacity (naïve, novice, normalized and natural) measured in terms of four attributes, namely culture, processes, experience and application [50,51]. Each level is defined and characterized clearly, thus allowing companies to self-evaluate their level of maturity using a previously established scale. Once this level of maturity has been determined, a company can set clear targets for improvement [52].
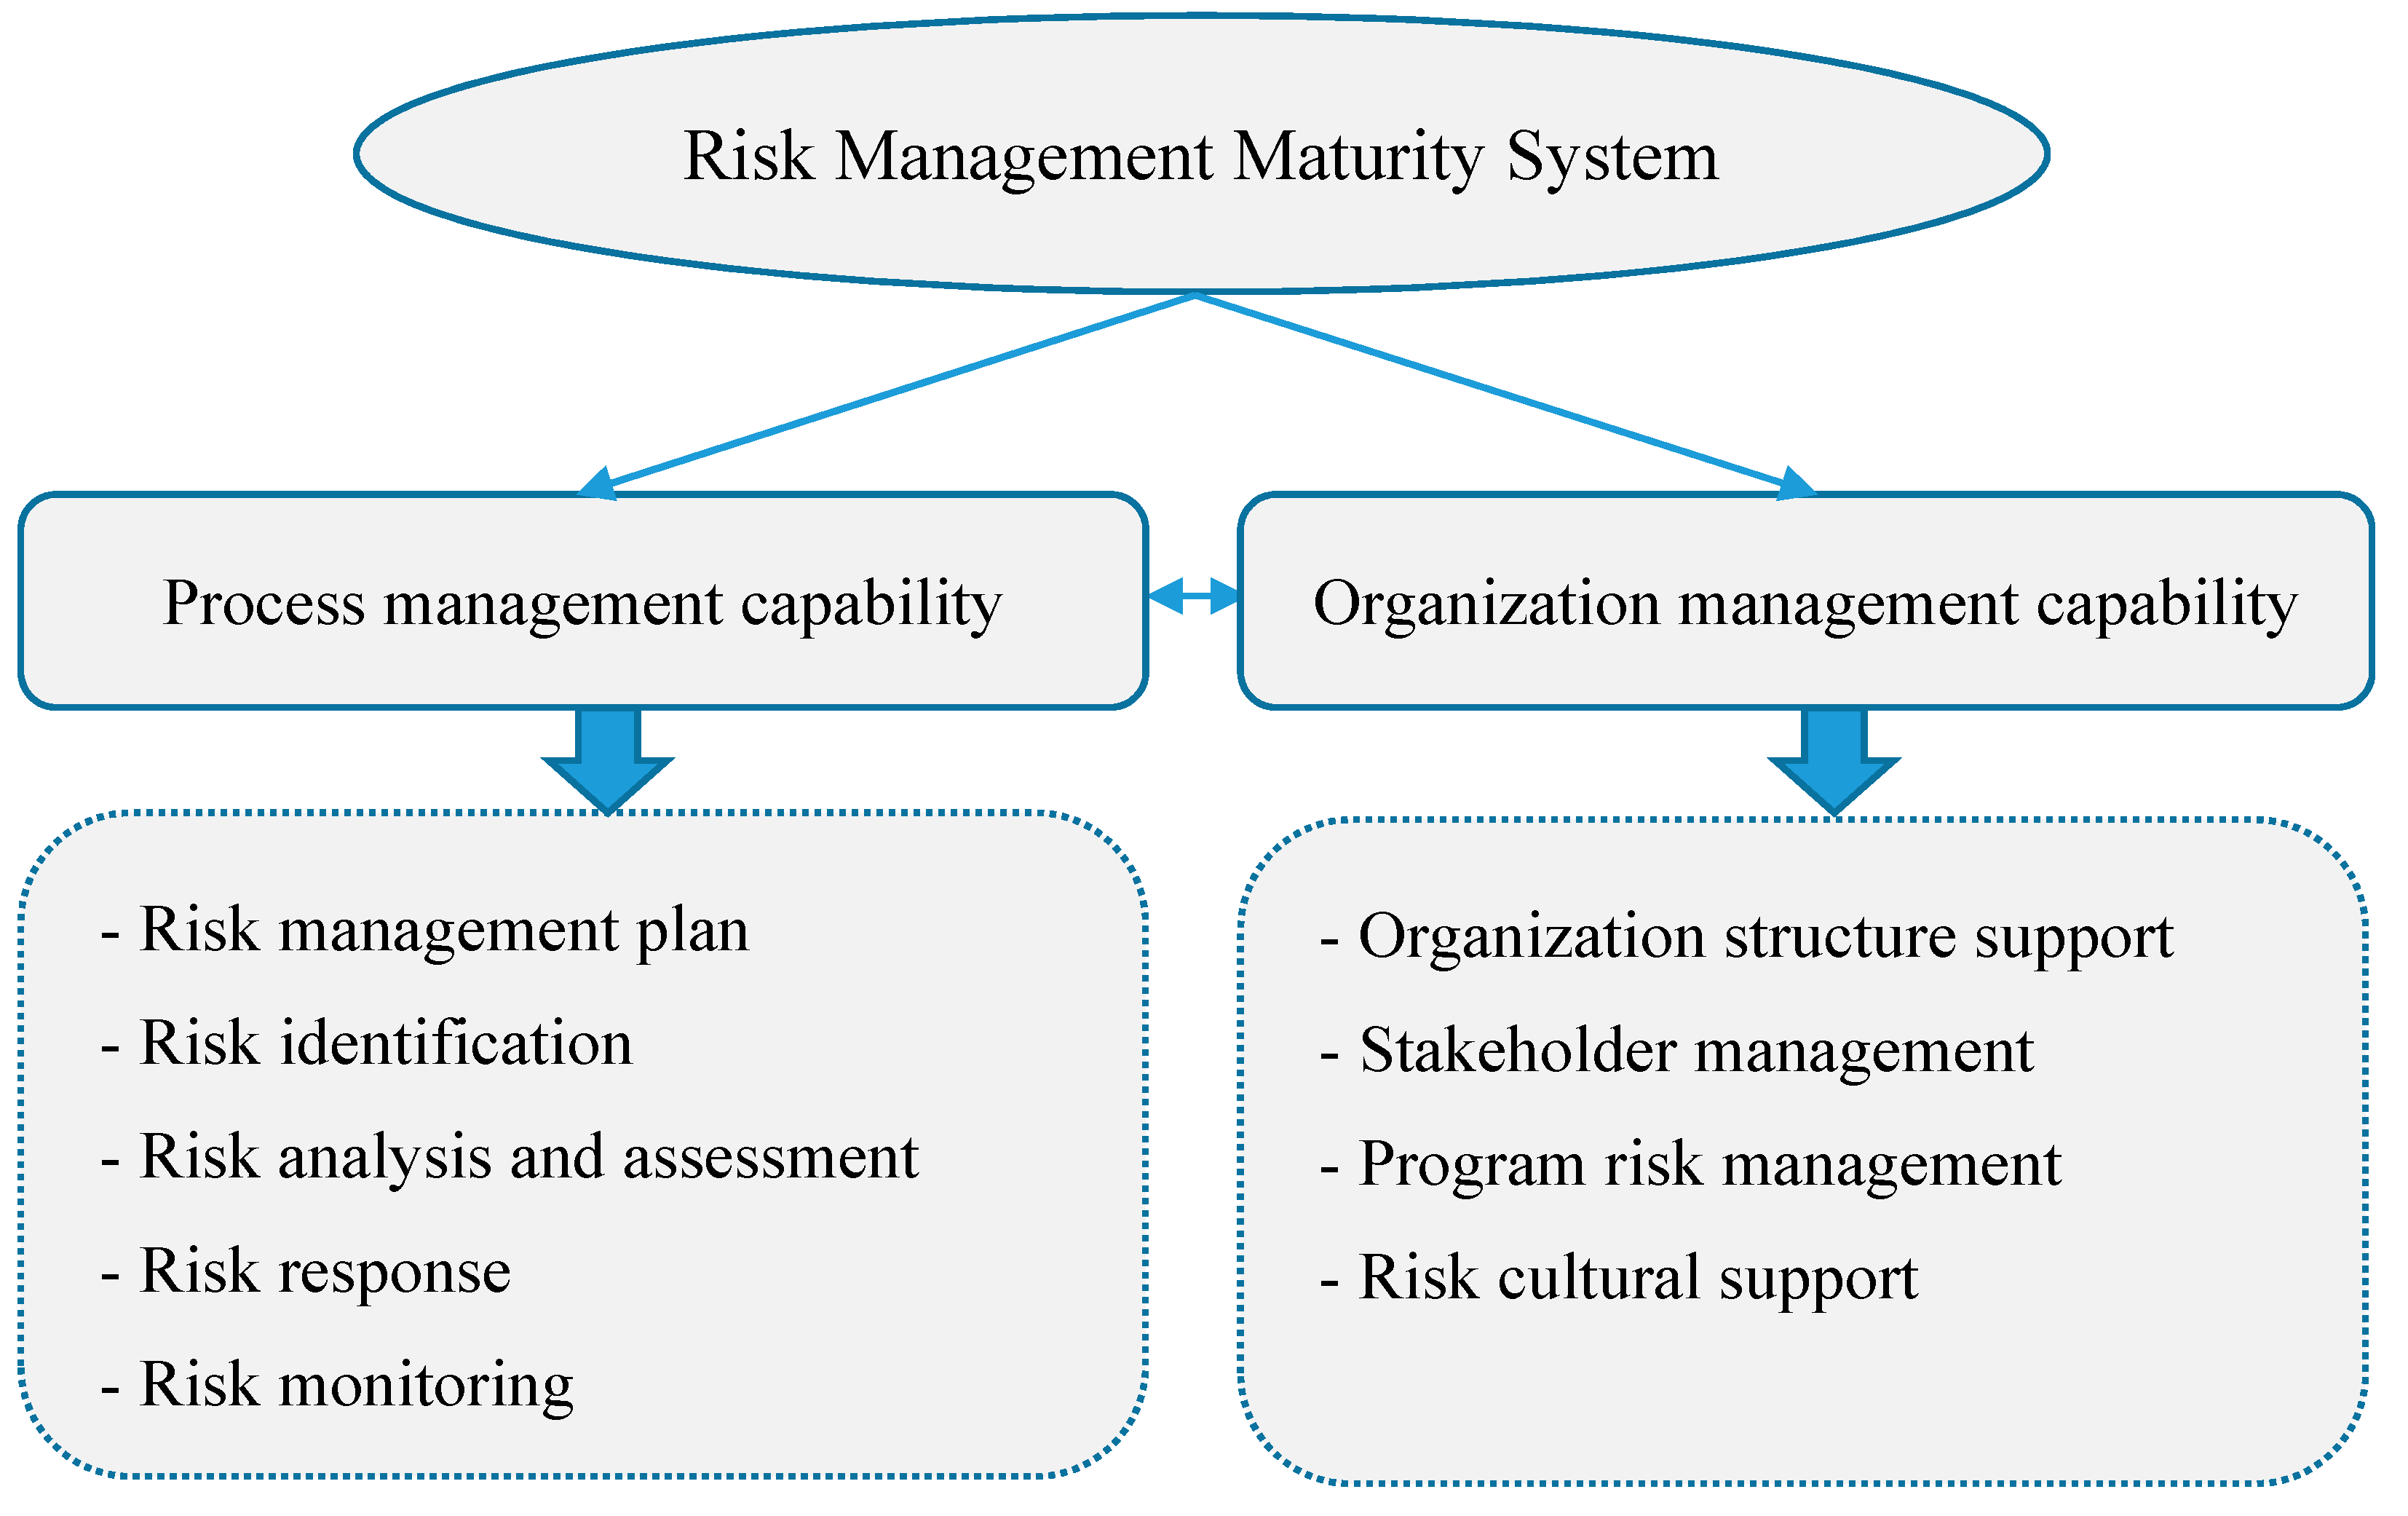
The risk management maturity system (RMMS) was developed for application to construction projects [33]. This model is based on a system composed of three functional elements: capability, evaluation and improvement. Figure 4 describes the capability element: (1) managerial capability associated with the “organization,” which represents the support provided by the company with regard to safety, stakeholder management, culture and the program risk management and (2) capability associated with “processes,” which represents the identification, analysis, evaluation and handling of risks as well as collection of afferent information.
In general, managerial capabilities associated with the “organization” and with “processes” are at least somewhat interconnected. In fact, the former provides the basis of risk management processes. Improvement of either favours improvement of the other (mutual relationship). The model is divided into six categories and 21 activities, including risk management analysis feasibility, the risk identification process, structured description of risk, selection and use of risk analysis methods, risk analysis results, identification of residual risk and risk monitoring.
The risk management maturity model (RM3) was also developed for application to construction projects [53]. Several facets of projects are analyzed, including the system, the process, human resources and culture. RM3 is composed of the following five elements: risk management and leadership capability, risk management organizational culture, risk identification and analysis capability and aptitude for developing and applying a standardized process of risk management. It includes four levels of maturity: initial, repeatable, directed and optimized. The reliability and effectiveness of RM3 has been demonstrated in several empirical applications.
We note also a model developed initially to measure and later to promote safety culture in Brazilian petrochemical companies [54]. In its original configuration, it included three levels (pathological, bureaucratic and generative). Two others were added, namely reactive and proactive [55] and the term “bureaucratic” was changed to “calculating.” The different levels have been defined as follows [56]:
  • Pathological: characterized by worker-caused unsafe conditions. The principal focus of the business is productivity. Safety legislation and regulations are disregarded or circumvented deliberately.
  • Reactive: the organization is starting to take safety seriously. Measures and actions are undertaken as accidents occur.
  • Calculating: safety is guided by management systems based on data gathering. It is more suggested or imposed by the administration than desired by the workers.
  • Proactive: performance is improved using predictions. Worker involvement is starting the transition from a purely top-down approach.
  • Generative: active participation is preached and practised at all levels. Safety is perceived as a central and crucial issue for the company.
Using a model proposed by Hudson [57], Parker et al. [58] designed a framework that could help SMEs evaluate their safety culture maturity. Following improvements by Filho et al. [54], the model now includes the following five dimensions:
  • “Information” refers to the information system, that is, the manager’s evaluation of the system put in place to favour circulation of and access to information on workplace accidents, for the purpose of improving safety performance.
  • “Organizational learning” refers to information processing and analysis and to training of workers in subjects related to safety.
  • “Involvement” refers to that of workers in the risk management process.
  • “Communication” refers to horizontal as well as vertical exchanges of information within the company.
  • “Commitment” refers to the support provided by the company with regard to safety.
Among the other relevant research articles identified are Safety culture maturity model [59]; The Model to Assess the Maturity Level of the Risk Management Process in Information Security [60], The Safety Culture Maturity and Risk Management Maturity in Industrial Organizations [61] and The Risk Maturity Model for Dutch Municipalities [34]. Underlying the development of these models is the inclusion of the more recently described notion of good risk management practices [33,34], which are particularly relevant to the SME problem. In summary, models of risk management maturity measurement are helpful in several ways. The literature nevertheless does mention some of their drawbacks, such as poor grounding (overwhelming subjectivity), structural complexity or highly theoretical aspects.

4.2. Indicators Suitable for Measuring Risk Management Maturity

All of the models of maturity measurement cited above are based on the use of indicators [31,42,56,62,63]. Measurable indicators play an important role in the process of improving OHS risk management performance in businesses [29]. They allow comparisons of different situations and provide reliable and meaningful information on relevant phenomena [31] and appear to be indispensable for sound decision-making and getting staff involved and committed to implementing actions designed to improve OHS risk management [30].
A measurable indicator of performance is defined as information that can be used to monitor the evolution of a phenomenon relative to defined objectives or a previously determined and accepted framework [64]. Updated regularly, such indicators are useful for evaluating the effectiveness and the efficiency of a system or a part thereof over time. The number of inspections completed on time divided by the total number of inspections planned for a given time interval is an example of an indicator of proper carrying out of maintenance operations.
An indicator can also be an element or group of elements of meaningful information, a representative index or a statistic representing some concern [65]. These are derived from data collected on an observed condition, manifested phenomenon or element associated with the proper functioning of an organization. The choice of an indicator is based on a certain number of criteria that must be met. In this context, it should be kept in mind that monitoring trends over time is an important aspect of risk management and must be based on objective characteristics such as those proposed by the Institut national de l’environnement industriel et des risques (INERIS) [64] and the Conseil du trésor du Québec [66]:
  • Relevance: The preoccupation and the associated expectations have real significance in terms of the objective to be met. The result or phenomenon to be measured is shown clearly and sufficient information is obtained on the effects of the activities underway and the expected results.
  • Validity: The measurement provides accurate and precise evaluation of the situation of concern. It should be noted that validity is verified by cross-comparison with other indicators used to measure the same phenomenon.
  • Feasibility: The data associated with an indicator are accessible when needed and at an acceptable cost.
  • User friendliness: The criterion (indicator) is simple, clear, easy to understand and to present and is interpreted the same way by all within known limits.
  • Reliability: The measurements obtained correspond to reality. Values remain constant while the measurement is repeated under identical conditions. The overall reliability of the indicator depends largely on the reliability of the data (of the actual measurements).
  • Compatibility: Standard variables, calculation methods and frequencies of measurement are used, as recommended by recognized official organizations, thus lending credibility to the indicator.
Although the usefulness of measurable indicators needs little further explanation, their non-judicious use can be counterproductive and costly [67]. For example, over-rating a performance indicator can lead to erroneous results and unrealistic objectives, which will likely have a negative impact on the entire process of risk management and on motivation of staff.
In the literature, performance indicators are divided into several categories: quantitative, qualitative, reactive, proactive, operational, strategic, in-house, external and so on. Even the names of the various types vary depending on the author and the field of research. The two main categories that emerge most consistently from the literature search are lagging indicators (reactive or retrospective) and leading indicators (proactive or predictive).
The focus of most reactive indicators (mishap frequency, severity, frequency-severity and cost) is maximization of results (income, sales, quality, etc.), whereas the focus of OHS performance indicators is the reduction (frequency, severity, etc.) of workplace injuries [68]. In Québec, the CNESST evaluates economic sectors and calculates dues using reactive indicators only [69,70]. This method has provided close-up views of the OHS situation. However, the data show only what types of injury occur and where, while providing little information about their causes. It has been shown that this way of measuring OHS performance is imprecise, inappropriate and even counterproductive [70]. It is of little aid to businesses where accident rates are low while situations at risk are numerous. In addition, reactive indicators alone provide a partial and thus incomplete view of reality, one that can and often does lead to ineffective actions. In order to avoid increases in annual dues, businesses tend to under-report accidents. Results-oriented indicators can be divided into two levels of preoccupation [68]: (1) injury prevention, with result categories such as number of incidents, equipment damage, rescue, first aid, temporary reassignment and indirect costs and (2) monitoring of losses, with conventional result categories including number of accidents, number of illnesses, number of workdays lost, direct costs, dues and so on. Both levels concern past and hence unchangeable occurrences. Too much emphasis on reactive indicators has been identified as a frequent major obstacle to the improvement of OHS risk management performance [71,72].
Proactive indicators provide means of monitoring current OHS performance effectiveness (maturity), activities and risk management processes plus information on the current OHS status of the organization. In other words, they provide advanced warning of potential problems and therefore the possibility of implementing preventive measures before mishaps occur. They can also be used to reveal weaknesses in risk management procedures or worker behaviours that increase the risk of injury [72,73]. Given the dynamic nature of the conditions under which most injuries occur, a proactive indicator will be suitable only if it can provide constant monitoring. Being proactive is beneficial only if the chosen indicator provides timely information that can be interpreted effectively and translated into concrete actions. The USA National Safety Council [
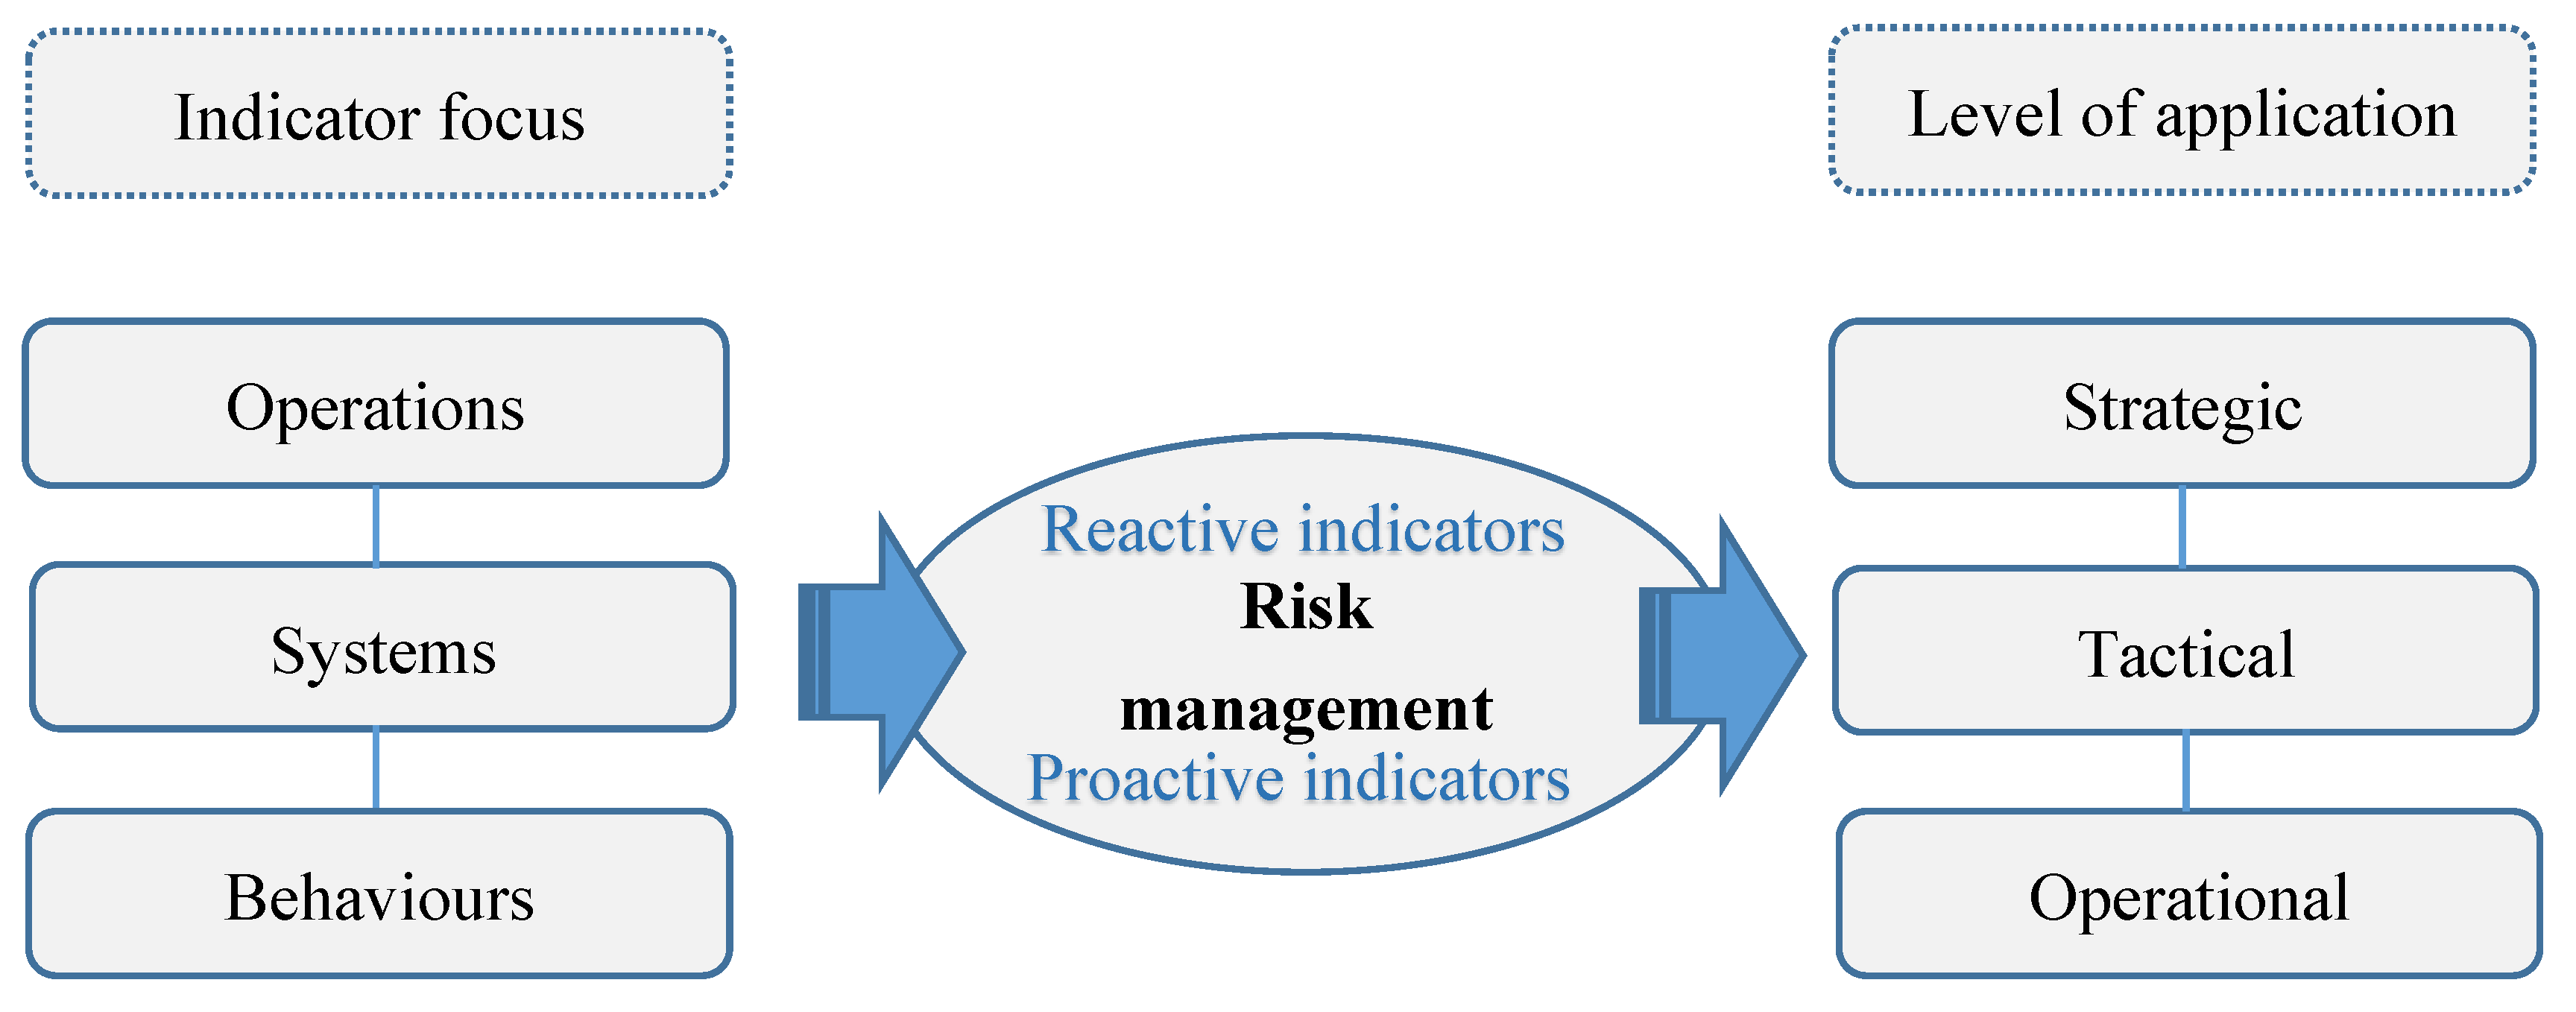
74] describes an effective proactive indicator as being actionable, feasible, meaningful, transparent, easy to communicate, valid, helpful and timely. Their use is generally associated with the following expectations: (1) anticipating, foreseeing or eliminating risks and losses (possibility of taking swift action); (2) monitoring and evaluating OHS risk management efficiency; (3) promoting safe behaviours, staff involvement and continuing improvement and (4) communicating reliable findings. The USA National Safety Council [74] suggests three broad categories of proactive indicators, namely (1) focused on operations (relevant to the functioning of SMEs); (2) focused on systems (i.e., management systems); and (3) focused on behaviours or actions of individuals or groups in the workplace, personal interactions in association with supervision and management. As shown in Figure 5, there are also three hierarchical levels of application of indicators, namely strategic, tactical and operational [64].
A few guides and research articles discuss the use of proactive indicators of OHS status and performance, such as a publication by the Government of Alberta [73]. Based on actual investigation, this guide emphasizes that the implementation of indicators may encounter several obstacles, including the absence of standardized practices or of reference criteria in the studied sector of activity. One study reached the conclusion that benchmarking should be considered the most appropriate method of comparing proactive indicators and their impact on businesses [31]. The proactive indicators mentioned most often in the literature are listed below in Table 1.

4.3. Preliminary Model of OHS Risk Management Maturity Measurement

The model was developed in two steps. The first step consisted of compiling a preliminary list of maturity indicators and grouping these into families in accordance with the main objective of this study, based on relevance to (1) risk management processes, (2) organization and management, (3) individuals and (4) tasks and resources. These four families formed the basis of our preliminary model. We supported the selected indicators with concrete examples. The second step consisted of using the list of families in conjunction with relevant models found in the literature in order to propose a preliminary model better adapted to the SME context.
Our approach to developing a model of OHS management maturity in the SME context was drawn mainly from work by Jia et al. [33] and Cienfuegos [34]. This preliminary model is based on the notion of levels of maturity. These levels find support in organizational learning theory as described in work by Argyris and Schön [35].
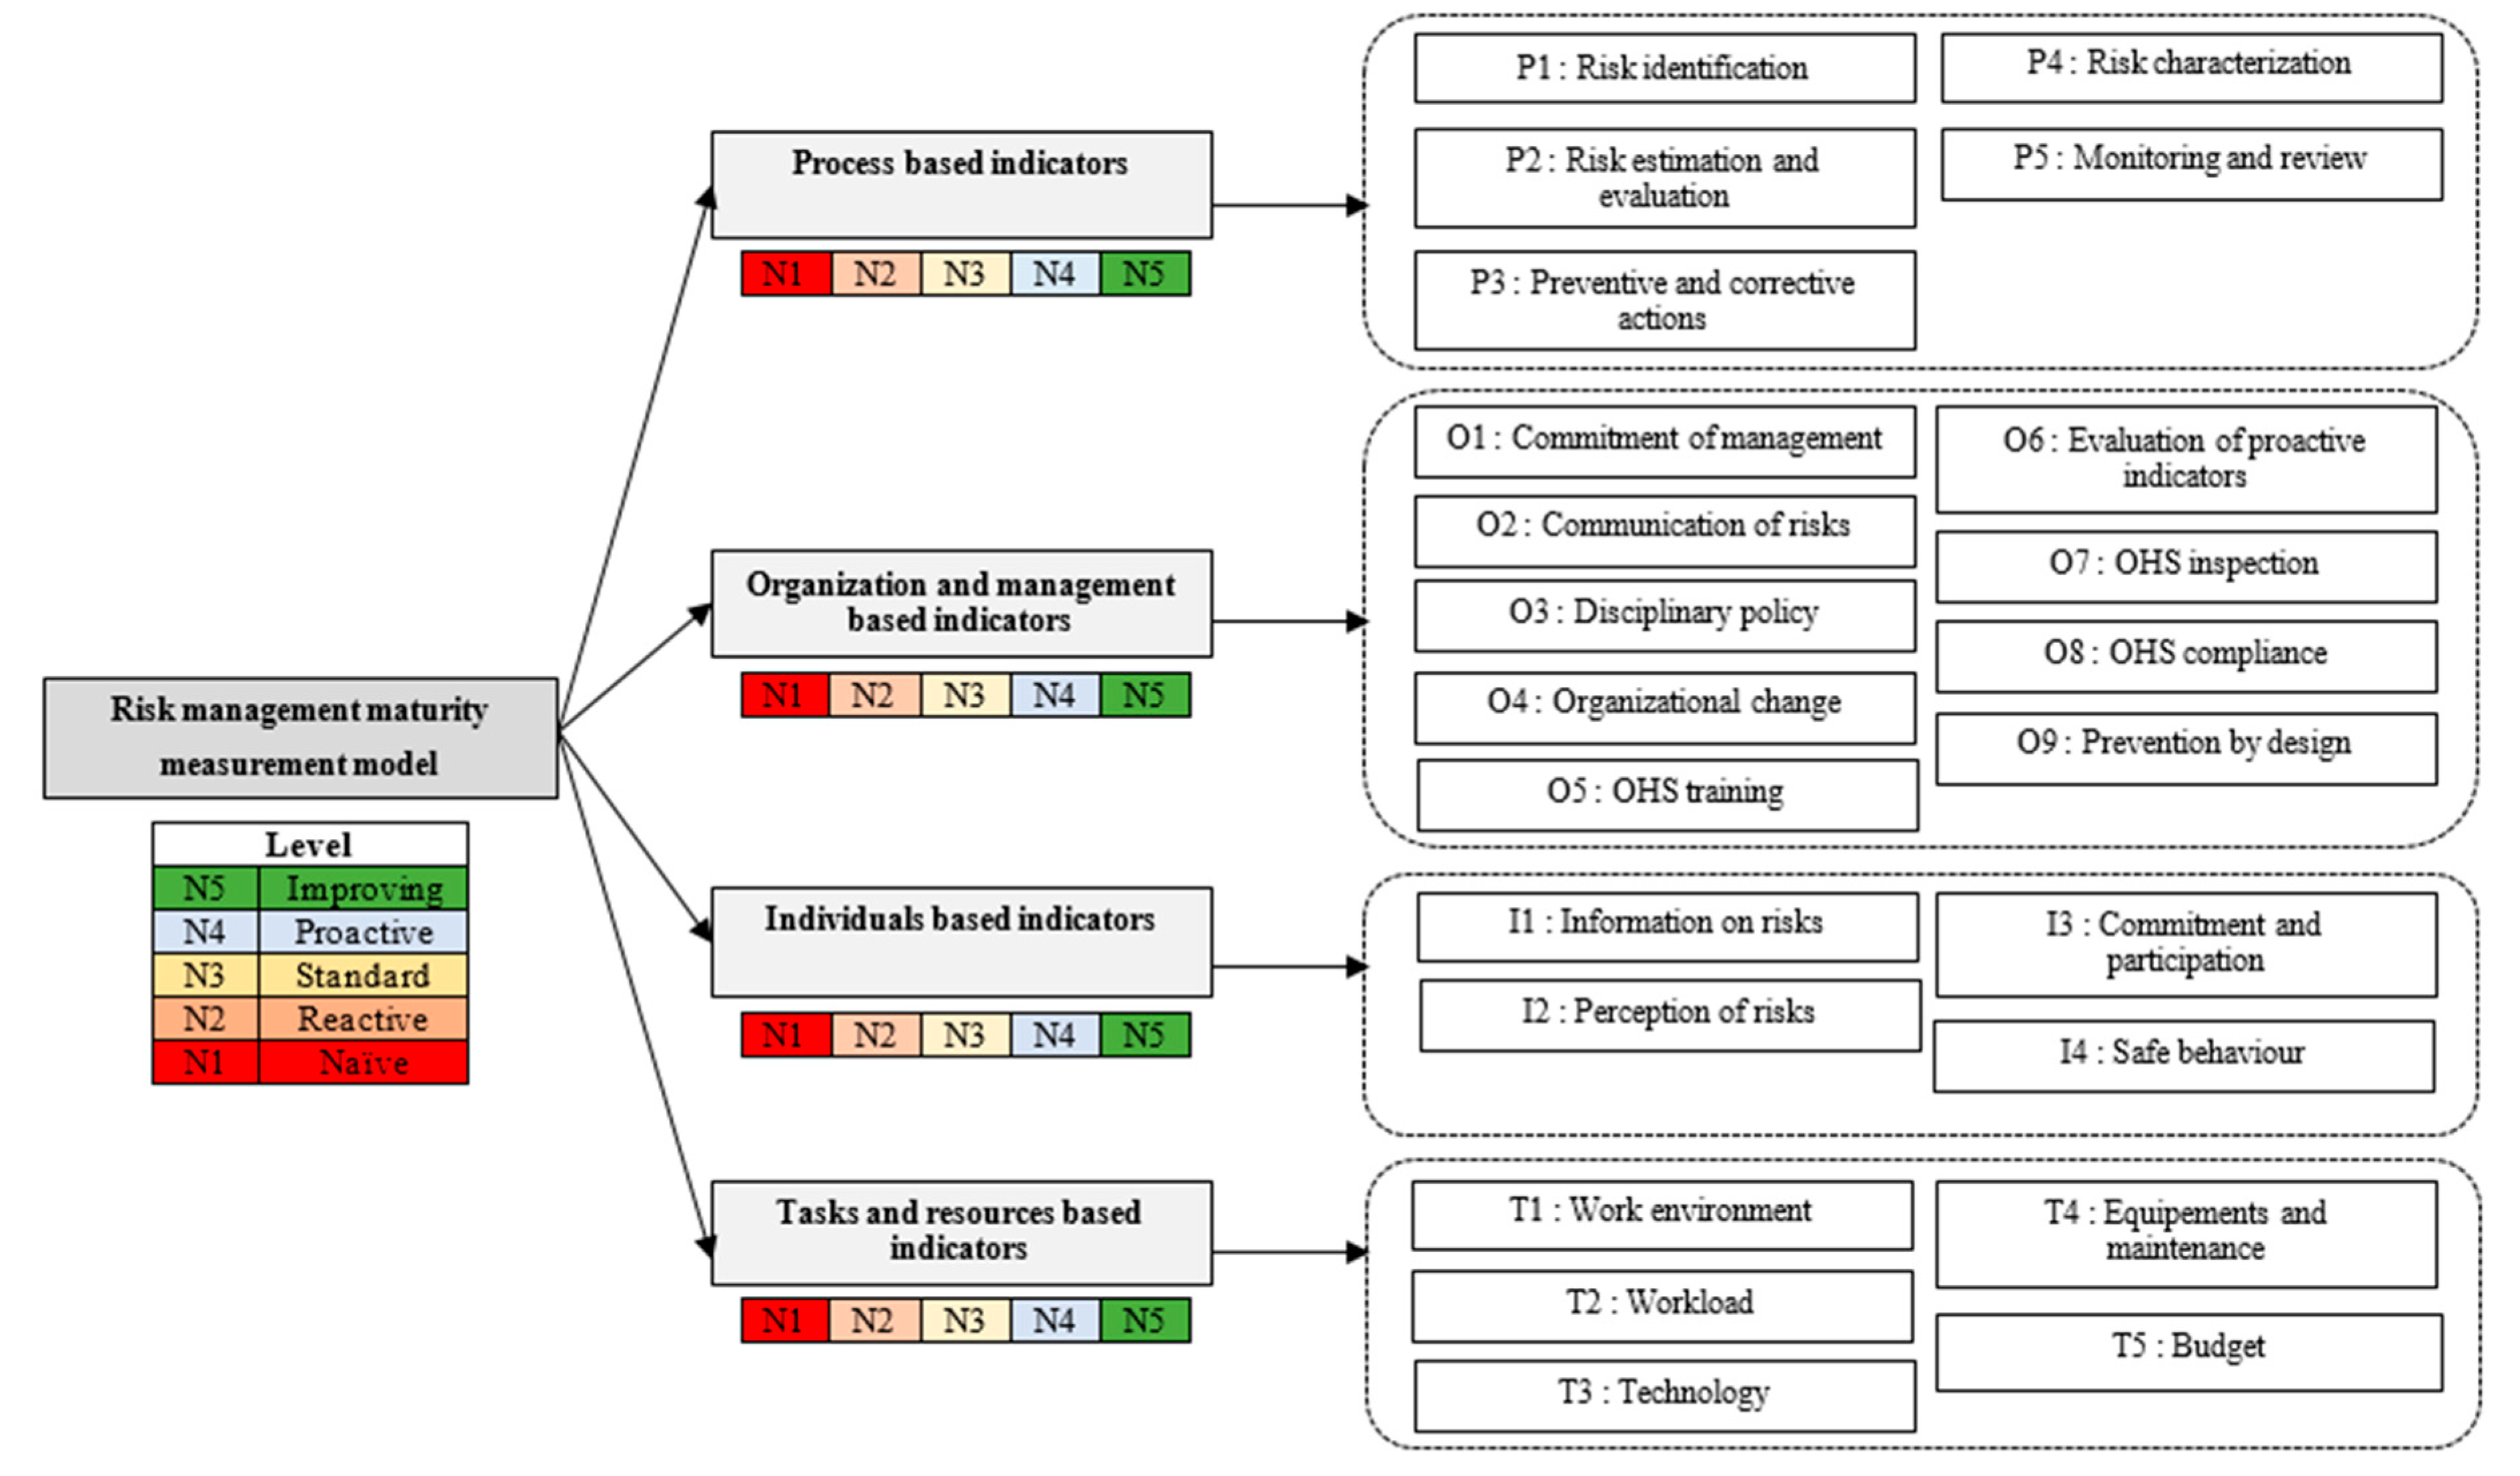
The indicators are shown grouped into the four main families in Figure 6. It is important to specify the frequency (annually, quarterly, etc.) of evaluation.
“Process based indicators” (Table 2) refers to quantification of OHS risk management activities, preventive actions, corrective actions, risk characterization by category and/or level (risk profiling) and finally monitoring and review. This latter activity allows overseeing of setting up and effective application of risk-reducing measures as well as ensuring that the results obtained contribute to achieving the objectives.
“Organization and management based indicators” (Table 3) refers to quantification of the role of management, particularly in terms of commitment in the deployment of risk management at all levels of the business, the communication of risks present in the work setting, OHS training for workers, recognition of good behavior, leadership, organizational and process changes, evaluation of the relevance of proactive indicators, carrying out inspections and checking OHS practice realities, compliance with OHS regulations and prevention by design.
“Individuals based indicators” (Table 4) refers to quantification of measures regarding information on OHS, perception of OHS risks by workers, worker involvement and participation with regard to OHS and behaviour in the workplace.
“Tasks and resources based indicators” (Table 5) groups quantification of the work environment danger level and situations potentially at risk and requiring permits, workload, the technological sophistication accessible to the company and use thereof to limit OHS risks, equipment use and preventive maintenance and finally the budget allotted to OHS.
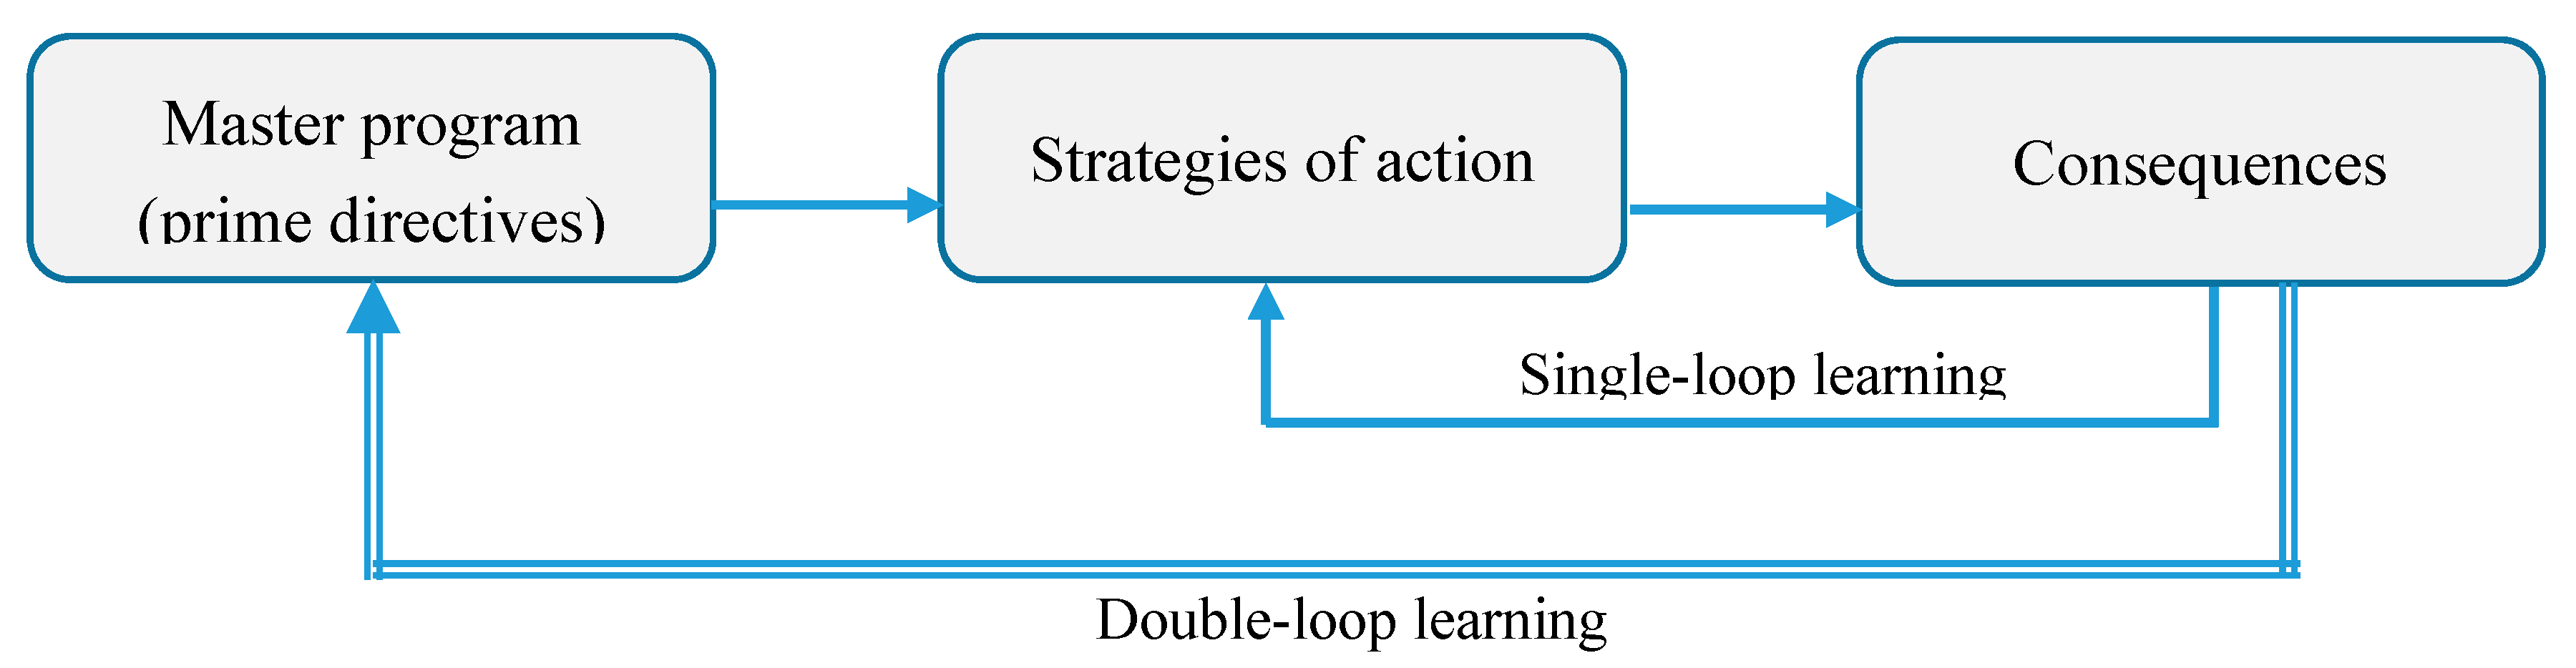
At this point, as mentioned in the research methodology section, we used maturity levels based on organizational learning theory. According to this theory, learning is deemed to have occurred when an organization detects and corrects an error in its management of OHS risks. The first step is devoted to error discovery, while the other steps take place when the error is corrected. As shown in Figure 7, there are at least two ways of correcting an error, including acting on the underlying behaviour (this action requires a single-loop learning) and acting on the management system, which is considered as a double-loop mode of learning [91].
These two types of learning and the definition of the five levels of maturity are listed in Table 6. The levels included in the preliminary model are the immature stage (N1), the mature stage (N5) and three intermediate stages. In order to make the model applicable, percentage intervals for each level (0 to 100%) and scores for each element of the corresponding family (weighted 1 to 5) need to be allotted.

5. Discussion

The first and principal goal of this research was to compile a list of measurable indicators of OHS risk management maturity that can be used in SME context. In view of the small number of studies focused on the SME context, we broadened the search criteria to include research articles and international standards that are not limited to this type of company. In fact, very few authors even specify what scale of business is the focus of their work. Furthermore, the literature retrieved is not limited to any particular sector or field of activity. The diversity and the comprehensiveness of the documents on which we based our research thus revealed both positive and negative aspects associated with evaluation of the risk management maturity of businesses in general.
Although the relevant indicators chosen are used in different industrial fields and for different sizes of business, we compiled our list with the intention of avoiding redundancy as much as possible and keeping those that can be used by SMEs. A measurable proactive indicator of risk management maturity should rest on a solid theoretical base. The context of use must also be taken into consideration in order to choose the most appropriate indicators. Choosing the indicators best adapted to the SME context is particularly challenging.
The second goal of this research was to develop a preliminary model of risk management maturity measurement based on the compilation of the selected indicators. These were grouped into four families with supporting examples of possible means of quantitative measurement. We consider the integration of indicators associated with good practices in prevention to represent true added value in the proposed model.

Limitations of this Research

To begin with, the developed list of OHS risk management maturity measurable indicators is not exhaustive. The limitations of the qualitative aspect of the proactive indicators also need to be considered. Both their implementation and their use are subject to major constraints. Next, it must be noted that the preliminary model developed suggests no particular formula either for weighting or for quantifying the indicators. This choice will give more flexibility to researchers and practitioners to develop mathematically supported tools specific to them and according to their vision. In this case, experts will be more able to adapt the proposed model to their context. Appropriate tools for enabling the indicators (e.g., a questionnaire) remain to be identified. Model examination and validation in the SME context will require case studies, after completing the development of the supporting mathematics. Validation will be possible only insofar as sufficient amounts of data are collected and found reliable based on validated tools and found to reflect accurately the reality of the risk management practices of the SMEs involved in the exercise.
Since this study is one of the first to look into how OHS risk management maturity could be evaluated in small-to-medium-sized industrial enterprises, several complementary studies are being planned in order to explore this research theme in the depth that it warrants, which will be only beneficial to the cause of preventing occupational injuries in several industrial sectors in Québec.
Finally, Web of Science (Clarivate Analytics) has not been used in this work.

6. Conclusions

This research was focused primarily on compiling a list of measurable indicators suitable for evaluating OHS risk management maturity specifically in small-to-medium-sized industrial enterprises. The integration of this list into a model of maturity measurement or evaluation represents value added to this review of the literature.
Concepts, methods, tools and models of risk management maturity (or performance) evaluation were analyzed in order to identify the most relevant measurable indicators. These indicators were then used to develop the framework for a preliminary model adapted for use in SMEs.
In spite of the limitations of its findings, the research undertaken here is a significant step towards helping managers of SMEs develop an in-house tool at minimal cost in support of their quest to improve their OHS performance.

Acknowledgments

The authors thank the Université du Québec à Trois-Rivières, Natural Sciences and Engineering Research Council of Canada (NSERC) and Association québécoise pour l’hygiène, la santé et la sécurité au travail (AQHSST) for their financial support.

Author Contributions

This paper is entirely based on the results of research conducted by Bilal Kaassis as part of his master’s project in industrial safety and hygiene under the direction of Professor Adel Badri. The paper has been written in collaboration between Bilal Kaassis and Adel Badri.

Conflicts of Interest

The authors declare no conflict of interest.

References

  1. International Labour Organization. Investigation of Occupational Accidents and Diseases: A Practical Guide for Labour Inspectors, 1st ed.; International Labour Office: Geneva, Switzerland, 2015. [Google Scholar]
  2. International Labour Organization. Small and Medium-Sized Enterprises and Decent and Productive Employment Creation, Report IV; International Labour Office: Geneva, Switzerland, 2015. [Google Scholar]
  3. Commission des Normes, de L’équité, de la Santé et de la Sécurité du Travail (CNESST). Statistiques Annuelles CNESST 2014. Available online: http://www.cnesst.gouv.qc.ca/Publications/200/Documents/DC200-1046web.pdf (accessed on 15 February 2017).
  4. Commission des Normes, de L’équité, de la Santé et de la Sécurité du Travail (CNESST); Institut de Recherche Robert-Sauvé en Santé et en Sécurité du Travail (IRSST). Prévention au Travail (La Sécurité Dans les Ateliers de Mécanique). 2016. Available online: http://www.cnesst.gouv.qc.ca/Publications/600/Documents/DC600-202-164web.pdf (accessed on 15 February 2017).
  5. Association des Commissions des Accidents du Travail du Canada (ACATC). Statistiques des Accidents Professionnels au Canada 2015. Available online: http://awcbc.org/fr/?page_id=381 (accessed on 6 September 2016).
  6. Mendeloff, J.; Nelson, C.; Ko, K.; Haviland, A. Small Businesses and Workplace Fatality Risk—An Exploratory Analysis. Available online: http://www.rand.org/content/dam/rand/pubs/technical_reports/2006/RAND_TR371.pdf (accessed on 20 August 2016).
  7. Holizki, T.; McDonald, R.; Gagnon, F. Patterns of underlying causes of work-related traumatic fatalities—Comparison between small and larger companies in British Columbia. Saf. Sci. 2015, 71, 197–204. [Google Scholar] [CrossRef]
  8. Masi, D.; Cagno, E. Barriers to OHS interventions in Small and Medium-sized Enterprises. Saf. Sci. 2015, 71, 226–241. [Google Scholar] [CrossRef]
  9. Brody, B.; Létourneau, Y.; Poirier, A. Le coût des accidents du travail: État des connaissances. Relat. Ind. 1990, 45, 94–117. [Google Scholar] [CrossRef]
  10. Commission des Normes, de L’équité, de la Santé et de la Sécurité du Travail (CNESST). Rapport Annuel Gestion SST. Available online: http://www.cnesst.gouv.qc.ca/Publications/400/Documents/DC-400-2032-8web.pdf (accessed on 15 October 2016).
  11. Lebeau, M.; Duguay, P. Les Coûts des Lésions Professionnelles, Une Revue de Littérature. Available online: http://www.irsst.qc.ca/media/documents/PubIRSST/R-676.pdf (accessed on 5 October 2016).
  12. Ressources Humaines et Développement des Compétences Canada. Accidents de Travail et Maladies Professionnelles au Canada, 1996–2008—Programme du Travail. Available online: http://www.travail.gc.ca/fra/sante_securite/pubs_ss/atmc.shtml (accessed on 6 December 2016).
  13. Abad, J.; Lafuente, E.; Vilajosana, J. An assessment of the OHSAS 18001 certification process: Objective drivers and consequences on safety performance and labour productivity. Saf. Sci. 2013, 60, 47–56. [Google Scholar] [CrossRef]
  14. International Organization for Standardization (ISO). ISO 31000: Risk Management—Principles and Guidelines, 1st ed.; International Organization for Standardization: Geneva, Switzerland, 2009. [Google Scholar]
  15. Canadian Standards Association (CSA). CAN/CSA-Z1000-14: Occupational Health and Safety Management; Canadian Standards Association: Mississauga, ON, Canada, 2014. [Google Scholar]
  16. British Standard Institute (BSI). OHSAS 18001: Occupational Health and Safety Management; British Standard Institute: London, UK, 2007. [Google Scholar]
  17. Sghaier, W.; Hergon, E.; Desroches, A. Global risk management. Transfus. Clin. Biol. 2015, 22, 158–167. [Google Scholar] [CrossRef] [PubMed]
  18. Meyssonnier, F.; Zawadzki, C. L’introduction du contrôle de gestion en PME. Revue Internationale P.M.E. Économie et Gestion de la Petite et Moyenne Entreprise 2008, 21, 69–92. [Google Scholar] [CrossRef]
  19. Becker, B.; Gerhart, B. The Impact of Human Resource Management on Organizational Performance: Progress and Prospects. Acad. Manag. J. 1996, 39, 779–801. [Google Scholar] [CrossRef]
  20. Legg, S.J.; Olsen, K.B.; Laird, I.S.; Hasle, P. Managing safety in small and medium enterprises. Saf. Sci. 2015, 71, 189–196. [Google Scholar] [CrossRef]
  21. International Labor Office. Guidelines on Occupational Safety and Health Management Systems (ILO-OSH/ISBN 92-2-111634-4); International Labor Office: Geneva, Switzerland, 2001. [Google Scholar]
  22. Mazars. Management des Risques—Enquête Gestion des Risques 2007. Available online: https://www.mazars.fr/Accueil/News/Publications/Enquetes-et-Etudes/Enquete-sur-la-gestion-des-risques (accessed on 20 July 2017).
  23. Baldock, R.; James, P.; Smallbone, D.; Vickers, I. Influences on Small-Firm Compliance-Related Behaviour. Available online: http://0-epc-sagepub-com.brum.beds.ac.uk/content/24/6/827.full.pdf+html (accessed on 18 September 2016).
  24. Reinhold, K.; Järvis, M.; Tint, P. Practical tool and procedure for workplace risk assessment: Evidence from SMEs in Estonia. Saf. Sci. 2015, 71, 282–291. [Google Scholar] [CrossRef]
  25. Unnikrishnan, S.; Iqbal, R.; Singh, A.; Nimkar, I.M. Safety management practices in small and medium enterprises in India. Saf. Health Work 2015, 6, 46–55. [Google Scholar] [CrossRef] [PubMed]
  26. Laird, I.; Hasle, P.; Olsen, K.; Harris, L.A.; Legg, S.; Perry, M.J. Utilising the characteristics of small enterprises to assist in managing hazardous substances in the workplace. Int. J. Workplace Health Manag. 2011, 4, 140–163. [Google Scholar] [CrossRef]
  27. Cassell, C.; Nadin, S.; Older Gray, M. The use and effectiveness of benchmarking in SMEs. Benchmark. Int. J. 2001, 8, 212–222. [Google Scholar] [CrossRef]
  28. Kaplan, R.S.; Norton, D.P. The Balanced Scorecard: Translating Strategy into Action; Harvard Business Press: Boston, MA, USA, 1996; p. 231. [Google Scholar]
  29. Kongsvik, T.; Kjøs Johnsen, S.Å.; Sklet, S. Safety climate and hydrocarbon leaks: An empirical contribution to the leading-lagging indicator discussion. J. Loss Prev. Process Ind. 2011, 24, 405–411. [Google Scholar] [CrossRef]
  30. Hale, A. Why Safety Performance Indicators? Saf. Sci. 2009, 47, 479–480. [Google Scholar] [CrossRef]
  31. Moriarty, J.P.; Smallman, C. En route to a theory of benchmarking. Benchmark. Int. J. 2009, 16, 484–503. [Google Scholar] [CrossRef]
  32. Wendler, R. The maturity of maturity model research: A systematic mapping study. Inf. Softw. Technol. 2012, 54, 1317–1339. [Google Scholar] [CrossRef]
  33. Jia, G.; Ni, X.; Chen, Z.; Hong, B.; Chen, Y.; Yang, F.; Lin, C. Measuring the maturity of risk management in large-scale construction projects. Autom. Constr. 2013, 34, 56–66. [Google Scholar] [CrossRef]
  34. Cienfuegos, I. Developing a Risk Management Maturity Model—A Comprehensive Risk Maturity-Model for Dutch Municipalities. Ph.D. Thesis, University of Twente, Enschede, The Netherlands, 2013. [Google Scholar]
  35. Argyris, C.; Schön, A. L’apprentissage Organisationnel, Théorie, Méthode et Pratique; Addison-Wesley: Reading, MA, USA, 1978. [Google Scholar]
  36. Min, Ho.; Min, H. Cross-cultural competitive benchmarking of fast-food restaurant services. Benchmark. Int. J. 2013, 20, 212–232. [Google Scholar] [CrossRef]
  37. Wang, K.-J.; Hong, W.-C. Competitive advantage analysis and strategy formulation of airport city development—The case of Taiwan. Transp. Policy 2011, 18, 276–288. [Google Scholar] [CrossRef]
  38. Watson, G. Strategic Benchmarking: How to Rate Your Company’s Performance against the World’s Best; Research Technology Management; J. Wiley & Sons: New York, NY, USA, 1993; Volume 36, 288p. [Google Scholar]
  39. Wynn, L.M. Highlights of an industry benchmarking study: Health and safety excellence initiatives. J. Chem. Health Saf. 2008, 15, 22–24. [Google Scholar] [CrossRef]
  40. Fang, D.; Huang, X.; Hinze, J. Benchmarking studies on construction safety management in China. J. Constr. Eng. Manag. 2004, 130, 424–432. [Google Scholar] [CrossRef]
  41. Zairi, M. Benchmarking: The Best Tool for Measuring Competitiveness. Benchmark. Qual. Manag. Technol. 1994, 1, 11–24. [Google Scholar] [CrossRef]
  42. Zairi, M.; Baidoun, S. Understanding the Essentials of Total Quality Management—A Best Practice Approach, Part 2. Available online: http://citeseerx.ist.psu.edu/viewdoc/download?doi=10.1.1.195.7364&rep=rep1&type=pdf (accessed on 13 September 2016).
  43. Deguil, R. Mapping Entre un Référentiel D’exigences et un Modèle de Maturité: Application à L’industrie Pharmaceutique. Ph.D. Thesis, Université de Toulouse, Toulouse, France, 2008. [Google Scholar]
  44. Fraser, M.; Moultrie, J.; Gregory, M. The use of maturity models/grids as a tool in assessing product development capability. In Proceedings of the 2002 IEEE International Engineering Management Conference, Cambridge, UK, 18–20 August 2002; Centre for Technology Management, Institute for Manufacturing, University of Cambridge: Mill Lane, Cambridge, UK, 2002. [Google Scholar]
  45. Crosby, P.B. La Qualité, C’est Gratuit: L’art et la Manière D’obtenir la Qualité; Economica: Paris, France, 1986. [Google Scholar]
  46. Ferchichi, A.; Bourey, J.-P.; Bigand, M. Contribution à L’intégration des Processus Métier—Application à la Mise en Place d’un Référentiel Qualité Multi-Vues. Ph.D. Thesis, École Centrale de Lille, Villeneuve-d’Ascq, France, 2008. [Google Scholar]
  47. Project Management Institute. Organization Project Management Maturity Model (OPM3) Knowledge Foundation, Project Management Institute (PMI®); Project Management Institute: Pittsburgh, PA, USA, 2003. [Google Scholar]
  48. Sahibudin, S.; Sharifi, M.; Ayat, M. Combining ITIL, COBIT and ISO/IEC 27002 in Order to Design a Comprehensive IT Framework in Organizations. In Proceedings of the 2008 Second Asia International Conference on Modelling & Simulation (AMS), Washington, DC, USA, 13–15 May 2008; pp. 749–753. [Google Scholar] [CrossRef]
  49. Hillson, D. Towards a risk maturity model. Int. J. Proj. Bus. Risk Manag. 1997, 1, 35–45. [Google Scholar]
  50. Arrow, J. Risk Intelligence and Measuring Excellence in Project Risk Management. AACE International Transactions; RISK.845.2 Risk Intelligence and Measuring Excellence in Project Risk Management; AACE International: San Antonio, TX, USA, 2012. [Google Scholar]
  51. Chapman, R.J. Risk Maturity Models. Simple Tools and Techniques for Enterprise Risk Management, 2nd ed.; John Wiley & Sons, Ltd.: London, UK, 2011. [Google Scholar]
  52. Yeo, K.T.; Ren, Y. Risk management capability maturity model for complex product systems (CoPS) projects. Syst. Eng. 2009, 12, 275–294. [Google Scholar] [CrossRef]
  53. Zou, P.X.W.; Chen, Y.; Chan, A.T.-Y. Understanding and Improving Your Risk Management Capability Assessment Model for Construction Organizations. J. Constr. Eng. Manag. 2010, 136, 854–863. [Google Scholar] [CrossRef]
  54. Filho, A.P.G.; Andrade, J.C.S.; Oliveira Marinho, M.M. A safety culture maturity model for petrochemical companies in Brazil. Saf. Sci. 2010, 48, 615–624. [Google Scholar] [CrossRef]
  55. Reason, J. Managing the Risks of Organizational Accidents. Available online: https://books.google.fr/books?id=UVCFCwAAQBAJ (accessed on 9 December 2016).
  56. Hudson, P. Applying the Lessons of High Risk Industries to Health Care. Available online: http://0-qualitysafety-bmj-com.brum.beds.ac.uk/content/12/suppl_1/i7.full.pdf+html (accessed on 15 September 2016).
  57. Hudson, P.T.W. Safety management and safety culture: The long, hard and winding road. In Occupational Health and Safety Management Systems; Pearse, W., Gallagher, C., Bluff, L., Eds.; Crown Content: Melbourne, Australia, 2001. [Google Scholar]
  58. Parker, D.; Lawrie, M.; Hudson, P. A framework for understanding the development of organisational safety culture. Saf. Sci. 2006, 44, 551–562. [Google Scholar] [CrossRef]
  59. Fleming, M. Safety Culture Maturity Model; Prepared by The Keil Centre for the Health and Safety Executive, Offshore Technology Report 2000/049; Offshore Technology Report-Health and Safety Executive OTH: Norwich, UK, 2000. [Google Scholar]
  60. Mayer, J.; Fagundes, L.L. A Model to Assess the Maturity Level of the Risk Management Process in Information Security. Available online: http://0-ieeexplore-ieee-org.brum.beds.ac.uk/stamp/stamp.jsp?arnumber=5195935 (accessed on 13 September 2016).
  61. Goncalves, A.P.; Kanegae, G.; Leite, G. Safety Culture Maturity and Risk Management Maturity in Industrial Organizations. Available online: http://www.abepro.org.br/biblioteca/icieom2012_submission_131.pdf (accessed on 15 November 2016).
  62. International Nuclear Safety Advisory Group. Key Practical Issues in Strengthening Safety Culture. Available online: http://www-pub.iaea.org/MTCD/publications/PDF/Pub1137_scr.pdf (accessed on 5 September 2016).
  63. Tee, K.F.; Rick Edgeman, P.A.N.D. Identifying critical performance indicators and suitable partners using a benchmarking template. Int. J. Prod. Perform. Manag. 2015, 64, 434–450. [Google Scholar] [CrossRef]
  64. Institut National de L’environnement Industriel et des Risques (INERIS). Pilotage de la Sécurité par les Indicateurs de Performance—Guide à L’attention des ICPE. Available online: http://www.ineris.fr/centredoc/guide-ineris-sips-1459850449.pdf (accessed on 5 September 2016).
  65. Voyer, P. Tableaux de Bord de Gestion et Indicateur de Performance, 2nd ed.; Presses de l’Université du Québec: Sainte-Foy, QC, Canada, 2002; p. 446. [Google Scholar]
  66. Conseil du Trésor du Québec. Guide sur les Indicateurs. Available online: https://www.tresor.gouv.qc.ca/fileadmin/PDF/publications/guide_indicateur.pdf (accessed on 10 September 2016).
  67. Meek, V.L.; van der Lee, J.J. Performance Indicators for Assessing and Benchmarking Research Capacities in Universities. Available online: https://minerva-access.unimelb.edu.au/handle/11343/28907 (accessed on 8 September 2016).
  68. Roy, M.; Desmarais, L.; Cadieux, J. Améliorer la Performance en SST: Les Résultats vs les Prédicteurs. Available online: https://pistes.revues.org/3214 (accessed on 25 June 2016).
  69. Commission de la Santé et de la Sécurité du Travail (CNESST). Pour Comprendre le Régime Québécois de Santé et de Sécurité du Travail. Available online: http://bibvir1.uqac.ca/archivage/000588663.pdf (accessed on 16 August 2016).
  70. Roy, M.; Bergeron, S.; Fortier, L. Développement D’instruments de Mesure de Performance en Santé et Sécurité du Travail à L’intention des Entreprises Manufacturières Organisées en Équipes Semi-Autonomes de Travail. Available online: https://www.usherbrooke.ca/ceot/fileadmin/sites/ceot/documents/Publications/Projets_de_recherche/R-357_IRSST.pdf (accessed on 13 June 2016).
  71. Chemical Safety Board (CSB). US Chemical Safety and Hazard Investigation Board, Investigation Report, Refinery Explosion and Fire; Report No. 2005-04-ITX; Chemical Safety Board: Texas City, TX, USA, 2007. [Google Scholar]
  72. Knegtering, B.; Pasman, H.J. Safety of the process industries in the 21st century—A changing need of process safety management for a changing industry. J. Loss Prev. Process Ind. 2008, 22, 162–168. [Google Scholar] [CrossRef]
  73. Government of Alberta. Leading Indicators for Workplace Health and Safety—A User Guide. Available online: http://work.alberta.ca/documents/ohs-best-practices-BP019.pdf (accessed on 5 June 2017).
  74. USA National Safety Council. Elevating EHS Leading Indicators—Cambpell Institut. Available online: http://www.nsc.org/CambpellInstituteandAwardDocuments/WP-From-Defining-to-Designing.pdf (accessed on 2 February 2017).
  75. Paltrinieri, N.; Øien, K.; Cozzani, V. Assessment and comparison of two early warning indicator methods in the perspective of prevention of atypical accident scenarios. Reliab. Eng. Syst. Saf. 2012, 108, 21–31. [Google Scholar] [CrossRef]
  76. Wu, X.; Liu, Q.; Zhang, L.; Skibniewski, M.J.; Wang, Y. Prospective safety performance evaluation on construction sites. Accid. Anal. Prev. 2015, 78, 58–72. [Google Scholar] [CrossRef] [PubMed]
  77. Zwetsloot, G.I.; Aaltonen, M.; Wybo, J.-L.; Saari, J.; Kines, P.; Beeck, R.O.D. The case for research into the zero accident vision. Saf. Sci. 2013, 58, 41–48. [Google Scholar] [CrossRef]
  78. Nordlöf, H.; Wiitavaara, B.; Winblad, U.; Wijk, K.; Westerling, R. Safety culture and reasons for risk-taking at a large steel-manufacturing company: Investigating the worker perspective. Saf. Sci. 2015, 73, 126–135. [Google Scholar] [CrossRef]
  79. Skogdalen, J.E.; Vinnem, J.E. Combining precursor incidents investigations and QRA in oil and gas industry. Reliab. Eng. Syst. Saf. 2012, 101, 48–58. [Google Scholar] [CrossRef]
  80. Arocena, P.; Núñez, I.; Villanueva, M. The impact of prevention measures and organisational factors on occupational injuries. Saf. Sci. 2008, 46, 1369–1384. [Google Scholar] [CrossRef]
  81. Euzenat, D.; Mortezapouraghdam, M. Les changements d’organisation du travail dans les entreprises: Quelles conséquences sur les accidents du travail des salariés? Econ. Stat. 2016, 486, 129–147. [Google Scholar] [CrossRef]
  82. Greenan, N.; Mairesse, J. Les changements organisationnels, l’informatisation des entreprises et le travail des salaries—Un exercice de mesure à partir de données couplées entreprises/salariés. Rev. Écon. 2006, 57, 1137–1175. [Google Scholar] [CrossRef]
  83. Bellemare, M.; Trudel, L.; Ledoux, É.; Montreuil, S.; Marier, M.; Laberge, M.; Godi, M.-J. Intégration de la Prévention des TMS dès la Conception d’un Aménagement—Le cas des Bibliothèques Publiques; l’Institut de Recherche Robert-Sauvé en Santé et en Sécurité du Travail: Montreal, QC, Canada, 2005; p. 210. [Google Scholar]
  84. Commission de la Santé et de la Sécurité du Travail (CNESST). Prévention des Phénomènes Dangereux D’origine Mécanique (2008). Available online: https://www.irsst.qc.ca/media/documents/PubIRSST/RG-552.pdf (accessed on 16 August 2016).
  85. International Organization for Standardization. ISO 12100: Safety of Machinery—General Principles for Design—Risk Assessment and Risk Reduction, 1st ed.; International Organization for Standardization: Geneva, Switzerland, 2010. [Google Scholar]
  86. Podgórski, D. Measuring operational performance of OHS management system—A demonstration of AHP-based selection of leading key performance indicators. Saf. Sci. 2015, 73, 146–166. [Google Scholar] [CrossRef]
  87. Reason, J. Safety paradoxes and safety culture. Inj. Control Saf. Promot. 2000, 7, 3–14. [Google Scholar] [CrossRef]
  88. Antonsen, S.; Skarholt, K.; Ringstad, A.J. The role of standardization in safety management—A case study of a major oil & gas company. Saf. Sci. 2012, 50, 2001–2009. [Google Scholar] [CrossRef]
  89. Commission des Normes, de L’équité, de la Santé et de la Sécurité du Travail (CNESST). Des Métiers Transformés par les Technologies (2014b). Available online: http://www.cnesst.gouv.qc.ca/Publications/600/Documents/DC600_410_40web.pdf (accessed on 15 April 2017).
  90. Institut de Recherche Robert-Sauvé en Santé et en Sécurité du Travail (IRSST). Étude Exploratoire des Facteurs de la Charge de Travail Ayant un Impact sur la Santé et la Sécurité (2010). Available online: http://www.irsst.qc.ca/media/documents/pubirsst/R-668.pdf (accessed on 7 November 2016).
  91. Argyris, C.; Moingeon, B.; Ramanantsoa, B. Savoir Pour Agir-Surmonter les Obstacles à L’apprentissage Organisationnel; Publiée Originally in the USA by Jossey-Bass; Jossey-Bass: San Francisco, CA, USA, 1993. [Google Scholar]
Figure 1. Principal elements of the research problem. OHS: occupational health and safety; SME: small-to-medium-sized enterprise.
Safety 04 00005 g001
Figure 2. Distribution of risk management maturity indicators in the literature. IS: Information systems.
Safety 04 00005 g002
Figure 3. An example of four levels of risk management maturity, Adapted from Arrow [50].
Safety 04 00005 g003
Figure 4. The capability component of the risk management maturity system (RMMS) model, Adapted from Jia et al. [33].
Safety 04 00005 g004
Figure 5. Focus and levels of application of indicators used for measuring risk management maturity.
Safety 04 00005 g005
Figure 6. Preliminary model of OHS management maturity measurement.
Safety 04 00005 g006
Figure 7. Organizational learning (single or double loop).
Safety 04 00005 g007
Table 1. The principal proactive measurable indicators in occupational health and safety (OHS).
Proactive IndicatorExamples of MeasurementReferences
Identification of OHS hazards– Number of hazards uncovered[14,17,33,52]
– Number of incident reports
OHS risk estimation and evaluation– Number of estimations and evaluations carried out and validated[23,24,33,52]
Preventive and corrective actions– Number of preventive and corrective actions recommended[14,17,24]
Risk characterization or profiling– Number of potential risks, by level of seriousness[33,74]
– Number of risks per category
Disciplinary policy or program– Number of disciplinary actions[75,76,77]
Communication of OHS risks– Number of OHS meetings[20,33,54,59,76,78,79]
– Number of OHS reports communicated
Monitoring and review– Number of re-evaluations of OHS risk management activities[14]
Perception of OHS risks– Number and frequency of inquiries into staff perception of OHS[25,54,59,76,77]
OHS training– Number of hours of training[23,25,33,54,59]
Information on OHS risksNot specified[8,33]
Organizational/process changes– Number of new organizational practices implemented[80,81,82]
– Frequency of certification and audits
Prevention by designNot specified[83,84,85]
Commitment of managementNot specified[24,59,79]
Worker commitment and participation– Percent response to questionnaires [24,59,78,86]
OHS-related behaviour– Number of observations of unsafe or deviant actions[78,87]
Compliance with OHS guidelines or regulations– Number of penalties for non-compliance[8,23,40,54,88]
OHS inspection – Number of inspections carried out[25,40,79,86]
Equipment and preventive maintenanceNot specified[25,79]
Work setting and situations potentially at riskNot specified[7,8,20,24,79]
Evaluation of proactive indicatorsNot specified[74,79,86]
Technology– Degree of integration of technology into the processes[33,89]
Budget– The amount allotted to OHS[33,40,59]
Workload– Evaluation of workload[90]
Table 2. Measurable indicators of risk management maturity based on process-based indicators.
CodeIndicatorMeasurement
P1Identification of OHS risks (or hazards) – Number of hazards identified
– Number of incident reports filed
– Number of inspections carried out
– Number of persons trained in hazard identification
P2OHS risk estimation and evaluation– Number of estimations/evaluations carried out and validated
– Risks identified per level
P3Preventive and corrective actions– Number of preventive and corrective actions recommended
– Number of preventive and corrective actions found effective (audited and validated)
– Number of preventive actions per type of hazard (e.g., closed spaces, etc.)
– Number of corrective actions prioritized per level of hazard (e.g., severe and minor)
– New number of hazards reported after implementation of preventive and corrective measures
P4Risk characterization– Correlation between proactive and reactive indicators 
– Number of potential hazards, by severity 
– Number of hazards per specific category (e.g., closed spaces, heights, etc.)
P5Monitoring and review– Number of new evaluations of OHS risks
– Effectiveness of corrective actions implemented
Table 3. Measurable indicators of risk management maturity based on organization and management-based indicators.
CodeIndicatorExamples of Measurement
O1Commitment of management– Number of suggestions implemented by managers
– Percentage of positive OHS evaluations carried out by managers in the design phase
– Number (percentage) of managers participating in OHS meetings
O2Communication of risks (or hazards)– Number and frequency of OHS meetings
– Number of OHS information posters
O3Leadership and disciplinary policy– Number of OHS-related disciplinary actions
– Number of recognitions of safe behaviours
O4Organizational and/or process changes– Number of new OHS organizational practices implemented
– Frequency of OHS audits
O5OHS training– Hours of training/hours of work ratio
– Number of training sessions
O6Evaluation of proactive indicators– Number of evaluations correlating predictive measures with OHS results
– Number of preventive actions for reaching OHS objectives
O7OHS inspection– Number of workplace inspections
– Percent compliance (and/or non-compliance) with applicable regulations and standards
O8OHS compliance– Number of in-house regulatory inspections
– Number of compliance inspections carried out by external evaluators
O9Prevention by design– Number of plans or models that pass safety testing or validation
Table 4. Measurable indicators of risk management maturity based on individuals-based indicators.
CodeIndicatorExamples of Measurement
I1Information on OHS risks or hazards– Number of injuries attributable to lack of information
– Number of consultations of the OHS intranet by managers
I2Perception of OHS risks– Number, frequency and results of surveys or questionnaires on the perception of OHS in the organization
I3Worker commitment and participation– Number (percentage) of workers involved in OHS activities (inspection, training, etc.)
I4Safe behaviour– Number of observations of behaviour indicating mindfulness (or lack thereof) of OHS
– Observed ratio of high-risk to low-risk behaviours
Table 5. Measurable indicators of risk management maturity based on tasks and resources-based indicators.
CodeIndicatorExamples of Measurement
T1Work environment, situations potentially at risk– Number of evaluations of written procedures relating to OHS risks
– Number of managers trained regarding specific tasks (e.g., closed spaces, work at heights, etc.)
T2Workload– Hours of overtime per week
– Frequency of measurement of workload
T3Technology– Level of integration of risk management technology
– Level of integration of the technology into the processes
T4Equipment and preventive maintenance– Percentage of time designated as maintenance time
– Number of injuries attributable to equipment failures
T5Budget– Budget allotted to OHS
– Ratio of OHS allotment to overall budget
Table 6. Levels of OHS risk management maturity [32].
TypeLevel of MaturityDefinition
Single-loop learning1NaïveThe company learns little from its errors and is not conscientious with regard to OHS.
2ReactiveThe company learns from its errors but lacks formalized and standardized methods for managing situations at risk.
3StandardThe company learns from its errors and has a formalized and standardized risk management process intended to avoid repetition of problems.
4ProactiveThe company carries out continued analysis and evaluation of OHS performance and responds in order to reduce or eliminate risks.
Double-loop learning5AmeliorativeThe company is continually improving its management of OHS risks. It has well-rooted OHS values, strategy, standards and methodologies in place.

