Do Online Bicycle Routing Portals Adequately Address Prevalent Safety Concerns?


1
Department of Geoinformatics, University of Salzburg, 5020 Salzburg, Austria
2
Fort Lauderdale Research and Education Center, University of Florida, Davie, FL 33314, USA
*
Author to whom correspondence should be addressed.
Safety 2018, 4(1), 9; https://0-doi-org.brum.beds.ac.uk/10.3390/safety4010009
Submission received: 17 November 2017
/
Revised: 28 February 2018
/
Accepted: 3 March 2018
/
Published: 6 March 2018
Abstract
:Safety concerns are among the most prevalent deterrents for bicycling. The provision of adequate bicycling infrastructure is considered as one of the most efficient means to increase cycling safety. However, limited public funding does not always allow agencies to implement cycling infrastructure improvements at the desirable level. Thus, bicycle trip planners can at least partly alleviate the lack of adequate infrastructure by recommending optimal routes in terms of safety. The presented study provides a systematic review of 35 bicycle routing applications and analyses to which degree they promote safe bicycling. The results show that most trip planners lack corresponding routing options and therefore do not sufficiently address safety concerns of bicyclists. Based on these findings, we developed recommendations on how to better address bicycling safety in routing portals. We suggest employing current communication technology and analysis to consider safety concerns more explicitly.
1. Introduction
Although public administrations around the world have started to adopt comprehensive bicycle promotion strategies over the recent years, safety concerns are still among the most prevalent barriers for a further increase of utilitarian bicycling [1]. There is strong evidence from the literature that dedicated bicycle infrastructure is the best way to address this objective [2,3,4] and mitigate subjective safety threats [5]. However, many cities still fall short of providing connected bicycle infrastructure within their road network [6,7]. Under such circumstances, information about bicycle-friendly connections can partly alleviate the lack of adequate infrastructure, support existing bicyclists in their wayfinding efforts and contribute to a better awareness of safety in bicycling.
Through the ubiquitous availability of the Internet and advances in web and communication technology, information provision in general and decision support systems in particular have become integral elements of mobility planning and management. The integration of GNSS (Global Navigation Satellite System) sensors in mobile devices and their permanent access to the Internet paved the way for bicycling routing portals and navigation applications, which have become part of comprehensive bicycle promotion strategies [8]. It is widely acknowledged that bicycle promotion strategies benefit from user-tailored information and communication [9]. Schweizer and Rupi [10] argue, in line with Pucher et al. [11] and Lanzendorf and Busch-Geertsema [12], for various complementary “soft measures”, such as educational and promotional activities, which include information provision and go along with necessary investments in adequate infrastructure.
In this study, we hypothesize that existing routing portals for bicyclists lack safety-related routing options and routing information. We further argue that such information provision could supplement investments in physical infrastructure, address prevailing safety concerns and facilitate better-informed decisions on mode and route choice.
The remainder of the paper is structured as follows: Section 2 provides background information on bicycle routing as it pertains to the subsequent study. Section 3 describes the applied method and study design. Results are presented in Section 4 and discussed in Section 5. Conclusions are drawn in a final section.
2. Bicycle Routing
Bicycle routing applications provide pre-trip information for bicyclists, often combined with on-trip navigation. In some cases, these applications are embedded in broader information and communication portals, covering several modes and aspects of mobility. There is a lively debate in the literature about the impact of such information on people’s mobility behavior [13,14,15]. However, most of the discussion focuses on mode choice and less on route choice. In the context of this paper, only the latter is relevant. However, we acknowledge evidence for the effect of routing information on peoples’ mode choice.
2.1. Route Choice
Route selection problems are complex tasks since they involve a set of route options from which a traveler needs to choose an alternative under consideration of several evaluation criteria. Selection procedures are often distinguished into compensatory and noncompensatory. Compensatory selection procedures take into account trade-offs between performances on different evaluation criteria (e.g., between bicycling distance and proportion of route along a scenic lake), whereas under a non-compensatory decision rule a poor criterion’s outcome of an alternative (e.g., stairs along a route alternative) cannot be offset by another criterion’s good outcome [16]. Such criteria that impose strict limitations on the set of decision alternatives are often referred to as eliminatory constraints. An earlier desktop usability study on bicycle route planners showed that bicyclists prefer user interfaces that support compensatory decision making, e.g., allowing to set a preference for safe routes, and at the same time setting eliminatory constraints, e.g., avoid routes with tunnels [17].
Route preferences of bicyclists depend on several parameters, such as trip purpose, physical constitution, age or gender. Also, since bicyclists are more directly exposed to the elements than car drivers the range of identified route selection criteria observed for bicyclists is comprehensive. An internet survey identified a total of 35 different route selection criteria for bicyclists [18]. In a subsequent study, participants were asked to group these 35 criteria into anywhere between three and six classes. Results revealed that a four cluster solution consisting of the higher level criteria “fast”, “safe”, “simple” and “attractive” was the most prominent grouping [19]. Winters et al. [20] evaluated 73 individual bicycling motivators (e.g., beautiful scenery, daylight travel) and deterrents (e.g., carry heavy items, slick surface) from different sources. These 73 items were subsequently grouped into 15 factors, some of which closely resemble the essence of the four clusters identified in Hochmair [19]. Overlapping factors are safety (“safe”), intersection and traffic signals (“fast”, “simple”), and pleasant route conditions (“attractive”). Some of these 73 evaluated items can be linked to physical road conditions that are preferred by bicyclists, such as buffered bike lanes, or flat routes. Broach et al. [21] identified several significant indicators from recorded GPS tracks that affect route choice for bicyclists, including short and direct connections (corresponds with “fast”), low turn frequency (“simple”), and signalized crossings, separated bike paths and low traffic volume (“safe”). In another similar study, the analysis of GPS tracking data from smartphones revealed cycling preferences for bicycle lanes and bike paths (“safe”), and aversion against slopes (“fast”) and cycling against one-ways (“safe”) [22]. Krenn et al. [23] identified a distinct preference for flat and green areas (“attractive”) and bicycle pathways (“safe”), but avoidance of traffic lights and crossings (“fast”). Based on crowd-sourced trajectories uploaded to the GPSies cycling portal, Sultan et al. [24] revealed cycling preference for route with less tumultuous traffic (“safe”) and passing through social spaces, such as a city center (“attractive”). Many of these parameters are proxies for the stress level of road networks. Lowry et al. [25] for instance, use the concept of low-stress networks in their accessibility analysis approach. Findings from London’s bicycle sharing scheme are in line with the aforementioned studies, but with a clear gender difference. Female bicyclists tend to prefer routes through parks and green spaces [26], which can be related to the aggregated routing criterion “attractive”.
2.2. Route Optimization
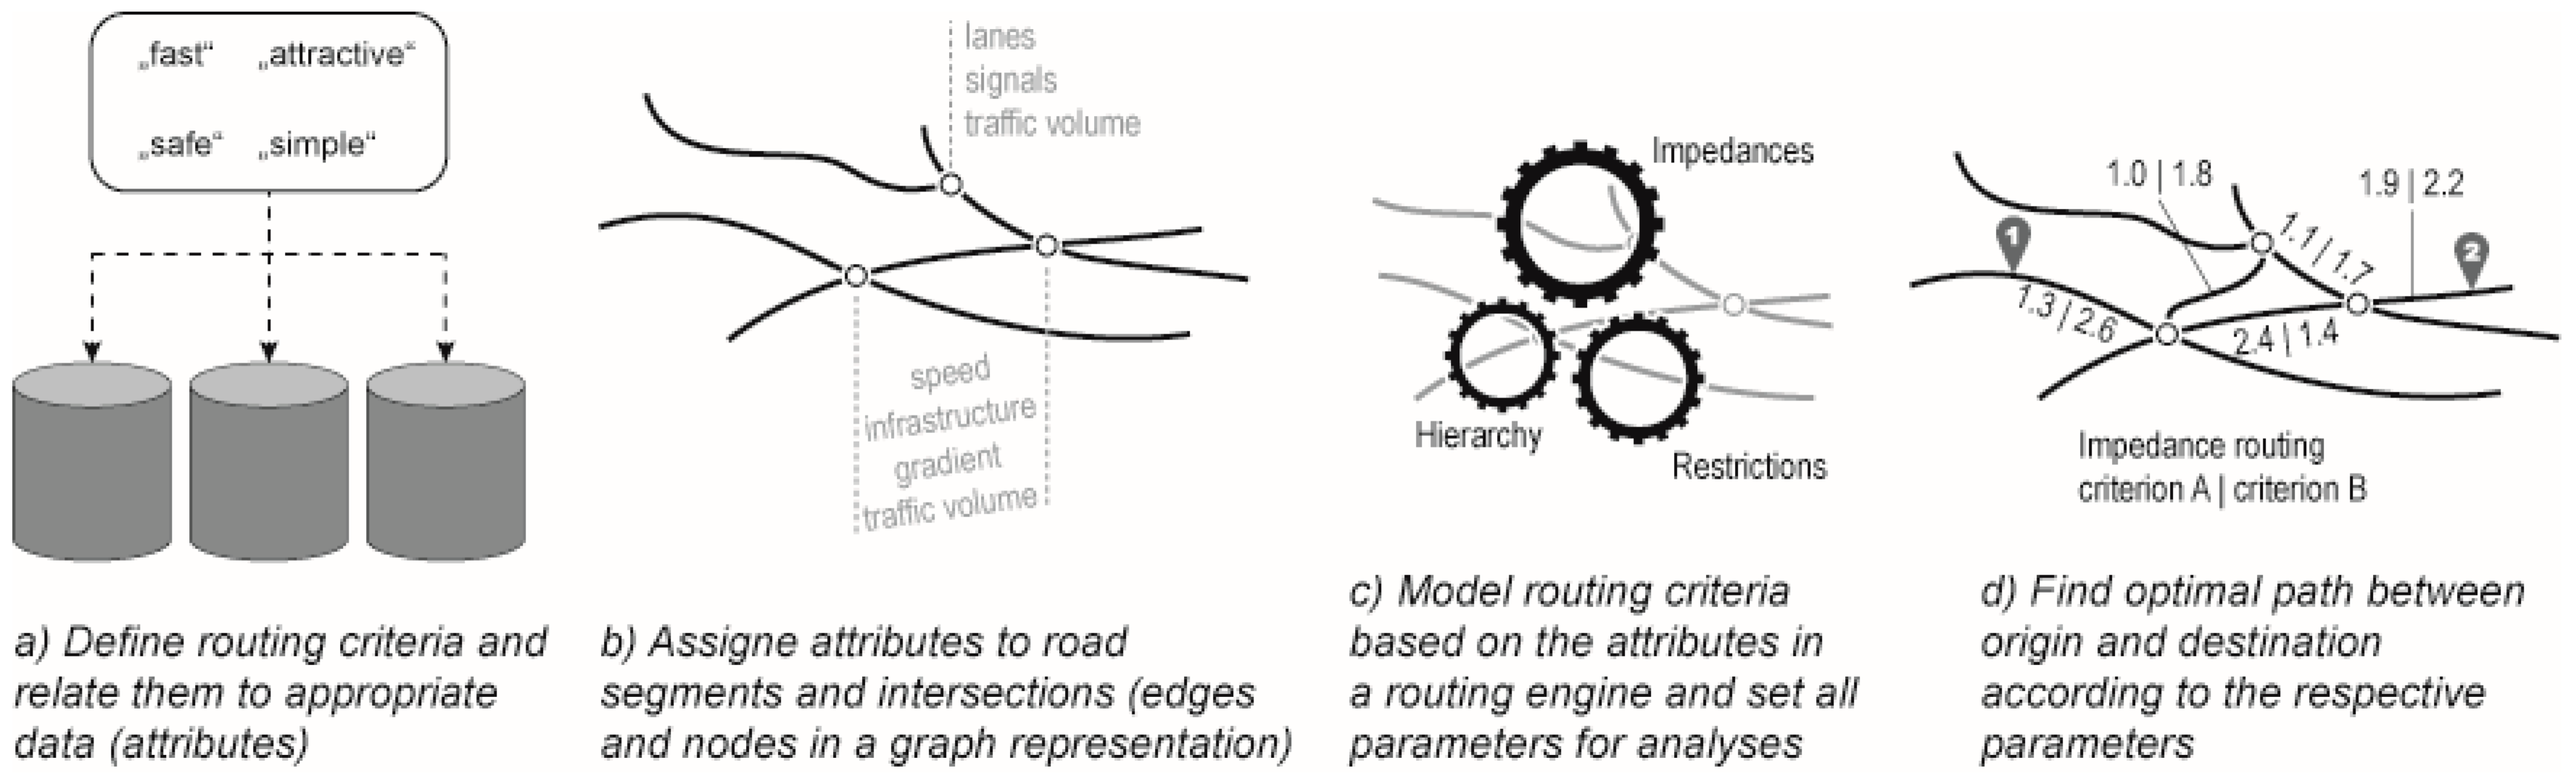
In order to transfer route choice parameters into routing applications, several steps are required (Figure 1). Route optimization in a digital environment relies on suitable and complete data. Since the success of (global) open data initiatives [27] and the increasing availability of bicycle infrastructure data in crowd-sourcing platforms, such as OpenStreetMap [28], data acquisition has become less important. However, handling and interpreting the vast amount of heterogeneous data, most often from various data sources, each with distinct data models, has become a challenge, which is especially relevant for modeling, analysis and information provision in the context of mobility research and application development [29,30]. With regard to route optimization, the connection between verbally described routing criteria and digital data bases (Figure 1a) requires advanced data models and ontologies [31]. Depending on the data model, attributes that describe the physical and legal environment of the road space are assigned to edges (representing road segments) and nodes (representing junctions) in a next step (Figure 1b). The assignment of attributes to the network geometry results in a connected graph with attributes, which represents the road space digitally and serves as input for the route optimization (Figure 1c). At this stage of the workflow, route preferences and choice models are implemented. In a final step (Figure 1d) the routing problem is solved based on the predefined optimization parameters. For algorithmic details regarding route optimization see Hrncir et al. [32]. While finding the shortest connection between origin and destination is solved exclusively on geometric network attributes, alternative routing criteria require corresponding attributes and adequate models.
Geographical Information Systems (GISs) are adequate platforms for the implementation of the workflow described in Figure 1. They allow for data management, geospatial modeling, analysis and visualization. For the optimization of route recommendations in terms of safety, a distinction between three approaches can be made: model-based safety performance indicator (Section 2.2.1); consideration of bicycle crash locations (Section 2.2.2) and integration of user feedback (Section 2.2.3). However, the boundaries between these categories are fuzzy and examples for mixed approaches can be found.
2.2.1. Model-Based
Route optimization approaches, which include deterministic methods [31,33] and heuristic algorithms [32,34], build upon (spatial) models, which consider multiple segment and junction attributes as composite index values or as independent criteria. These criteria commonly express the suitability of road-segments and junctions for bicyclists in terms of safety (often referred to as “bikeability”). Input parameters and the corresponding weights determine the routing outcome.
2.2.2. Crash Locations
In contrast to purely model-based safety-routings, Singleton and Lewis [35] use crash frequencies as proxy for safety and to optimize the routing engine accordingly. Instead of considering the physical environment (e.g., bicycle infrastructure) as input in a composite model, the authors generated a weighted crash-frequency graph for the route optimization. The major drawback of this approach is that it does not account for traffic volume although the number of crashes depends on an exposure variable [36]. Thus, such an approach might favor routes with fewer recorded crashes, but which are nevertheless unsuitable for bicyclists. In addition, many roads have a low crash frequency because bicyclists, most probably due to safety concerns, generally avoid them.
2.2.3. User Feedback
Gilka et al. [37] complement a model-based approach with crash hot spots and user feedback, which considers perceived safety threats in the routing optimization. Additionally, this prototype allows for personalization and intermodal routing. Besides active user feedback, an increasing number of routing applications make use of passively sensed GPS tracking data from mobile apps. Based on this collective sensing approach, route choice models can be reverse-engineered and fed into adaptive route optimization algorithms [38].
The benefits of a mixed approach, as for example demonstrated by Gilka et al. [37], especially when combined with the possibility to integrate user preferences, is acknowledged by various authors [39,40,41]. They point out the fact that the majority of model-based safety performance indicators represent a hypothetical average but do not necessarily reflect individual preferences and experiences. Generally, bicyclists aim to choose routes that fit their preferences best, although they might be longer than the shortest connection.
Relevant criteria for route choice are known from previous studies and methods for reflecting them in information and routing portals exist. According to Su et al. [42] information provision is among the 15 top motivating factors for bicycling. However, to the best of our knowledge there is no study which assesses the provision of information about safe routes on mobility platforms. This paper aims therefore to provide an overview of current information and routing portals and to analyze to which degree “safety” is explicitly considered.
3. Methods
For answering the question to which degree current bicycle information and routing portals address prevalent safety concerns, an evaluation of online web services was conducted. We applied the following inclusion criteria for information and routing portals: free availability and accessibility on the internet, no obligation to register and the provision of a web browser version. The selection of portals that are considered was based on a web search for bicycle routing in English, Dutch and German languages. Since the landscape of web services is subject to constant change, the study does not claim to cover all possible portals. However, we aimed for a broad variety in terms of data sources, geographical coverage and general purpose.
For this study, we used an evaluation matrix, which considers key information (URL, data source and geographical coverage) and safety-relevant criteria. For the latter, we used the criteria that contribute to the category “safety” in Hochmair [19]: safe area, lighted at night, avoidance of busy intersections, bike lane, good street condition, avoidance of public transport, no wrong-enter of one-ways, avoidance of roundabouts. In addition, we evaluated the availability of routing criteria that were reported in the literature as relevant for route choice. Table 1 provides an overview of the evaluation criteria.
In the evaluation, the availability of these routing criteria was reviewed and results stored as binary values (provided/not provided). Additionally, definitions for higher-level criteria types (i.e., safety, scenery, comfort) were recorded where available.
After providing descriptive statistics for the popularity of routing criteria in the different portals we examined the statistical association between the number of available routing criteria and geographical coverage of the application with a t-test. Furthermore, characteristics of identified user interaction features, as they are used in criteria selection, are described and categorized.
4. Results
For this study, 35 bicycle routing applications met the inclusion criteria and were examined according to the evaluation matrix introduced in the previous section. Table 2 gives an overview of the considered information- and routing portals.
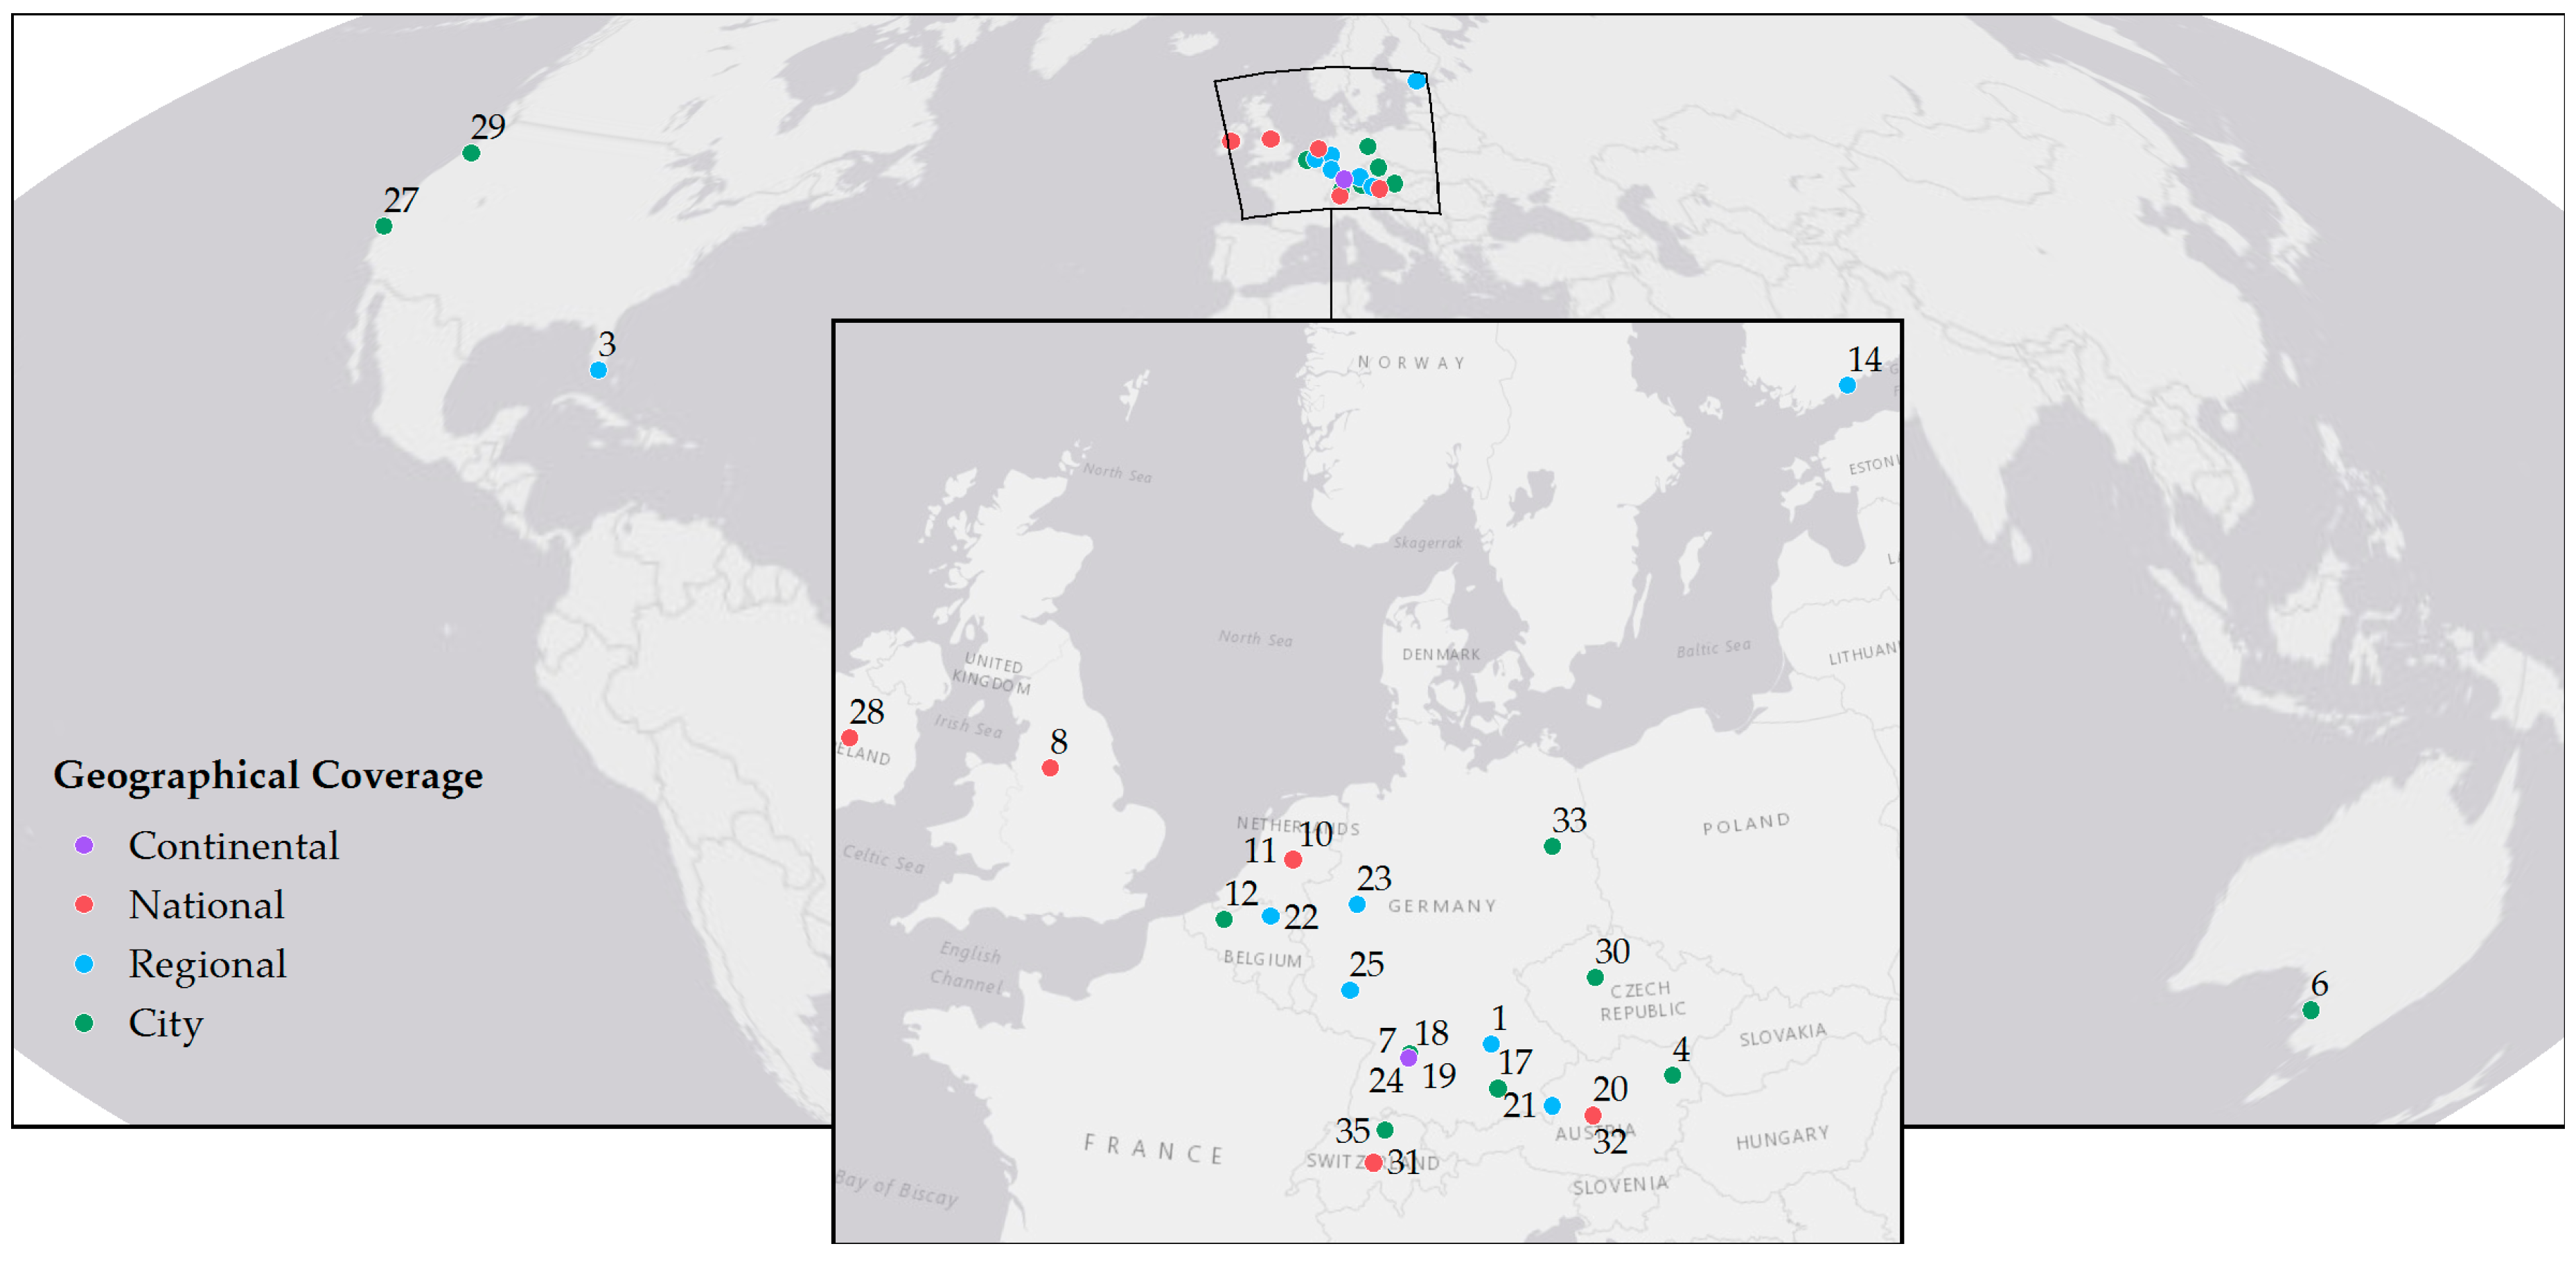
The majority of examined services cover European countries, regions and cities. However, some examples from overseas are also included (Figure 2).
Content, functionality, routing criteria and usability varied considerably between analyzed routing portals. More specifically, a clear difference in design and functionality can be observed between applications that are specifically designed for bicyclists and those that add bicycle routing as an ancillary service, such as route planners for automobiles. The majority of the latter applications do not address bicycle-specific routing parameters explicitly. Generally, the documentation of the routing criteria is poor for most portals. Verbally labeled routing criteria, such as “preferred”, “sportive”, or “nature” route, leave room for interpretation. On average, the analyzed 35 portals provide three routing criteria (mean = 2.97; median = 3), with a minimum of 1 and a maximum of 7.
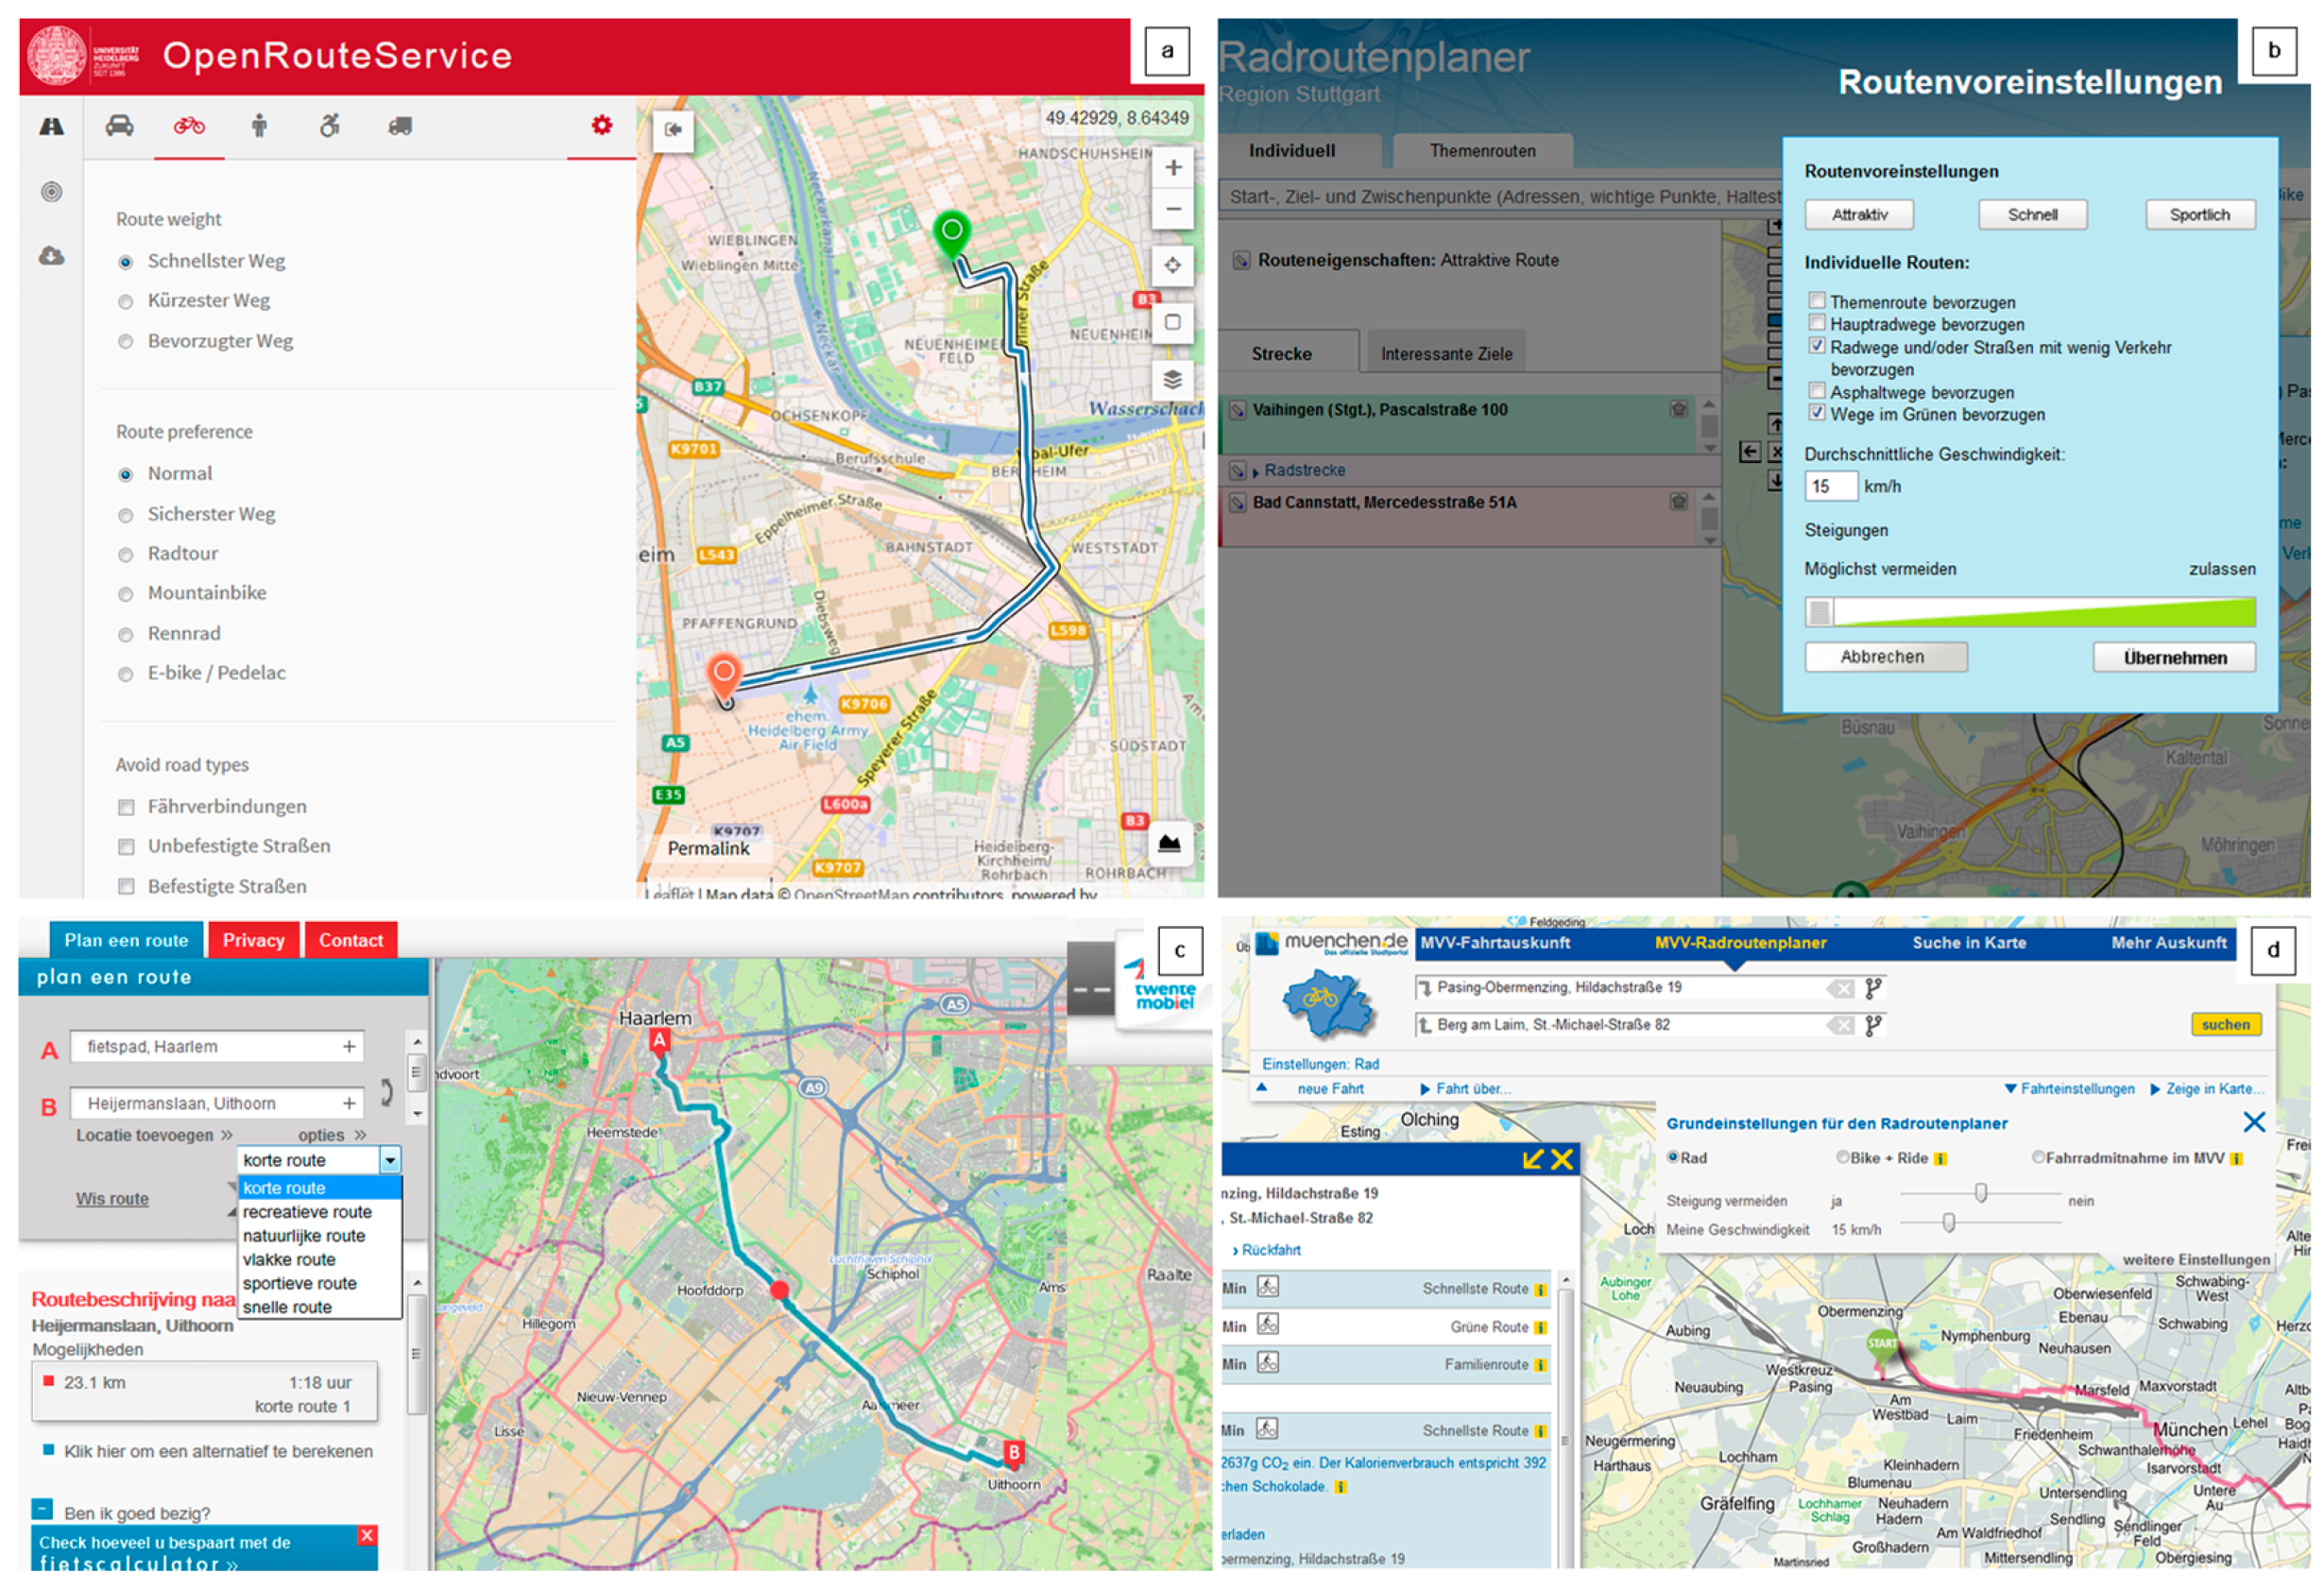
Several common characteristics of user interface designs of analyzed route planners could be identified (Figure 3). That is, routing criteria were mostly offered for a compensatory route selection approach using different interactive elements, such as radio buttons (Figure 3a), check boxes (Figure 3b), combo boxes (Figure 3c), or slider bars (Figure 3d), where either one or several optimization criteria could be selected. Only few route planners offer eliminatory constraints. An example is avoidance of route types, such as ferries or stairs (Figure 3a).
4.1. Popularity of Routing Criteria
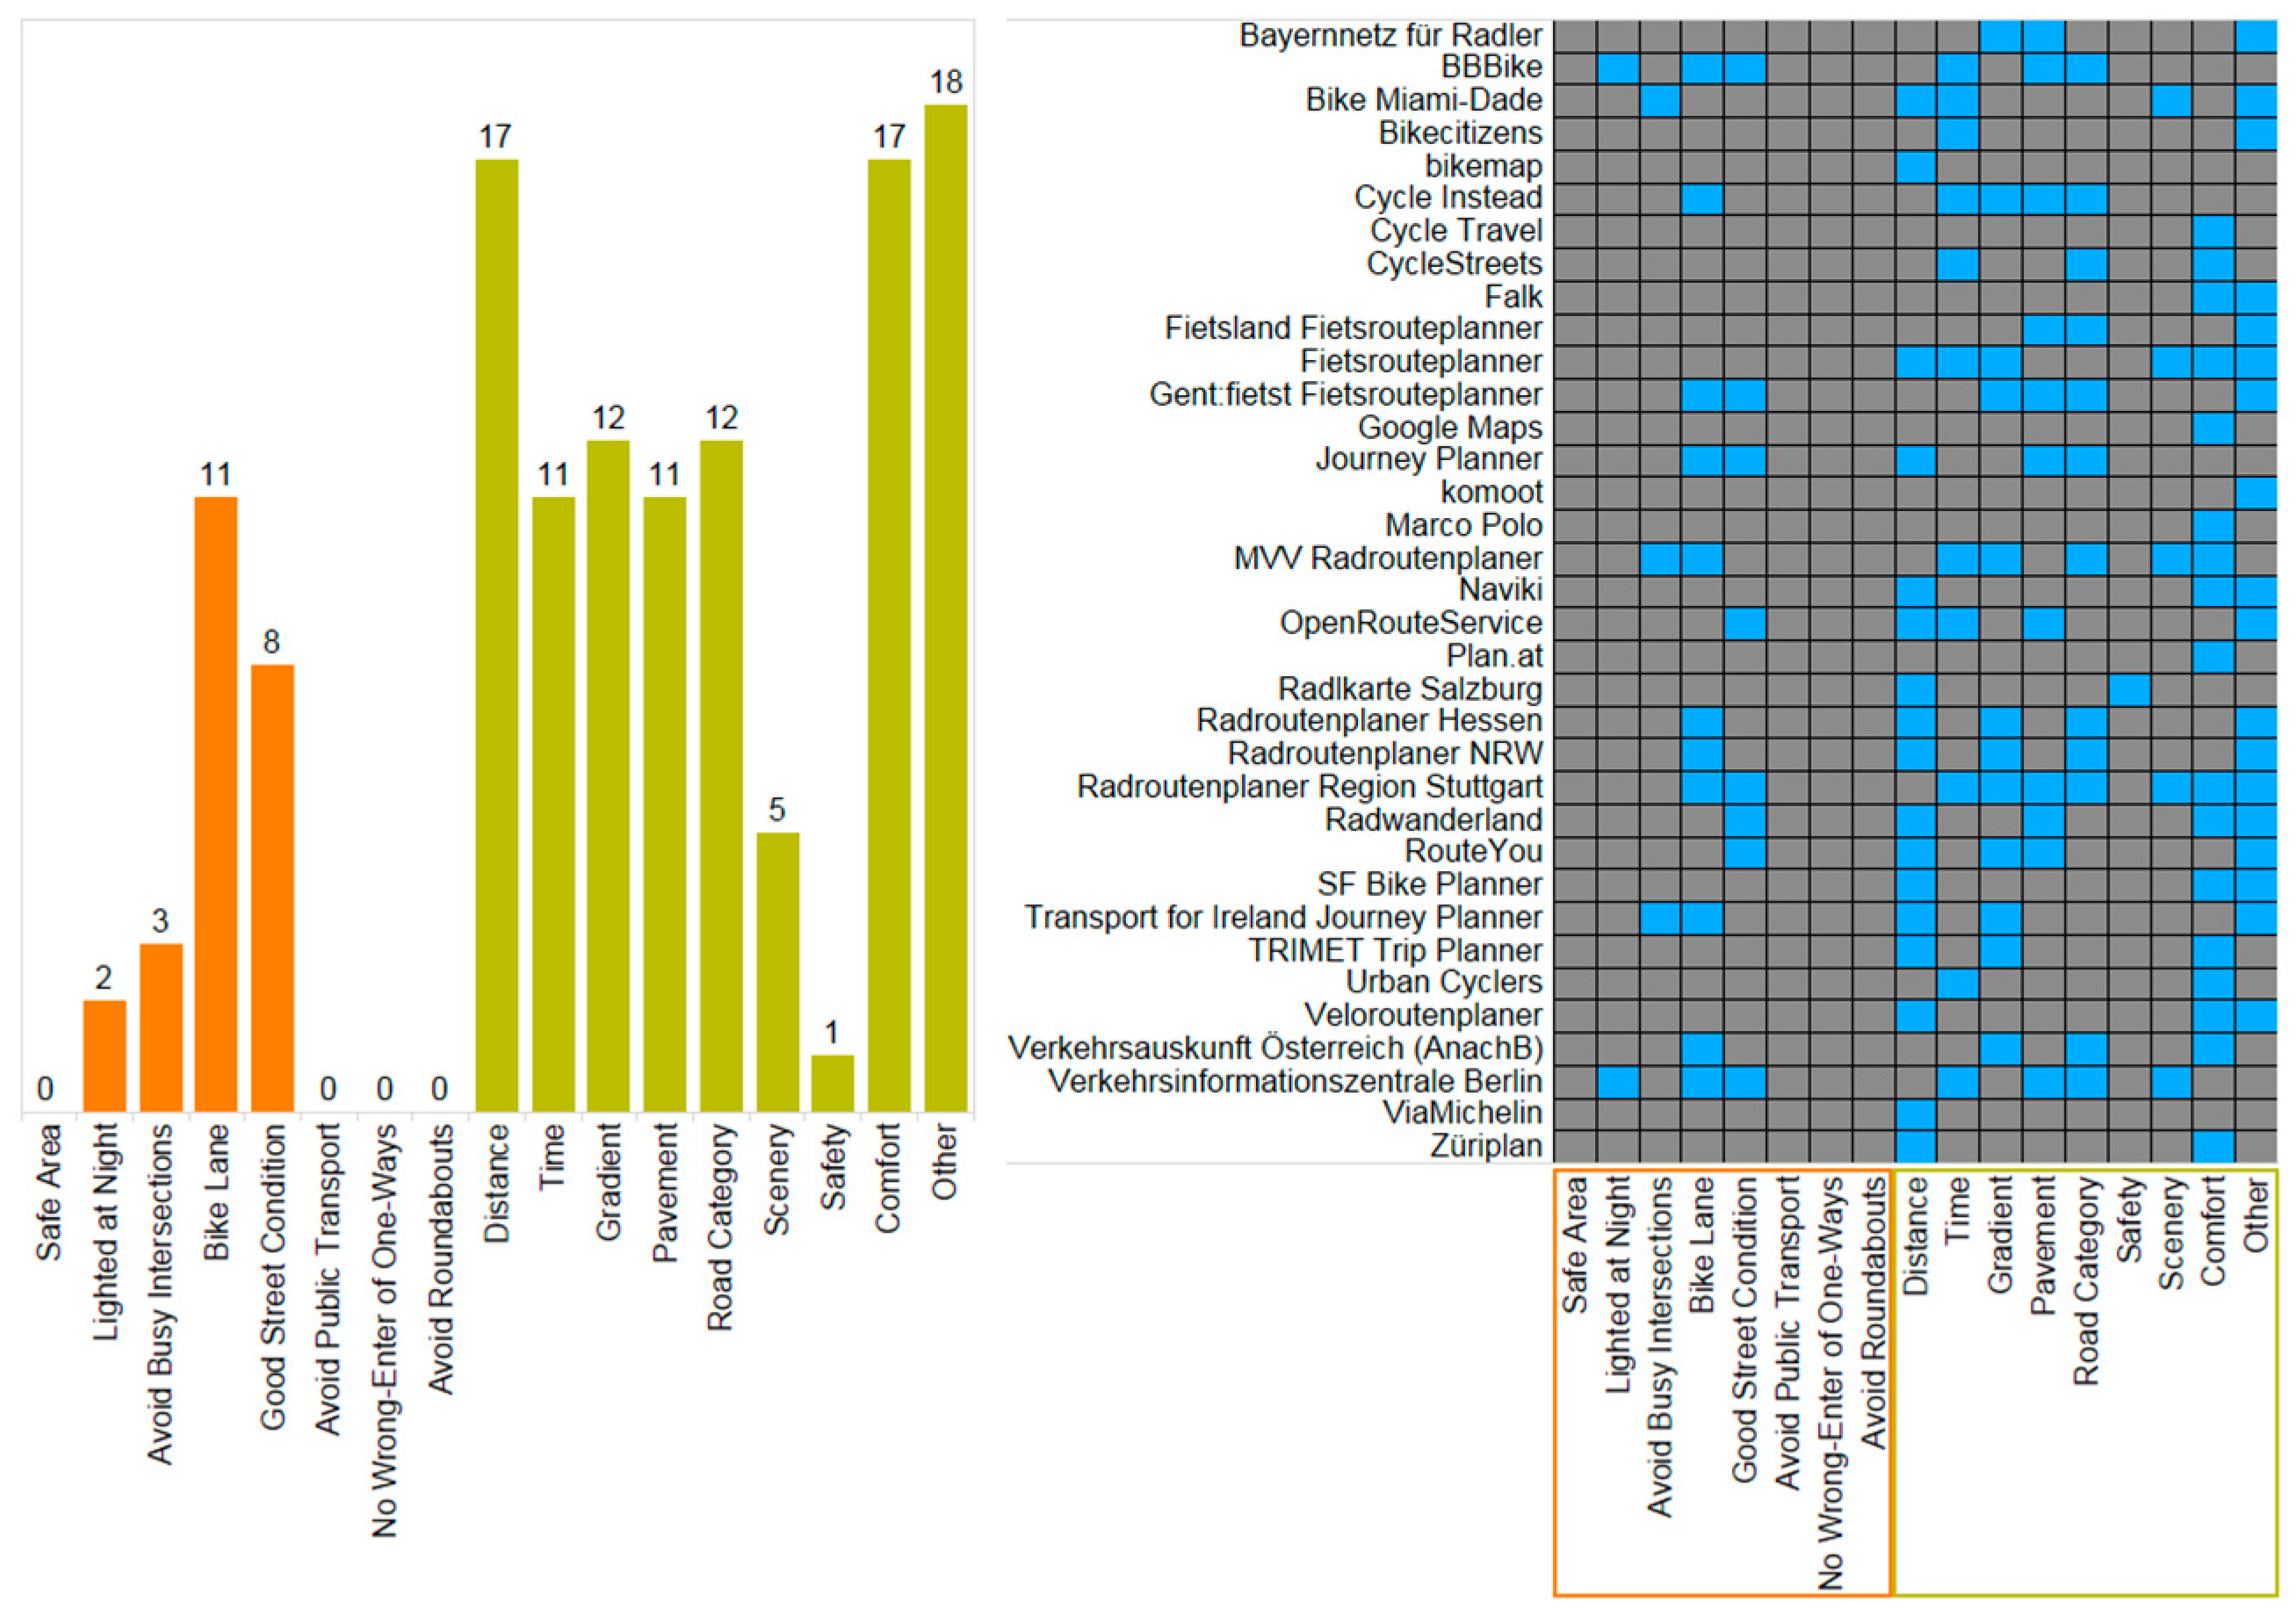
Among the analyzed portals, “shortest distance” and “most comfortable” are the most common routing criteria. The definition of “most comfortable” is broad and typically refers to bicycle infrastructure, road category and green space. “Gradient”, “road category”, “pavement” and “travel time” are further popular routing criteria (see Figure 4). “Safety” as a routing criterion is hardly ever provided. In the Radlkarte Salzburg portal this option is called “recommended route” for liability reasons. However, this criterion is explained via a linked paper. The Bike Miami-Dade trip planner provides the routing criterion “least interaction with traffic” and the Transport for Ireland Journey Planner provides “easiest routes”, which are routes along roads with a minimum of motorized traffic and a minimum of difficult junctions.
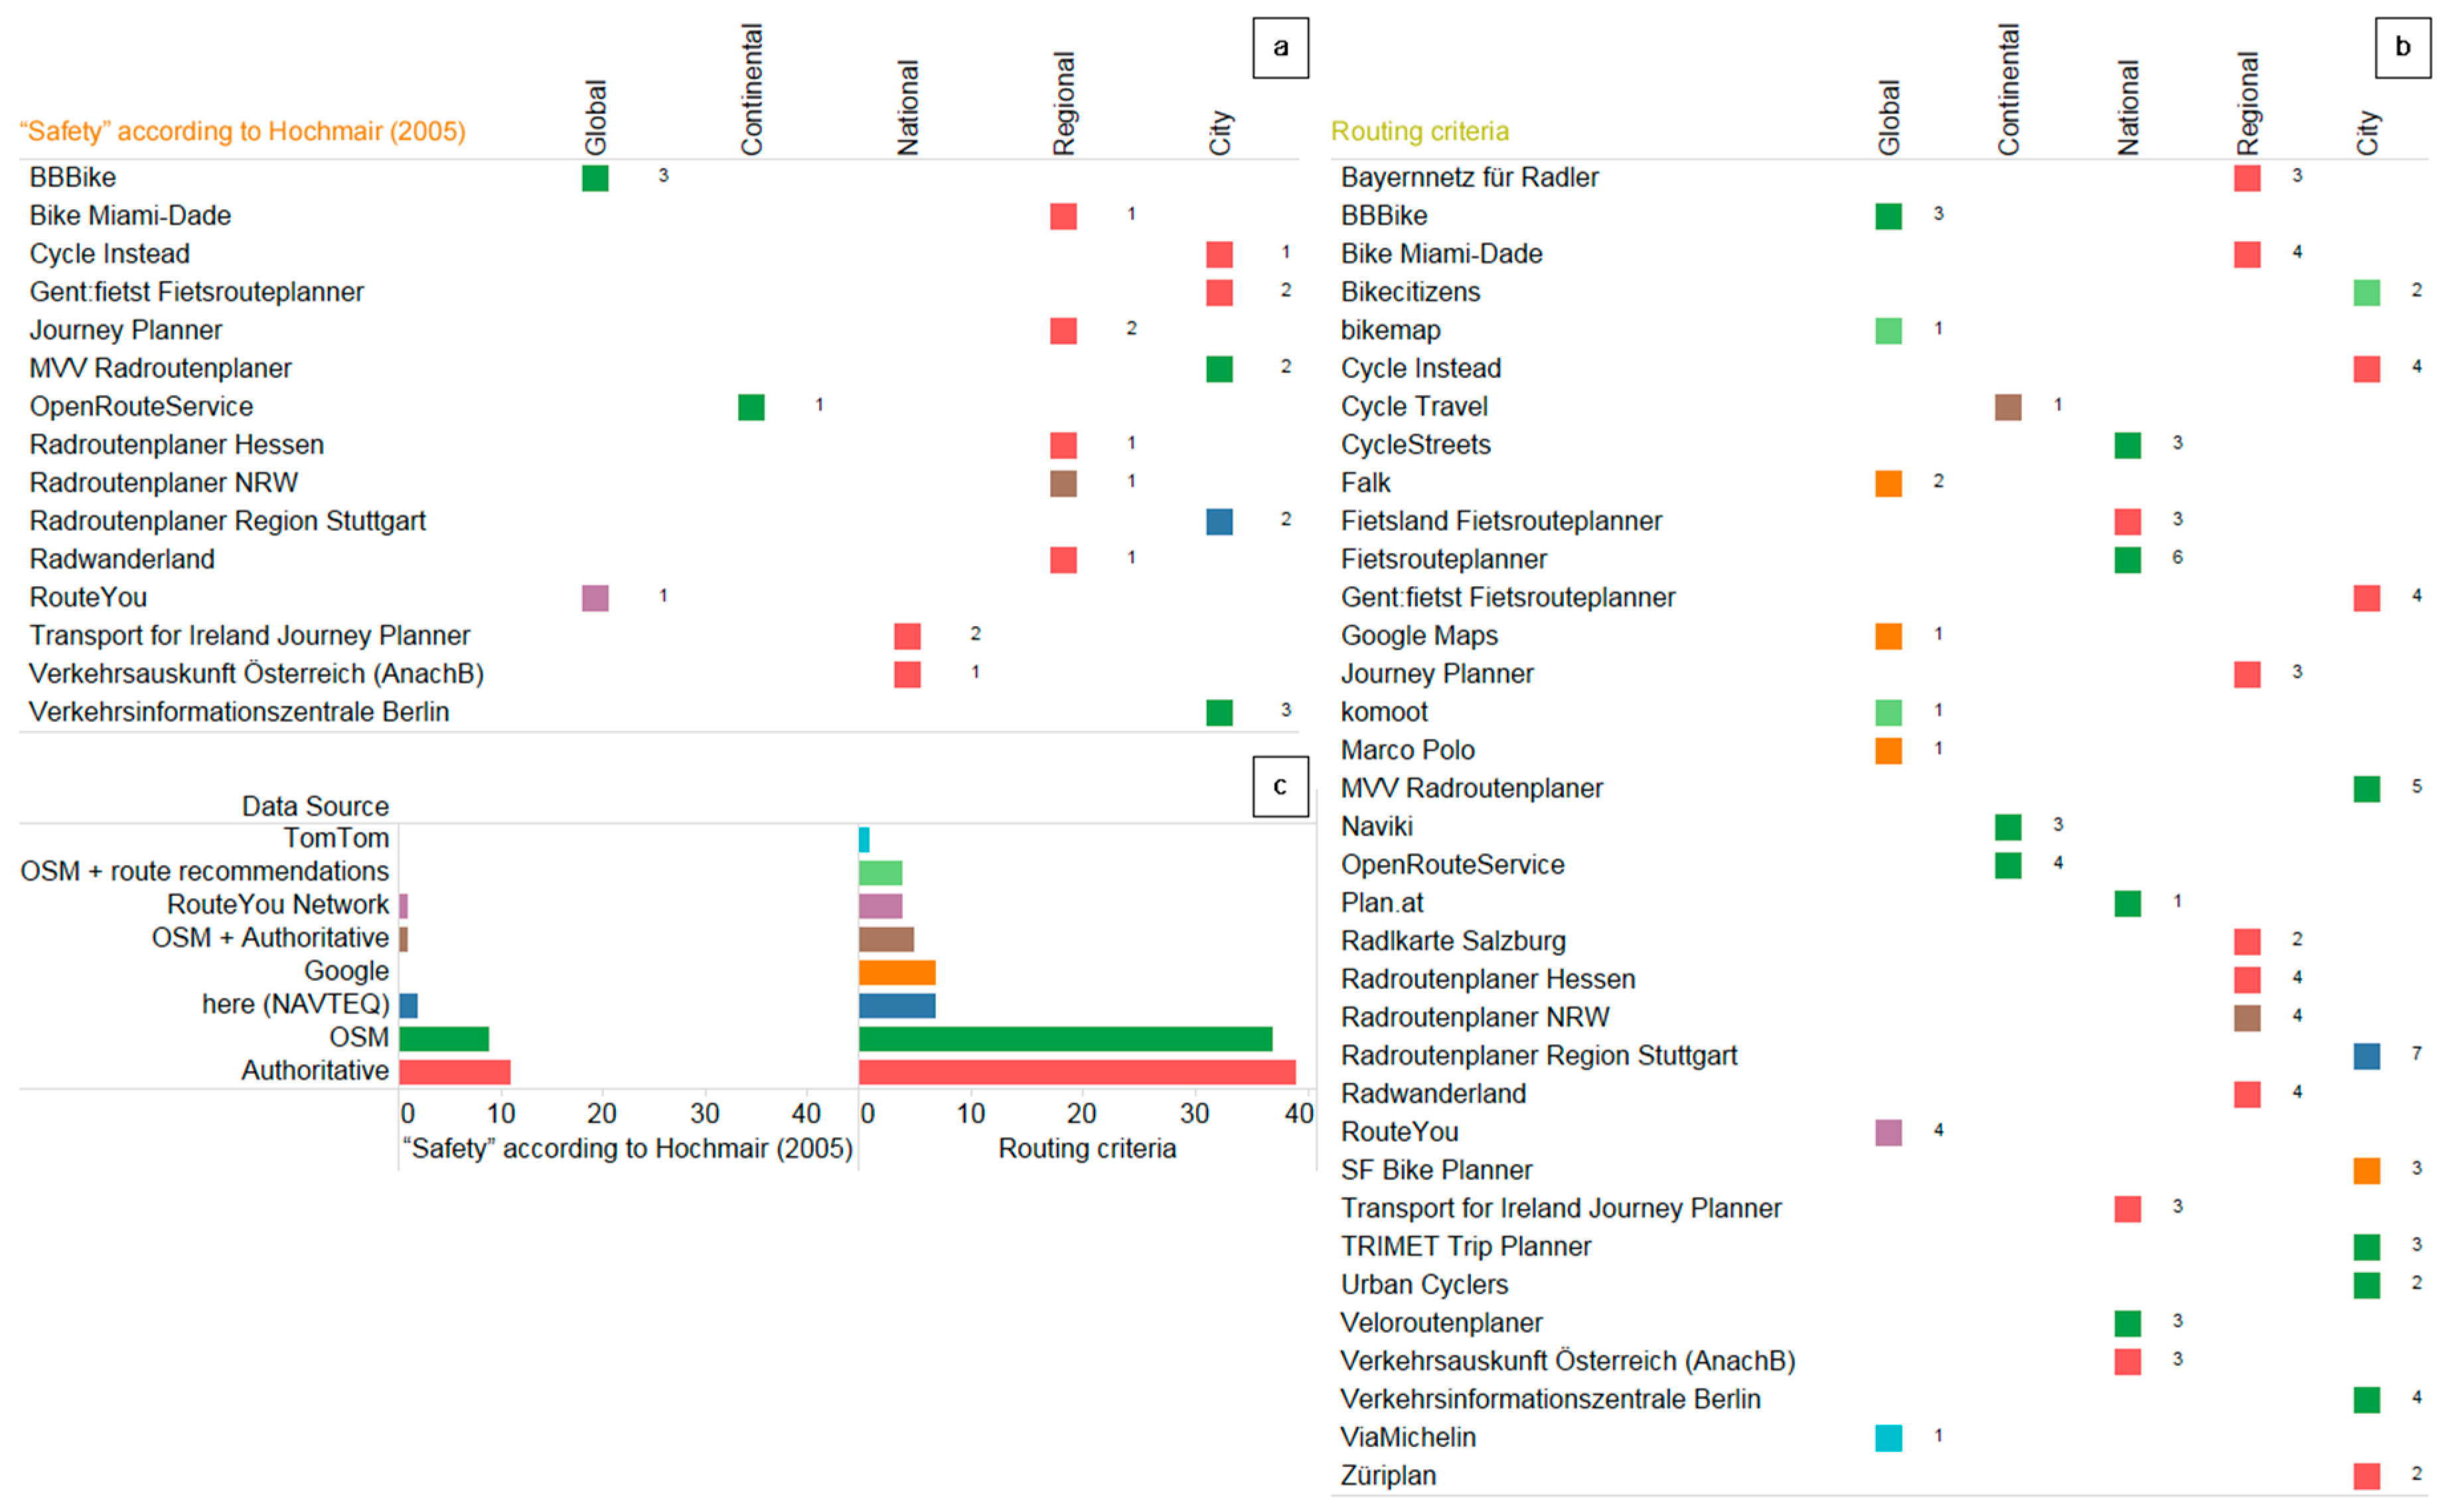
Figure 5 depicts for each analyzed portal the number of safety related routing criteria according to Hochmair [19] (Figure 5a), the geographical coverage and total number of routing criteria offered (Figure 5b), and the data source (Figure 5c). Different color values in square symbols refer to the different data sources as explained in Figure 5c.
4.2. Number of Routing Criteria
In order to test for a statistical association between safety criteria and the overall number of criteria on the one and the geographical coverage on the other hand, the average number of safety related routing criteria for portals that offer at least one safety criterion (see Figure 5a), and the average number of all routing criteria from all analyzed portals (see Figure 5b) were computed for two geographic coverage types (local vs. global) and compared between them. Descriptive statistics of criterion numbers (mean, standard deviation, median) are provided in Table 3.
The upper data row shows that the mean number of safety related criteria offered in local/regional trip planners (M = 0.94, SD = 0.97) is higher than that for national/continental/global ones (M = 0.44, SD = 0.86). Using an independent samples t-test it was, however, found that this difference is not significant (t(33) = 1.61, p = 0.116). This means that there is no influence of the geographic coverage on the number of detailed safety related routing criteria. Next, an independent samples t-test was conducted to compare the total number of routing criteria offered between local/regional and national/continental/global route planners. Results revealed that the number of routing criteria offered for local/regional routing portals (M = 3.53, SD = 1.28) is significantly different (t(33) = 2.37, p = 0.024) from national/continental/global routing portals (M = 2.42, SD = 1.42). These results suggest that the geographic coverage of the routing service associated with a trip planner does affect the variety of routing options.
4.3. Data Sources
The most common data source for the examined routing portals is OpenStreetMap (OSM) with 46% (dark green symbols in Figure 5). It is primarily used for portals, which provide services with global coverage (38% use OSM) or continental coverage (100% use OSM), none of which use authoritative data sources (see Figure 5b). Contrary to this, at the city (30%) and regional level (86%) authoritative data are more frequently used. Data from commercial providers, such as TomTom or HERE (formerly NAVTEQ) play only a minor role. Examples are the Radroutenplaner Region Stuttgart (HERE) and ViaMichelin (TomTom). Google provides its own portal (Google Maps) and feeds its road network to other portals as a basis for route search.
5. Discussion
Safety plays a minor role in provided routing criteria, according to our examination of 35 bicycle routing applications. Only one portal, namely Radlkarte Salzburg recommends safest routes. However, the provider does not label the criterion explicitly due to liability reasons, but refers to a paper [43] where the risk avoidance of the routing algorithm is explained. Two other portals, Bike Miami-Dade trip planner and the Transport for Ireland Journey Planner, use the amount of motorized traffic as a proxy for parameters that affect a bicyclist’s safety. This assumption corresponds with findings by Teschke et al. [44].
Although the importance of routing criteria that represent the class “safety” according to Hochmair [19] is reiterated in the related literature (see for instance Su et al. [42]), these criteria are rarely explicitly considered in the examined routing portals. The criteria listed in Hochmair [19] lack formal, quantitative specifications since they originate from an earlier survey that collected routing criteria from participants in free text format without requesting further detailed information. The considered criteria therefore leave room for interpretation. Additionally, it is not documented to which degree these criteria describe subjectively perceived and objective safety threats [20]. However, this could not sufficiently explain the absence of safety and safety-related routing criteria and information in the investigated portals. At least two relevant components of objective and subjective bicycling safety are available in a fraction of our sample, namely the existence of bicycle lanes and road quality in terms of pavement.
We investigated the sample of portals with regards to whether city and regional portals offer a wider selection of cycling related routing criteria than trip planners that facilitate routing at the national, continental, or global level. The latter group is typically designed for motorized (car) travel and operated on global datasets. These datasets lack detailed cycling related road information which limits the number of applicable cycling related routing criteria that can be provided for trip planning. A prominent example of a routing application that is primarily designed for cars is ViaMichelin, which recommends bicycle routes that are mostly identical to car routes. In contrast, the portal with the highest number of routing criteria, Radroutenplaner Region Stuttgart, offers seven optimization parameters that largely meet the needs of both utilitarian and recreational bicyclists. In general, we found that local and regional portals provide more routing criteria than portals that cover larger areas. However, the difference in safety-related criteria is insignificant. Thus, we deduce that although data sources used in local and regional portals tend to exhibit more details on the road space, this information is not used to address safety concerns.
The dominance of OpenStreetMap (OSM) as data source can be explained by at least two factors. First, the quality of bicycling related OSM data is continuously improving and exceeding that of authoritative and proprietary data in some cases, although it must be noted that OSM data quality with respect to the mapping of bicycle lanes and trails varies between geographic regions [28]. Second, the OSM data model is simple and consistent across national boundaries, and provides a wide range of key-value pairs to specify bicycle infrastructure on road networks. All these characteristics make the OSM framework both suitable and scalable. Spatial models that build upon this data source (see Figure 1a) can be easily transferred to arbitrary geographic regions. The strengths of this platform can be further leveraged by integrating actively or passively sensed user feedback, as it is the case in the Bikecitizens trip planner (see https://www.bikecitizens.net/de/app/faq/ for technical details).
6. Conclusions
The presented study identifies a clear discrepancy between observed bicyclist behavior (which often reveals preference for safer routes, based on findings from previous work) and optimization criteria offered in existing bicycle routing portals. In particular, the safety aspect is not adequately addressed. None of 35 analyzed bicycle routing portals provide a safest route option, which is explicitly labeled as such (one examples provides “recommended routes”, a synonym for safety in order to avoid liability issues). In total 15 portals offer at least one routing option that corresponds to safety according to Hochmair [19]. The implementation of these criteria is exclusively model-based and does not consider crash locations or user feedback. In conclusion, it can therefore be stated that the contributions of routing portals to the promotion of safe bicycling are limited. Although local routing portals offer significantly more routing criteria a user can choose from, this is not the case for safety related criteria. Hence, geographic coverage does not play a role in the design of bicycle trip planner when it comes to safe routes.
All analyzed portals are designed for pre-trip route planning. The integration of real-time information, such as closed bike lanes, or community components, such as user feedback about road safety, is rare.
In order to more efficiently employ bicycle portals for the promotion of safe bicycling the following aspects should be considered in the future refinement of trip planner functionality:
- Safety-relevant motivators (e.g., separate bicycle path) and deterrents (e.g., accident prone intersections) [19,20] should be reflected more explicitly in routing criteria. Although this integration depends on data availability, several existing examples already demonstrate that crowdsourced (e.g., OSM) as well as authoritative data do allow for modeling this level of detail (cf., Loidl and Zagel [31]). In general, it can be concluded that sufficient data describing the road space are available. However, further research and development is still needed concerning the management of semantically and structurally heterogeneous data and their integration into models that assess safety in road networks. Apart from modeling potential safety threats based on environmental variables, we see great potential to further improve such models with additional data on crash locations [45], near-miss data [46] and derived incident rates [36]. Yet, these data sources have not been fully exploited due to the lack of sufficiently accurate population data. Consequently, bicycle flow models and simulations are regarded as promising in this regard.
- The integration of user feedback and crowdsourced information (see for instance, Straub and Graser [47] or the Bikecitizens application) in routing recommendation systems helps to identify popular routes, which are typically safer than alternative connections.
- Real-time information on the traffic status, temporary safety threats or weather conditions could enrich static information and generate additional value for bicyclists.
- Geographical Information Systems (GIS) can serve as an integrated platform for various perspectives on the road space (infrastructure characteristics, traffic conditions, topography etc.). This potential could be used to collect, manage and relate different data layers and derive more precise information on safety threats used for the computation of safer routes. Additionally, the consideration of multiple information layers could also facilitate more flexible routing recommendations. With this, the very different preferences and needs of user groups, trip purpose, time-of-day or season could be better addressed than in a “one-fits-it-all” solution.
Supplementary Materials
The table with all evaluation criteria can be accessed via https://goo.gl/1iQmgP.
Acknowledgments
Parts of this research were funded through the Radlkarte XL project, commissioned by the provincial government of Salzburg. Many thanks go to Julia Stepan for proofreading the manuscript. We appreciate the valuable comments by three anonymous reviewers.
Author Contributions
M.L. designed the study, evaluated the routing portals and wrote large parts of the manuscript. H.H.H. contributed to the methodology section and data analysis and edited the manuscript.
Conflicts of Interest
The authors declare no conflicts of interest.
References
- Wegman, F.; Zhang, F.; Dijkstra, A. How to make more cycling good for road safety? Accid. Anal. Prev. 2012, 44, 19–29. [Google Scholar] [CrossRef] [PubMed]
- Cripton, P.A.; Shen, H.; Brubacher, J.R.; Chipman, M.; Friedman, S.M.; Harris, M.A.; Winters, M.; Reynolds, C.C.O.; Cusimano, M.D.; Babul, S.; et al. Severity of urban cycling injuries and the relationship with personal, trip, route and crash characteristics: Analyses using four severity metrics. BMJ Open 2015, 5, e006654. [Google Scholar] [CrossRef] [PubMed]
- Schepers, P.; Twisk, D.; Fishman, E.; Fyhri, A.; Jensen, A. The Dutch road to a high level of cycling safety. Saf. Sci. 2017, 92, 264–273. [Google Scholar] [CrossRef]
- Thomas, B.; DeRobertis, M. The safety of urban cycle tracks: A review of the literature. Accid. Anal. Prev. 2013, 52, 219–227. [Google Scholar] [CrossRef] [PubMed]
- Werneke, J.; Dozza, M.; Karlsson, M. Safety–critical events in everyday cycling—Interviews with bicyclists and video annotation of safety–critical events in a naturalistic cycling study. Transp. Res. Part F Traffic Psychol. Behav. 2015, 35, 199–212. [Google Scholar] [CrossRef]
- Schoner, J.E.; Levinson, D.M. The missing link: Bicycle infrastructure networks and ridership in 74 US cities. Transportation 2014, 41, 1187–1204. [Google Scholar] [CrossRef]
- Marqués, R.; Hernández-Herrador, V.; Calvo-Salazar, M.; García-Cebrián, J.A. How infrastructure can promote cycling in cities: Lessons from Seville. Res. Transp. Econ. 2015, 53, 31–44. [Google Scholar] [CrossRef]
- Loidl, M. Spatial information for safer bicycling. In Advances and New Trends in Environmental Informatics, Proceedings of the Selected and Extended Contributions from the 28th International Conference on Informatics for Environmental Protection, Oldenburg, Germany, 10–12 September 2014; Gómez, J.M., Sonnenschein, M., Vogel, U., Winter, A., Rapp, B., Giesen, N., Eds.; Springer: Berlin/Heidelberg, Germany, 2016; pp. 219–235. [Google Scholar]
- Pucher, J.; Buehler, R. Making Cycling Irresistible: Lessons from the Netherlands, Denmark and Germany. Transp. Rev. 2008, 28, 495–528. [Google Scholar] [CrossRef]
- Schweizer, J.; Rupi, F. Performance Evaluation of Extreme Bicycle Scenarios. Proced. Soc. Behav. Sci. 2014, 111, 508–517. [Google Scholar] [CrossRef]
- Pucher, J.; Dill, J.; Handy, S. Infrastructure, programs, and policies to increase bicycling: An international review. Prev. Med. 2010, 50, 106–125. [Google Scholar] [CrossRef] [PubMed]
- Lanzendorf, M.; Busch-Geertsema, A. The cycling boom in large German cities—Empirical evidence for successful cycling campaigns. Transp. Policy 2014, 36, 26–33. [Google Scholar] [CrossRef]
- Stern, P.C. Information, Incentives, and Proenvironmental Consumer Behavior. J. Consum. Policy 1999, 22, 461–478. [Google Scholar] [CrossRef]
- Gukeisen, M.V.; Hutchful, D.; Kleymeer, P.; Munson, S.A. altVerto: Using intervention and community to promote alternative transportation. In Proceedings of the CHI Conference on Human Factors in Computing Systems (CHI ’07), San Jose, CA, USA, 30 April–3 May 2007; ACM: New York, NY, USA, 2007; pp. 2067–2072. [Google Scholar]
- Innocenti, A.; Lattarulo, P.; Pazienza, M.G. Car stickiness: Heuristics and biases in travel choice. Transp. Policy 2013, 25, 158–168. [Google Scholar] [CrossRef]
- Malczewski, J.; Rinner, C. Multicriteria Decision Analysis in Geographic Information Science; Springer: New York, NY, USA, 2015. [Google Scholar]
- Hochmair, H.H.; Rinner, C. Investigating the need for eliminatory constraints in the user interface of bicycle route planners. In Proceedings of the International Conference on Spatial Information Theory, Ellicottville, NY, USA, 14–18 September 2005; Cohn, A.G., Mark, D.M., Eds.; Springer: Berlin/Heidelberg, Germany, 2005; pp. 49–66. [Google Scholar]
- Hochmair, H.H. Decision Support for Bicycle Route Planning in Urban Environments. In Proceedings of the 7th AGILE Conference on Geographic Information Science, Heraklion, Greece, 29 April–1 May 2004; pp. 697–706. [Google Scholar]
- Hochmair, H.H. Towards a classification of route selection criteria for route planning tools. In Developments in Spatial Data Handling; Fisher, P., Ed.; Springer: Berlin/Heidelberg, Germany, 2005; pp. 481–492. [Google Scholar]
- Winters, M.; Davidson, G.; Kao, D.; Teschke, K. Motivators and deterrents of bicycling: Comparing influences on decisions to ride. Transportation 2011, 38, 153–168. [Google Scholar] [CrossRef]
- Broach, J.; Dill, J.; Gliebe, J. Where do cyclists ride? A route choice model developed with revealed preference GPS data. Transp. Res. Part A Policy Pract. 2012, 46, 1730–1740. [Google Scholar] [CrossRef]
- Hood, J.; Sall, E.; Charlton, B. A GPS-based bicycle route choice model for San Francisco, California. Transp. Lett. 2011, 3, 63–75. [Google Scholar] [CrossRef]
- Krenn, P.J.; Oja, P.; Titze, S. Route choices of transport bicyclists: A comparison of actually used and shortest routes. Int. J. Behav. Nutr. Phys. Act. 2014, 11, 31. [Google Scholar] [CrossRef] [PubMed]
- Sultan, J.; Ben-Haim, G.; Haunert, J.-H.; Dalyot, S. Extracting spatial patterns in bicycle routes from crowdsourced data. Trans. GIS 2017, 21, 1321–1340. [Google Scholar] [CrossRef]
- Lowry, M.B.; Furth, P.; Hadden-Loh, T. Prioritizing new bicycle facilities to improve low-stress network connectivity. Transp. Res. Part A Policy Pract. 2016, 86, 124–140. [Google Scholar] [CrossRef]
- Beecham, R.; Wood, J. Exploring gendered cycling behaviours within a large-scale behavioural data-set. Transp. Plan. Technol. 2013, 37, 83–97. [Google Scholar] [CrossRef]
- Sui, D. Opportunities and Impediments for Open GIS. Trans. GIS 2014, 18, 1–24. [Google Scholar] [CrossRef]
- Hochmair, H.H.; Zielstra, D.; Neis, P. Assessing the Completeness of Bicycle Trail and Lane Features in OpenStreetMap for the United States. Trans. GIS 2015, 19, 63–81. [Google Scholar] [CrossRef]
- Miller, H.; Goodchild, M. Data-driven geography. GeoJournal 2015, 80, 449–461. [Google Scholar] [CrossRef]
- Loidl, M.; Wallentin, G.; Cyganski, R.; Graser, A.; Scholz, J.; Haslauer, E. GIS and Transport Modeling—Strengthening the Spatial Perspective. ISPRS Int. J. Geo-Inf. 2016, 5, 84. [Google Scholar] [CrossRef]
- Loidl, M.; Zagel, B. Assessing bicycle safety in multiple networks with different data models. In GI-Forum; Vogler, R., Car, A., Strobl, J., Griesebner, G., Eds.; Wichmann: Salzburg, Austria, 2014; pp. 144–154. [Google Scholar]
- Hrncir, J.; Zilecky, P.; Song, Q.; Jakob, M. Speedups for Multi-Criteria Urban Bicycle Routing. In Proceedings of the 15th Workshop on Algorithmic Approaches for Transportation Modelling, Optimization, and Systems (ATMOS 2015), Patras, Greece, 17 September 2015; Italiano, G.F., Schmidt, M., Eds.; Schloss Dagstuhl—Leibniz-Zentrum fuer Informatik: Wadern, Germany, 2015; pp. 16–28. [Google Scholar]
- Chandra, S. Safety-based path finding in urban areas for older drivers and bicyclists. Transp. Res. Part C Emerg. Technol. 2014, 48, 143–157. [Google Scholar] [CrossRef]
- Mooney, P.; Winstanley, A. An evolutionary algorithm for multicriteria path optimization problems. Int. J. Geogr. Inf. Sci. 2006, 20, 401–423. [Google Scholar] [CrossRef]
- Singleton, A.; Lewis, D.J. Including Accident Information in Automatic Bicycle Route Planning for Urban Areas. Urban Stud. Res. 2011, 2011, 362817. [Google Scholar] [CrossRef]
- Loidl, M.; Wallentin, G.; Wendel, R.; Zagel, B. Mapping Bicycle Crash Risk Patterns on the Local Scale. Safety 2016, 2, 17. [Google Scholar] [CrossRef]
- Gilka, P.; Schaffer, S.; Schilling, T.; Pepik, M. Towards an Intermondal Router Featuring Cycling Safety in Berlin. In Proceedings of the ITS World Conference, Bordeaux, France, 5–9 October 2015. [Google Scholar]
- Huang, H.; Gartner, G. Collective intelligence-based route recommendation for assisting pedestrian wayfinding in the era of Web 2.0. J. Locat. Based Serv. 2012, 6, 1–21. [Google Scholar] [CrossRef]
- Priedhorsky, R.; Pitchford, D.; Sen, S.; Terveen, L. Recommending routes in the context of bicycling: Algorithms, evaluation, and the value of personalization. In Proceedings of the ACM 2012 Conference on Computer Supported Cooperative Work, Seattle, WA, USA, 11–15 February 2012; ACM: New York, NY, USA, 2012; pp. 979–988. [Google Scholar]
- Prato, C.G. Route choice modeling: Past, present and future research directions. J. Choice Model. 2009, 2, 65–100. [Google Scholar] [CrossRef]
- Dalton, A.M.; Jones, A.P.; Panter, J.; Ogilvie, D. Are GIS-modelled routes a useful proxy for the actual routes followed by commuters? J. Transp. Health 2015, 2, 219–229. [Google Scholar] [CrossRef] [PubMed]
- Su, J.G.; Winters, M.; Nunes, M.; Brauer, M. Designing a route planner to facilitate and promote cycling in Metro Vancouver, Canada. Transp. Res. Part A Policy Pract. 2010, 44, 495–505. [Google Scholar] [CrossRef]
- Loidl, M.; Zagel, B. Wie sicher ist sicher?—Innovatives Kostenmodell zur Ermittlung des Gefährdungspotenzials auf Radwegen. In AGIT; Strobl, J., Blaschke, T., Griesebner, G., Eds.; Wichmann Verlag: Salzburg, Austria, 2010; pp. 394–403. [Google Scholar]
- Teschke, K.; Harris, M.A.; Reynolds, C.C.O.; Winters, M.; Babul, S.; Chipman, M.; Cusimano, M.D.; Brubacher, J.R.; Hunte, G.; Friedman, S.M.; et al. Route Infrastructure and the Risk of Injuries to Bicyclists: A Case-Crossover Study. Am. J. Public Health 2012, 102, 2336–2343. [Google Scholar] [CrossRef] [PubMed]
- Loidl, M.; Traun, C.; Wallentin, G. Spatial patterns and temporal dynamics of urban bicycle crashes—A case study from Salzburg (Austria). J. Transp. Geogr. 2016, 52, 38–50. [Google Scholar] [CrossRef]
- Nelson, T.A.; Denouden, T.; Jestico, B.; Laberee, K.; Winters, M. BikeMaps.org: A Global Tool for Collision and Near Miss Mapping. Front. Public Health 2015, 3, 53. [Google Scholar] [CrossRef] [PubMed]
- Straub, M.; Graser, A. Learning from Experts: Inferring Road Popularity from GPS Trajectories. GI_Forum J. Geogr. Inf. Sci. 2015, 2015, 41–50. [Google Scholar] [CrossRef]
Figure 1.
Workflow for the representation and processing of routing criteria. (a) Relate routing criteria to attributes; (b) assign attributes to road segments and intersections; (c) set parameters in a routing engine; (d) find optimal path.
Figure 1.
Workflow for the representation and processing of routing criteria. (a) Relate routing criteria to attributes; (b) assign attributes to road segments and intersections; (c) set parameters in a routing engine; (d) find optimal path.

Figure 2.
Geographic coverage of analyzed applications that do not provide a worldwide routing service.
Figure 2.
Geographic coverage of analyzed applications that do not provide a worldwide routing service.

Figure 3.
Graphical user interface design for the selection of routing criteria. (a) OpenRouteService with radio buttons; (b) Radroutenplaner Region Stuttgart with check boxes; (c) Fietsrouteplanner with combo boxes; (d) MVV Radroutenplaner with slider bars.
Figure 3.
Graphical user interface design for the selection of routing criteria. (a) OpenRouteService with radio buttons; (b) Radroutenplaner Region Stuttgart with check boxes; (c) Fietsrouteplanner with combo boxes; (d) MVV Radroutenplaner with slider bars.

Figure 4.
Factors that contribute to the routing criterion “safety” according to Hochmair [19] (orange), and general routing criteria (green). Both classes are mapped onto the analyzed portals in the matrix to the right.
Figure 4.
Factors that contribute to the routing criterion “safety” according to Hochmair [19] (orange), and general routing criteria (green). Both classes are mapped onto the analyzed portals in the matrix to the right.

Figure 5.
Analyzed bicycle routing portals: Number of safety related routing criteria per portal (a); geographical coverage and total number of cycling related criteria per portal (b); and data sources (c).
Figure 5.
Analyzed bicycle routing portals: Number of safety related routing criteria per portal (a); geographical coverage and total number of cycling related criteria per portal (b); and data sources (c).


Table 1.
The portals were evaluated with regard to the following routing criteria.
| Criteria Defining “Safety” According to [19] | Routing Criteria |
|---|---|
|
|
Table 2.
List of the analyzed bicycle routing portals (last access 14 November 2017).
Table 3.
Number of safety related criteria and all routing criteria, analyzed for routing portals that operate on different levels of geographic coverage.
Table 3.
Number of safety related criteria and all routing criteria, analyzed for routing portals that operate on different levels of geographic coverage.
| Geographical Coverage | Local/Regional | National/Continental/Global | ||
|---|---|---|---|---|
| Criteria | Mean (SD) | Median | Mean (SD) | Median |
| Safety criteria | 0.94 (0.97) | 1 | 0.44 (0.86) | 0 |
| All criteria | 3.53 (1.28) | 4 | 2.44 (1.42) | 3 |
© 2018 by the authors. Licensee MDPI, Basel, Switzerland. This article is an open access article distributed under the terms and conditions of the Creative Commons Attribution (CC BY) license (http://creativecommons.org/licenses/by/4.0/).
Share and Cite
MDPI and ACS Style
Loidl, M.; Hochmair, H.H. Do Online Bicycle Routing Portals Adequately Address Prevalent Safety Concerns? Safety 2018, 4, 9. https://0-doi-org.brum.beds.ac.uk/10.3390/safety4010009
AMA Style
Loidl M, Hochmair HH. Do Online Bicycle Routing Portals Adequately Address Prevalent Safety Concerns? Safety. 2018; 4(1):9. https://0-doi-org.brum.beds.ac.uk/10.3390/safety4010009
Chicago/Turabian StyleLoidl, Martin, and Hartwig H. Hochmair. 2018. "Do Online Bicycle Routing Portals Adequately Address Prevalent Safety Concerns?" Safety 4, no. 1: 9. https://0-doi-org.brum.beds.ac.uk/10.3390/safety4010009
Note that from the first issue of 2016, this journal uses article numbers instead of page numbers. See further details here.