A Retrospective, Cross-Sectional Cohort Study Examining the Risk of Unintentional Fatal Drowning during Public Holidays in Australia


1
Royal Life Saving Society—Australia, Broadway, NSW 2007, Australia
2
College of Public Health, Medical and Veterinary Sciences, James Cook University, Townsville, QLD 4011, Australia
*
Author to whom correspondence should be addressed.
Safety 2018, 4(4), 42; https://0-doi-org.brum.beds.ac.uk/10.3390/safety4040042
Submission received: 10 August 2018
/
Revised: 18 September 2018
/
Accepted: 20 September 2018
/
Published: 28 September 2018
Abstract
:Australia’s celebration of its public holidays often involves aquatic recreation, frequently mixed with consumption of alcohol, both of which are risk factors for drowning. This study examines how the demographics and circumstances of public holiday drownings compare to the average day drownings. A total population survey (1 July 2002 to 30 June 2017) of unintentional fatal drownings in Australia were extracted from the Royal Life Saving National Fatal Drowning Database. Date of drowning and state/territory of residence were used to determine if the drowning occurred on a public holiday in the person’s place of residence. 4175 persons drowned during the study period. There was a statistically significant difference between the incidence of fatal drowning on public holidays and the other days, with fatal drowning 1.73 times more likely to occur on public holidays (CI: 1.57–1.89). The increased risk of drowning on public holidays should inform the timing and the content of drowning prevention campaigns and strategies.
1. Introduction
Drowning is a global public health threat, with an estimated number of 372,000 people fatally drowning annually [1]. In Australia, on average 281 people fatally drown each year [2], with the common risk factors include being male [3], being an Aboriginal and Torres Strait Islander [4], alcohol consumption [5,6] and exposure to rivers [7].
Prior research suggests that school aged children experience a significant increase in the risk of fatal drowning during the school holidays [8], with days of holiday posing a relative risk of 2.40 compared with school days.
Australia’s states and territories have an average of between 10.2 and 11.5 public holidays annually, which are made up of a combination of uniform national holidays (e.g., Christmas Day, Good Friday) and state/territory-specific holidays (e.g., Melbourne Cup day, celebrated only in the state of Victoria). Anecdotally, drowning prevention practitioners suspect that drowning risk increases on public holidays, due to the different patterns of leisure [9], the involvement of alcohol [10] and increased likelihood of travel to unfamiliar locations [11]. This supposition has not yet been tested epidemiologically.
This study provides a comprehensive analysis of the epidemiology of fatal unintentional drowning in Australia, comparing the frequency and circumstances of unintentional drowning fatalities between public holidays and other days.
2. Materials and Methods
Unintentional fatal drowning data for all persons with a listed Australian state or territory of residence between 1 July 2002 and 30 June 2017 were extracted from the Royal Life Saving National Fatal Drowning Database (the Database), representing the full period covered by the Database. The Database uses a triangulation method, sourcing data from media monitoring, police reports, child death review teams and lifesaving organizations [12]. Cases are cross-referenced with the National Coronial Information System (NCIS) [13] to finalize inclusion based on the cause of death (primary or contributory cause of unintentional drowning), as well as the causal factors. Intentional drowning deaths or deaths in water due to natural causes are excluded. We believe that this approach results in a complete count of fatal drowning in Australia as it is possible with existing data sets and more accurate than using International Classification of Diseases (ICD)-based approaches alone [12].
The date of drowning incident was used to code the drowning incidents on public holidays. The state or territory of residence of the victim was used, rather than the incident location (where different) to determine the relevant public holidays. Persons with no recorded residence in Australia (N = 80) were excluded from this analysis.
State and territory public holiday dates (including shared national public holidays) were collated [14,15,16]. The exact number of public holidays over the sample period, which is used to calculate the per-day relative risk (RR), varies between states and territories. Our calculations estimate the number of public holidays experienced by the average Australian using the population-weighted average number of state public holiday days over the 5479 day sample period at 163.0, with actual public holidays by state or territory ranging from 152 to 172.
Public holidays were compared to the recorded date of drowning incident based on the recorded state or territory of residence. Relative Risk (RR) of drowning on a public holiday was calculated by comparing the public holiday drownings to non-public holiday drownings across a range of demographic and circumstantial variables.
The contribution of alcohol was allocated where the victim was found to have a blood alcohol concentration (BAC) ≥0.05% post mortem, due to the impact of a BAC at this level on concentration, reaction times, motor skills and risk-taking behavior [5,6]. This level was selected based on its use in legislation as the upper legal limit for driving a motor vehicle in Australia [17]. Cases where no BAC was available (N = 1754), were excluded from this analysis.
Subgroup analysis was conducted on persons found to be visitors to the site of drowning. Visitor status was determined by calculating the distance between residential and incident postcodes. Classifications used were: Visitor—Intrastate (residing in the same state/territory but >100 km from where they drowned) and Visitor—Interstate (residing in a different state/territory from where they drowned) [18]. Locals were excluded from the subgroup analysis.
The activity of ‘non-aquatic transport’ relates to drowning deaths as a result of incidents involving means of transport not intended for aquatic use such as cars, motorbikes, aircraft and bicycles [18]. The most common example of non-aquatic transport related drowning deaths are cars, which enter floodwaters [19].
Sensitivity analysis was conducted to determine the effect of public holidays relative to weekends by repeating the analysis on alternative non-public holiday samples either excluding all weekend days and weekend fatal incidents or restricted to weekends.
The difference in RR, modelling treatment and control group sizes as proportional to the number of days in each category, was calculated and significance tested against a hypothesis of no difference in RR.
Our results set out the breakdown of deaths across the public holidays and other days across a range of demographic characteristics as well as by location and activity prior to drowning. The key outcome presented is the RR of drowning on a public holiday compared to a normal day, which is equivalent to the ratio of the incidence of drowning on a public holiday as against any other day. The reported test statistics show the probability of the observed difference in RR between the public holidays and other days having arisen by chance over the 15 year sample period as well as confidence intervals (CI) for 95% probability. Data analysis was performed using Microsoft Excel 2013 and Microsoft Visual Basic for Applications 7.1.
Results are reported in accordance with the STROBE statement [20]. This study received ethics approval from the Victorian Department of Justice and Regulation Human Research Ethics Committee (JHREC) (CF/07/13729; CF/10/25057, CF/13/19798).
3. Results
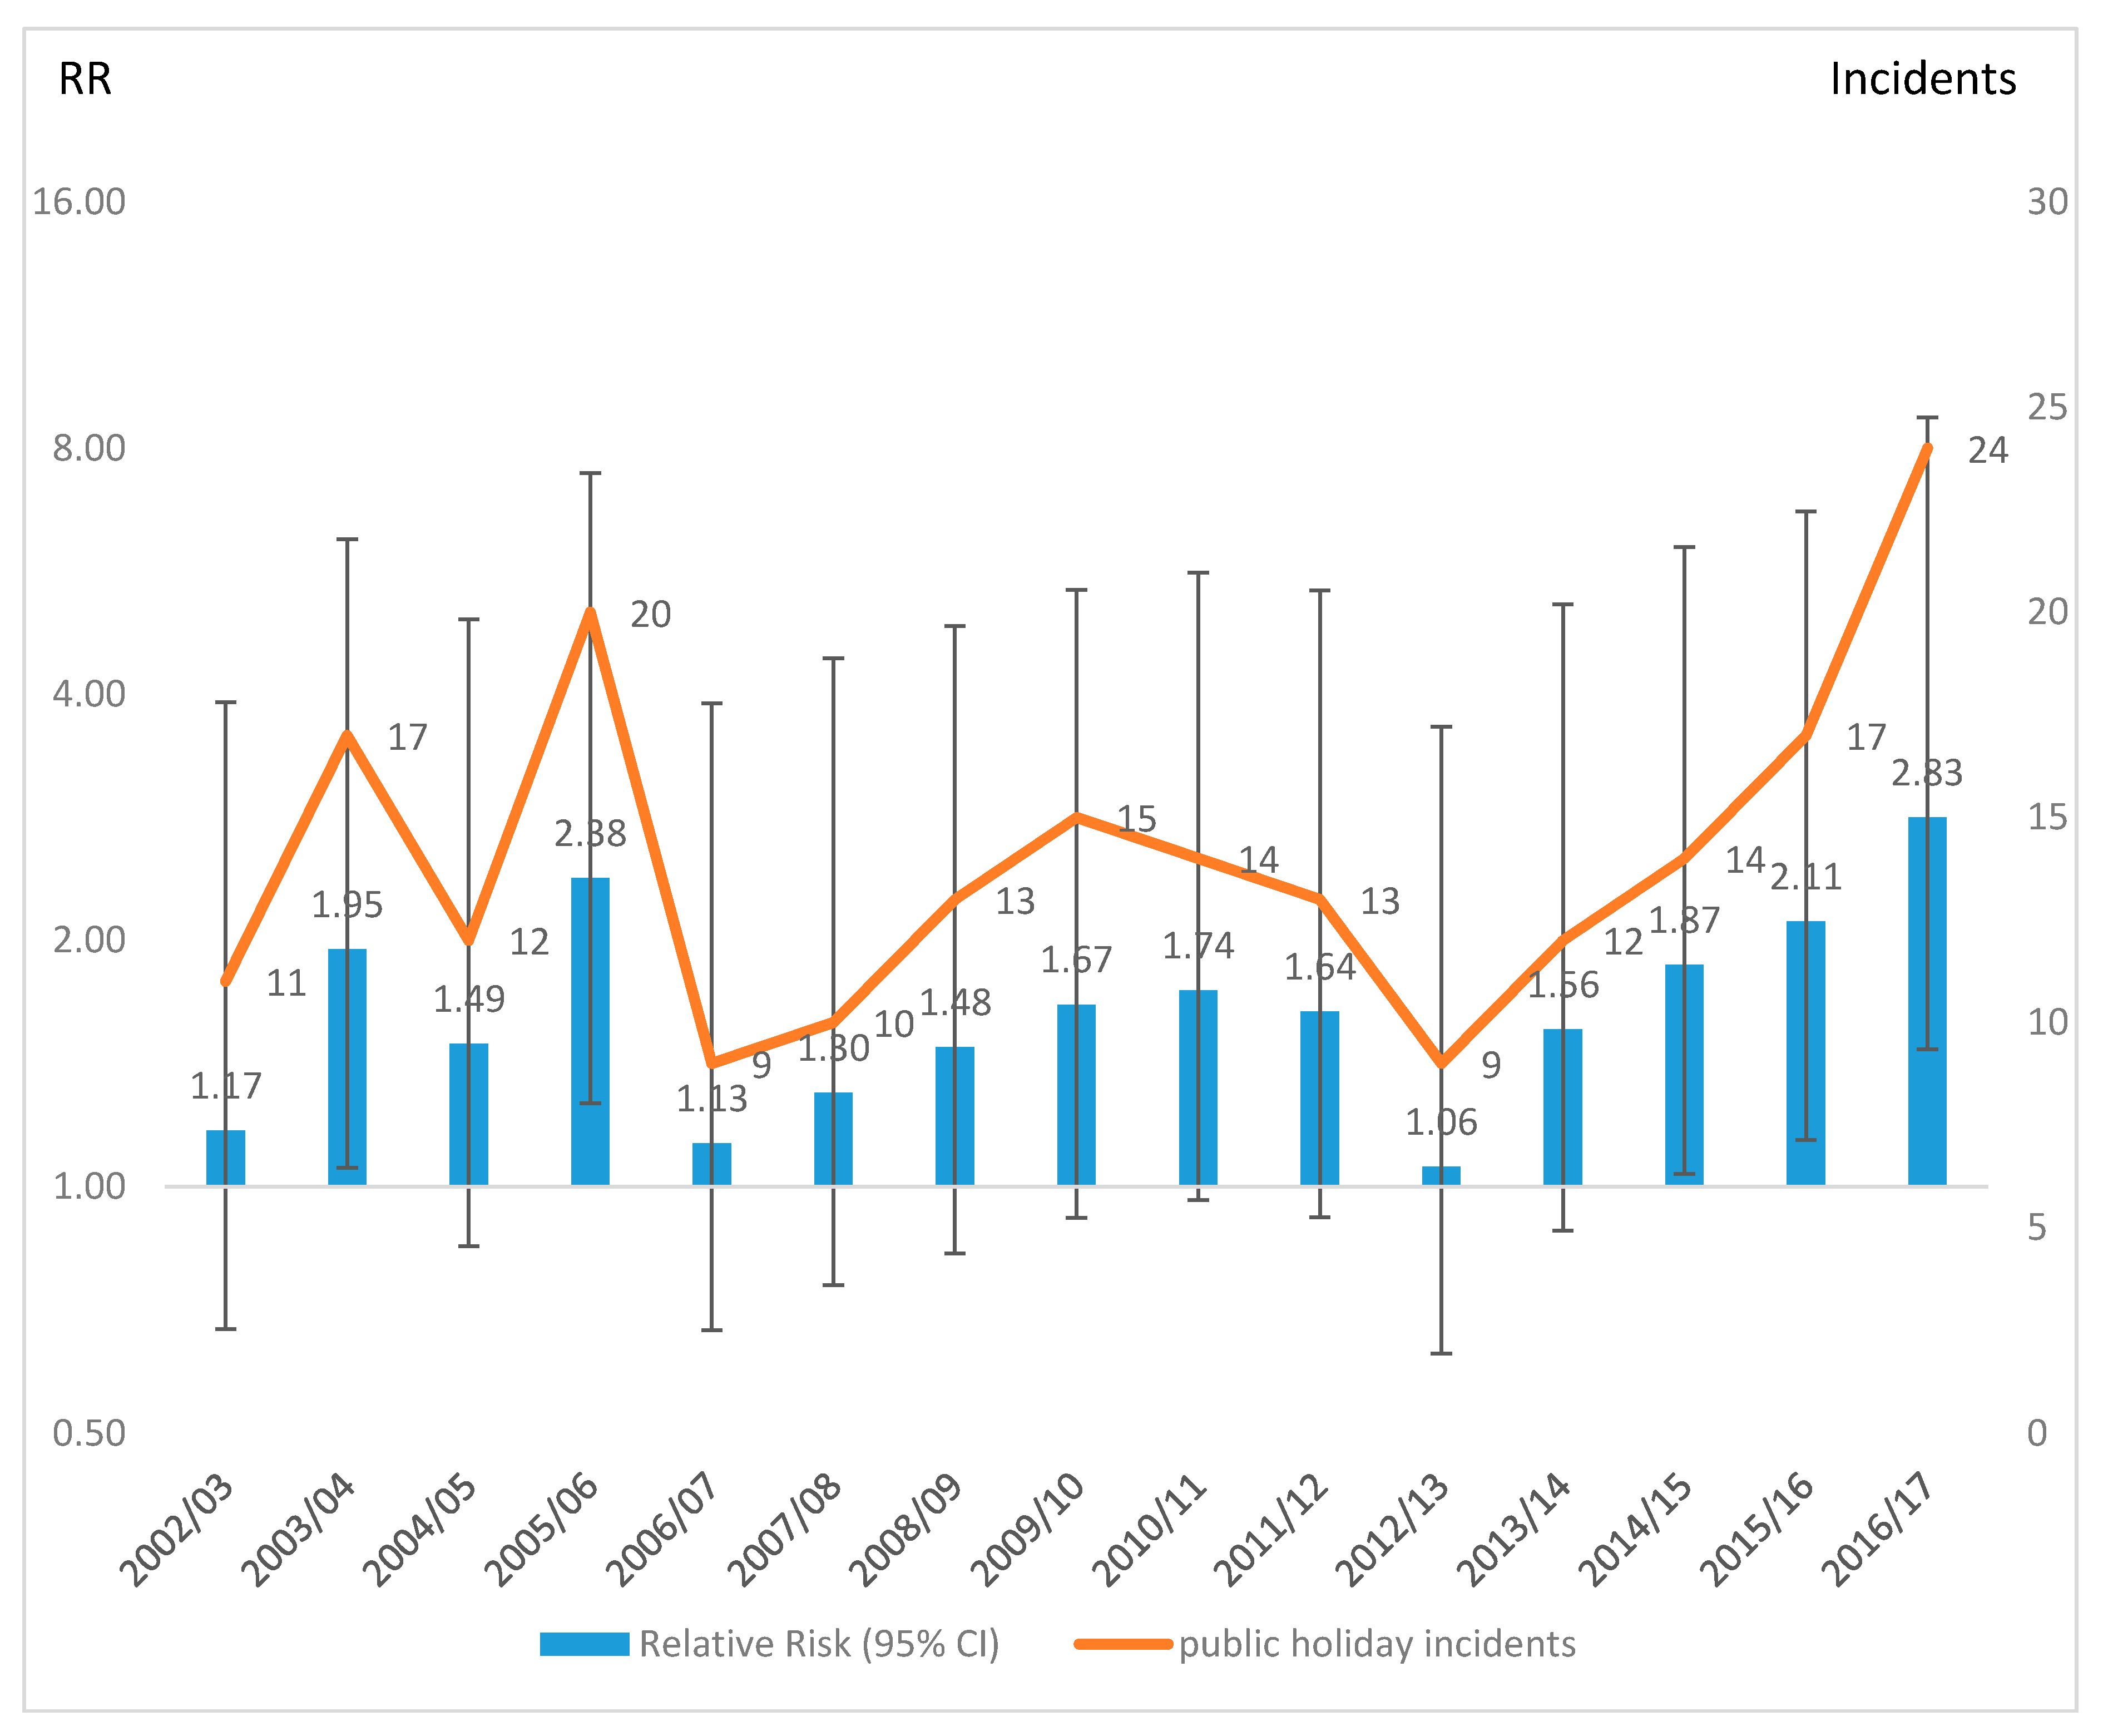
There were 4175 drowning deaths with a recorded Australian state/territory of residence during the fifteen year study period; 210 of which occurred on a public holiday in the drowning victim’s place of residence. Annual deaths on public holidays show significant variation, as low as 9 deaths observed in both 2006/07 and 2012/13 and as high as 24 in 2016/17 (Figure 1).
The RR of fatal drowning on a public holiday compared to any other day varies over time. RR of drowning on a public holiday broadly tracks the absolute frequency of these incidents, with the lowest RR (RR = 1.06; CI: 0.65–1.73) recorded in 2012/13 and the highest (RR = 2.83 CI: 2.36–3.82) in 2016/17 (Figure 1).
There was a significantly higher per-day incidence of fatal drowning on public holidays compared to other days of the year. Australians were 1.73 times (CI: 1.57–1.89) as likely to fatally drown on a public holiday as on other days. The influence was particularly strong for Australians aged 10 to 34 years. These age groups experienced at least a two-fold increase in the risk of fatal drowning on public holidays, with the increase peaking at 3.78 times (CI: 1.85–7.74) higher in persons aged 10–14 years (Table 1).
To examine whether the increased risk is similar to increased risk on weekends, this study compared fatal drowning incidents on public holidays to incidents on weekdays, excluding weekends, (N = 2601), which gives an estimated RR of 1.93 times (CI: 1.54–2.42). Comparing the rates of fatal drowning on public holidays to those on weekends only yields a RR of 1.26 (CI: 1.14–1.40). These results imply that weekends are more dangerous than weekdays, but that public holidays pose the most risk (Table 1).
Sensitivity analysis examining the impact of public holidays relative to weekdays only and weekends only showed that the public holiday effect persists when compared to both subgroups, but that the elevated risk was higher compared to weekdays (RR = 1.93, CI: 1.54–2.42) than weekends (RR = 1.26, CI: 1.14–1.40) (Table 2).
The locations with the largest increased risk of fatal drowning on public holidays were those associated with leisure activities, including beaches (RR = 2.22; CI: 1.69–2.92), swimming pools (RR = 2.04; CI: 1.24–3.36) and rocks (RR = 1.98; CI: 1.46–2.68). There was a statistically insignificant reduction in the rate of fatal drowning in bathtubs and spa baths (RR = 0.8; CI: 0.38–1.66; p = 0.54). The activities which saw the largest increase in RR on public holidays were swimming and recreating (RR = 2.42; CI: 1.93–3.04) and non-aquatic transport (RR = 2.10; CI: 1.27–3.46), suggesting that the types of recreation undertaken on public holidays help to explain their higher risk of drowning (Table 2).
Both intrastate and interstate visitors faced elevated risk on public holidays, with RRs of 2.53 (CI: 1.87–3.43) and 2.28 (CI: 1.40–3.70) respectively, potentially reflecting unfamiliarity with the area (Table 2).
Public holidays were a major risk factor in alcohol-related fatal drowning, with a 107% increase in the risk of fatal drowning with a BAC of ≥0.05% on public holidays (RR = 2.07; CI: 1.53–2.80). The RR for victims whose BAC was tested and found to be <0.05% was 1.77 (CI: 1.50–2.10) (Table 2).
4. Discussion
A disproportionate share of fatal unintentional drowning occurs on public holidays, accounting for 5% of fatalities in only 3% of the year. This effect is strong and statistically significant but does not comprise a large enough share of all incidents to suggest that drowning prevention efforts should focus exclusively on public holidays.
Rather, drowning prevention strategies should target the common features of public holidays which make them more dangerous, such as increased unsupervised leisure time for younger people, often away from home and in unfamiliar locales, increased alcohol consumption and spending time in the pool or at the beach, and develop broader messages aimed at raising awareness of these risks at all times.
Alcohol is a known risk factor for drowning [5], with alcohol known to be present in 26% of Australian river drownings between 2002–2012 [21], 38% of drowning deaths in Sweden between 1992–2009 [22], 65% of boating-related drownings in Finland between 2000–2009 [23], and 37% of drowning deaths in Canada between 2008 and 2012 [24]. This study identified 26% of drowning deaths which were known to involve victims with a BAC ≥0.05, with an increased risk of alcohol-related drowning when compared to non-holidays. Strategies to combat excessive alcohol consumption while around water and when undertaking aquatic activity will be required, with a particular focus on the festive period and public holidays during the warmer months.
This study addresses the apparent similarities between weekends and public holidays via sensitivity analyses, concluding that public holidays pose risks over-and-above decreased attendance at work and school common to weekends and public holidays. Public holidays are an imperfect proxy for nonattendance at work, given that some Australians attend work on public holidays. Data provided by Transport for NSW show that the number of public transport passengers during peak hours declines by around 75% on public holidays, even including non-work trips. Our results are consistent with the previous studies of school holiday drowning risk in children and adolescents [8].
Data on the contribution of alcohol to public holiday fatal drowning may be skewed by the number of cases for which no BAC was available (N = 1754).
Data on public holidays do not distinguish at the postcode level observance of a small number of local holidays, such as Melbourne Cup Day, which may not be celebrated statewide, and which may be unofficially celebrated in parts of other states.
We do not adjust for the seasonal distribution of public holidays, which may introduce error since warmer seasons are positively correlated with fatal drowning [2]. As Australia’s public holidays are concentrated in summer and autumn, future research could assess the links between warm-weather and public holiday drowning.
Future research could also consider the effect of public holidays on drowning during adjacent weekends or the surrounding week, to capture the possibility of increased travel and casual leave at these times.
5. Conclusions
This study found that Australians have 1.73 times higher risk of fatally drowning on a public holiday than other days. This risk is pronounced for people aged 10–34 years and for recreational activities undertaken at aquatic locations such as beaches, swimming pools and rocks. Such findings should be used to inform the development of general drowning prevention campaigns including strategies around public holidays, such as the role of alcohol in increased drowning risk, particularly on public holidays.
Author Contributions
Conceptualization, P.D.B. and A.E.P.; Methodology, P.D.B. and A.E.P.; Validation, A.E.P.; Formal Analysis, P.D.B.; Investigation, P.D.B. and A.E.P.; Writing-Original Draft Preparation, P.D.B. and A.E.P.; Writing-Review & Editing, P.D.B. and A.E.P.
Funding
This research received no external funding.
Acknowledgments
This research is supported by the Royal Life Saving Society—Australia. Research at the Royal Life Saving Society—Australia is supported by the Australian Government. The authors are responsible for the use made of the data in this study.
Conflicts of Interest
The authors declare no conflict of interest.
References
- World Health Organization. Global Report on Drowning: Preventing a Leading Killer; World Health Organization: Geneva, Switzerland, 2014. [Google Scholar]
- Royal Life Saving Society—Australia. Royal Life Saving National Downing Report 2017; Royal Life Saving Society: Sydney, Australia, 2017. [Google Scholar]
- Franklin, R.C.; Scarr, J.P.; Pearn, J.H. Reducing drowning deaths: The continued challenge of immersion fatalities in Australia. Med. J. Aust. 2010, 192, 123–126. [Google Scholar] [PubMed]
- Wallis, B.A.; Watt, K.; Franklin, R.C.; Kimble, R.M. Drowning in Aboriginal and Torres Strait Islander children and adolescents in Queensland (Australia). BMC Public Health 2015, 15, 795. [Google Scholar] [CrossRef] [PubMed]
- Driscoll, T.R.; Harrison, J.A.; Steenkamp, M. Review of the role of alcohol in drowning associated with recreational aquatic activity. Inj. Prev. 2004, 10, 107–113. [Google Scholar] [CrossRef] [PubMed] [Green Version]
- Peden, A.E.; Franklin, R.C.; Leggat, P.A. Alcohol and its contributory role in fatal drowning in Australian rivers, 2002–2012. Accid. Anal. Prev. 2017, 98, 259–265. [Google Scholar] [CrossRef] [PubMed]
- Peden, A.E.; Franklin, R.C.; Leggat, P.A. Exploring visitation at rivers to understand drowning risk. Inj. Prev. 2018. [Google Scholar] [CrossRef] [PubMed]
- Peden, A.E.; Barnsley, P.D.; Queiroga, A.C. The association between school attendance and unintentional fatal drowning among children and adolescents aged 5–17 years. J. Paediatr. Child Health 2018. [Google Scholar] [CrossRef]
- Peden, A.E.; Franklin, R.C.; Leggat, P.A. International travelers and unintentional fatal drowning in Australia—A 10 year review 2002–2012. J. Travel Med. 2016, 23, 1–7. [Google Scholar] [CrossRef] [PubMed]
- Lloyd, B.; Matthews, S.; Livingston, M.; Jayasekara, H.; Smith, K. Alcohol intoxication in the context of major public holidays, sporting and social events: A time–series analysis in Melbourne, Australia, 2000–2009. Addiction 2013, 108, 701–709. [Google Scholar] [CrossRef] [PubMed]
- Mahony, A.; Scarr, J.; Peden, A.E. NSW Summer Drowning Report: An Investigation into Drowning Deaths in NSW between 1 December 2016 and 28 February 2017; Royal Life Saving Society: Sydney, Australia, 2017. [Google Scholar]
- Peden, A.E.; Franklin, R.C.; Mahony, A.M.; Barnsley, P.D.; Scarr, J. Using a retrospective cross-sectional study to analyse unintentional fatal drowning in Australia: ICD-10 coding-based methodologies verses actual deaths. BMJ Open 2017, 7, e019407. [Google Scholar] [CrossRef] [PubMed]
- Victorian Institute of Forensic Medicine. National Coronial Information System (NCIS). Available online: www.ncis.org.au (accessed on 18 April 2018).
- Australia.gov.au. Public Holidays. Available online: www.australia.gov.au/about-australia/special-dates-and-events/public-holidays (accessed on 11 November 2017).
- Calender-Australia.com. Holidays Australia. Available online: www.calendar-australia.com/holidays/ (accessed on 12 November 2017).
- Australian Public Holidays Dates Machine Readable Dataset. Available online: https://data.gov.au/dataset/australian-holidays-machine-readable-dataset (accessed on 10 November 2017).
- New South Wales Health. Fact Sheets—Alcohol. Available online: http://www.health.nsw.gov.au/mhdao/Factsheets/Pages/alcohol.aspx (accessed on 28 August 2018).
- Royal Life Saving Society—Australia. Royal Life Saving Society—Australia Drowning Database Definitions and Coding Manual 2017; Peden, A.E., Ed.; Royal Life Saving Society: Sydney, Australia, 2017. [Google Scholar]
- Peden, A.E.; Franklin, R.C.; Leggat, P.; Aitken, P. Causal Pathways of Flood Related River Drowning Deaths in Australia. PLoS Curr. Disasters 2017, 1, 1–24. [Google Scholar] [CrossRef]
- Von Elm, E.; Altman, D.G.; Egger, M.; Pocock, S.J.; Gøtzsche, P.C.; Vandenbroucke, J.P.; STROBE Initiative. The Strengthening the Reporting of Observational Studies in Epidemiology (STROBE) statement: Guidelines for reporting observational studies. J. Clin. Epidemiol. 2008, 61, 344–349. [Google Scholar] [CrossRef] [PubMed]
- Peden, A.E.; Franklin, R.C.; Leggat, P.A. The Hidden Tragedy of Rivers: A decade of unintentional fatal drowning in Australia. PLoS ONE 2016, 11, e0160709. [Google Scholar] [CrossRef] [PubMed]
- Pajunen, T.; Vuori, E.; Vincenzi, F.F.; Lillsunde, P.; Smith, G.; Lunetta, P. Unintentional drowning: Role of medicinal drugs and alcohol. BMC Public Health 2017, 17, 388. [Google Scholar] [CrossRef] [PubMed]
- Ahlm, K.; Saveman, B.-I.; Björnstig, U. Drowning deaths in Sweden with emphasis on the presence of alcohol and drugs—A retrospective study, 1992–2009. BMC Public Health 2013, 13, 216. [Google Scholar] [CrossRef] [PubMed]
- Clemens, T.; Tamim, H.; Rotondi, M.; Macpherson, A.K. A population based study of drowning in Canada. BMC Public Health 2016, 16, 559. [Google Scholar] [CrossRef] [PubMed]
Figure 1.
Trends over time in relative risk of drowning death on public holidays (relative to other days of the year) and the number of fatal incidents on public holidays. Note: The left hand axis is logarithmic (base 2) in order to show the confidence intervals on an appropriate scale.
Figure 1.
Trends over time in relative risk of drowning death on public holidays (relative to other days of the year) and the number of fatal incidents on public holidays. Note: The left hand axis is logarithmic (base 2) in order to show the confidence intervals on an appropriate scale.

Table 1.
Demographics of fatal unintentional drowning on public holidays and other days in Australia, 2002/03–2016/17 (N = 4175).
Table 1.
Demographics of fatal unintentional drowning on public holidays and other days in Australia, 2002/03–2016/17 (N = 4175).
| Variables Analyzed | Total | Public Holiday | Other Days | Z Statistic (p-Value) | RR (Holiday Compared to Other Days) (95% CI) | |||
|---|---|---|---|---|---|---|---|---|
| N | % | N | Incidence by Time of Exposure 1 | N | Incidence by Time of Exposure 1 | |||
| Total | 4175 | 100.0 | 210 | 31.26 | 3965 | 18.13 | 16.01 (<0.01) * | 1.73 (1.57–1.89) |
| Sex | ||||||||
| Male | 3242 | 77.7 | 171 | 51.16 | 3071 | 28.21 | 12.06 (<0.01) * | 1.82 (1.63–2.02) |
| Female | 933 | 22.3 | 39 | 11.56 | 894 | 8.14 | 2.39 (0.02) | 1.42 (1.07–1.90) |
| Age group | ||||||||
| 0–4 Years | 458 | 11.0% | 22 | 50.00 | 436 | 30.44 | 2.41 (0.02) | 1.65 (1.10–2.46) |
| 5–9 Years | 117 | 2.8% | 4 | 9.56 | 113 | 8.30 | 0.29 (0.78) | 1.15 (0.43–3.09) |
| 10–14 Years | 77 | 1.8% | 8 | 19.33 | 69 | 5.12 | 3.86 (<0.01) * | 3.78 (1.85–7.74) |
| 15–17 Years | 81 | 1.9% | 6 | 23.34 | 75 | 8.96 | 2.37 (0.02) | 2.61 (1.15–5.91) |
| 18–24 Years | 409 | 9.8% | 28 | 42.39 | 381 | 17.72 | 4.79 (<0.01) * | 2.40 (1.68–3.42) |
| 25–34 Years | 618 | 14.8% | 43 | 44.50 | 575 | 18.28 | 6.19 (<0.01) * | 2.44 (1.85–3.22) |
| 35–44 Years | 538 | 12.9% | 23 | 24.30 | 515 | 16.71 | 1.87 (0.06) | 1.46 (0.98–2.15) |
| 45–64 Years | 1082 | 26.0% | 49 | 53.96 | 1033 | 34.94 | 3.02 (<0.01) * | 1.48 (1.15–1.90) |
| 65 Years or over | 795 | 19.0% | 27 | 35.17 | 768 | 30.73 | 0.76 (0.45) | 1.15 (0.80–1.64) |
| Comparison to weekends | ||||||||
| Excluding weekends | 2601 | 62.3% | 175 | 42.93 | 2426 | 22.22 | 14.46 (<0.01) * | 1.93 (1.54–2.42) |
| Public holidays compared to weekends only | 1714 | 41.1% | 175 | 17.97 | 1539 | 14.87 | 15.76 (<0.01) * | 1.26 (1.14–1.40) |
* Difference in relative risk is significant at the 1% level. 1 Incidence is per 100,000 persons per day over the entire sample period.
Table 2.
Circumstances of unintentional fatal drowning on public holidays and other days in Australia, 2002/03–2016/17.
Table 2.
Circumstances of unintentional fatal drowning on public holidays and other days in Australia, 2002/03–2016/17.
| Variables Analyzed | Total | Public Holiday | Other Days | Z Statistic (p-Value) | RR (Holiday Compared to Other Days) (CI) | |||
|---|---|---|---|---|---|---|---|---|
| N | % | N | Incidence by Time of Exposure 1 | N | Incidence by Time of Exposure 1 | |||
| Location of drowning incident (N = 4175) | ||||||||
| Bathtub/Spa Bath | 294 | 7.0% | 7 | 2.09 | 287 | 2.64 | 0.62 (0.54) | 0.80 (0.38–1.66) |
| Beach | 689 | 16.5% | 44 | 13.16 | 645 | 5.93 | 5.64 (<0.01) * | 2.22 (1.69–2.92) |
| Lake/Dam/Lagoon | 393 | 9.4% | 21 | 6.28 | 372 | 3.42 | 2.87 (<0.01) * | 1.84 (1.22–2.79) |
| Ocean/Harbour | 674 | 16.1% | 35 | 10.47 | 639 | 5.87 | 3.62 (<0.01) * | 1.79 (1.31–2.43) |
| River/Creek/Stream | 1071 | 25.7% | 47 | 14.06 | 1024 | 9.41 | 3.04 (<0.01) * | 1.50 (1.16–1.94) |
| Swimming Pool | 255 | 6.1% | 15 | 4.49 | 240 | 2.21 | 2.80 (<0.01) * | 2.04 (1.24–3.36) |
| Rocks | 630 | 15.1% | 36 | 10.77 | 594 | 5.46 | 4.30 (<0.01) * | 1.98 (1.46–2.68) |
| Other/unknown | 169 | 4.0% | 5 | 1.50 | 164 | 1.51 | 0.01 (0.99) | 0.99 (0.41–2.39) |
| Blood Alcohol Content (n = 2421) # | ||||||||
| Blood alcohol content <0.05% | 1802 | 74.4% | 93 | 27.82 | 1709 | 15.70 | 6.67 (<0.01) * | 1.77 (1.50–2.10) |
| Blood alcohol content ≥0.05% | 619 | 25.6% | 37 | 11.07 | 582 | 5.35 | 4.67 (<0.01) * | 2.07 (1.53–2.80) |
| Activity immediately prior to drowning (N = 4175) | ||||||||
| Bathing | 274 | 6.6% | 7 | 2.09 | 267 | 2.45 | 0.42 (0.33) | 0.86 (0.41–1.78) |
| Boating and Watercraft | 542 | 13.0% | 20 | 5.98 | 522 | 4.80 | 1.03 (0.30) | 1.25 (0.82–1.90) |
| Falls | 792 | 19.0% | 38 | 11.37 | 754 | 6.93 | 3.26 (<0.01) * | 1.64 (1.22–22.1) |
| Diving | 200 | 4.8% | 8 | 2.39 | 192 | 1.76 | 0.87 (0.38) | 1.36 (0.68–2.71) |
| Jumped In | 67 | 1.6% | 4 | 1.20 | 63 | 0.58 | 1.45 (0.15) | 2.07 (0.76–5.62) |
| Non–aquatic Transport 1 | 248 | 5.9% | 15 | 4.49 | 233 | 2.14 | 2.92 (<0.01) * | 2.10 (1.27–3.46) |
| Rock Fishing | 168 | 4.0% | 8 | 2.39 | 160 | 1.47 | 1.38 (0.17) | 1.63 (0.81–3.26) |
| Swimming and Recreating | 854 | 20.5% | 59 | 17.65 | 795 | 7.30 | 7.36 (<0.01) * | 2.42 (1.93–3.04) |
| Other and Unknown | 1030 | 24.7% | 51 | 15.26 | 979 | 9.00 | 4.14 (<0.01) * | 1.70 (1.33–2.17) |
| Visitors (n = 759) | ||||||||
| Intrastate visitors | 514 | 37 | 11.07 | 477 | 4.38 | 5.92 (<0.01) * | 2.53 (1.87–3.43) | |
| Interstate visitors | 245 | 16 | 4.79 | 229 | 2.10 | 3.35 (<0.01) * | 2.28 (1.40–3.70) | |
* Difference in relative risk is significant at the 1% level. # Cases with unknown BAC were removed prior to analysis for this variable. 1 Incidence is per 100,000 persons per day over the entire sample period. In the absence of exposure data for activities et al., incidence on both holidays and other days is measured against the population as a whole.
© 2018 by the authors. Licensee MDPI, Basel, Switzerland. This article is an open access article distributed under the terms and conditions of the Creative Commons Attribution (CC BY) license (http://creativecommons.org/licenses/by/4.0/).
Share and Cite
MDPI and ACS Style
Barnsley, P.D.; Peden, A.E. A Retrospective, Cross-Sectional Cohort Study Examining the Risk of Unintentional Fatal Drowning during Public Holidays in Australia. Safety 2018, 4, 42. https://0-doi-org.brum.beds.ac.uk/10.3390/safety4040042
AMA Style
Barnsley PD, Peden AE. A Retrospective, Cross-Sectional Cohort Study Examining the Risk of Unintentional Fatal Drowning during Public Holidays in Australia. Safety. 2018; 4(4):42. https://0-doi-org.brum.beds.ac.uk/10.3390/safety4040042
Chicago/Turabian StyleBarnsley, Paul D., and Amy E. Peden. 2018. "A Retrospective, Cross-Sectional Cohort Study Examining the Risk of Unintentional Fatal Drowning during Public Holidays in Australia" Safety 4, no. 4: 42. https://0-doi-org.brum.beds.ac.uk/10.3390/safety4040042
Note that from the first issue of 2016, this journal uses article numbers instead of page numbers. See further details here.