Consequences of Increases in Wild Boar-Vehicle Accidents 2003–2016 in Sweden on Personal Injuries and Costs


1
Calluna AB, Hästholmsvägen 28, SE-131 30 Nacka, Sweden
2
Department of Construction Engineering and Lighting Science, School of Engineering, Jönköping University, P.O. Box 1026, SE-551 11 Jönköping, Sweden
3
Department of Economics, Swedish University of Agricultural Sciences, Box 7013, SE-750 07 Uppsala, Sweden
*
Author to whom correspondence should be addressed.
Safety 2018, 4(4), 53; https://0-doi-org.brum.beds.ac.uk/10.3390/safety4040053
Submission received: 19 October 2018
/
Revised: 11 November 2018
/
Accepted: 14 November 2018
/
Published: 19 November 2018
Abstract
:This study examined whether the rising trends of wild boar (Sus scrofa)-vehicle accidents in Sweden are accompanied by a higher amount of personal injuries and costs. Temporal trends in accident frequencies and the number of persons injured in wild boar-vehicle accidents were examined for 2003–2016, and the cost of wild boar-vehicle accidents was calculated. Results show increases in the number of personal injuries, and increased costs, particularly after 2010–2012. The total number of wild boar accidents correlated with the number of injured persons as well as with the number of accidents with personal injuries. Approximately one person (1.13%) is injured per 100 wild boar-vehicle accidents, and approximately one accident per 200 wild boar-vehicle accidents will result in one or more persons with injuries (0.5%). However, most of the persons injured have slighter injuries. Although the number of wild boar-vehicle accidents and the number of persons injured in the accidents have increased, the frequency of accidents resulting in personal injuries is still at low levels in comparison with, for example, frequencies of personal injuries for moose accidents. The cost for wild boar-vehicle accidents has increased between 2003 to 2016 and is currently estimated to vary between approximately EUR 9.66–12.31 million per year.
1. Introduction
Wildlife-vehicle collisions are a worldwide acknowledged growing problem with millions of accidents with large mammals occurring every year [1,2,3]. Wildlife-vehicle collisions cause the deaths of millions of animals globally and have serious traffic safety consequences in the number of human fatalities and injuries, as well as causing substantial economic losses [4]. In the 1990s, Groot Bruinderink and Hazebroek [5] estimated that in Europe wildlife-vehicle collisions annually were approximately 507,000, resulting in 300 fatalities and 300,000 injuries and that the costs for the property damages were approximately $1 billion (US).
Wild boar (Sus scrofa) are among the most extensively distributed large mammals worldwide, and in many parts of Europe, the wild boar populations are increasing [6,7]. Vehicle accidents involving wild boars are also increasing in many new areas of the world due to the successful ability of wild boars to colonise and recolonise [5,8]. In Northern Europe, for example, wild boar has recolonised Finland, Sweden, and Norway [7], resulting in a 250% increase in the number of wild boar-vehicle accidents in Sweden between 2003 and 2011 [9]. More specifically, in Sweden in 2003 the number of reported wild boar-vehicle accidents were 755, and in 2017 they had increased to 6085 [10].
However, since wild boar is currently colonising new geographical areas in Sweden, it is likely that the number of wild boar-vehicle accidents will continue to increase in the future [11,12]. Countermeasures, for example, warning signs or wildlife fences, seem to have little success in mitigating wild boar-vehicle accidents in Sweden, e.g., [13]. Nevertheless, a 92% reduction in accidents was shown in Catalonia, Spain, when combining wildlife crossings and perimeter fencing [14].
Few studies have investigated the risk of vehicle accidents or risk of human injuries for wild boar accidents in comparison to all wildlife-vehicle accidents. In Spain, where the wild boar populations have grown and expanded [15], especially in the northern half of the Iberian Peninsula, wild animals (mainly wild boar and roe deer) cause 30–50% of all road traffic accidents. Bearing in mind that the national mean for wild animal accidents in Spain is 8.9%, the proportion of animal caused accidents in Northern Spain is very high [16]. Furthermore, wild boar-vehicle accidents can be especially damaging and harmful for humans, causing up to three times more injuries per collision in comparison with roe deer [16]. Even though the proportion of human injuries due to wildlife-vehicle collisions may be low under normal circumstances, such as an average of 8% in Catalonia, Spain, between 2007–2011, wild boar-vehicle accidents may account for as much as 59% of all wildlife-vehicle accidents causing human injury victims [14]. Similarly, in Spain (2006–2012), wild boar accidents alone accounted for 43% and 47% of the wildlife-vehicle accidents that resulted in injured persons and fatalities, respectively [16]. Consequently, the costs of wild boar-vehicle accidents may be substantial and were shown to increase by 41% in Spain during 2006–2012 [16].
Several studies have previously investigated the costs of wildlife-vehicle accidents, cf., [1,4,11,16,17,18,19], but few have managed to incorporate populational change over time [20] or investigated if the frequency of fatalities and personal injuries may change with time due to changes in wildlife populations or other factors [12]. The costs of fatalities and personal injuries are especially relevant to quantify when making calculation estimates on the cost-effectiveness of mitigation measures aimed to reduce wildlife accidents because fatalities and personal injuries often constitute a significant part of the total costs of wildlife-vehicle accidents. For example, in Swedish evaluations costs for property damages per se are estimated to EUR 1450 (1 EUR = 10.35 SEK, 6 November 2018, is used for all conversions), while fatalities and injuries are estimated to EUR 2222–2454,110 for 2014 [21]. Mitigation measures, for example, wildlife fences, are expensive in investment costs and require long-term maintenance needs. Also, wildlife fences may create ecological barriers with damaging effects on wildlife species through, e.g., population growth, gene flow and survival. Currently, no countermeasures directed toward reducing wild boar-vehicle accidents are being implemented in Sweden, but wildlife fences may sometimes be adapted to be resistant to wild boars.
A model was developed by Gren et al. [9] to quantify population dynamics and intrinsic growth rates based on traffic loads, traffic accidents and landscape characteristics in Sweden. The model predicts an 80% increase in wild boar populations for the future 30 years if hunting and traffic load remain the same. However, the increase of wild boars will be unevenly distributed, and it is therefore likely that increases of wild boar populations will be substantially higher in counties that are currently under invasion, resulting in a higher amount of wild boar-vehicle accidents in these counties. In the new areas, wild boars will be less effective in avoiding roads with high traffic load [22] and high vehicle speed, and drivers may also under-estimate risks of wild boar accidents, potentially leading to a higher amount of accidents with personal injuries.
Predicted development based on wild boar population growth in Sweden shows increases in costs from EUR 5.8 million in 2011 for wild boar-vehicle property damage per se to EUR 13–30.9 million in 2021, and that the variation is dependent upon hunting pressure [11]. In comparison, costs of roe deer-vehicle accidents during 2012 in Sweden was estimated to approximately EUR 96.6 million [23], and total costs of wildlife-vehicle accidents in Sweden is forecasted to EUR 165–730 million in 2030 [12]. Cost estimations usually assume that the frequency of fatalities and personal injuries are relatively stable over time and rarely needs substantial updates. Consequently, if accidents with fatalities and personal injuries increase in relation to the total amount of accidents, the costs increase more than predicted and may motivate further countermeasures in the planning stage to mitigate or decrease wild boar-vehicle accidents.
In this study, we examine if the rising trend of wild boar-vehicle accidents in Sweden is accompanied by higher frequencies of accidents with personal injuries and increased costs.
This article is organised as follows: in the next section the methodology used is presented and followed by a display by the empirical results, and finally, the results are discussed.
2. Materials and Methods
Data is obtained from two different sources, STRADA (the Swedish Traffic Accident Data Acquisition) and NVR (the Swedish Council for the Prevention of Wildlife-Vehicle Accidents, viltolycka.se). STRADA is used to extract data on traffic accidents with human injuries or fatalities, and NVR is used to collect data on all kinds of wildlife-vehicle accidents. Both databases are based on police-reported data, but STRADA also contains cases reported by hospitals.
2.1. Extraction from the STRADA Database
STRADA is an information-based system for data collection on damages and accidents for the road transport system in Sweden [24]. The police reported data consists of accidents with fatalities and personal injuries and accidents without injuries and have national coverage since 2003. The hospital data originates from emergency hospitals that register information about persons who have searched hospital care due to an injury in the road traffic environment. The information registry to STRADA is voluntarily for the hospitals and not all emergency hospitals in Sweden are included.
Data on vehicle accidents were retrieved by several searches to identify all accidents that were caused by wild boars, either by direct impact (collision with wild boar) or by indirect impact (for example if driving off the road to avoid animals). The searches included 1 January 2003 until 13 December 2016 which were performed on 14–22 December 2016. The first search included accidents registered by the category wild boar and the accident type “W5” (wild boar) and resulted in 284 accidents. Another search was made to include accidents with wild boar accidents in the accident type and as free text. The free text search included words that could be used to describe wild boar in the standard Swedish language, for example, wild boar, sow, young sow, piggy. This search yielded an additional 16 accidents. Finally, a search solely on free text (that did not include the category or accident type) was performed and an additional 109 accidents were found. All accident cases were then checked to ensure that they were triggered by or involved wild boars and were excluded if this was not the case.
The number of wild boar related accidents was based on police reports, and the number of persons injured was based on both police reports and hospital reports. For police reports, severe injuries are classified as injuries that have required inpatient care, whereas slight injuries only require non-institutional or out-patient care [21]. No wild boar-vehicle accident had a fatal outcome.
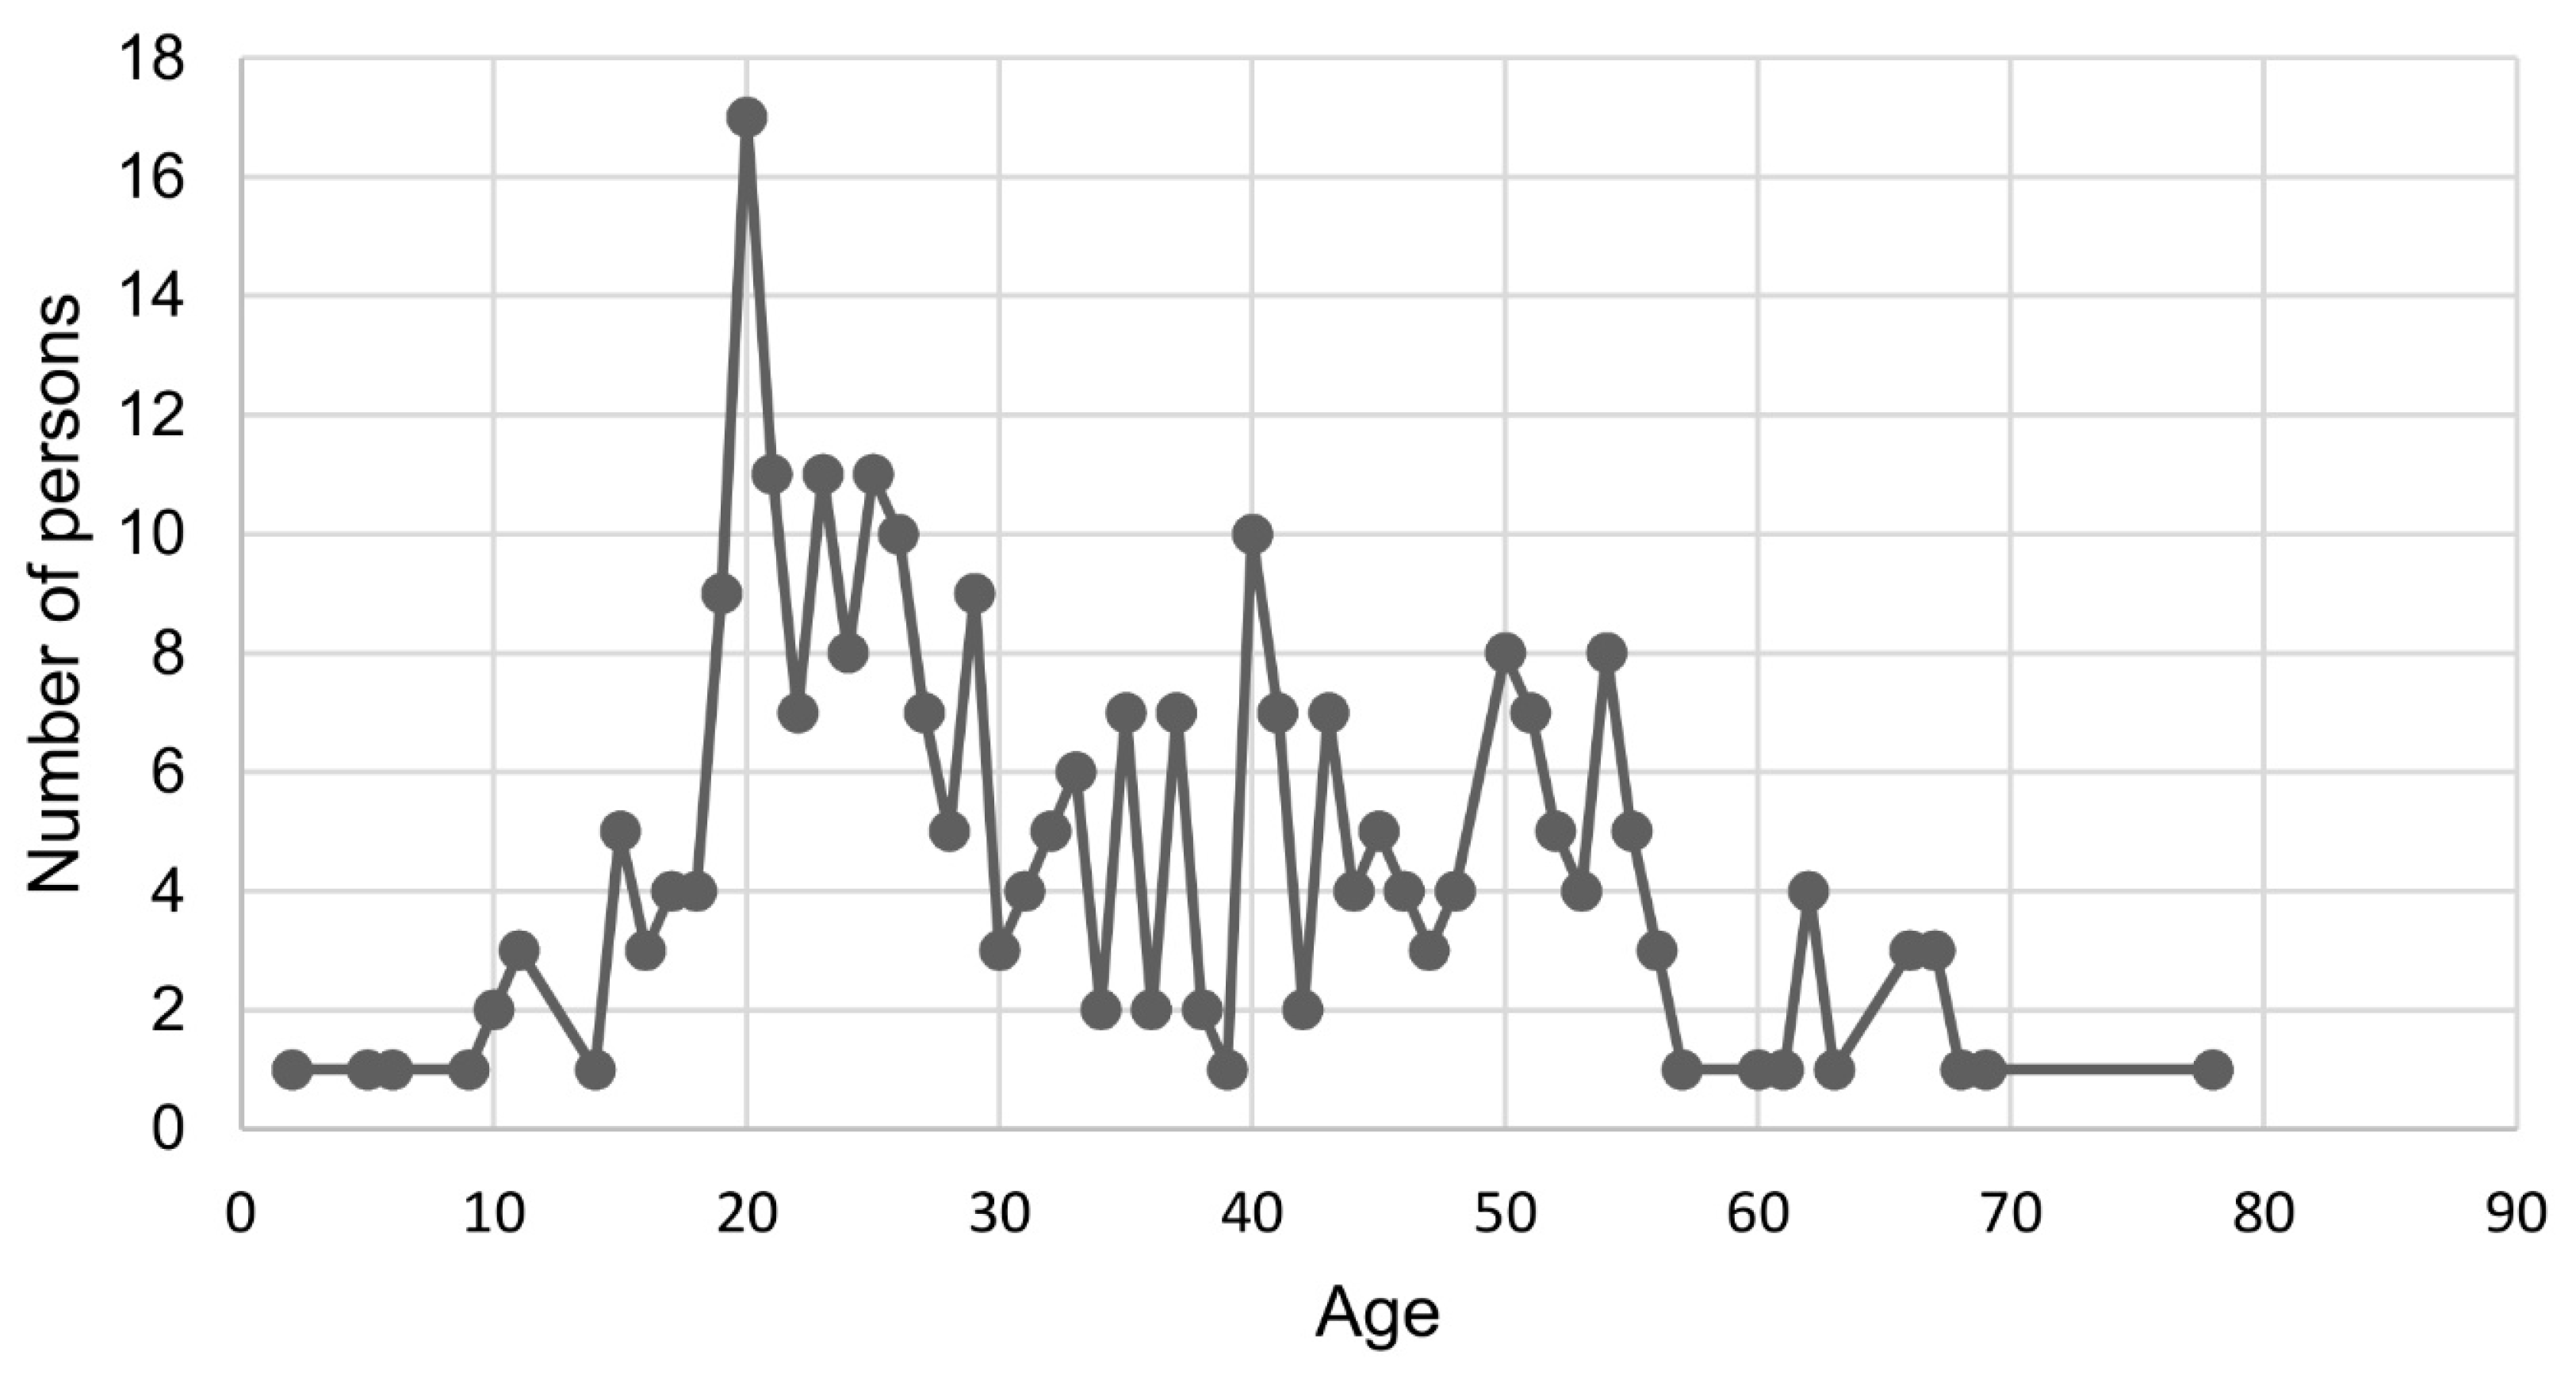
In total, 126 vehicle accidents with human injuries were found from the police-reported accidents for 2003–2016. In total, 272 persons were injured in wild boar accidents in 2003–2016, of which 21 was severely injured and 251 had slighter injuries. The high number of persons injured in relation to the number of accidents is explained by the use of the two different databases: cases from the hospitals are not registered as accidents since only police-reported accidents are included as accidents. Personal injuries from hospital reports were determined, in this study, by the following classification for ISS (injury severity score): slight injuries ISS 1–3, and severe injuries ≥ISS 4. The number of accidents reported by the police excluded cases only reported to hospitals in order to avoid overlapping observations. The mean age for injured persons were 34 (for age distribution see Appendix A, Figure A1) and females accounted for 48% of the accidents.
The accidents were classified in STRADA as: collisions (two accidents, 0.7%), single collisions (42 accidents, 15%), overtaking accidents (two accidents, 0.7%), other wildlife accidents (13 accidents or 4.8%), and as “real” wild boar-vehicle accidents (213 accidents, 78%). Single collisions included accidents were the vehicle collided with trees or objects in the roadside environment.
2.2. Extractions from the National Database on Accidents
Data on all reported wild boar-vehicle accidents 2003–2016 were retrieved on 11 January 2017 from the national database Nationella Viltolycksrådet (NVR) [10]. The database is relatively accurate since drivers in Sweden are obliged to report ungulate vehicle accidents by law [25] to the authorities. The database includes all types of wildlife-vehicle accidents, i.e., both property damages and accidents with personal injuries. In total, the dataset contained 36,087 wild boar-vehicle accidents for 2003–2016.
2.3. Calculations and Analyses
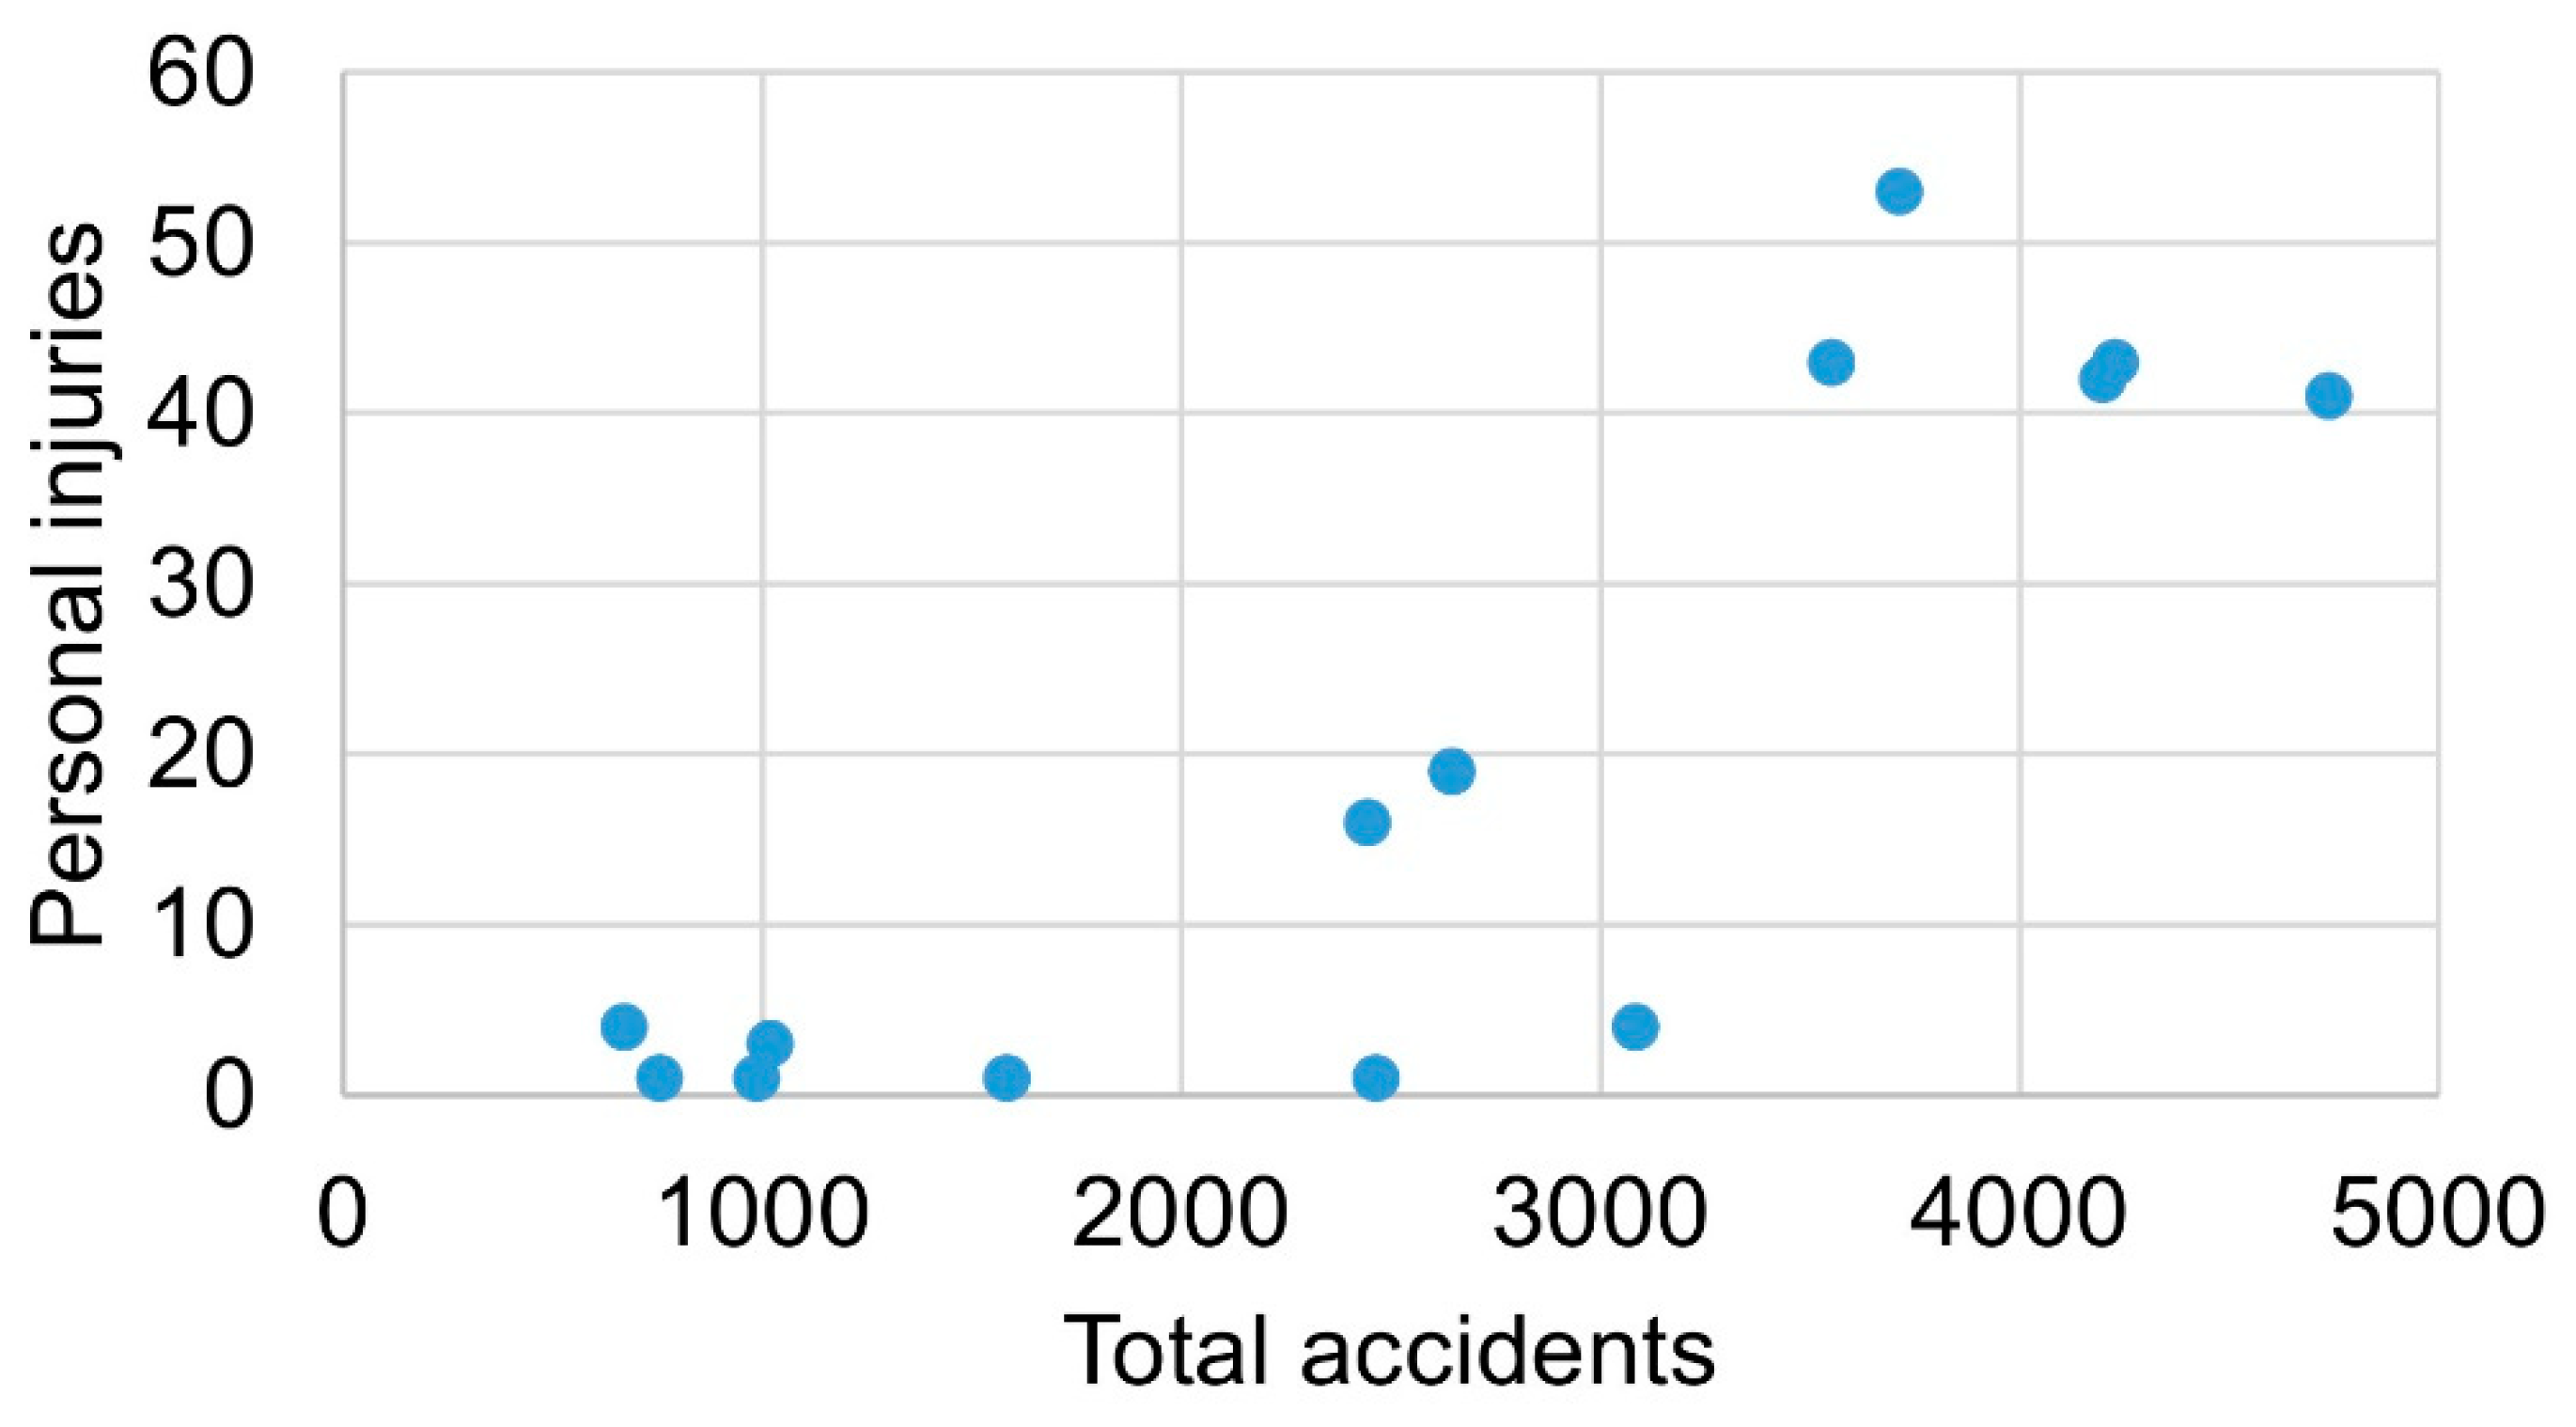
In order to examine the relation between costs and traffic accidents with wild boar, we estimate the power of traffic accidents in explaining personal injuries by simple regression analysis. With only 14 observations, it is necessary to minimise the number of independent variables to explain the number of injured persons. The data displayed in Figure 1 indicates a nonlinear relation where injured persons increase at an increasing rate in the number of total accidents.
There is a shift in injured persons from 2009 and 2010, which we account for by introducing a dummy, Dt, for two periods 2003–2009 and 2010–2016 where Dt = 1 for 2010–2016 and Dt = 0 otherwise. We then specify a linear and nonlinear regression model as:
where Pt is persons injured, At are the number of total accidents, Dt is the dummy and εt the error term. However, the At variable is endogenous and dependent on, among others, traffic volume, driving behaviour, speed limits, and wild boar population. The existence of endogenous explanatory variables results in biased when using Ordinary Least Square (OLS) estimate. We, therefore, test for the existence of endogeneity with traffic volume [26] and hunters bags of wild boar [27] as instruments. The instrument(s) must fulfil the exclusion restriction criteria of being correlated to the endogenous covariate(s) and only correlate with the outcome variable through the endogenous At. Several studies have shown that traffic volume affects the number of accidents, but there is probably not a direct link to the seriousness of the accident. The number of wild boars is also likely to affect accidents at given levels of traffic volume, e.g., [20]. There is no data on population sizes, and we therefore use the number of hunting bags as an instrument.
Model 1: Pt = a + β1At + β2Dt+ εt
Model 2: Pt = a + β1At2 + β2Dt + εt
A Durbin-Wu-Hausmann test of endogeneity of At showed that the hypothesis of exogenity could not be rejected. Further tests were therefore made of the validity and strength of the instruments. The overidentification test showed that the instruments were valid, and the test of the strength of the instruments showed a joint significance with F statistic exceeding 10 which is usually required for strong instruments [28]. Test statistic also revealed the existence of heteroscedasticity, and we therefore estimate robust standard errors. We present the results from both OLS and the instrumental variable method, both with robust standard errors.
Costs for wild boar-vehicle accidents were calculated based on the Swedish Transport Administrations statistical value of life for fatalities and injured in Sweden [21,29], see Table 1. However, a previous study has shown that a more realistic cost for property damages for wild boar-vehicle accidents in Sweden is EUR 2222, which is well above the standardised cost of EUR 1450 for an accident with property damages only [11]. We, therefore, used a value of EUR 2222 for property damages of wild boar-vehicle accidents instead.
3. Results
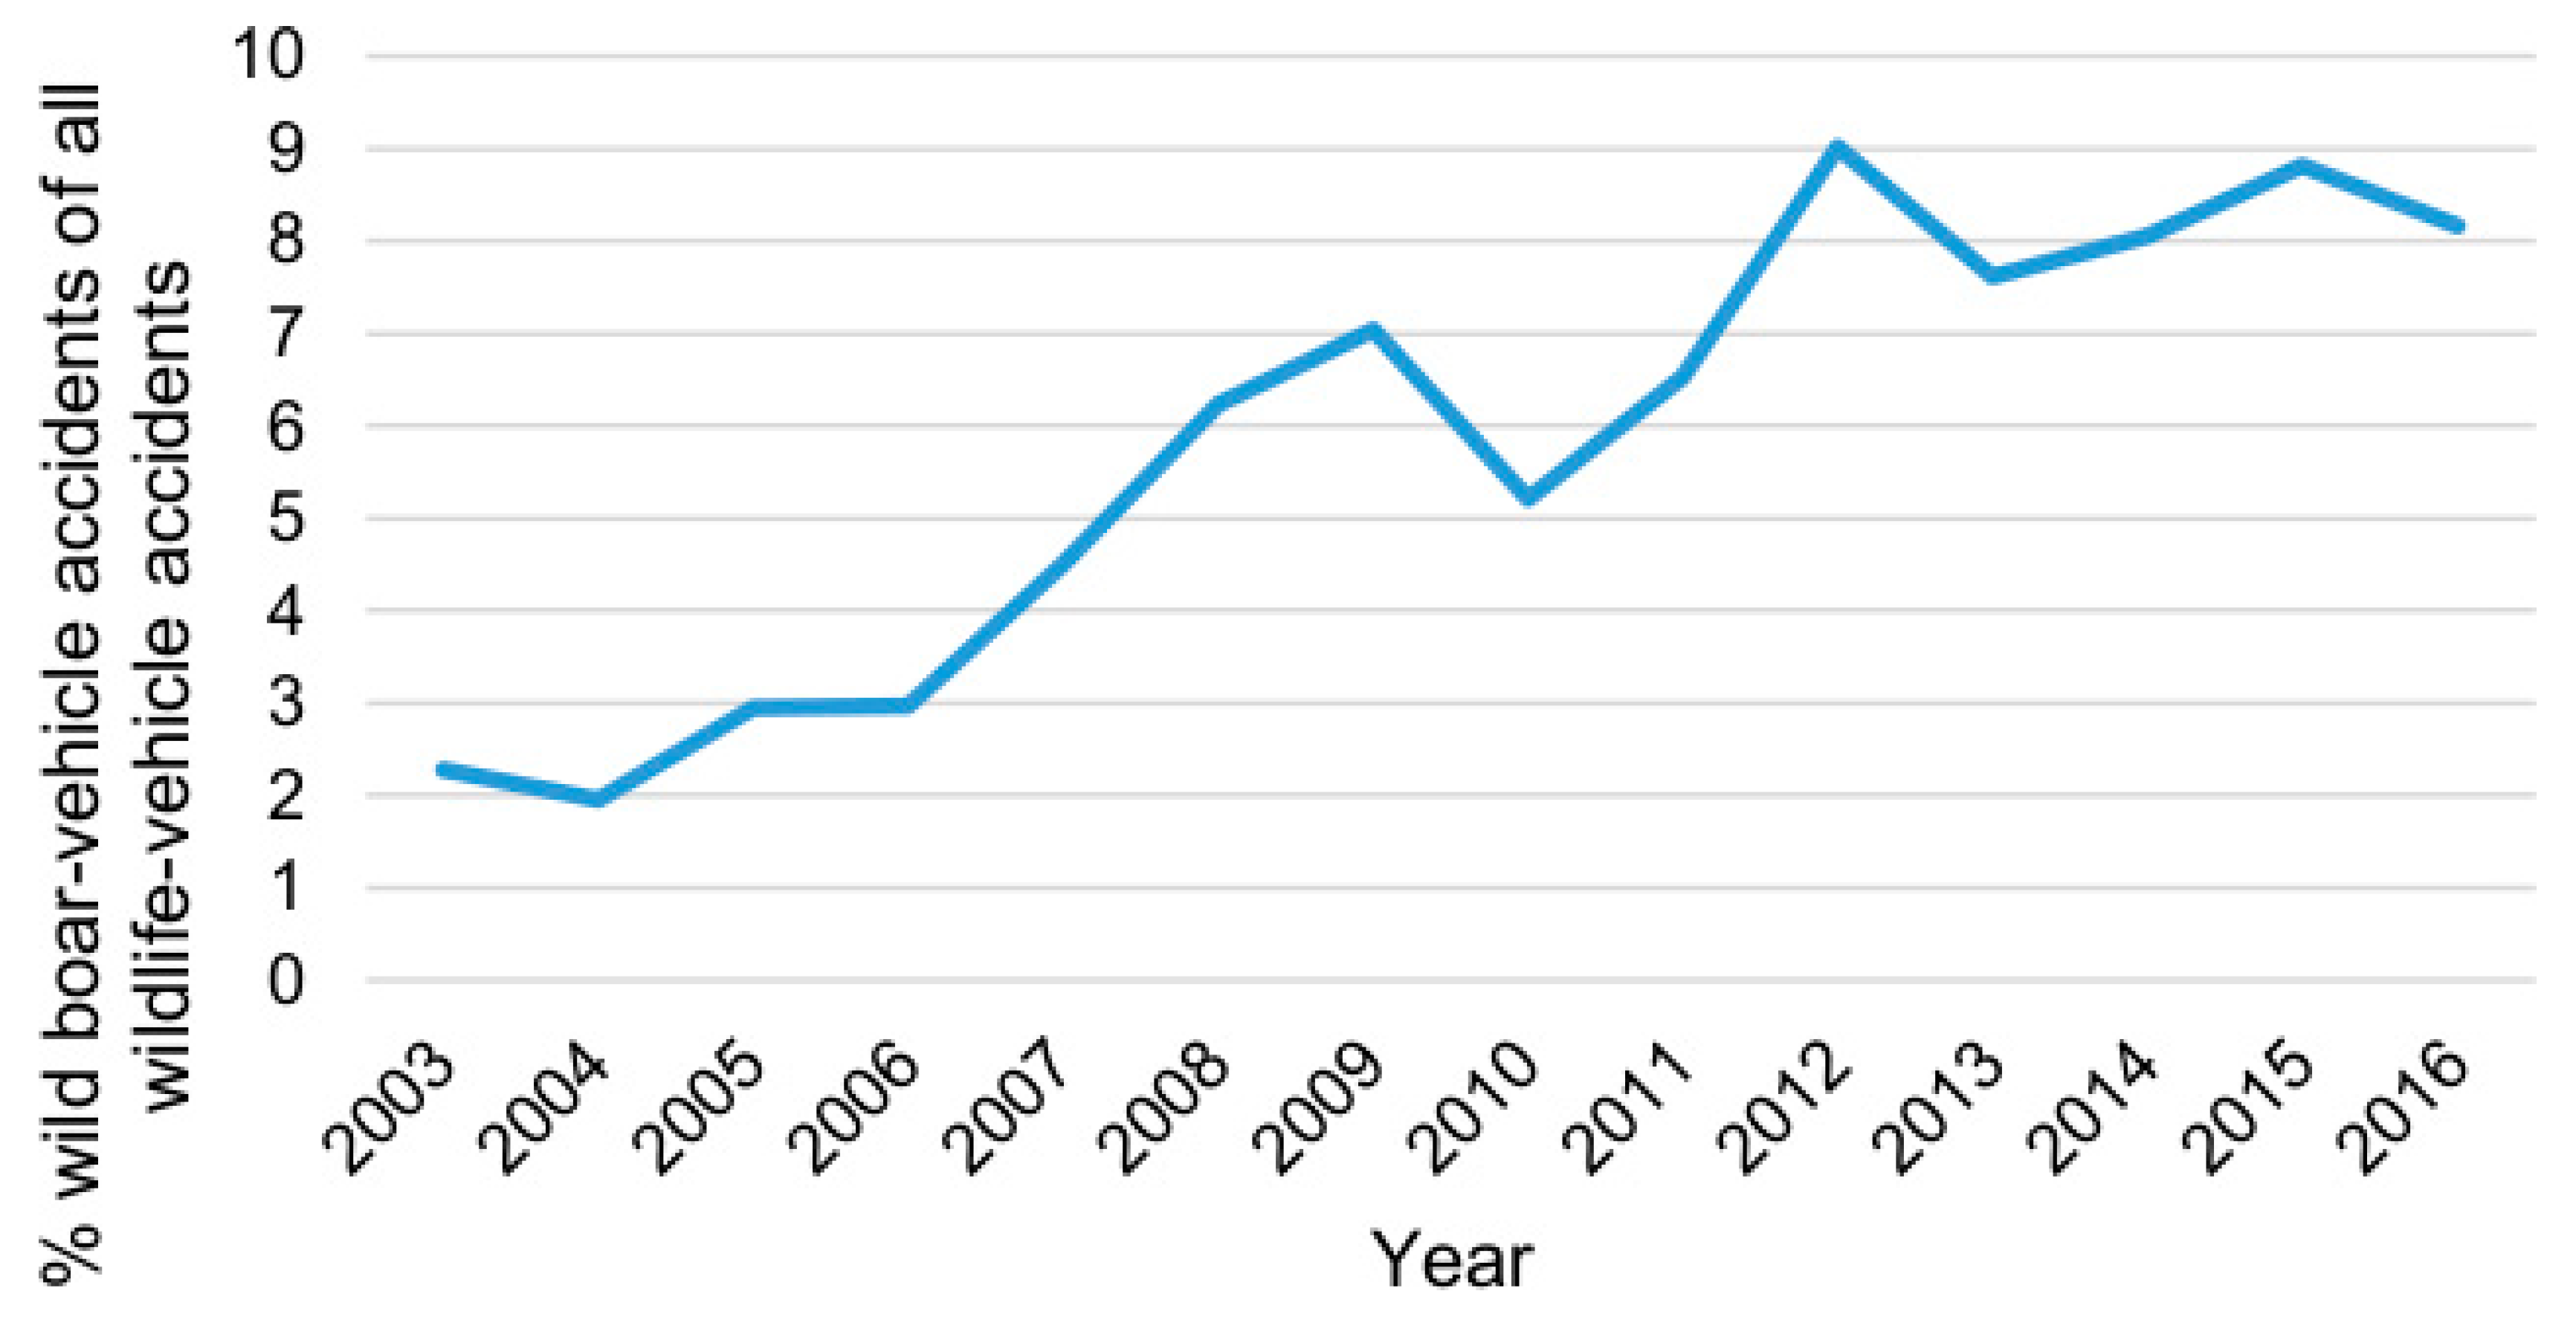
Wild boar-vehicle accidents show an increasing proportion of all wildlife-vehicle accidents in Sweden (Figure 2). In 2003 and 2004, wild boar-vehicle accidents accounted for approximately 2% of all wildlife-vehicle accidents and since 2012 wild boar-vehicle accidents are accounting for approximately 7.5–9% of all wildlife-vehicle accidents (Figure 2).
The number of wild boar-vehicle accidents reached new record levels in 2016 with 4739 reported wild boar-vehicle accidents (Table 2). The major part of the wild boar-vehicle accidents are property damage accidents, and very few accidents result in personal injuries (Table 2). In Table 2 it is clearly shown that the number of injured persons per year has increased, and in Figure 3 it is shown that the number of severely injured persons in wild boar-vehicle accidents has increased from zero to a few persons per year between 2010 to 2016, except for in 2015 when no one was severely injured in a wild boar-vehicle accident (Figure 3). The number of persons injured (both severe and slight injuries) and the amount of accidents leading to personal injuries has stayed at relatively low levels (<5 at the national level) despite high increases in the total number of accidents until 2010. After that, they increased manifold to approximately 40–50 persons per year and approximately 20 accidents per year (Table 2, Figure 3). The increase is mainly explained by an increased number of persons with slighter injuries (Figure 3).
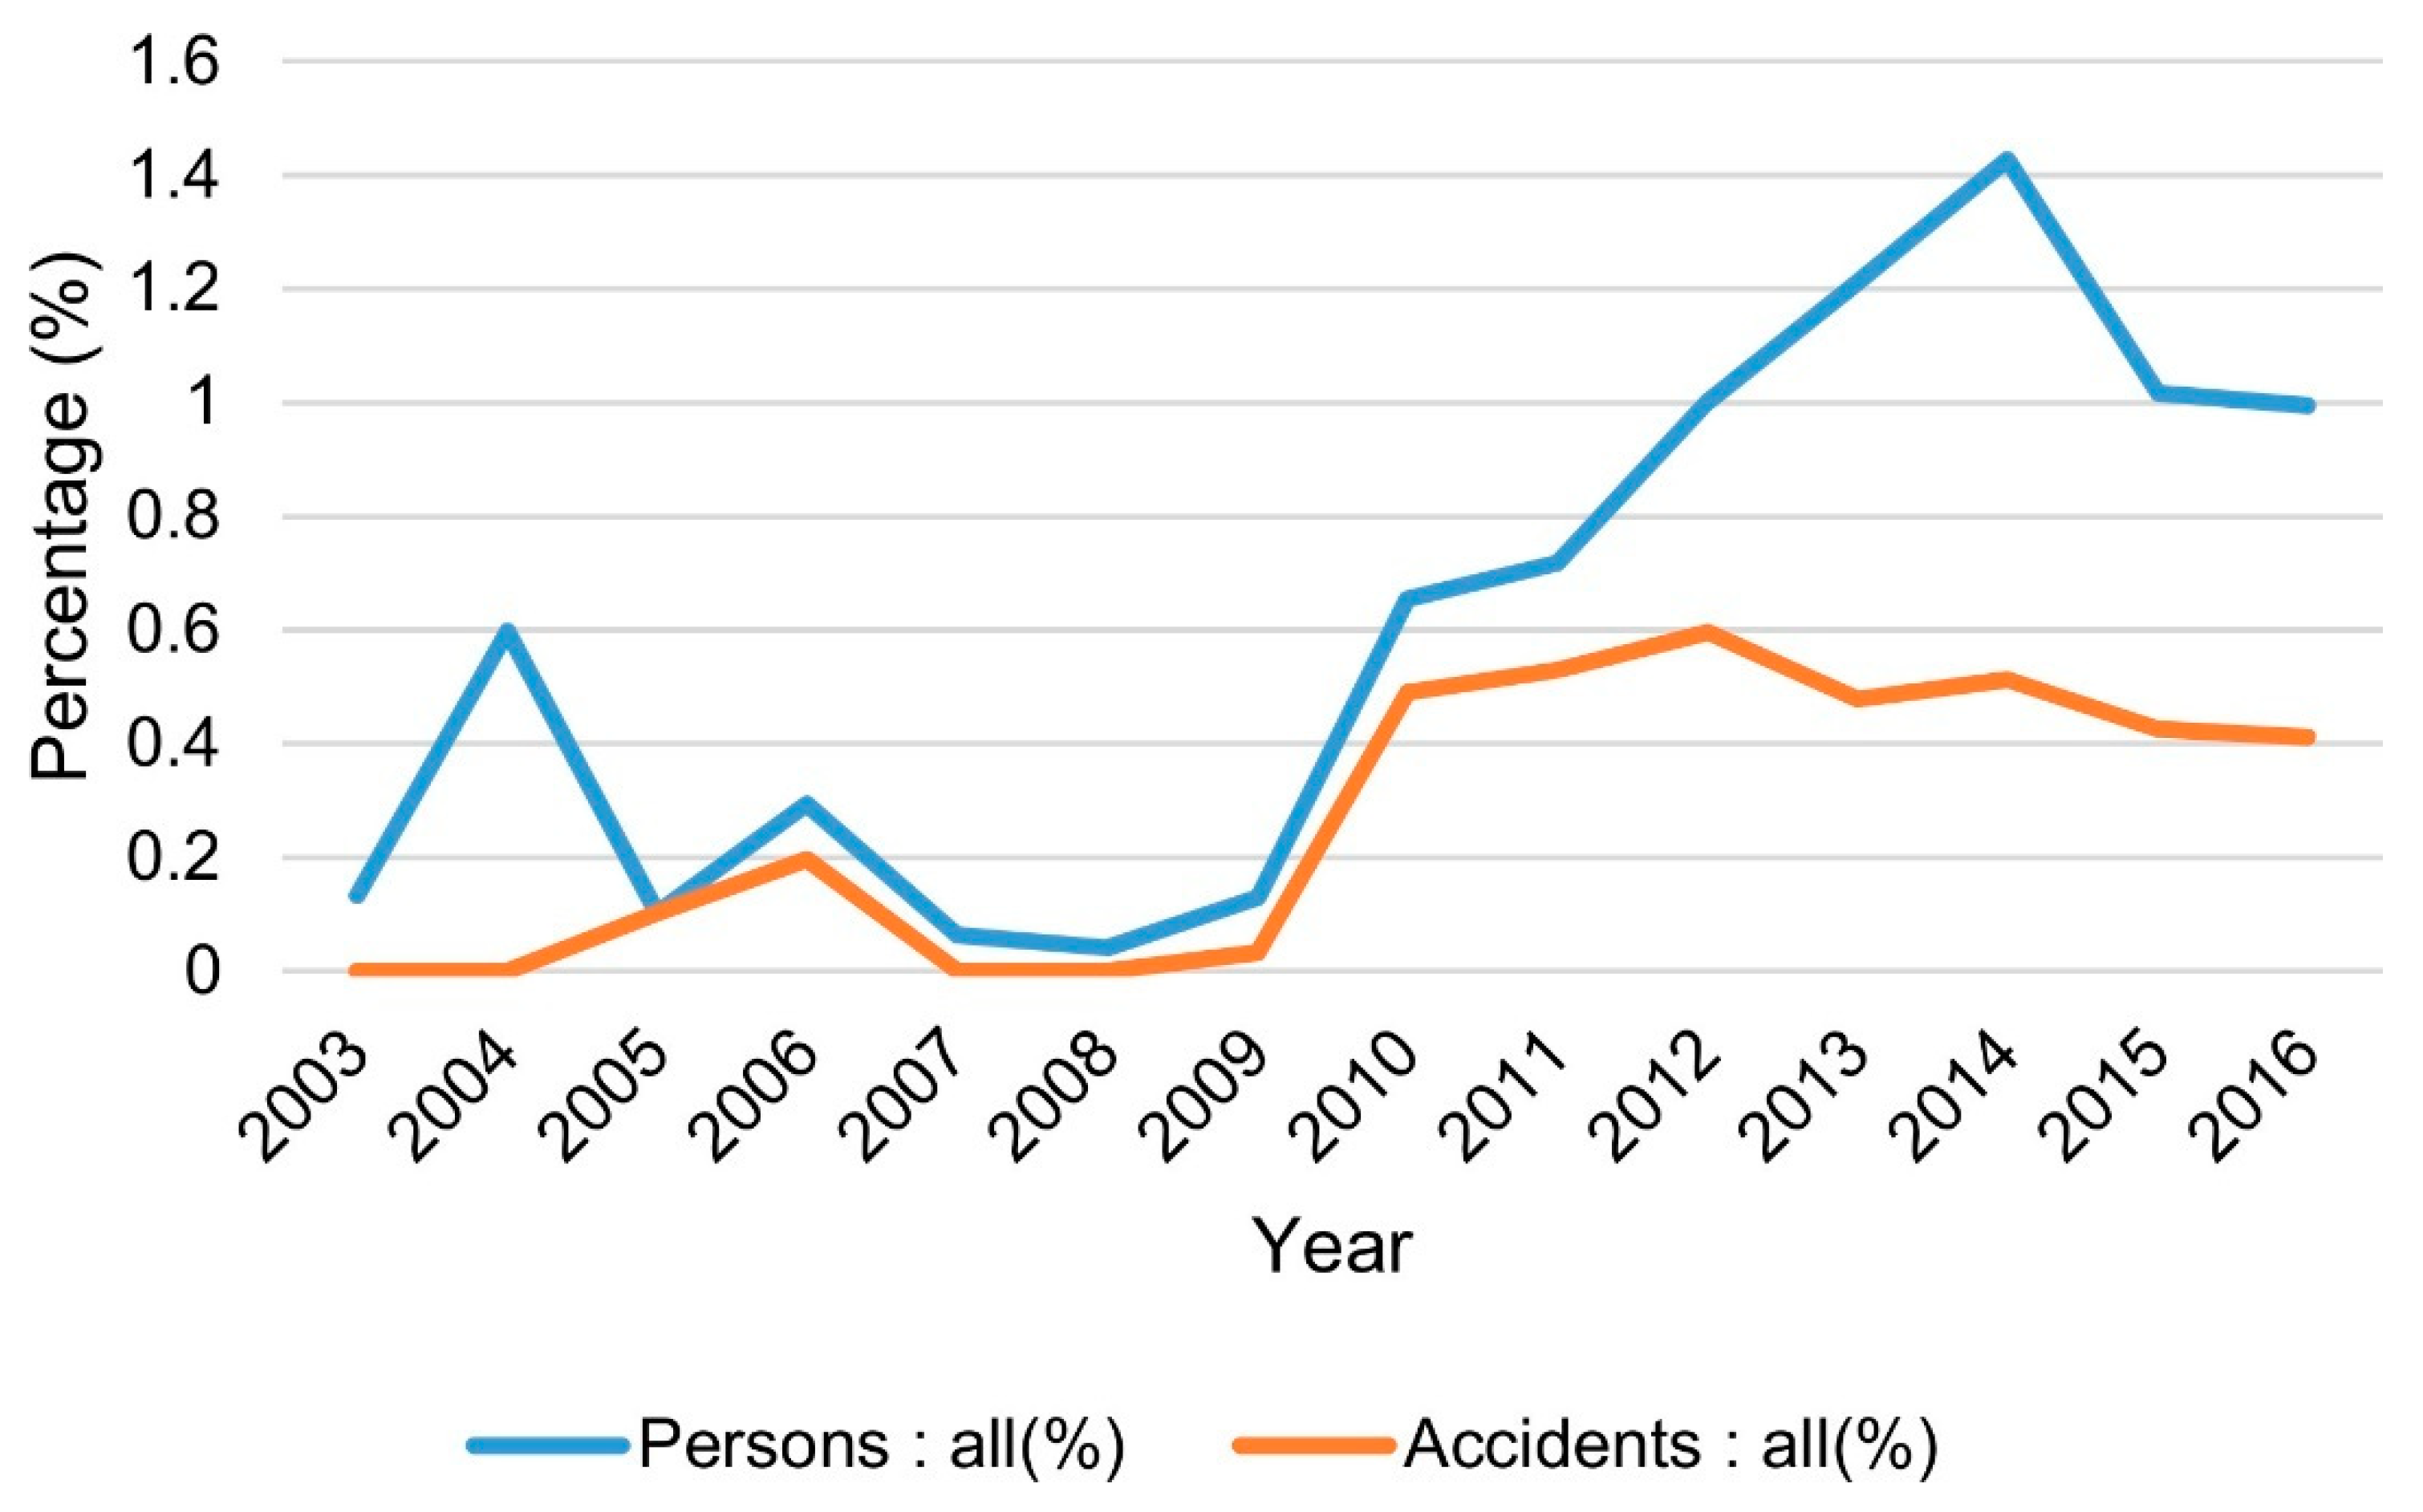
The percentages of persons injured to property damages show increases after 2009 and have after 2012 stayed at levels above 1% (mean value 2012–2016: 1.13%) (Figure 4). Similarly, the percentages of accidents with personal injuries to the number of accidents with property damages have increased from 2010 and forward and has stayed around 0.4–0.6% (mean value 2012–2016: 0.5%) (Figure 4).
The results in Table 3 show that the nonlinear model gives the best statistical fit as measured by adj. R2 and p-values (Table 3). Accidents are significant in both models at the 95% level in the linear and 99% level in the nonlinear model. As expected, the dummy for the years 2010–2016 is positive which reflects the increase in reported injuries for this year. The linear models predict that the number of injured persons increases by 0.0071 of an increase in accidents by one unit. The corresponding increase based on the nonlinear model depends on the level of accidents. At the 2016 level of 4739 accidents, injured persons increase with 0.0114 of a unit increase in wild boar accidents.
Costs of wild boar-vehicle accidents have increased since 2003, with a sharp increase in the costs of personal injuries from 2008 but with variation in specific years (Table 4). Since 2012, the total costs of wild boar-vehicle accidents have stayed above EUR 9.66 million, of which property damage accounts for approximately EUR 7.9–11 million. In 2016, costs were EUR 12.3 million, and property damages accounted for 86% of the total cost. In the last 13 years, the costs for wild boar-vehicle accidents have increased by 536%, from EUR 1.9 million to 12.3 million (Table 4).
4. Discussion
The rising trend of wild boar-vehicle accidents is accompanied by an increased amount of personal injuries, both severe and slighter injuries, as well as increased costs. The number of persons with injuries (severely and slightly injured) from wild boar-vehicle accidents has increased, especially after 2010. The regression analyses showed that the number of injured persons increases at an increasing rate in traffic accidents with wild boar. Based on the frequency analysis in this study, in average approximately one person per 100 accidents (1.13%) is injured, and approximately one accident per 200 wild boar-vehicle accidents will result in one or more persons with injuries (0.5%). However, most of the injuries are slighter injuries, and few are severe injuries. The number of persons with severe injuries caused by wild boar-vehicle accidents varies between zero and six per year. This variation is probably explained by factors such as vehicle speed, weather, number of passengers, county, traffic load, road geometry, vehicle-related characteristics, driver-related factors and unknown circumstances. In this study, we did not have the opportunity to examine the accident cause in more detail for any of the accidents but used the available information accessible in STRADA. Thus, this paper provides some general insight into wild boar-vehicle accidents and their trends at the national level. Future research may include more detailed analyses to better account for both the observed and the unobserved heterogeneity, for example by the use of mixed logit models as has been applied for single-vehicle crashes [30], random parameter multinomial logit models [31], or the use of cross-classified multilevel models to better incorporate regional heterogeneity [32].
When compared with the total amount of persons injured in all road traffic accidents each year in Sweden (approximately 20,000 per year) [33], the number of injured persons from wild boar-vehicle accidents is relatively low. However, the wild boar population will continue to expand during forth-coming decades in specific geographical areas in Sweden and colonise new areas and thereby increase the frequency of accidents which results in an increased number of persons injured in wild boar-vehicle collisions. For example, wild boar-vehicle collisions increased from 4739 in 2016 to 6082 in 2017 [34]. The correlation between increased population sizes and a higher frequency of vehicle collisions has also been shown in other studies where the wild boar is increasing, in, for example, Estonia [35].
Comparisons with wild boar accidents in Spain suggest that it is more likely that a wild boar-vehicle accident will result in human injuries than what was found in this study. In Spain, 180 persons were injured out of a total of 5005 accidents for the period 2006–2012 [16], whereas in Sweden, 272 persons were injured out of a total of 36,087 accidents for the period 2003–2016. In Spain, the proportion of injured persons out of the total accidents is 3.6% while in Sweden it is approximately 1%. This difference might be explained by the fact that many of the accidents that occur in Spain take place in the northern mountainous provinces, where road traffic condition might be severe, leading indirectly to accidents with higher damage consequences.
In general, the frequency of accidents resulting in human injuries compared to all accidents with wild boar was in this study found to be 0.5%, which is perhaps low in comparison with other studies. For moose accidents, frequencies of 3–8% have been reported [36]. Besides, in Sweden, 5.2% of the moose accidents resulted in fatalities or human injuries, while 0.14% of the deer accidents resulted in fatalities or human injuries for the years 2013–2015 [37]. The frequency of accidents with human injuries compared to the total amount of wild boar accidents may the physical conditions for the accident (moose can weigh between 200–550 kg [38], and wild boar can weigh 100–200 kg [39]), leading to high frequency of human injuries when colliding with large and heavy animals. Consequently, even though the number of wild boar-vehicle accidents and the number of persons injured in the accidents have increased, the frequency of accidents resulting in personal injuries are still at low levels in comparison with, for example, moose accidents.
Costs of wild boar-vehicle accidents in Sweden have been calculated to EUR 5.8 million per year for 2011 [11] but did not include personal injuries since such accidents were few for the years included in the calculations. In this study, we calculated the cost of wild boar-vehicle accidents to EUR 6.85 million for 2011 which is in line with the previous study. However, since the number of persons injured has increased after 2011, the cost for wild boar-vehicle accidents has increased and is currently estimated to vary between approximately EUR 9.66–12.31 million per year.
This study shows that an increased number of wild boars may lead to a possible increase in road traffic accidents. No specific countermeasures, except adapted wildlife fences, are currently used to reduce wild boar accidents in the road planning process in Sweden. However, wildlife accidents may be counteracted through measures targeting the animals or through an impact on driving behaviour. For example, interdependencies between animal-vehicle accidents and the animal population size may result in smaller populations and thereby a decreased number of future accidents [40]. Similarly, in a study in Finland, moose-vehicle accidents were positively related to the moose population abundance and the traffic volume [36]. However, when studying spatiotemporal patterns of wildlife road-crossings and wildlife-vehicle collisions, a higher collisions risk seems to be primarily due to low light and poor road surface conditions, indicating that wildlife accidents countermeasures should be aimed at driver behaviour rather than animal movements [41]. Countermeasures for adjusting driver behaviour to mitigate wildlife-vehicle accidents involves speed-reduction to minimise accident damage consequences and measures aimed at making drivers more observant on animals in the road environment [42]. A conventional countermeasure is static wildlife warning sign, but their effectiveness has been questioned since drivers get accustomed to them over time [43,44]. Active warning signs, such as radio warning messages seem to have a more long-term speed reducing effect [44].
In this study, we did not account for the under-reporting of wildlife-vehicle accidents. The under-reporting of accidents can be substantial, and it is therefore recommended by the Swedish Transport Administration to use weights for calculating the actual number of accidents from the number of accidents reported by the police. For example, weights for fatalities are 1.0, for severe and slight injury in accidents with motor vehicles it is 1.7 in rural areas and 1.5 in urban areas, for property damage accidents it is 7, and for accidents with ungulates, it is 2.0. However, other studies in Sweden have shown that an under-reporting weight of 2.0 for wildlife accidents is probably too high and it is therefore recommended to use a weight of 1.15 (±5%) for wildlife-vehicle accidents in general [12,45]. On the other hand, in this study, we used datasets from both police-reported accidents and hospital-reported accidents and we also included accidents that were not originally classified as wild boar accidents in STRADA, so it is not clear if it would be correct to implement weights for our analyses. The Swedish Transport Administration uses weights for police-reported cases, and do not include cases reported by the hospitals in the calculations.
Future possible studies would, for example, include more detailed accident analyses as mentioned above, but may also include studies to investigate the causal effects of driving behaviour, or road or environmental factors on wild boar-vehicle accidents. Previous studies have shown that driving behaviour is an essential factor in wildlife-vehicle accidents and it is likely that driver behaviour may also influence the damage consequences of accidents.
Author Contributions
Idea, A.K.J. and I.-M.G. Methods, figures, and writing was mainly performed by A.K.J. and I.-M.G. contributed with funding, commenting, statistical analyses, reviewing and editing of the manuscript.
Funding
This research was partly funded by financial support from the project ‘Economic analysis of wild boar in Sweden’ (Grant No. 12/133 NV-01518-13), from the Wildlife fund at the Swedish Environmental Protection Agency (Naturvårdsverket).
Acknowledgments
We are much indebted the Wildlife fund at the Swedish Environmental Protection Agency (Naturvårdsverket) that partly funded this research. We want to thank the three anonymous reviewers for their insightful comments on the paper which led to valuable improvements.
Conflicts of Interest
The authors declare no conflicts of interest.
Appendix A
Appendix Figure A1 shows the age distribution for persons involved in wild boar-vehicle accidents with severe or slighter injuries.
Figure A1.
Age distribution for persons with severe and slighter injuries from wild boar-vehicle accidents 2003–2016 in Sweden.
Figure A1.
Age distribution for persons with severe and slighter injuries from wild boar-vehicle accidents 2003–2016 in Sweden.

References
- Conover, M.R.; Pitt, W.C.; Kessler, K.K.; Dubow, T.J.; Sanborn, W.A. Review of human injuries, illnesses, and economic losses caused by wildlife in the United States. Wildl. Soc. Bull. 1995, 23, 407–414. [Google Scholar]
- Romin, L.A.; Bissonette, J.A. Deer-vehicle collisions: Status of state monitoring activities and mitigation efforts. Wildl. Soc. Bull. 1996, 24, 276–283. [Google Scholar]
- Malo, J.E.; Suarez, F.; Diez, A. Can we mitigate animal-vehicle accidents using predictive models? J. Appl. Ecol. 2004, 41, 701–710. [Google Scholar] [CrossRef]
- Huijser, M.P.; Duffield, J.W.; Clevenger, A.P.; Ament, R.J.; McGowen, P.T. Cost-Benefit Analyses of Mitigation Measures Aimed at Reducing Collisions with Large Ungulates in the United States and Canada: A Decision Support Tool. Ecol. Soc. 2009, 14, 15. [Google Scholar] [CrossRef]
- Groot Bruinderink, G.W.T.A.; Hazebroek, E. Ungulate traffic collisions in Europe. Conserv. Biol. 1996, 10, 1059–1067. [Google Scholar] [CrossRef]
- Keuling, O.; Baubet, E.; Duscher, A.; Ebert, C.; Fischer, C.; Monaco, A.; Podgórski, T.; Prevot, C.; Ronnenberg, K.; Sodeikat, G.; et al. Mortality rates of wild boar Sus scrofa L. in central Europe. Eur. J. Wildl. Res. 2013, 59, 805–814. [Google Scholar] [CrossRef]
- Massei, G.; Kindberg, J.; Licoppe, A.; Gačić, D.; Šprem, N.; Kamler, J.; Baubet, E.; Hohmann, U.; Monaco, A.; Ozoliņš, J.; et al. Wild boar populations up, numbers of hunters down? A review of trends and implications for Europe. Pest Manag. Sci. 2015, 71, 492–500. [Google Scholar] [CrossRef] [PubMed]
- Lagos, L.; Picos, J.; Valero, E. Temporal pattern of wild ungulate-related traffic accidents in northwest Spain. Eur. J. Wildl. Res. 2012, 58, 661–668. [Google Scholar] [CrossRef]
- Gren, I.M.; Häggmark-Svensson, T.; Andersson, H.; Jansson, G.; Jägerbrand, A. Using traffic data to estimate wildlife populations. J. Bioecon. 2016, 18, 17–31. [Google Scholar] [CrossRef]
- NVR. Statistik (viltolyckor). Available online: http://www.viltolycka.se/statistik/ (accessed on 2 February 2018).
- Häggmark-Svensson, T.; Gren, I.M.; Andersson, H.; Jansson, G.; Jägerbrand, A.K. Cost of Traffic Accidents with Wild Boar Populations in Sweden; Working Paper Series; Swedish University of Agricultural Sciences, Department of Economics: Uppsala, Sweden, 2014. [Google Scholar]
- Jägerbrand, A.K.; Gren, I.M.; Seiler, A.; Johansson, Ö. Uppdatering och nya Effektsamband i Effektmodellen för Viltolyckor; Calluna AB: Stockholm, Sweden, 2018; Available online: http://www.calluna.se/publikationer/publikationer/ (accessed on 17 November 2018).
- Söderberg, R. Så Ska Vildsvinen Hållas Borta. Available online: https://www.svt.se/nyheter/lokalt/smaland/sa-ska-vildsvinen-hallas-borta-fran-vagarna (accessed on 17 November 2018).
- Rosell, C.; Fernández-Bou, M.; Camps, F.; Boronat, C.; Navàs, F.; Martinez, M.; Sorolla, A. Animal-vehicle collisions: A new cooperative strategy is needed to reduce the conflict. In Proceedings of the ICOET, International Conference on Ecology and Transportation, Scottsdale, AZ, USA, 23–27 June 2013. [Google Scholar]
- Sáez-Royuela, C.; Tellería, J.L. The increased population of the wild boar (Sus scrofa) in Europe. Mamm. Rev. 1986, 16, 97–101. [Google Scholar] [CrossRef]
- Sáenz-de-Santa-María, A.; Tellería, J.L. Wildlife-vehicle collisions in Spain. Eur. J. Wildl. Res. 2015, 61, 399–406. [Google Scholar] [CrossRef]
- Huijser, M.P.; Abra, F.D.; Duffield, J.W. Mammal road mortality and cost-benefit analyses of mitigation measures aimed at reducing collisions with capybara (Hydrochoerus hydrochaeris) in São Paulo State, Brazil. Oecol. Aust. 2013, 17, 129–146. [Google Scholar] [CrossRef]
- Witmer, G.W.; DeCalesta, D.S. The need and difficulty of bringing the Pennsylvanian deer herd under control. In Proceedings of the Fifth Eastern Wildlife Damage Control Conference, Ithaca, NY, USA, 6–9 October 1991; paper 45. Available online: http://digitalcommons.unl.edu/cgi/viewcontent.cgi?article=1044&context=ewdcc5 (accessed on 17 November 2018).
- Bissonette, J.A.; Kassar, C.A.; Cook, L.J. Assessment of costs associated with deer-vehicle collisions: Human death and injury, vehicle damage, and deer loss. Hum.-Wildl. Confl. 2008, 2, 17–27. [Google Scholar]
- Gren, I.M.; Jägerbrand, A.K. Predicting the costs of animal-vehicle accidents involving ungulates in Sweden. Transp. Res. D Transp. Environ. 2018. under review. [Google Scholar]
- The Swedish Transport Administration. Analysmetod Och Samhällsekonomiska Kalkylvärden för Transportsektorn: ASEK 6.0. Kapitel 9; Trafiksäkerhet och olyckskostnader; The Swedish Transport Administration, Trafikverket: Borlänge, Sweden, 2016.
- Thurfjell, H.; Spong, G.; Olsson, M.; Ericsson, G. Avoidance of high traffic levels results in lower risk of wild boar-vehicle accidents. Landsc. Urban Plan. 2015, 133, 98–104. [Google Scholar] [CrossRef]
- Jägerbrand, A. Kollisioner och olyckor med rådjur i Sverige under 10 år (2003–2012); Variation i tid, geografi och kostnader; The Swedish National Road and Transport Research Institute (VTI): Linköping, Sweden, 2014; p. R818.
- Transportstyrelsen. Strada-informationssystem för olyckor och skador i trafiken. Available online: https://www.transportstyrelsen.se/strada (accessed on 11 November 2018).
- SFS. Jaktförordning (1987:905); Svensk författningssamling; SFS: Stockholm, Sweden, 1987. [Google Scholar]
- Trafikanalys. Trafikarbete på svenska vägar. Available online: https://www.trafa.se/vagtrafik/trafikarbete/ (accessed on 29 October 2018).
- Svenska Jägareförbundet. Viltdata. Available online: http://www.viltdata.se/ (accessed on 28 October 2018).
- Sanderson, E.; Windmeijer, F. A weak instrument F-test in linear IV models with multiple endogenous variables. J. Econom. 2016, 190, 212–221. [Google Scholar] [CrossRef] [PubMed]
- Bångman, G. Analysmetod och samhällsekonomiska kalkylvärden för transportsektorn: ASEK 6.0; Kapitel 20 English Summary of ASEK Recommendations; The Swedish Transport Administration, Trafikverket: Borlänge, Sweden, 2016.
- Behnood, A.; Mannering, F.L. The temporal stability of factors affecting driver-injury severities in single-vehicle crashes: Some empirical evidence. Anal. Methods Accid. Res. 2015, 8, 7–32. [Google Scholar] [CrossRef]
- Behnood, A.; Mannering, F. Determinants of bicyclist injury severities in bicycle-vehicle crashes: A random parameters approach with heterogeneity in means and variances. Anal. Methods Accid. Res. 2017, 16, 35–47. [Google Scholar] [CrossRef]
- Park, H.-C.; Kim, D.-K.; Kho, S.-Y.; Park, P.Y. Cross-classified multilevel models for severity of commercial motor vehicle crashes considering heterogeneity among companies and regions. Accid. Anal. Prev. 2017, 106, 305–314. [Google Scholar] [CrossRef] [PubMed]
- The Swedish Transport Agency. Olycksstatistik. Available online: https://www.transportstyrelsen.se/sv/vagtrafik/statistik/Olycksstatistik/ (accessed on 15 October 2018).
- NVR. Viltolyckor för respektive viltslag. Available online: https://www.viltolycka.se/statistik/viltolyckor-for-respektive-viltslag/ (accessed on 15 October 2018).
- Kruuse, M.; Enno, S.E.; Oja, T. Temporal patterns of wild boar-vehicle collisions in Estonia, at the northern limit of its range. Eur. J. Wildl. Res. 2016. [Google Scholar] [CrossRef]
- Niemi, M.; Rolandsen, C.M.; Neumann, W.; Kukko, T.; Tiilikainen, R.; Pusenius, J.; Solberg, E.J.; Ericsson, G. Temporal patterns of moose-vehicle collisions with and without personal injuries. Accid. Anal. Prev. 2017, 98, 167–173. [Google Scholar] [CrossRef] [PubMed] [Green Version]
- Jägerbrand, A.K.; Gren, I.M. Testing the validity of an animal-vehicle collisions (AVCs) model used in the road planning process in Sweden. Int. J. Environ. Sci. Technol. 2018. under review. [Google Scholar]
- Svenska Jägareförbundet. Älg. Available online: https://jagareforbundet.se/vilt/vilt-vetande2/artpresentation/daggdjur/alg/ (accessed on 15 October 2018).
- Svenska Jägareförbundet. Vildsvin. Available online: https://jagareforbundet.se/vilt/vilt-vetande2/artpresentation/daggdjur/vildsvin/ (accessed on 15 October 2018).
- Fahrig, L.; Pedlar, J.H.; Pope, S.E.; Taylor, P.D.; Wegner, J.F. Effect of road traffic on amphibian density. Biol. Conserv. 1995, 73, 177–182. [Google Scholar] [CrossRef] [Green Version]
- Neumann, W.; Ericsson, G.; Dettki, H.; Bunnefeld, N.; Keuler, N.S.; Helmers, D.P.; Radeloff, V.C. Difference in spatiotemporal patterns of wildlife road-crossings and wildlife-vehicle collisions. Biol. Conserv. 2012, 145, 70–78. [Google Scholar] [CrossRef]
- Jägerbrand, A.K.; Antonson, H. Driving behaviour responses to a moose encounter, automatic speed camera, wildlife warning sign and radio message determined in a factorial simulator study. Accid. Anal. Prev. 2016, 86, 229–238. [Google Scholar] [CrossRef] [PubMed]
- Pojar, T.M. Evaluation of devices to prevent deer-auto accidents. In Game Research Report. July Part III; Game, Fish and Parks Div: Denver, CO, USA, 1971; pp. 331–339. [Google Scholar]
- Jägerbrand, A.K.; Antonson, H.; Ahlström, C. Speed reduction effects over distance of animal-vehicle collision countermeasures—A driving simulator study. Eur. Transp. Res. Rev. 2018, 10, 40. [Google Scholar] [CrossRef]
- Seiler, A.; Jägerbrand, A.K. Mörkertal i viltolycksstatistiken—Resultat från enkätundersökning och analyser av olycksdata; Preliminär rapport version 2017-05-31. Available online: https://www.researchgate.net/publication/324168595_Morkertal_i_viltolycksstatistiken_-_resultat_fran_enkatundersokning_och_analyser_av_olycksdata_Preliminar_rapport_version_2017-05-31 (accessed on 17 November 2018).
Figure 1.
The number of injured persons and the number of wild boar-vehicle accidents between 2003–2016.
Figure 1.
The number of injured persons and the number of wild boar-vehicle accidents between 2003–2016.

Figure 2.
Percentage of wild boar-vehicle accidents of all wildlife-vehicle accidents in Sweden between 2003–2016. The data comes from NVR.
Figure 2.
Percentage of wild boar-vehicle accidents of all wildlife-vehicle accidents in Sweden between 2003–2016. The data comes from NVR.

Figure 3.
The number of injured persons (slighter and severe injuries) in wild boar-vehicle accidents in Sweden 2003–2016. Data comes from STRADA.
Figure 3.
The number of injured persons (slighter and severe injuries) in wild boar-vehicle accidents in Sweden 2003–2016. Data comes from STRADA.
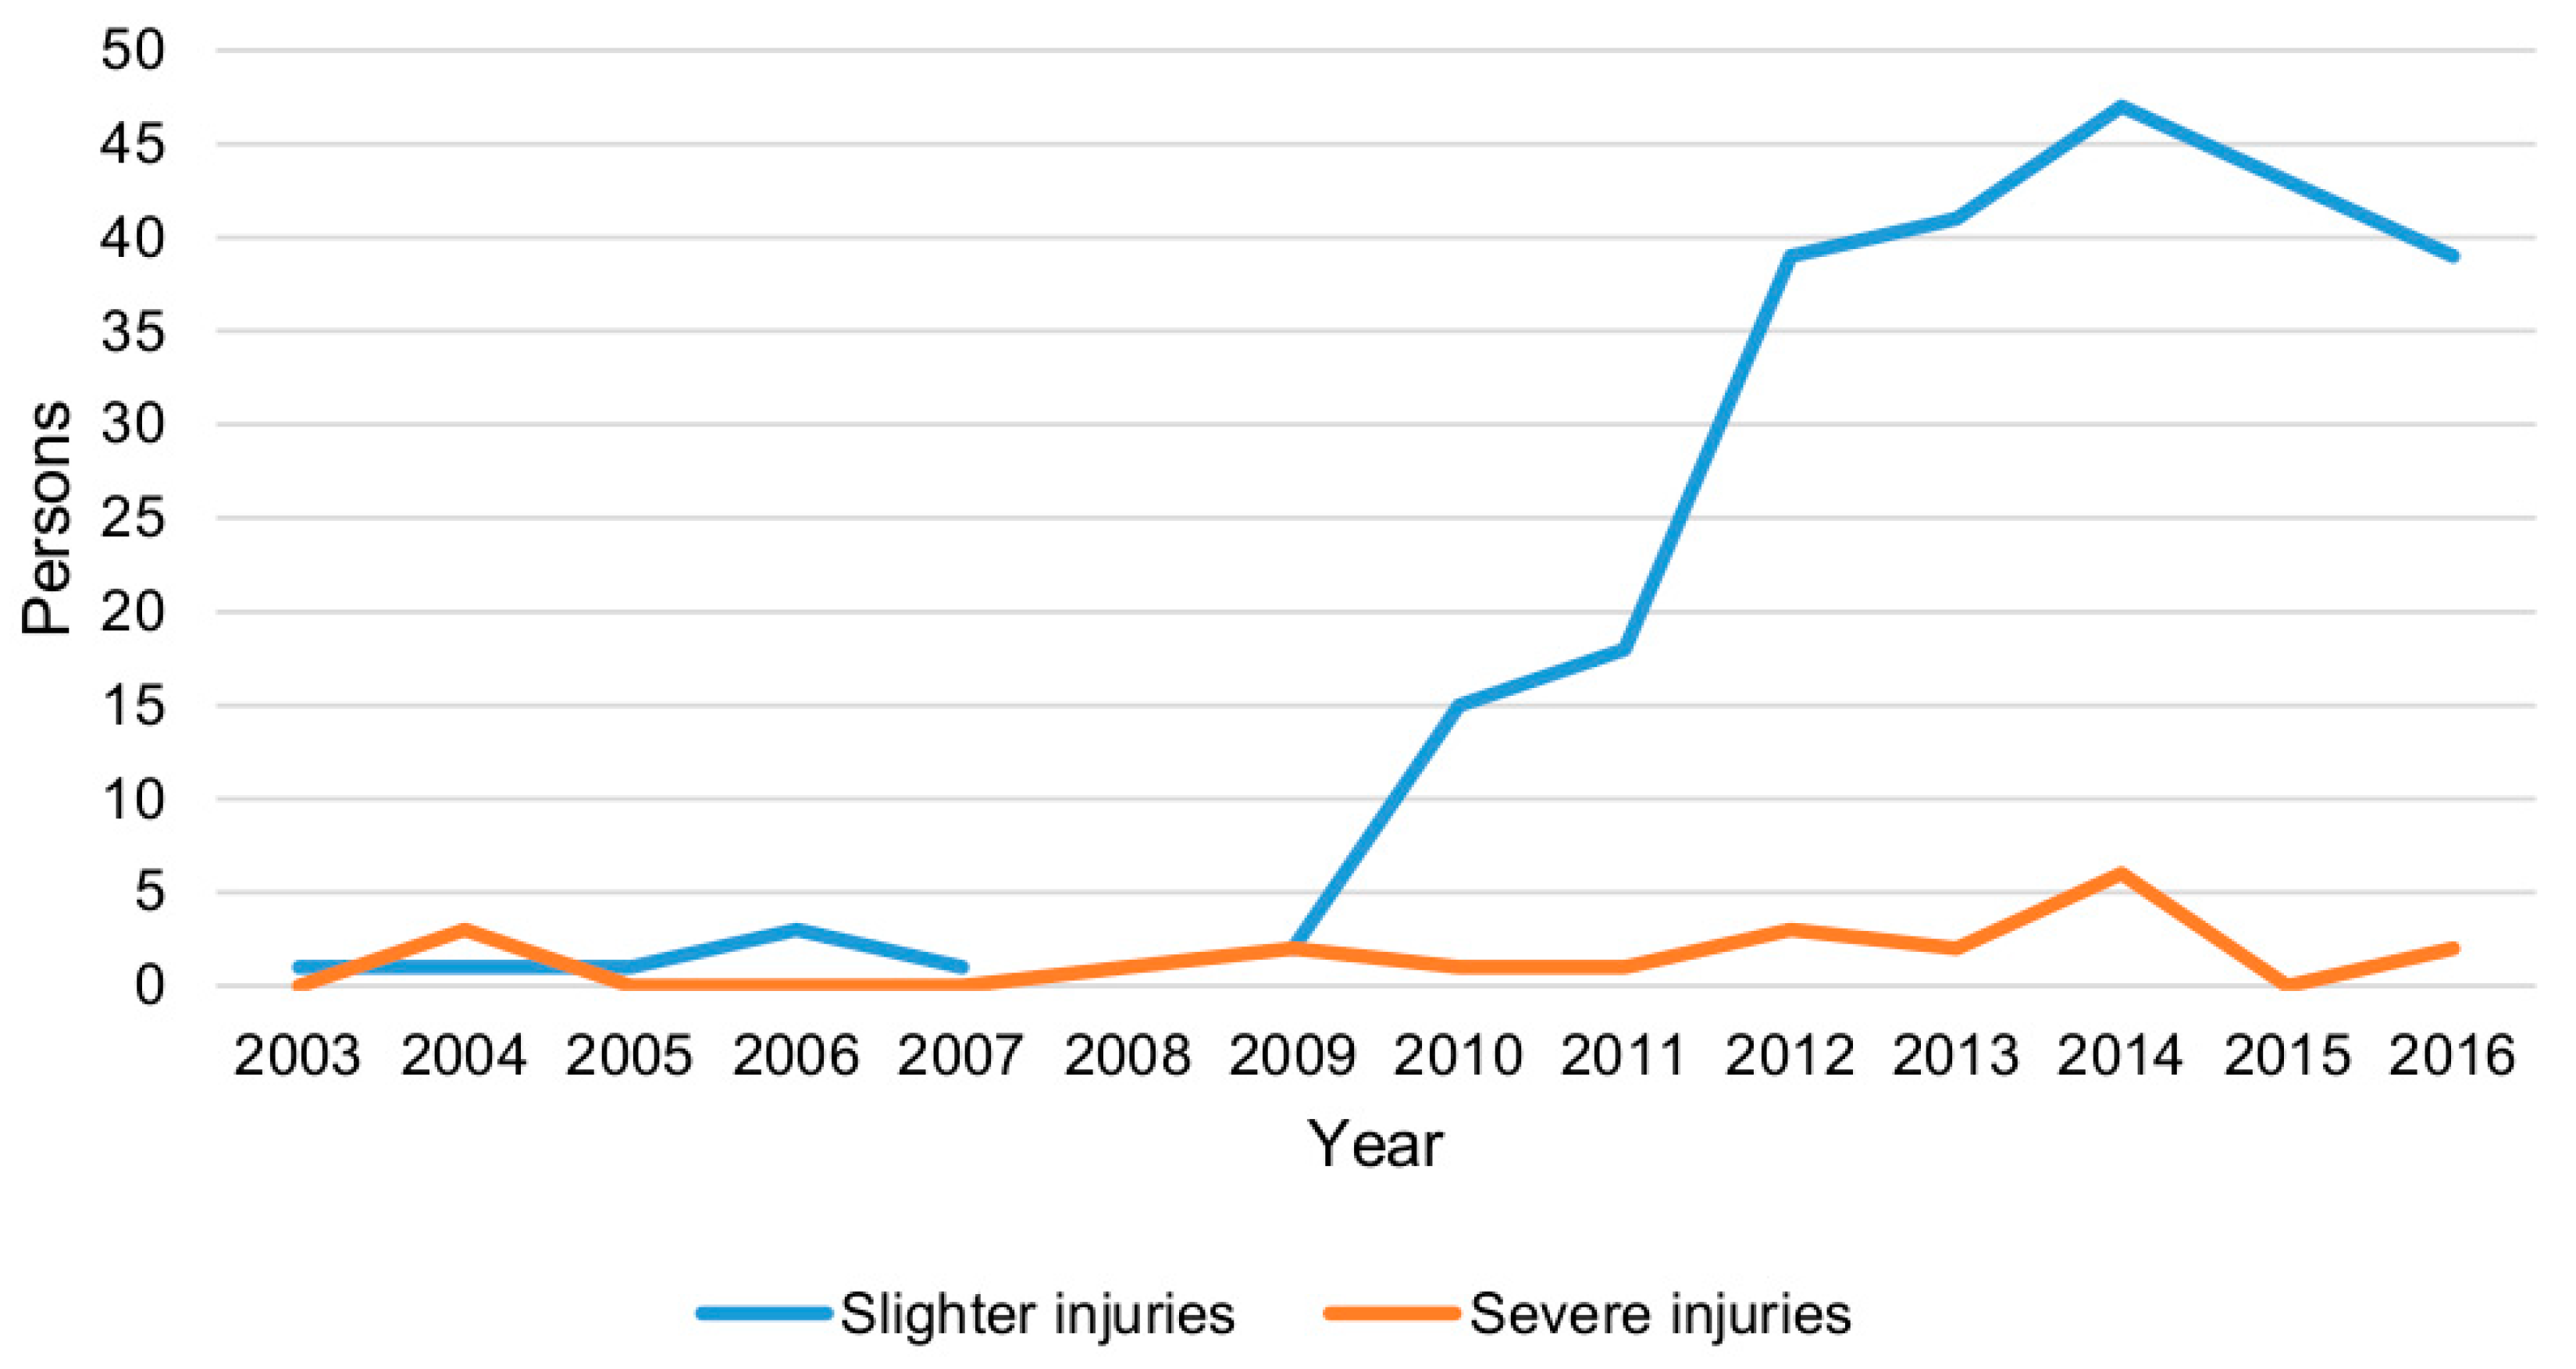
Figure 4.
Trends of personal injuries compared to all wild boar-vehicle accidents in Sweden 2003–2016. The percentage of persons injured to all wild boar-vehicle accidents (Persons: all), and the percentage of accidents with personal injuries to all wild boar-vehicle accidents (Accidents: all). Data originate from STRADA and NVR.


Table 1.
Statistical values of causalities avoided per person for fatalities and injured in Sweden [21,29] and per accident for wild boar property damages [11].
| Fatalities and Injuries | EUR |
|---|---|
| Fatalities | 2,454,106 |
| Severe injuries | 454,106 |
| Slighter injuries | 22,222 |
| Property damages | 2222 |
Table 2.
Wild boar-vehicle accidents in Sweden from 2003 to 2016. The number of persons injured in accidents (severely and slightly injured), the number of vehicle accidents reported by the police, and the number of accidents with property damage. Data on injured persons originates from STRADA (police and hospital reports), data on vehicle accidents with personal injuries originate from STRADA (police reports), and data on property damage accidents originate from NVR.
| Year | Injured Persons | Vehicle Accidents with Personal Injuries | Property Damage Accidents |
|---|---|---|---|
| 2003 | 1 | 0 | 755 |
| 2004 | 4 | 0 | 670 |
| 2005 | 1 | 1 | 987 |
| 2006 | 3 | 2 | 1020 |
| 2007 | 1 | 0 | 1583 |
| 2008 | 1 | 0 | 2464 |
| 2009 | 4 | 1 | 3085 |
| 2010 | 16 | 12 | 2445 |
| 2011 | 19 | 14 | 2647 |
| 2012 | 42 | 25 | 4198 |
| 2013 | 43 | 17 | 3551 |
| 2014 | 53 | 19 | 3714 |
| 2015 | 43 | 18 | 4229 |
| 2016 | 41 | 17 | 4739 |
Table 3.
Results from regression estimates of Models 1 and 2 with persons injured as the dependent variable, N = 14.
Table 3.
Results from regression estimates of Models 1 and 2 with persons injured as the dependent variable, N = 14.
| Model 1 | Model 2 | |||
|---|---|---|---|---|
| Variables | Coefficient | p-Value | Coefficient | p-Value |
| Constant | −8.6550 | 0.050 * | −1.5270 | 0.382 |
| At | 0.0071 | 0.014 ** | ||
| At2 | 0.0012 | 0.006 *** | ||
| Dt | 19.1666 | 0.033 ** | 21.18 | 0.003 *** |
| Adj. R2 | 0.84 | 0.87 | ||
Significance levels; *** p < 0.01, ** p < 0.05, * p < 0.10.
Table 4.
The costs of wild boar-vehicle accidents in Sweden from 2003 to 2016. Costs are calculated from Table 1 and a standard cost of EUR 2222 for property damages. TEUR = thousand Euros.
Table 4.
The costs of wild boar-vehicle accidents in Sweden from 2003 to 2016. Costs are calculated from Table 1 and a standard cost of EUR 2222 for property damages. TEUR = thousand Euros.
| Year | Personal Injuries (TEUR) | Property Damages (TEUR) | Total (TEUR) |
|---|---|---|---|
| 2003 | 25 | 1909 | 1934 |
| 2004 | 1570 | 1688 | 3257 |
| 2005 | 25 | 2476 | 2501 |
| 2006 | 74 | 2524 | 2598 |
| 2007 | 24 | 3832 | 3856 |
| 2008 | 478 | 5766 | 6244 |
| 2009 | 1006 | 7240 | 8246 |
| 2010 | 821 | 5665 | 6486 |
| 2011 | 868 | 5978 | 6846 |
| 2012 | 2245 | 9397 | 11,642 |
| 2013 | 1834 | 7953 | 9786 |
| 2014 | 3805 | 8332 | 12,137 |
| 2015 | 965 | 9492 | 10,457 |
| 2016 | 1775 | 10,531 | 12,306 |
© 2018 by the authors. Licensee MDPI, Basel, Switzerland. This article is an open access article distributed under the terms and conditions of the Creative Commons Attribution (CC BY) license (http://creativecommons.org/licenses/by/4.0/).
Share and Cite
MDPI and ACS Style
Jägerbrand, A.K.; Gren, I.-M. Consequences of Increases in Wild Boar-Vehicle Accidents 2003–2016 in Sweden on Personal Injuries and Costs. Safety 2018, 4, 53. https://0-doi-org.brum.beds.ac.uk/10.3390/safety4040053
AMA Style
Jägerbrand AK, Gren I-M. Consequences of Increases in Wild Boar-Vehicle Accidents 2003–2016 in Sweden on Personal Injuries and Costs. Safety. 2018; 4(4):53. https://0-doi-org.brum.beds.ac.uk/10.3390/safety4040053
Chicago/Turabian StyleJägerbrand, Annika K., and Ing-Marie Gren. 2018. "Consequences of Increases in Wild Boar-Vehicle Accidents 2003–2016 in Sweden on Personal Injuries and Costs" Safety 4, no. 4: 53. https://0-doi-org.brum.beds.ac.uk/10.3390/safety4040053
Note that from the first issue of 2016, this journal uses article numbers instead of page numbers. See further details here.