Comparisons of Predictive Power for Traffic Accident Involvement; Celeration Behaviour versus Age, Sex, Ethnic Origin, and Experience


School of Aerospace, Transport & Manufacturing, Cranfield University, Cranfield, Bedfordshire MK43 0AL, UK
Safety 2018, 4(4), 59; https://0-doi-org.brum.beds.ac.uk/10.3390/safety4040059
Submission received: 30 October 2018
/
Revised: 7 December 2018
/
Accepted: 10 December 2018
/
Published: 12 December 2018
(This article belongs to the Special Issue Traffic Safety and Driver Behaviour)
Abstract
:Driver celeration behaviour theory (DCBT) assumes that risk for a driver of causing a road crash is linearly related to speed change in any given moment and that the speed change variable (celeration) captures all risk (all vehicle control movements can be measured as acceleration). When sampling driver behaviour, the celeration variable is calculated as the average of all absolute values of acceleration when the vehicle is moving. DCBT predicts that no other variable can be a stronger predictor of (the same set of) traffic accident involvements than celeration, given equal reliability of the predictors. Also, other predictors, regardless of which ones, should associate with celeration in ways that are similar to how they correlate with accidents. Predictions were tested in a sample of bus drivers, against variables with reliabilities close to 1 (age, sex, experience, ethnic origin), which are not necessarily optimal predictors for testing but were the only predictors available. The results were largely as predicted from theory. The principles for testing the kind of predictions made from celeration theory were discussed, outlining the importance of a larger number of variables, preferably with repeated measurements.
1. Introduction
The history of trying to predict individual accident record from other variables is rather long; the first attempts were made already in the early twentieth century [1,2], an endeavour which was soon extended to traffic [3]. Many different viewpoints and variables have been proposed and tested as crash predictors, and various rather weak associations found, possibly mirroring the multiple causes of traffic accidents. Some broad classes of predictors are medical, cognitive, behavioural, and psychiatric (see reviews [4,5,6]). In meta-analyses, the effect sizes of various predictors have usually been found to be weak (e.g., cannabis [7], sleep apnoea [8], personality [9]). Currently, only the use of alcohol has been shown to have a strong association with crashes [10].
However, it can be noted that although a few of these studies have been guided by theoretical considerations, most have been rather common sense in their hypotheses. For example, medical variables mainly seem to be based upon the basic thought that being ‘impaired’ by illness and/or medications does not make a safe driver. Furthermore, what little theory has found its way into this area has hardly been able to make predictions that are specific enough to be rigorously tested (i.e., no expected effect sizes are described, only whether associations are expected to be positive or negative). Similarly, there does not seem to a theory or hypothesis which makes predictions about the relative predictive power of various variables versus traffic accidents.
Driver celeration behaviour theory (DCBT [11]) make the basic assumption that all behaviours of a driver which are related to safety can be measured as longitudinal and lateral speed changes, where the risk increases linearly with the size of the speed change. However, in contrast to the use of events (near crashes, crash-relevant events, triggers, and other terms) within naturalistic driving research (e.g., [12,13,14,15]), where apparently it is assumed that only speed changes above certain thresholds (which differ between studies) are dangerous, DCBT assumes that all changes carry some risk. This risk is of course miniscule within the short periods of time over which speed changes are usually calculated. Over time, however, these very small risks add up, until the right circumstances coincide for an actual crash to happen. Drivers who habitually execute more and stronger speed changes will therefore be at higher risk for crashing. Celeration is therefore calculated as the mean of all absolute values of speed changes during movement of the vehicle, when sampling from a driver’s behaviour. This method of computing a risk index for a driver can be compared to that of events, where the number of happenings during a given journey is negatively related to the level of the threshold used. At very low thresholds (for example, <2 m/s2), this kind of calculation will become very similar to celeration [16]. In standard practice, however, the event-based method and DCBT are very different, although this has not always been understood (e.g., [13]). Apart from the basic difference in assumptions of risk and speed change, the event-based approach is highly subjective and therefore differs between studies, while DCBT is defined only in physical terms and therefore is totally objective. Furthermore, DCBT is a theoretical construction which predicts a number of testable outcomes, while the event-based approach makes no predictions at all (because no theory has been developed around it). Similarly, a few papers using acceleration-based measurements to predict crash involvement have been published [17,18,19] but without any theoretical basis. The closest thing to an actual theory about acceleration behaviour and crash involvement before the DCBT is the paper by Robertson, Winnett, and Herrod [20].
The present paper aims at showing the principles involved in testing two of the predictions from DCBT—predictions which no other theory has made. The test performed in the present paper is not perfect, and the results therefore are not very strong. Instead, the paper should be seen as a model for how this kind of testing should be undertaken. The need for a paper such as this is due to the many complicated methodological issues involved [21]. Without consideration of issues such as culpability for crashes and reliability of variables, which are explicitly included in DCBT, most tests of predictions from this theory will be meaningless.
In driver celeration behaviour theory [11], it has been predicted that no other variable can be a stronger predictor than celeration, unless it has a higher reliability (in the same measurement/study). This is due to the basic assumptions of the theory that all speed changes (celerations) signify risk, and that there is no other way of causing accidents than through behaviour, all of which is channelled as celerations (speed changes). Celeration behaviour is therefore the direct cause of accidents, and all other variables are more or less further removed as causes. It is thus assumed that, for example, cognitive differences, or medical maladies, only have their effect upon accidents by changing the (vehicle control) behaviour of the driver, which is summarized as celeration. Apart from the prediction of celeration as the stronger predictor when its reliability is the same or higher, the above reasoning leads to the prediction that the correlation between a certain predictor and celeration should be stronger than the predictor’s association with accidents, but similar. None of these two hypotheses seem to have been proposed or tested before.
Regarding the reliability of variables, some facts can be noted; the technical term and value of reliability are mathematically derived from the association between two different halves of the same test or measurement. In the present study, however, it refers to the correlation between two measurements from different days. For the terminological purist, it is therefore better to talk about the stability between measurements. What is of importance presently is the effect of averaging over several different measurements; this method has as its effect an increase in the stability/reliability of any value that measures something, as random error (from natural fluctuations or the measurement method) will tend to cancel its own effects in the long run [22]. Thus, if there is indeed an association between a predictor and a dependent variable, this will become stronger (in the sample) if the average of several measurements is used as the predictor instead of a single one [13]. Although this principle would seem to be fairly well known, at least among psychologists, it seems to have had little impact upon traffic psychology, where measurements are seldom repeated on the same individuals [6].
When using road traffic crashes as the dependent variable in studies on individual differences, it is of outmost importance to use only the incidents which have been caused by the driver under study. Other crashes represent error variance, only related to exposure, and will thus decrease effect sizes [23,24,25,26]. Although this aspect is not crucial in the current study (because effect sizes are compared between predictors and any error in this respect is therefore held constant), only culpable crashes were used, as a matter of principle.
The present study set out to showcase how two predictions from DCBT can be tested, using bus driver data. Also, the problem of the reliability of variables was taken into account.
2. Materials and Methods
2.1. Data
All data was procured from the bus company Gamla Uppsalabuss (GUB) in Uppsala, Sweden. This company runs all intra-city bus traffic in Uppsala and has about 350 drivers and 180 buses at any one time.
Incidents with buses (including physical damage, injuries, hitting animals, and going off the road) had been gathered and entered into a database [27]. From this database, the number of culpable accidents [23,24,25] per driver per year was extracted for the time period 1999–2005, forming six variables. These were thereafter aggregated into three different time periods, where the longest (1999–2005) was not expected to show the main effect, while the medium (2001–2004) would show some, and the shortest (2002–2003) would show the strongest effect. This systematic test of predictive range for celeration was due to the use of highly stable predictors as a comparison in this analysis. Predictors which do not change, or change systematically over time, can be used to predict crashes over very long time periods. For a variable where the long-term changes, and the reasons for them, are unknown, this is probably not possible.
Age of drivers was calculated as per the last day of 2003, as was experience, while sex and ethnic origin (Swedish/non-Swedish) was coded (dichotomously) using the drivers’ names, from company work lists (see Table 1 for descriptive statistics).
Celeration data had been gathered in a project on training in fuel efficient driving [28], with measurements running from August 2001 to February 2004. Vehicle computers had been installed in five buses running on the same route, calculating the speed differences at 2.5 Hz. These data were later averaged over each duty a driver served, and each measurement used in the present study was therefore the absolute mean of all longitudinal accelerations when v > 0 for driving between 12–36 kilometres on one day. As drivers work different schedules and numbers of hours, the number of measurements per driver differed strongly (1 to 24). It was expected that accident prediction would be more accurate for drivers with more measurements averaged.
The use of longitudinal acceleration is an approximation of the theoretically specified celeration variable. It has been found that it is the longitudinal speed change that adds about eighty percent of the variance to this variable [29].
This dataset is still in use and therefore not publicly available.
2.2. Reliability of Variables
The term reliability will here be used in the sense of between measurements correlation, which can be seen as how stable a variable is between measurements. This value is influenced both by the stability over time of the variable in question and by the measurement method. This has repercussions for the usefulness of a variable as a predictor and for how it should be measured. In essence, a behaviour which varies a lot from day to day is difficult to use as a predictor of a long-term outcome because any single (one-day) measurement will probably not be a good estimate (reliability is low) of the overall behaviour. The remedy is to increase the number of measurements per person and average them, which will increase reliability. This very basic methodological problem is extremely important in driver behaviour research, where the variables used often have the characteristic of low reliability.
As has been repeatedly argued in previous publications, the choice of time period for calculating the accident criterion can be decisive for the effects found [6,26,29], as the time frame used may be too long for the type of predictor used to be valid (i.e., if reliability of the independent variable is low, a short time period must be used for accidents, or else the accidents will to some degree have happened when the behaviour of the driver was different). In the present paper, this notion is of prime importance, as the reliability of celeration is to some degree dependent upon the time period between measurements but also increases drastically when different measurements are averaged [30]. However, in general, the predictive power increases with the time period of accidents, as this increases variance [26].
Here, a distinction between two different uses of the term reliability must be made. First, in-between measurements correlations increase as measurements are averaged and the average is used as one measurement (i.e., the correlation will be higher when the average of two measurements is correlated with another such point than if a single measurement is used). Reliability will thus increase with the aggregation of data. However, this increase in reliability will likely be countered if the goal is to estimate the behaviour in a time period outside of the actual measurements (under the assumption that most behaviours will have some sort of long-term systematic change).
As the other independent variables used in the present study all had reliabilities very close to 1, the prediction that celeration will be the better accident predictor was only expected to hold good for a time period when the reliability of celeration was very high. In the present data, this means for the time period when measurements where actually made (late 2001–early 2004). This limitation led to the expectation that the effect would be stronger within this time frame and weaker when the boundary was widened (i.e., the accident variable was calculated over a longer time period). Furthermore, as the reliability of celeration is strongly dependent upon the number of measurements averaged, and the present data contained drivers with different numbers of measurements, it was expected that the main effect of relative predictive superiority of celeration would increase when drivers with few measurements were excluded, as shown previously for the celeration variable in isolation [30,31].
As for actual estimates of reliability for celeration in these data, it was found that correlations between single measurements for bus drivers (of about two hours of driving each) are about 0.5 (Pearson r), increasing to 0.6 for two measurements averaged, and 0.7 for three measurements [30] (see also [29,32] for other calculations). Celeration behaviour thus fluctuates a bit for each driver, but the average is stable over several years.
2.3. Analysis
The basic statistical tool of the present study was the Pearson correlation. However, exactly which type of analysis is used for this type of test is not important. Actually, any zero-order association measure could be utilized, as it was the relative strength of association that was the target of the investigation. As the current variables had very differing statistical characteristics, different tests would usually have been applied. However, the intended test of similarity of predictive patterns versus crashes between celeration and other predictors required that the same test was used. As the Pearson correlation tends to be very robust against violations against normality of data (as can be seen in meta-analytic calculations on accident data [26]), this was considered to be a useful compromise. Furthermore, if a two-group test (like Student’s, or ANOVA) had been used instead, for the two categorical variables (sex and ethnicity), these values could have been converted into Pearson r values with good precision [33].
Apart from the first test of relative strength of correlations with accidents, a further test can be made in terms of whether any predictor can add any power to that of celeration in a multiple regression. Given the predictions from celeration theory, this should not be possible (This effect could also be tested in a path analysis. Other predictors should always take the path through celeration towards crash involvement.).
The prediction about similarity of associations for predictors with accidents and celeration requires a special type of analysis, which can be called an association pattern and is best shown in a visualization (i.e., a figure). However, this can also be tested in a meta-correlation (i.e., the effect sizes are treated as variables and correlated). The effects for the predictors versus celeration and accidents would form one variable each. As the theory predicts that predictors will be more strongly associated with celeration, the absolute values of correlations need to be used (or a −0.2 correlation would be treated as less than −0.1 in this secondary analysis).
3. Results
3.1. Superiority of Celeration as Predictor
As can be seen in Table 2, the shortest time period for accidents yielded the predicted effect, although the difference between celeration and the next highest correlation (experience) was only significant at p < 0.10 (test for difference between dependent correlations). In a multiple regression, experience added significantly (at p < 0.05) to the explained variance after celeration. However, this effect was reduced to non-significance by removing the thirteen drivers with only one measurement (i.e., drivers with low reliability in their celeration estimates).
For the longer time periods, celeration was inferior as a predictor. However, when celeration reliability was increased by removing drivers with few measurements, the correlation of celeration with accidents increased and finally surpassed that of the other variables for the 2001–2004 period. This was achieved when the number of measurements was more than ten per drivers (Table 3). At this level, only celeration added significantly (at p < 0.05) to the explained variance in a multiple regression. Although the method of removing drivers with low reliability in their measurements made all correlations change somewhat, only celeration systematically increased its accident predictive power.
For the longest period of time, accidents could not be better predicted by celeration, despite removals of low reliability drivers (i.e., those with few measurements).
3.2. Similarity of Associations
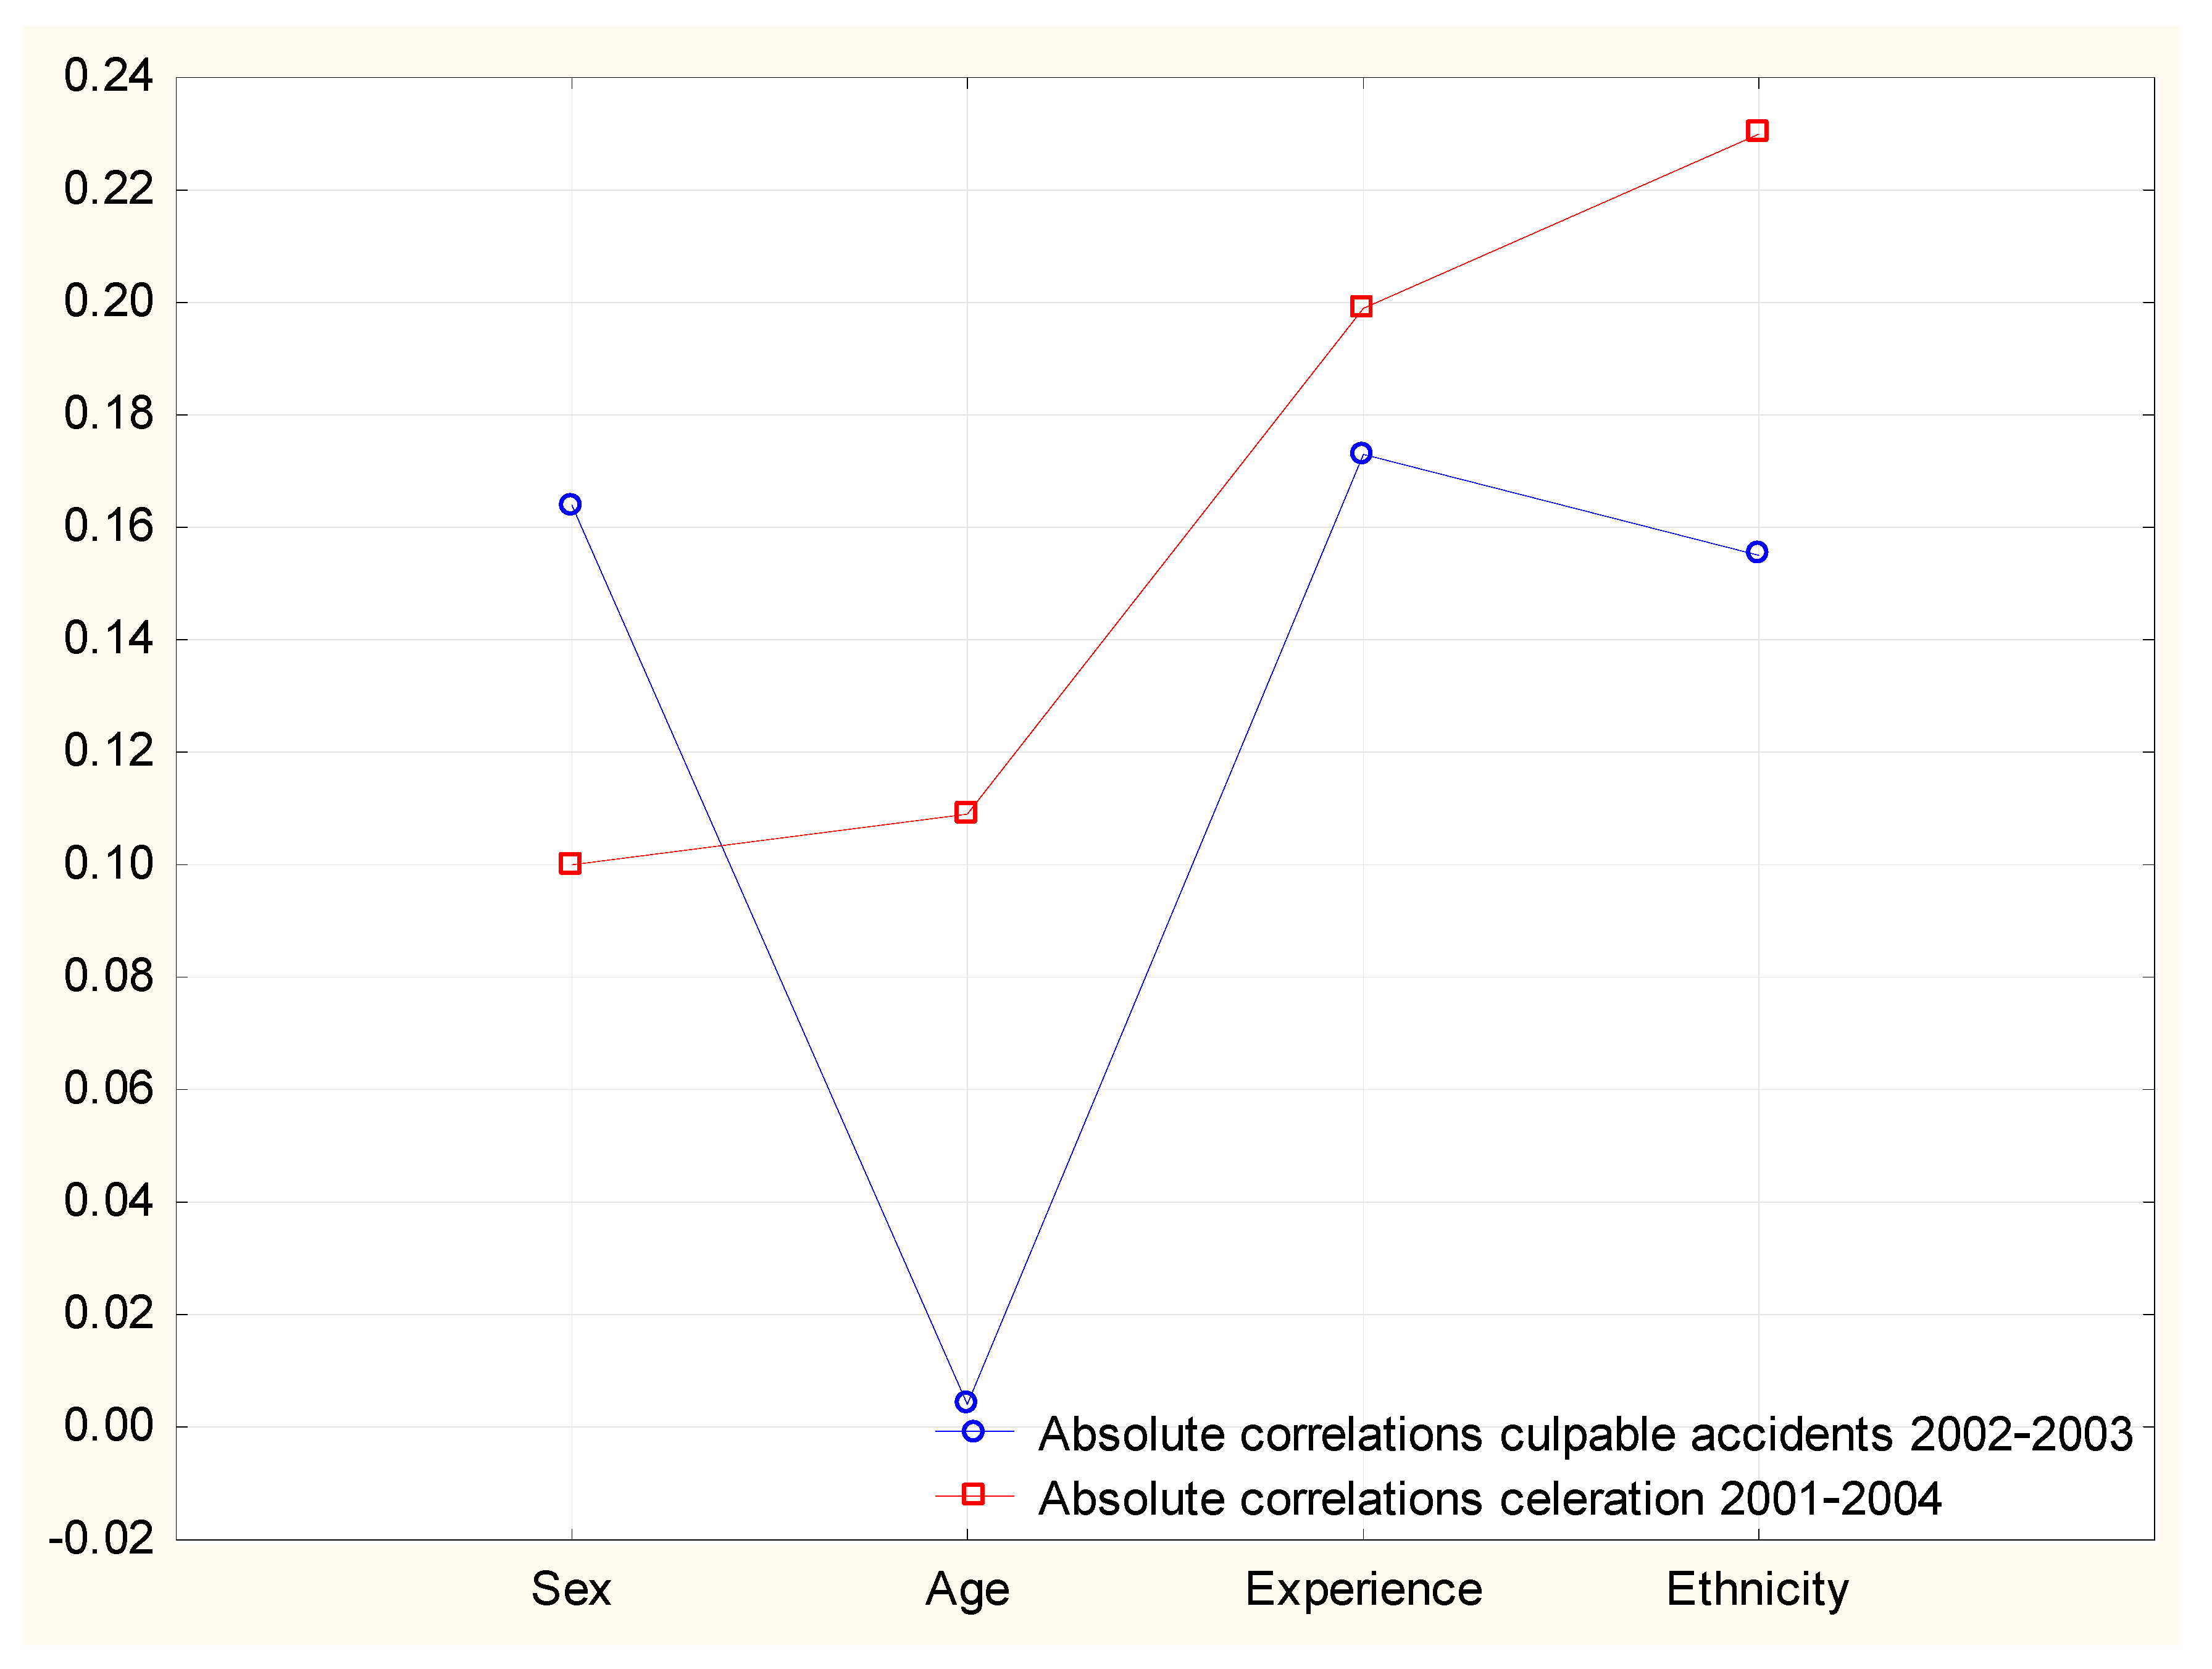
The sizes of the correlations between age, sex, experience, and ethnic origin with accidents on one hand and celeration on the other can be seen in Figure 1. As should be apparent from the lines in the figure, the association between the two sets of correlations was of medium strength (r = 0.5, N = 4). In this set of variables, the sex variable did not conform to the prediction but yielded a stronger correlation with crashes than with celeration.
4. Discussion
The main aim of the present paper was to describe in detail how two predictions from DCBT should be tested within a methodological framework which takes into account the reliability of the variables included. The need for a paper like this is indicated by the lack of theory tests (and testable theory) within traffic psychology and the equal lack of methodological rigour in this research area [6,26].
The analysis tested two hypotheses derived from the driver celeration theory and found some agreement between results and predictions. It can be noted that not only were most of the specific effects as expected, but certain manipulations had the systematic influences that they should have, given the correctness of the theory and basic methodological considerations (as described in previous publications, e.g., [6,11,26]).
The limits of the study are mainly that the results come from one population of drivers, one specific type of vehicle, and one driving culture. Replications are naturally needed.
Furthermore, the test of the superiority of celeration as a predictor was not as strict as could have been the case, as the variables used as comparisons had very high reliabilities. A better test would be to use variables with similar reliability, preferably with repeated measurements, which would make it possible to systematically manipulate the reliability of all variables, thus testing the hypothesis at several levels.
The test of the similarity of correlations for predictors versus celeration and accidents was limited by only having four variables to use as cases in the comparison. A test using dozens of variables would, of course, be better. Although this would make necessary a rather extended data collection, it would not be as difficult as could be expected at first look; any variable could be used, whether normally found to be predictive of accidents or not. This could include, for example, obesity, time of being a licensed driver, engine size of the vehicle normally used, percent driving at night, and so on.
The problem of differing reliability of predictors in an analysis like the present one could be handled by controlling statistically for this feature, according to the formula by Hunter and Schmidt [34]. In regard to the present data, this would not have made any difference for the conclusions, however.
One feature of the present analysis, which has emerged previously in these data [31], is that the predictive power of celeration decreases rather rapidly as soon as the time period used for calculating the accident criterion becomes longer than that used for celeration measurements. From the point of view of the driver celeration theory, this can only be explained by the reliability of celeration decreasing similarly strongly. Although some previous calculations do confirm this [6,30], this facet has not been thoroughly investigated. One can wonder why celeration changes, as it does correlate with most of the rather unchanging variables it was compared to in the present study and does not change after crash involvement [35].
The conclusions from the present paper are that, again, tests have shown support for the DCBT, although with some slight deviations. This is similar to other papers [16,24,30,36]. This means that the theory is superior to other theories of driver behaviour, not only in its testability, but in its support from tests. It does, however, have one weakness, which will be addressed in the future; it does not predict the specific size of a correlation between celeration and crash involvement in an empirical study. This is possible to do, given the predicted ideal endpoint of perfect correlation, but a formula for the prediction of empirical results needs to take into account the reliability of celeration, the variance in the accident variable, etc. All of these will vary between studies and influence the results.
An empirical shortcoming of the research on DCBT is that so far only bus drivers have been used as subjects and that the driving environments have therefore been very homogenous. Results from other driver groups are needed to confirm or refute the predictions made from theory.
Finally, it can be asked what the use of DCBT might be? It can be noted that it is different from other driver behaviour theories in that it does not try to explain why behaviour occurs, but centres on the relation between driver behaviour and crash involvement. This focus makes it practical to use in applied settings such as telematics (in vehicle measurement systems). Such systems use extremely complicated algorithms for the calculation of events, usually without any kind of validation of the formulae. The DCBT offers a simple approach which can easily be implemented in any telematics hardware as well as smartphones.
However, it is apparently the simplicity of the basic assumptions and measurements of the DCBT which have hampered its acceptance and use in research and applied safety work. To people used to mathematical formulae, the equations describing the DCBT must look childishly simple. For some reason, this has been interpreted as evidence that it is wrong. The point of the theory, however, lies not in any complicated mathematics but the rather complex results of the basic assumption.
Funding
The data used in this paper was gathered in two different projects, under the following grants: Swedish Road Administration, grant AL90AB 2001:7758, Swedish Communications Research Board grant 1997-0259.
Acknowledgments
All data gathering and editing was undertaken by Hanna Skagerström. Hardware and software were from Drivec.
Conflicts of Interest
The author has no conflict of interest. The funders had no role in the design of the study; in the collection, analyses, or interpretation of data; in the writing of the manuscript, or in the decision to publish the results.
References
- Greenwood, M.; Woods, H.M. The Incidence of Industrial Accidents upon Individuals with Specific Reference to Multiple Accidents; Industrial Fatigue Research Board, Report No 4; His Majesty’s Stationary Office: London, UK, 1919. [Google Scholar]
- Farmer, E.; Chambers, E.G. A Psychological Study of Individual Differences in Accident Rates; Industrial Health Research Board Report No 38; Industrial Fatigue Research Board: London, UK, 1926. [Google Scholar]
- Farmer, E.; Chambers, E.G. A Study of Accident Proneness among Motor Drivers; Medical Research Council, Industrial Health Research Board, Report 84; His Majesty’s Stationary Office: London, UK, 1939. [Google Scholar]
- Golding, A.P. Differential Accident Involvement: A Literature Survey; Council for Scientific and Industrial Research Reports, PERS 356:44; Transport Research Laboratory: Berks, UK, 1983. [Google Scholar]
- Lester, J. Individual Differences in Accident Liability: Review of the Literature; TRRL Research Report 306; Transport and Road Research Laboratory: Crowthorne, UK, 1991. [Google Scholar]
- Af Wåhlberg, A.E. Some methodological deficiencies in studies on traffic accident predictors. Acc. Anal. Prev. 2003, 35, 473–486. [Google Scholar] [CrossRef]
- Asbridge, M.; Hayden, J.A.; Cartwright, J.L. Acute cannabis consumption and motor vehicle collision risk: systematic review of observational studies and meta-analysis. BMJ 2012, 344, e536. [Google Scholar] [CrossRef] [PubMed]
- Tregear, S.; Reston, J.; Schoelles, K.; Phillips, B. Obstructive sleep apnea and risk of motor vehicle crash: Systematic review and meta-analysis. J. Clin. Sleep Med. 2009, 5, 573–581. [Google Scholar] [PubMed]
- Af Wåhlberg, A.E.; Barraclough, P.; Freeman, J. Personality versus traffic accidents; Meta-analysis of real and method effects. Transp. Res. Part F 2016, 44, 90–104. [Google Scholar] [CrossRef]
- Taylor, B.; Irving, H.M.; Kanteres, F.; Room, R.; Borges, G.; Cherpitel, C.J.; Bond, J.; Greenfield, T.; Rehm, J. The more you drink the harder you fall: A systematic review and meta-analysis of how acute alcohol consumption and injury or collision risk increase together. Drug Alcohol. Depend. 2010, 110, 108–116. [Google Scholar] [CrossRef] [PubMed]
- Af Wåhlberg, A.E. Driver celeration behaviour and accidents—An analysis. Theor. Issues Ergon. Sci. 2008, 9, 383–403. [Google Scholar] [CrossRef]
- Klauer, S.G.; Dingus, T.A.; Neale, V.L.; Sudweeks, J.D.; Ramsey, D.J. Comparing Real-World Behaviors of Drivers with High versus Low Rates of Crashes and Near-Crashes; Report DOT HS 811 091; US Department of Transportation, National Highway Traffic Safety Administration: Washington, DC, USA, 2009.
- Klauer, S.G.; Sayer, T.B.; Baynes, P.; Ankem, G. Using real-time and post hoc feedback to improve driving safety for novice drivers. In Proceedings of the Human Factors and Ergonomics Society 2016 Annual Meeting, Washington, DC, USA, 19–23 September 2016. [Google Scholar]
- Hickman, J.S.; Hanowski, R.J. Use of a video monitoring approach to reduce at-risk driving behaviors in commercial vehicle operations. Transp. Res. Part F 2011, 14, 189–198. [Google Scholar] [CrossRef]
- Simons-Morton, B.G.; Simons-Morton, C.; Bingham, R.; Ouimet, M.C.; Pradhan, A.K.; Chen, R.; Barretto, A.; Shope, J.T. The effect on teenage risky driving of feedback from a safety monitoring system: A randomized controlled trial. J Adolesc. Health 2013, 53, 21–26. [Google Scholar] [CrossRef] [PubMed]
- Khorram, B.; Af Wåhlberg, A.E.; Tavakoli, A. Longitudinal jerk and celeration as measures of safety in bus rapid transport drivers in Tehran. 2018; submitted. [Google Scholar]
- Lajunen, T.; Summala, H. Effects of driving experience, personality, driver’s skill and safety orientation on speed regulation and accidents. In Traffic and Transport Psychology: Theory and Application; Rothengatter, T., Carbonell Vaya, E., Eds.; Pergamon: Amsterdam, The Netherlands, 1997; pp. 283–294. [Google Scholar]
- Quimby, A.; Maycock, G.; Palmer, C.; Grayson, G.B. Drivers’ Speed Choice: An In-Depth Study; TRL Report 326; Transport Research Laboratory: Crowthorne, UK, 1999. [Google Scholar]
- Lajunen, T.; Karola, J.; Summala, H. Speed and acceleration as measures of driving style in young male drivers. Percept. Mot. Skills 1997, 85, 3–16. [Google Scholar] [CrossRef] [PubMed]
- Robertson, D.I.; Winnett, M.A.; Herrod, R.T. Acceleration signatures. Traf. Eng. Contr. 1992, 33, 485–491. [Google Scholar]
- Af Wåhlberg, A.E. The Prediction of Traffic Accident Involvement from Driving Behavior. Ph.D. Thesis, Uppsala University, Uppsala, Sweden, 3 March 2006. [Google Scholar]
- Rushton, J.P.; Brainerd, C.J.; Pressley, M. Behavioral development and construct validity: The principle of aggregation. Psycholo. Bull. 1983, 94, 18–38. [Google Scholar] [CrossRef]
- Dorn, L.; af Wåhlberg, A.E. Behavioural culpability for traffic accidents. Transp. Res. Part F 2018, 60, 505–514. [Google Scholar] [CrossRef]
- Af Wåhlberg, A.E. The relation of non-culpable traffic incidents to bus drivers’ celeration behavior. J. Saf. Res. 2008, 39, 41–46. [Google Scholar] [CrossRef] [PubMed]
- Af Wåhlberg, A.E.; Dorn, L. Culpable versus non-culpable traffic accidents; what is wrong with this picture? J. Saf. Res. 2007, 38, 453–459. [Google Scholar] [CrossRef] [PubMed]
- Af Wåhlberg, A.E. Driver Behaviour and Accident Research Methodology; Unresolved Problems; Ashgate: Farnham, UK, 2009; ISBN 9780754670766. [Google Scholar]
- Af Wåhlberg, A.E. Characteristics of low speed accidents with buses in public transport. Acc. Anal. Prev. 2002, 34, 637–647. [Google Scholar] [CrossRef]
- Af Wåhlberg, A.E. Long term effects of training in economical driving; fuel consumption, accidents, driver acceleration behavior and technical feedback. Int. J. Ind. Ergon. 2007, 37, 333–343. [Google Scholar] [CrossRef]
- Af Wåhlberg, A.E. The stability of driver acceleration behavior, and a replication of its relation to bus accidents. Acc. Anal. Prev. 2004, 36, 83–92. [Google Scholar] [CrossRef]
- Af Wåhlberg, A.E. Aggregation of driver celeration behavior data: Effects on stability and accident prediction. Saf. Sci. 2007, 45, 487–500. [Google Scholar] [CrossRef]
- Af Wåhlberg, A.E. Long-term prediction of traffic accident record from bus driver celeration behavior. Int. J. Occup. Saf. Ergon. 2007, 13, 159–171. [Google Scholar] [CrossRef] [PubMed]
- Af Wåhlberg, A.E. Stability and correlates of driver acceleration behaviour. In Driver Behaviour and Training, Proceedings of the First International Conference on Driver Behaviour and Training, Stratford-upon-Avon, UK, 11–12 November 2003; Dorn, L., Ed.; Ashgate: Aldershot, UK, 2003; pp. 45–54. ISBN 0-7546-3835-9. [Google Scholar]
- Af Wåhlberg, A.E. Accuracy of conversion formulae for effect sizes. 2018; submitted. [Google Scholar]
- Hunter, J.E.; Schmidt, F.L. Methods of Meta-Analysis: Correcting Error and Bias in Research Findings; Sage: Newbury Park, CA, USA, 1990; ISBN 0-8039-3223-5. [Google Scholar]
- Af Wåhlberg, A.E. Changes in driver celeration behavior over time; do drivers learn from collisions? Transp. Res. Part F 2012, 15, 471–479. [Google Scholar] [CrossRef]
- Af Wåhlberg, A.E. Speed choice versus celeration behavior as traffic accident predictor. J. Saf. Res. 2006, 37, 43–51. [Google Scholar] [CrossRef] [PubMed]
Figure 1.
The correlations of sex, age, experience, and ethnic origin with culpable accidents and celeration. N = 259.
Figure 1.
The correlations of sex, age, experience, and ethnic origin with culpable accidents and celeration. N = 259.


Table 1.
The means and standard deviations (where applicable) of accidents and the predictor variables; celeration (m/s2), sex (percent men), age (years), experience (years of employment at Gamla Uppsalabuss (GUB)), and ethnic origin (percent drivers with Swedish names). N = 259.
Table 1.
The means and standard deviations (where applicable) of accidents and the predictor variables; celeration (m/s2), sex (percent men), age (years), experience (years of employment at Gamla Uppsalabuss (GUB)), and ethnic origin (percent drivers with Swedish names). N = 259.
| Culpable Accidents 2002–2003 | Celeration | Sex | Age | Experience | Ethnic Origin |
|---|---|---|---|---|---|
| 0.49/0.79 | 0.502/0.044 | 87% | 47.3/9.6 | 11.1/9.6 | 48.6% |
Table 2.
The correlations of celeration, sex, age experience, and ethnic origin with culpable accident involvement in different time periods, for bus drivers at GUB.
Table 2.
The correlations of celeration, sex, age experience, and ethnic origin with culpable accident involvement in different time periods, for bus drivers at GUB.
| Variable | Culpable Accidents 2002–2003 (N = 259) | Culpable Accidents 2001–2004 (N = 229) | Culpable Accidents 1999–2005 (N = 153) |
|---|---|---|---|
| Celeration 2001–2004 | 0.260 *** | 0.191 ** | 0.079 |
| Sex | 0.164 ** | 0.171 * | 0.111 |
| Age | −0.004 | −0.015 | 0.004 |
| Experience | −0.173 ** | −0.240 *** | −0.148 |
| Ethnic origin | −0.155 * | −0.219 *** | −0.204 * |
* p < 0.05, ** p < 0.01, *** p < 0.001.
Table 3.
The correlations of celeration for drivers with more than ten such measurements for sex, age, experience, and ethnic origin with culpable accident involvement in different time periods, for bus drivers at GUB.
Table 3.
The correlations of celeration for drivers with more than ten such measurements for sex, age, experience, and ethnic origin with culpable accident involvement in different time periods, for bus drivers at GUB.
| Variable | Culpable Accidents 2002–2003 (N = 137) | Culpable Accidents 2001–2004 (N = 129) | Culpable Accidents 1999–2005 (N = 81) |
|---|---|---|---|
| Celeration 2001–2004 | 0.296 *** | 0.267 ** | 0.074 |
| Sex | 0.162 | 0.215 * | 0.158 |
| Age | −0.033 | 0.028 | 0.040 |
| Experience | −0.212 * | −0.227 ** | −0.055 |
| Ethnic origin | −0.170 * | −0.239 ** | −0.170 |
* p < 0.05, ** p < 0.01, *** p < 0.001.
© 2018 by the author. Licensee MDPI, Basel, Switzerland. This article is an open access article distributed under the terms and conditions of the Creative Commons Attribution (CC BY) license (http://creativecommons.org/licenses/by/4.0/).
Share and Cite
MDPI and ACS Style
Af Wåhlberg, A. Comparisons of Predictive Power for Traffic Accident Involvement; Celeration Behaviour versus Age, Sex, Ethnic Origin, and Experience. Safety 2018, 4, 59. https://0-doi-org.brum.beds.ac.uk/10.3390/safety4040059
AMA Style
Af Wåhlberg A. Comparisons of Predictive Power for Traffic Accident Involvement; Celeration Behaviour versus Age, Sex, Ethnic Origin, and Experience. Safety. 2018; 4(4):59. https://0-doi-org.brum.beds.ac.uk/10.3390/safety4040059
Chicago/Turabian StyleAf Wåhlberg, Anders. 2018. "Comparisons of Predictive Power for Traffic Accident Involvement; Celeration Behaviour versus Age, Sex, Ethnic Origin, and Experience" Safety 4, no. 4: 59. https://0-doi-org.brum.beds.ac.uk/10.3390/safety4040059
Note that from the first issue of 2016, this journal uses article numbers instead of page numbers. See further details here.