Evaluation of the Speed Control Cameras in the City of Lisbon
by
 and
and
José Nuno Dias Crespo Martins dos Santos
1, 
Carmen de Jesus Geraldo Carvalheira
2,
Luís Guilherme de Picado Santos
1,* and
Radmila Magušić
1 1
CERIS, Instituto Superior Técnico, Universidade de Lisboa, 1049001 Lisboa, Portugal
2
Department of Civil Engineering, High Institute of Engineering of Lisbon, 1549020 Lisboa, Portugal
*
Author to whom correspondence should be addressed.
Safety 2019, 5(1), 4; https://0-doi-org.brum.beds.ac.uk/10.3390/safety5010004
Submission received: 4 October 2018
/
Revised: 7 December 2018
/
Accepted: 8 January 2019
/
Published: 15 January 2019
Abstract
:In Portugal, urban areas still have a high number of fatalities as a result of road crashes. In 2016, 78% of road crashes with victims, 62% with serious injuries and 54% with fatalities occurred in urban areas. Knowing where crashes occur and what circumstances contributed to these occurrences is the key to finding solutions that minimize injuries and deaths. At the end of 2016, as a safety measure, speed control cameras from SINCRO (Sistema Nacional de Controlo de Velocidade, the national speed control system), began to be installed in different parts of the country. The first application was in 2006 at several spots in the urban area of Lisbon. Cameras were installed in 20 of these locations. This study, using the location of the speed control cameras (which were only effective in 19 spots) and the 2004–2011 crash databases, sought to assess the effectiveness of the measure. The results showed that there was a positive effect on crash rates soon after implementation, but it was also perceived that this effect was attenuated in subsequent years. It is assumed that the reasons for this are due to the familiarization with the system, together with inefficient sanctioning of the violators, and additionally due to malfunctioning equipment not being repaired in a timely manner, which was evident to the users.
1. Introduction
Despite great advances in road safety engineering, road crashes in developed urban metropolises continue to be among the main causes of death in Portugal and around the world. Around 1.25 million people worldwide die every year in road crashes, while the amount of people injured is estimated to reach 50 million, which has led the World Health Organization [1] to declare road crashes to be a global public health problem. In Europe, about 85,000 people die annually and about 2.40 million people are injured in road crashes. In this region, road crashes are the largest cause of death among the population aged 5 to 29 [1].
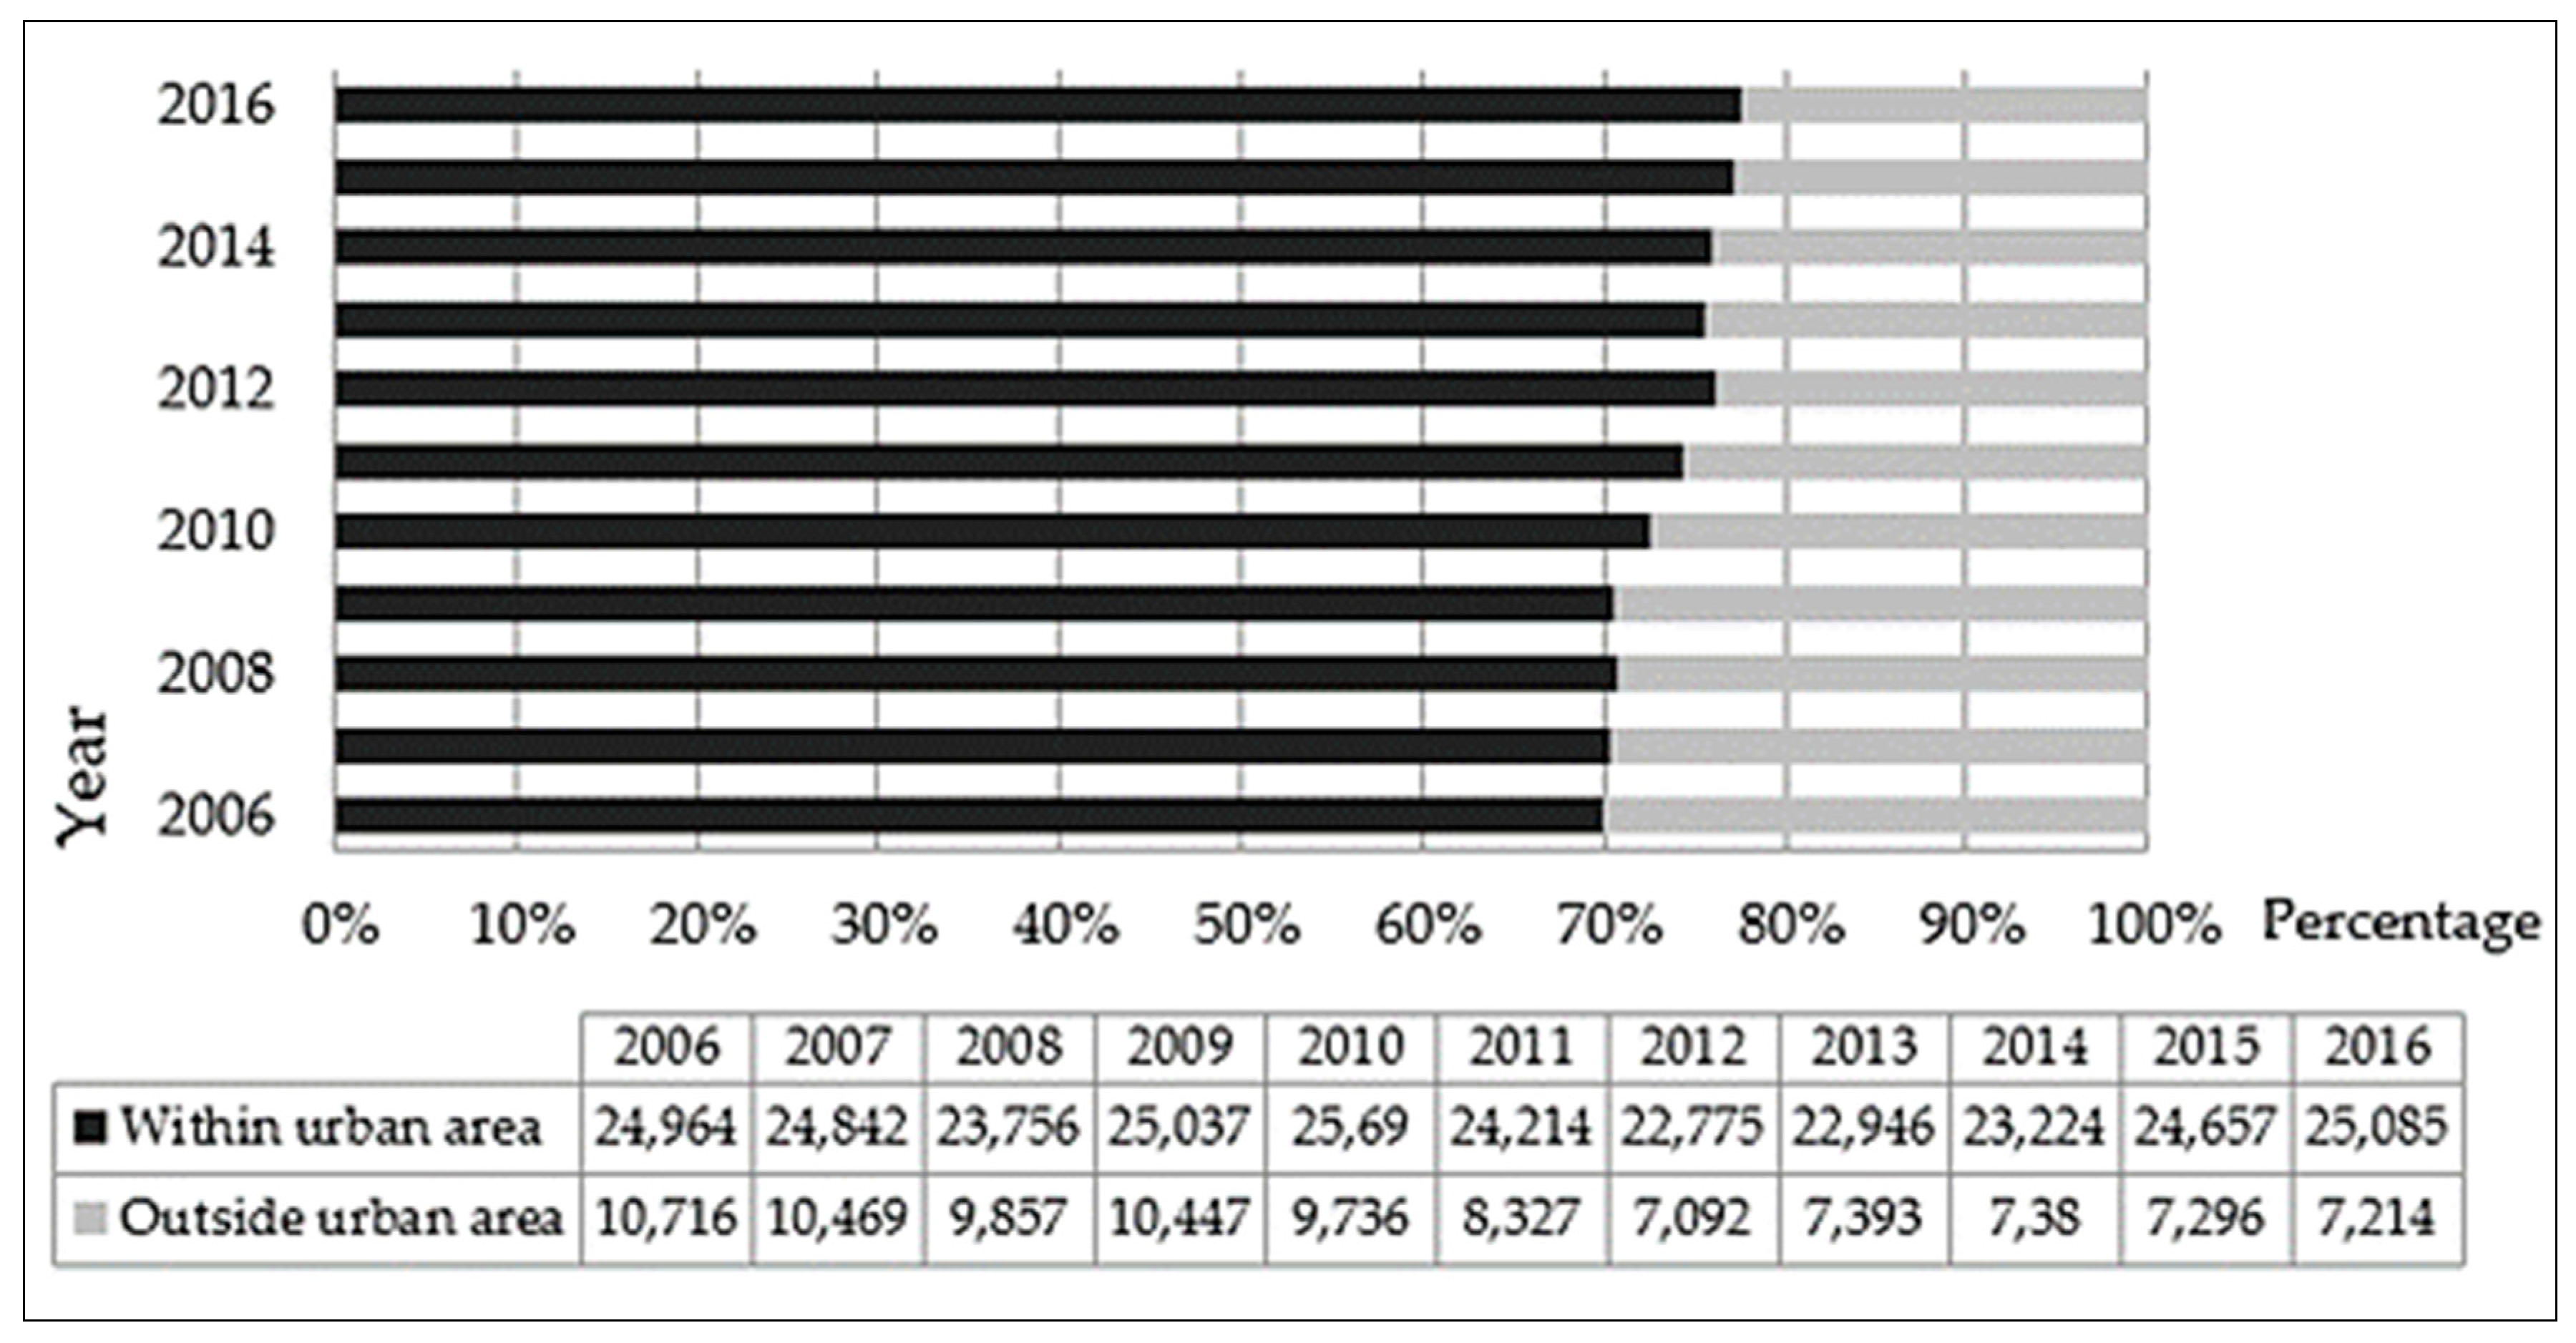
According to the National Authority for Road Safety [2] in Portugal, the number of fatalities in road crashes has been gradually declining, where it has fallen from 969 in 2006 to 563 in 2016. Despite the 42% reduction in deaths in 10 years, there are still a high number of deaths and injuries and a certain lack of progress is visible in the reduction of these numbers in the last three years. When analysing road crashes according to location (Figure 1, [2]), it can be verified that the greatest number of crashes with casualties happened in an urban environment. In 2016, 78% of road crashes with victims, 62% of road crashes with serious injuries and 54% of road crashes with fatalities occurred in urban areas.
It is clear that one of the main causes of road crashes is excessive and inappropriate speed for the road environment [3]. Adding to this evidence, and as an example of speeding consequences, studies have indicated that vulnerable road users survive a collision with a vehicle speeding at 30 km/h but not at 50 km/h or more [3]. This factor is of greater importance in the urban environment because this is where the coexistence between motorized vehicles and the most vulnerable road users, such as pedestrians or cyclists, is more visible. It is therefore vital to intensify measures aimed at reducing traffic speeds. One of the measures that has been increasingly implemented in many countries and especially in the United Kingdom is the use of speed cameras. Also, France has seen a decrease in the number of fatalities and injuries since November 2003 when their speed enforcement programme was implemented, and this drew attention to what could be applicable to other countries [4]. Speed cameras were associated with a 10% reduction in mean speeds and a 62% reduction in the likelihood that a vehicle was travelling more than 10 mph above the speed limit at a camera site [5].
In the United Kingdom and Belgium, studies have analysed the effect of speed cameras at various distances, ranging from 100 m to 2000 m. They reached the conclusion that the effectiveness of the cameras is greater in their proximity and that, in general, for distances greater than 500 m, the results are not significant [6,7]. Speed cameras were found to be most effective in reducing crashes up to 200 m from camera sites [8,9].
Aim of the Study
In Lisbon, in 2007, after an investment of almost three million euros was made by the city council, 19 speed control cameras started operating in different parts of the city, in order to reduce crashes by preventing speeding. This is a goal of the city council to address the significant number of crashes in their urban area, in line with the trend for the country (Figure 1).
The aim of this study is to evaluate the effect on the number of crashes at 19 camera spots in Lisbon and underline the lessons learned.
2. Materials and Methods
2.1. Study Design
The study used a before and after approach to observe changes in crash and casualty numbers following the installation of speed cameras at 19 urban sites.
In order to have an insight about the risk involved, traffic classes were used to characterise each speed camera spot. In a certain sense, they defined the level of risk, admitting that more traffic implies more conflicts and a higher probability of having more crashes. The traffic classes were defined based on information extracted from a traffic assignment consultancy study for the main axes and their neighbourhoods. The classes had the following definition (vehicles are expressed in equivalent passenger cars) per heaviest rush hour: Class 4: >1500 veh/hour; class 3: >1000 ≤ 1500; class 2: >500 ≤ 1000; class 1: ≤500. Purely for informational purposes, the typical daily traffic spread throughout 24 h in one typical week day in Lisbon for the more loaded network segments [10] allowed us to identify the morning and the afternoon peak hour volumes as 2000 and 1800 passenger equivalent vehicles/hour, respectively.
To underline the context of the study in terms of the definition of casualties, the authors have used the Portuguese approach that could be described as follows:
- A fatality is a victim whose death occurs within 30 days from the crash;
- A serious injury is a victim of a crash whose injuries required a period of hospitalization of more than 24 h and who does not die within 30 days from the crash;
- A light injury is victim of a crash that is not considered seriously injured and who does not die within 30 days from the crash.
2.2. Methods
For the purpose of this study, the location of speed control cameras in conjunction with a database of eight years of crashes (2004–2011) was used and connected to a geographic information system (GIS) for greater efficiency [11,12,13].
The database was created from the “Crashes Participation” form [2], completed by the in-charge police branch whenever they are called to the scene of a crash because there are people injured (this is mandatory) or because the parties involved simply fail to reach agreement.
The GIS software, Arcgis 10.0 (Universidade de Lisboa, Lisboa, Portugal), which was already in use by the services of the city council, provided the road network shapefile [13].
It was possible to extract trends from the analysis in the sequence of defining the area of influence for each speed control camera and identifying the crashes in each of these areas before and after their implementation. This area was taken as a radius of 150 m with the centre located at the speed camera. According to previous experiences [14] that have shown 150 m is the distance in urban areas from which drivers are more influenced by the presence of enforcement devices, despite some studies which have indicated that the effective distance in reducing crashes could be up to 200 m from a camera’s location [9]. For one direction of traffic, the consideration of 150 m after the speed camera (we considered, as said, a circular area centred on the speed camera) as well and not just before was important to register once the simple observation of driver behaviour in the vicinity of speed control cameras revealed the possible existence of what some studies [15] have defined as “kangaroo jumps”, where in the approach to the speed control camera, the driver abruptly reduces speed and after passing the camera accelerates back to their initial speed.
2.3. Materials
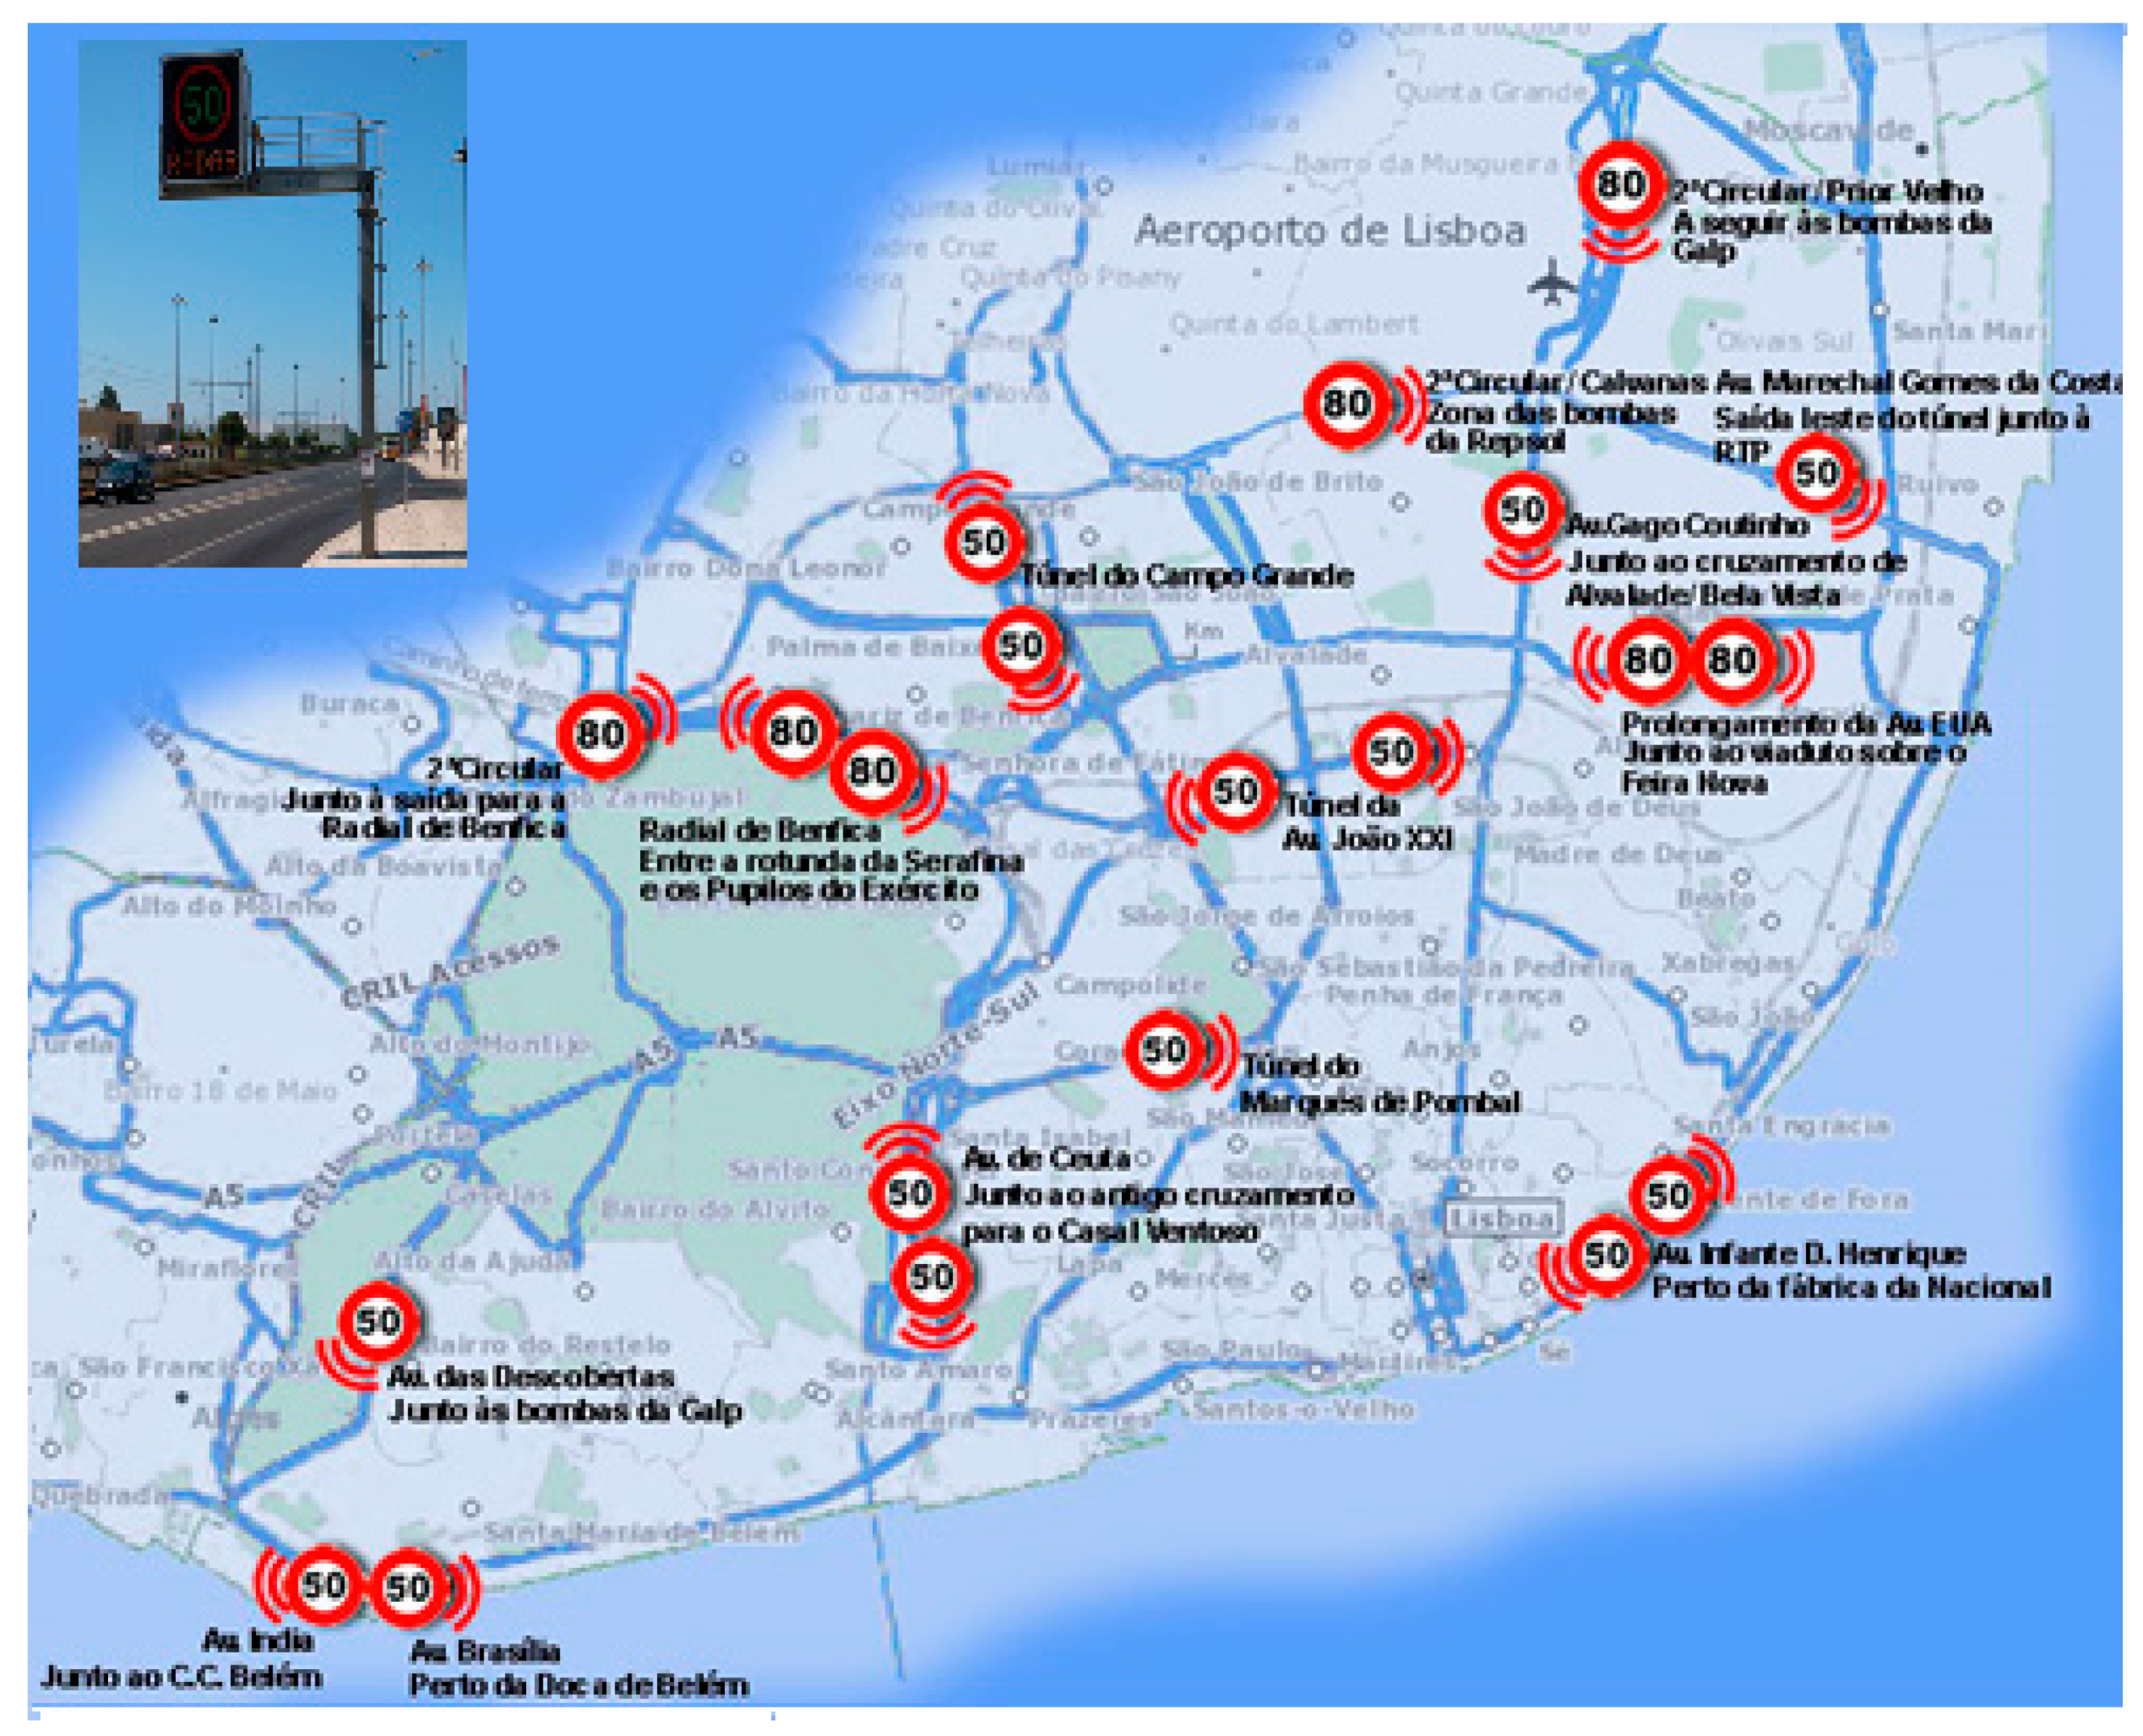
In this study, the definition of the area of influence of the speed control cameras took into account the above-mentioned reasons but also the distance at which the driver sees the “radar” display panel, shown in Figure 2 as an example. In this figure, the locations of the speed cameras considered in the study are also presented.
Crashes were considered when they occurred on the same road and the direction of travel was towards the location of the speed control cameras.
When all the information was gathered it was possible to analyse the crashes, which occurred before and after the installation of the cameras.
It is important to be aware of the implications if a driver is fined for exceeding the speed limit. Portuguese legislation establishes monetary fines with distinctions for cars/motorcycles and drivers in other vehicles (e.g., a car driver is fined with a maximum of 300 € if the speed is exceeded by up to 20 km/h and a maximum of 2500 € if that figure is more than 60 km/h).
2.4. Parameters and Procedure
The before-and-after study (BAS) approach used is based on observations of certain parameters in the periods before and after the implementation of a road safety measure, how they correlate and what type of inferences could be drawn. For the present study, the parameters analysed were as follows:
- The number of crashes with injuries;
- The number of types of injuries: Fatalities, serious injuries and light injuries.
However, the simple direct comparison of the parameter values in the periods “before” and “after” the introduction of a corrective measure may give a false idea due to disregarding the possible contribution of factors other than the measure itself [16,17]. In the analysis of the effectiveness of road safety measures, Elvik [18] says that any BAS should take into account all the confounding factors that may influence the phenomenon under study. The most common confounding factors referred to by Hauer [19] are the regression-to-the-mean, the long-term evolutionary trend of casualties, changes in traffic volume and any changes introduced (physical or in the circulation plan of the zone) during the study period.
The regression-to-the-mean results from the random nature of the crash rate, where values closer to the mean have a tendency to reoccur; that is, it results from a statistical tendency in which, after periods where values far from the mean value have occurred, values closer to that mean will occur again [20]. This is a phenomenon which is particularly important since locations where road safety measures are implemented are places where a significant number of crashes have occurred. In these cases, it is expected that the frequency of crashes will decrease in these locations regardless of whether or not mitigation measures are applied [21]. The dimension of this phenomenon tends to be greater for shorter BAS monitoring periods [14,16].
The long-term trend of the crash rate is also related to some other factors that influence it. These factors could include, for example, the increase of passive safety devices with which cars are equipped, such as, more efficient airbag systems, more efficient braking and stability control systems, anti-collision warnings/systems, systems to increase driver awareness of the dangers of reckless driving (under the effect of alcohol or drugs), among others.
The influence of the traffic volume is another factor that should not be overlooked in the analysis of the crash rate at a given point. It is expected that an increase in traffic volume will increase the risk and very probably the number of fatal crashes [22]. Similarly, a reduction in traffic volume may result in a reduction of crash rates regardless of the road safety measure implemented [16].
Another confounding factor that is referred to is the introduction of any other event occurring simultaneously with the measure that is being analysed. It is understood that an increase in on-site vigilance by police or an increase in traffic signs could have an influence on the crash rate. If the influence of these events is not taken into account, the results of the analysis could be distorted [23].
According to Cardoso and Gomes [24], the influence of confounding factors can be assessed through two methodological approaches: Through the statistical estimation of the effects of these factors or through the use of a control group in which it may be assumed that the effect of these factors will be identical to those occurring at the intervention site.
Statistical estimation could be complicated to construct because it assumes the knowledge of all the exogenous factors’ influences in a way (having enough defining data) that can be mathematically modelled. This stage is very rarely achievable when it comes to road crashes in a certain urban spot.
The choice of a control group that seeks to reflect the effect of all these variables is thus critical to the success of the analysis. According to Elvik [25], the criteria to be considered in the choice of a control group to address the effects of the confounding factors are as follows: Choosing a control group with a number of crashes per year of a few hundred, presenting data from several years in the “before” period, representing a large area and preferably including the sites under study.
Basically, the control group is used to estimate in the “after” period the crash trend in the spots under study as if the safety measures had not been implemented. In fact, this type of methodology is based on two hypotheses: It accepts that from the “before” to the “after” period, exogenous factors underwent a similar effect in both the control group and the intervention areas. The methodology also accepts that any change provoked by exogenous factors were identical in the control group and in the intervention areas [21].
The approach of using a control group was that which was used for the present analysis. The crash data from the Lisbon municipality as a whole was chosen to compose the control group. This was done because it is a fact that the majority of crashes (more than 60% for the city of Lisbon [13]) took place in the influence zones of intersections, and so the type of confounding factors can be taken to be similar to those for the spots under study. Since the zones with speed cameras under analysis were located in the municipality of Lisbon, it was decided to remove figures from the municipality’s data of crashes and casualties, in order to exclude side effects of the measure under study in this dataset. Applying the same evolutionary trend of the crash rate in the city of Lisbon to the 19 sites, it is possible to assume the evolution of the crash rate in these locations as if the speed control cameras had not been installed. This will be illustrated in Section 4.
3. Results
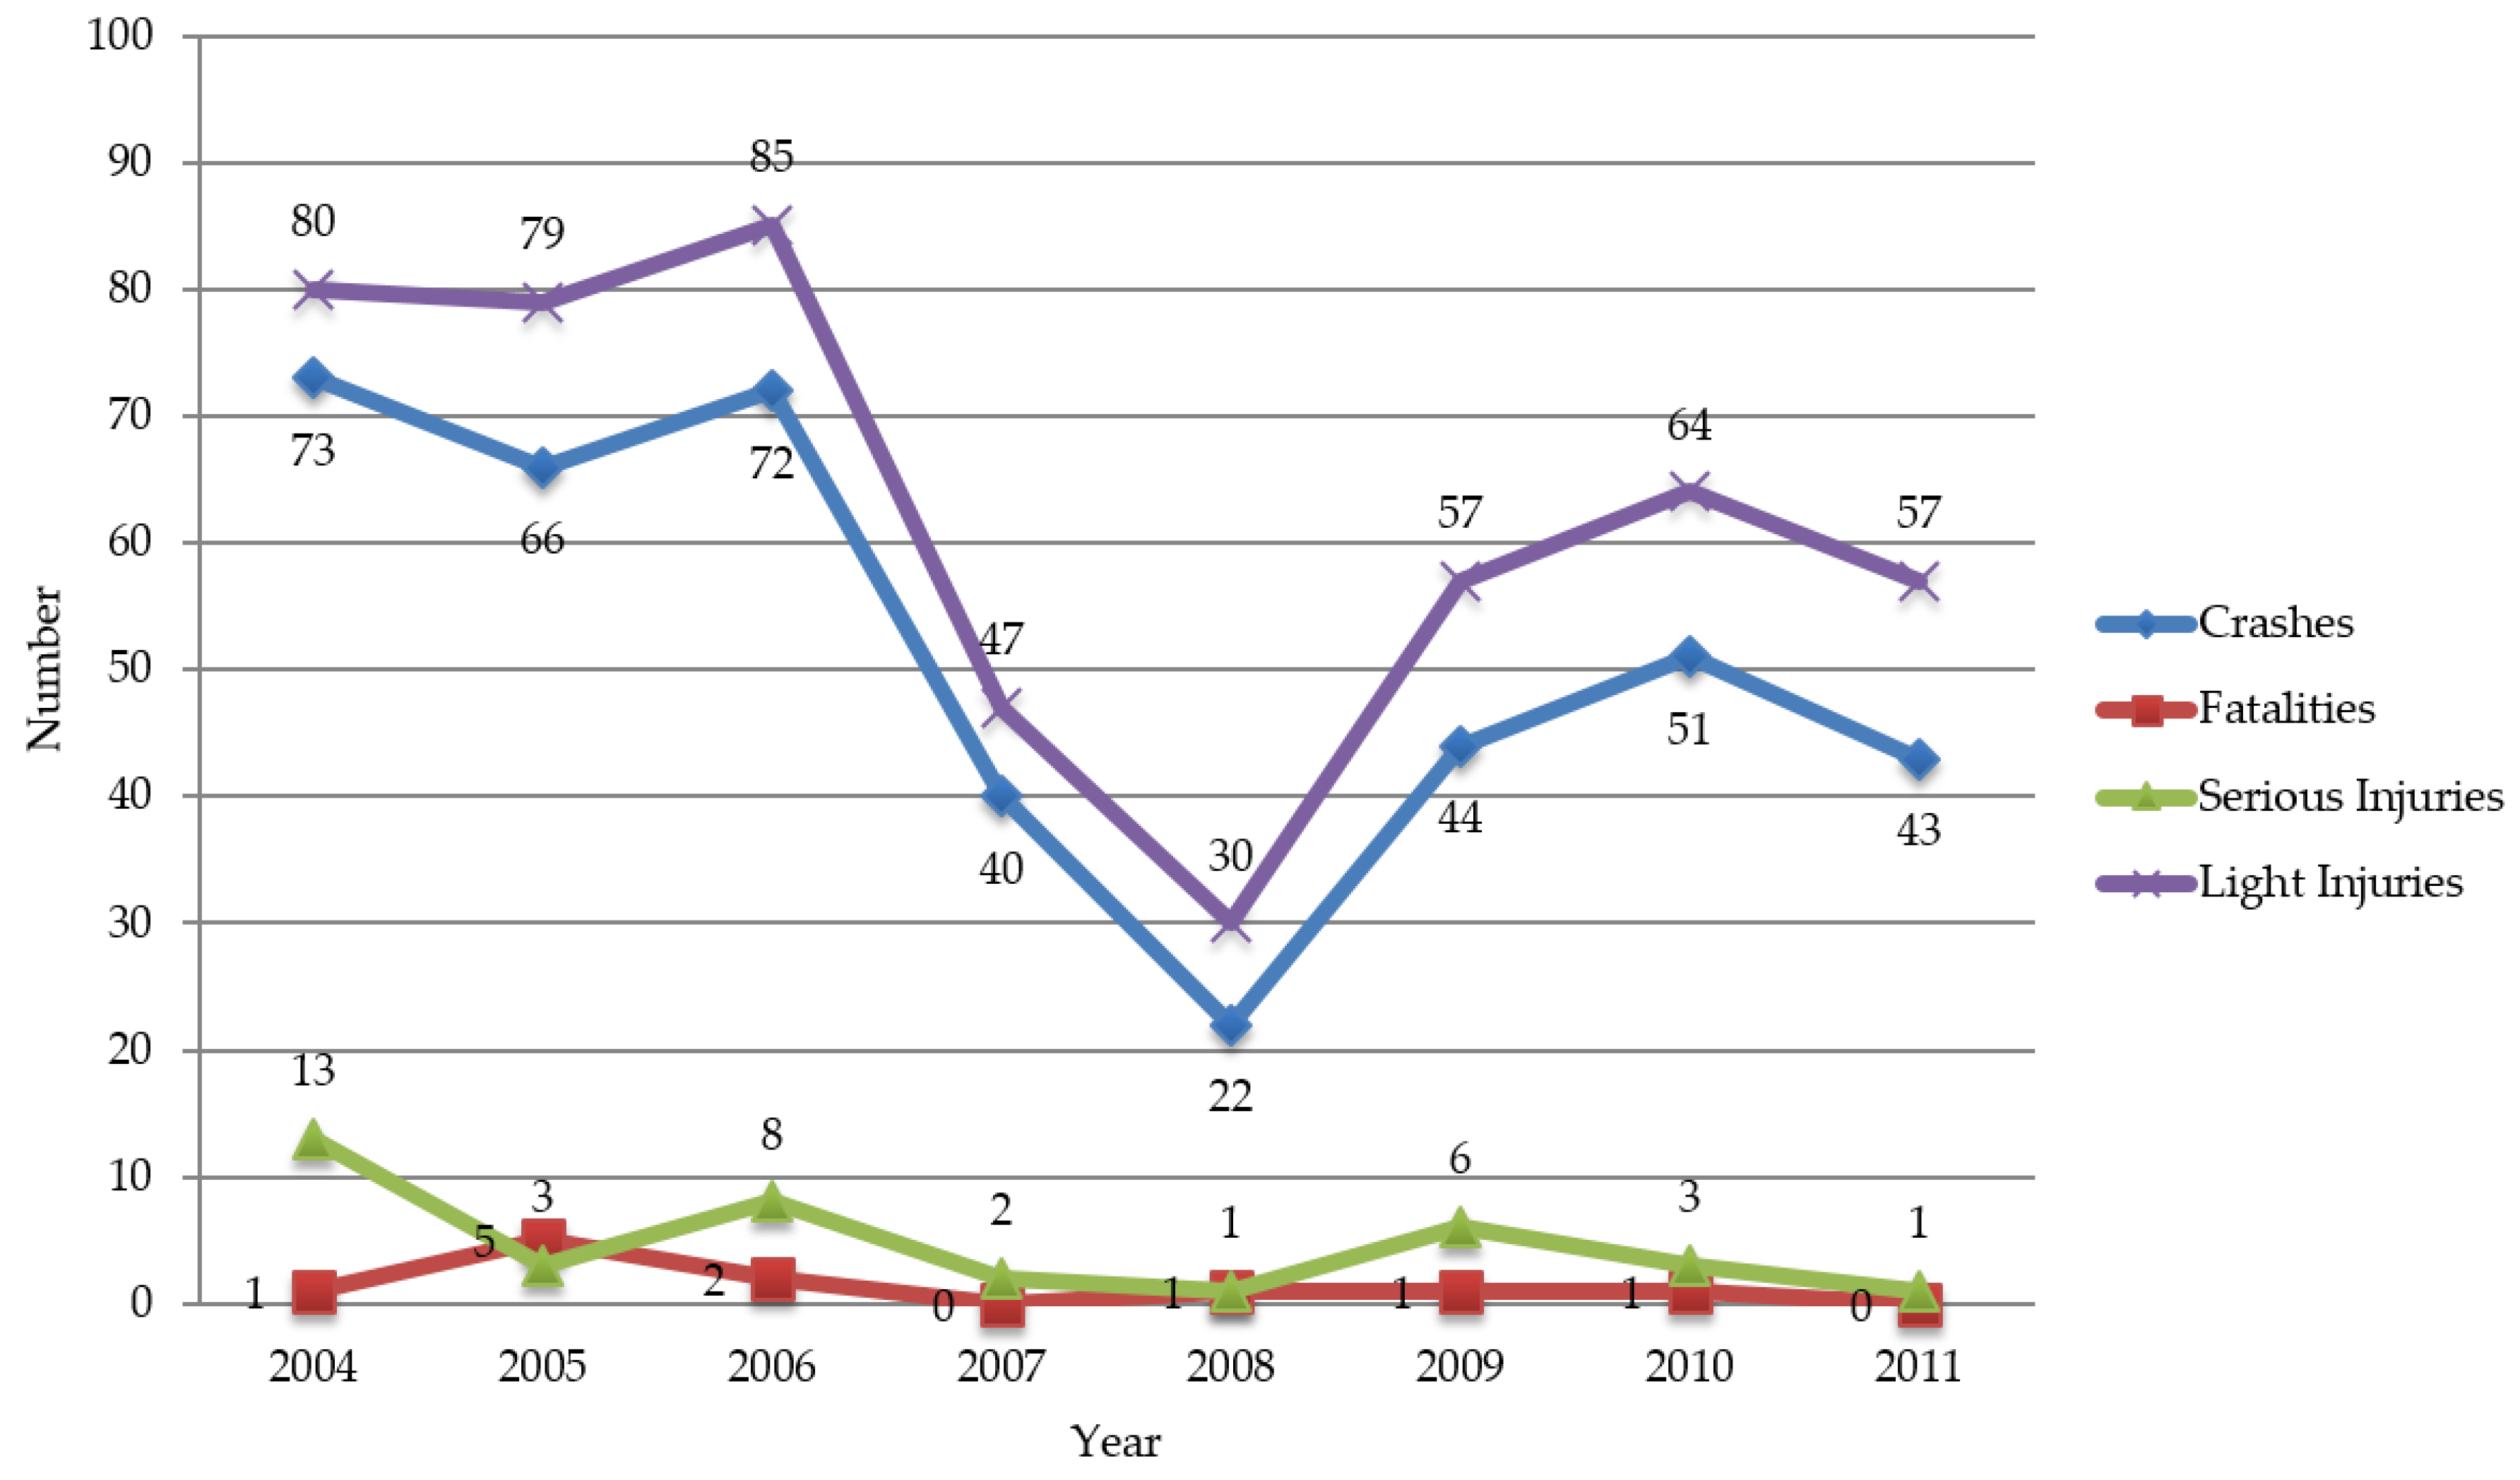
Since crashes with casualties are, fortunately, a rare phenomenon, the size of the available samples was small for each camera spot analysed. Therefore, no robust statistical explanation or crash occurrence modelling is usable for each site. Because of this, it was decided to analyse the results of the number of crashes together for the 19 speed control cameras, as shown in Figure 3.
As mentioned earlier, the starting date of infringement recording was 16 July 2007. Hence, for the analysis in question, 2007 was considered as year zero. It was accepted that this was the year during which drivers were expected to adapt their behaviour to this measure. The year 2006 is considered as the last year of the “before” period and 2008 as the first year in the period “after” the implementation of the speed cameras.
Looking at the graph in Figure 3, a reduction in the number of traffic crashes is noticeable after the installation of the speed control cameras. In order to assess the rate of reduction in all the 19 speed control sites, the variation in all crash indicators for each location was calculated. The selected indicators were as follows: Crashes with casualties, number of fatalities, serious injuries and light injuries in the three years before and after 2007. The findings are presented in Table 1.
In Table 1, the traffic classes assigned to each spot can also be seen. The data related to the control group mentioned will be shown in the next section with the intention of supporting the estimates for the situation with the speed cameras, focusing the comparison on the figures recorded in these spots.
4. Discussion
For the number of crashes with casualties, there were three spots where these increased (on average 21%) and one spot where there were no changes. For the 15 spots (±80% of total) where the number of crashes decreased, the average figure was 54% with a standard deviation of 27%. There were five spots with a total (100%) reduction of “fatalities”, seven spots with a total reduction of “serious injuries” (and one spot where this figure increased to double), and for the number of “light injuries” there were two spots where they increased (on average 22%), three spots where there were no changes, and 15 spots (75% of total) where the number of “light injuries” decreased, with the average figure being 45% with a standard deviation of 27%.
A reduction of the various crash indicators was achieved on average. Another important feature is the high value obtained for the standard deviation. These results reflect an important dispersion in the several sites analysed. It was observed that in most cases there was a reduction in the number of fatalities. However, in some places, there was also an increase in the number of fatalities in the period analysed after the installation of the speed control cameras. In this case, we refer to two locations with one fatality in the period after and none in the period before. As this is such a small number this should be classified as a rare phenomenon, which is possibly due to several rarely repeatable circumstances. Indeed, the two spots have an opposite amount of traffic (classes 1 and 4), and so a risk, in principle, which is also different, but the fact is that for such a rare phenomenon, the circumstances of the crash with the fatality could be similar for both locations.
Nevertheless, as already mentioned in this BAS, the methodology employed to analyse the effect of confounding factors was the use of a control group.
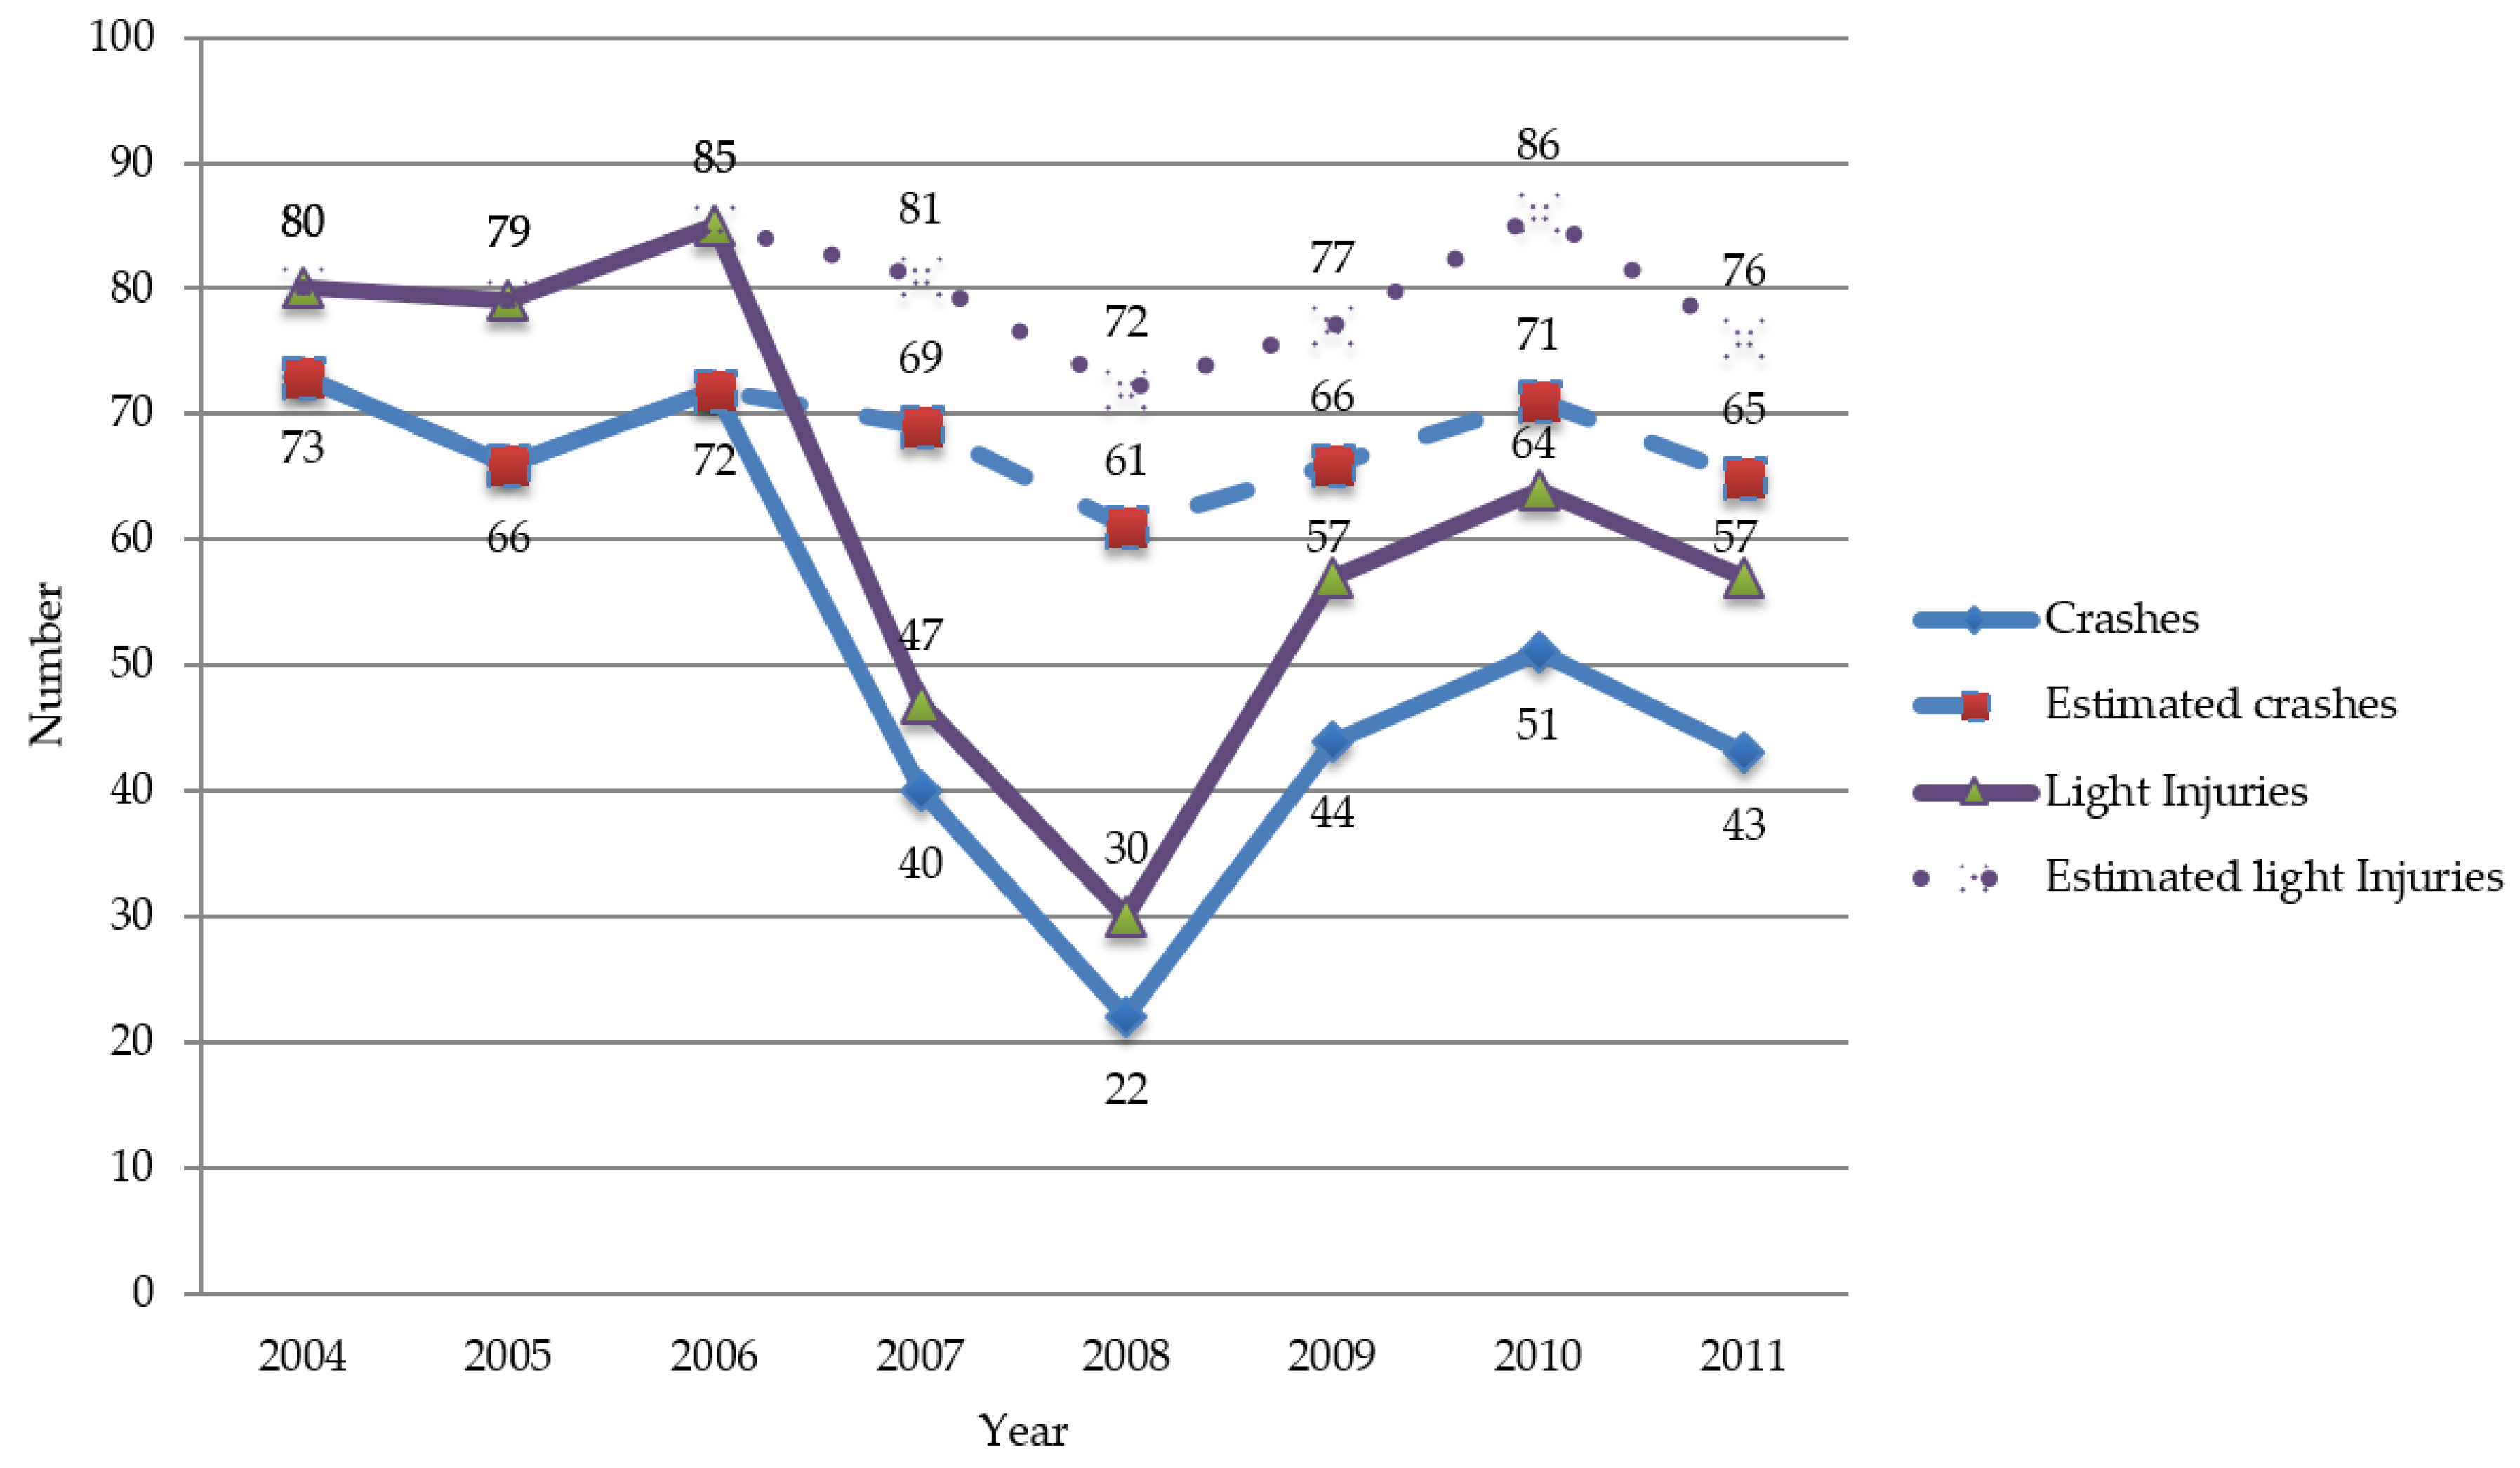
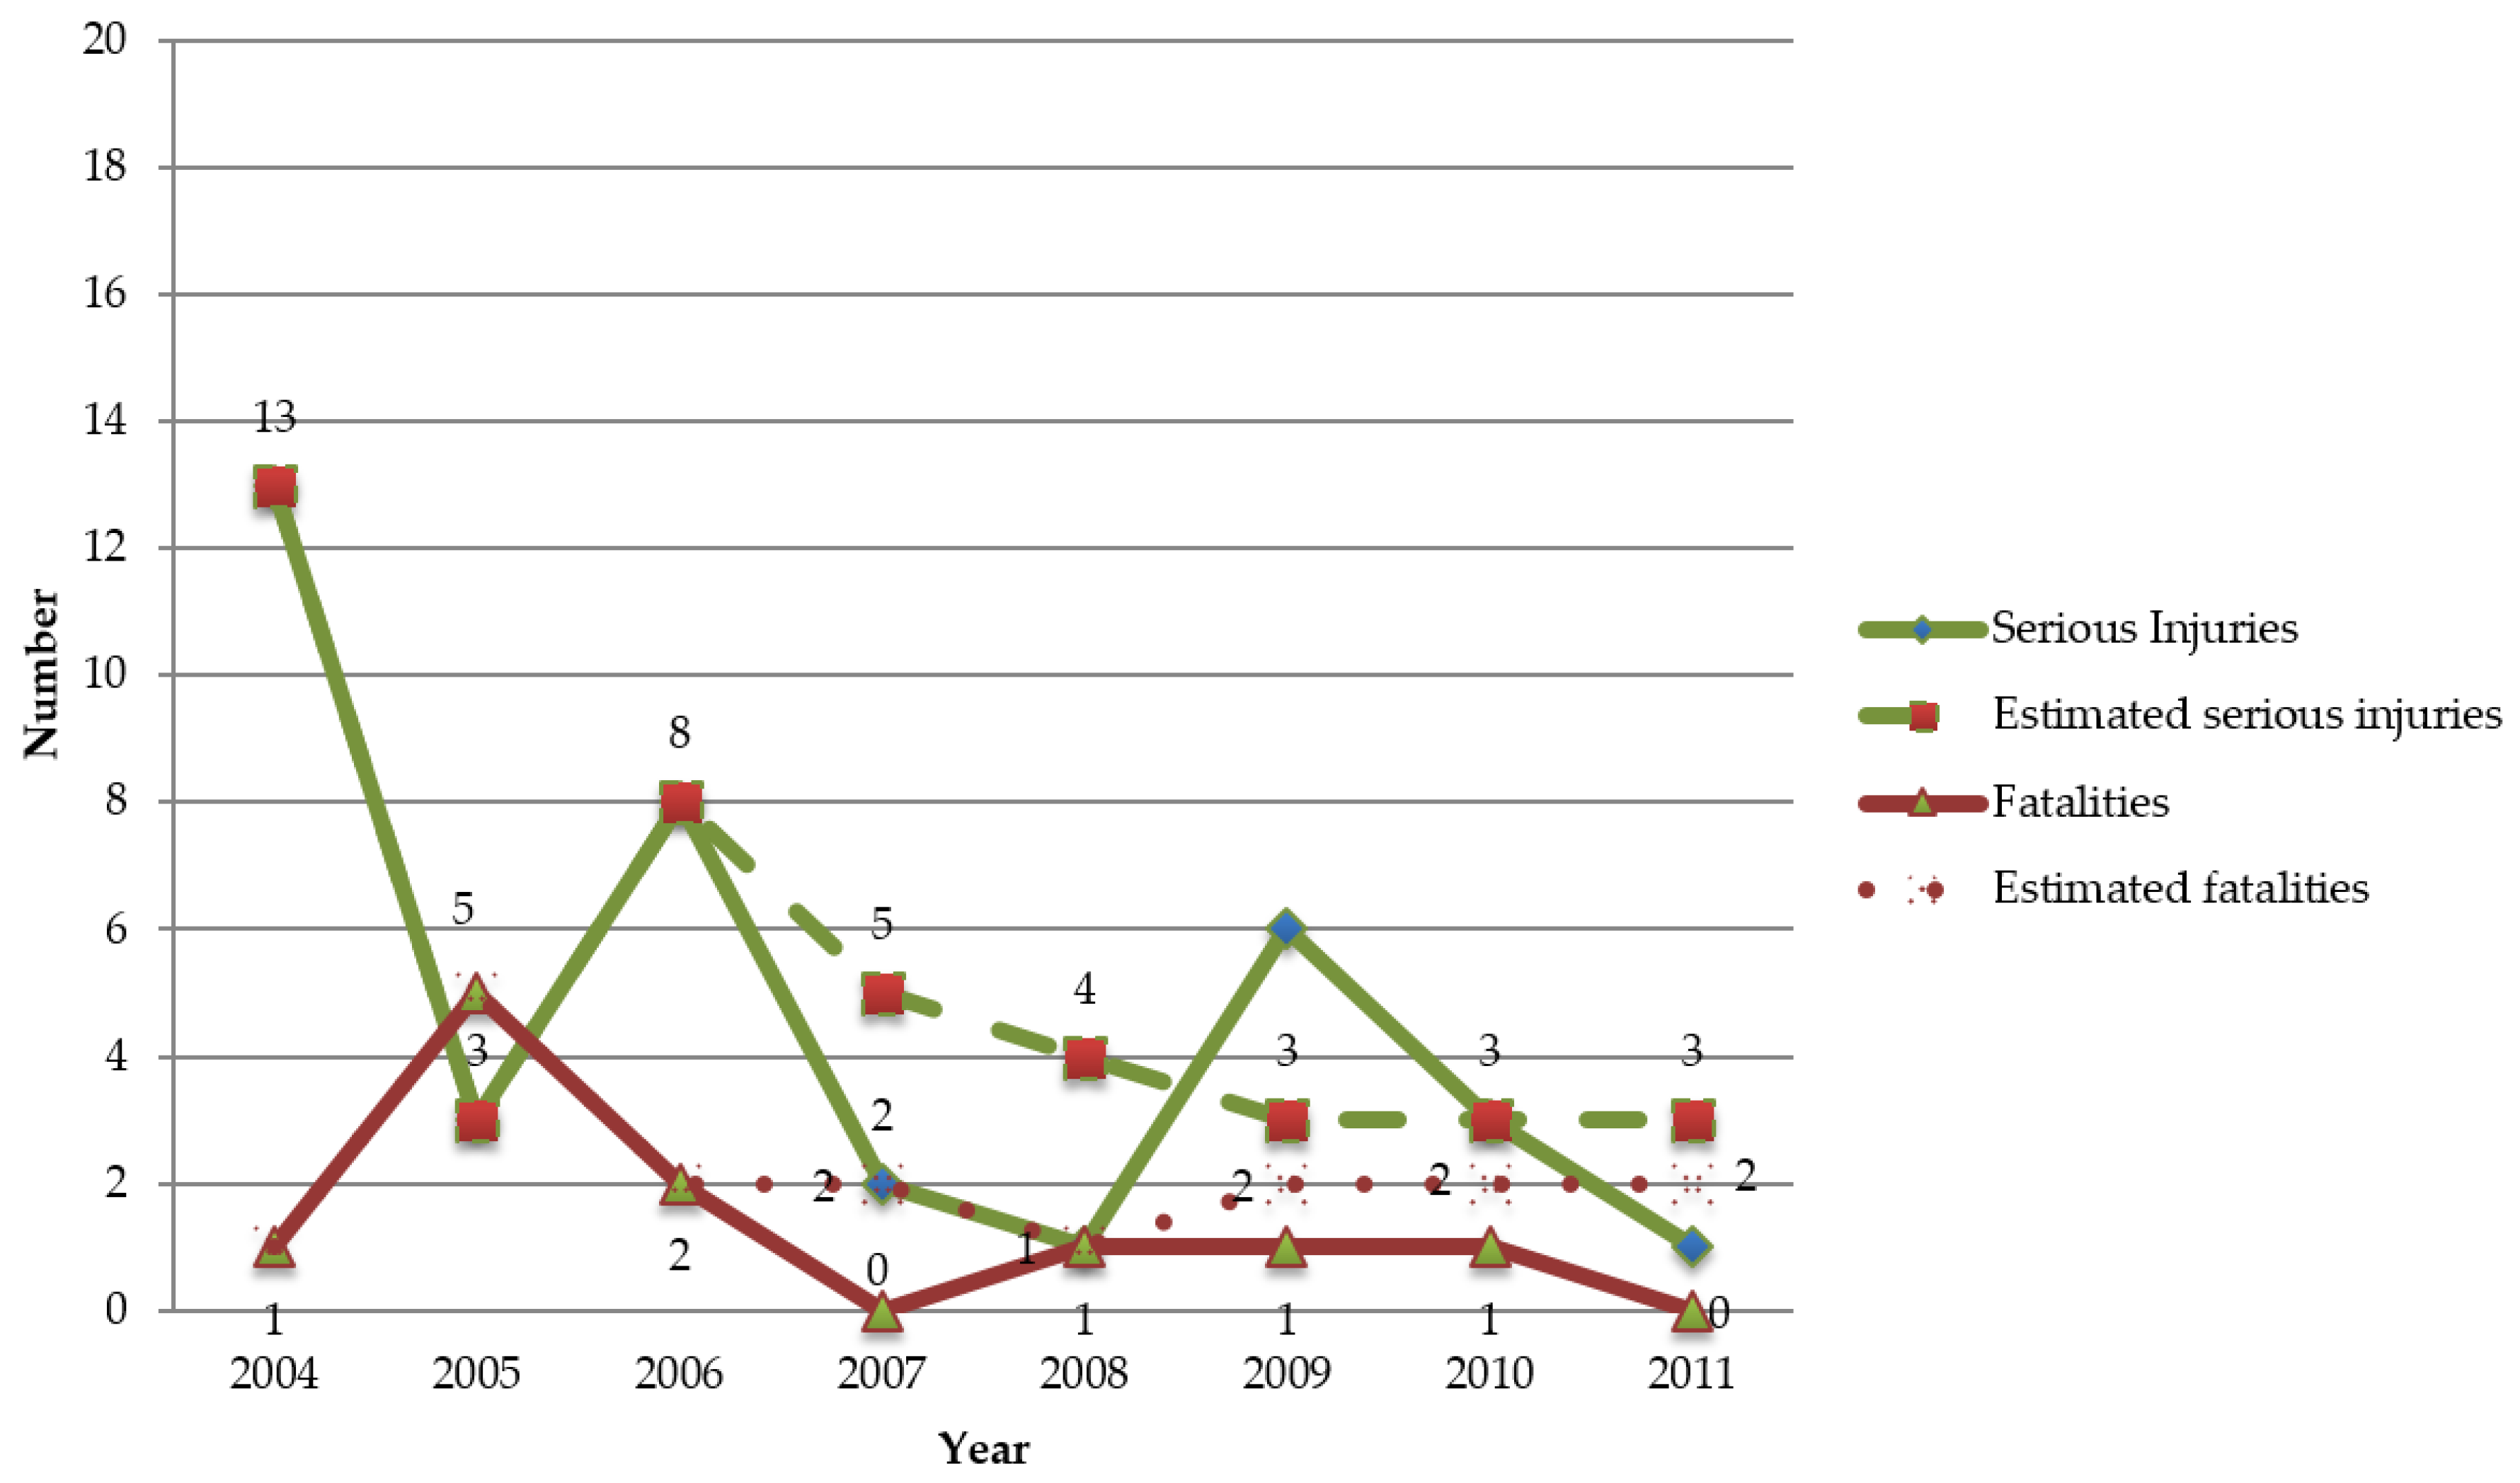
Following the criteria presented by Elvik [18] and mentioned earlier, the city of Lisbon was chosen as the control group. In Figure 4 and Figure 5, it is possible to see the estimated trend as if there were no speed cameras (following the general trend for Lisbon data) and the figures with speed cameras (continuous lines). Simply as an example, and to clarify the interpretation of Figure 4 and Figure 5, the crash number in 2006 was 72 (on average for the 19 spots with speed cameras). In 2007, after the installation of the speed cameras, the number decreases to 40 from 72. If the trend for the city of Lisbon is followed, the number should only decrease to 69 from 72.
In relation to crashes with casualties, the reduction compared to the estimated values was 42% less in 2007 and 64% less in 2008. After 2008, the number of crashes with casualties started to rise again and approach the estimated values; although, there was still a reduction of approximately 32%. Regarding the number of light injuries, the reduction was also visible, reaching 42% as early in 2007 and a reduction of 58% in 2008. As for the year 2009, the difference between the estimated and verified values decreased to nearly 26%, remaining almost constant until 2011. In respect of the number of deaths and serious injuries, since the size of the sample is reduced, the analysis is always more limited, implying a greater degree of uncertainty. The number of deaths recorded is always less than the estimated number, as expected. The number of actual serious injuries was also lower than the estimated number except in the year 2009, where six serious injuries occurred when the estimates using the control group only indicated three serious injuries.
This analysis indicates another situation, which is the increase in crashes/casualties after 2008. Although the trend is similar (with similar global figures) in relation to the control group for the period of 2009 to 2011, between 2008 and 2009, the increase in speed camera spots was 100% for crashes against a figure of less than 5% for the control group. This was the year (2008/2009) for which it is assumed that the reasons for that difference were due to familiarization with the system, difficulty in sanctioning the violators (police information) and due to equipment malfunction that was evident to the users and not repaired in a timely manner. After 2008/2009 (the period 2009–2011), it is expected that the estimate (control group) and real (on spot) trends (and total figures) will become similar.
This study’s results are consistent with past studies and research in showing a decrease in unsafe behaviour and crashes in the vicinity of fixed speed cameras after installation. One study on fixed camera speed enforcement on urban road types indicated a 28% reduction for all crashes [25], while another study indicated a 22% reduction for personal injury collisions in the UK [26], and the present study indicates a 54% reduction (average figure for 15 of the 19 camera spots) for crashes with causalities in the urban area of Lisbon.
The feasibility of the use of 19 speed cameras in an urban environment (e.g., Lisbon) to mitigate crashes indicates that speed cameras together with appropriate sanctions for violators are an effective measure, as observed in studies elsewhere (also for two-wheeled vehicles [27], not only four-wheeled vehicles [23]). This study also reveals that after the first two years, the number of crashes rose again. This situation happened at a period when most of the cameras were often vandalized and remained so, and the difficulty for the authorities to deal with the administrative sanctioning procedures for speeding drivers was made public.
Finally, in times where authorities have to deal with financial constraints, choosing where to intervene is essential in achieving the goal of reducing road crashes. In some of the present camera sites in Lisbon, there was no history of crashes prior to the installation of cameras. These situations led to public disbelief and opposition to this type of operation, perhaps inducing camera vandalism. Also, the methodology used in this study, which was essentially analysing crashes and the associated police reports to extract the information about the way they occurred, namely if they were facilitated by speeding conditions, and using a GIS to identify accumulation spots, may be a very interesting approach to defining the right locations where the speed control cameras could certainly be an option of major significance as a road crash mitigation measure.
5. Limitations
It should be stressed that despite the carefully applied data treatment, this study relied on the accuracy of crash and casualty coding by the police. Nevertheless, it should be stated that this registration has improved since 2005 with the implementation of more effective procedures [12].
The fact that a control group was used for comparison and a specific study was not carried out to analyse if the confounding factors could be considered as aligned with the object group is a fact that could introduce some lack of confidence about the final results. Nevertheless, as underlined, the majority of crashes (more than 60% for the city of Lisbon [13]) took place in the influence zones of intersections, and so it is believed that the analysis is fairly close to reality when the types of confounding factors were taken to be similar between the control group and the spots under analysis.
6. Conclusions
The analysis of all the speed control spots acknowledges the effectiveness of the cameras as a mitigating measure in road crashes, with the results indicating a 54% reduction in the number of crashes with casualties. This was effective over the next 2/3 years after installation, and it is believed that with the right maintenance and the right enforcement by the authorities, the measure might be very effective to promote crash reduction. However, it should be pointed out that this inference was made by the use of a BAS of the crashes at 19 fixed points with different physical characteristics, also assuming that the effect of the confounding factors were identical to the selected control group, which was taken from the whole city to which the spots belonged. On the other hand, the available database does not allow for any meaningful statistical modelling of the effects of these confounding factors, namely the consideration of the “return to the mean” or the “risk induced by traffic volume variation”.
Despite all the constraints, it should be underlined again that this measure (speed control cameras) is an effective one for crash reduction but, as with many other measures, needs to be assessed permanently, both in terms of preserving their function and in reacting to infringing drivers and maintaining their restrictions, namely by fining them.
Author Contributions
Conceptualization, all the authors; Methodology, all the authors; Validation, J.S. and R.M.; Formal analysis, J.S.; Data curation, J.S.; Writing—original draft preparation, all the authors; Writing—review and editing, L.P.-S. and R.M.
Funding
This research received no external funding.
Conflicts of Interest
The authors declare no conflict of interest.
References
- World Health Organization. Global Status Report on Road Safety 2015; WHO Library Cataloguing-in-Publication Data; World Health Organization: Geneva, Switzerland, 2015; ISBN 9789241565066. [Google Scholar]
- Autoridade Nacional Seguranca Rodoviaria. Relatórios de Sinistralidade (Road Crashes Reports). Observatório de Segurança Rodoviária, 2017. Available online: http://www.ansr.pt/ (accessed on 1 December 2017). (In Portuguese).
- Global Road Safety Partnership. Speed Management: A Road Safety Manual for Decision-Makers and Practitioners; Global Road Safety Partnership: Geneva, Switzerland, 2008; ISBN 978-2-940395-04-0. [Google Scholar]
- Carnis, L.; Blais, E. An assessment of the safety effects of the French speed camera program. Accid. Anal. Prev. 2013, 51, 301–309. [Google Scholar] [CrossRef]
- Hu, W.; McCartt, A.T. Effects of automated speed enforcement in Montgomery County, Maryland, on vehicle speeds, public opinion, and crashes. Traffic Inj. Prev. 2016, 17 (Suppl. 1), 53–58. [Google Scholar] [CrossRef]
- Christie, S.M.; Lyons, R.A.; Dunstan, F.D.; Jones, S.J. Are mobile speed cameras effective? A controlled before and after study. Inj. Prev. 2003, 9, 297–301. [Google Scholar] [CrossRef]
- de Pauw, E.; Daniels, S.; Brijs, T.; Hermans, E.; Wets, G. An evaluations of the traffic safety effect of fixed speed cameras. Saf. Sci. 2014, 62, 168–174. [Google Scholar] [CrossRef]
- Polders, E.; Cornu, J.; Ceunynck, T.; Daniels, S.; Brijs, K.; Brijs, T.; Hermans, E.; Wets, G. Drivers’ behavioral responses to combined speed and red light cameras. Accid. Anal. Prev. 2015, 81, 153–166. [Google Scholar] [CrossRef] [PubMed]
- Li, H.; Graham, D.; Majumdar, A. The impacts of speed cameras on road accidents: An application of propensity score matching methods. Accid. Anal. Prev. 2013, 60, 148–157. [Google Scholar] [CrossRef] [PubMed]
- Merkebe, D. Combining Datasets from Multiple Sources for Urban and Transportation Planning: Emphasis on Cellular Network Data. Ph.D. Thesis, University of Coimbra, Coimbra, Portugal, 2014. [Google Scholar] [CrossRef]
- Carvalheira, C. Metodologia de intervenção na infraestrutura para mitigação de acidentes rodoviários em meio urbano (Methodology to mitigate urban road accidents by interventation on the infrastructure). Ph.D. Thesis, University of Coimbra, Coimbra, Portugal, 2010. (In Portuguese). [Google Scholar]
- Carvalheira, A.; Picado-Santos, L. A GIS tool for Urban Road Safety Analysis. In Proceedings of the European Transport Conference, Glasgow, UK, 11–13 October 2011; pp. 711–720. [Google Scholar]
- Carvalheira, C.; Picado-Santos, L. Urban Road Safety—Assessment of a Road Safety Measures Tool. In Proceedings of the 3rd International Conference on Road Safety and Simulation, Indianapolis, IN, USA, 14–16 September 2011; pp. 711–720. [Google Scholar]
- Carvalheira, A.; Picado-Santos, L. A Road Safety Measures Tool Applied for Urban Road Safety Management. In Proceedings of the European Pavement and Asset Management, Malmo, Sweden, 5–7 September 2012. [Google Scholar]
- Høye, A. Speed Cameras, sections control, and kangaroo jumps—A meta-analysis. Accid. Anal. Prev. 2014, 73, 200–208. [Google Scholar] [CrossRef] [PubMed]
- Carvalheira, C.; Picado-Santos, L.; Gomes, S.; Cardoso, J. Road Safety Management in Lisbon: Development of efficient corrective safety measures. In Proceedings of the 3rd European Pavement and Asset Management Conference, Coimbra, Portugal, 7–9 July 2008. [Google Scholar]
- Carvalheira, C.; Picado-Santos, L. Diagnostic of crashes in accumulation zones and aid-decision about countermeasures. In Proceedings of the Actas do XVI Congresso Ibero-Latinoamericano do Asfalto, Rio de Janeiro, Brasil, 20–25 November 2011; pp. 300–310. (In Portuguese). [Google Scholar]
- Elvik, R. The importance of confounding in observational before-and-after studies of road safety measures. Accid. Anal. Prev. 2002, 34, 631–635. [Google Scholar] [CrossRef]
- Hauer, E. Observational Before-After Studies in Road Safety. Estimating the Effect of Highway and Traffic Engineering Measures on Road Safety; Emerald Group Publishing Limited: Bingley, UK, 1997; ISBN 978-0-08-043053-9. [Google Scholar]
- Wrigth, C.; Boyle, A. Road Accident Causation and Engineering Treatment; a review of some current issues. Traffic Eng. Control 1987, 28, 475–483. [Google Scholar]
- Seco, A.J.; Ferreira, S.; Silva, A.; Costa, A. Manual of Accessibility Planning and of Traffic Management: Road Safety; Comissão de Coordenação e Desenvolvimento Regional do Norte: Porto, Portugal, 2008; Volume 11. (In Portuguese) [Google Scholar]
- Fridstrøm, L. Econometric Models of Road Use, Accidents, and Road Investment Decisions; Report 457; Institute of Transport Economics: Oslo, Norway, 1999; Volume II. [Google Scholar]
- Wilmots, B.; Hermans, E.; Brijs, T.; Wets, G. Evaluating Speed Enforcement Field Set-Ups Used by Regional Police in Belgium: An Analysis of Speed Outcome Indicators. Safety 2017, 3, 1. [Google Scholar] [CrossRef]
- Cardoso, J.; Gomes, E.S. Impact Evaluation on Crash Rate of the Implementation of Countermeasures in a Section of EN6; Relatório 217/05-NPTS, LNEC: Lisboa, Portugal, 2005. (In Portuguese) [Google Scholar]
- Elvik, R.; Vaa, T. The Handbook of Road Safety Measures; Elsevier Science: Amsterdam, NY, USA, 2004. [Google Scholar]
- Gains, A.; Heydecker, B.; Shrewsbury, J.; Robertson, S. The National Safety Camera Programme—Three-Year Evaluation Report; PA Consulting Group: London, UK, 2004. [Google Scholar]
- Šraml, M.; Tollazzi, T.; Renčelj, M. Traffic safety analysis of two-wheelers (PTWs) in Slovenia. Accid. Anal. Prev. 2012, 49, 36–43. [Google Scholar] [CrossRef] [PubMed]
Figure 1.
Percentage of crashes with casualties by location between 2006 and 2016 in Portugal [2].
Figure 1.
Percentage of crashes with casualties by location between 2006 and 2016 in Portugal [2].

Figure 2.
Speed control system locations in Lisbon and example of a speed warning panel (Av. da Índia).
Figure 2.
Speed control system locations in Lisbon and example of a speed warning panel (Av. da Índia).

Figure 3.
Road crashes and casualties in the area of influence of all 19 speed cameras in the study.
Figure 3.
Road crashes and casualties in the area of influence of all 19 speed cameras in the study.

Figure 4.
Comparison of crashes and light injuries with the estimated values of the control group (I).
Figure 4.
Comparison of crashes and light injuries with the estimated values of the control group (I).

Figure 5.
Comparison of crashes/casualties with the estimated values of the control group (II).


Table 1.
Variation of crash indicators in the periods before and after the installation of the speed control cameras.
Table 1.
Variation of crash indicators in the periods before and after the installation of the speed control cameras.
| Location of Speed Camera | Time Period | Crashes with Causalities | Fatalities | Serious Injuries | Light Injuries | Traffic Classes |
|---|---|---|---|---|---|---|
| 2004 to 2006 | 19 | 1 | 2 | 21 | 3 | |
| Av. de Ceuta 1 | 2008 to 2010 | 5 | 0 | 2 | 4 | |
| Variation | −74% | −100% | 0% | −81% | ||
| 2004 to 2006 | 12 | 0 | 4 | 10 | 3 | |
| Av. de Ceuta 2 | 2008 to 2010 | 4 | 0 | 0 | 4 | |
| Variation | −67% | 0% | −100% | −60% | ||
| Av. Gen. | 2004 to 2006 | 1 | 0 | 0 | 1 | 3 |
| Correia Barreto 1 | 2008 to 2010 | 0 | 0 | 0 | 0 | |
| Variation | −100% | 0% | 0% | −100% | ||
| 2004 to 2006 | 24 | 3 | 5 | 23 | 4 | |
| Campo Grande | 2008 to 2010 | 1 | 0 | 0 | 5 | |
| Variation | −96% | −100% | −100% | −78% | ||
| Av. General | 2004 to 2006 | 10 | 0 | 0 | 12 | 4 |
| Norton de Matos | 2008 to 2010 | 12 | 0 | 0 | 15 | |
| (“2ª Circular”) | Variation | 20% | 0% | 0% | 25% | |
| Av. Marechal | 2004 to 2006 | 8 | 0 | 1 | 10 | 4 |
| Craveiro Lopes | 2008 to 2010 | 6 | 0 | 0 | 9 | |
| (“2ª Circular”) | Variation | −25% | 0% | −100% | −10% | |
| Av. Marechal | 2004 to 2006 | 13 | 0 | 0 | 17 | 4 |
| Craveiro Lopes | 2008 to 2010 | 8 | 1 | 0 | 10 | |
| (“2ª Circular”) | Variation | −38% | N/A | 0% | −41% | |
| 2004 to 2006 | 3 | 0 | 0 | 3 | 1 | |
| Av. da Índia | 2008 to 2010 | 4 | 0 | 0 | 4 | |
| Variation | 33% | 0% | 0% | 33% | ||
| 2004to2006 | 15 | 0 | 1 | 22 | 1 | |
| Av. de Brasília | 2008to2010 | 12 | 1 | 3 | 16 | |
| Variation | −20% | N/A | 200% | −27% | ||
| Av. Afonso | 2004 to 2006 | 8 | 0 | 3 | 6 | 3 |
| Costa | 2008 to 2010 | 2 | 0 | 0 | 3 | |
| Variation | −75% | 0% | −100% | −50% | ||
| Av. da | 2004 to 2006 | 10 | 0 | 3 | 9 | 4 |
| República | 2008 to 2010 | 5 | 0 | 0 | 8 | |
| Variation | −50% | 0% | −100% | −11% | ||
| 2004 to 2006 | 22 | 1 | 2 | 26 | 3 | |
| Av. João XXI | 2008 to 2010 | 19 | 0 | 0 | 26 | |
| Variation | −14% | −100% | −100% | 0% | ||
| Av. Marechal | 2004 to 2006 | 9 | 1 | 0 | 12 | 2 |
| Gomes da Costa | 2008 to 2010 | 10 | 1 | 4 | 9 | |
| Variation | 11% | 0% | N/A | −25% | ||
| Av. Marechal | 2004 to 2006 | 7 | 1 | 0 | 6 | 1 |
| António de Spínola | 2008 to 2010 | 2 | 0 | 0 | 6 | |
| Variation | −71% | −100% | 0% | 0% | ||
| Av. Marechal | 2004 to 2006 | 4 | 0 | 0 | 6 | 1 |
| António de Spínola | 2008 to 2010 | 4 | 0 | 0 | 5 | |
| Variation | 0% | 0% | 0% | −17% | ||
| Av. Infante | 2004 to 2006 | 18 | 0 | 2 | 28 | 1 |
| Dom Henrique | 2008 to 2010 | 4 | 0 | 0 | 7 | |
| Variation | −78% | 0% | −100% | −75% | ||
| Av. Infante | 2004 to 2006 | 6 | 0 | 0 | 8 | 1 |
| Dom Henrique | 2008 to 2010 | 4 | 0 | 0 | 4 | |
| Variation | −33% | 0% | 0% | −50% | ||
| Av. Almirante | 2004 to 2006 | 16 | 0 | 1 | 19 | 4 |
| Gago Coutinho | 2008 to 2010 | 11 | 0 | 1 | 12 | |
| Variation | −31% | 0% | 0% | −37% | ||
| Av. das | 2004 to 2006 | 6 | 1 | 0 | 5 | 3 |
| Descobertas | 2008 to 2010 | 4 | 0 | 0 | 4 | |
| Variation | −33% | −100% | 0% | −20% |
© 2019 by the authors. Licensee MDPI, Basel, Switzerland. This article is an open access article distributed under the terms and conditions of the Creative Commons Attribution (CC BY) license (http://creativecommons.org/licenses/by/4.0/).
Share and Cite
MDPI and ACS Style
Santos, J.N.D.C.M.d.; Carvalheira, C.d.J.G.; Picado Santos, L.G.d.; Magušić, R. Evaluation of the Speed Control Cameras in the City of Lisbon. Safety 2019, 5, 4. https://0-doi-org.brum.beds.ac.uk/10.3390/safety5010004
AMA Style
Santos JNDCMd, Carvalheira CdJG, Picado Santos LGd, Magušić R. Evaluation of the Speed Control Cameras in the City of Lisbon. Safety. 2019; 5(1):4. https://0-doi-org.brum.beds.ac.uk/10.3390/safety5010004
Chicago/Turabian StyleSantos, José Nuno Dias Crespo Martins dos, Carmen de Jesus Geraldo Carvalheira, Luís Guilherme de Picado Santos, and Radmila Magušić. 2019. "Evaluation of the Speed Control Cameras in the City of Lisbon" Safety 5, no. 1: 4. https://0-doi-org.brum.beds.ac.uk/10.3390/safety5010004
Note that from the first issue of 2016, this journal uses article numbers instead of page numbers. See further details here.