The Relationship between Fitness and Marksmanship in Police Officers
by
 , ,
, ,
Hannah Muirhead
1, 
Robin Orr
1,2,* ,
,
Ben Schram
1,2,
Charlie Kornhauser
3,
Ryan Holmes
3 and
J. Jay Dawes
2,4 1
Faculty of Health Sciences & Medicine, Bond University, Robina, QLD 4226, Australia
2
Tactical Research Unit, Bond University, Robina, QLD 4226, Australia
3
Colorado State Highway Patrol, Lakewood, CO 80120, USA
4
School of Kinesiology, Applied Health and Recreation, Oklahoma State University, Stillwater, OK 74074, USA
*
Author to whom correspondence should be addressed.
Safety 2019, 5(3), 54; https://0-doi-org.brum.beds.ac.uk/10.3390/safety5030054
Submission received: 1 July 2019
/
Revised: 5 August 2019
/
Accepted: 9 August 2019
/
Published: 14 August 2019
Abstract
:Police officers may be required to discharge their weapon under physical duress. The purpose of this study was to investigate the relationship between fitness and marksmanship to facilitate future strategies to improve marksmanship. Retrospective data were provided for thirty-four police officers (mean age = 40.48 ± 6.66 years: mean weight = 100.60 ± 19.82 kg: mean height = 180.42 ± 6.87 cm) from a US-based law enforcement agency. Data included four different fitness measures and three different shooting scenarios. No significant relationship was observed between the three different shooting scenarios. There was a significant relationship between shuttle run and static shoot (r = 0.528, p = 0.002), grip strength and the dynamic scenario (r = −0.367, p = 0.035) and leg strength and the positive identification scenario (r = 0.344, p = 0.050). This study demonstrated that a high variety of fitness training and marksmanship practice, under various occupational scenarios, may be required to ensure optimal police shooting accuracy whilst in the field.
1. Introduction
A career within the police force encompasses two conflicting occupational physical requirements, one of which involves sedentary, desk-bound administrative work, and the other involving physically demanding, field-based manual tasks [1]. These physical tasks can include running, jumping, crawling, balancing, vaulting, climbing, lifting, carrying, pushing, pulling, fighting, dragging and restraining a suspect [2,3]. Additionally, police officers may be required to attend to situations of high risk that threaten the wellbeing of themselves, their colleagues or the general public [4]. Subsequently, optimizing performance in these situations is of utmost importance.
A factor that could influence an officer’s ability to effectively and safely perform their work tasks is their level of fitness [5]. Officers who are physically unfit may be at greater risk of injury, illness and time off work [6]. It is therefore unsurprising that in anticipation of these task-related demands, police recruits are required to undergo preliminary physical training [7], where there is an emphasis placed on producing police officers who are capable of performing the physically demanding tasks required of them in the workforce [6,8]. However, despite this emphasis, a significant decline in physical fitness is often seen during their employment, which could negatively impact occupational task performance over time [9]. It is recognised that this decline in physical fitness may be credited to an increase in age [10], as well as the sedentary nature of this occupation (e.g., shift work, sedentary tasks, etc.) [7]. In addition, there have been differences noted between the sexes, with the average male police officer typically achieving higher fitness levels than the average female officer [10]. Thus, there is a large variation in fitness levels of police officers, which can be influenced by stage of training, duration of career, age and sex.
Police officers may encounter situations with suspects that pose a threat to their safety, or the safety of their co-workers or fellow citizens [4], as many may be well-equipped with firearms and prepared to use them to avoid arrest [11]. Due to this threat, police officers are increasingly required to wear and carry protective equipment, such as body armour [12,13]. Body armour can weigh approximately 2.7–3.8 kg, and despite providing a defense from stabbing, blunt trauma and small calibre bullets [12], it increases the duty load carried by officers to 10 kg [14]. The negative impact that this increase in load can have on occupational duties such as jumping, sprinting [15] and general mobility [13] further accentuates the necessity for officers to be physically fit. Relative duty loads, (i.e., equipment load relative to body weight) should also be considered when comparing the fitness of female and male officers, as females may carry heavier relative duty loads (13.36 ± 2.46% of their body weight) when compared to their male colleagues (11.50 ± 2.24% of their body weight) [14]. This creates an occupational environment where female officers may require a slightly greater strength-to-weight ratio than male officers to account for their higher relative duty load.
During life threatening situations, a police officer may be required to aim and fire a weapon in the line of duty. Failure to perform this task accurately could result in possible harm to the officer, suspect or the general public [3,16,17]. Firing a weapon with accuracy may need to be performed under the strenuous physical demands officers may face while carrying their duty loads in unpredictable environments, as mentioned previously. Ito et al. [18] found a strong relationship between fitness levels and marksmanship performance when examining shooting accuracy directly after high intensity running on a treadmill or walking with heavy backpacks (23.3 kg, 35.2 kg, 48.8 kg). The researchers found that shooting accuracy decreased immediately post-exercise; however, the soldiers with a higher physical fitness recovered and returned to optimal shooting performance more quickly. Fatigue from physical exertion resulting in increased postural sway with fatigue and heart rate have also been cited as factors that contribute to decreased shooting performance [19]. Therefore, one may hypothesize that a potential risk factor within the occupation of a law enforcement officer is their fitness level. As such, the purpose of this study was to further investigate the relationship between fitness and marksmanship in order to inform future strategies to improve police officer performance, in regards to shooting while under physical duress.
2. Materials and Methods
Retrospective data were provided for thirty-three police officers (n = 33: mean age = 40.48 ± 6.66 years: mean weight = 100.60 ± 19.82 kg: mean height = 180.42 ± 6.87 cm: mean BMI of 30.76 ± 4.88 kg/m2) from a US based law enforcement agency, with ethics approval from the University of Colorado, Colorado Springs Institutional Review Board (IRB #15-074) for the Protection of Human Subjects and Bond University.
2.1. Age, Height, and Weight
Measured height and body mass: Officers’ height (cm) and body mass (kg) were measured shoeless, using a digital scale (Health-O-Meter®, McCook, IL, USA) and a portable stadiometer (Seca®, Chino, CA, USA). Height and weight were converted from imperial measures to metric values for analysis. As only one female officer participated in this study, her scores for each item were removed due to the gender differences identified in previous studies [5] to ensure consistency within the results.
The fitness measures that were utilised for this study have been commonly used within the literature for this population [3,5,7,20,21,22]. The following is a detailed description for each of the fitness tests that were performed by the officers. Each of these tests was performed in self-selected fitness training attire. Prior to the fitness testing battery, the officers were allowed 5–10 min to perform a self-selected warmup, which consisted of light jogging and callisthenic type movements.
2.2. Vertical Jump
Vertical jump (VJ) height was calculated using a 27 in. × 27 in. Just Jump Mat (ProBotics Inc, Huntsville, AL, USA). All officers were instructed to step onto the mat and perform a countermovement arm swing and jump as high as possible. The Just Jump Mat calculates VJ height by measuring the amount of time the feet are not in contact with the mat and uses flight time/contact time to calculate vertical jump height. This device has been validated in previous research [23], and has been used with a similar protocol in previous research with this population [5]. The best of three allowed attempts were recorded, without rounding, before being converted into metric units.
2.3. Isometric Leg/Back Strength
Isometric leg/back strength was measured using an isometric leg/back chain dynamometer (Medico Inc., Phoenix, AZ, USA). As per the protocol used by Dawes et al. [5] in a law enforcement population, the chain connecting the scale on one end and a handle on the other was altered, allowing the officer’s knees to be flexed at approximately 120°. The dynamometer was calibrated to within 0.05 kg prior to use using an industrial portable digital hanging scale. The officers were instructed to pull the handle upward as hard as possible through extension of the hips and knees, while maintaining good spinal posture, straight arms and flat feet on the base of the dynamometer. Officers were allowed a single trial and their score to the nearest pound was recorded. This score was then converted to metric units.
2.4. Grip Strength
A handgrip dynamometer (Takei Scientific Instruments, Niigata, Japan) was used to measure dominant grip strength, with the dynamometer being adjusted so that the base of the first metacarpal and the middle four fingers were in contact with the handle. The elbow was fully extended with the hand held at shoulder height. The officers were instructed to squeeze the handle as hard as possible and were allowed one attempt. The score achieved was recorded to the nearest kilogram.
2.5. Shuttle Run
As per the 20 m multi-stage fitness test (20 m MSFT) protocol used by Dawes et al. [5], two lines were marked on the ground exactly 20 m apart. The officers were required to run back and forth between the lines with the speed of the test standardised by pre-recorded auditory beeps. The initial test speed was set at 8.5 km/h and increased by 0.5 km/h at each stage. The test was terminated when the officer was unsuccessful in reaching the next line two consecutive times in accordance to the auditory beep. The shuttle run was scored as the final stage and shuttle (e.g., stage 5.5), with the final scores converted to the total number of shuttles completed.
2.6. Static Shooting
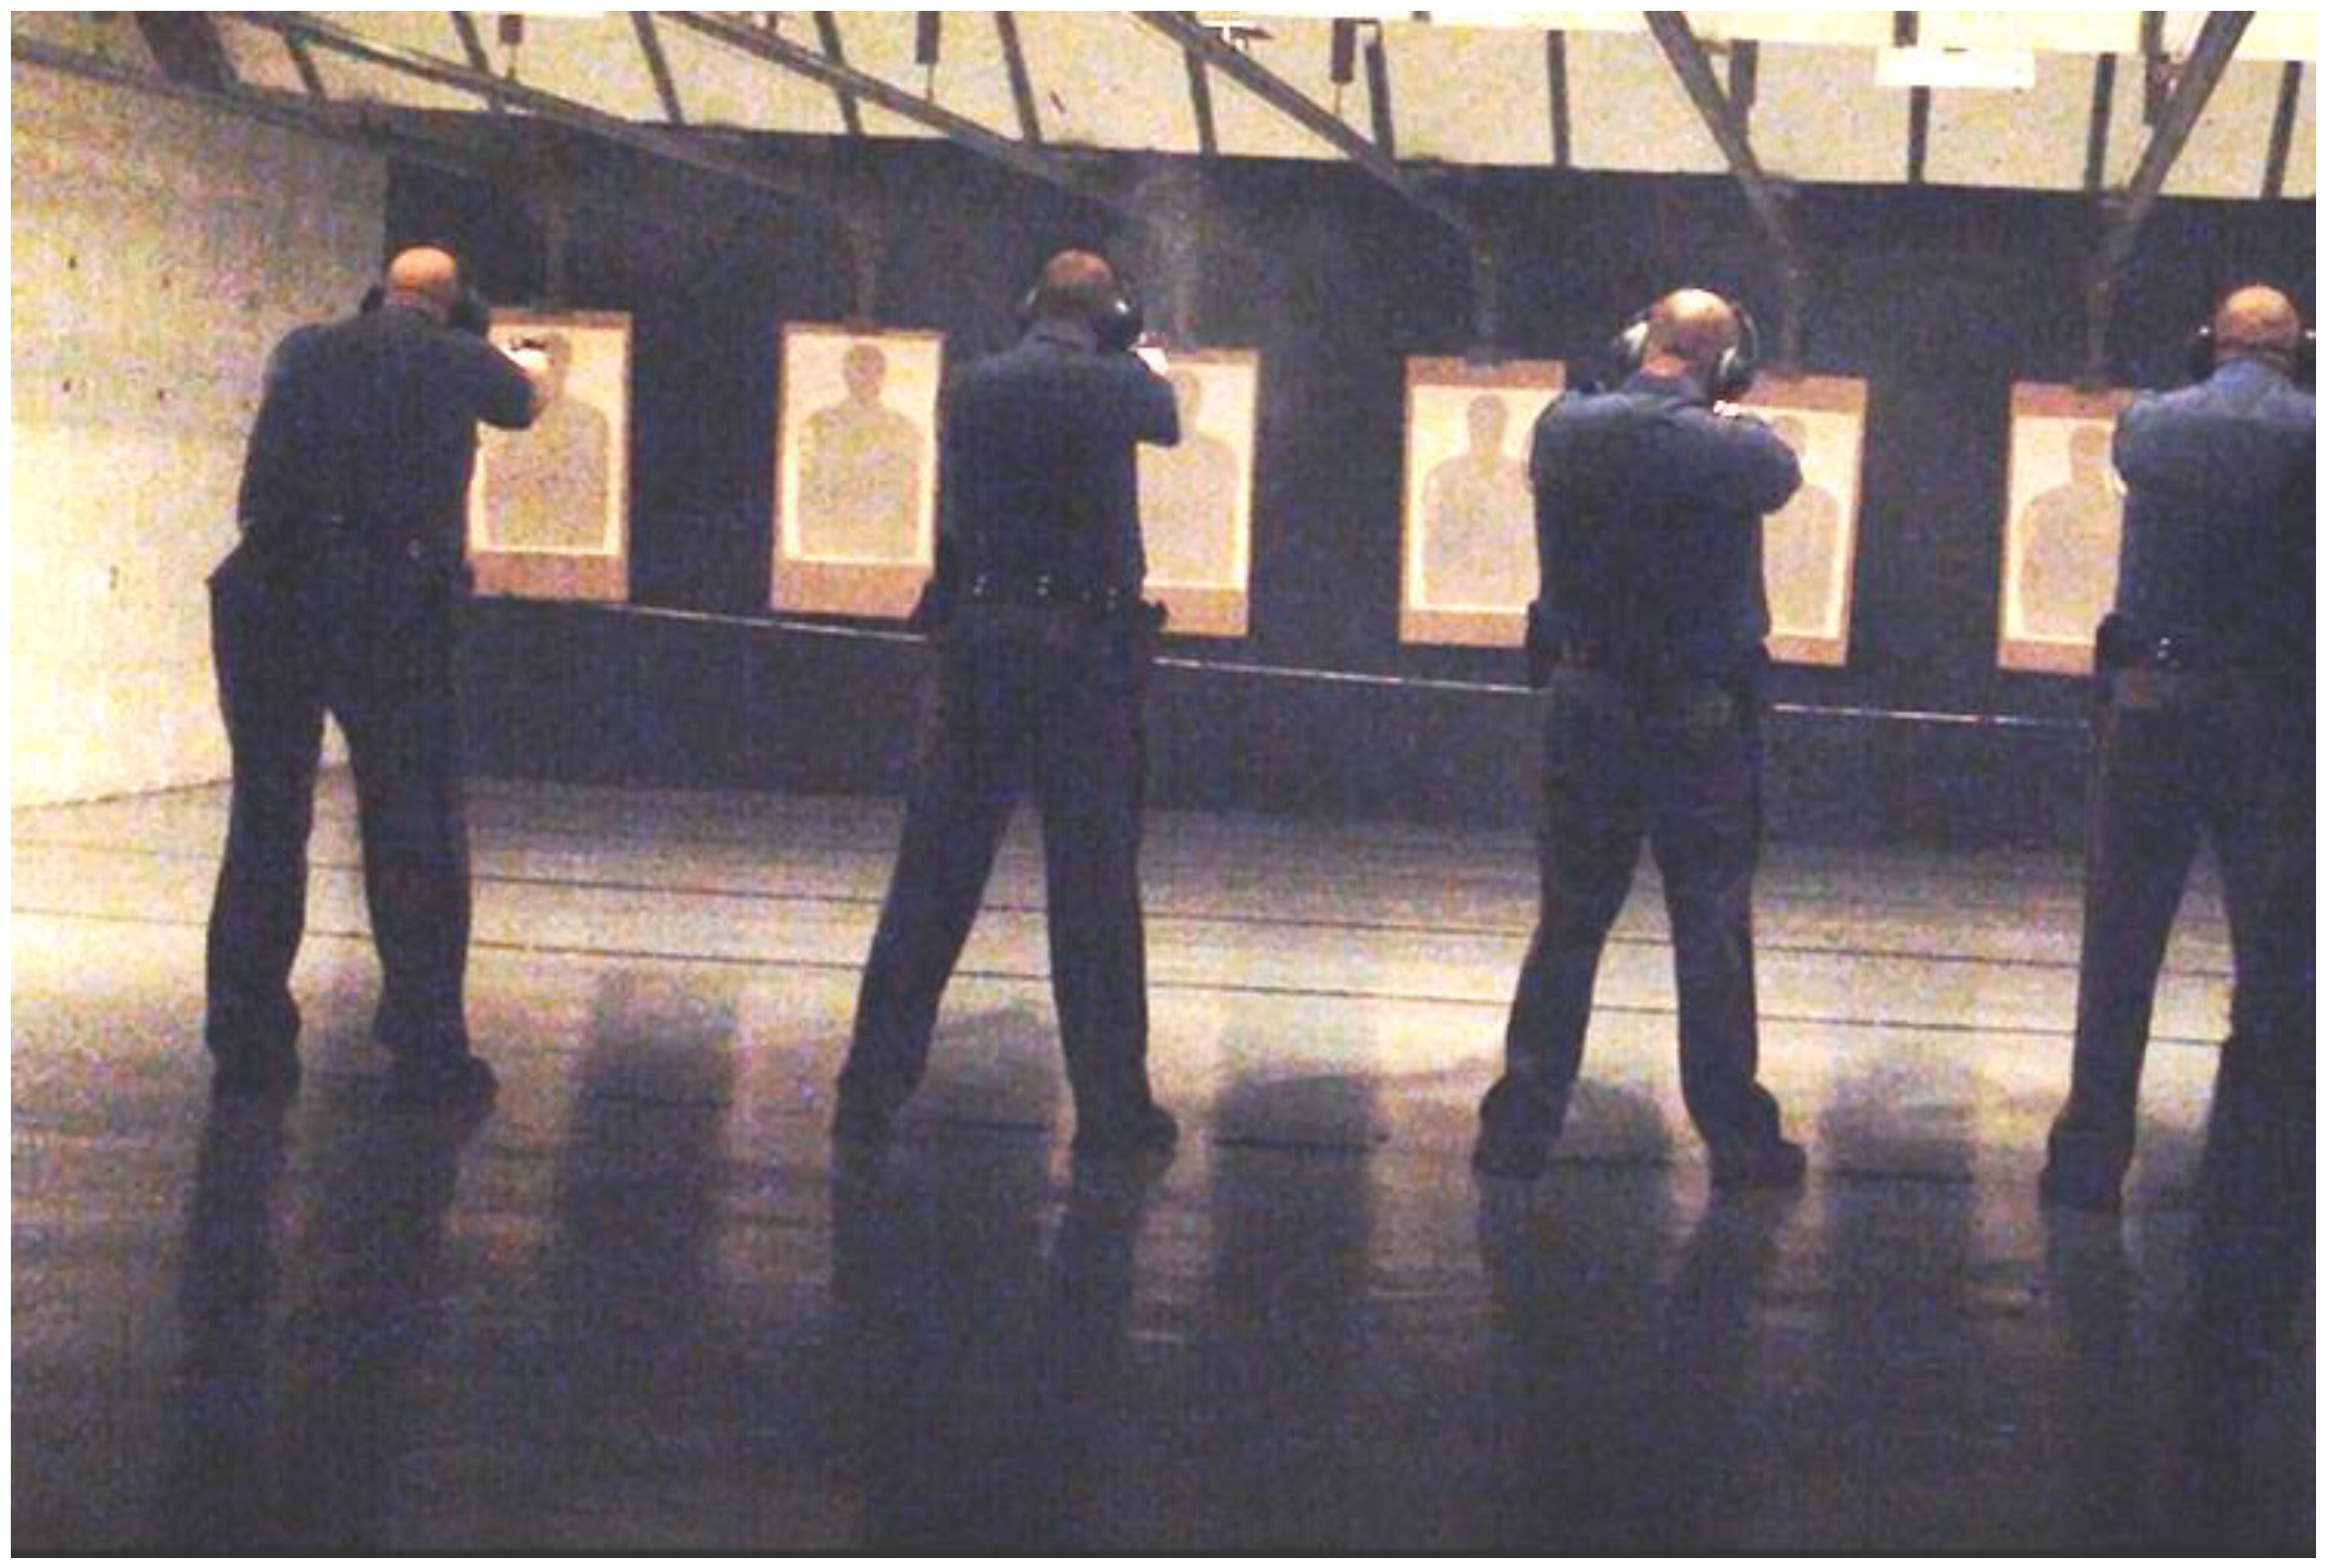
To evaluate the officers’ baseline shooting accuracy while at rest with no external distractions or duress, officers were instructed to use their issued 0.40 caliber Smith and Wesson handgun to aim and fire at an 8″ circle located at the centre-of-mass or on the head of the standard qualification target used by the law enforcement agency (a black silhouette in the shape of an individual’s upper body and head) (Figure 1). After loading a magazine to capacity (15 rounds), officers were instructed to stand at the ten-yard line and fire ten rounds towards the target. The officers were allowed to perform the task at their own pace and were not timed or evaluated on any factors other than the accuracy of their shot placement. The event took place in a “dim light” shooting environment inside a law enforcement academy indoor shooting range, with up to ten officers on the firing line performing the task at the same time. Accuracy was scored in accordance with shot impact position on the target, with shots closer to the center of mass or to the head resulting in a score of three points, shots impacting vital areas of the upper body region but outside the centre of mass resulting in two points and shots that struck the extremities resulting in one point. The maximum score possible was 30 points. Final scores were then calculated by dividing the officer’s score by the maximum possible score and multiplying the result by 100 to score as a percentage.
2.7. Dynamic Scenario
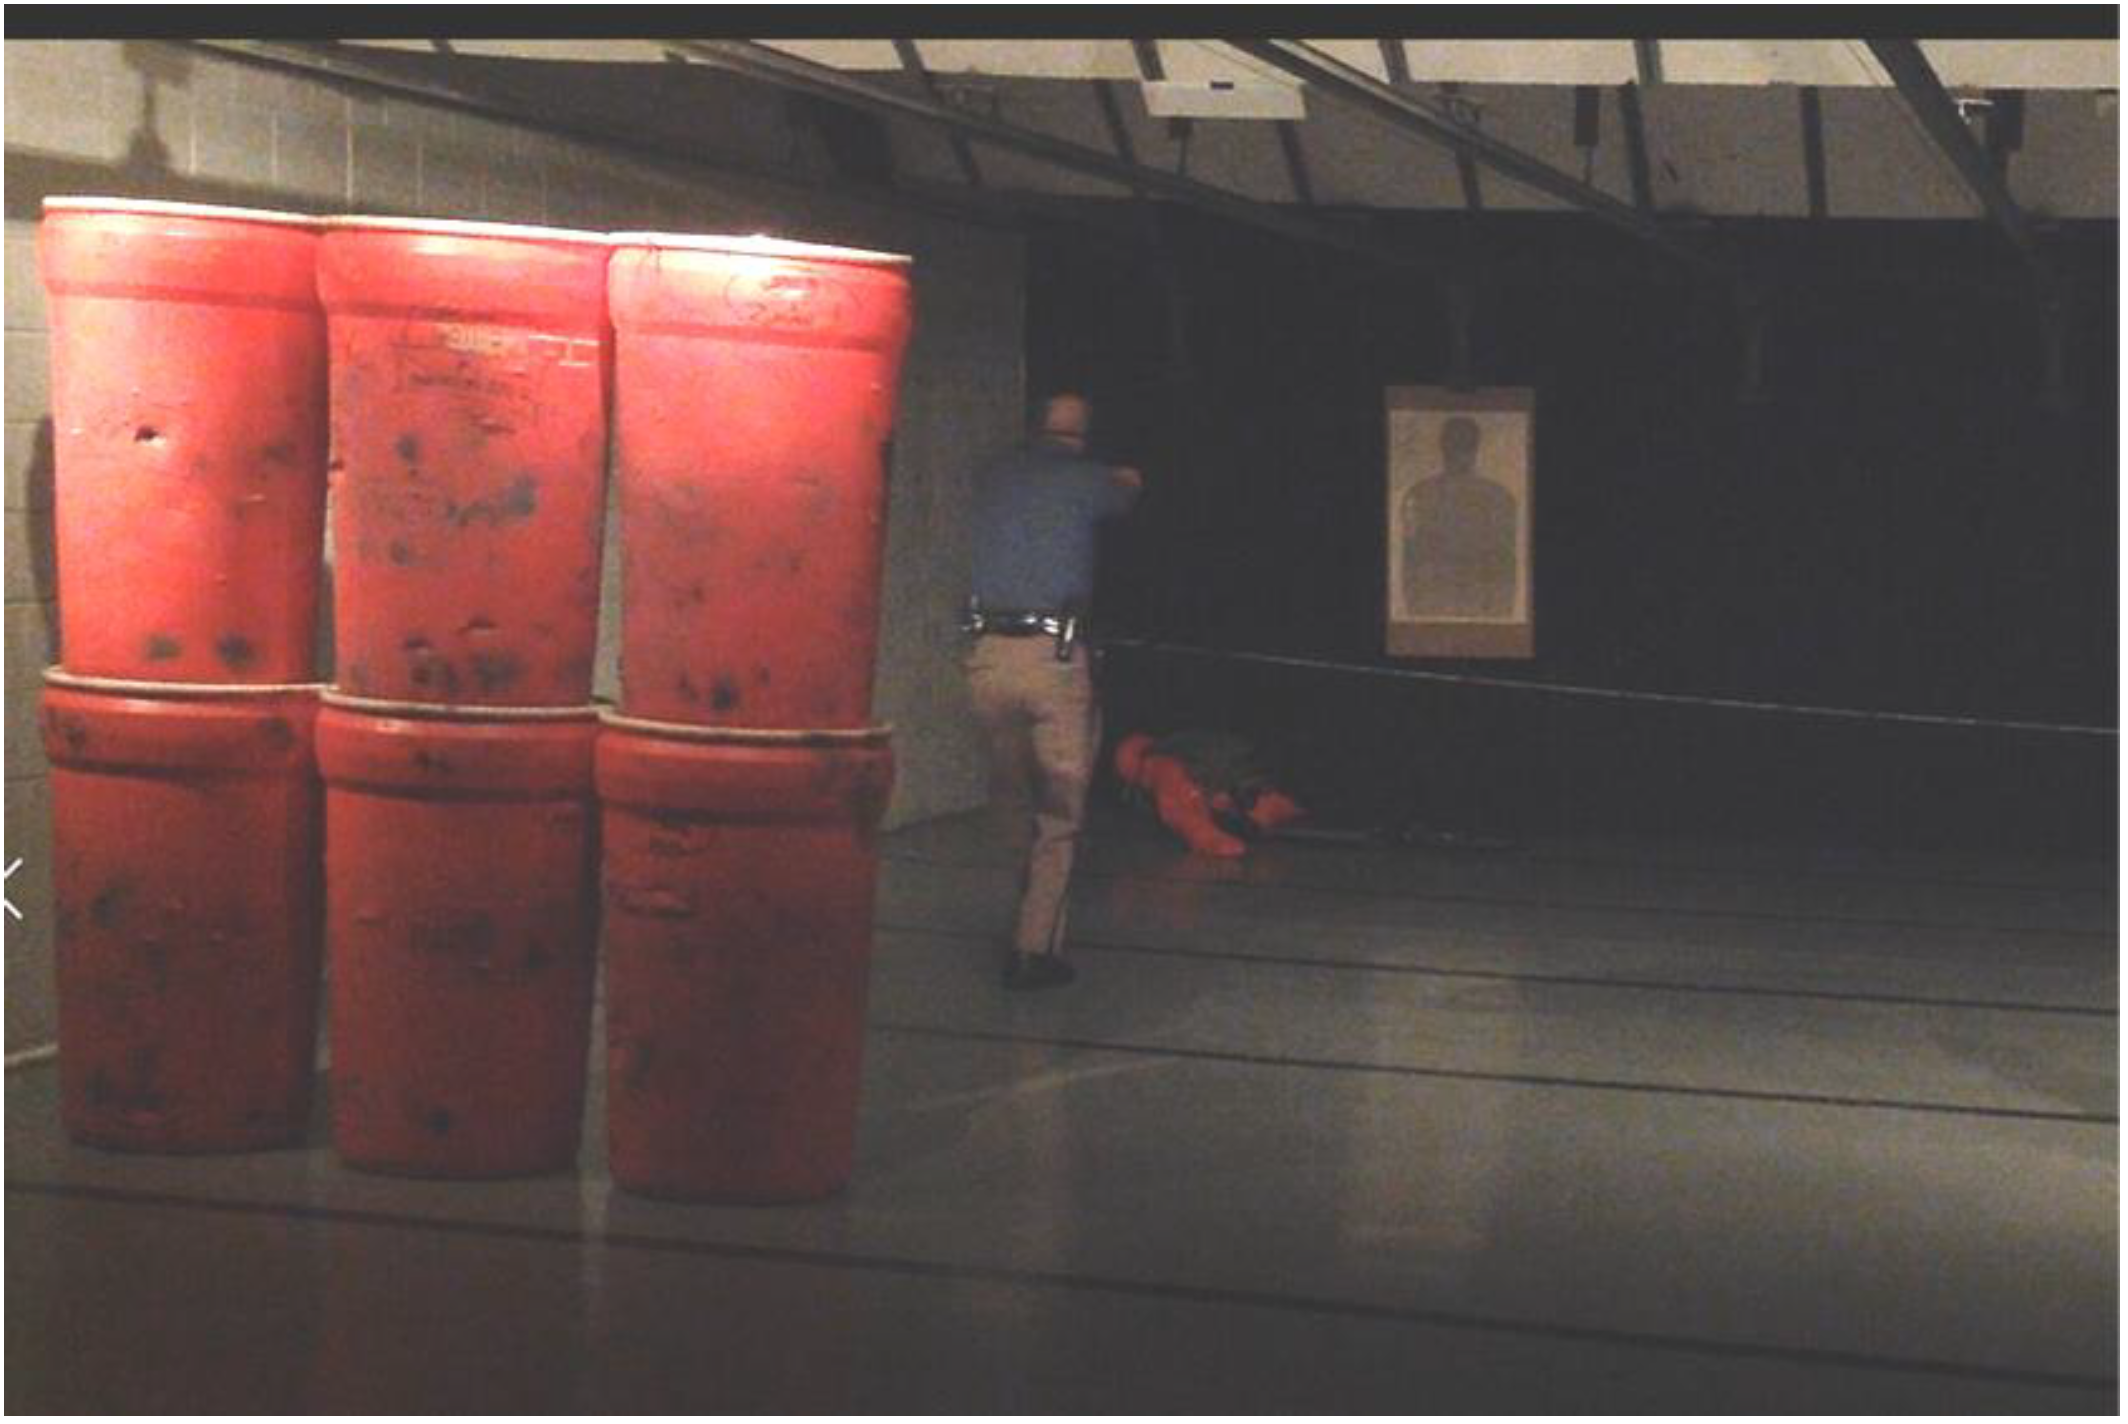
The dynamic scenario was multi-faceted to assess the officers’ ability to shoot accurately while under stress, their ability to perceive occupational hazards, their ability to handle and drag a dummy efficiently and their ability to rely on training (such as the use of “cover”). Officers were taken individually from a classroom and asked to perform a three minute sub-maximal step-test. They were then given three pre-loaded magazines (the first with only two rounds, the second with six rounds and the third filled to capacity) and were directed to the shooting area within the “dimly lit” indoor shooting range. The officer was placed at the 10 yard line in front of “cover” and was instructed to start with the gun drawn and fixed on the target (Figure 2). The officer was then required to fire two rounds, “combat reload” and fire four more rounds while moving from the 10 yard line to the 1.5 yard line. They were then to safely holster their weapon and perform a victim drag using a 220 lb (99.79 kg) dummy, dragging it backwards to the 10 yard line behind “cover”. They were then required to fire four more rounds, using cover appropriately as the officers had been trained. Upon that final round being fired, the officer had completed the event. The event was timed from the initial facing of the target until the firing of the final round, and was recorded and reviewed by multiple Lead Firearms Instructor subject matter experts. The target was a black silhouette in the shape of an individual and shots were directed to be at the centre of mass, in accordance with an officer’s training. Score was determined by number of shots on target, and within the scoring zones described above, with a maximum score of 30 points possible. Final scores were then calculated by dividing the officer’s score by the maximum possible score and multiplying the result by 100 to score as a percentage.
2.8. Positive Identification Scenario
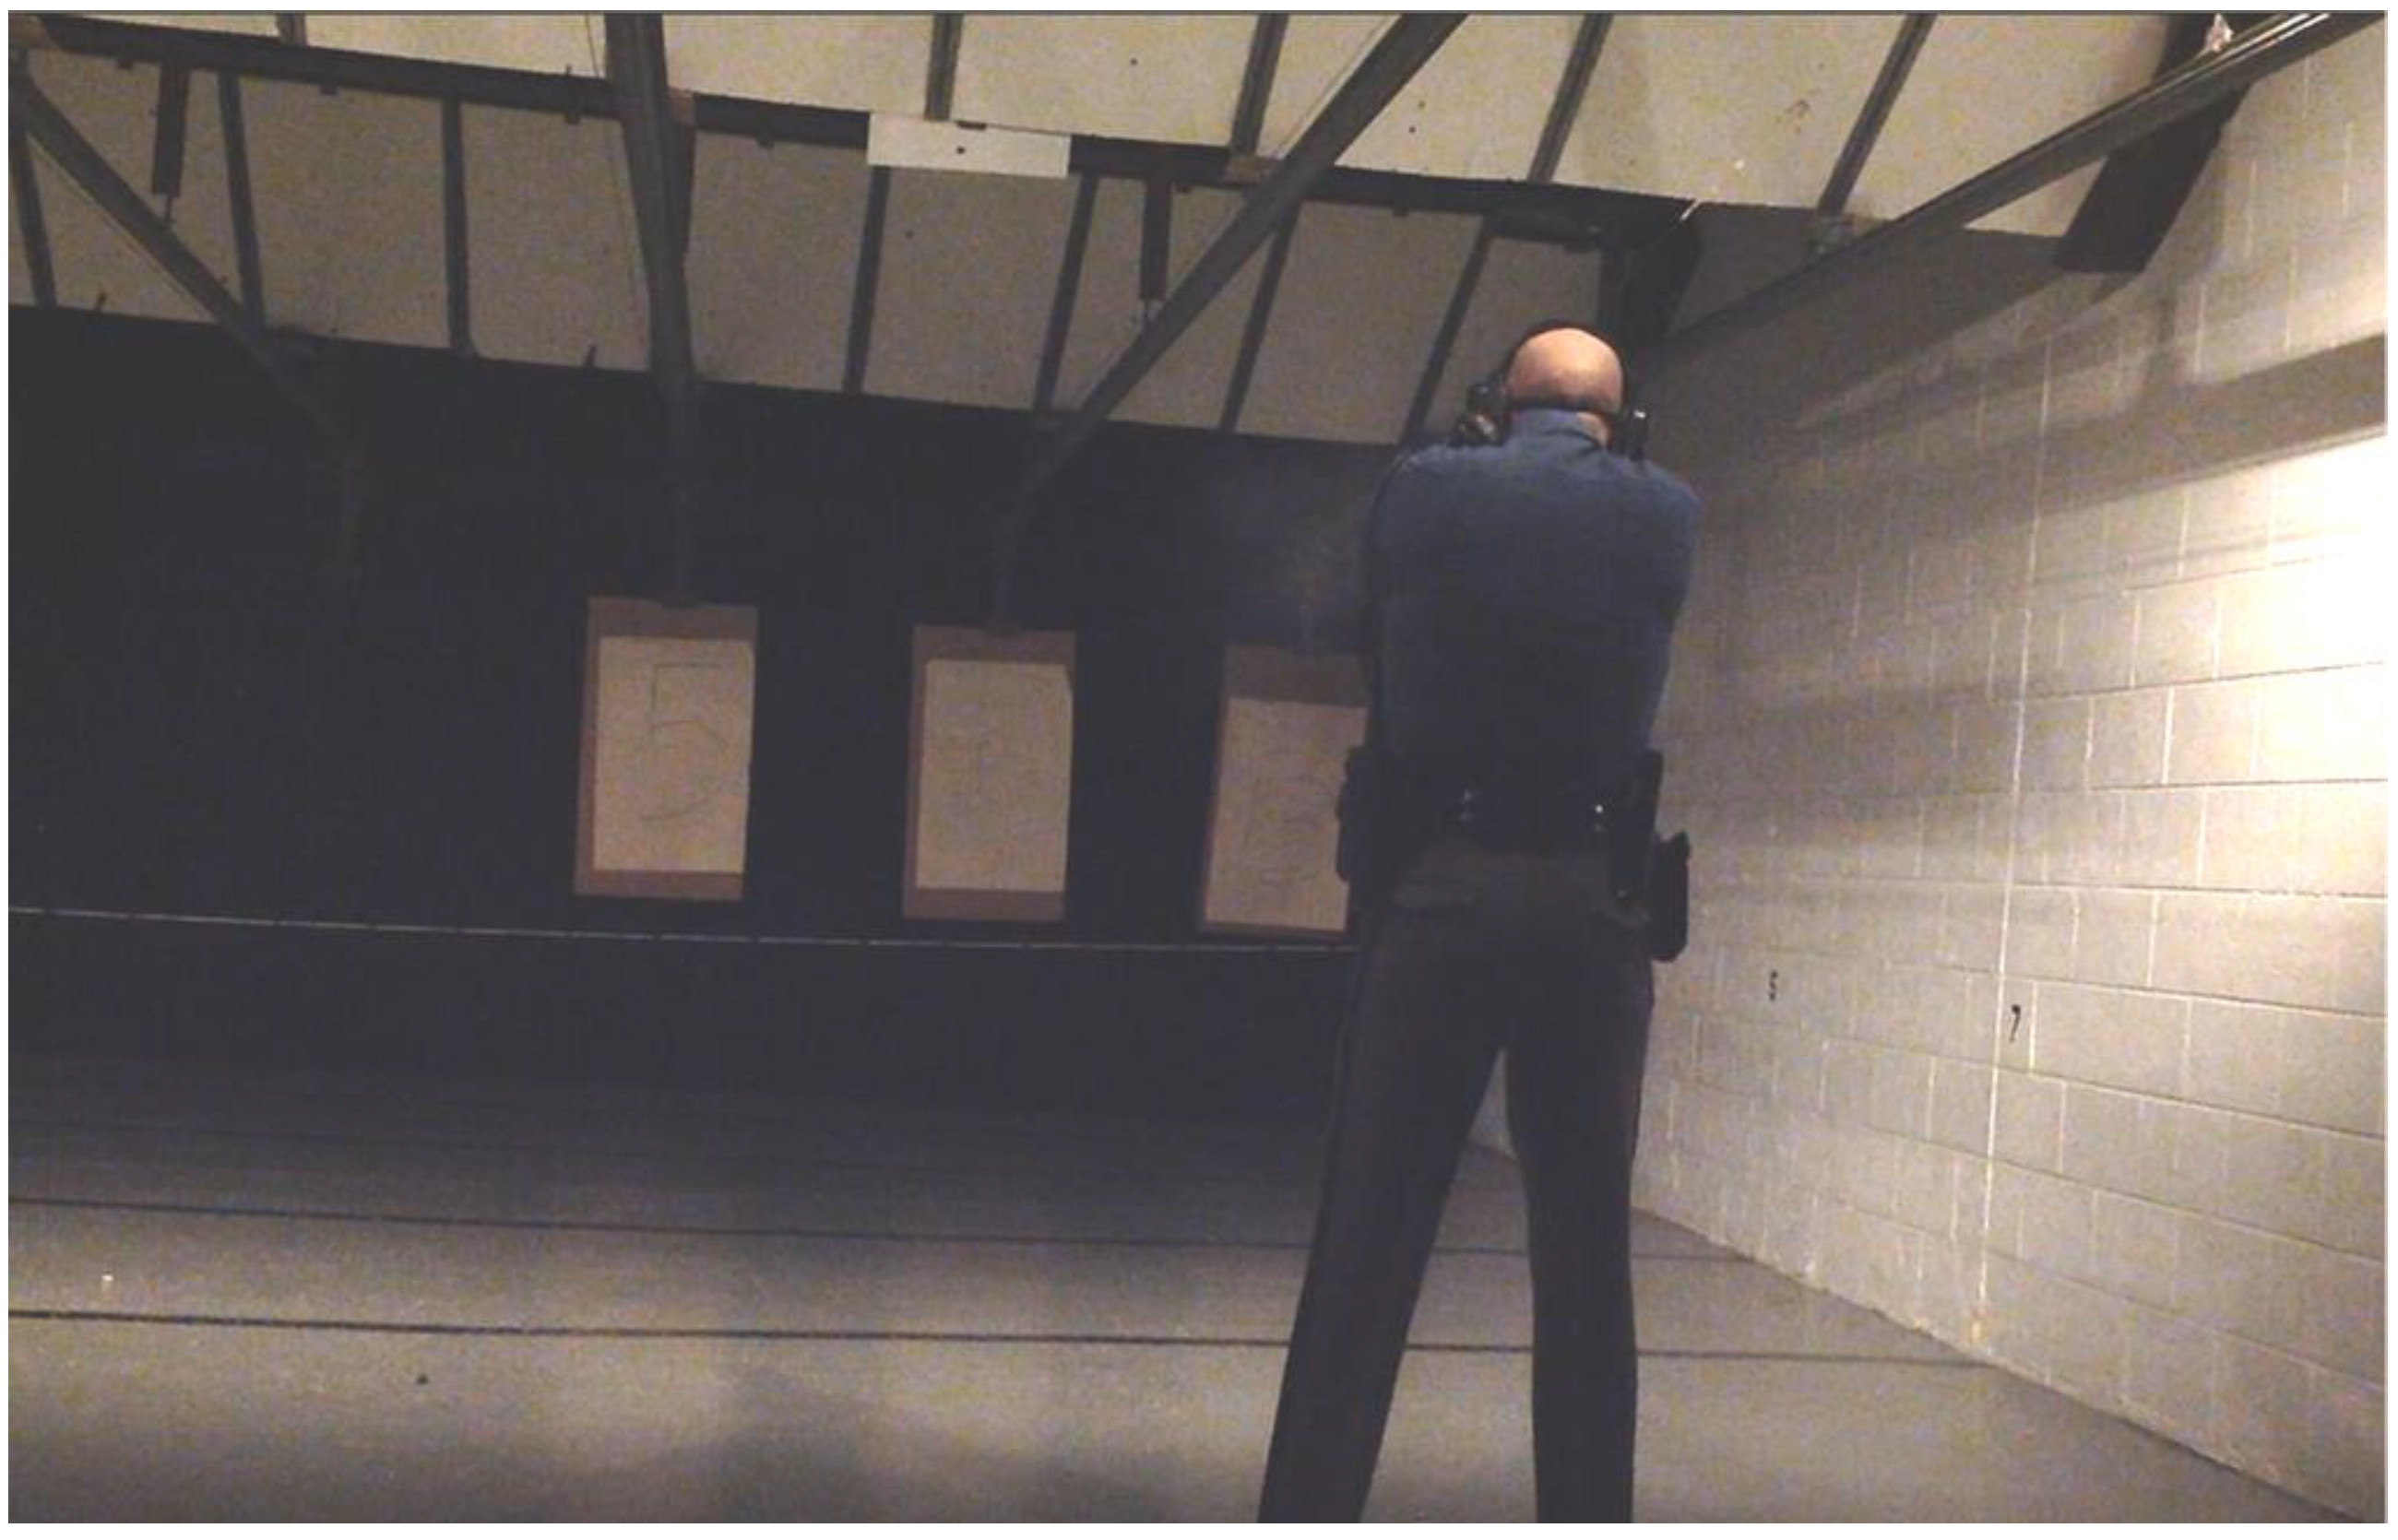
The decisional shooting test served to evaluate the officer’s ability to perceive and identify a specific target while under stress, and to identify what was and was not a viable target. The officers were placed at the 10 yard line whilst under stress, having immediately exited the shooting area from the dynamic scenario (Figure 3). They were instructed that upon the facing the targets, they would be given four seconds to identify and shoot two rounds into “any backer with a number on it”. The targets were set to face and edge automatically along three consecutive lanes, and when faced they showed the number “5”, the letter “R” and the number “13”, remaining in the same order from left to right throughout each test. The numbers and letter were drawn to cover approximately ¾ of the surface of a standard sized blank qualification target and circled. The target was a black silhouette in the shape of an individual, and shots were to be directed at the centre of mass or head in accordance with the officers’ training. Upon facing the targets, the officers were given 4 s (by means of automatic computer driven timing) to draw their guns, identify the targets and fire the required number of shots. The environment was consistent with the other two shooting scenarios, inside the law enforcement academy indoor shooting range with “dim light”. As with the scoring criteria in the dynamic scenario, the score was determined by the number of shots on target and within the scoring zones, with a maximum score being six points. Final scores were then calculated by dividing the officer’s score by the maximum possible scores and multiplying the result by 100 to score as a percentage.
Officers wore their standard uniform and duty load throughout all three shooting scenarios to eliminate any variability that load carriage may have on their shooting performance or their physical endurance [18,24,25]. The total score was calculated by adding all three final scores together and dividing the total by three.
2.9. Statistical Analysis
Data collected were provided in an excel spreadsheet prior to being imported into SPSS (version 25) for analysis. A descriptive analysis was performed on all variables to identify mean values, standard deviation and value ranges. Following this, Pearson’s bivariate correlations were performed to investigate relationships between fitness measures and shooting scenarios. To investigate variations in associations between different fitness measures and shooting scenarios between officers of different skill levels, the officers were divided into a higher performing 50% (n = 17) and a lower performing 50% (n = 17) groups based on their total scores. An additional Pearson correlation was then applied to the fitness measures and shooting scores of these two groups. The strength of the correlations were considered against the scale proposed by Evans [26].
3. Results
3.1. Descriptive
Data for thirty-three male officers were provided. Descriptive data for the officers and all measures are shown in Table 1.
3.2. Shooting
The correlation analysis (see Table 2) revealed no significant correlations between any of the shooting scenarios. The static shooting scenario had a correlation score of 0.314 (p = 0.075) to Scenario 1 and a correlation score of 0.281 (p = 0.113) to Scenario 2. Scenario 1 and Scenario 2 had a correlation score of 0.177 (p = 0.326).
3.3. Fitness
The descriptive statistics of the officers’ fitness measures are shown in Table 1. There was no single fitness measures that consistently demonstrated a relationship to the officers shooting scores between the marksmanship tasks (see Table 3). A moderate positive significant correlation was found between the shuttle run scores and the static shooting scenario scores (r = 0.528, p = 0.002). There was also a weak negative significant relationship between Scenario 1 and grip strength (r = −0.367, p = 0.035), and a weak positive non-significant relationship between leg dynamometer strength and Scenario 2 (r = 0.344, p = 0.050).
4. Discussion
This study investigated the relationships between different fitness measures and different marksmanship scenarios within a population of police officers. The different marksmanship scenarios were designed to mimic different environments that officers may face while in the field [3,16,20,27]. There were varying relationships between individual fitness measures and marksmanship scenarios, with significant relationships between the shuttle run and static shooting, grip strength and the dynamic scenario, and leg/back strength and the positive identification scenario. No significant correlations were found between the three different shooting scenarios, which suggests that each marksmanship task was unique and highlights a possible lack of skill crossover, whereby performing well in one aspect of marksmanship may not translate to performing well in another event.
4.1. Fitness Measures
A significant positive correlation between the number of shuttle runs completed and the static shooting could possibly be attributed to the officers being more aerobically fit and having a lower resting heart rate. When aiming to shoot, a lower heart rate results in less body tremor than a faster heart rate [28], suggesting that a lower resting heart rate may positively relate to shooting performance. However, there has been conflicting research regarding the influence of heart rate whilst under physical duress [11,29]. A study by Billich et al. [11] found that shooting accuracy was negatively impacted when an officer performed an activity at an intensity near maximum heart rate; however, the officers that were least affected were those whose hobbies included endurance activities or power training. Brown et al. [29], however, found no inverse relationship between shooting performance and heart rate when exerting officers to 80% of their maximum heart rate, and questioned if shooting performance was maintained due to their expert level within their field. A study that evaluated marksmanship saw a positive relationship between elevated heart rate and shooting accuracy prior to physical exertion, followed by a negative relationship between increased heart rate and shooting accuracy subsequent to physical activity [30]. Considering this, it may be worthwhile in future research related to this topic to include heart rate monitoring and a VO2 max assessment to identify any possible relationships between the three scenarios and the heart rate achieved in each scenario.
Grip strength has commonly demonstrated a positive significant relationship with marksmanship in previous research within the law enforcement population [3,22]. Conversely, this study found a significant but negative relationship to shooting performance. The mean grip strength within this study (51.82 ± 7.04 kg) was slightly lower than the fitness profile of participants in the study performed by Dawes et al. [5] (55.04 ± 7.77 kg); however, Dawes et al. [5] did not investigate relationships between grip strength and marksmanship ability. This particular study group had a higher mean grip strength than a study performed by Orr et al. [3] within a similar population (right hand: 42.15 ± 8.29 kg), who found a significant and positive relationship associated with grip strength. Orr et al. [3] did suggest, however, that a strength threshold may exist where, as grip strength increased above a given threshold, shooting scores may decrease. This has also been speculated in a study performed by Rodd et al. [21], who found that although grip strength did positively correlate with marksmanship, some individuals with the highest grip strength scores actually demonstrated some of the poorer qualifying scores in their marksmanship assessment. A possible cause for this negative relationship between marksmanship and higher grip strength may be due to how grip strength was measured, as a typical protocol [5] has the dynamometer adjusted to hand size, whereas the width of the pistol remains extant to grip size. Hand/arm size has been found to have a significant correlation with grip strength, with larger hands being able to exert higher forces [31]. Therefore, it could be theorized that subjects with larger upper limb measurements could shoot with more accuracy, as the gripped gun would be proportionally smaller in their hands [17]. Kayihan et al. [20] also found significant correlations between wrist circumference, bicep circumference, grip strength and marksmanship. Unfortunately, no hand sizes were available for this study—this measure may be of benefit in future research.
The officers’ leg dynamometer scores demonstrated a significant positive relationship with the positive identification scenario and the officers’ total scores. This particular study group recorded a higher mean score (181.99 ± 29.08 kg) than the average score found when profiling male state patrol officers (170.68 ± 37.46 kg). This higher average may have improved the officers’ marksmanship ability, as Hoffman et al. [32] found that decreased lower limb strength may be indicative of poorer shooting accuracy when a prone and a standing position were compared during firing. Increased lower limb strength may also reduce the amount of fatigue the officers experienced, therefore decreasing the negative effect of fatigue on marksmanship [19].
A vertical jump measurement was used to provide an indirect measure of lower body power [5]. Although this particular study saw no significant relationship between vertical jump height and any of the shooting scenarios, it is an important fitness parameter to assess within a law enforcement population, as lower scores can indicate a higher risk of injury and possible lower fitness levels [33]. It should be noted that the average vertical jump score of the participants of this study (46.82 ± 8.85 cm) was lower than the average score found by Dawes et al. [5] (50.74 ± 8.89 cm) when profiling state patrol officers. This could suggest that this particular group had lower levels of fitness than the average law enforcement officer, and therefore would potentially be more susceptible to fatigue, which can decrease marksmanship ability [19,25].
4.2. Shooting
Research studies often only assess marksmanship skills via one method of testing in either a static scenario or a scenario under duress or fatigue [16,18,19,27,29,30,32]. A potential reason, apart from time, for only employing one shooting scenario (i.e., static or dynamic) is the contention that an officer’s marksmanship skills are transferable [34]. The results of this study demonstrated that there were no significant relationships between the three different shooting scenarios. As such, officers who were good marksmen in one task were not necessarily good marksmen in the other task. Therefore, it is suggested that to improve overall marksmanship performance for in field encounters, an officer would be required to train in a diverse range of scenarios to ensure optimal performance.
This lack of marksmanship skill transfer and differences in relationships between fitness measures and the different marksmanship measures may help explain the conflicting results between marksmanship ability and fitness. A number of studies [16,18,19,22,27,29,30,32] have investigated relationships between measures of fitness and shooting performance. They found significant correlations—possibly suggesting that a directed training program in these fitness areas would be beneficial to marksmanship accuracy.
5. Conclusions
This study highlighted that different marksmanship tasks were not necessarily related, and that an officer’s performance in one shooting scenario was not indicative of their performance in another. For each marksmanship scenario, a different fitness measure was a contributing factor to performance. Therefore, officers may need to be exposed to a high variety of marksmanship scenarios and a diverse level of fitness training to increase overall marksmanship accuracy.
Author Contributions
Conceptualization, R.O., B.S., J.J.D.; methodology R.O., B.S., C.K., R.H., J.J.D., software H.M., R.O., B.S., J.J.D.; validation H.M., R.O., B.S., C.K., R.H., J.J.D.; formal analysis, H.M., R.O., B.S., C.K.; investigation, H.M., R.O., B.S., C.K., R.H., J.J.D.; resources C.K., R.H., J.J.D.; data curation, C.K., R.H., J.J.D.; writing—original draft preparation, H.M.; writing—review and editing H.M., R.O., B.S., J.J.D.; visualization, H.M., R.O., B.S., J.J.D.; supervision, R.O., B.S., project administration, R.O., B.S., J.J.D.
Funding
This project received no additional funding.
Acknowledgments
The authors of this study would like to acknowledge the Colorado State Patrol for their assistance with the completion of this project.
Conflicts of Interest
The authors declare no conflict of interest.
References
- Violanti, J.M.; Ma, C.C.; Fekedulegn, D.; Andrew, M.E.; Gu, J.K.; Hartley, T.A.; Charles, L.E.; Burchfiel, C.M. Associations Between Body Fat Percentage and Fitness among Police Officers: A Statewide Study. Saf. Health Work 2017, 8, 36–41. [Google Scholar] [CrossRef]
- Bonneau, J.; Brown, J. Physical ability, fitness and police work. J. Clin. Forensic Med. 1995, 2, 157–164. [Google Scholar] [CrossRef]
- Orr, R.; Pope, R.; Stierli, M.; Hinton, B. Grip Strength and Its Relationship to Police Recruit Task Performance and Injury Risk: A Retrospective Cohort Study. Int. J. Environ. Res. Public Health 2017, 14, 941. [Google Scholar] [CrossRef]
- Anderson, G.S.; Litzenberger, R.; Plecas, D. Physical evidence of police officer stress. Policing 2002, 25, 399–420. [Google Scholar] [CrossRef] [Green Version]
- Dawes, J.; Orr, R.; Flores, R.; Lockie, R.; Kornhauser, C.; Holmes, R. A physical fitness profile of state highway patrol officers by gender and age. Ann. Occup. Environ. Med. 2017, 29, 16. [Google Scholar] [CrossRef]
- Shusko, M.; Benedetti, L.; Korre, M.; Eshleman, E.J.; Farioli, A.; Christophi, C.A.; Kales, S.N. Recruit Fitness as a Predictor of Police Academy Graduation. Occup. Med. 2017, 67, 555–561. [Google Scholar] [CrossRef] [Green Version]
- Orr, R.; Dawes, J.; Pope, R.; Terry, J. Assessing Differences in Anthropometric and Fitness Characteristics Between Police Academy Cadets and Incumbent Officers. J. Strength Cond. Res. 2018, 32, 2632. [Google Scholar] [CrossRef]
- Orr, R.; Ford, K.; Stierli, M. Implementation of an Ability-based Training Program in Police Force Recruits. J. Strength Cond. Res. 2016, 30, 2781–2787. [Google Scholar] [CrossRef]
- Sorensen, L.; Smolander, J.; Louhevaara, V.; Korhonen, O.; Oja, P. Physical activity, fitness and body composition of Finnish police officers: A 15-year follow-up study. Occup. Med. 2000, 50, 3–10. [Google Scholar] [CrossRef]
- Lockie, R.G.; Dawes, J.J.; Orr, R.M.; Stierli, M.; Dulla, J.M.; Orjalo, A.J. Analysis of the Effects of Sex and Age on Upper- and Lower-body Power for Law Enforcement Agency Recruits Before Academy Training. J. Strength Occup. Med. 2018, 32, 1968–1974. [Google Scholar] [CrossRef]
- Billich, R.; Barták, E.; Beneš, J.; Majerčík, P.; Jelen, K. Effect of maximum heart rate on accuracy of fire. Acta Univ. Carol. Kinanthropol. 2014, 50, 98–107. [Google Scholar] [CrossRef]
- Dempsey, P.C.; Handcock, P.J.; Rehrer, N.J. Impact of police body armour and equipment on mobility. Appl. Ergon. 2013, 44, 957–961. [Google Scholar] [CrossRef]
- Schram, B.; Orr, R.; Pope, R.; Hinton, B.; Norris, G. Comparing the Effects of Different Body Armor Systems on the Occupational Performance of Police Officers. Int. J. Environ. Res. Public Health 2018, 15, 893. [Google Scholar] [CrossRef]
- Dulla, J.; Baran, K.; Pope, R.; Orr, R. Duty loads carried by the LA sheriff’s department officers. J. Aust. Strength Cond. 2017, 26, 34–38. [Google Scholar] [CrossRef]
- Joseph, A.; Wiley, A.; Orr, R.; Schram, B.; Dawes, J.J. The Impact of Load Carriage on Measures of Power and Agility in Tactical Occupations: A Critical Review. Int. J. Environ. Res. Public Health 2018, 15, 88. [Google Scholar] [CrossRef]
- Nibbeling, N.; Oudejans, R.R.; Canal-Bruland, R.; van der Wurff, P.; Daanen, H.A. Pursue or shoot? Effects of exercise-induced fatigue on the transition from running to rifle shooting in a pursuit task. Ergonomics 2013, 56, 1877–1888. [Google Scholar] [CrossRef]
- Anderson, G.S.; Plecas, D.B. Predicting shooting scores from physical performance data. Policing 2000, 23, 525–537. [Google Scholar] [CrossRef] [Green Version]
- Ito, M.A.; Sharp, M.A.; Johnson, R.F.; Merullo, D.J.; Mello, R.P. Rifle Shooting Accuracy During Recovery from Fatiguing Exercise. Army Res. Inst. Environ. Med. 1999, 1–7. [Google Scholar]
- Evans, R.; Scoville, C.; Ito, M.; Mello, R. Upper body fatiguing exercise and shooting performance. Mil. Med. 2003, 168, 451–456. [Google Scholar] [CrossRef]
- Kayihan, G.; Ersöz, G.; Özkan, A.; Koz, M. Relationship between efficiency of pistol shooting and selected physical-physiological parameters of police. Policing 2013, 36, 819–832. [Google Scholar] [CrossRef]
- Rodd, D.; Leasure-Woodburn, M.; Wilson, G. The Effects of Grip Strength and Firearm Discharge. Med. Sci. Sports Exerc. 2008, 40, S356. [Google Scholar] [CrossRef]
- Muirhead, H.; Birge, S.; Orr, R.M.; Schram, B.; Dawes, J.J. The impact of fitness levels on marksmanship: A critical narrative review. In Proceedings of the Poster presentation at the Rocky Mountain American College of Sports Medicine Annual Meeting, Denver, CO, USA, 1–2 March 2019. [Google Scholar]
- Leard, J.S.; Cirillo, M.A.; Katsnelson, E.; Kimiatek, D.A.; Miller, T.W.; Trebincevic, K.; Garbalosa, J.C. Validity of two alternative systems for measuring vertical jump height. J. Strength Cond. Res. 2007, 21, 1296–1299. [Google Scholar] [CrossRef]
- Thomas, M.; Pohl, M.B.; Shapiro, R.; Keeler, J.; Abel, M.G. Effect of Load Carriage on Tactical Performance in Special Weapons and Tactics Operators. J. Strength Cond. Res. 2018, 32, 554–564. [Google Scholar] [CrossRef]
- Knapik, J.; Ang, P.; Meiselman, H.; Johnson, W.; Kirk, J.; Bensel, C.; Hanlon, W. Soldier performance and strenuous road marching: Influence of load mass and load distribution. Mil. Med. 1997, 162, 62–67. [Google Scholar] [CrossRef]
- Evans, J.D. Straightforward Statistics for the Behavioral Sciences; Brooks/Cole: Boston, MA, USA, 1996. [Google Scholar]
- Carbone, P.; Carlton, S.; Stierli, M.; Orr, R. The Impact of Load Carriage on the Marksmanship of the Tactical Police Officer: A Pilot Study. J. Aust. Strength Cond. 2014, 22, 50–57. [Google Scholar]
- Ahmad, M.A.N.; Saeri, A.S.A.; Muhtar, K. The Importance of Being Calm: The Impact of Heart Rate Towards Performance. In Proceedings of the Business Management and Computing Research Colloquium (BMCRC), Raub, Malaysia, 25 May 2016; pp. 15–17. [Google Scholar]
- Brown, M.J.; Tandy, R.D.; Wulf, G.; Young, J.C. The effect of acute exercise on pistol shooting performance of police officers. Motor Control 2013, 17, 273–282. [Google Scholar] [CrossRef]
- Tenan, M.; LaFiandra, M.; Ortega, S. The Effect of Soldier Marching, Rucksack Load, and Heart Rate on Marksmanship. Human Factors 2017, 59, 259–267. [Google Scholar] [CrossRef]
- Fransson, C.; Winkel, J. Hand strength: The influence of grip span and grip type. Ergonomics 1991, 34, 881–892. [Google Scholar] [CrossRef]
- Hoffman, M.; Gilson, P.; Westenburg, T.; Spencer, W. Biathlon shooting performance after exercise of different intensities. Int. J. Sports Med. 1992, 13, 270–273. [Google Scholar] [CrossRef]
- Orr, R.; Pope, R.; Peterson, S.; Hinton, B.; Stierli, M. Leg power as an indicator of risk of injury or illness in police recruits. Int. J. Environ. Res. Public Health 2016, 13, 237. [Google Scholar] [CrossRef]
- Rao, H.M.; Khanna, R.; Zielinski, D.J.; Lu, Y.; Clements, J.M.; Potter, N.D.; Sommer, M.A.; Kopper, R.; Appelbaum, L.G. Sensorimotor learning during a marksmanship task in immersive virtual reality. Front. Psychol. 2018, 9, 58. [Google Scholar] [CrossRef]
Figure 1.
Static shoot.

Figure 2.
Dynamic scenario.

Figure 3.
Positive identification task.


Table 1.
Descriptive Statistics of All Variables of Officers (n = 33).
| Mean ± SD | Range | |
|---|---|---|
| Age (years) | 40.48 ± 6.66 | 29.00–52.00 |
| Weight (kg) | 100.60 ± 19.82 | 70.90–155.90 |
| Height (cm) | 180.42 ± 6.87 | 165.60–200.70 |
| BMI (kg/m2) | 30.76 ± 4.88 | 23.43–41.50 |
| Shuttles | 40.06 ± 19.75 | 14.00–85.00 |
| Vertical Jump (cm) | 46.82 ± 8.85 | 27.70–70.90 |
| Grip Strength (kg) | 51.82 ± 7.04 | 40.00–70.00 |
| Leg Dyno (kg) | 181.99 ± 29.08 | 104.33–263.08 |
| Static Shoot (%) | 82.58 ± 14.68 | 37.00–100.00 |
| Dynamic Scenario (%) | 74.27 ± 12.41 | 47.00–100.00 |
| Positive Identification Scenario (%) | 76.52 ± 34.76 | 0.00–100.00 |
| Total Score (%) | 77.79 ± 15.39 | 43.00–99.00 |
Table 2.
Shooting Scenario Pearson Correlations.
| Static Score | Scenario 1 | Scenario 2 | |
|---|---|---|---|
| Static Score | - | 0.314 | 0.281 |
| Dynamic Scenario | 0.314 | - | 0.177 |
| Positive Identification Scenario | 0.281 | 0.177 | - |
Table 3.
Pearson Correlation of Fitness Measures and Shooting Performance (n = 33).
| Shuttle Run | Vertical Jump (cm) | Grip Strength (kg) | Leg Dyno (kg) | |
|---|---|---|---|---|
| Static Score | 0.528 ** | 0.322 | −0.001 | 0.343 |
| Dynamic Scenario | 0.170 | −0.022 | −0.367 * | −0.069 |
| Positive Identification Scenario | 0.009 | 0.221 | 0.040 | 0.344 * |
| Total Score | 0.220 | 0.255 | −0.129 | 0.350 * |
** Correlation was significant at the 0.01 level (2-tailed). * Correlation was significant at the 0.05 level (2-tailed).
© 2019 by the authors. Licensee MDPI, Basel, Switzerland. This article is an open access article distributed under the terms and conditions of the Creative Commons Attribution (CC BY) license (http://creativecommons.org/licenses/by/4.0/).
Share and Cite
MDPI and ACS Style
Muirhead, H.; Orr, R.; Schram, B.; Kornhauser, C.; Holmes, R.; Dawes, J.J. The Relationship between Fitness and Marksmanship in Police Officers. Safety 2019, 5, 54. https://0-doi-org.brum.beds.ac.uk/10.3390/safety5030054
AMA Style
Muirhead H, Orr R, Schram B, Kornhauser C, Holmes R, Dawes JJ. The Relationship between Fitness and Marksmanship in Police Officers. Safety. 2019; 5(3):54. https://0-doi-org.brum.beds.ac.uk/10.3390/safety5030054
Chicago/Turabian StyleMuirhead, Hannah, Robin Orr, Ben Schram, Charlie Kornhauser, Ryan Holmes, and J. Jay Dawes. 2019. "The Relationship between Fitness and Marksmanship in Police Officers" Safety 5, no. 3: 54. https://0-doi-org.brum.beds.ac.uk/10.3390/safety5030054
Note that from the first issue of 2016, this journal uses article numbers instead of page numbers. See further details here.