The Effect of All-Terrain Vehicle Crash Location on Emergency Medical Services Time Intervals


Department of Emergency Medicine, Roy J. and Lucille A. Carver College of Medicine, 200 Hawkins Drive, Iowa City, IA 52242, USA
*
Author to whom correspondence should be addressed.
Safety 2019, 5(4), 73; https://doi.org/10.3390/safety5040073
Submission received: 16 September 2019
/
Revised: 18 October 2019
/
Accepted: 22 October 2019
/
Published: 25 October 2019
Abstract
:Over 100,000 all-terrain vehicle (ATV)-related injuries are evaluated in U.S. emergency departments each year. In this study, we analyzed the time intervals for emergency medical services (EMS) providers responding to ATV crashes in different location types. Data from the Iowa State Trauma Registry and a statewide ATV crash/injury database was matched with Iowa EMS Registry records from 2004–2014. Ground ambulance responses to 270 ATV crashes were identified, and response characteristics and time intervals were analyzed. Off-road crashes had a longer median patient access interval (p < 0.001) and total on scene interval (p = 0.002) than roadway crashes. Crashes in remote locations had a longer median patient access interval (p < 0.001) and total on scene interval (p < 0.001), but also a longer median on scene with patient interval (p = 0.004) than crashes in accessible locations. Fifteen percent of remote patient access times were >6 min as compared to 3% of accessible crashes (p = 0.0004). There were no differences in en route to scene or en route to hospital time. Comparisons by location type showed no differences in injury severity score or number of total procedures performed. We concluded that responding EMS providers had an increased length of time to get to the patient after arriving on scene for off-road and remote ATV crashes relative to roadway and accessible location crashes, respectively.
1. Introduction
All-terrain vehicle (ATV) crashes in the U.S. have accounted for over 11,000 fatalities over the past 20 years and about 100,000 emergency department (ED) visits annually, with over one-fifth of the fatalities involving children under 16 years of age [1]. The non-fatal injuries sustained are often serious, as demonstrated by a multicenter Pennsylvania study that found admitted pediatric ATV crash patients had a median hospital length of stay of three days with 29% being admitted to the intensive care unit [2].
Emergency medical services (EMS) providers have indicated that responding to off-road and remote ATV crashes, including those in dedicated off-highway vehicle (OHV) parks, is often more time consuming than other locations. For example, when referring to a National Forest ATV trail system, a provider stated “it’s just a slow process getting people out of there” [3]. Some parks have posted warnings that crash patients will be difficult to locate and access due to poor cell phone service and geographical barriers [4]. A Nevada State Recreational Area suggested that a sign be posted stating that “emergency responses can be delayed up to three hours. Please use caution and enter at your own risk” [5]. EMS responses to both medical and traumatic incidents on public trails and in wilderness areas have been noted to be uniquely challenging [6].
EMS providers document several key time intervals once activated. The interval between receipt of an emergency call and the arrival of the first EMS vehicle on the scene is referred to as response time [7,8]. Multiple factors have been associated with longer response times, including distance to the scene, chief complaint, time of day, crew workload in the previous hour, and degree of rurality [7,9,10]. Shorter EMS response times have been associated with decreased mortality, particularly for patients experiencing an out of hospital cardiac arrest [11,12,13,14].
Although response times are frequently studied and emphasized in quality measures, patient care cannot begin until providers leave their vehicle and arrive at the patient’s side [15]. This time interval between the first EMS vehicle arriving on the scene and providers arriving at the patient’s side is the patient access interval [8,15,16]. While it is often assumed to be negligible, it has been shown to be significantly longer in certain locations, such as urban high-rise dwellings, and when barriers are encountered on the scene [15,16,17].
The total time spent on scene includes both the patient access interval and the time providing medical care to the patient before departing the scene. A longer on scene interval has been associated with worse outcomes, including a higher mortality rate for penetrating trauma patients, when time on scene was >20 min as compared to <10 min [18,19]. EMS responses to patients in rural areas have been shown to have both longer on scene and overall transport times, and worse outcomes including a lower probability of survival for out-of-hospital cardiac arrest [9,10,20].
The impact of ATV crash location on emergency responses has not been well described. The aim of the current study was to quantify the time intervals required for EMS response to ATV crashes, and to examine factors that might impact those intervals.
2. Materials and Methods
2.1. Identifying EMS Responses to ATV Crashes
A database of off-road vehicle (ORV) crashes and injuries in Iowa called the Iowa Off-Road Vehicle (ORV) Database was created and coded as previously described in the literature [21,22,23]. The database includes data from the Iowa State Trauma Registry (STR), the Iowa Department of Transportation, and the Iowa Department of Natural Resources for 2002–2013. Geospatial mapping of these cases has been previously published [23]. The current study utilized ORV database records from 2004–2013 and additional STR data from 2014.
To identify corresponding EMS records for these crash records, Iowa EMS Registry data was requested from the Iowa Department of Public Health based on queries using two sets of e-codes. For 2004–2008, the EMStat™ e-codes 15 (machinery accidents), 17 (MVC non-public/off road), 18 (MVC public road), and 28 (motorcycle collision) were used [24]. For 2009–2014, the query used the National EMS Information System (NEMSIS) variable “cause of injury” with values 9580 (machinery accident), 9590 (non-motorized vehicle accident), 9595 (motor vehicle traffic accident), and 9600 (motorcycle accident) [25].
EMS registry records corresponding to the ORV crash and injury database were identified by matching the two datasets by patient name, gender, date of birth, crash date, and the county where the crash occurred using Link Plus Version 2.0 (Centers for Disease Control and Prevention, Atlanta, Georgia, USA) with a threshold value of 7.0 [26]. A manual review of matches with lower scores was then performed to identify additional matches not previously identified.
2.2. Inclusion and Exclusion
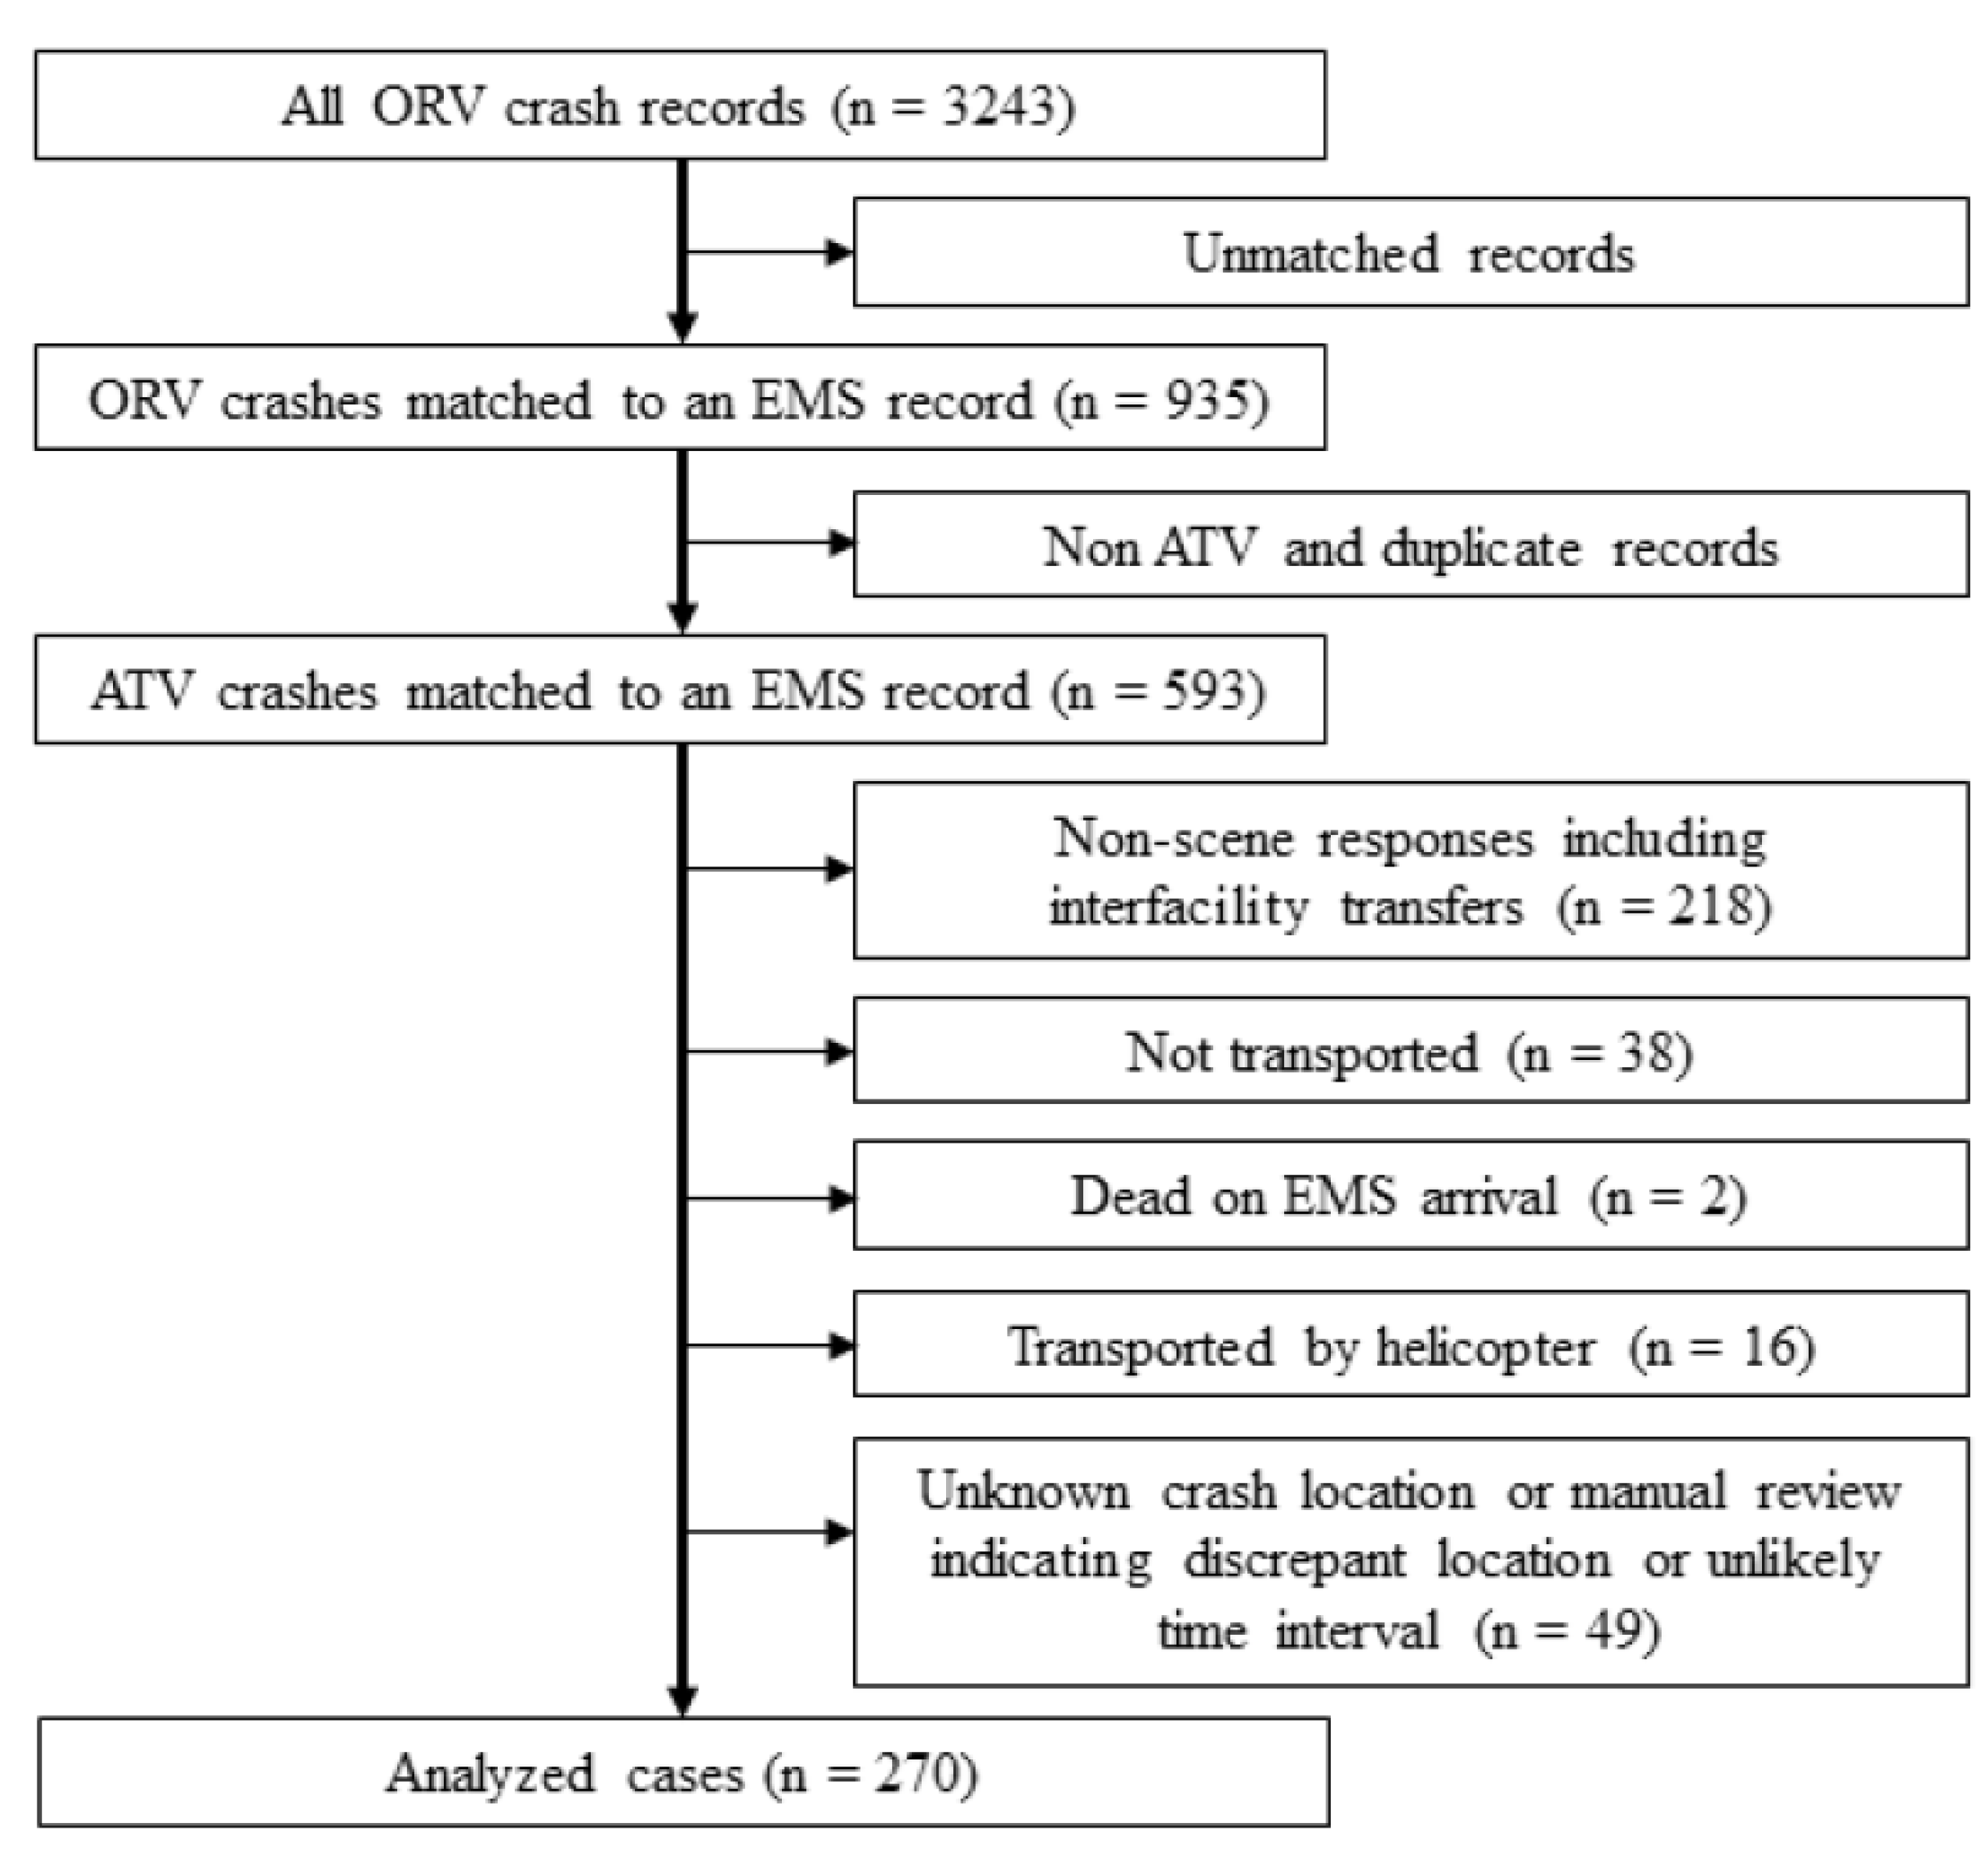
Figure 1 is a flowchart illustrating case selection. Of the 3243 cases in the ORV crash database, 935 had a matching record in the EMS dataset. Of these, 593 were unique ATV crashes. Further exclusion criteria were non-scene responses (e.g., interfacility transfers), patients that were not transported or were dead on arrival at the scene, helicopter transports, EMS records reporting unlikely time intervals (defined as a total on scene time of zero), and records with unknown crash locations or irreconcilable location discrepancies between the two datasets. With respect to location discrepancies, location-related data including crash addresses and ORV database narrative comments were manually reviewed to resolve discrepancies between the two data sources. Cases were excluded if there were incompatible location types recorded, such as an EMS record with “roadway” but an ORV crash record with “off-road” without information in the crash narrative to explain the discrepancy. After inclusion and exclusion criteria were applied, 270 cases were included in the final analysis.
2.3. Study Variables
Person-related variables used in this study were the patient’s sex, age, initial Glasgow Coma Scale (GCS) score, Injury Severity Score (ISS), and mortality. Age was categorized as younger than 16 years, 16–35 years, or older than 35 years to represent patients who were pre-driver’s license, young adults, and older adults. Total GCS score was categorized as normal (15) or abnormal (<15). ISS was categorized as severe injury (>15) or less-severe injury (≤15) [27,28].
Crash-related variables used were whether the crash occurred on or off the roadway, the rurality of a crash location, the type of crash location, and the remoteness of the location. Rurality coding was coded as Urban, Large Rural, Small Rural, and Isolated Rural based on the crash location zip code using the Rural Urban Commuting Area Codes (RUCA) 2.0 as previously described [29,30]. Crash locations were categorized as remote if in a recreation or wilderness area (but not related to organized racing), or described as in a field, mine, creek, waterway, woods, or ravine, on an ATV or nature trail, or more than 500 feet from a road. All locations not coded as remote were coded as accessible.
EMS response-related variables were type of service requested, type of responding vehicle, highest certification level of responder, whether the patient was transported, types of treatment provided, and the number of patients at the scene. There were a small number of responding providers labeled as “critical care” in the EMS record (n = 15); these were grouped with ALS providers.
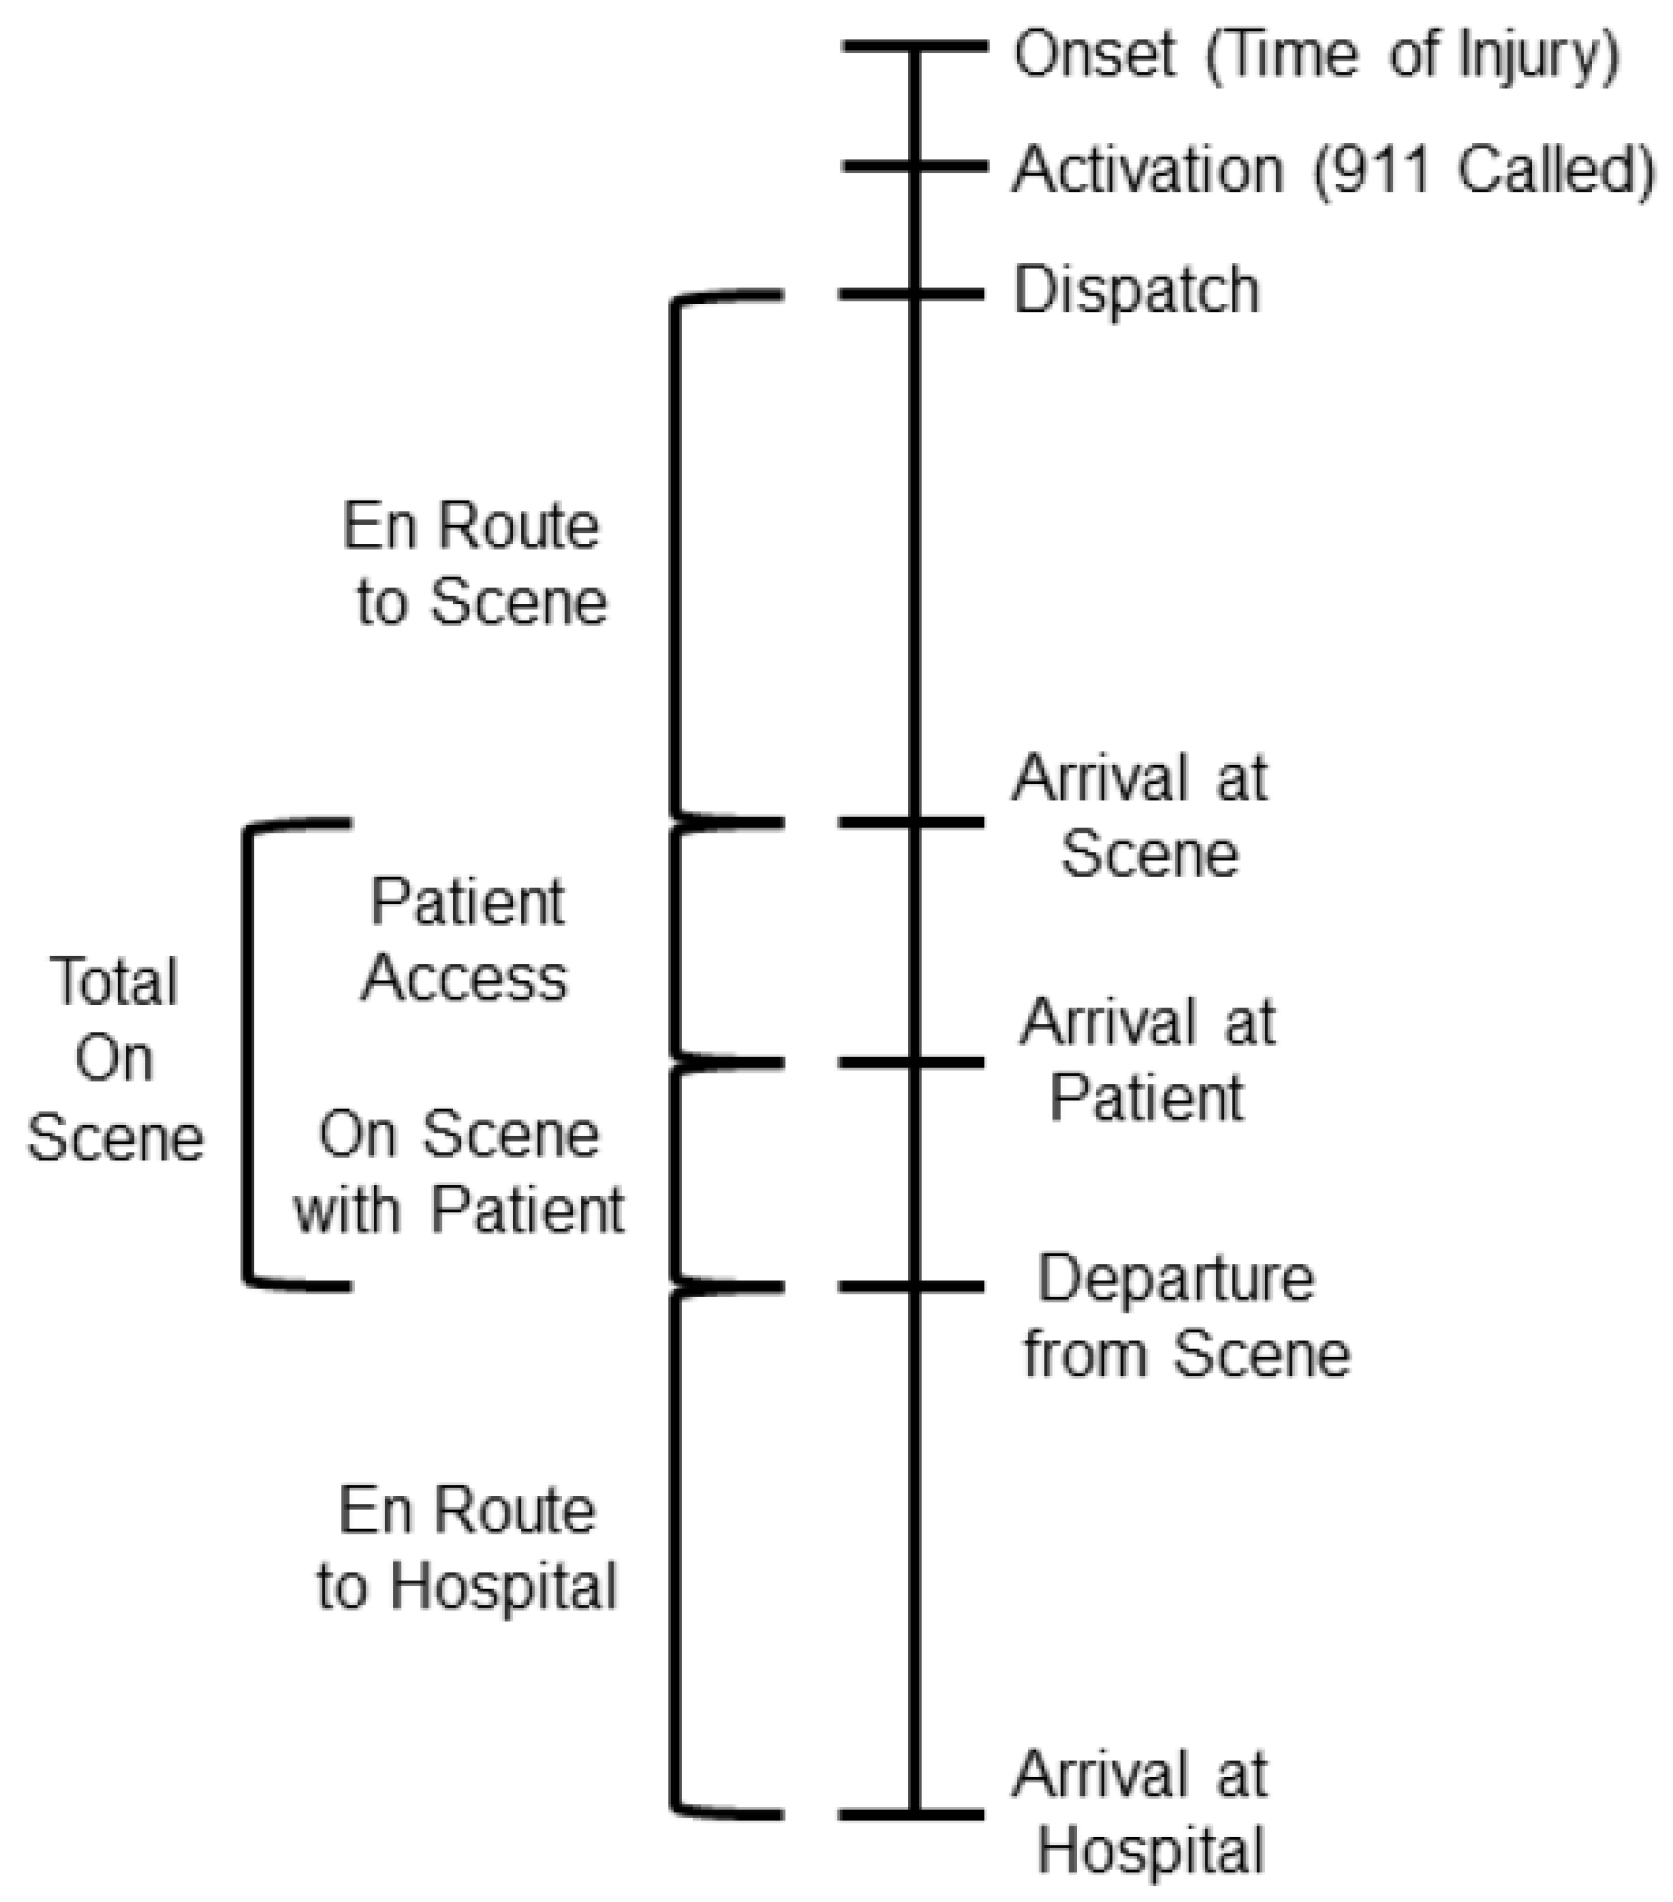
Other data utilized were the time (hour and minutes) at onset (time injury occurred), activation (time 911 was called), dispatch (time the EMS crew was notified), arrival at the scene, arrival at the patient’s side, departure from the scene, and arrival at the receiving facility. These EMS times were used to calculate time intervals (Figure 2).
Treatment and treatment index variables from the EMS Registry were used to determine the total number of treatments attempted by EMS and whether extrication, spinal immobilization (cervical collar, short board, and/or long board placed), intravenous access (including intra-osseous access), cardiac monitoring, intubation, or cardiopulmonary resuscitation was performed. Total number of treatments attempted was categorized as minimal (0–1) or multiple (2–8). Multiple attempts or occurrences of the same treatment were counted as one treatment because multiple attempts or occurrences were not reported for some study years. There were eight crashes documented as involving multiple patients, but this specific variable was not analyzed, as it was poorly documented and not reported prior to 2008. The STR variables for hospital days and intensive care unit (ICU) days were utilized and categorized as one or more hospital days, two or more hospital days, and one or more ICU days.
2.4. Data Analysis
We used SPSS Version 25 (IBM Statistics Package for the Social Sciences, Armonk, New York, USA) to perform all analyses. The mean, standard deviation, and median with interquartile range (IQR) for time intervals were calculated. The medians of continuous variables were compared using the Kruskal-Wallis H test. Frequencies were calculated for categorical variables and comparisons were performed using the chi-square test or Fisher’s Exact Test with a two-tailed significance level defined as p < 0.05.
3. Results
3.1. EMS Response Characteristics
Patient, location, and EMS response characteristics were determined for the study population (Table 1). More than three-fifths of ATV crashes occurred off-road, and over one-fifth were in remote locations including recreation areas (50%), farms (13%), and wilderness areas (10%). About one-third of patients had an abnormal GCS, 27% had an ISS > 15, and 5% were fatalities. Over 70% of patients received two or more treatments.
3.2. Characteristics by Crash Location
Roadway crashes had a greater proportion of patients with an abnormal GCS score (p = 0.003) and a higher proportion of fatalities (p = 0.00027) than crashes off the road (Table 2), with no other significant differences. A greater proportion of remote patients than accessible patients underwent spinal immobilization (76% versus 60%, p = 0.025) and IV placement (69% versus 54%, p = 0.045) with no differences in other procedures (data not shown) or total number of treatments (Table 2).
3.3. Time Interval Comparisons by Crash Location
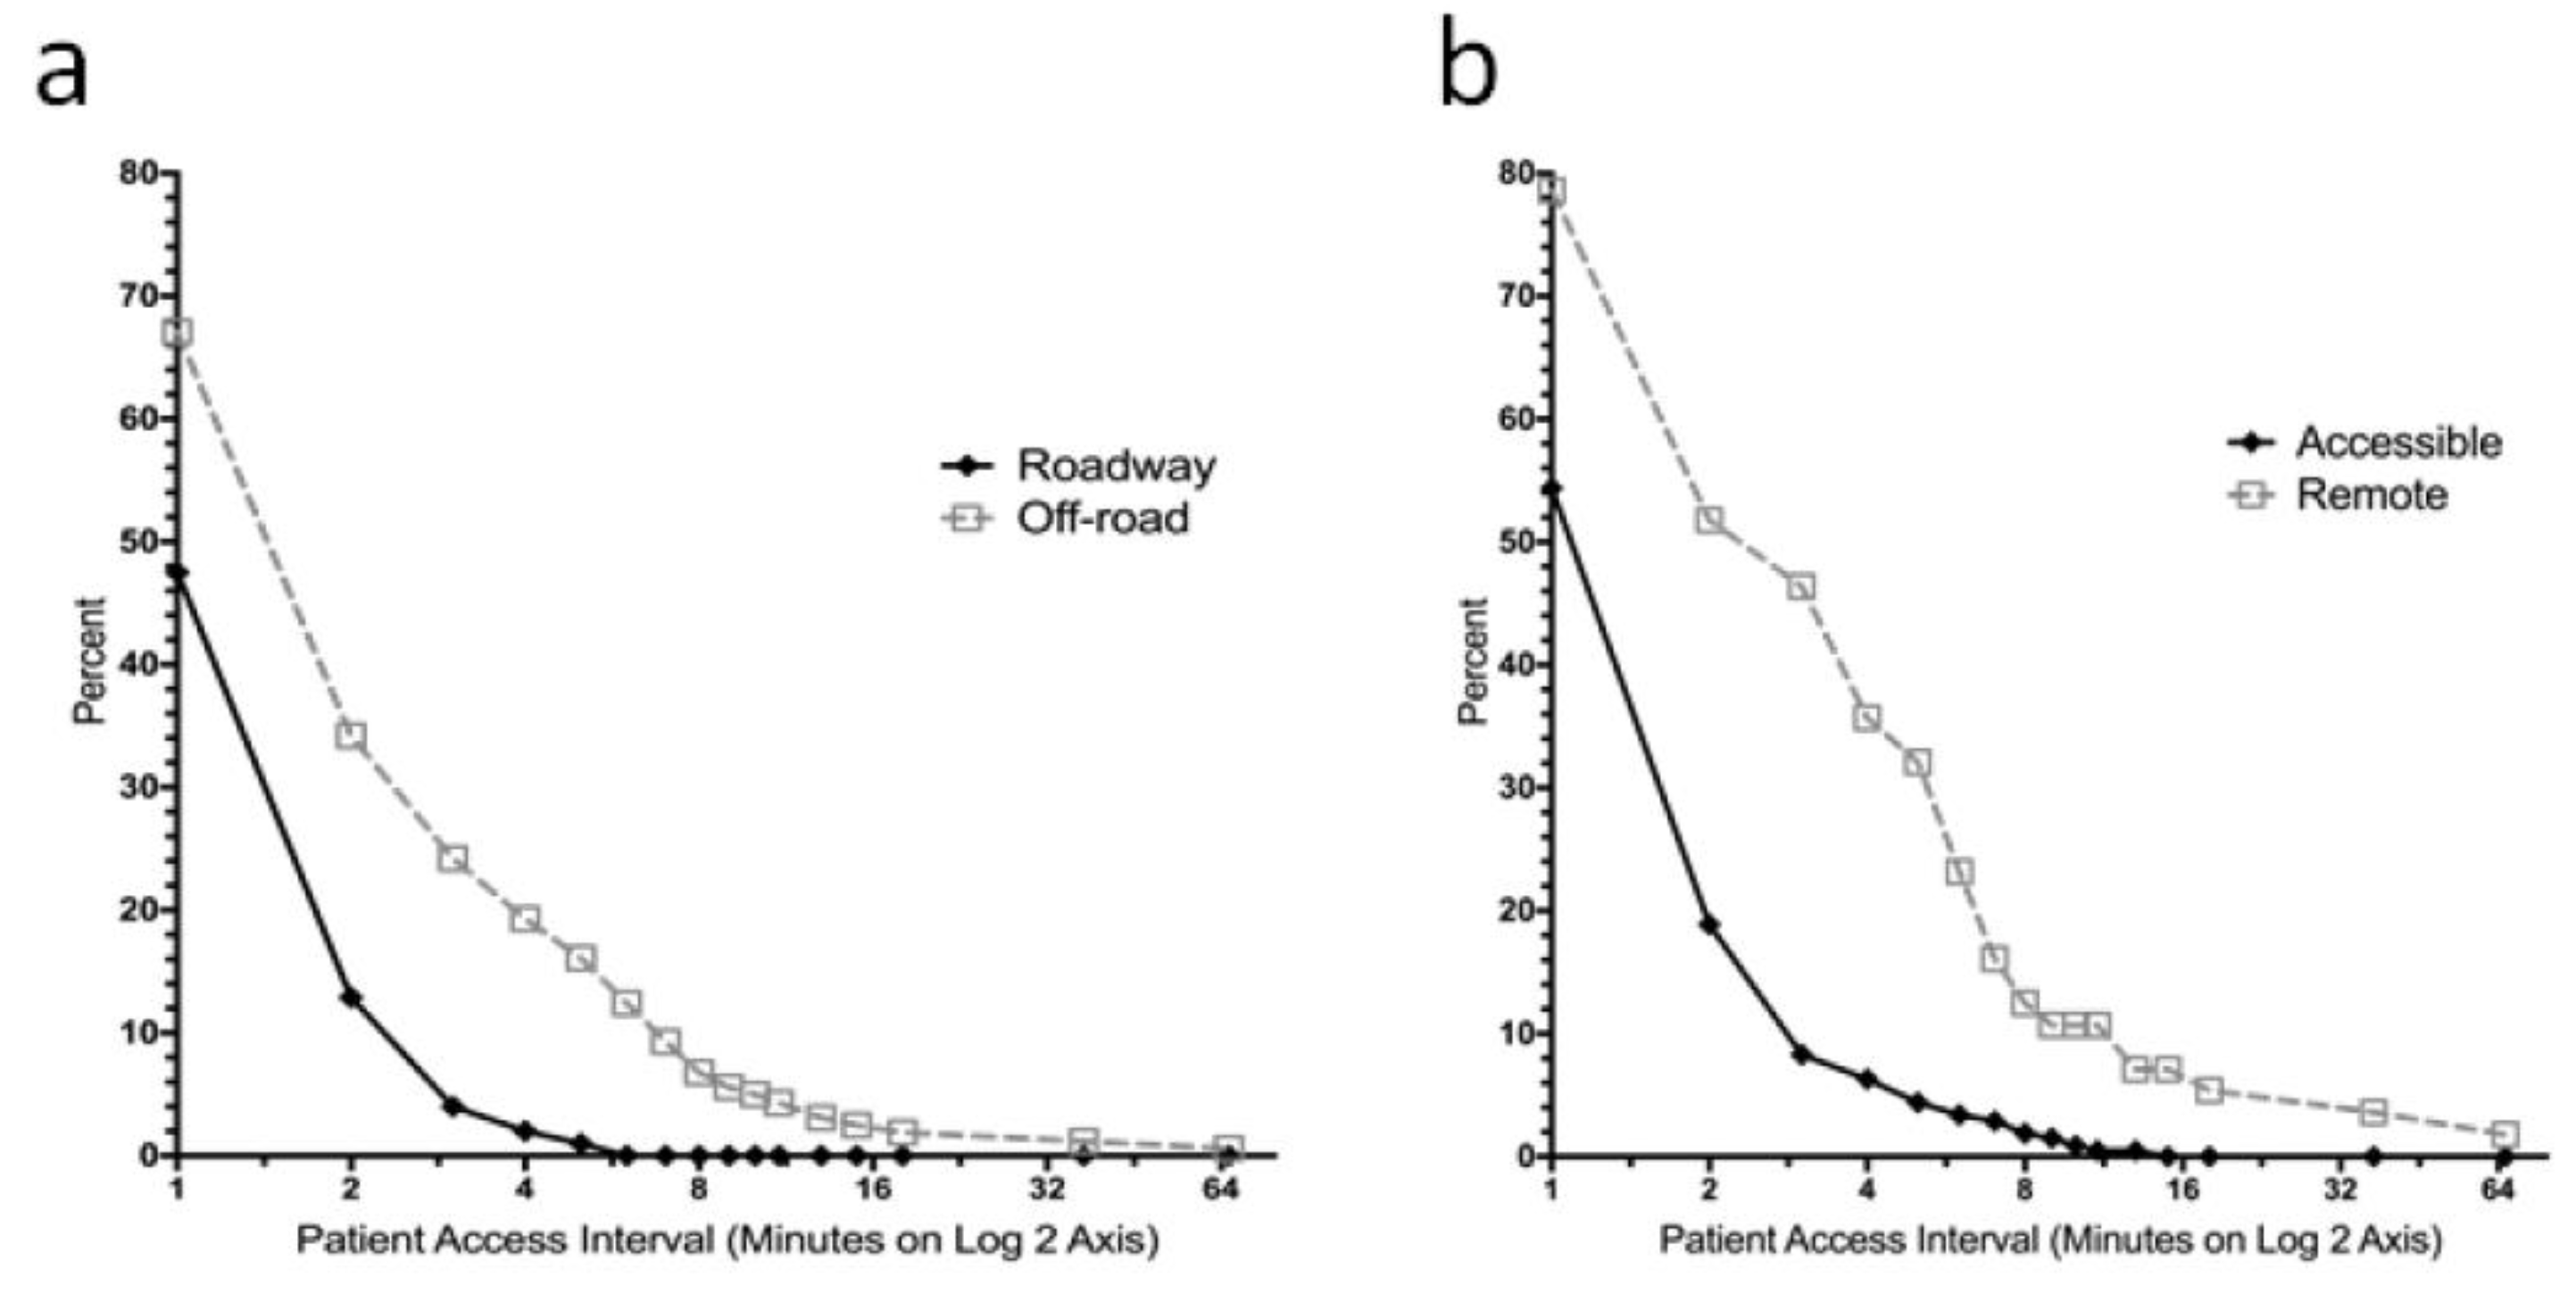
Off-road crashes had a significantly longer patient access interval (p < 0.001) and total on scene interval (p = 0.002) than roadway crashes (Table 3). Figure 3a illustrates the differences in distribution of patient access interval length as a proportion of responses exceeding specific times (in minutes) for roadway versus off-road crashes. Twelve percent (19/161) of off-road patient access times were longer than six minutes, compared to none of the 101 patient access times for roadway crashes. There were no differences between roadway and off-road crashes in the intervals representing time en route to the scene, time on scene with the patient, or time en route to the hospital.
Remote crashes also had a significantly longer patient access interval (p < 0.001) and total on scene interval (p < 0.001). The differences in distribution of patient access interval length for remote versus accessible crashes are shown in Figure 3b. In addition, crashes in remote areas had a longer time on scene with the patient as compared to crashes in accessible locations (p = 0.004). For remote crash patient access times, 23% (13/56) were longer than six minutes, whereas only 3% (7/206) of accessible crash patient access times were more than 6 min long (p < 0.0001). The specific locations with the longest median patient access interval were wilderness areas (4 min) and OHV parks (3 min). These median times were longer than for farms (1 min) and private residences (1 min).
3.4. Patient Outcomes by Crash Location
Hospital and ICU length of stay was only available for patients identified using STR records (240/270 = 89%), of which 119 (50%) had a hospital stay of one or more days and 29 (12%) had at least one ICU day (Table 4). Remote crashes had a higher proportion of patients admitted to the hospital for two or more days than accessible crashes (46% versus 30%, p = 0.022). However, there was no difference in the proportion of patients with an ICU stay between remote and accessible crashes, and no difference in the proportion of patients with an ICU or hospital stay between roadway and off-road crashes.
4. Discussion
4.1. Patient Access Interval
Our study demonstrated significant differences in the length of time required for EMS to reach ATV crash patients after arriving on scene in off-road and remote locations compared to those on roadways and in accessible locations, respectively. Previous studies focused on the effect of patient location on EMS patient access times in urban settings. Morrison et al. reported longer median patient access times for patients in apartment buildings as compared to other locations (2.1 versus 1.1 min) and those three or more stories above ground compared to two or less (2.5 versus 1.1 min), noting barriers such as elevators that were unavailable or too small, and missing signs or entry codes [16]. Another study found that median patient access times at scenes where patient extrication was required, police were securing the scene, or doors, gates, stairs, elevators, bystander interference, or inclement weather were present had longer access times than scenes without such barriers (2.3 versus 0.8 min) [15]. In addition, patient access times were longer than 4.1 min in a quarter of the cases with scene barriers.
A possible explanation for longer remote and off-road patient access times in our study includes difficulty locating patients or logistical challenges trying to reach them due to the terrain. Although the barriers faced are likely different, our findings suggest that the association seen between location type and the length of the patient access intervals in urban settings may also be true of remote and off-road locations [15,16,17]. Further work is needed to identify specific barriers and their impact on patient access times in ATV crashes.
Although the small difference in median patient access interval between off-road and roadway crashes (1.0 versus 0.0 min) is unlikely to be clinically significant in all cases, at least some of the 12% of intervals that were 6–66 min in length may be of concern. Likewise, the difference in median patient access times between remote and accessible crash locations was again small (2.0 versus 1.0 min), but nearly a quarter of remote crash access times were 6–66 min.
The effect of a prolonged patient access interval on patient outcomes is unknown and has not been previously investigated. However, its importance in the context of meeting EMS response time goals for the initiation of patient care has been illustrated. Campbell et al. showed that responders met the EMS service’s goal of arriving at the scene in less than 9 min for over 90% of their level one calls. However, when the patient access interval was included in the response time to reflect the total time from dispatch to the initiation of patient care, less than 64% of responses were still under nine minutes [31].
In this study, we found that remote crash patients had a higher proportion of hospital stays lasting two or more days as compared to accessible crash victims. Possible reasons for this finding might include different injury types and severity in remote versus accessible crashes that require longer hospital stays. However, it is possible that increased EMS patient access time intervals and extraction times for remote ATV crash victims may have a clinical impact on patient outcome. Further research is needed to identify the actual contributors for the length of stay difference found in the current study.
4.2. Comparisons by Crash Location
Studies of ATV crashes by location have been previously performed, with an emphasis on comparing off-road and roadway crashes. Analyses of U.S. Consumer Product Safety Commission data have shown that roadway crashes, on both paved and unpaved roads, accounted for over 60% of all fatalities overall, including 57% of pediatric deaths [32,33,34]. In prior Iowa ORV studies, 38% of non-fatal crashes were on roadways, and roadway crashes had higher ISS scores, significantly lower helmet use, and higher likelihood of head injury than those off-road [21,32,34]. The current study demonstrated a similar percentage of roadway crashes (39%), but did not demonstrate any differences in ISS between crash locations, although there were more abnormal GCS scores in those who crashed on roadways.
Iowa OHV parks were previously found to be the location of 6% of off-road crashes in the state. Park crashes were more likely to involve adult riders (≥16 years old) and have jump-related mechanisms than other off-road crashes. In addition, 90% of crash patients in Iowa OHV parks (where helmets are required and rules are enforced) were helmeted and no severe head injuries were recorded [22].
4.3. On Scene Interval
The total time spent on scene for EMS crews responding to off-road crashes was longer than for roadway crashes, but the time spent with the patient was not significantly different. This suggests that longer on scene times were predominately due to longer patient access times. In contrast to off-road crashes, time spent with patients crashing in remote areas prior to scene departure was longer than for accessible settings. Thus, both patient access time and time spent with the patient contributed to longer total on scene times.
Remote crashes had a higher percentage of patients undergoing spinal immobilization and IV access, which could help explain a longer time on scene with the patient if they were performed prior to transport. However, there was no difference in the proportion of patients undergoing more than one procedure compared to accessible crashes, and no differences in injury severity by ISS or GCS. This suggests that neither injury severity nor a high number of interventions were responsible for longer scene time. We hypothesize that the longer total on scene times for patients in remote locations versus accessible ones might be due to the challenges of transporting the patient from the crash site to the ambulance prior to departure.
4.4. Practical Implications
The dangers of ATV use on roadways have been shown repeatedly, and recreation area and OHV park use has been encouraged as an alternative [21,22,32,33,34]. However, a significant number of crashes resulting in injury still occurred in off-road and remote areas, including OHV parks. From the perspective of EMS response, these locations may benefit from different strategies and interventions to improve timeliness of EMS access. Technological aids such as personal locator beacons (PLBs), which transmit a distress frequency using global positioning system (GPS) satellites, have been used successfully to aid EMS responders in finding ATV crash patients and stranded mountain hikers [35,36,37,38]. PLBs are not used by most ATV users, but perhaps should be. Some EMS groups have used off-road rescue vehicles in an attempt to improve their ability to access remote patients [3,39,40]. Rigorous training on the use of these vehicles and strict safety protocols are needed to minimize the risk to patients and to providers dealing with challenging terrain. Further study is needed to determine if implementing these aids is beneficial to EMS or improves patient outcomes.
4.5. Limitations
Our study was subject to general limitations common to the majority of retrospective analyses. This included utilization of records that may have missing or incorrect values for some variables and datasets that may not capture all cases during the study period. In addition, the data sources are from a single state, and the statewide EMS Registry does not include records from every EMS provider.
Specific limitations were incomplete documentation of relevant variables in the data sources utilized (although most variables were well-documented), a change in the e-codes used in the EMS Registry at a midpoint in the study period, and variability from year to year in EMS variables collected by the registry. Because of this, we were unable to determine the number of times a treatment or procedure was attempted, the length of time it took, or the timing relative to the time of scene departure (and therefore, whether it occurred on scene or during patient transport). However, there were no significant differences in total number of interventions performed between off-road and roadway crashes or remote and accessible crashes. Second, we were unable to compare some factors known to affect time on scene, such as the number of responding crew members [41]. Third, although we would hypothesize that longer EMS time intervals might contribute to worse patient outcomes, other than mortality proportions, we were only able to compare indirect outcome measures including hospital and ICU length of stay. Fourth, we were unable to determine if any adjuncts such as off-road vehicles were used to transport patients from the crash site to the ambulance, as this was not documented and we did not have access to the full EMS narrative. However, even if the use of these adjuncts is assumed, off-road and remote crashes still had longer patient access times. Taken together, these considerations may limit the generalizability of our results.
5. Conclusions
It took longer for EMS providers to reach off-road and remote ATV crash patients than roadway and accessible location patients, respectively, once they arrived on the scene. EMS providers also spent more time on the scene with off-road and remote ATV crash patients. Further research is needed to determine the specific factors that account for these time interval differences and how they might impact patient outcomes. However, it is likely that difficulties locating patients and logistical challenges trying to reach them and extract them from the crash scene contribute. A better understanding of the challenges faced when responding to various ATV crash locations may foster the development of strategies to improve the ability of EMS to respond to these crashes.
Author Contributions
B.M.W. was primarily responsible for data curation, performing initial analysis, and creating first drafts of the tables, figures, and manuscript. G.M.D. helped with data curation, formal analysis, as well as in the creation of final tables, figures, and reviewing and editing of the manuscript. C.A.J. was primarily responsible for the final study methodology and data acquisition, and significantly contributed to data interpretation and reviewing and editing of the completed manuscript for submission.
Funding
This research received no external funding.
Acknowledgments
Support for these studies was provided by the Department of Emergency Medicine at the University of Iowa.
Conflicts of Interest
The authors declare no conflict of interest.
References
- U.S. Consumer Product Safety Commission. Annual Report of ATV-Related Deaths and Injuries. 2016. Available online: https://www.cpsc.gov/s3fs-public/atv_annual_Report_2016.pdf?vIcLfTM9VNDc23qe6FQyhJq7A7454xCr (accessed on 10 January 2019).
- Garay, M.; Hess, J.; Armstrong, D.; Hennrikus, W. Pediatric ATV injuries in a statewide sample: 2004 to 2014. Pediatrics 2017, 140, 1–7. [Google Scholar] [CrossRef] [PubMed]
- Safety Officials Concerned with ATV Trail Where Chattooga County Woman Killed. Times Free Press. 2012. Available online: https://www.timesfreepress.com/news/news/story/2012/apr/03/whitfield-county-woman-dies-after-atv-fall/74525/ (accessed on 10 January 2019).
- Stanislaus County Department of Parks and Recreation. FAQ for Off-Highway Vehicle Parks. 2016. Available online: https://www.stancounty.com/parks/pdf/faq%20ohv%20parksstanco.pdf (accessed on 4 January 2019).
- Nevada Department of Conservation and Natural Resources. Application to the State of Nevada Off-Highway Vehicles Program. 2017. Available online: https://ohv.nv.gov/assets/etc/pdfs/Lyon_Co._Walker_River_SRA_Initiative_pdf (accessed on 10 January 2019).
- Baker, J.; Pat McKay, M. Analysis of emergency medical services activations in Shenandoah National Park from 2003 to 2007. Prehosp. Emerg. Care 2010, 14, 182–186. [Google Scholar] [CrossRef] [PubMed]
- Nehme, Z.; Andrew, E.; Smith, K. Factors influencing the timeliness of emergency medical service response to time critical emergencies. Prehosp. Emerg. Care 2016, 20, 783–791. [Google Scholar] [CrossRef] [PubMed]
- Bigdeli, M.; Khorasani-Zavareh, D.; Mohammadi, R. Pre-Hospital care time intervals among victims of road traffic injuries in Iran: A Cross-Sectional study. BMC Public Health 2010, 10. Available online: http://0-www-biomedcentral-com.brum.beds.ac.uk/1471-2458/10/406 (accessed on 10 January 2019). [CrossRef]
- Yeap, E.E.; Morrison, J.J.; Apodaca, A.N.; Egan, G.; Jansen, J.O. Trauma care in Scotland: Effect of rurality on ambulance travel times and level of destination healthcare facility. Eur. J. Trauma Emerg. Surg. 2014, 40, 295–302. [Google Scholar] [CrossRef]
- Grossman, D.C.; Kim, A.; Macdonald, S.C.; Klein, P.; Copass, M.K.; Maier, R.V. Urban-rural differences in prehospital care of major trauma. J. Trauma 1997, 42, 723–729. [Google Scholar] [CrossRef]
- Pell, J.P.; Sirel, J.M.; Marsden, A.K.; Ford, I.; Cobbe, S.M. Effect of reducing ambulance response times on deaths from out of hospital cardiac arrest: Cohort study. BMJ 2001, 322, 1385–1388. [Google Scholar] [CrossRef]
- Rajan, S.; Wissenberg, M.; Folke, F.; Hansen, S.M.; Gerds, T.A.; Kragholm, K.; Hansen, C.M.; Karlsson, L.I.M.; Lippert, F.K.; Køber, L.; et al. Association of bystander cardiopulmonary resuscitation and survival according to ambulance response times after out-of-hospital cardiac arrest. Circulation 2016, 134, 2095–2104. [Google Scholar] [CrossRef]
- O’Keeffe, C.; Nicholl, J.; Turner, J.; Goodacre, S. Role of ambulance response times in the survival of patients with out-of-hospital cardiac arrest. Emerg. Med. J. 2011, 28, 703–706. [Google Scholar] [CrossRef]
- Jena, A.B.; Mann, N.C.; Wedlund, L.N.; Olenski, A. Delays in emergency care and mortality during major U.S. marathons. N. Engl. J. Med. 2017, 376, 1441–1450. [Google Scholar] [CrossRef]
- Campbell, J.P.; Gratton, M.C.; Salomone, J.A.; Watson, A.W. Ambulance arrival to patient contact: The hidden component of prehospital response time intervals. Ann. Emerg. Med. 1993, 22, 1254–1257. [Google Scholar] [CrossRef]
- Morrison, L.J.; Angelini, M.P.; Vermeulen, M.J.; Schwartz, B. Measuring the EMS patient access time interval and the impact of responding to high-rise buildings. Prehosp. Emerg. Care 2005, 9, 8–14. [Google Scholar] [CrossRef] [PubMed]
- Kobayashi, D.; Kitamura, T.; Kiyohara, K.; Nishiyama, C.; Hayashida, S.; Fujii, T.; Izawa, J.; Shimamoto, T.; Matsuyama, T.; Hatakeyama, T.; et al. High-rise buildings and neurologically favorable outcome after out-of-hospital cardiac arrest. Int. J. Cardiol. 2016, 224, 178–182. [Google Scholar] [CrossRef] [PubMed]
- McCoy, C.E.; Menchine, M.; Sampson, S.; Anderson, C.; Kahn, C. Emergency medical services out-of-hospital scene and transport times and their association with mortality in trauma patients presenting to an urban level I trauma center. Ann. Emerg. Med. 2013, 61, 167–174. [Google Scholar] [CrossRef]
- Brown, J.B.; Rosengart, M.R.; Forsythe, R.M.; Reynolds, B.R.; Gestring, M.L.; Hallinan, W.M.; Peitzman, A.B.; Billiar, T.R.; Sperry, J.L. Not all prehospital time is equal: Influence of scene time on mortality. J. Trauma Acute Care Surg. 2016, 81, 93–100. [Google Scholar] [CrossRef]
- Mathiesen, W.T.; Bjørshol, C.A.; Kvaløy, J.T.; Søreide, E. Effects of modifiable prehospital factors on survival after out-of-hospital cardiac arrest in rural versus urban areas. Crit. Care 2018, 22, 99. [Google Scholar] [CrossRef] [Green Version]
- Denning, G.; Jennissen, C.; Harland, K.; Ellis, D.; Buresh, C. All-terrain vehicles (ATVs) on the road: A serious traffic safety and public health concern. Traffic Inj. Prev. 2013, 14, 78–85. [Google Scholar] [CrossRef]
- Denning, G.; Jennissen, C.; Harland, K.; Ellis, D.G.; Buresh, C.T. Off-highway vehicle parks: Combining environment, knowledge, and enforcement for all-terrain vehicle injury prevention. Accid. Anal. Prev. 2013, 52, 64–70. [Google Scholar] [CrossRef]
- Qin, E.S.; Jennissen, C.A.; Wadman, C.A.; Denning, G.M. Using Geospatial Mapping to Determine the Impact of All-Terrain Vehicle Crashes on Both Rural and Urban Communities. West. J. Emerg. Med. 2017, 18, 913–922. [Google Scholar] [CrossRef] [Green Version]
- MedMedia First Aid for Data Collection. EM Stat Database Dictionary: Version 3.1. 2004. [Google Scholar]
- National Highway Traffic Safety Administration (NHTSA) EMS Division. NHTSA Uniform Pre-Hospital Emergency Medical Services (EMS) Dataset: Version 2.2; National Highway Traffic Safety Administration (NHTSA): Washington, DC, USA, 2005.
- Registry Plus(TM) Link Plus. 2.0 ed: Centers for Disease Control and Prevention. Available online: https://www.cdc.gov/cancer/npcr/tools/registryplus/lp.htm (accessed on 10 January 2019).
- Baker, S.P.; O’Neill, B.; Haddon, W.; Long, W.B. The injury severity score: A method for describing patients with multiple injuries and evaluating emergency care. J. Trauma 1974, 14, 187–196. [Google Scholar] [CrossRef]
- Copes, W.S.; Champion, H.R.; Sacco, W.J.; Lawnick, M.M.; Keast, S.L.; Bain, L.W. The Injury Severity Score revisited. J. Trauma 1988, 28, 69–77. [Google Scholar] [CrossRef] [PubMed]
- WWAMI RUCA Rural Health Research Center. RUCA Data: ZIP Code RUCA Approximation. 2004. Available online: http://depts.washington.edu/uwruca/ruca-approx.php (accessed on 10 January 2019).
- Harland, K.K.; Greenan, M.; Ramirez, M. Not just a rural occurrence: Differences in agricultural equipment crash characteristics by rural-urban crash site and proximity to town. Accid. Anal. Prev. 2014, 70, 8–13. [Google Scholar] [CrossRef] [PubMed]
- Campbell, J.P.; Gratton, M.C.; Salomone, J.A.; Lindholm, D.J.; Watson, W.A. System implications of the ambulance arrival-to-patient contact interval on response interval compliance. Prehosp. Disaster Med. 1994, 9, 230–232. [Google Scholar] [CrossRef] [PubMed]
- Denning, G.M.; Harland, K.K.; Ellis, D.G.; Jennissen, C.A. More fatal all-terrain vehicle crashes occur on the roadway than off: Increased risk-taking characterises roadway fatalities. Inj. Prev. 2013, 19, 250–256. [Google Scholar] [CrossRef] [PubMed]
- Denning, G.M.; Jennissen, C.A. All-terrain vehicle fatalities on paved roads, unpaved roads, and off-road: Evidence for informed roadway safety warnings and legislation. Traffic Inj. Prev. 2016, 17, 406–412. [Google Scholar] [CrossRef]
- Denning, G.M.; Harland, K.K.; Jennissen, C.A. Age-based risk factors for pediatric ATV-related fatalities. Pediatrics 2014, 134, 1094–1102. [Google Scholar] [CrossRef]
- The Gisborne Herald. Beacon Brings Rescuers to Injured Farmer: Quad Bike Accident on Farm near Wairoa. 2017. Available online: http://gisborneherald.co.nz/localnews/3144234-135/beacon-brings-rescuers-to-injured-farmer (accessed on 10 January 2019).
- Almanack, A.; Lynch, M. Personal Locator Beacon Key to Mount Marcy Rescue. 2016. Available online: https://www.adirondackalmanack.com/2016/02/locator-beacon-key-to-marcy-rescue.html (accessed on 10 January 2019).
- Maritime New Zealand. Distress Beacon and Helmet Save Injured Farmer and Dogs from Bull Attack. 2018. Available online: https://www.maritimenz.govt.nz/public/news/media-releases-2018/20180202b.asp (accessed on 10 January 2019).
- PLB Usage Grows in U.S. More Rescues Credited to the Use of the Satellite Detectable Locator Beacons; BusinessWire: Fort Lauderdale, FL, USA, 2008; Available online: https://www.businesswire.com/news/home/20080410005115/en/PLB-Usage-Grows-U.S. (accessed on 10 January 2019).
- Knight, T. ATV Rider Crashes and Man Falls off Cliff over Holiday Weekend in FULTON. Watershed Post. 2016. Available online: http://www.watershedpost.com/2016/atv-rider-crashes-and-man-falls-cliff-over-holiday-weekend-fulton (accessed on 10 January 2019).
- Lehman, D. BLOG: Busy Season on the Trails. The Post Star. 2018. Available online: https://poststar.com/blogs/don_lehman/blog-new-winter-tourism-site-for-when-snow-arrives/article_6e4e8ca2-0e9d-11e9-91d0-07622a8da2c6.html (accessed on 10 January 2019).
- Brown, L.H.; Owens, C.F., Jr.; March, J.A.; Archino, E.A. Does ambulance crew size affect on-scene time or number of prehospital interventions? Prehosp. Disaster Med. 1996, 11, 214–217. [Google Scholar] [CrossRef]
Figure 1.
Flow diagram of stepwise inclusion (left) and exclusion criteria (right). Unlikely time interval was defined as total on scene time of zero. ORV: off-road vehicle; EMS: emergency medical services; ATV: all-terrain vehicle.
Figure 1.
Flow diagram of stepwise inclusion (left) and exclusion criteria (right). Unlikely time interval was defined as total on scene time of zero. ORV: off-road vehicle; EMS: emergency medical services; ATV: all-terrain vehicle.

Figure 2.
Timeline of Emergency Medical Services (EMS) documented time points (right side of the timeline) with the calculated time intervals utilized in the study (left side of the timeline).
Figure 2.
Timeline of Emergency Medical Services (EMS) documented time points (right side of the timeline) with the calculated time intervals utilized in the study (left side of the timeline).

Figure 3.
Comparison of the differences in distribution of the length of the EMS patient access interval between (a) off-road and roadway and between (b) remote and accessible ATV crashes. The graph shows the percentage of responses with a patient access interval greater than or equal to the specified time in minutes, with time displayed on a log base two axis.


Table 1.
Patient, injury severity, crew, crash location, and treatment characteristics of emergency medical services (EMS) responses to all-terrain vehicle crashes recorded in the Iowa EMS Registry (2004–2014) and identified using the Iowa Off-Highway Vehicle Database (2004–2013) and the Iowa State Trauma Registry for 2014.
| Sex | n (Col %) 1 | Roadway | n (Col %) 1 |
|---|---|---|---|
| Male | 189 (77%) | Off | 166 (61%) |
| Female | 57 (23%) | On | 104 (39%) |
| Age (years old) | Location | ||
| <16 | 58 (22%) | Remote | 58 (21%) |
| 16–35 | 121 (45%) | Accessible | 212 (79%) |
| 36 and older | 91 (34%) | Spinal Immobilization | |
| GCS | Yes | 171 (63%) | |
| <15 | 76 (32%) | No | 99 (37%) |
| 15 | 159 (68%) | IV Placement | |
| ISS | Yes | 155 (57%) | |
| >15 | 62 (27%) | No | 115 (43%) |
| ≤15 | 164 (73%) | Cardiac Monitoring | |
| Eventual Fatality | Yes | 127 (47%) | |
| Yes | 13 (5%) | No | 143 (53%) |
| No | 233 (95%) | CPR | |
| Crew Training | Yes | 5 (2%) | |
| BLS | 49 (20%) | No | 265 (98%) |
| ALS | 195 (80%) | Intubation | |
| Rurality | Yes | 10 (4%) | |
| Isolated Rural | 48 (19%) | No | 260 (96%) |
| Small Rural | 40 (16%) | Number of Treatments | |
| Large Rural | 65 (26%) | 0–1 | 78 (29%) |
| Urban | 101 (40%) | 2–8 | 192 (71%) |
Definitions: Col = column; GCS = Glasgow Coma Scale Score; ISS = Injury Severity Score; BLS = Basic Life Support; ALS = Advanced Life Support; CPR = cardiopulmonary resuscitation. 1 Total of column n values by category may not equal total N for study population (270) because of missing data.
Table 2.
Comparison of all-terrain vehicle crash patients transported via emergency medical services ground ambulance by crash location (2004–2014): Off-road (N = 166) versus roadway (N = 104) and remote (N = 58) versus accessible crash location (N = 212).
Table 2.
Comparison of all-terrain vehicle crash patients transported via emergency medical services ground ambulance by crash location (2004–2014): Off-road (N = 166) versus roadway (N = 104) and remote (N = 58) versus accessible crash location (N = 212).
| Characteristics | Crash Location n (Col %) 1 | p-Value 2 | Crash Location n (Col %) 1 | p-Value 2 | ||
|---|---|---|---|---|---|---|
| Off-Road | Roadway | Remote | Accessible | |||
| Sex | ||||||
| Male | 124 (81%) | 65 (71%) | 0.076 | 46 (82%) | 143 (75%) | 0.28 |
| Female | 30 (19%) | 27 (29%) | 10 (18%) | 47 (25%) | ||
| Age (years) | ||||||
| <16 | 29 (17%) | 29 (28%) | 0.13 | 6 (10%) | 52 (25%) | 0.060 |
| 16–35 | 79 (48%) | 42 (40%) | 31 (53%) | 90 (42%) | ||
| >36 | 58 (35%) | 33 (32%) | 21 (36%) | 70 (33%) | ||
| GCS | ||||||
| <15 | 37 (25%) | 39 (44%) | 0.003 | 12 (24%) | 64 (35%) | 0.13 |
| 15 | 109 (75%) | 50 (56%) | 39 (76%) | 120 (65%) | ||
| ISS | ||||||
| >15 | 37 (24%) | 25 (34%) | 0.14 | 16 (30%) | 46 (27%) | 0.68 |
| ≤15 | 115 (76%) | 49 (66%) | 38 (70%) | 126 (63%) | ||
| Eventual Fatality | ||||||
| Yes | 1 (<1%) | 12 (12%) | 0.00027 | 1 (2%) | 12 (6%) | 0.47 3 |
| No | 146 (99%) | 87 (88%) | 47 (98%) | 186 (94%) | ||
| Crew Level | ||||||
| BLS | 26 (17%) | 23 (25%) | 0.12 | 8 (15%) | 41 (22%) | 0.27 |
| ALS | 127 (83%) | 68 (75%) | 46 (85%) | 149 (78%) | ||
| Rurality | ||||||
| Isolated Rural | 22 (14%) | 26 (27%) | 0.11 | 8 (15%) | 40 (20%) | 0.59 |
| Small Rural | 26 (17%) | 14 (14%) | 9 (17%) | 31 (15%) | ||
| Large Rural | 42 (27%) | 23 (23%) | 17 (32%) | 48 (24%) | ||
| Urban | 66 (42%) | 35 (36%) | 19 (36%) | 82 (41%) | ||
| Number of Interventions | ||||||
| 2–8 | 116 (70%) | 76 (73%) | 0.57 | 46 (79%) | 146 (69%) | 0.12 |
| 0–1 | 50 (30%) | 28 (27%) | 12 (21%) | 66 (31%) | ||
Definitions: Col = column; n = number of responses in analysis subgroup, ALS = Advanced Life Support. 1 total of column n values by category may not equal total N for study population (270) because of missing data. 2 Chi-square comparison of proportions by crash location except as noted. 3 Fisher’s Exact Test.
Table 3.
Comparison of emergency medical services (EMS) response time intervals in minutes for all-terrain vehicle crash patients transported via EMS ground ambulance by crash location (2004–2014): Off-road (N = 166) versus roadway (N = 104) and remote (N = 58) versus accessible locations (N = 212).
| Crash Location (n) 1 | Range | Mean (SD) | Median (IQR: Q1–Q3) | p-Value 2 |
|---|---|---|---|---|
| En Route to Scene | ||||
| Off-Road (166) | 0–43 | 9.9 (6.5) | 9.0 (6–13) | 0.40 |
| Roadway (104) | 0–25 | 10.2 (5.5) | 9.0 (6.5–14) | |
| Remote (58) | 0–40 | 10.2 (6.7) | 9.0 (6–14) | 0.85 |
| Accessible (212) | 0–43 | 9.9 (6.0) | 9.0 (6–13) | |
| Patient Access | ||||
| Off-Road (161) | 0–66 | 2.6 (6.5) | 1.0 (0–2) | <0.001 |
| Roadway (101) | 0–5 | 0.7 (0.9) | 0.0 (0–1) | |
| Remote (58) | 0–66 | 4.9 (10.2) | 2.0 (1–5) | <0.001 |
| Accessible (212) | 0–13 | 1.0 (1.8) | 1.0 (0–1) | |
| On Scene with Patient | ||||
| Off-Road (161) | 2–71 | 16.3 (9.4) | 14.0 (10–20) | 0.076 |
| Roadway (101) | 1–83 | 14.7 (10.6) | 13.0 (9–18) | |
| Remote (58) | 5–49 | 17.8 (8.4) | 16.5 (13–21.5) | 0.004 |
| Accessible (212) | 1–83 | 15.1 (10.2) | 13.0 (9–19) | |
| Total On Scene | ||||
| Off-Road (166) | 2–81 | 19.0 (11.8) | 16.0 (12–22) | 0.002 |
| Roadway (104) | 1–83 | 15.2 (10.6) | 13.0 (9–19) | |
| Remote (58) | 5–80 | 22.4 (12.6) | 19.5 (15–26) | <0.001 |
| Accessible (212) | 1–83 | 16.2 (10.8) | 14.0 (10–19) | |
| En Route to Hospital | ||||
| Off-Road (152) | 0–90 | 19.5 (12.8) | 16.0 (11–26) | 0.36 |
| Roadway (92) | 0–65 | 18.2 (12.2) | 16.5 (10–23) | |
| Remote (58) | 2–61 | 16.5 (10.8) | 15.0 (9–21) | 0.087 |
| Accessible (212) | 0–90 | 19.7 (13.0) | 17.0 (10–26) |
Definitions: n = number of responses in analysis subgroup; SD = standard deviation; IQR = interquartile range. 1 Total of column n values by category may not equal total N for study population (270) because of missing data. 2 Kruskal-Wallis H test comparison of medians.
Table 4.
Hospital length of stay for all-terrain vehicle crash patients transported via emergency medical services ground ambulance by crash location (2004–2014), available for State Trauma Registry data only: roadway (N = 80), off-road (N = 160), remote (N = 54), accessible (N = 186).
Table 4.
Hospital length of stay for all-terrain vehicle crash patients transported via emergency medical services ground ambulance by crash location (2004–2014), available for State Trauma Registry data only: roadway (N = 80), off-road (N = 160), remote (N = 54), accessible (N = 186).
| Hospital Stay Characteristics | Crash Location n (Col %) 1 | p-Value 2 | Crash Location n (Col %) 1 | p-Value 2 | ||
|---|---|---|---|---|---|---|
| Off-road | Roadway | Remote | Accessible | |||
| ICU Days | ||||||
| 0 | 142 (89%) | 69 (86%) | 0.58 | 46 (85%) | 165 (89%) | 0.48 |
| ≥1 | 18 (11%) | 11 (14%) | 8 (15%) | 21 (11%) | ||
| Hospital Days | ||||||
| 0 | 79 (49%) | 42 (53%) | 0.65 | 21 (39%) | 100 (54%) | 0.054 |
| ≥1 | 81 (51%) | 38 (48%) | 33 (61%) | 86 (46%) | ||
| Hospital Days | ||||||
| 0–1 | 106 (66%) | 54 (68%) | 0.85 | 29 (54%) | 131 (70%) | 0.022 |
| ≥2 | 54 (34%) | 26 (32%) | 25 (46%) | 55 (30%) | ||
Definitions: ICU = intensive care unit. 1 Total of column n values by category may not equal total N for study population (270) because of missing data. 2 Chi-square comparison of proportions by crash location except as noted.
© 2019 by the authors. Licensee MDPI, Basel, Switzerland. This article is an open access article distributed under the terms and conditions of the Creative Commons Attribution (CC BY) license (http://creativecommons.org/licenses/by/4.0/).
Share and Cite
MDPI and ACS Style
Wubben, B.M.; Denning, G.M.; Jennissen, C.A. The Effect of All-Terrain Vehicle Crash Location on Emergency Medical Services Time Intervals. Safety 2019, 5, 73. https://0-doi-org.brum.beds.ac.uk/10.3390/safety5040073
AMA Style
Wubben BM, Denning GM, Jennissen CA. The Effect of All-Terrain Vehicle Crash Location on Emergency Medical Services Time Intervals. Safety. 2019; 5(4):73. https://0-doi-org.brum.beds.ac.uk/10.3390/safety5040073
Chicago/Turabian StyleWubben, Brandon M., Gerene M. Denning, and Charles A. Jennissen. 2019. "The Effect of All-Terrain Vehicle Crash Location on Emergency Medical Services Time Intervals" Safety 5, no. 4: 73. https://0-doi-org.brum.beds.ac.uk/10.3390/safety5040073
Note that from the first issue of 2016, this journal uses article numbers instead of page numbers. See further details here.