Improved Strategies for the Maritime Industry to Target Vessels for Inspection and to Select Inspection Priority Areas


Econometric Institute, Erasmus University, 3062 PA Rotterdam, The Netherlands
*
Author to whom correspondence should be addressed.
Safety 2020, 6(2), 18; https://0-doi-org.brum.beds.ac.uk/10.3390/safety6020018
Submission received: 31 December 2019
/
Revised: 12 March 2020
/
Accepted: 25 March 2020
/
Published: 31 March 2020
(This article belongs to the Special Issue Maritime Safety and Operations)
Abstract
:Inspection authorities such as the Port State Control Memoranda of Understanding use different policies and targeting methods to select vessels for inspections and rely primarily on past inspection outcomes. One of the main goals of inspections is to improve the safety quality of vessels and to reduce the probability of future incidents. This study shows there is room for improvement in targeting vessels for inspections and in determining vessel-specific inspection priority areas (e.g., bridge management versus machinery related items). For the year 2018, sixty percent of vessels that experienced very serious or serious (VSS) incidents were not selected for inspection up to three months prior to the incident and forty percent of the vessels that were inspected still had incidents of which only four percent were detained. Furthermore, one can observe a very low correlation (−0.04) between the probabilities of detention and incidents (VSS) for the year 2018. The proposed approach treats detention and incident types as separate risk dimensions and evaluates seven targeting methods against random selection of vessels using empirical data for 2018. The analysis is based on three comprehensive data sets that cover the world fleet and shows potential gains (reduction of false negative events) of 14–27 percent compared to random selection. This can be further improved by adding eight inspection priority risk areas that help inspectors to focus inspections by providing insight in the individual risk profile of vessels. Policy makers can further customize the approach by classifying the risk of vessels into categories and by selecting inspection targets and benchmark samples. A small application example is provided to demonstrate feasibility of the proposed approach for policy makers and inspection authorities.
1. Introduction
This manuscript evaluates and challenges the status quo practice of the maritime industry to primarily use past Port State Control inspection outcomes to target future risky vessels for inspections as highlighted by Knapp [1]. The primary goal is to develop a method and possibly a practical tool that can be used by maritime administrations or integrated into their systems with the aim to enhance the detection of risky vessels and to reduce false negative events—in short to have a more proactive approach to inspection selection. The development of the method builds on work of Knapp and Franses [2], Heij et al. [3] and Heij and Knapp [4] to select vessels for inspections with the highest benefit (reduction in risk) and to treat detention and incident risk as separate risk dimensions in order to reduce false negative events. A false negative event is an event where the targeting method classifies a vessel as low risk, but in reality, this vessel is a risky vessel. If a vessel is classified as low risk based on detention risk only, the vessel does not get targeted but can experience an incident with (very) serious consequences. If this happens, the inspection regime failed the opportunity to inspect the vessel and to improve its safety quality because inspections reduce incident risk, as is well established in the literature [5,6,7,8,9]. Ji et al. [10] demonstrate that using incident data besides detention data improves the evaluation of registries and subsequent selection of ships for inspections.
The literature on Port State Control covers various topics such as the evaluation of the effectiveness of Port State Control regimes [1,9] or the use of past deficiencies to predict future risk or to guide inspectors to find more deficiencies [11,12,13,14] but the standard assumption remains that detention equals incident risk. This manuscript challenges this assumption and presents a methodology that treats incident risk and detention as two separate risk dimensions. This line of thinking is in line with Yang et al. [15,16] and Luo and Shin [17] who suggest more proactive approaches. Since vessels benefit from an inspection and this effect can be measured quantitatively [3,6], the probability of incident is reduced if an inspection is performed. This, however, is not necessarily due to a detention as demonstrated by Heij et al. [3] who show a low correlation between the probability of detention and incident and Bijwaard et al. [6] who use survival analysis to analyze ship cycles over a long time period.
The goal of inspections is to raise the safety quality of vessels in order to prevent future incidents rather than preventing future detentions. By combining the two risk dimensions, false negative events can be reduced since the riskiest vessels benefit most from an inspection. This study is based on three sets of databases and data feeds containing global incident, inspection, and ship-particular data of the world fleet (73,905 vessels).
The analysis confirms the importance of the two risk dimensions and the need to improve targeting ships for inspections, since during the year 2018, 60 percent of vessels that experienced very serious or serious (VSS) incidents were not selected for inspection up to three months prior to the incident. The analysis also highlights the need to improve selection of vessel-specific inspection priority risk areas, since 40 percent of the vessels there were inspected still had incidents and only 4 percent were detained. In addition, one can observe a very low correlation (–0.04) between the probabilities of detention and incidents (VSS) for the year 2018. The included incident type risks are those classified as total loss and very serious and serious incidents (VSS) according to the International Maritime Organization’s definitions [18]. Less serious incidents and near misses are excluded here due to their high degree of underreporting as noted by Hassel et al. [19].
With the above philosophy in mind to treat detention and incident (VSS) as separate risk dimensions and with an established need for improvement, the presented approach extends Heij and Knapp [4] who consider three combined methods and use three months of empirical data (the first quarter of 2018) to evaluate them. The approach presented here uses five combined methods, by which we mean methods that combine the information present in past detention data and past incident data. By using percentiles instead of estimated (logit) risk probability levels, the analysis becomes robust against size distortions of the logit probabilities that arise because of data limitations. The five combined methods are evaluated along with the eight priority areas using empirical data for the whole year of 2018. Furthermore, the presented approach allows for the combination of an automated data-driven part with qualitative aspects. Data-driven approaches have been proposed previously [1,11,12,13,14] but exclude other components included here, such as accounting for two different risk dimensions and addition of inspection priority areas. The data-driven part here provides the risk profiles of individual vessels for eight vessel inspection priority risk areas and combines detention and incident (VSS) risk into one metric to enhance targeting. This data-driven part can be combined with other intelligence and expert knowledge of inspectors to finalize inspection selection and execution. An application example is provided to demonstrate feasibility.
2. Data and Methodology
The analysis is based on a unique and comprehensive combination of databases, data feeds and methods and follows a systematic step by step approach which is explained below.
- Step 1: Estimation of Risk Formulas
The first step is to create the data matrix to estimate risk formulas. The formulas are estimated by using logit models and the underlying matrix used was from the years 2010 to 2014 covering the world fleet. For more details on the underlying statistical models used including a list of variables that are evaluated, we refer to Knapp and Franses [20] and Knapp [21]. Separate risk formulas are estimated for each incident type of interest and for detention. The formulas can be used for a maximum of three to five years and will then need to be re-estimated.
- Step 2: Estimate Probabilities Using Data Feeds from 2018
The second step is to use the derived risk formulas of Step 1 and, using input data feeds from 2018, to estimate probabilities at ship level for each of the four quarters of 2018. This is necessary because the main interest is to estimate the probabilities valid at a specific point in time. Since quarterly input data feeds for the year 2018 were available, those were used to estimate the probabilities using custom—made software that can process the input data feeds, calculate the input parameters needed to apply the risk formulas and estimate the probabilities. Ten risk formulas are selected that cover targeting and vessel inspection priority areas resulting in a total of 2.9 million probabilities.
- Step 3: Calculate Percentile Ranks
The probabilities of Step 2 form the basis to calculate percentile ranks of vessels. Percentile ranks are useful to rank vessels according to their risk and to construct classes of vessels with roughly comparable risk and especially classes where such risk is relatively high. An advantage of using percentiles instead of estimated (logit) risk probability levels is that these percentiles are robust against size distortions of the logit probabilities as percentile ranks are not affected by size distortions. As a benchmark sample, the global fleet is used as the basis and the percentile ranks are calculated of the five methods that are evaluated combining detention and incident (VSS) percentile ranks. The percentile ranks of the inspection priority areas are also calculated but not combined with detention. In addition, percentile ranks are also used to classify vessels using five risk categories (1 = very high to 5 = very low risk). The output of this step is 4.4 million percentile ranks and form the basis for evaluation and validation. Different benchmark samples could be used such as for instance benchmarking only vessels that arrive in a specific geographic location in order to zoom into those vessels of interest if the global fleet is not adequate. The proposed method is very flexible and can easily be adjusted to zoom into particular geographic locations.
- Step 4: Validate Targeting Methods Using Empirical Data from 2018
The last step is to validate the methods from Step 3 against empirical data from 2018 using three validation variables (detention only, incidents only, and detention and incidents combined).
Table 1 lists the data sources, time frames, and number of observations for the databases and data feeds that form the basis for the four steps mentioned above. Appendix A (Table A1) provides descriptive statistics by ship type for all databases and data feeds used in this analysis. For Step 1, historical data is used to estimate risk formulas. For Steps 2 to 4, we use data input feeds with ship and various histories (changes in ship particulars as well as inspection and incident type histories) at a particular time to estimate probabilities at a specific time. The global inspection data comprises data from over seventy countries from eight Port State Control Memoranda of Understanding (MoU’s). Incident data had to be combined and manually reclassified using IMO definitions [18] since different data providers use different definitions of seriousness. In addition, for each incident the first event of the chain of events was identified since that is needed for the incident type models for the eight-vessel inspection priority risk areas. In addition, the various types of consequences are recorded for each incident.
To ensure that results are not biased due to underreporting of less serious incidents and near misses [19], this study concentrates on very serious (including total loss) and serious incidents (VSS). Ship particular data contains standard information such as ship type, age, size, flag, company (e.g., beneficial owner, class society, safety management company), construction (engine information, shipyard country), previous incidents and inspection outcomes. Tugs and fishing vessels are excluded, and ship types are grouped into six main groups: general cargo, dry bulk, container, tanker, passenger, and other types. To estimate probabilities at the ship level, the data feed contains quarterly data feeds for 2018 from the same sources shown in Table 1 for 73,905 vessels, which are out-of-sample data compared to the data for 2010–2014 used to estimate the risk formulas.
The risk formulas used in this analysis are based on logit models following the methodology of the selection of variables from Knapp [1,21] and Knapp and Franses [2,5]. The logit model estimates the probability (p) of an event of interest such as detention or incidents (VSS) by means of p = exp(xb)/(1 + exp(xb)), where ‘exp’ denotes the exponential function and ‘x’ is the set of vessel-specific variables (e.g., ship type, size, age, flag, classification society, beneficial owner, engine designer, ship yard country). Over 500 variables (including counting dummies for categorical ones) are considered initially. The database to estimate the incident type models has one observation per vessel per year whereas the database to estimate the detention model has multiple observations per vessel per year since vessels can be inspected various times per year. The models are specified by backward elimination by removing insignificant factors (at the 5% significance level). The largest of the resulting models for incidents (VSS) contains 172 variables while the smallest contains 16 (for fire and explosion). All models are estimated by quasi-maximum likelihood as by Greene [22] to allow for possible misspecification of the assumed underlying distribution function for logit models. The employed logit models are described in more detail in Knapp [21] and Heij and Knapp [4].
Table 2 lists the resulting risk models that form the basis for Step 2 of the methodology. The incident type models serve as proxy to inspection related focus areas, where separate models are used for collisions, powered groundings, main engine failures, and drift groundings.
Since the effect of risk factors changes over time as they proxy how industry responds to market conditions and legislative changes, the risk formulas need to be updated every three to five years. Based on the data from 2010 to 2014, the effects of vessel age and size for VSS incident risk are opposite to those for detention risk. Since the detention model reflects actual Port State Control Memoranda of Understanding (MoU) decisions in practice, this indicates that no incident information is part of the targeting routine. This finding relates to one of the main messages of this paper that past incident information is relevant for targeting vessels for inspection to reduce future incidents (VSS). It also demonstrates that the inspection data is biased since it reflects the various targeting policies of coastal states.
Step 2 involves the estimation of ship-specific probabilities using quarterly input data feeds for 2018 and using the risk formulas obtained under Step 1. The input data feeds cover the global fleet of 73,905 individual vessels and cover the following six ship types: general cargo (23.8%), dry bulk carriers (15.7%), container vessels (7%), tankers (22.1%), passenger vessels (9.7%) and all other ship types (excluding fishing vessels, tugs and commercial yachts) (21.7%).
The calculation of the probabilities was performed by means of a customized software program resulting in 2.9 million probabilities that form the basis for the development and testing of the targeting methods shown in Table 3. The software processes the data feeds, calculates the input parameters to be applied for the risk formulas and estimates the probabilities. The probabilities are converted into percentile ranks using as benchmark the global fleet in each of the four quarters.
Percentile ranks provide a useful way for policy makers to understand where a particular vessel stands with respect to all other vessels in the benchmark sample, which could be adjusted to regional preferences (e.g., all vessels that arrived in a particular region over the last three years) rather than using the global fleet as benchmark. Table 3 shows the five combined targeting methods (A, B, C, D and E) and the two stand-alone (detention, incidents) that were evaluated based on 4.4 million percentile ranks.
In order to classify vessels based on their percentile ranks, five risk categories are chosen as shown in Table 4 along with a color coding for the five risk categories to help visualize the risk categories. The suggested target inspection coverage is flexible and can be set by policy makers considering the country’s (or group of countries in the case of a PSC MoU) risk appetite, regional priorities and arrival profiles, inspection policies (e.g., to inspect vessels every six months, to inspect all passenger vessels etc.) and resources. To test feasibility, the suggested yearly target inspection coverage was applied to ship arrival data for 2018 of one country containing 34 thousand arrivals in port (6065 unique IMOs) with average daily arrival rate of 95 vessels and average daily inspection rate of eight vessels. Applying the above target inspection coverage using Method B, the same average yearly figures were obtained, that is a daily average inspection rate of eight vessels, making the suggested coverage feasible. In addition, it is recommended to add some random selectin to the inspection coverage for the lower risk coverage areas.
At the global level and based on unique IMO numbers, the quarterly average inspection rate is 21.2% while the yearly average inspection rate is 41.6%. The determination of the target inspection coverage will depend on regional inspection capacities and trade flows and it is recommended to custom tailor those to the respective country or region. Table 4 is only provided as example on what would be feasible given the inspection capacity of one country. Furthermore, the inspection coverage should be re-evaluated yearly to adjust to changes in the trade flows which will determine the type of vessels that trade in a region.
3. Evaluation of Targeting Methods
To evaluate the various proposed targeting methods, three evaluation variables were considered: incidents (VSS); detentions; incidents and detentions combined (the vessel was either detained or had an incident within the relevant time period). The evaluation time periods are specified as follows, since estimated probabilities are only valid up to a maximum of three months:
- P1: Probabilities estimated as of late Dec 2017—empirical data from Jan to March 2018;
- P2: Probabilities estimated as of late March 2018—empirical data from April to June 2018;
- P3: Probabilities estimated as of late June 2018—empirical data from July to Sept 2018;
- P4: Probabilities estimated as of late Sept 2018—empirical data from Oct to Dec 2018.
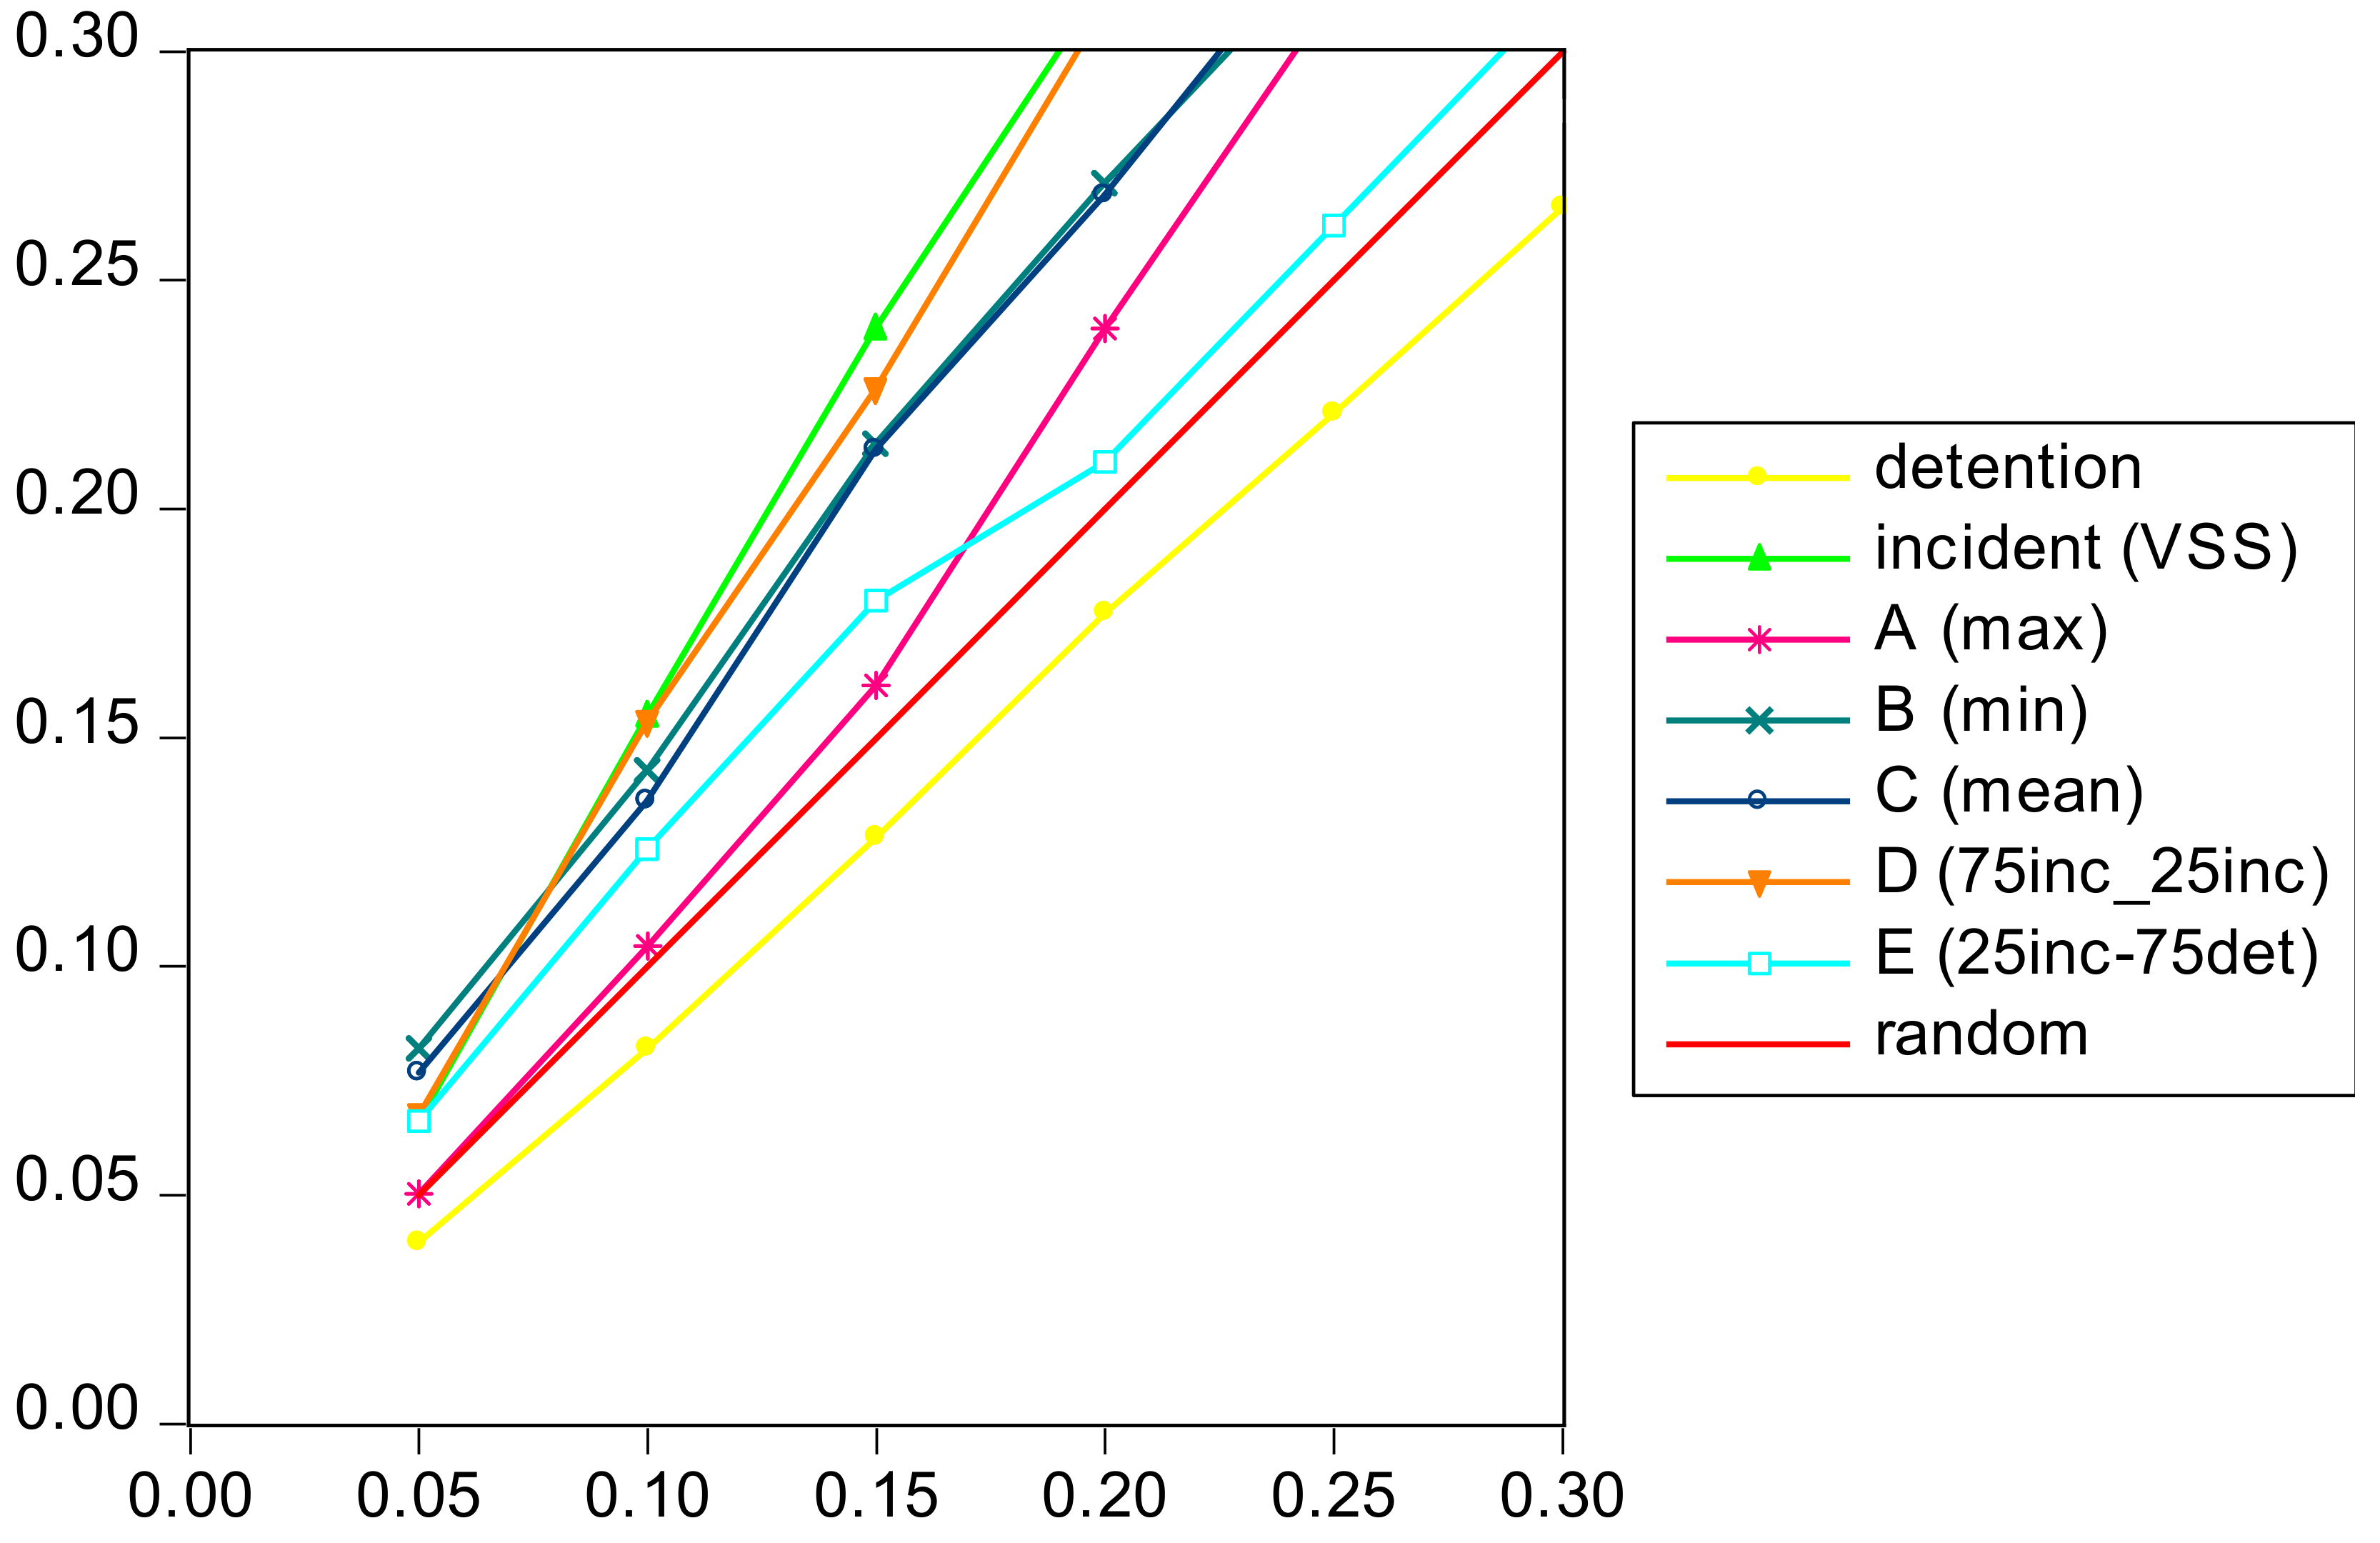
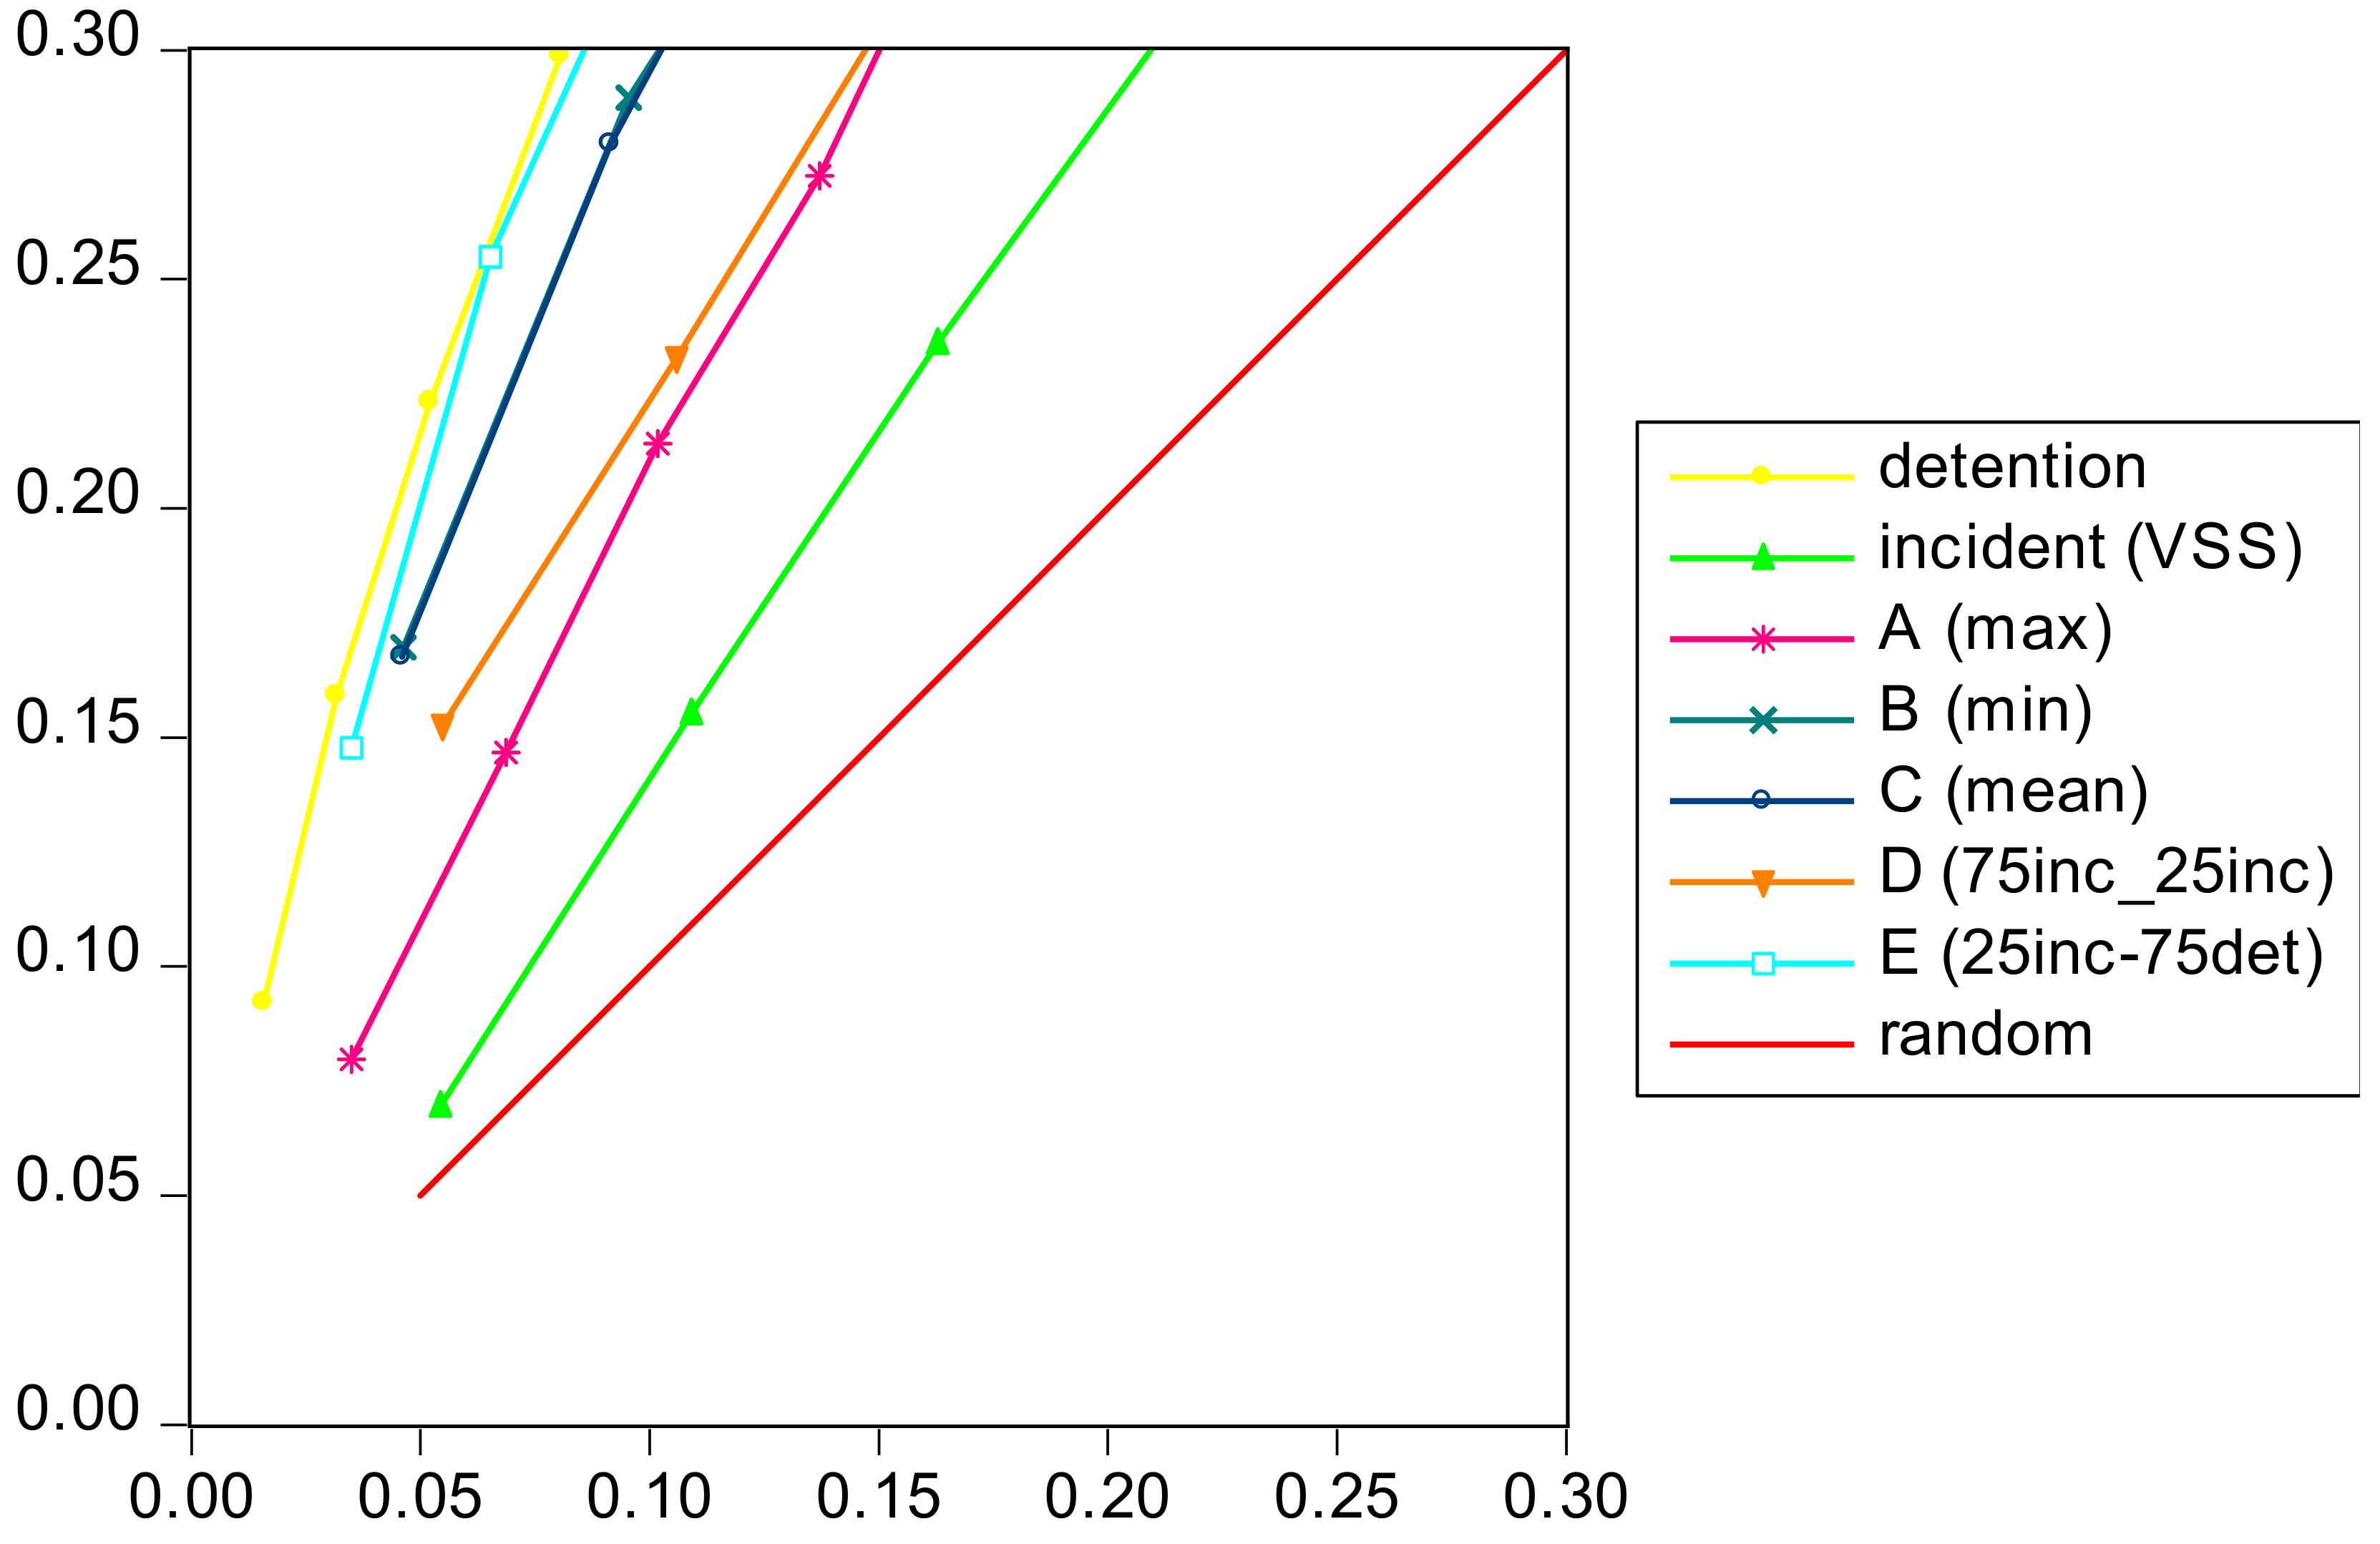
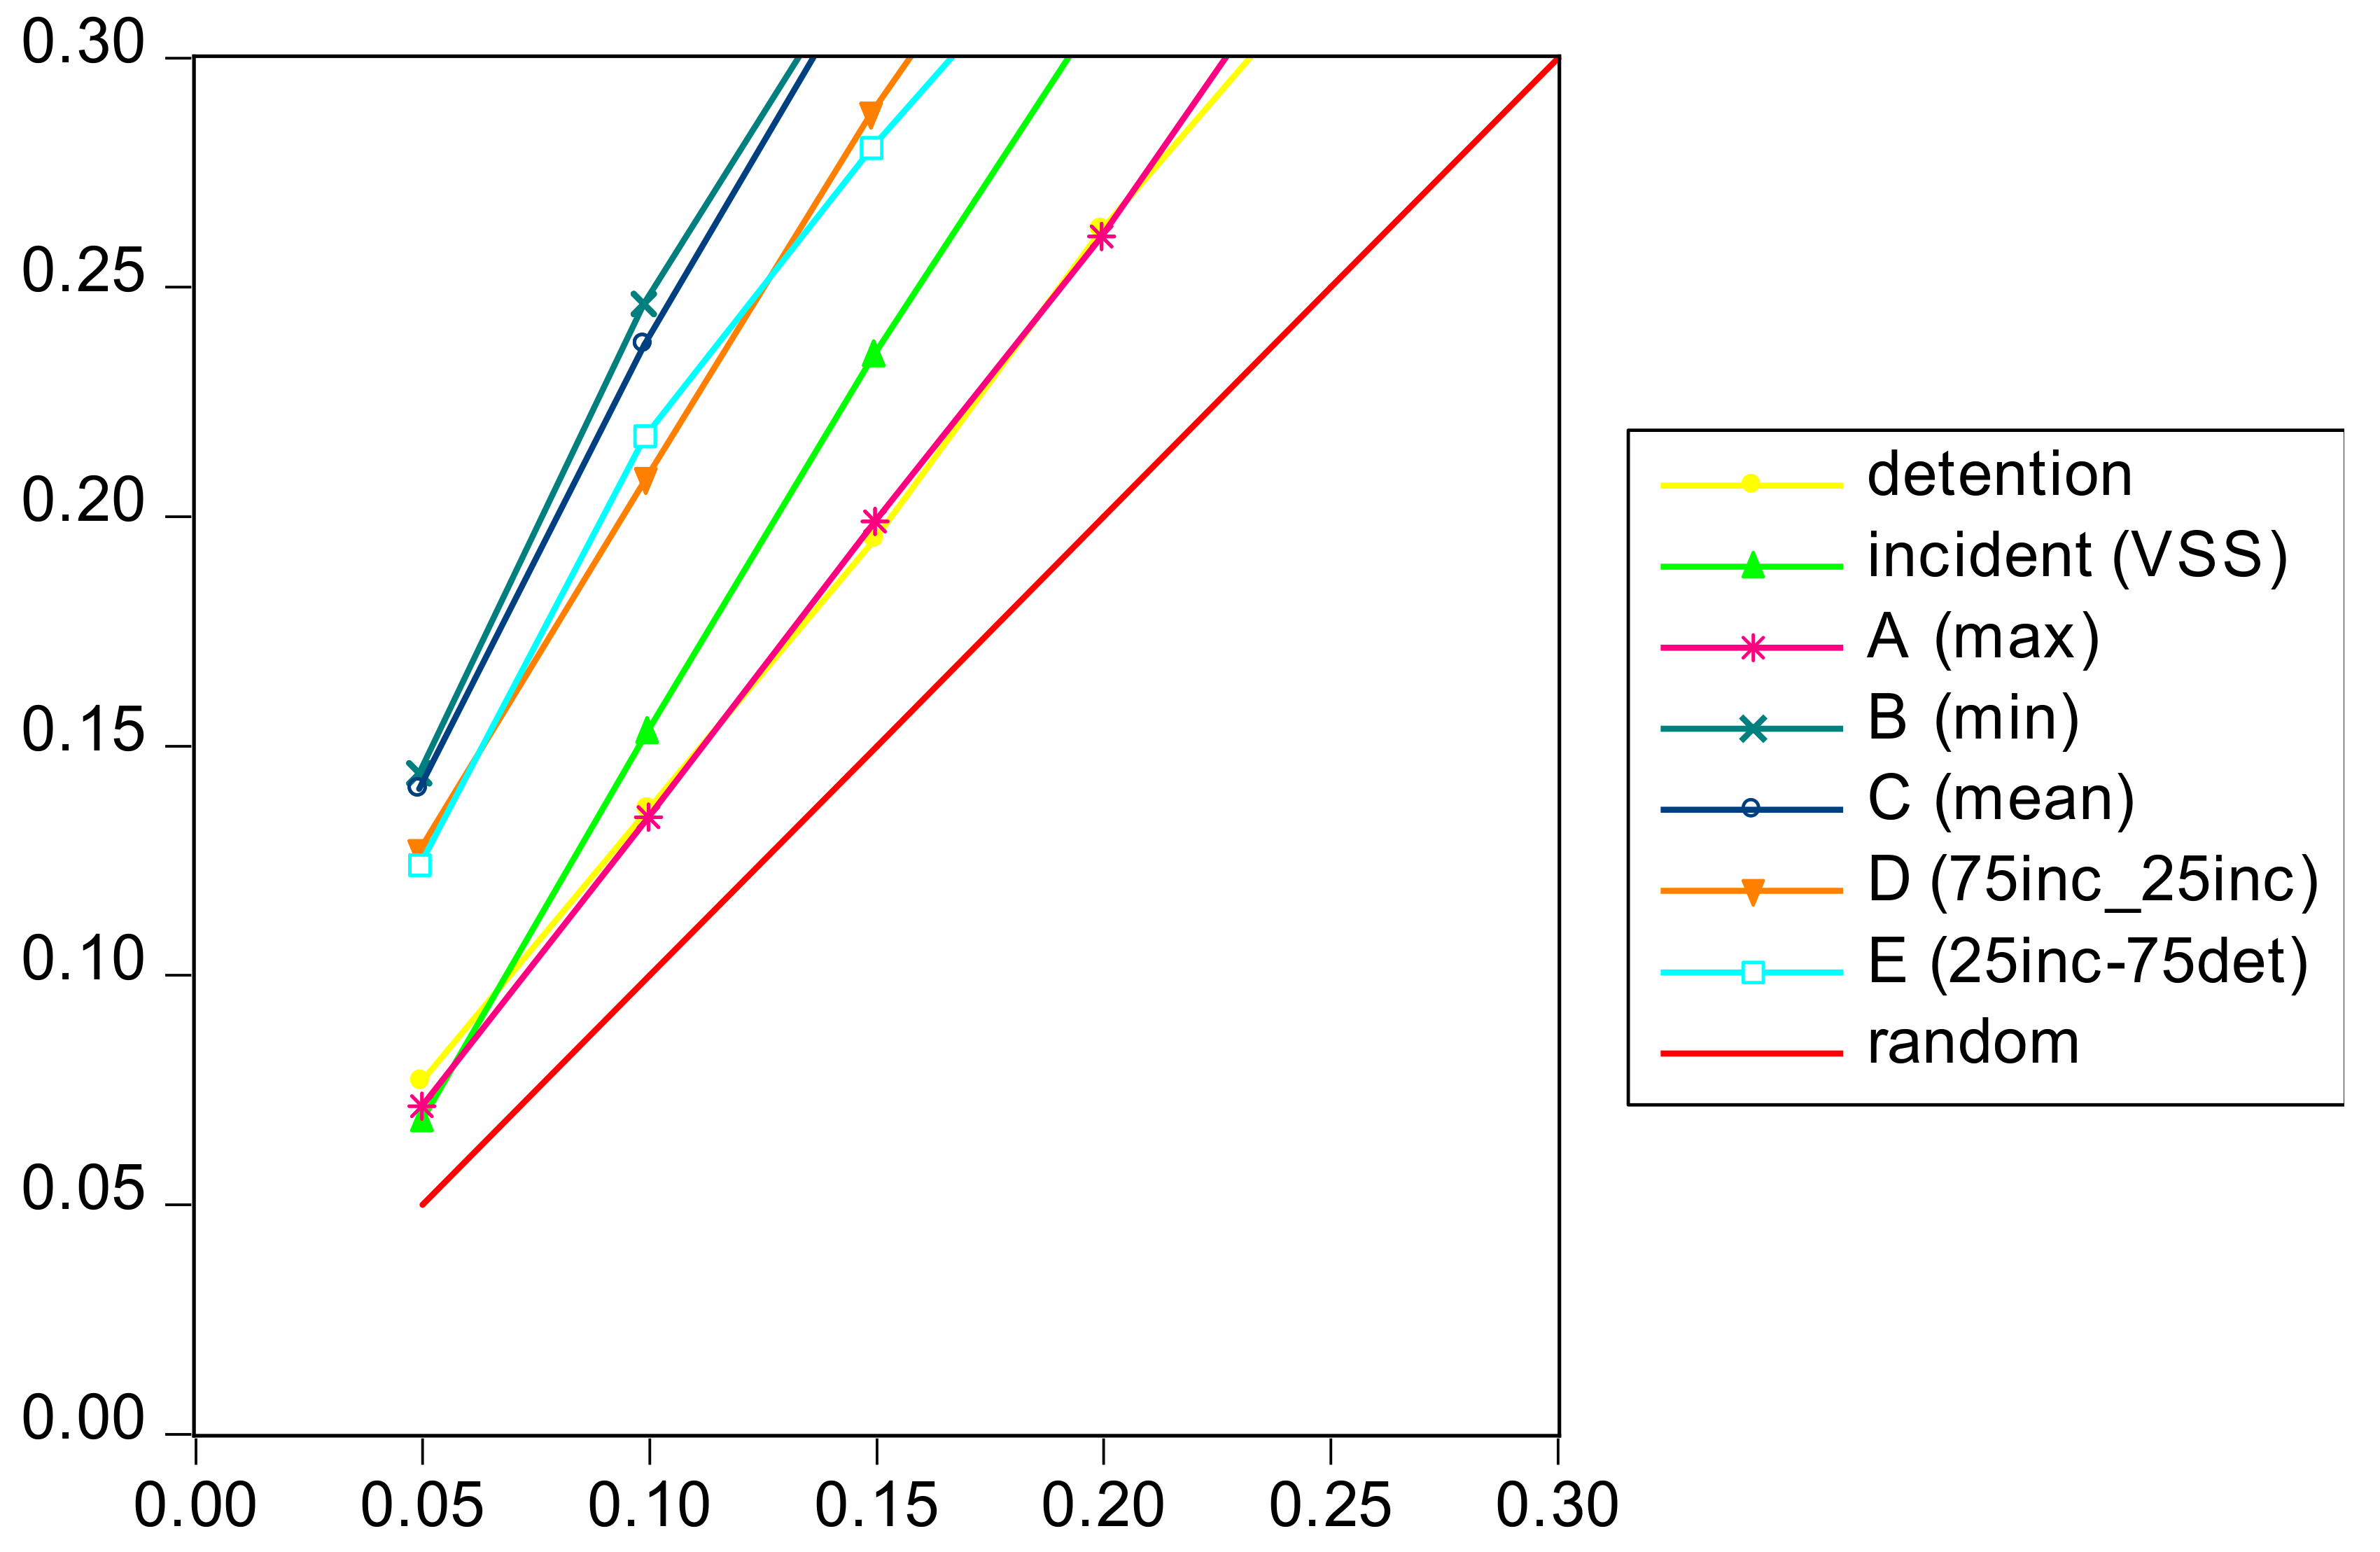
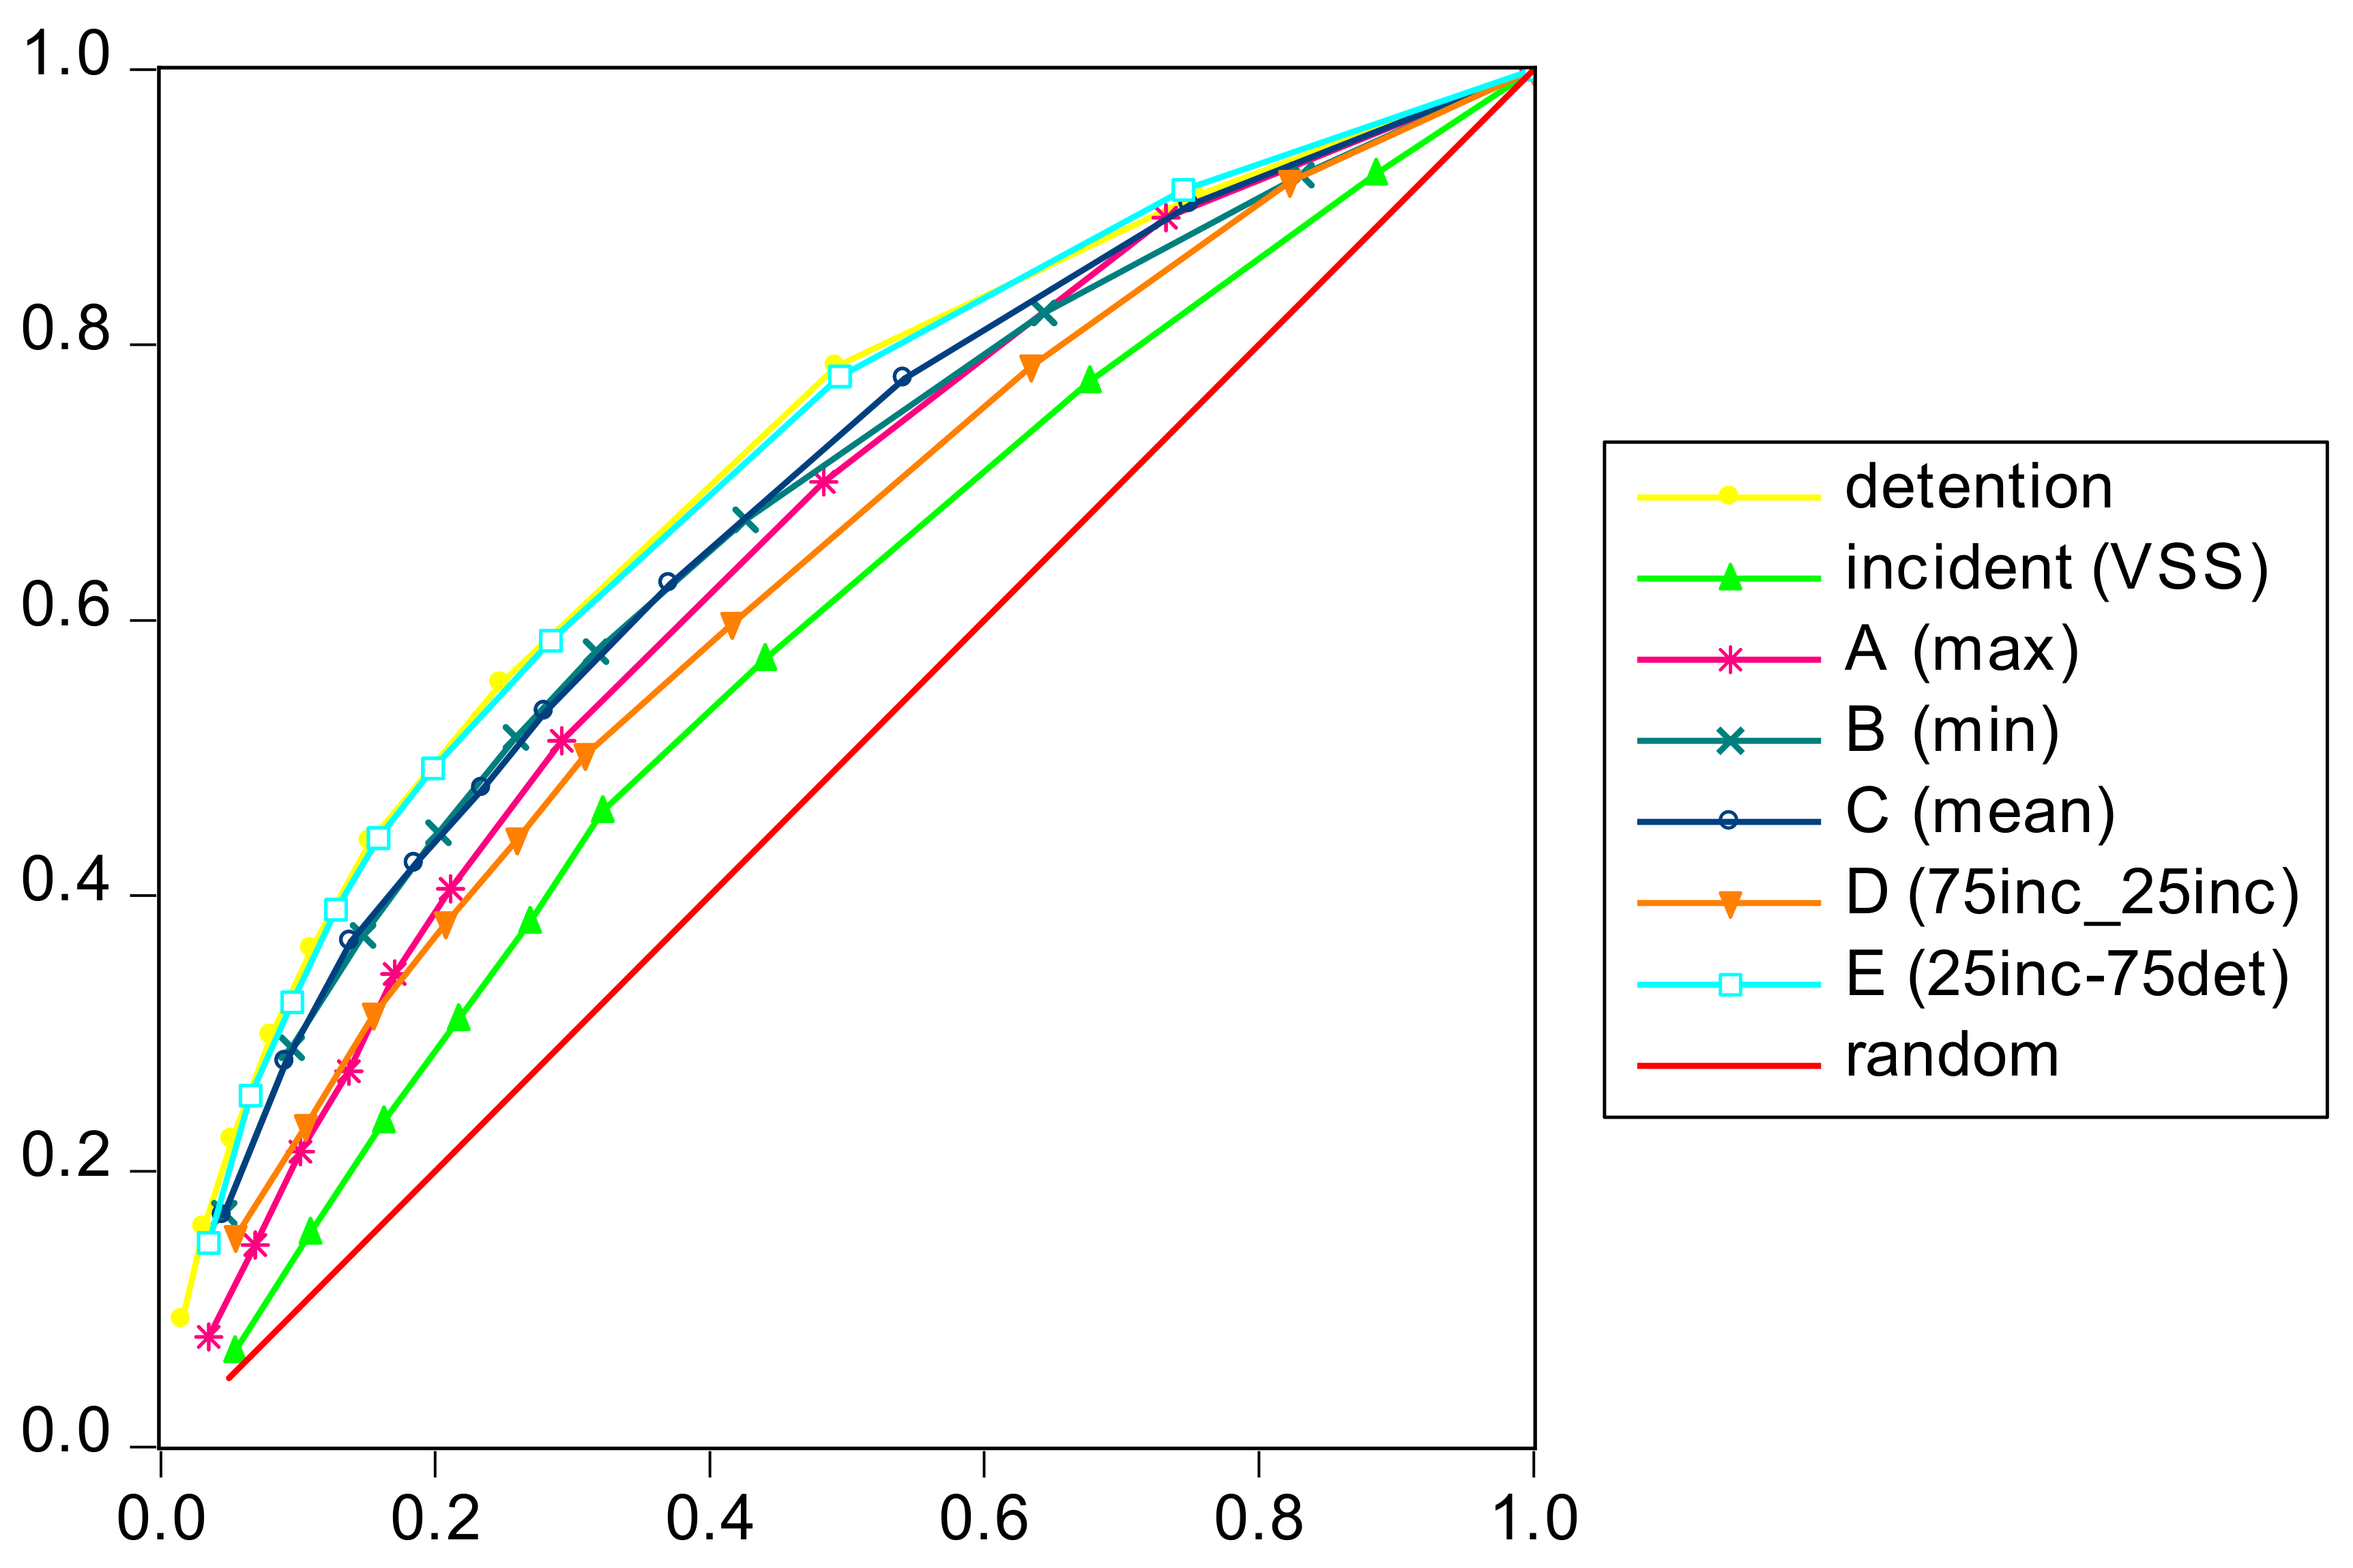
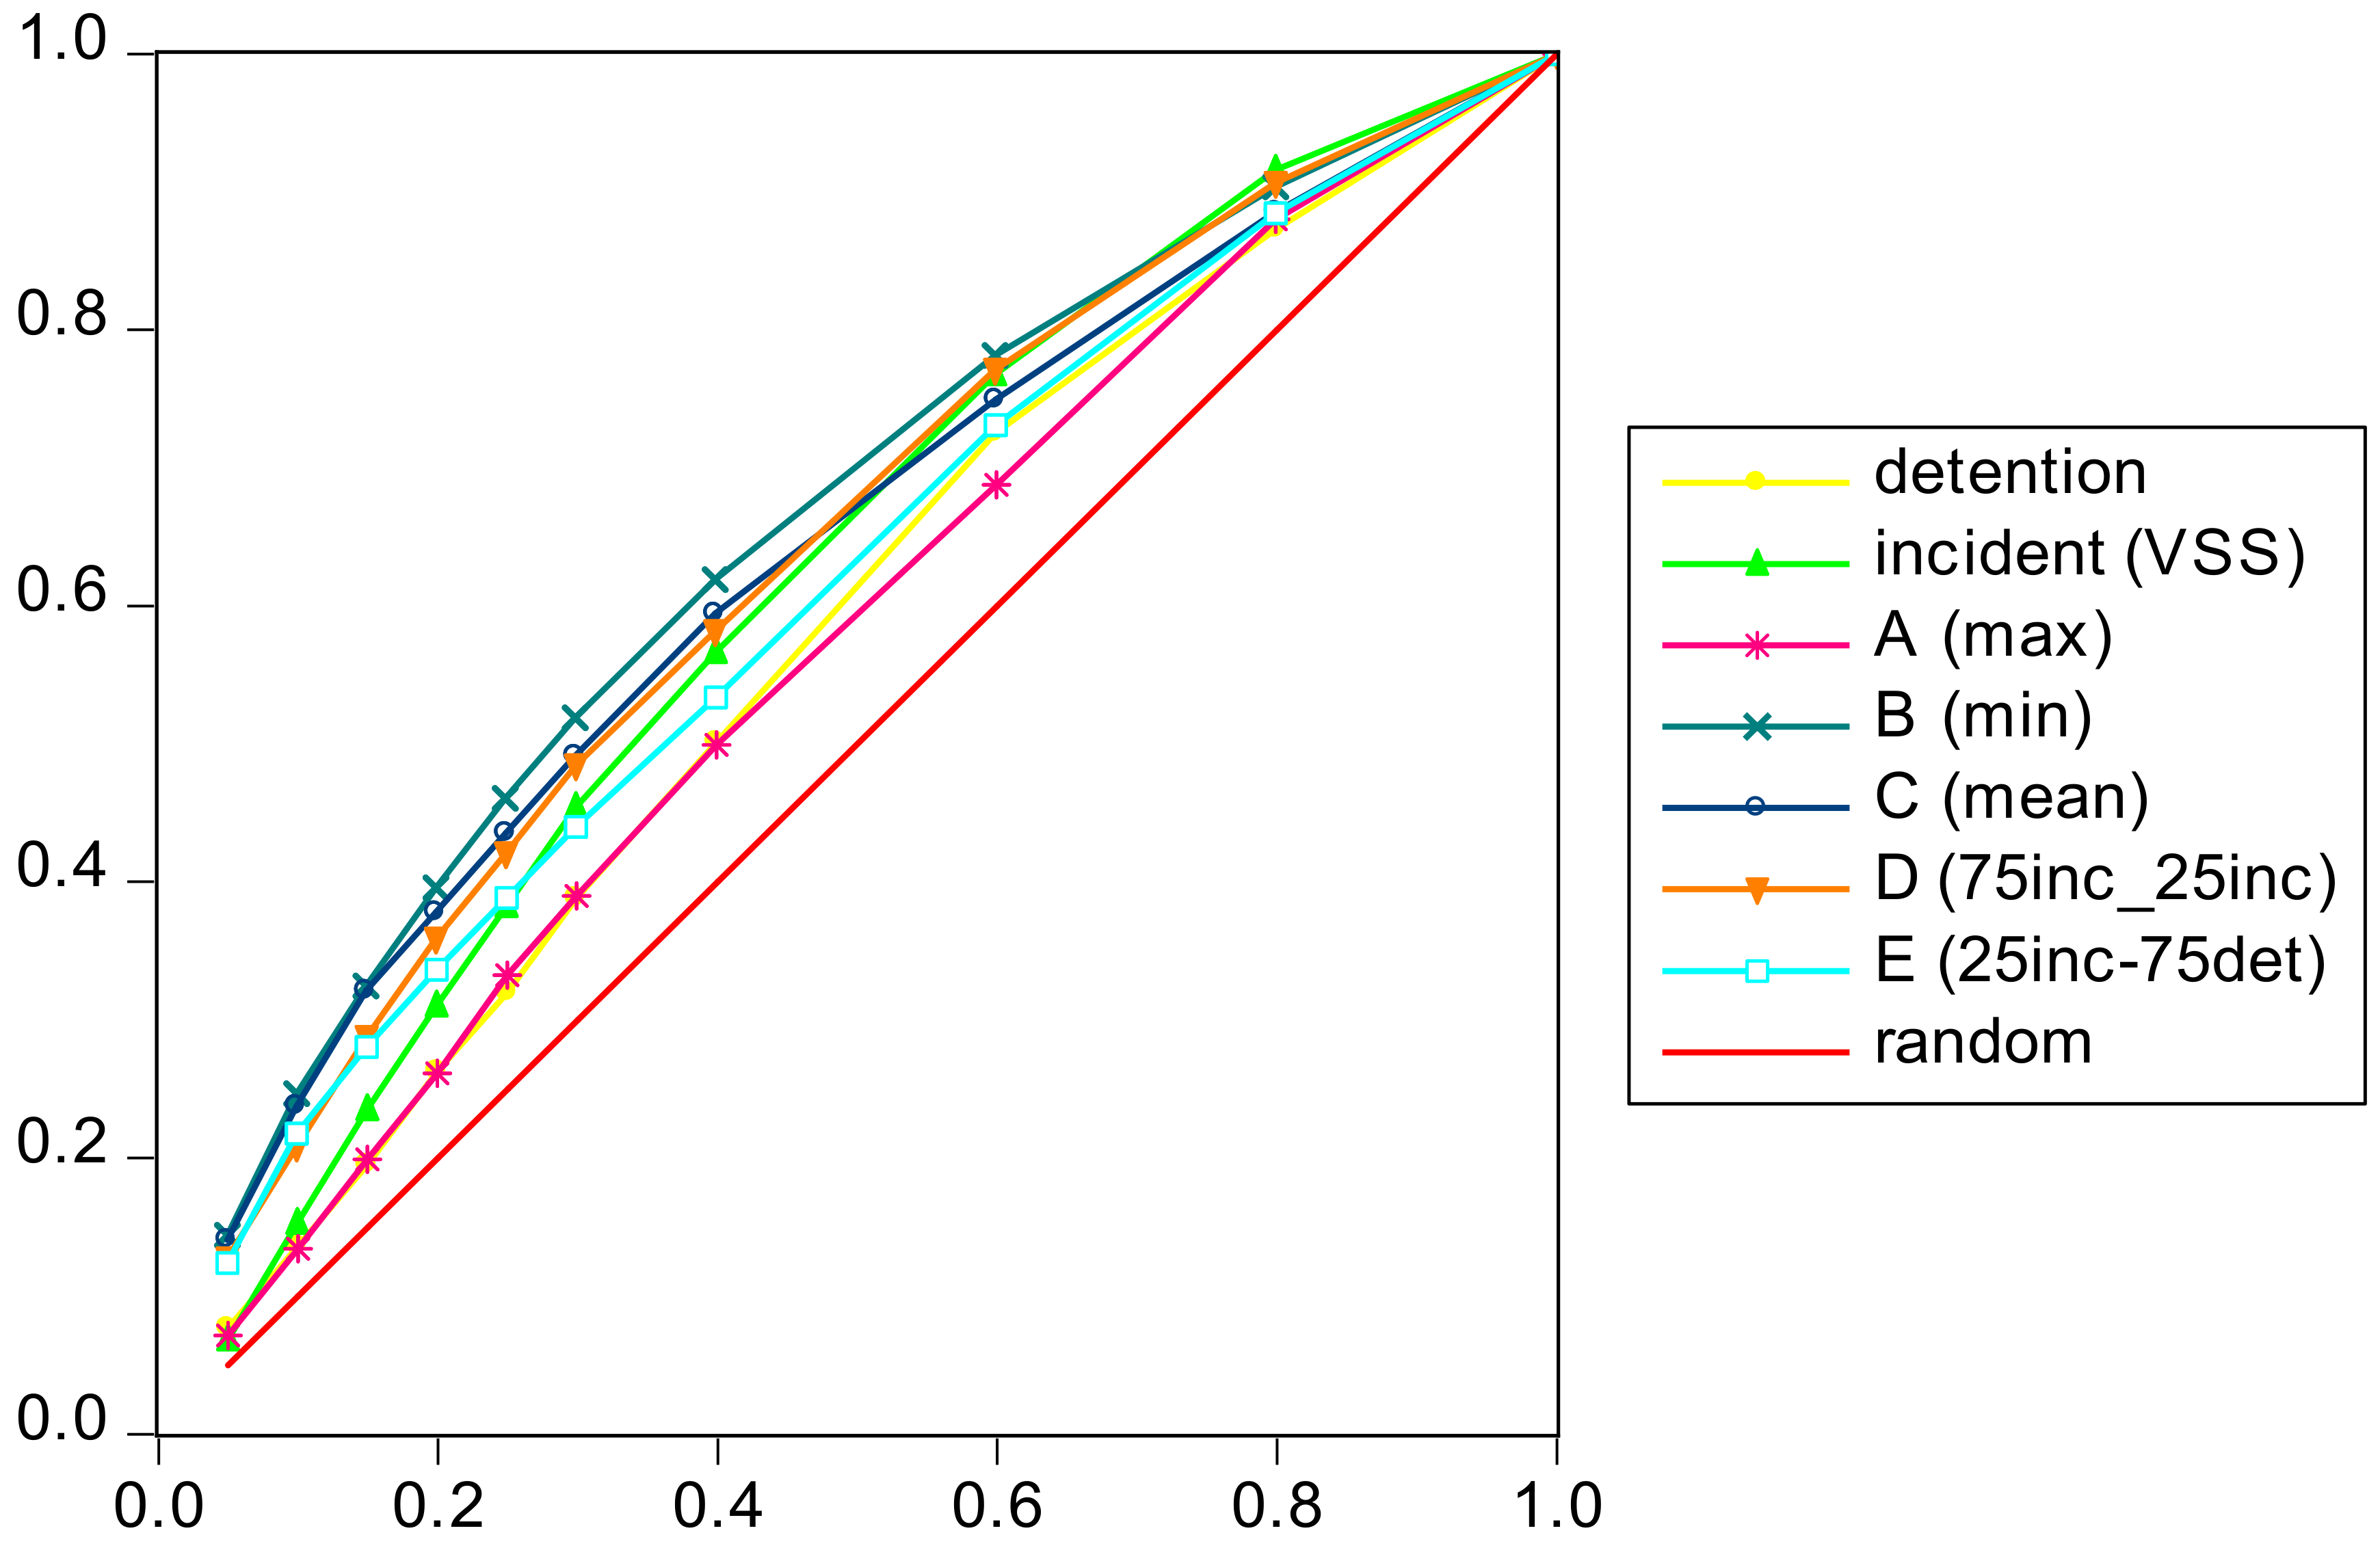
One way to visualize how well the targeting methods perform compared to random selection of vessels is via ROC (receiver operating characteristic) curves that plot the true positive rate (TPR) on the Y-axis against the false positive rate (FPR) on the X-axis. Figure 1, Figure 2 and Figure 3 provide ROC curves for the three evaluation variables, zooming into the top 30% of all vessels, which represents the top three risk categories (RC1 to RC3). Any curve above the diagonal line (random selection) constitutes an improvement. Appendix B (Figure A1, Figure A2 and Figure A3) provides the complete ROC curves.
One can observe that all methods perform better than random selection except for the detention method (using detention only) for the evaluation variable incidents (VSS). This is understandable given the small correlation (–0.046) between the two which also confirms that vessels with a high probability of detention do not necessarily have a high probability of incident (VSS) and that the two need to be treated as different risk dimensions.
At the global level, 60.2% of all incidents (VSS) were not selected for inspection up to three months prior to the incident. Of the 39.8% vessels that were inspected, 4.4% were detained indicating that vessel inspection priority risk areas could be improved in order to focus inspection efforts and to reduce incidents from happening. Restricting this to very serious incidents (VS) only, 75.4% were not selected for inspection and 3.3% were detained. After excluding cases with heavy or severe weather conditions, only 42.1% (VSS) and 34.3% (VS) of vessels with incidents were selected for inspection up to three months prior to the incident.
Method D on the other hand would have selected 44.8% of all vessels with VSS incidents and 39.3% of all vessels with vs. incidents in the top three risk categories (RC1 to RC3). Taking different inspection rates into account and if random selection is set to factor 1 for comparison reasons, the 44.8% classification rate of Method D translates to 1.49 compared to random selection (44.8% divided by 30%). Besides visualization by ROC curves, the improvement over random selection of vessels in terms of reduction of the false negative rate is quantified in Table 5. Note that the false negative rate is the opposite of the true positive rate (in the sense that both rates add up to 100 percent). To test the significance of differences in success rates across methods, the Satterthwaite Welch t-test is performed (Appendix C—Table A2 shows detailed results for some methods).
The results confirm that all methods are significantly better than random selection except for the method DET (using detention only) for the evaluation variable VSS. For the evaluation variable incidents (VSS), Method D performs best at the top 30% level which combines the first three risk categories (RC 1 to 3) while method VSS performs best at the top 10% level (RC1) followed closely by Method D. The Satterthwaite Welch t-test however confirms no significant difference between method VSS and Method D at the top 10% or top 30% level but confirms that Method B and using detention only vary significantly compared to method VSS or Method D. Method D gives more weight to incidents but also accounts for detention risk to capture vessels that have low percentile ranks for VSS but high for detention. For the evaluation variable detention and combining detention with incidents, Method B (min) performs best at the top 10% and top 30% level. This is also confirmed by the Satterthwaite Welch t-test where Method B varies significantly compared to method DET, VSS and Method D at the top 10% and top 30% level.
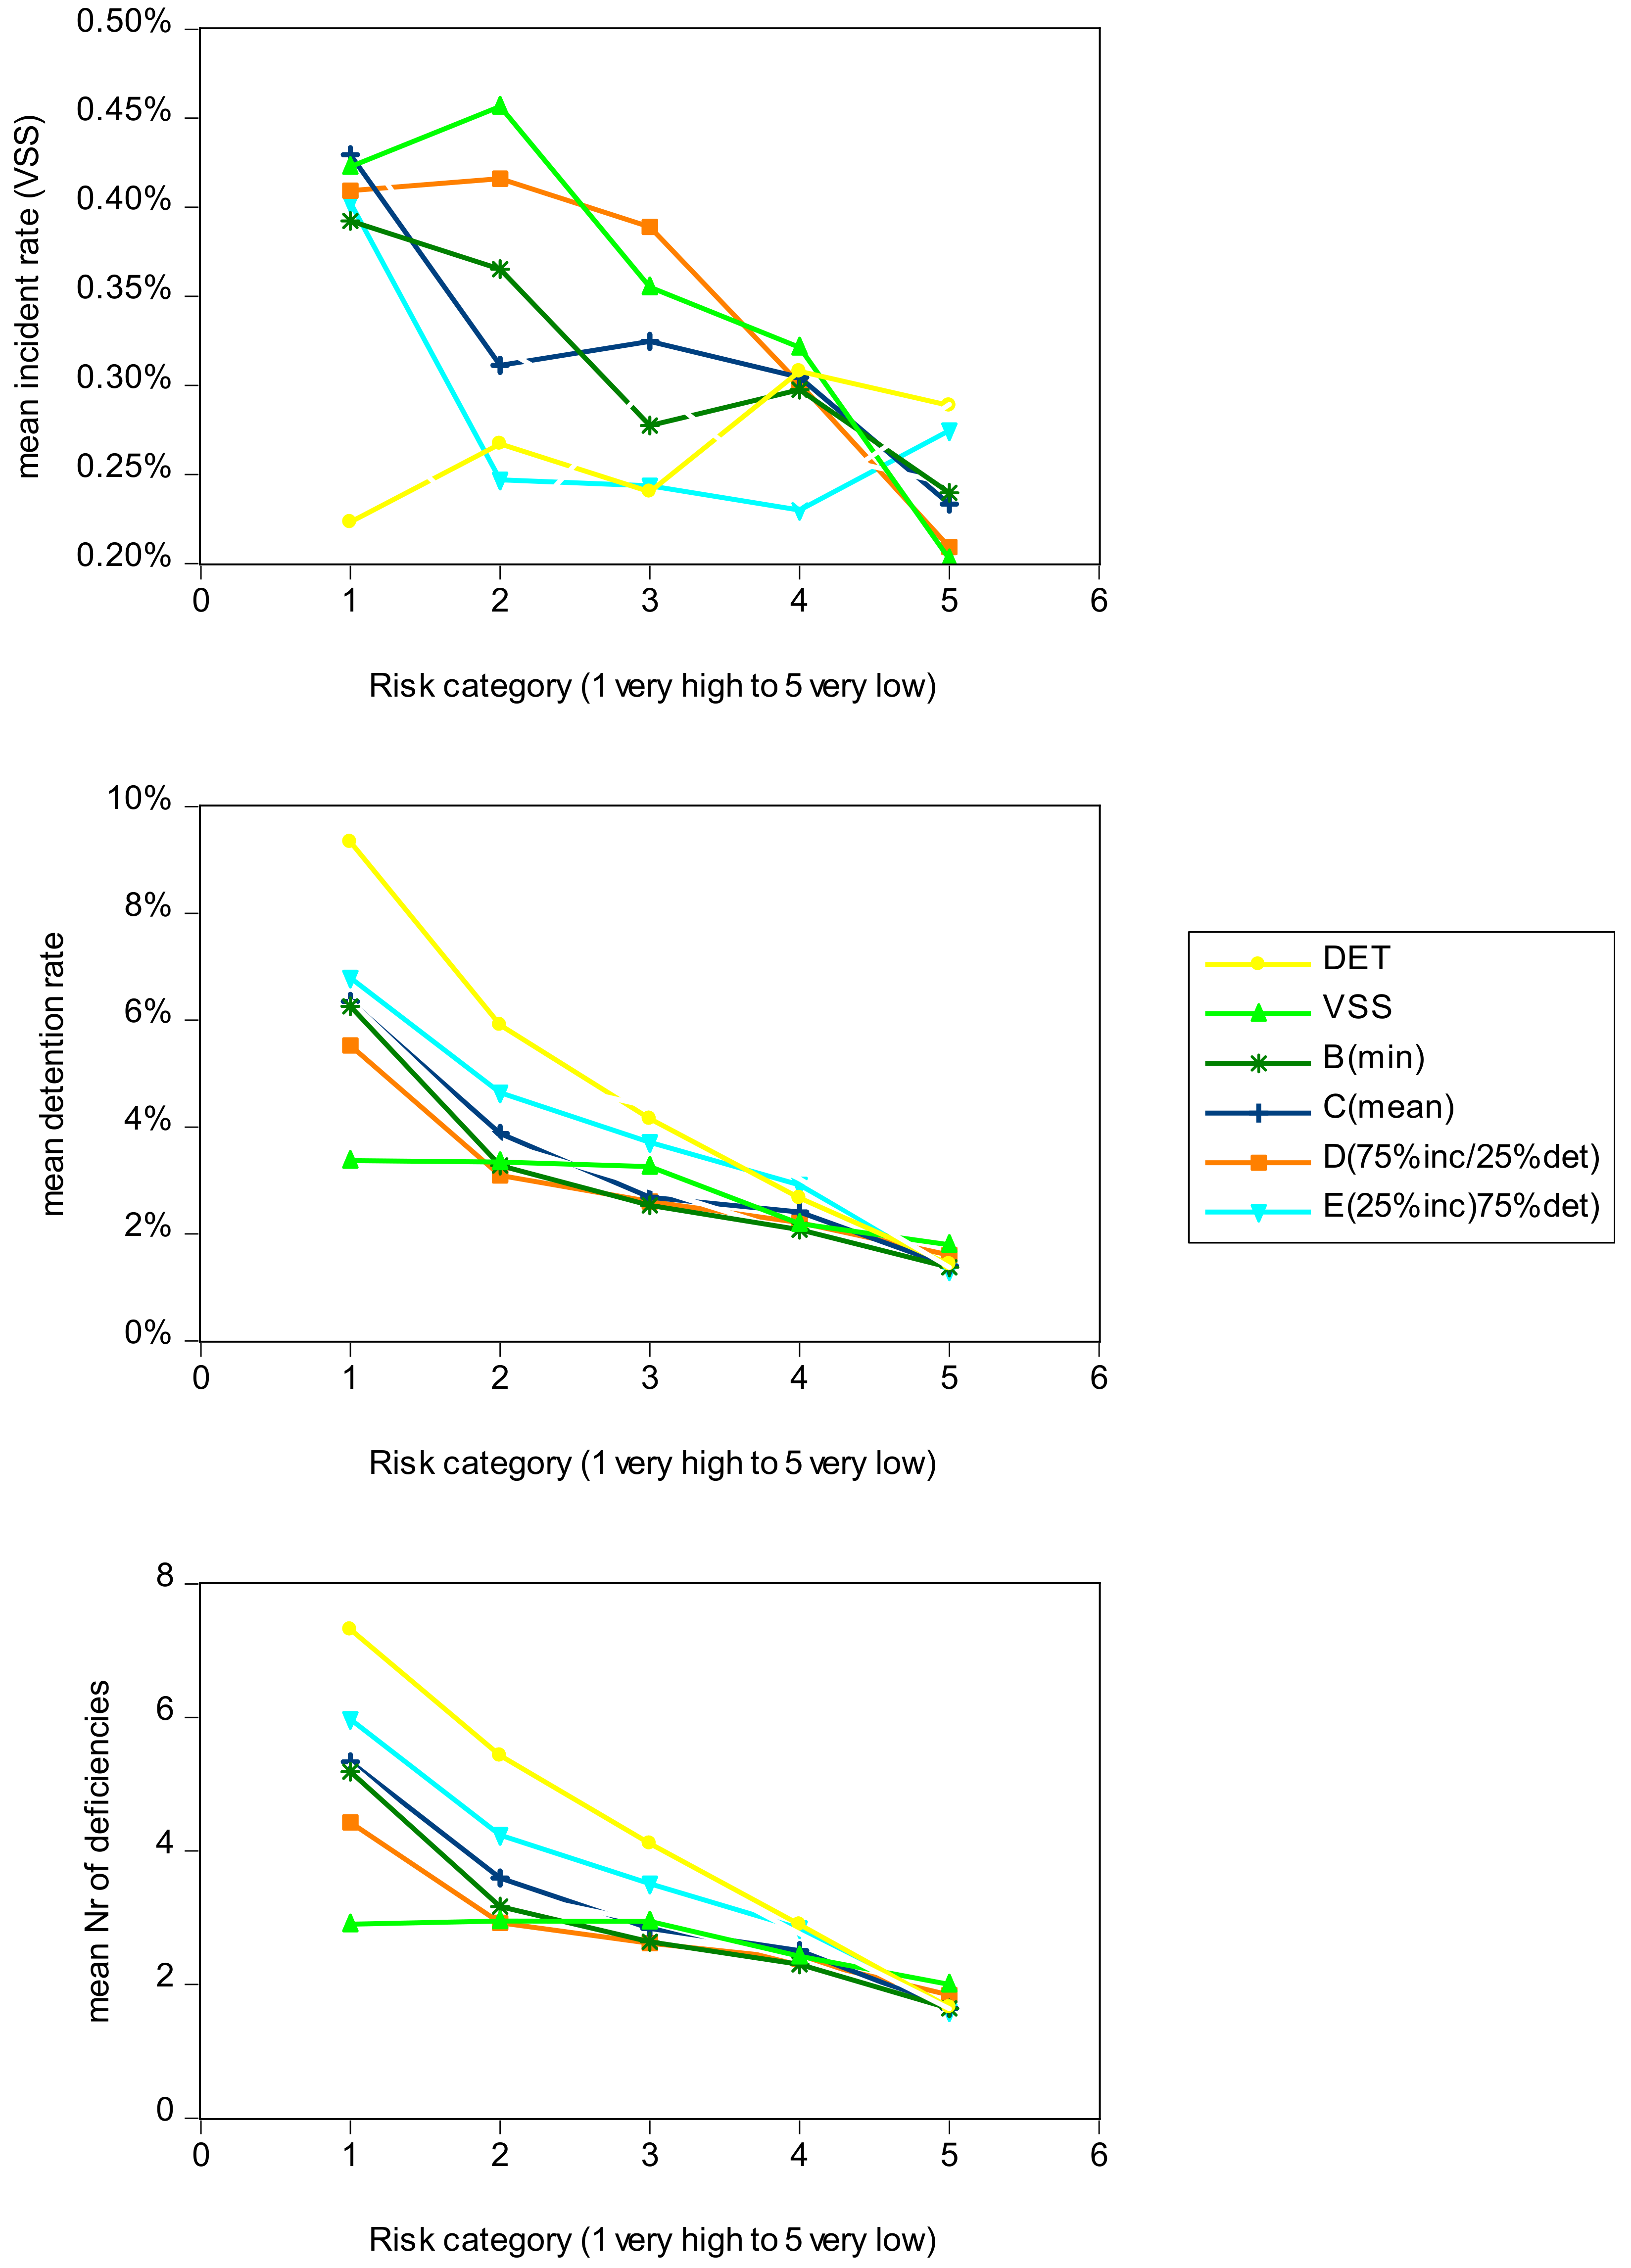
Figure 4 provides the mean deficiency rate and detention rate of inspected ships and the mean incident rate of all vessels for each of the suggested risk categories which should be higher for higher risk categories.
The final part of the analysis compares observed incident types with the eight-vessel inspection priority risk areas. The 817 incidents (including vessels that had more than one incident per quarter, which is therefore more than the 756 incidents mentioned in Table 5) are manually checked to identify the first event of what is normally a chain of events. Since an incident can have multiple events and consequences, this leads to 886 outcomes (84 for VS) linked to the inspection priority risk areas. Vessels with high risk (RC1 to RC3) are identified and Table 6 shows the percentage of these vessels to the total of relevant incidents for each category. Some incident types such as grounding, stranding and loss of life, have few observations and it is not possible to distinguish between powered and drift grounding with the available data, hence the comparison is made with grounding/stranding for this type of category using the same count.
In the future, vessel inspection priority risk areas can be extended by adding for instance models related to the maritime labor convention (MLC) and by producing MLC type deficiency probabilities. Another possible improvement is related to occupational safety type incidents and human error. The empirical data showed 45 such cases (21 for VS) that cannot be easily matched against any risk inspection priority areas at this stage but could be in the future if there is a separate risk model for occupational safety related incidents.
The inspection priority risk areas can also be used to further improve targeting vessels for inspection in addition to using combined Methods A–E. This idea was tested using the inspection priority risk areas of the 817 vessels that had incidents with results shown in Table 7. Table 7 shows the improvement compared to random selection by using the various methods alone and by combining them with inspection priorities that have high risk ratings (RC1 to RC3). For instance, for Method B, improvement over random selection is 0.24 (1.24–1) compared to using Method B alone for targeting. Using at least one of the inspection priorities that have high risk ranking in addition to Method B, overall improvement is 1.63 (2.63–1) over random selection or 1.39 (2.63–1.24) compared to using Method B alone. Based on Table 7, using at least four or more inspection priorities with higher risk rankings in addition to a base targeting method alone (e.g., such as Method B) seems to provide a good balance between improvement and the number of added vessels that would be selected for inspection as shown in the last row of Table 7.
The selection of how many of the risk priorities need to show a higher risk rating (e.g., 1 to 8) to be considered for inspection is up to policy makers and available resources. The inspection priority areas are more refined models (all restricted to VSS incidents) than the base VSS incident model and are worth been considered is more than three or four show high risk rating as they are also correlated (please refer to Appendix D, Table A3) indicating if a vessel has higher risk areas in one or two areas, it most likely will also show higher risk ranking in other areas.
4. Application Example for Inspectors
The approach presented in the previous section provides a data-driven or quantitative approach to assist selecting vessels for inspection and focusing inspection efforts with the aim to reduce false negative events. The data-driven part can be combined with other intelligence and expert knowledge of inspectors to finalize inspection selection and execution. The procedure can be split up into the following three main steps, where the first two steps can be fully automated and the final step allows addition of qualitative knowledge and other relevant intelligence.
- Step 1: Use risk formulas that are updated every three to five years to estimate ship-specific probabilities based on up-to-date data feeds that are received daily or weekly.
- Step 2: Calculate percentile ranks relative to the relevant benchmark sample (e.g., global fleet or vessels that visited the relevant region during the last three or five years) and classify vessels into risk categories. Consider inspection priority risk areas to focus inspection activities and to possibly further improve selection of vessels for inspection.
- Step 3: Combine the outcomes of Steps 1 and 2 with expected arrival data in a particular port or wider area of interest and plan the inspection visits based on priorities and capacities, taking the data-driven outcome as guidance. To finalize the inspection planning, use other available intelligence and expert knowledge, for instance, knowledge about specific companies or vessels known to inspectors or the region, market economic conditions, or new legislative requirements.
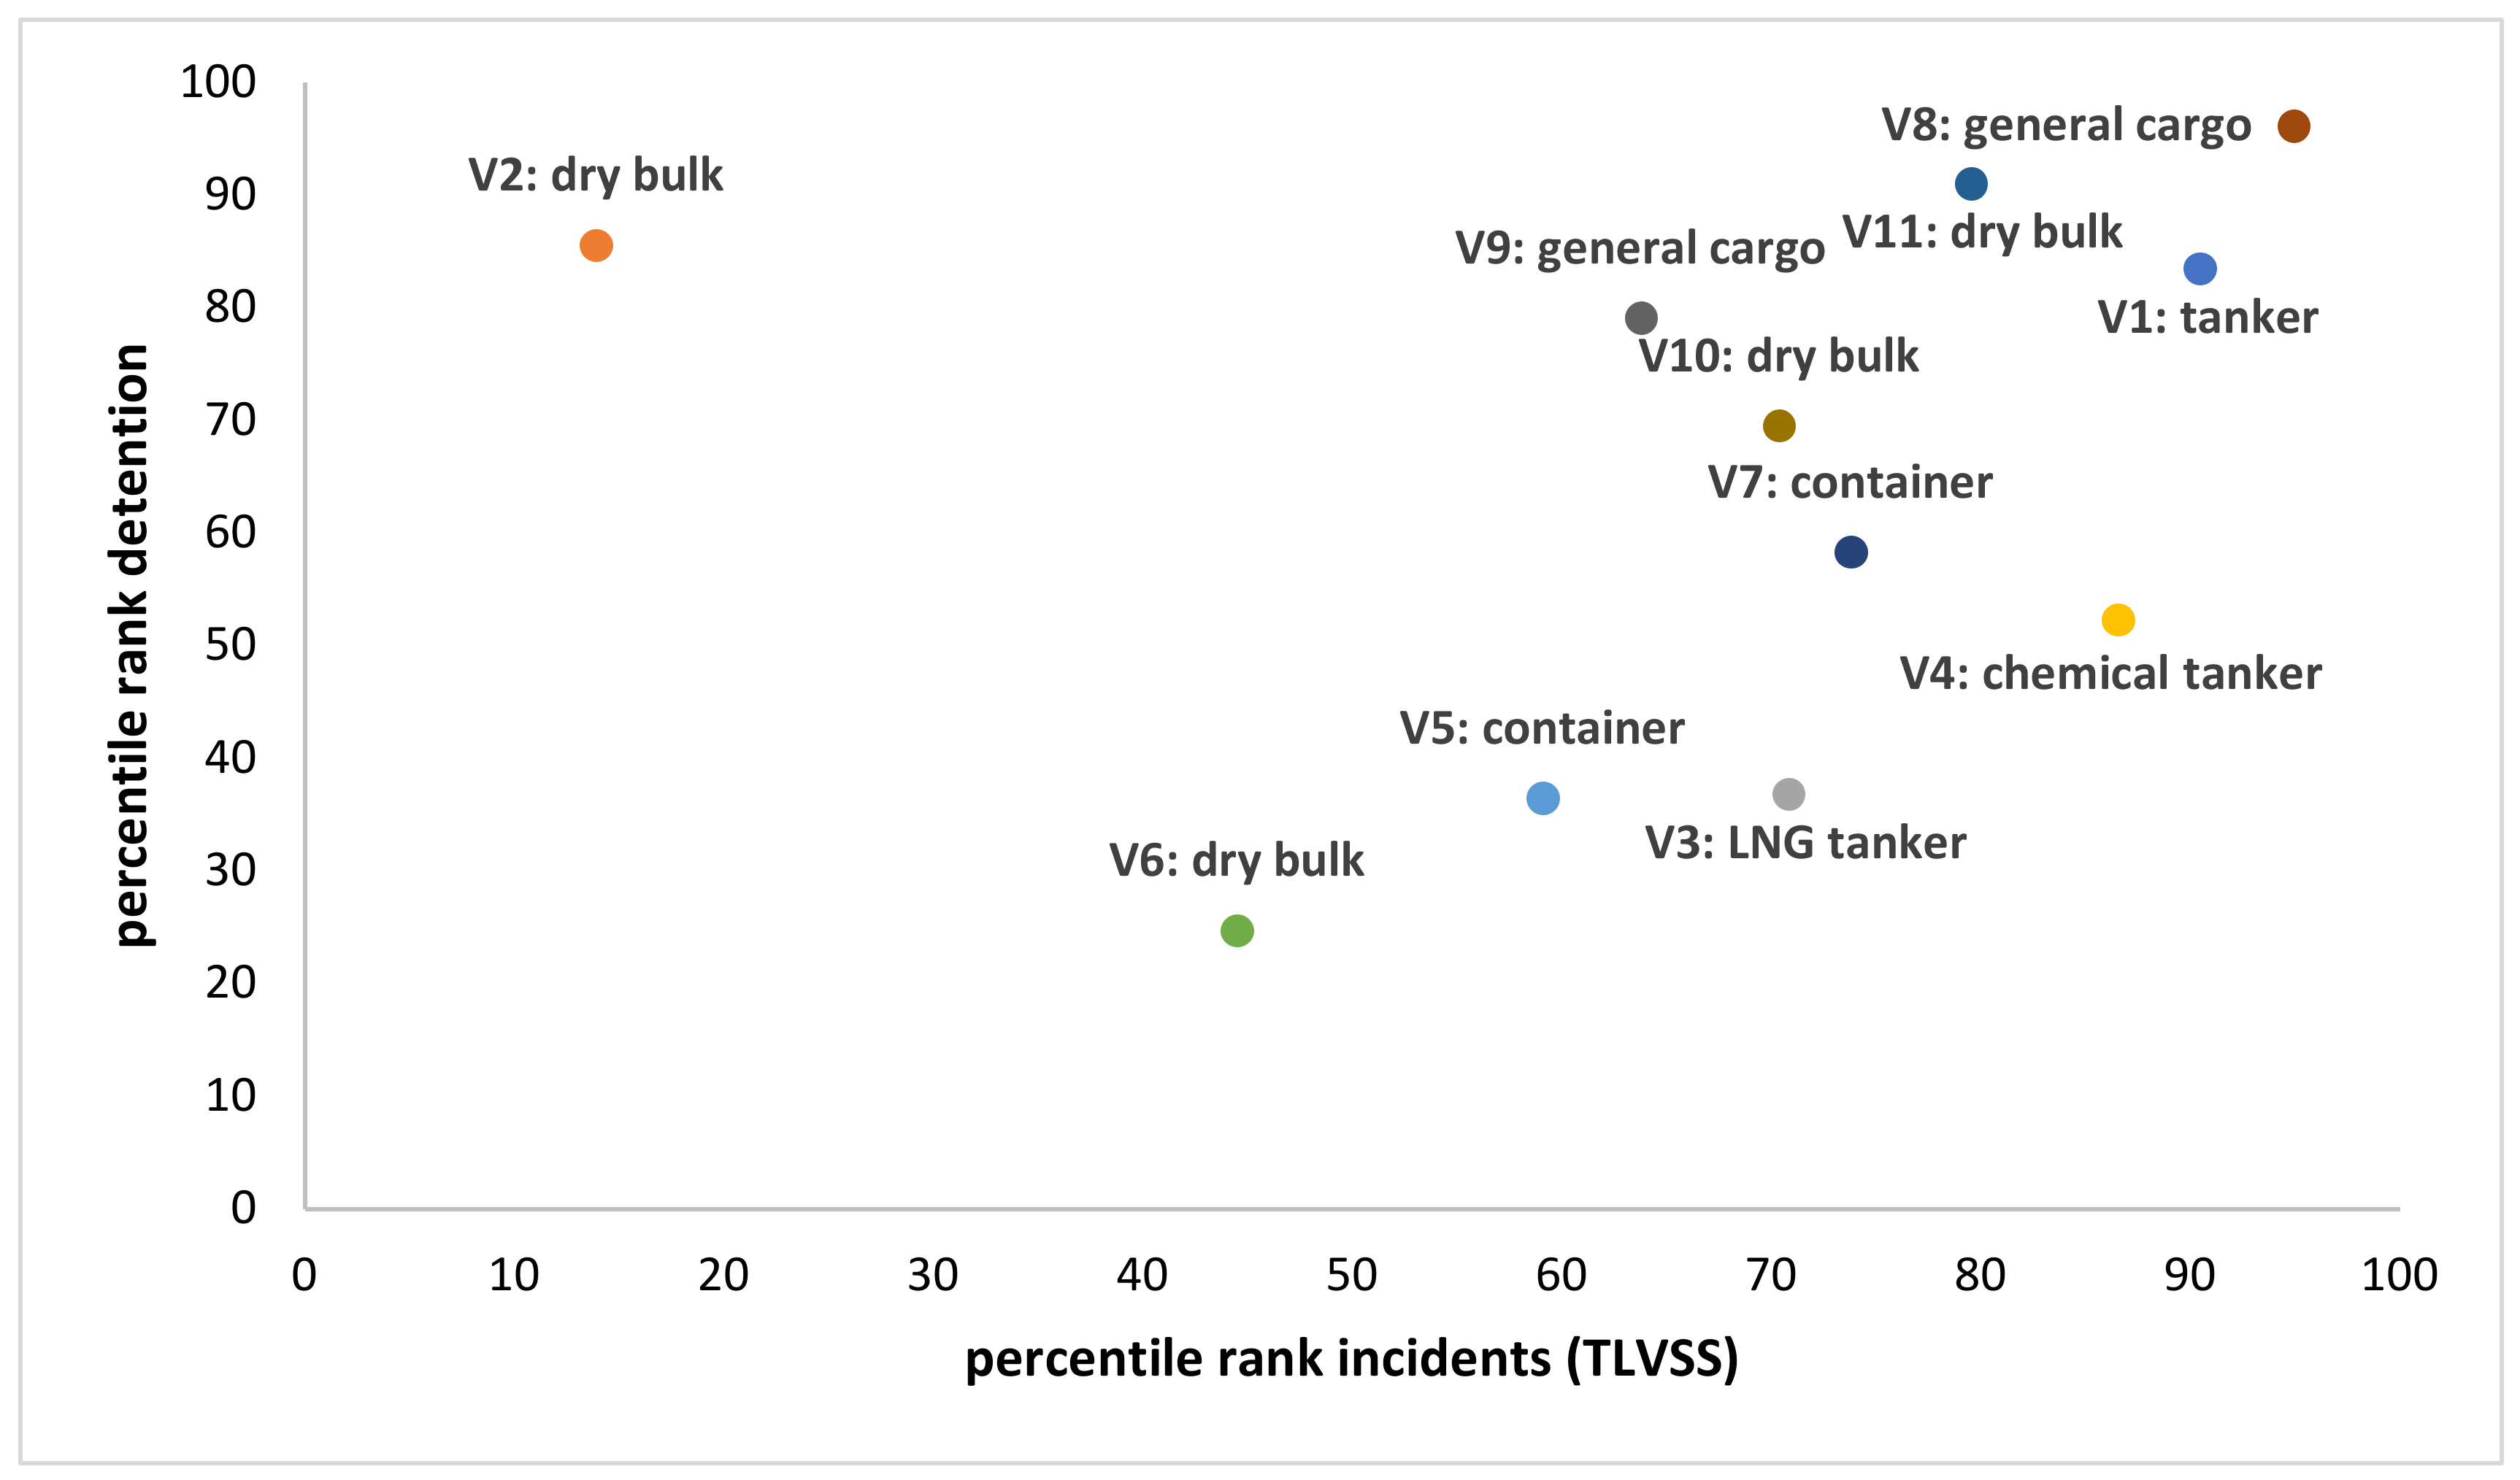
Risk dimensions can be shown graphically as visual assistance to inspectors. Figure 5 provides an example of 11 vessels that all had incidents, of which only one (container Vessel 5) has been selected for inspection (with a resulting detention). Such graphs can be generated automatically showing all vessels in port liable for inspection for a specific day or time period. The graph shows instantly where each vessel stands with respect to the others. In this particular example, the targeting method using a top 30% rule for detention only would have missed Vessels 3, 4, 5, 6, 7 and 10. If only incidents (VSS) are used for targeting, the top 30% rule would have missed Vessels 2, 5, 6 and 9. When using combined methods with the addition of inspection priority areas, all vessels could be considered for inspection.
This type of visualization could be complemented by a table (refer to Table 8 for an example) that lists the percentile ranks of selected methods and the percentile ranks for the vessel inspection priority risk areas. Note that in this example, all methods are shown. Under real operations, one or two would be chosen such as Method B, D, VSS and detention to cover all priorities and focuses. With respect to the inspection priority areas, the following is of interest given that all vessels experienced incidents but only one was selected for inspection and detained.
- Vessel 1 experienced a steering gear failure and stranded in February 2018. The percentile ranks for engine related failure is high (87.81) and drift grounding is medium (73.53). It arrived in port in January 2018 but was not inspected.
- Vessel 3 experienced main engine failures and was towed to port in late June 2018. The percentile rank for engine failure is high (80.87). It arrived three times in port (April, May and June) but was not selected for inspection.
- Vessel 4 experienced main engine failure and piston crown damage in late April 201. Its percentile rank for engine failure is high (85.20). It arrived in port four times prior to within 90 days of the incident and was not inspected.
- Vessel 8 experienced loss of life by mid Sept 2018. Percentile ranks of all methods are very high (above 90, and 94.71 for loss of life). It arrived in port twice in August, the last time just two weeks before the incident, but was not selected for inspection.
- Vessel 10 ran aground late in November 2018, was re-floated and departed. It has very high percentile ranks for drift grounding (97.41) and hull related failures (95.32). It arrived in port twice before the incident and was not inspected.
- Vessel 11 experienced engine problems late in October 2018. While its percentile rank of engine failure is low, the one for drift grounding is medium (78.15).
5. Discussion and Conclusions
This study considers and evaluates the status quo assumption of maritime inspections such as PSC inspections and industry inspections to primarily use past inspection outcomes – in particular past detention and deficiencies – to target vessels for inspections and to be able to identify future risky vessels. One of the main goals of inspections is to improve the safety quality of vessels and to reduce the probability of future incidents. The empirical analysis shows that for the year 2018, 60% of all vessels with a VSS incident were not inspected in the three months prior to the incident, and of the 40% that were inspected only 4% were detained. Furthermore, there is a low correlation (−0.04) between the probabilities of detention and incident (VSS) at ship level which confirms that these two dimensions measure different risk aspects and that targeting can be improved by combining these two risk dimensions.
The results further indicate that inspection efforts and inspection risk priorities can be improved by focusing them in a better way since inspectors could be guided the risk inspection priorities once a vessel is selected for inspection. One way to improve the effort is to treat detentions and incidents as two risk dimensions as suggested in this approach and to use methods that combine the two risk dimensions to target vessels for inspection and to guide the selection of the inspection priorities. In terms of targeting efficiency, the reduction of false negative events is the focus in order to minimize the probability that risky vessels are missed as incidents can be very costly.
Five targeting methods that combine the two risk dimensions (detention and incident) using percentile ranks are developed and tested against random selection of vessels using empirical data for 2018. The results show a potential gain (reduction of false negative events) of 14% to 27% compared to random selection which can be further improved if adding vessel inspection priority risk areas to the targeting routine. The study demonstrates that combined methods have the potential to reduce false negative events as the chance to catch risky vessels is improved. In the future, different weights for incident type risk and detention could be tested, especially if a longer time period for testing becomes available.
The use of percentile ranks makes it possible to combine two risk dimensions and allows customized benchmarking of vessels, for instance, by considering vessels for a specific country or region of interest rather than the global fleet used here. Since the percentile ranks are based on a benchmark sample which could be the global fleet or all vessels that arrived in a specific region over a time period (e.g., three or five years), the percentile ranks can be customized and are dynamic in nature since they automatically correct for improvements of the fleet since vessels are always compared against each other dynamically if the benchmarking routine is run daily or weekly. This approach is more dynamic to classify vessels compared to, for instance, just using an average detention rate that is used and not changed for many years.
The study presents risk categories and suggests associated inspection target coverage, which are tested for feasibility against arrival data of one country. However, these categories and target coverages are flexible and can be set by policy makers depending on their regional preferences and inspection capacities, along with the selection of the benchmark sample. It is recommended to customize the inspection coverage based on regional trade flows, inspection capacities and policies and to evaluate them yearly or every three years along with the size of the benchmark sample (e.g., all vessel arriving for the last 3, 5, 6 years etc.)
The study confirms that incident data still has many quality issues and it remains difficult to use these data to either estimate risk formulas or to validate targeting methods or to determine incident types related to inspection priority risk areas. This was partly overcome by restricting the data to VSS incidents, by using raw data from at least three different sources that can be manually classified. In addition, it is impossible to measure the number of vessels that did not have incidents due to inspections or that would not have had an incident if they had been inspected which is the most desirable outcome since inspections should improve safety qualities of vessels and reduce the likelihood of having an incident later on.
The eight considered vessel inspection priority risk areas provide the means to help inspectors in focusing their efforts, as these areas provide insight into the individual vessel risk profile. In the future, these areas could be extended further, for example, by adding Maritime Labor Convention deficiency type probabilities (e.g., fatigue and working, living and labor conditions) or by revising the incident type models to include incidents related to equipment failures or occupational incidents. Other combinations are possible given regional priorities and subject to availability of data.
The data-driven part to assist with targeting and to decide how to focus inspection priorities can be fully automated. It is simpler to visualize risk dimensions and risk priorities at the level of vessels that are expected to arrive in a port or in a specific regional area. The visualization can act as one component in the more complex process to select vessels for inspections and can be combined with qualitative aspects including other intelligence available and the inspector’s expert knowledge. These could for instance be mandatory or voluntary incident alerts that are available to some maritime administrations who are also involved in search and rescue operations. The percentile ranks could also be used to enhance domain awareness where risk profiles can be attached to Automatic Identification System (AIS) position records and vessels are monitored via automatic alerts (e.g., a high risk vessels enters a difficult area to navigate and starts drifting).
It should be acknowledged that the evaluation of new methods as presented here has two important restrictions. First, the inspection and detention data are the product of current inspection strategies across the globe and are therefore biased towards current targeting regimes. This means that potentially risky vessels that would have been detained if they would have been selected for inspection are not observed and are therefore not part of the empirical dataset used for validation here. In addition, if an incident was prevented due to an inspection, the desirable outcome cannot be observed. For this reason, evaluation is made against a random selection benchmark. Second, the incident data has several limitations. A true test of alternative inspection targeting approaches can only be obtained by implementing such approaches for some time to guide the inspection decisions and by recording some observable outcomes.
Author Contributions
S.K. identified the research area and worked on the data preparations, the logit models and the software to estimate probabilities. C.H. developed the overall methodology to combine the two risk dimensions. Both worked on the manuscript text collaboratively. All authors have read and agreed to the published version of the manuscript.
Funding
This research received no external funding
Acknowledgments
We thank the data providers for this manuscript, including IMO, LLI, and IHS Markit.
Conflicts of Interest
The authors declare not conflicts of interest.
Appendix A

Table A1.
Descriptive statistics by ship type of data sets and data feeds used.
| Incident Matrix | Detention Matrix | Count Data Feeds | ||||
| (2010 to 2014) | (2010 to 2014) | Per Quarter (2018) | ||||
| Ship Type | Nr Vessels | VSS | Nr Vessels | Detained | Indiv. IMO | % total |
| general cargo | 98,626 | 2,428 | 55,327 | 3,673 | 17,576 | 23.8% |
| dry bulk | 51,250 | 1,340 | 38,071 | 1,524 | 11,623 | 15.7% |
| container | 25,435 | 730 | 21,042 | 497 | 5,178 | 7.0% |
| tanker | 76,535 | 1,020 | 25,347 | 422 | 16,358 | 22.1% |
| passenger | 34,791 | 1,094 | 5,808 | 120 | 7,142 | 9.7% |
| other ship types | 89,871 | 2,262 | 12,592 | 222 | 16,028 | 21.7% |
| Total | 376,508 | 8,874 | 158,187 | 6,458 | 73,905 | 100.0% |
| Empirical Counts Used for Evaluation - Januar to December 2018 | ||||||
| Incident (VSS) | VSS/det Combined | Detention | ||||
| No | Yes | No | Yes | No | Yes | |
| Ship Type | Count | Count | Count | Count | Count | Count |
| general cargo | 70,019 | 285 | 69,177 | 1,127 | 15,025 | 862 |
| dry bulk | 46,373 | 119 | 45,808 | 684 | 20,570 | 569 |
| container | 20,635 | 77 | 20,465 | 247 | 8,846 | 173 |
| tanker | 65,320 | 112 | 65,136 | 296 | 13,062 | 188 |
| passenger | 28,453 | 115 | 28,432 | 136 | 1,554 | 25 |
| other ship types | 64,064 | 48 | 64,013 | 99 | 1,612 | 51 |
| Total | 294,864 | 756 | 293,031 | 2589 | 60,669 | 1868 |
Appendix B
Figure A1.
ROC curve—evaluation variable incidents (VSS): total incidents 756.

Figure A2.
ROC curve—evaluation variable detention: total detentions 1868.

Figure A3.
ROC curve—evaluation variable VSS and detention: total count 2589.

Appendix C
Table A2.
P values of the Satterthwaite Welch t-test.
| Method | Random | DET | VSS | B(min) |
| Very Serious and Serious Incidents (756) | ||||
| Top10 | ||||
| DET | 0.2115 | - | - | - |
| VSS | 0.0016 | 0.0000 | - | - |
| B(min) | 0.0118 | 0.0002 | 0.5158 | - |
| D(75inc/25det) | 0.0020 | 0.0000 | 0.9433 | 0.5628 |
| Top 30 | ||||
| DET | 0.0878 | - | - | - |
| VSS | 0.0000 | 0.0000 | - | - |
| B(min) | 0.0066 | 0.0000 | 0.0064 | - |
| D(75inc/25det) | 0.0000 | 0.0000 | 0.8767 | 0.0040 |
| Detention (1868) | ||||
| Top10 | Random | DET | VSS | B(min) |
| DET | 0.0000 | - | - | - |
| VSS | 0.0000 | 0.7531 | - | - |
| B(min) | 0.0000 | 0.0000 | 0.0000 | - |
| D(75inc/25det) | 0.0000 | 0.0000 | 0.0000 | 0.0001 |
| Top 30 | ||||
| DET | 0.0000 | - | - | - |
| VSS | 0.0000 | 0.1777 | - | - |
| B(min) | 0.0000 | 0.0000 | 0.0000 | - |
| D(75inc/25det) | 0.0000 | 0.0001 | 0.0128 | 0.0000 |
| Detention and Incidents Combined (2589) | ||||
| Top10 | Random | DET | VSS | B(min) |
| DET | 0.0001 | - | - | - |
| VSS | 0.0000 | 0.0894 | - | - |
| B(min) | 0.0000 | 0.0000 | 0.0000 | - |
| D(75inc/25det) | 0.0000 | 0.0000 | 0.0000 | 0.001 |
| Top 30 | ||||
| DET | 0.0000 | - | - | - |
| VSS | 0.0000 | 0.0000 | - | - |
| B(min) | 0.0000 | 0.0000 | 0.0000 | - |
| D(75inc/25det) | 0.0000 | 0.0000 | 0.0278 | 0.0144 |
Appendix D
Table A3.
Correlation of percentile ranks of vessel inspection priority risk areas.
| Area | COLL | DRFT GRD | POW GRD | FIRE | HULL | LIFE | MENG | POL |
|---|---|---|---|---|---|---|---|---|
| COLL | 1.00 | |||||||
| DRFTGRD | 0.72 | 1.00 | ||||||
| POWGRD | 0.60 | 0.54 | 1.00 | |||||
| FIRE | 0.46 | 0.24 | 0.49 | 1.00 | ||||
| HULL | 0.36 | 0.27 | 0.56 | 0.77 | 1.00 | |||
| LIFE | 0.41 | 0.23 | 0.29 | 0.62 | 0.53 | 1.00 | ||
| MENGINE | 0.67 | 0.85 | 0.43 | 0.17 | 0.13 | 0.23 | 1.00 | |
| POL | 0.38 | 0.21 | 0.32 | 0.49 | 0.54 | 0.64 | 0.20 | 1.00 |
Note: COLL = collisions, DRFTGRD = drift groundings, POWGRD = powered grounding, MENG = engine related failures, FIRE = fire and explosion, HULL = hull related failures, POL = pollution, LIFE = loss of life.
References
- Knapp, S. The Econometrics of Maritime Safety–Recommendations to Improve Safety at Sea; ERIM: Rotterdam, The Netherlands, 2006. [Google Scholar]
- Knapp, S.; Franses, P.H. A global view on port state control: Econometric analysis of the differences across port state control regimes. Marit. Policy Manag. 2007, 34, 453–482. [Google Scholar] [CrossRef]
- Heij, C.; Bijwaard, G.; Knapp, S. Ship inspection strategies: Effects on maritime safety and environmental protection. Transp. Res. Part D Transp. Environ. 2011, 16, 42–48. [Google Scholar] [CrossRef] [Green Version]
- Heij, C.; Knapp, S. Shipping Inspections, Detentions and Accidents: An Empirical Analysis of Risk Dimensions. Marit. Policy Manag. 2019, 47. [Google Scholar]
- Knapp, S.; Franses, P.H. Econometric analysis on the effect of port state control inspections on the probability of casualty. Mar. Policy 2007, 31, 550–563. [Google Scholar] [CrossRef]
- Bijwaard, G.; Knapp, S. Analysis of Ship Life Cycles—The Impact of Economic Cycles and Ship Inspections. Marine Policy 2009, 33, 350–369. [Google Scholar] [CrossRef]
- Perepelkin, M.; Knapp, S.; Perepelkin, G.; De Pooter, M. An improved methodology to measure flag performance for the shipping industry. Mar. Policy 2010, 34, 395–405. [Google Scholar] [CrossRef]
- Cariou, P.; Mejia, M.Q., Jr.; Wolff, F.-C. An econometric analysis of deficiencies noted in port state control inspections. Marit. Policy Manag. 2007, 34, 243–258. [Google Scholar] [CrossRef]
- Cariou, P.; Mejia, M.Q., Jr.; Wolff, F.-C. On the effectiveness of port state control inspections. Transp. Res. Part E: Logist. Transp. Rev. 2008, 44, 491–503. [Google Scholar] [CrossRef]
- Ji, X.; Brinkhuis, J.; Knapp, S. A method to measure enforcement effort in shipping with incomplete information. Mar. Policy 2015, 60, 162–170. [Google Scholar] [CrossRef] [Green Version]
- Heij, C.; Knapp, S. Predictive power of inspection outcomes for future shipping accidents – an empirical appraisal with special attention for human factor aspects. Marit. Policy Manag. 2018, 45, 604–621. [Google Scholar] [CrossRef] [Green Version]
- Chung, W.-H.; Kao, S.-L.; Chang, C.-M.; Yuan, C.-C. Association rule learning to improve deficiency inspection in port state control. Marit. Policy Manag. 2019, 1–20. [Google Scholar] [CrossRef]
- Wang, S.; Yan, R.; Qu, X. Development of a non-parametric classifier: Effective identification, algorithm, and applications in port state control for maritime transportation. Transp. Res. Part B Methodol. 2019, 128, 129–157. [Google Scholar] [CrossRef]
- Li, K.X.; Yin, J.; Fan, L. Ship safety index. Transp. Res. Part A Policy Pr. 2014, 66, 75–87. [Google Scholar] [CrossRef]
- Yang, Z.; Wang, J.; Li, K.X. Maritime safety analysis in retrospect. Marit. Policy Manag. 2013, 40, 261–277. [Google Scholar] [CrossRef]
- Yang, Z.; Yang, Z.; Yin, J. Realising advanced risk-based port state control inspection using data-driven Bayesian networks. Transp. Res. Part A: Policy Pr. 2018, 110, 38–56. [Google Scholar] [CrossRef]
- Luo, M.; Shin, S. Half-century research developments in maritime accidents: Future directions. Accid. Anal. Prev. 2019, 123, 448–460. [Google Scholar] [CrossRef] [PubMed]
- IMO. Reports on Marine Casualties and Incidents—Revised Harmonized Reporting Procedures; IMO Document MSC/Circ. 953, MEPC/Circ. 372; IMO: London, UK, 2000. [Google Scholar]
- Hassel, M.; Asbjørnslett, B.E.; Hole, L.P. Underreporting of maritime accidents to vessel accident databases. Accid. Anal. Prev. 2011, 43, 2053–2063. [Google Scholar] [CrossRef] [PubMed] [Green Version]
- Knapp, S.; Franses, P.H. Econometric analysis to differentiate effects of various ship safety inspections. Mar. Policy 2008, 32, 653–662. [Google Scholar] [CrossRef]
- Knapp, S. An Integrated Risk Estimation Methodology: Ship Specific Incident Type Risk; Econometric Institute Report; Erasmus School of Economics: Rotterdam, The Netherlands, 2013; Available online: http://repub.eur.nl/res/pub/39596/ (accessed on 29 March 2020).
- Bera, A.K.; Greene, W.H. Econometric Analysis. J. Am. Stat. Assoc. 1994, 89, 1567. [Google Scholar] [CrossRef]
Figure 1.
Receiver operating characteristic (ROC) curve top 30%—evaluation variable incidents (VSS): total incidents 756.
Figure 1.
Receiver operating characteristic (ROC) curve top 30%—evaluation variable incidents (VSS): total incidents 756.

Note: Y-axis: true positive rate, X-axis: false positive rate
Figure 2.
ROC curve top 30%—evaluation variable detention: total detentions 1868.

Note: Y-axis: true positive rate, X-axis: false positive rate
Figure 3.
ROC curve top 30%—evaluation variable VSS and detention combined: total count 2589.

Note: Y-axis: true positive rate, X-axis: false positive rate
Figure 4.
Incident rate (%), detention rate (%), and mean number of deficiencies per risk category.

Note: mean incident rate = sum of incidents/total nr of unique vessels by RC, mean detention rate = sum of detentions/sum of inspections by RC, mean nr of deficiencies = sum of deficiencies/total nr of unique inspected vessels.
Figure 5.
Example of visualization of risk dimensions of vessels in port.

Table 1.
Data sources used in the analysis.
| Data Used for: | Time Frame and Number of Observations | Data Types and Sources |
|---|---|---|
| Estimating risk formulas (incident, VSS and 8 incident types) | Jan 2010 to Dec 2014 376,508 total observations 8874 VSS incidents | Ship-particular data from IHSM Global PSC inspection data Global incident data from IMO, IHSM and LLI |
| Estimating risk formulas (detention) | Jan 2010 to Dec 2014 158,187 inspections 6458 detentions | |
| Estimating probabilities (detention and incident types) | Dec 2017 to Sept 2018 73,905 vessels per period 295,620 for 4 periods | Quarterly data feeds of incident, inspection and ship particular data from IMO, IHSM and LLI |
| Validating methods | Jan 2018 to Dec 2018 1868 detentions 756 VSS incidents | Global quarterly incidents and detention feeds (756 incidents when counting incident by quarter by IMO without duplicates, and 817 incidents when counting duplicates) |
Note: All data is for the world fleet with 73,905 vessels, excluding fishing vessels and tugs, and with the following status codes: in service, commission, laid-up, launched, in casualty or repair, converting, US Reserve Fleet. Further, VSS denotes very serious and serious incidents including total loss.
Table 2.
Models chosen for this analysis and their related risk priority inspection areas.
| Acronym | Model Type | Use of Model |
|---|---|---|
| DET | Detention | For targeting—to combine with VSS |
| VSS | Incident (very serious and serious) | For targeting—to combine with detention |
| COLL | Collision (VSS) and | Collision and powered groundings are both proxies to passage planning, bridge management, crew qualification |
| POWGRD | Powered grounding (VSS) | |
| ENG | Main engine failures (VSS) and | Engine failures and drift groundings are both proxies to main engine failures, black outs, emergency procedures |
| DRFTGRD | Drift grounding (VSS) | |
| FIRE | Fire and explosion (VSS) | Proxy to fire related aspects, emergency procedures |
| HULL | Hull failure (VSS) | Proxy to maintenance related issues including tanks and water integrity |
| LIFE | Loss of life (VSS) | Proxy to occupational safety, safety management, lifeboats |
| POL | Pollution (VSS) | Proxy to pollution prevention and emergency response |
Table 3.
Targeting methods evaluated.
| Targeting Methods | Description |
|---|---|
| Detention (only) | Vessels are ranked by percentile ranks from detention probabilities only. |
| Incidents (only) | Vessels are ranked by percentile ranks from VSS incident type probability (TLVSS = total loss, very serious and serious). |
| Combined methods – combining percentile ranks of detention and VSS: | |
| Method A (max) | Vessels are ranked by the highest of the two base percentile ranks |
| Method B (min) | Vessels are ranked by the lowest of the two base percentile ranks |
| Method C (weight) | Vessels are ranked by a weight of 50/50 incident to detention |
| Method D (weight) | Vessels are ranked by a weight of 75/25 incident to detention |
| Method E (weight) | Vessels are ranked by a weight of 25/75 incident to detention |
Table 4.
Risk categories and suggested yearly target inspection coverage.
| Risk Category | Percentile Rank | Suggested Target Inspection Coverage |
|---|---|---|
| RC1: Very high risk | 90 to 100 | 100% |
| RC2: High risk | 80 to 89 | 100% |
| RC3: Medium risk | 70 to 79 | 90% |
| RC4: Low risk | 60 to 69 | 10% random selection |
| RC5: Very low risk | 0 to 59 | 5% random selection |
Table 5.
Reduction in false negatives compared to random selection (top 5% to top 30% of vessels).
| Evaluation Variable | % Top | Emp. Count | DET | VSS | A | B | C | D | E |
|---|---|---|---|---|---|---|---|---|---|
| VSS | 5 | 756 | 1.0% | −1.6% | 0.0% | −3.2% | −2.7% | −1.8% | −1.6% |
| (295,620) | 10 | 756 | 1.8% | −5.5% | −0.5% | −4.3% | −3.6% | −5.3% | −2.6% |
| 15 | 756 | 2.2% | −8.9% | −1.1% | −6.4% | −6.3% | −7.6% | −3.0% | |
| 20 | 756 | 2.3% | −11.5% | −3.9% | −7.1% | −6.9% | −11.0% | −1.0% | |
| 25 | 756 | 2.9% | −14.0% | −6.2% | −7.4% | −8.1% | −12.7% | −1.2% | |
| 30 | 756 | 3.4% | −14.1% | −6.0% | −7.2% | −8.8% | −14.4% | −1.4% | |
| Detained | 5 | 1868 | −4.2% | −2.0% | −3.0% | −12.0% | −11.8% | −10.3% | −9.8% |
| (62,537) | 10 | 1868 | −5.9% | −5.5% | −4.7% | −19.0% | −17.9% | −13.3% | −15.5% |
| 15 | 1868 | −7.3% | −8.6% | −6.4% | −22.1% | −21.7% | −16.4% | −17.3% | |
| 20 | 1868 | −9.9% | −11.1% | −7.3% | −24.6% | −22.3% | −18.0% | −19.0% | |
| 25 | 1868 | −11.1% | −13.1% | −9.3% | −26.5% | −22.8% | −19.1% | −19.2% | |
| 30 | 1868 | −14.0% | −6.2% | −10.5% | −27.7% | −23.4% | −20.2% | −19.3% | |
| VSS and | 5 | 2589 | −2.7% | −1.8% | −2.2% | −9.4% | −9.1% | −7.7% | −7.4% |
| detained | 10 | 2589 | −3.6% | −5.3% | −3.4% | −14.6% | −13.8% | −10.8% | −11.8% |
| combined | 15 | 2589 | −4.5% | −8.5% | −4.9% | −17.5% | −17.1% | −13.8% | −13.0% |
| (295,620) | 20 | 2589 | −6.3% | −11.0% | −6.1% | −19.6% | −17.8% | −15.9% | −13.6% |
| 25 | 2589 | −7.0% | −13.2% | −8.2% | −21.0% | −18.5% | −17.1% | −13.9% | |
| 30 | 2589 | −8.8% | −15.4% | −9.0% | −21.9% | −19.1% | −18.5% | −14.0% |
Note: DET = detention, VSS = incident, A (max), B (min), C (mean), D (75%incident/25% detention), E (25% incident/75% detention)
Table 6.
Percentage of vessels identified in risk Category 1 to 3 by inspection priority risk areas (2018).
Table 6.
Percentage of vessels identified in risk Category 1 to 3 by inspection priority risk areas (2018).
| Observed | Corresponding | VSS | VS | ||
|---|---|---|---|---|---|
| Incident Type/First Event | Inspection Priority Areas | Total | RC1-RC3 | Total | RC1-RC3 |
| Pollution | Pollution | 52 | 30.8% | 3 | 0.0% |
| Loss of life | Loss of life | 31 | 12.9% | 31 | 12.9% |
| Collision/contact | Collision and Contact | 202 | 31.2% | 5 | 0.0% |
| Fire and explosion | Fire and Explosion | 72 | 34.7% | 12 | 25.0% |
| Engine/mechanical failures | Engine related failures | 317 | 59.9% | 4 | 50.0% |
| Propulsion/Steering gear failure | Drift grounding | 32 | 34.4% | - | n/a |
| Hull related/stranding | Hull related failures | 160 | 33.1% | 19 | 47.4% |
| Grounding/standing | Powered grounding | 19 | 63.2% | 10 | 70.0% |
| Drift grounding | 19 | 57.9% | 10 | 60.0% | |
Note: For incident type related to grounding and stranding, inspection priority risk areas for powered groundings and drift grounding are matched since they cannot be easily distinguished from the observed data.
Table 7.
Improvement in targeting by adding priority risk areas (relative true positive hit rate).
| Methods | Random | Using Methods | Adding Inspection Priorities Showing High Risk Ranking (RC1 to RC3) with at Least: | |||||||
|---|---|---|---|---|---|---|---|---|---|---|
| Alone | 1 | 2 | 3 | 4 | 5 | 6 | 7 | 8 | ||
| detention | 1 | 0.88 | 2.71 | 2.36 | 2.04 | 1.73 | 1.36 | 1.20 | 1.04 | 0.98 |
| incident (VSS) | 1 | 1.49 | 2.59 | 2.19 | 1.86 | 1.66 | 1.54 | 1.49 | 1.49 | 1.49 |
| method A | 1 | 1.20 | 2.65 | 2.26 | 1.90 | 1.60 | 1.33 | 1.23 | 1.22 | 1.20 |
| method B | 1 | 1.24 | 2.63 | 2.31 | 2.04 | 1.82 | 1.55 | 1.45 | 1.35 | 1.31 |
| method C | 1 | 1.29 | 2.60 | 2.27 | 1.97 | 1.74 | 1.49 | 1.42 | 1.34 | 1.32 |
| method D | 1 | 1.49 | 2.58 | 2.21 | 1.89 | 1.69 | 1.55 | 1.50 | 1.50 | 1.49 |
| method E | 1 | 1.06 | 2.68 | 2.35 | 2.03 | 1.76 | 1.44 | 1.32 | 1.20 | 1.15 |
| Additional vessels selected | 343 | 252 | 177 | 117 | 58 | 33 | 16 | 9 | ||
Note: The relative hit rate corrects for different inspection rates and is calculated as follows: % correctly classified/% of vessels inspected which is 30% for RC1 to RC3.
Table 8.
Summary of percentile ranks of vessels in port.
| Percentiles for Targeting Methods | |||||||||
| Nr | Ship Type | DET | VSS | A(max) | B(min) | C(mean) | D(75/25) | E(25/75) | |
| 1 | oil tanker | 83.51 | 90.45 | 83.47 | 93.87 | 93.05 | 93.70 | 90.61 | |
| 2 | dry bulk | 85.58 | 13.92 | 76.21 | 24.32 | 50.93 | 27.68 | 71.71 | |
| 3 | LNG tanker | 36.84 | 70.85 | 55.63 | 55.42 | 57.00 | 65.44 | 45.47 | |
| 4 | chemical tanker | 52.34 | 86.56 | 77.66 | 71.01 | 76.96 | 83.85 | 63.49 | |
| 5 | container | 36.51 | 59.11 | 40.84 | 55.09 | 48.20 | 54.61 | 41.81 | |
| 6 | dry bulk | 24.75 | 44.50 | 25.28 | 40.46 | 27.94 | 37.50 | 25.05 | |
| 7 | container | 58.35 | 73.82 | 59.53 | 76.72 | 72.79 | 74.32 | 64.97 | |
| 8 | general cargo | 96.15 | 94.94 | 92.89 | 99.02 | 98.63 | 98.33 | 98.52 | |
| 9 | general cargo | 79.12 | 63.79 | 66.71 | 81.28 | 79.14 | 72.11 | 80.40 | |
| 10 | dry bulk | 69.54 | 70.38 | 54.77 | 85.47 | 77.60 | 74.91 | 74.16 | |
| 11 | dry bulk | 91.06 | 79.55 | 84.27 | 91.72 | 91.98 | 88.10 | 93.13 | |
| Percentiles for Vessel Inspection Priorities Risk Areas | |||||||||
| Nr | Ship Type | COLL | DRFTGRD | POWGRD | ENGINE | FIRE | HULL | POL | LIFE |
| 1 | oil tanker | 84.58 | 73.53 | 77.77 | 87.81 | 96.40 | 72.62 | 90.16 | 95.06 |
| 2 | dry bulk | 13.28 | 51.20 | 42.49 | 64.34 | 29.82 | 25.78 | 3.06 | 12.84 |
| 3 | LNG tanker | 82.35 | 77.62 | 73.85 | 80.87 | 53.42 | 28.78 | 95.19 | 91.15 |
| 4 | chemical tanker | 72.25 | 76.37 | 75.77 | 85.20 | 96.91 | 78.66 | 21.65 | 78.17 |
| 5 | container | 79.22 | 55.55 | 42.01 | 42.91 | 74.94 | 50.38 | 57.49 | 54.65 |
| 6 | dry bulk | 61.21 | 38.59 | 71.39 | 45.17 | 69.66 | 32.83 | 38.96 | 12.78 |
| 7 | container | 69.99 | 40.58 | 67.44 | 49.69 | 14.58 | 80.09 | 21.18 | 75.91 |
| 8 | general cargo | 83.53 | 89.63 | 93.62 | 93.31 | 8.43 | 86.70 | 87.61 | 94.71 |
| 9 | general cargo | 18.36 | 20.46 | 44.36 | 24.03 | 29.14 | 10.03 | 69.05 | 15.67 |
| 10 | dry bulk | 59.66 | 97.41 | 46.48 | 59.02 | 45.05 | 95.32 | 35.90 | 39.41 |
| 11 | dry bulk | 73.46 | 78.15 | 79.22 | 58.47 | 68.22 | 82.25 | 66.59 | 66.49 |
Note: DET = detention, VSS = incident, COLL = collisions, DRFTGRD = drift groundings, POWGRD = powered grounding, ENGINE = engine related failures, FIRE = fire and explosion, HULL = hull related failures, POL = pollution, LIFE = loss of life. For the color coding of the risk categories, please refer to Table 4 which gives the percentile rank range for each risk category (RC1 to RC5).
© 2020 by the authors. Licensee MDPI, Basel, Switzerland. This article is an open access article distributed under the terms and conditions of the Creative Commons Attribution (CC BY) license (http://creativecommons.org/licenses/by/4.0/).
Share and Cite
MDPI and ACS Style
Knapp, S.; Heij, C. Improved Strategies for the Maritime Industry to Target Vessels for Inspection and to Select Inspection Priority Areas. Safety 2020, 6, 18. https://0-doi-org.brum.beds.ac.uk/10.3390/safety6020018
AMA Style
Knapp S, Heij C. Improved Strategies for the Maritime Industry to Target Vessels for Inspection and to Select Inspection Priority Areas. Safety. 2020; 6(2):18. https://0-doi-org.brum.beds.ac.uk/10.3390/safety6020018
Chicago/Turabian StyleKnapp, Sabine, and Christiaan Heij. 2020. "Improved Strategies for the Maritime Industry to Target Vessels for Inspection and to Select Inspection Priority Areas" Safety 6, no. 2: 18. https://0-doi-org.brum.beds.ac.uk/10.3390/safety6020018
Note that from the first issue of 2016, this journal uses article numbers instead of page numbers. See further details here.