The Effect of a LED Lighting Crosswalk on Pedestrian Safety: Some Experimental Results
by
 , , and
Sergio Maria Patella
1,* ,
,
Simone Sportiello
2,
Stefano Carrese
2,
Francesco Bella
2 and
Francesco Asdrubali
2 1
Faculty of Economics, Universitas Mercatorum, Piazza Mattei 10, 00186 Rome, Italy
2
Department of Engineering, Roma Tre University, Via Vito Volterra 62, 00146 Rome, Italy
*
Author to whom correspondence should be addressed.
Safety 2020, 6(2), 20; https://0-doi-org.brum.beds.ac.uk/10.3390/safety6020020
Submission received: 9 March 2020
/
Revised: 4 April 2020
/
Accepted: 6 April 2020
/
Published: 9 April 2020
Abstract
:The research presented in this paper is focused on the definition of a new methodology for evaluating how illuminated crosswalks influence drivers’ behavior when approaching the zebra in nighttime conditions. The proposed methodology is based on in situ speed measurements, and cars’ speed was detected in an urban road segment of the city of Rome with a Telelaser instrument. Vehicles speed profiles are measured in the same road segment both in LED-illuminated conditions and in non-illuminated conditions. Results have shown a promising impact of the LED lighting system on pedestrian safety. In fact, cars’ mean speed decreases by 19.3% at the crosswalk section in illuminated conditions. Moreover, a positive effect on safety, in terms of mean speed reduction (−16.4%), was found even in the absence of pedestrians.
1. Introduction
The importance of horizontal signs and its influence on safety, especially in conditions of poor visibility (night, fog, rain, etc.), has been widely described in the literature. Many authors [1,2,3,4] found that most road accidents in industrialized countries occurred in nighttime conditions; thus, as found by Horberry et al. (2006) [5], improvements in night visibility may be the major factor in reducing the number of accidents. Polus and Katz (1978) [6] showed a significant reduction in night car–pedestrian accidents when the crosswalk sections are equipped with lighting. Moreover, speed was identified as a key factor in the occurrence of a road accident, as it influences both the risk of an accident occurring and the severity of the damage due to the impact [7].
According to IESNA (2000) [8], the percentage of fatal accidents that occurred in unlighted pedestrian crossings is about three times higher than the cases where there is a lighting system. A comprehensive overview of the lighting systems for pedestrian crossings can be found in Bullough et al. (2009) [9]. In many crosswalk sections in major cities around the world, in order to increase the crossing safety, a signal equipped with LED lighting was installed, which illuminates the roadway at the pedestrian crossing. Markvica et al. (2019) [10], Peña-García et al. (2015) [11] and Davidovic et al. (2019) [12] found a positive effect of LED street lighting on road users’ perception of public space and mobility behavior. Other studies focused on energy savings and environmental implications associated with LED luminaires [13,14,15].
As to safety issues, many studies have focused on the effect of vertical lighting systems on pedestrian visibility at zebra crossings in nighttime conditions [16,17,18] and horizontal markings [19]. Jägerbrand et al. (2018) [20] showed the speed-reducing effect of speed humps with LED lighting placed directly above or in front of the hump, but could not reveal any significant differences in vehicle speed attributable to light conditions per se.
The study presented in this article aims at demonstrating how the presence of a LED lighting system in a pedestrian crossing reduces the speed of vehicles both in the presence and in the absence of pedestrians. To show this, speed measurements were performed in a one-way road segment, both in conditions of absence of lighting and with a LED lighting system.
Several studies focused on the driver’s speed in different lighting conditions using driving simulators [21,22,23]. Bella and Silvestri (2015) [24] analyzed driver’s speed behavior while approaching the zebra crossings under different conditions of vehicle–pedestrian interaction using a driving simulator.
At present, no research has examined the effects of pedestrian crossing lighting on driving behavior in nighttime conditions with in situ measurements. In this article, measurements were performed using a laser gun instrumentation, which detects the speed values of vehicles approaching the zebra. A similar procedure was used by Varhelyi (1998) [25], who measured the speed of vehicles approaching the crosswalk section in daytime through a laser gun equipment. The research presented in this paper aims at evaluating the impact of a LED lighting system located in the pavement in the presence and in the absence of pedestrians at the zebra crossing. The methodology, detailed in the following section, can then be reapplied for different road categories, lighting technologies, and traffic situations.
2. Methodology
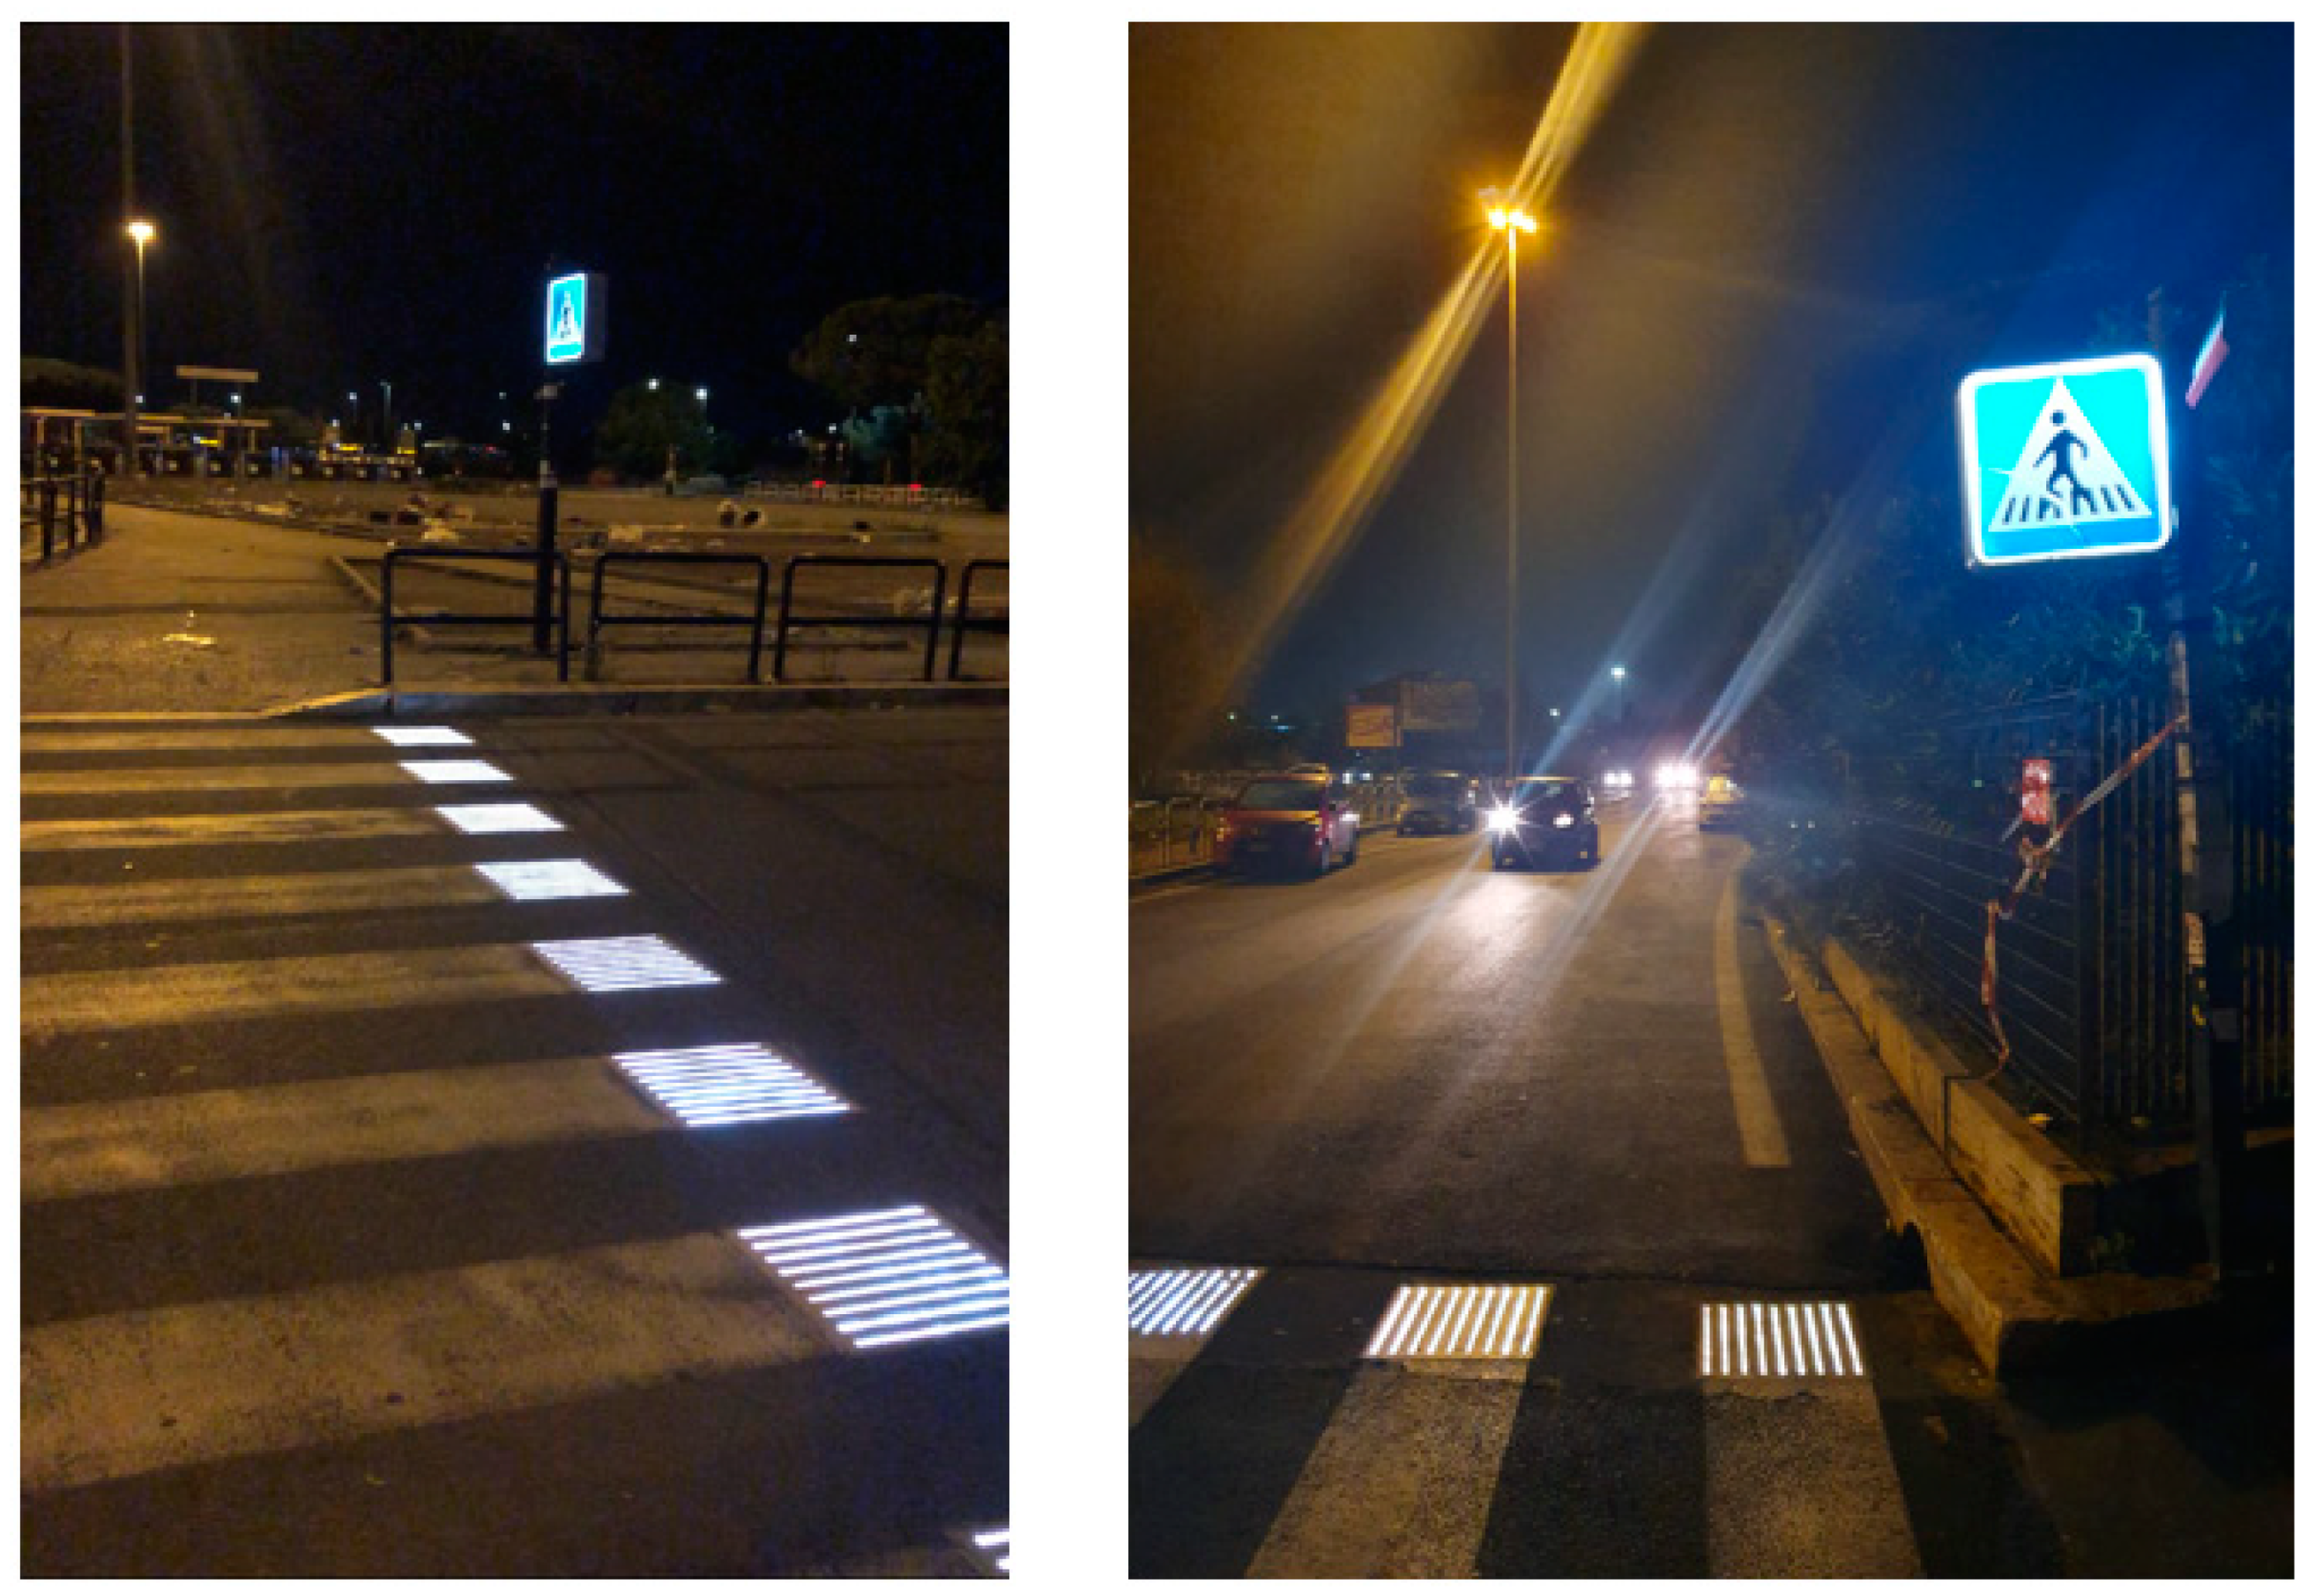
The methodology used is aimed at evaluating the safety improvements obtained with a LED lighting system positioned at the crosswalk section (Figure 1). The system is an innovative one, covered by a European patent, which is CE marked and complies with the standards UNE-EN 0598-1:2009+A11:2009, UNE-EN 61000-6-3:2007+A1:2012, UNE-EN 61547:2011 and UNE-EN 55015:2013 [26,27,28,29]. Each panel is 0.4 m × 0.4 m, it contains 9 LED stripes, it is supplied with both 12 V and 230 V and the protection index is IP67.
Using a TRUSPEED telelaser (Eltraff S.r.l., Concorezzo (MB), Italy) instrumentation, the speeds of vehicles approaching the zebra were measured in isolated-vehicle conditions. The telelaser equipment allows to collect speed measurements of an isolated vehicle with a frequency of 3 Hz. This instrument can be used from a minimum distance of 20 m to a maximum of 650 m from the vehicle, in a straight line (further technical details of the telelaser can be found in [30]). For each single vehicle, a succession of distance-speed data can be detected, obtaining a speed profile along the segment. The telelaser must be positioned in a hidden place not visible to drivers, in order to not generate an alteration of their behavior, such as unexpected deceleration to avoid a speed violation sanction (Figure 2).
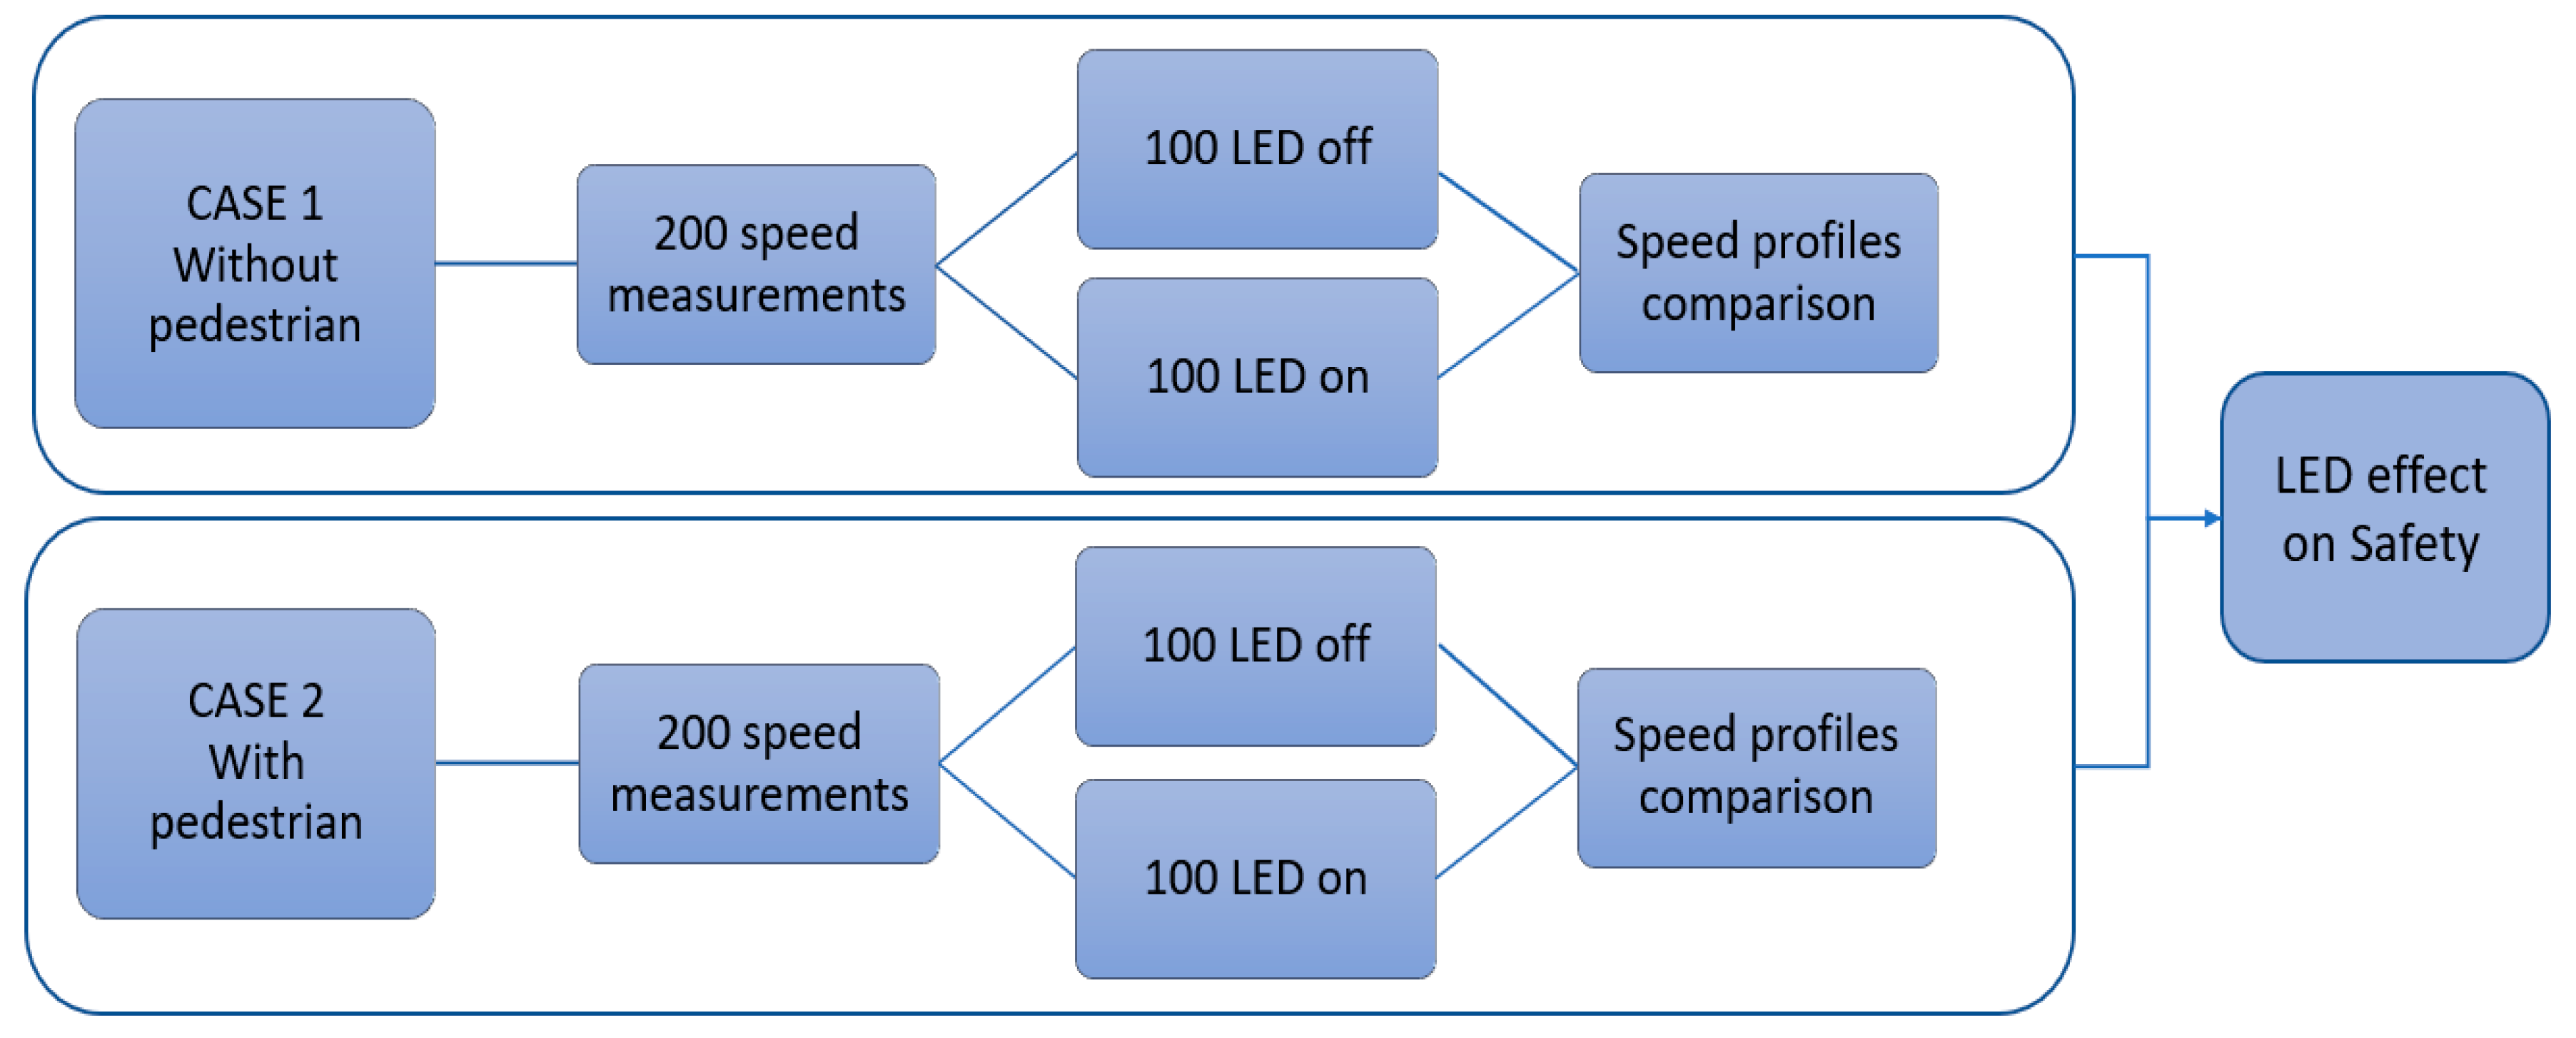
The investigation presented in this paper consists in two different cases: presence of pedestrian and absence of pedestrian. For both cases, the speed measurements were performed both in conditions of LED switched on and LED switched off, in order to examine comparatively the effect that the lighting system has on the driving style. The methodological scheme is reported in Figure 3.
The LED lights remains switched until a pedestrian passes under the optical sensor (Figure 4) and turns the lighting system on (Video S1). This one-stage pedestrian crossing section is located in the south of Rome close to a subway station named “Anagnina”, which represents one of the most important public transport hubs of the city [31,32,33].
The always-active LED condition is obtained through a pennant positioned in front of the sensor keeping the lighting always active. Once the two scenarios (LED on/off without pedestrian) have been recreated, speed measurements of each isolated vehicle were collected. A car is considered to be “isolated” if no other vehicles affects its driving behavior.
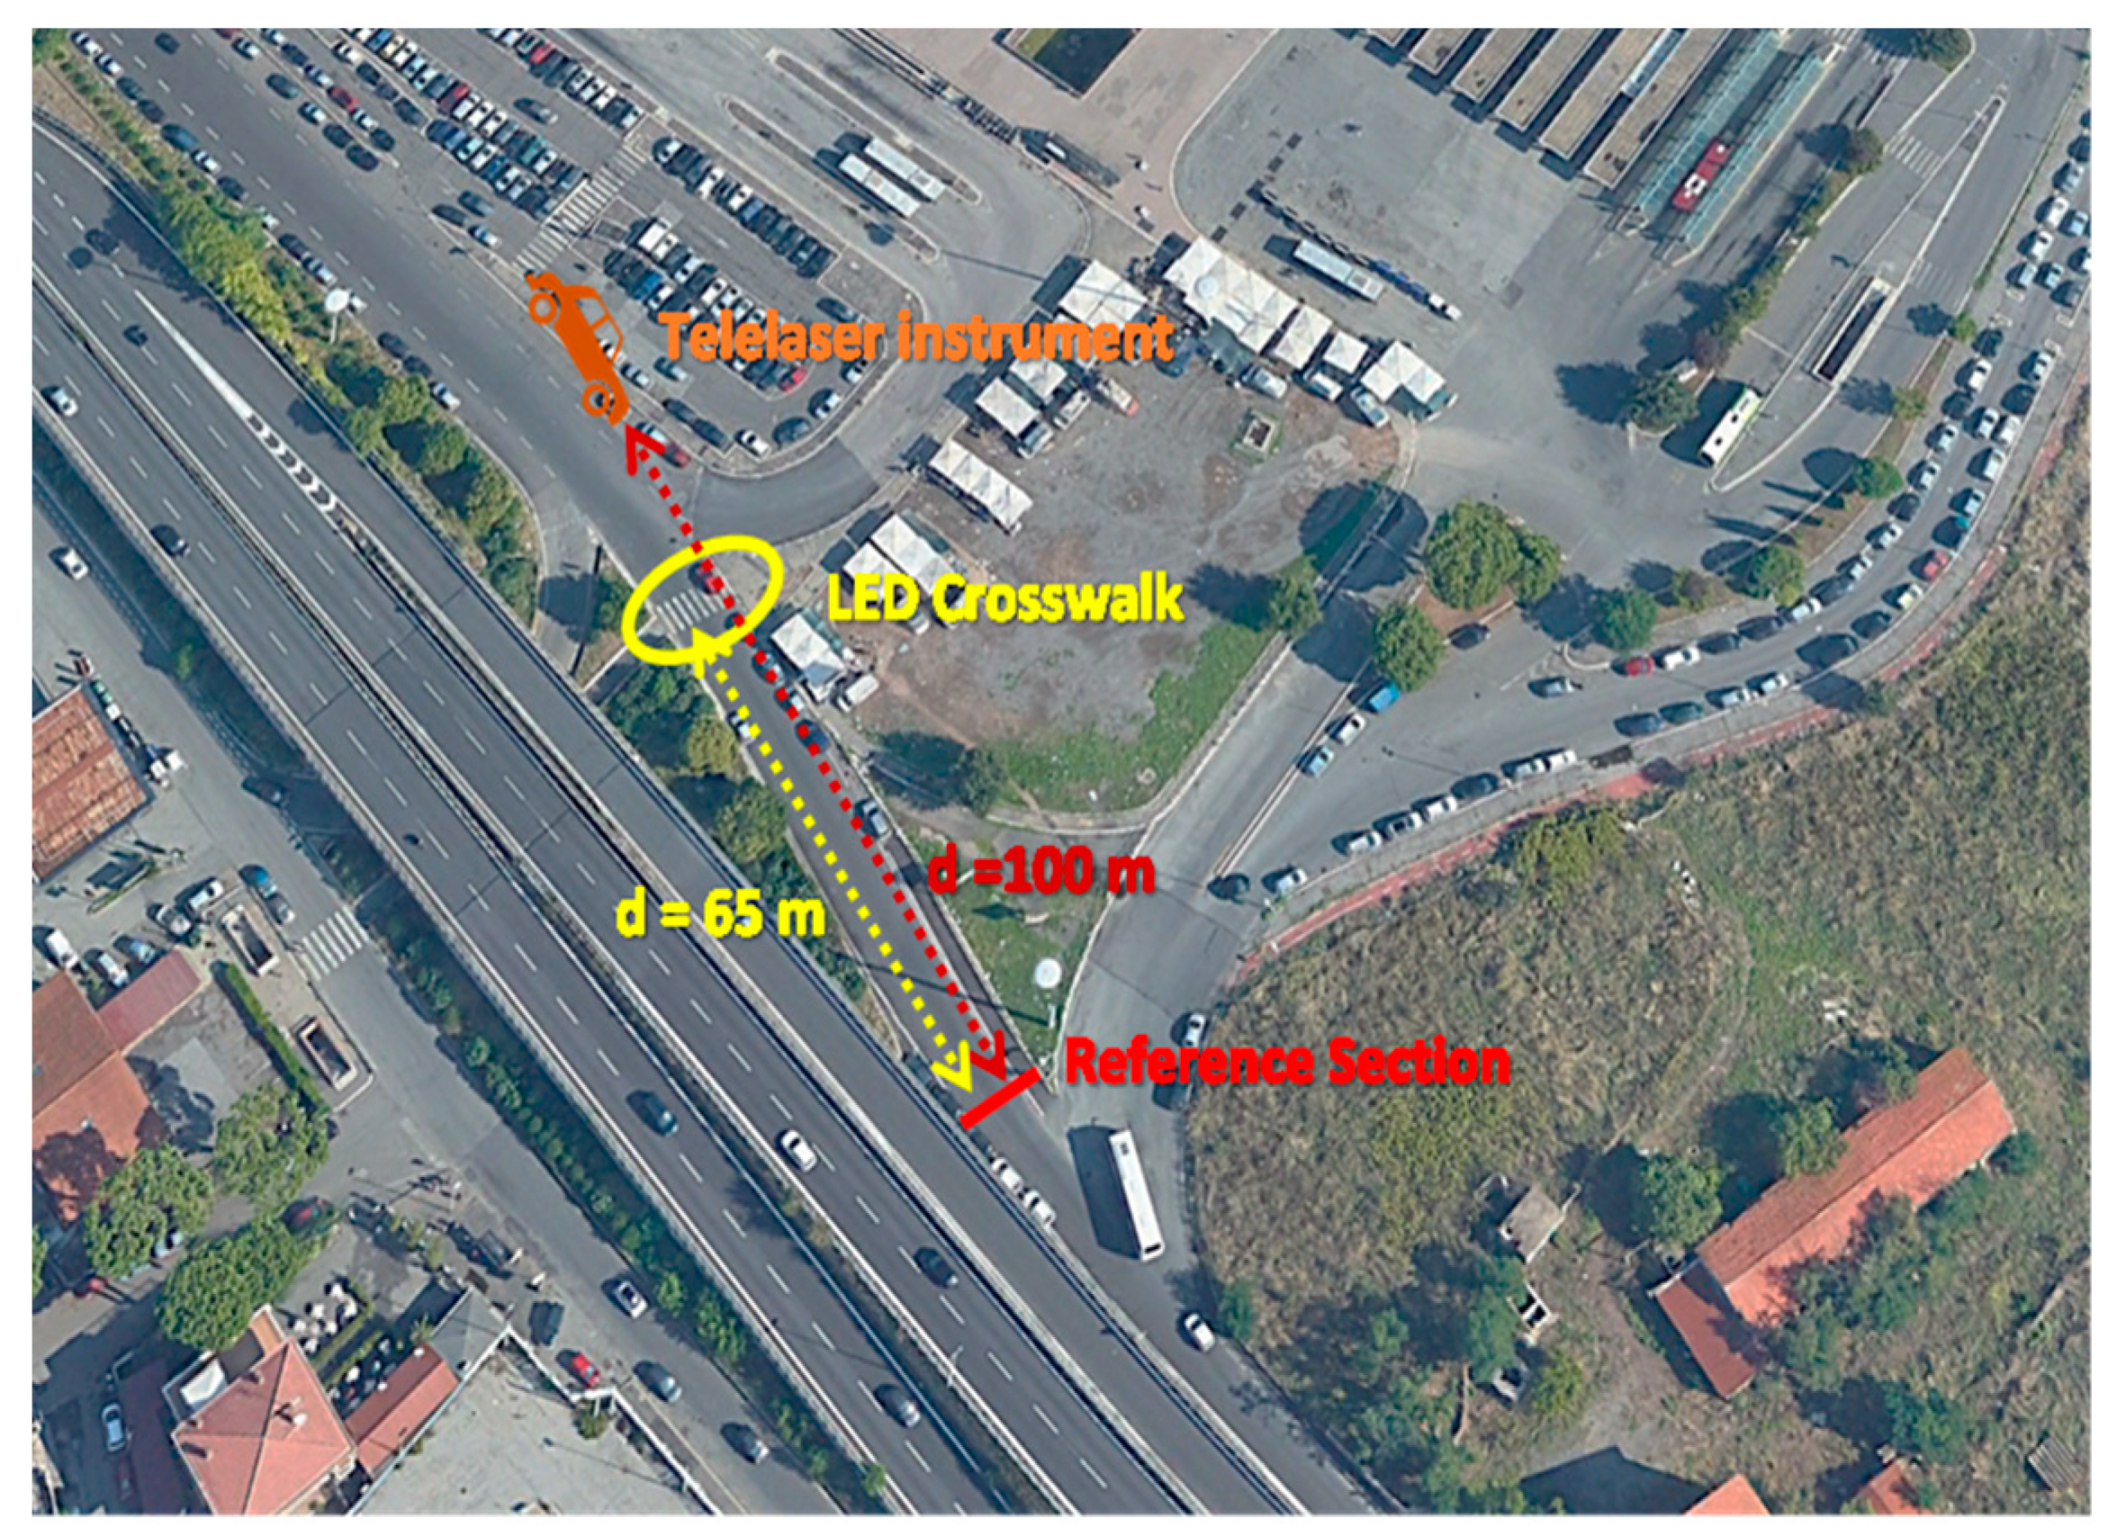
In the case of pedestrian presence, the experimental condition is characterized by a pedestrian who, passing under the sensor, makes the lighting switch on (Video S1). In order to maintain the pedestrian behavior constant, the pedestrian who crossed the road was a research collaborator who began to cross the zebra when an approaching car was at 65 m from the zebra crosswalk section (Figure 5). In the case of crossing in the LED-off condition, in order to not switch the lightning system on, the collaborator-pedestrian must walk outside the range of the optical sensor passing very close to the pole (Figure 4). All vehicles arriving when the desired conditions cease to exist, for example the unexpected passage of a pedestrian (non-collaborator), must be excluded from the study (invalid data). The collected data were transmitted on a laptop computer (Figure 2), and the data processing phase consisted of reconstructing vehicles speed profiles along the road segment in each scenario (LED on/off, with/without pedestrian). Furthermore, a more in-depth study was performed on drivers’ behavior in terms of accelerations/decelerations.
The average speed profile of all the vehicles was obtained by dividing the road into 2-m sub-segments. For each sub-segment the speed values were averaged among all the vehicles detected. By interpolating these values, the mean speed profile for the entire segment was evaluated. Finally, by comparing the speed profiles, the benefits (in terms of speed safety, i.e., speed reduction) obtained with the lighting system in both cases (with/without pedestrian) were evaluated. The speed can be detected either for cars coming toward the telelaser or for cars going away from it. For all the cases analyzed in this study, the telelaser was placed inside a car frontally positioned with respect to vehicular flow. This choice was dictated by technical reasons mainly related to the road segment geometry (Figure 5). The analyzed road segment is a one-way, 7.5 m wide road, and does not have traffic light intersections that could interfere with vehicles flow along the segment. The speed limit is 50 km/h.
As the analysis presented in this paper refers to an isolated vehicle condition, speed measurements were performed between 9 pm and 12 pm in working days, under clear day condition, and in undersaturated traffic flow condition (the average traffic flow was 140 veh/h).
To complete the experimental campaign, simple illuminance measurements were carried out on the ground in proximity of the crosswalk. The road can be classified as a secondary urban road (category M3), with a speed limit of 50 km/h. The illuminance on the ground on the horizontal plan due to the general lighting system is on average 15 lx, according to the standard EN13201-3 [34]. The aim of the measurements was only to verify that the illuminance provided by the general lighting system was adequate according to the typology of the road. In the crosswalk, illuminance measurements on the ground have a limited significance, since the light does not come from the above, but the LED panels are inserted in the road asphalt.
3. Results
In this section the results of two different cases (presence and absence of pedestrian) are presented. In both cases, the improvements generated by the LED lighting system have been evaluated by comparing cars’ speed measurements in two different conditions: illuminated and non-illuminated crosswalk. Since the general lighting, as mentioned in paragraph two, is adequate for the kind of road (15 lx on average on the ground), the improvements are to be attributed to the LED lighting which characterizes the crosswalk.
3.1. Case One: Absence of Pedestrian
As previously mentioned in Section 2, the first case is focused on drivers’ behavior when approaching a zebra crossing without a car–pedestrian interaction. This case was intended to show that the presence of a lighting system in a crosswalk section generates a speed-reducing effect even in the absence of pedestrians.
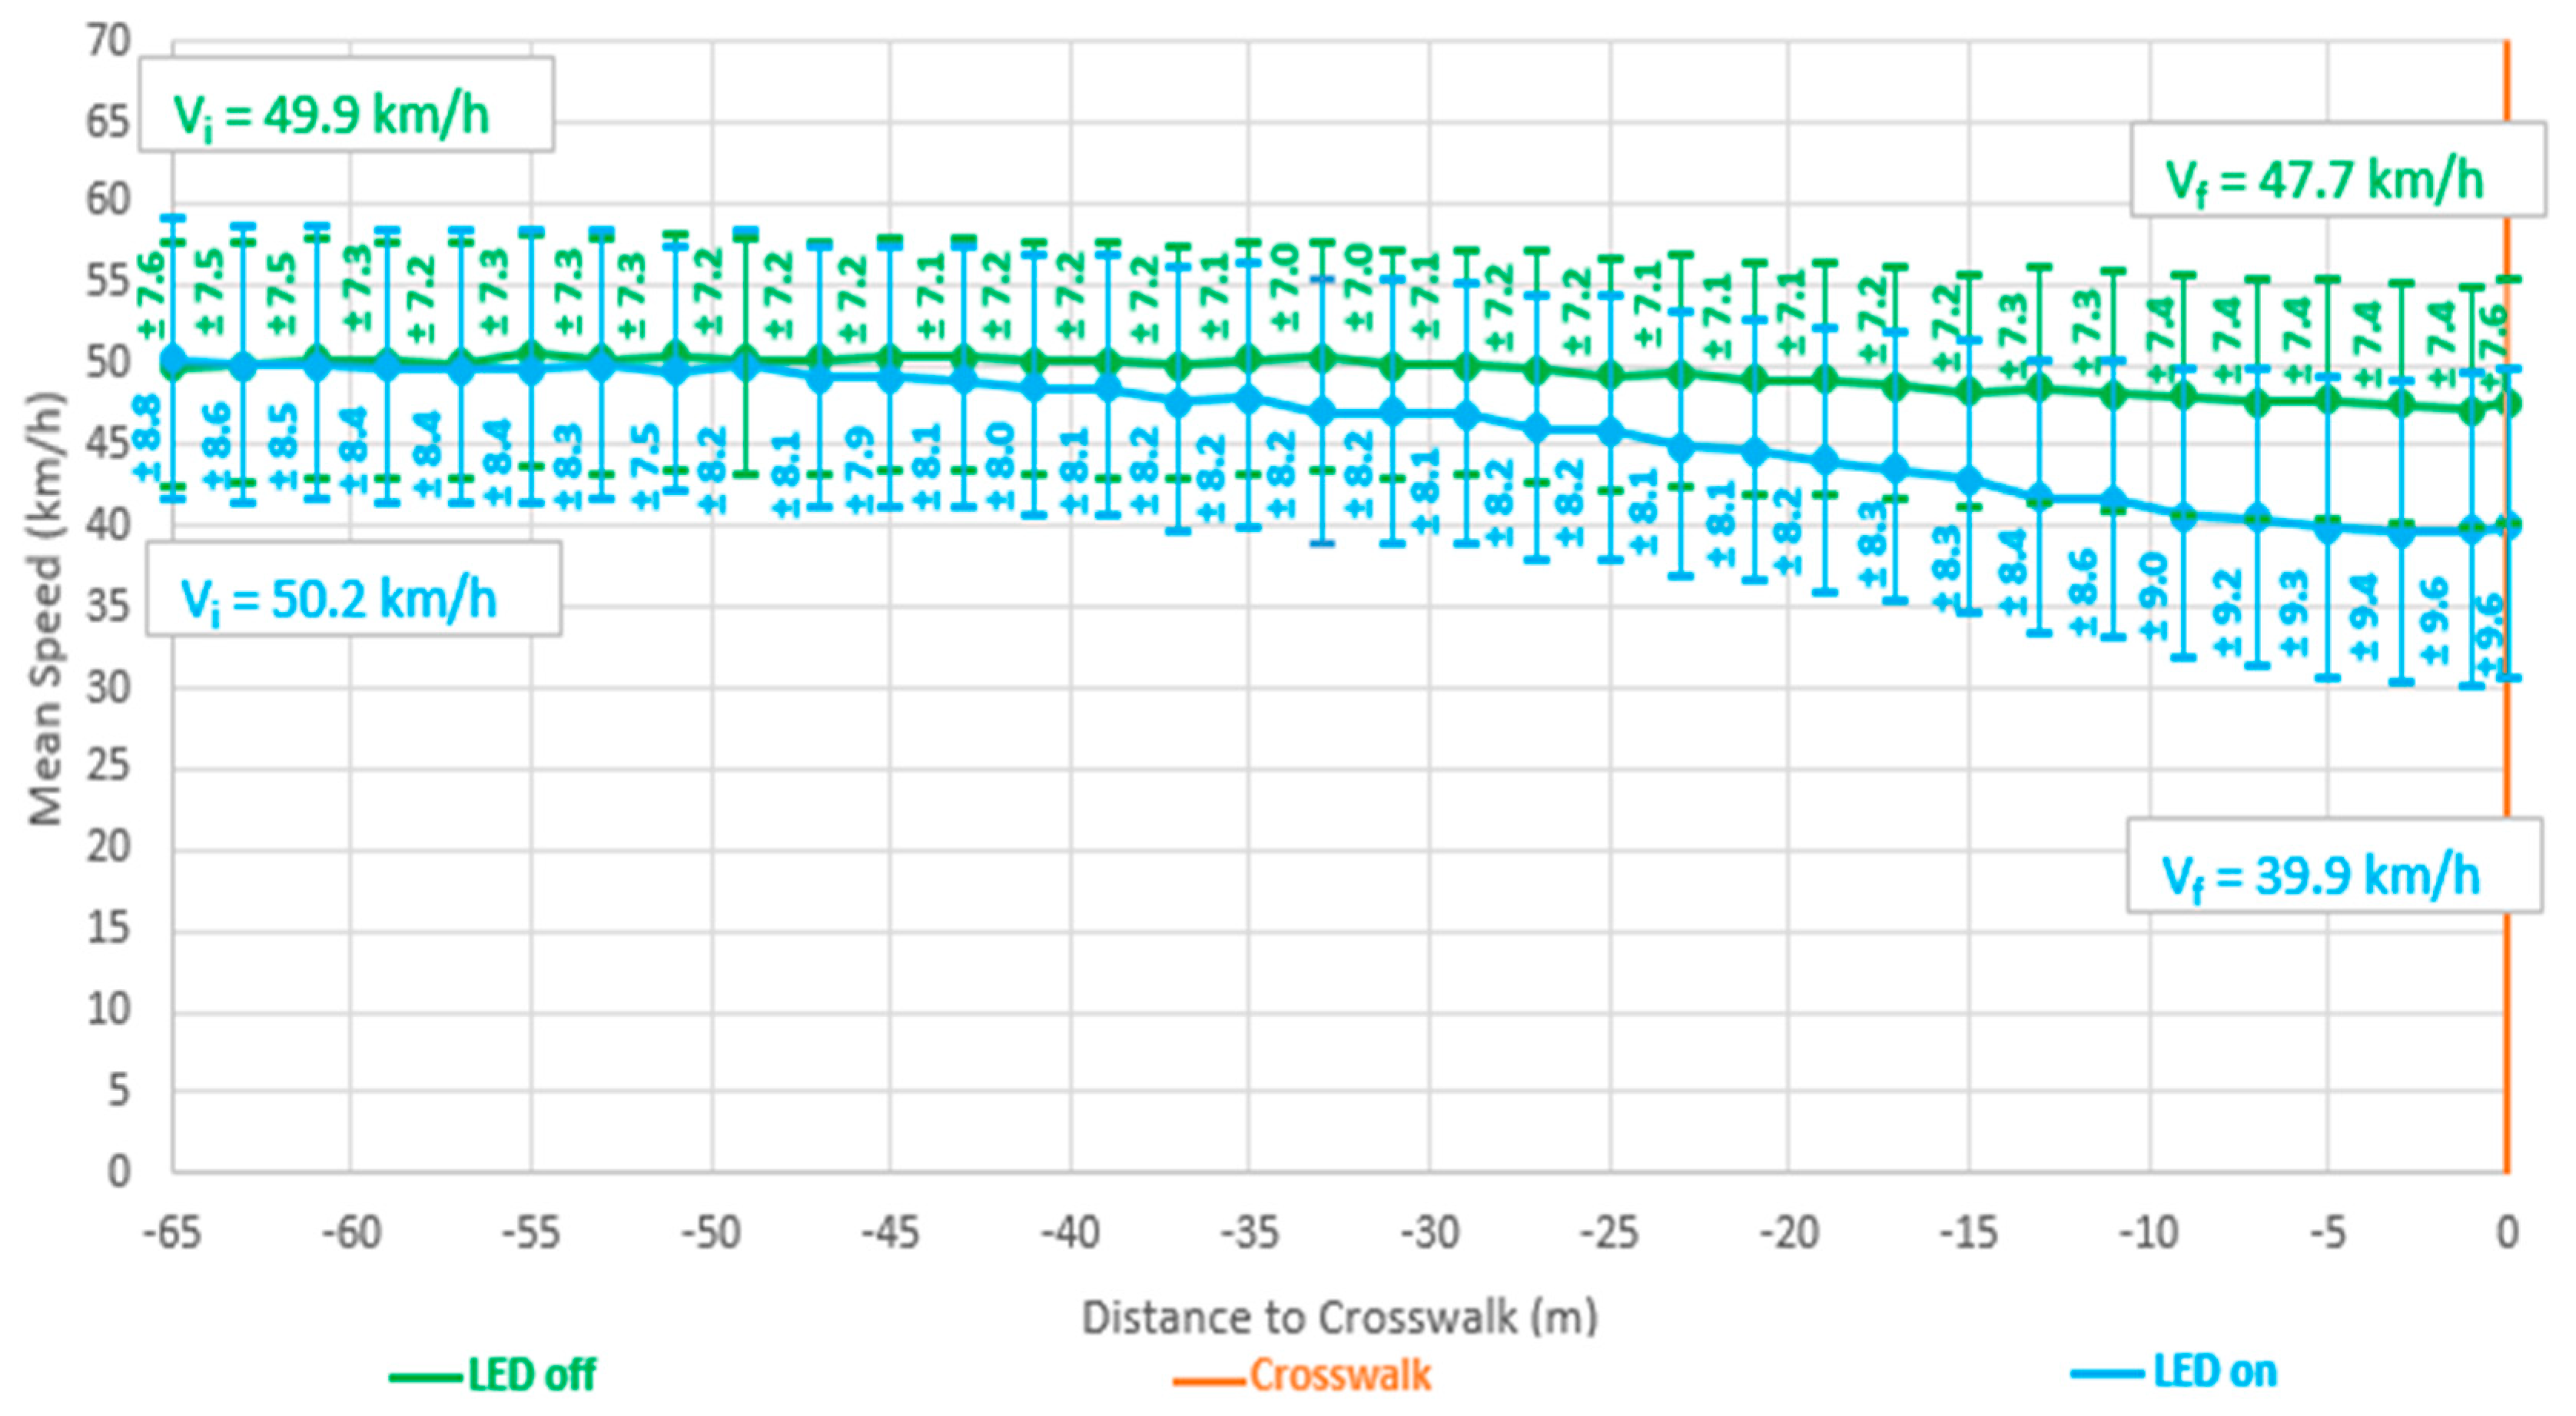
A total of 200 measurements were obtained: 100 in non-illuminated conditions, and 100 with the LED system continuously active. The latter condition was obtained by positioning a pennant in front of the optical sensor (Figure 4), and thus, both the base plates and the overhead sign continuously flash. In this way, drivers see the flashing light as they get onto the road segment where the pedestrian crossing is positioned. The following Figure 6 shows the speed profiles (mean and error term) from the 65 m section before the zebra crossing. The mean values and the standard variation of the speed were evaluated at every 2-m sub-segment.
From the analysis of the speed profile, one can observe that in the LED-off condition (green line) the speed remains almost constant for the whole segment. From the 65 m section until the zebra crossing there is only a slight speed decrease equal to −4.3%.
In the LED-on case (blue line), the initial mean speed () at abscissa −65 m is equal to 50.2 km/h, and in the last sub-segment (crosswalk section) the final mean speed () decreases to 39.9 km/h (−20.6%). Table 1 summarizes the results and highlights the speed-reducing effect of the LED illuminated crosswalk in the absence of pedestrians. In fact, by comparing the mean speed values at the pedestrian crossing (, ), when the lighting is on the mean speed decrease by 16.4%. As for the error term, in both conditions there is a high variability which is slightly more pronounced for the LED-on one. This result also occurs for case 2 and will be discussed further in the following paragraph of the paper.
The sample mean speed has been statistically tested with the null hypothesis . This z-test at the 5% level of significance was intended to determine whether the mean speed at the crosswalk section when the LED system is on () is significantly lower than the sample mean speed when the system is off (). The z-value is given by: , where is the sample standard deviation of the speed at the zebra crossing when the LED is on, and n is the sample size. Since we obtain z = −8.209 < −1.645, at the 5% level of significance there is enough evidence to reject the null hypothesis and to accept the alternative hypothesis , which confirms the speed-reducing effect of the lighting system.
As mentioned in the Methodology section, the LED system remains switched until a pedestrian passes under the optical sensor (Figure 4) and turns the lighting system on. For this reason, the case 1 (absence of pedestrian) was intended to show if, in principle, a LED lighting system constantly active might generate a speed reducing effect. The results reported in Table 1, however, should be taken with caution, as drivers will become less likely overtime to slow down if pedestrians are not there. In other words, they learn that the lights are unreliable predictors of pedestrians (false alarm) and therefore no longer trust the light signal (anonymous reviewer’s comment).
3.2. Case Two: Presence of Pedestrian
As mentioned at the beginning of Section 3, also in the case of presence of pedestrian the (positive) effect of the LED illuminated crosswalk was demonstrated by comparing two conditions: illuminated and non-illuminated pedestrian crossing. For each condition, 100 measurements were used for the analysis (200 in total). The cars’ speed measurements used to evaluate the mean speed profiles were those detected from the 65 m section before the zebra crossing. The 65 m reference section (see Figure 5) was chosen because of the presence of landmark (billboard), which was used by the pedestrian-collaborator to realize when to start crossing the zebra.
Figure 7 shows the speed profiles (mean and error term) from the 65 m section before the zebra crossing. The mean values and the standard variation of the speed were evaluated at every 2-m sub-segment.
From the mean speed profiles, one can observe that in the illuminated condition there is a step decrease, i.e., a deceleration, at about the 40 m section before the zebra crossing. In the non-illuminated condition, the speed variation is smoother along the road segment and it decreases from an initial value of 50.7 km/h to final value (at the crosswalk section) of 40.2 km/h. As for the variability, the error term varies from [±9.4, ±10.7] in non-illuminated conditions and from [±8.8, ±11.9] when the LED-lighting system is on. The slightly larger range observed in illuminated conditions, also confirmed in case 1, might suggest that LED systems put drivers on alert generating a less flat stereotyped and more careful behavior.
Table 2 summarizes the results and highlights the positive effect on safety (speed reduction) of the LED illuminated crosswalk in the presence of pedestrians crossing the zebra. In fact, by comparing the mean speed values at the pedestrian crossing section (,), when the lighting is on the mean speed decrease by 19.3%. As found by Rosen and Sander (2009) [35], in case of car–pedestrian impact, such a speed reduction corresponds to a reduction of 2% of fatal accident risk, and the risk of serious injuries decrease by 11% (Tefft, 2013) [36].
The same statistical hypothesis test performed for case 1 was used to test in the presence of pedestrians and the resulting z-value is equal to −6.512, again indicating strong evidence against the null hypothesis (5% level of significance).
Overall, the relative differences reported in Table 1 and Table 2, calculated from mean values ratio, provide a general indication of the speed-reducing effect of LED lighting.
Assuming a linear variation of the mean speed from the 65 m section to the zebra crossing, the deceleration can be calculated as: , where d represents the length of the segment (65 m). The following Table 3 highlights that in illuminated conditions the deceleration is higher.
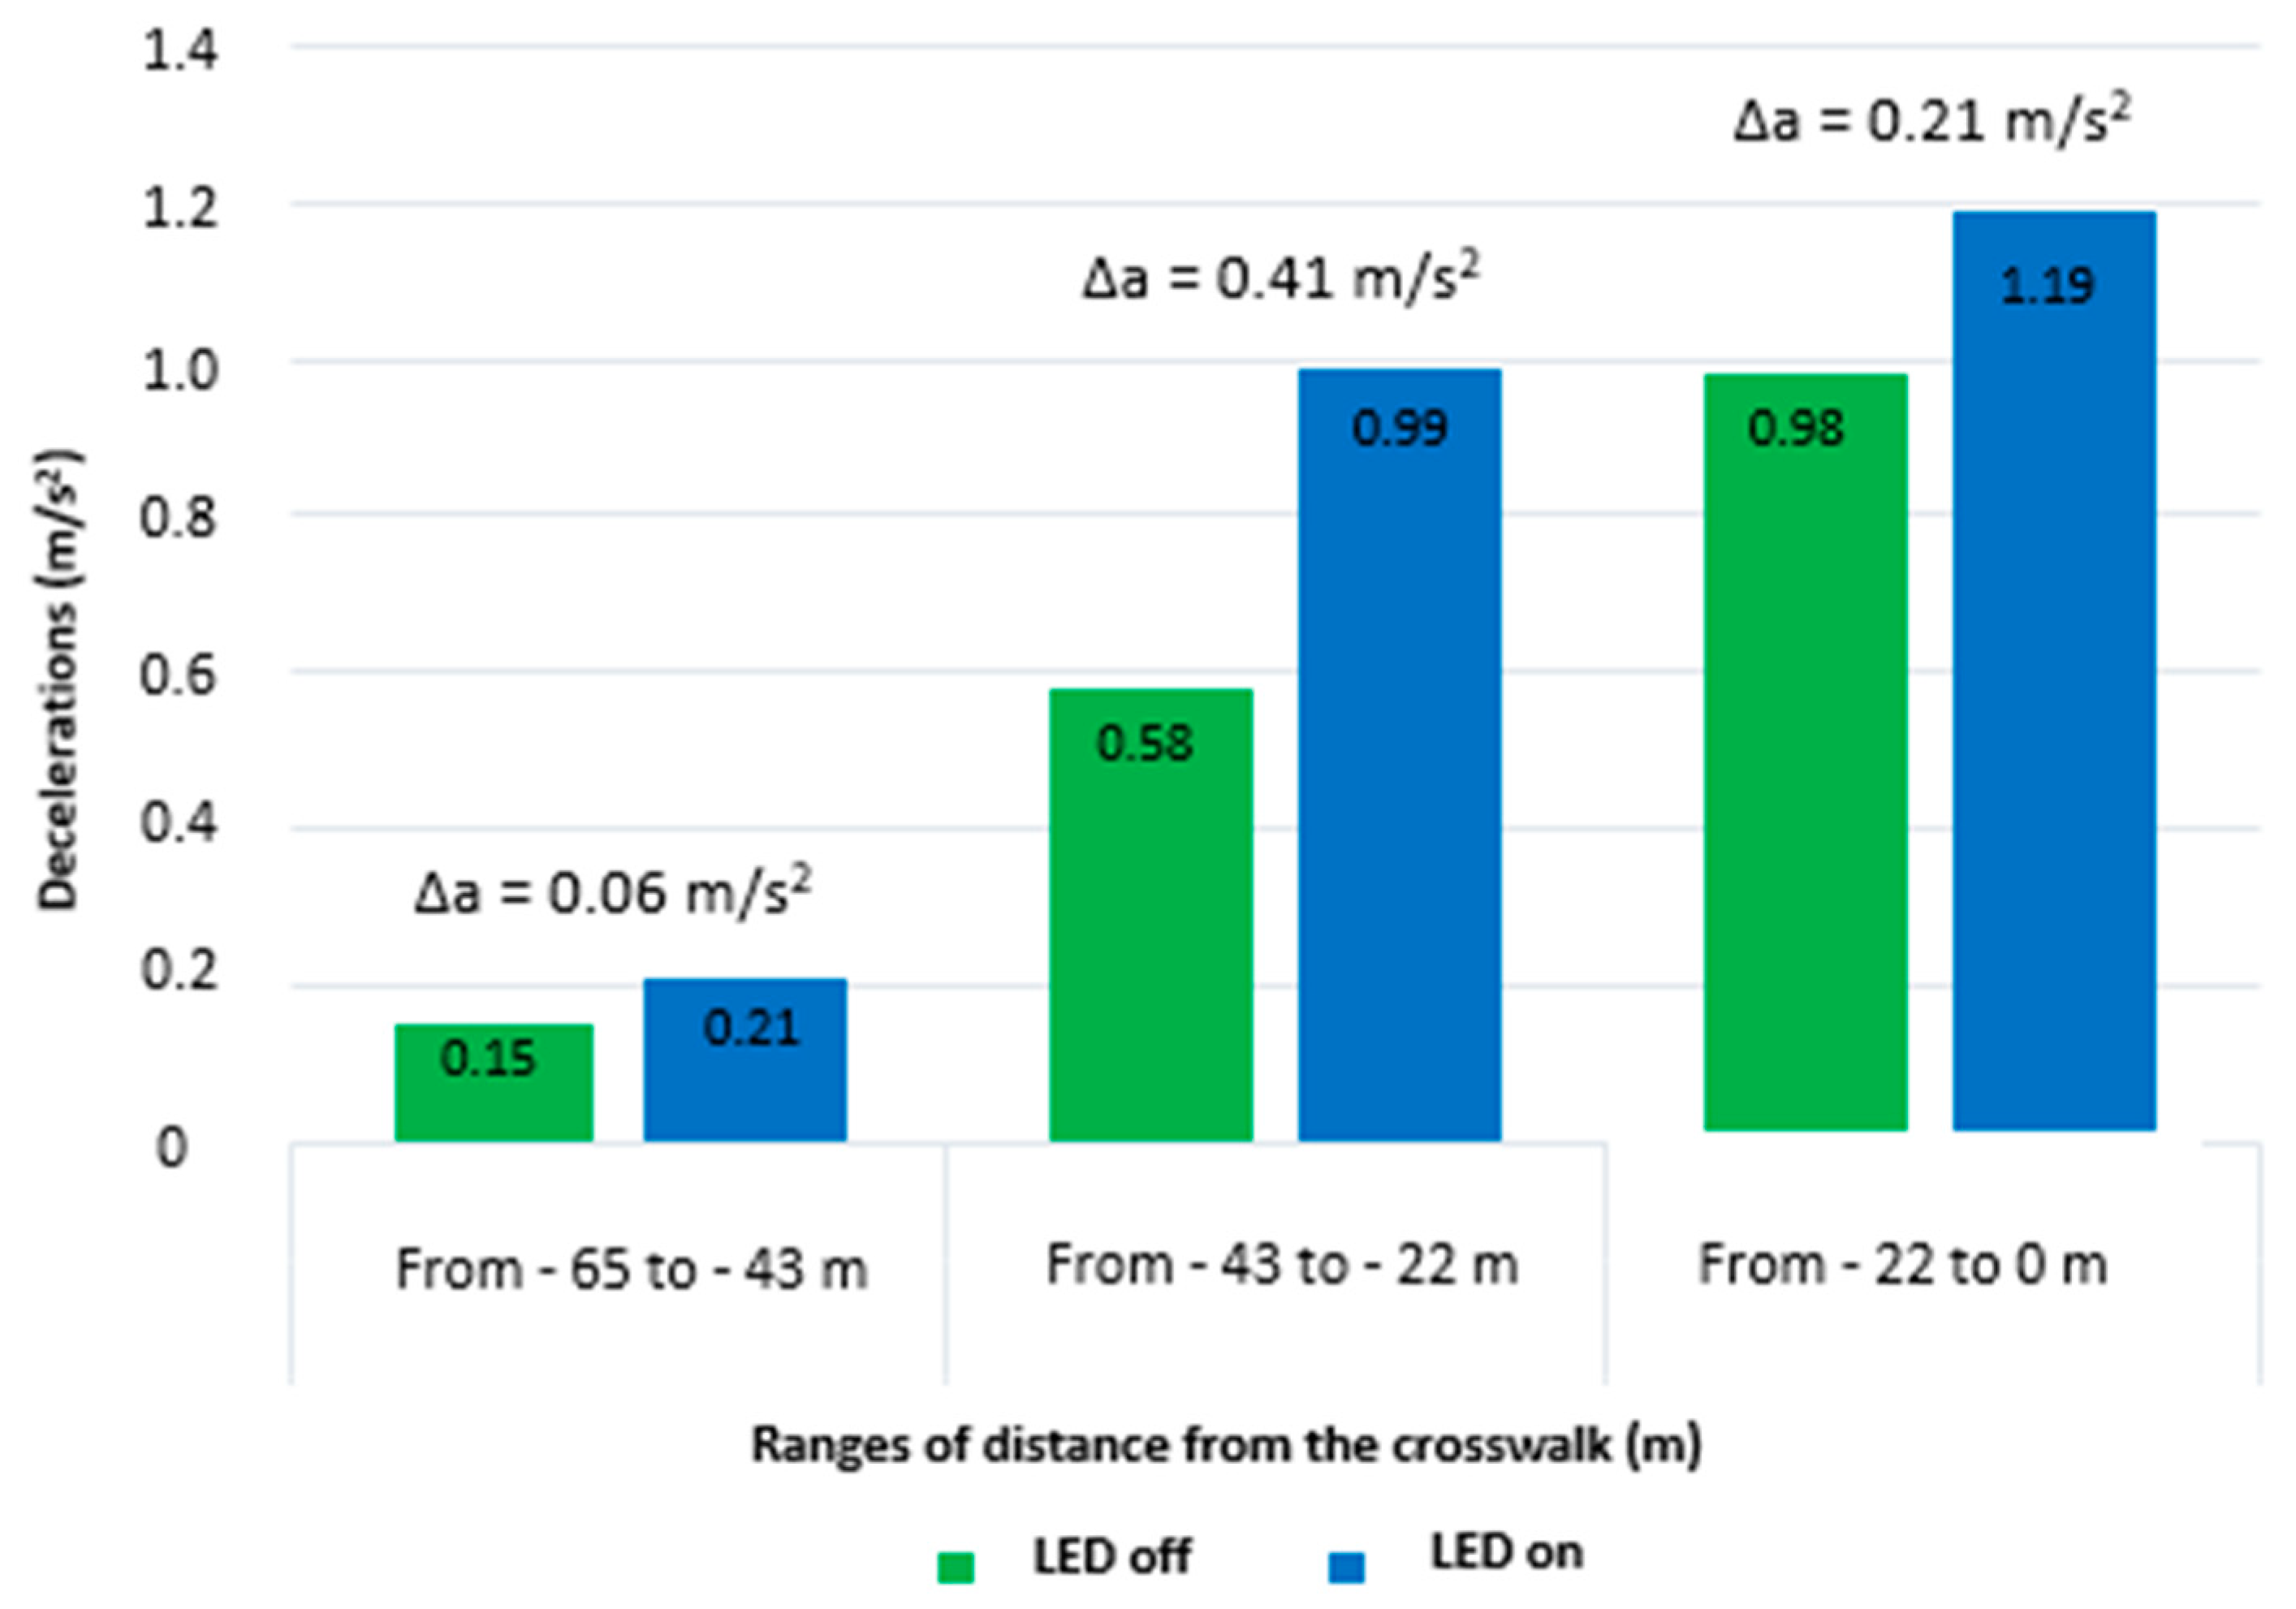
A further investigation of the deceleration is obtained by dividing the segment in three parts: from −65 to −43 m; from −43 to −22 m; from −22 m to the pedestrian crossing section (0 m). Figure 8 shows that in illuminated conditions car deceleration is always higher (in modulus) than in non-illuminated conditions. Furthermore, most relevant differences in deceleration, which correspond to a stronger effect of the lighting system, can be observed in the distance range from −44 to −22 m.
4. Conclusions
This study presented the results of a methodology, based on real-world speed measurements, to evaluate the effect that a LED illuminated crosswalk produced on pedestrian safety. The main feature of this methodology is that it relies on in situ measurement, since car speed measurements were detected with a telelaser instrument. The proposed methodology can be reapplied in different contexts in order to evaluate the effectiveness of other systems used to improve safety and visibility such as glow-in-the-dark or 3D crosswalks.
The application of the proposed methodology to the Rome-Anagnina case study, demonstrated the positive impact on drivers’ behavior (in terms of speed reduction) obtained with LED lighting system installed at the pedestrian crossing section. Results showed that this technology leads to a reduction in the mean speed equal to −19.3% at the zebra crossing, which corresponds to a lower fatal accident and serious injuries risk. Note, however, that this result is affected by high variability, and thus, further measurements (larger sample) are needed to obtain more reliable scientific evidence.
Moreover, it was found that an always-active LED-illuminated crosswalk, with in-road flashing warning lights embedded in the pavement, generate a speed-reducing effect even in the absence of a pedestrian (−16.4%). This result, however, should be taken with caution, as drivers will become less likely overtime to slow down if pedestrians are not there.
A further limitation, which provides direction for future research developments, is that the effect on drivers’ behavior of the new LED lighting system should also be tested and statistically validated with a new set of measurements later on, when drivers are used to the presence of the illumination.
The research agenda also includes a validation of this preliminary results in other similar crosswalks, since the Municipality of Rome has decided to extend the experimentation of the innovative LED system to other crosswalks, and the execution of luminance measurements in order to strengthen the correlation between speed reduction and lighting levels.
Supplementary Materials
The following are available online at https://0-www-mdpi-com.brum.beds.ac.uk/2313-576X/6/2/20/s1, Video S1: LED-lighting zebra crossing.
Author Contributions
Conceptualization, S.M.P.; Investigation, S.M.P. and S.S.; Methodology, S.M.P., S.S. and F.B.; Data curation, S.S.; Writing—original draft, S.M.P. and S.S.; Writing—review and editing, S.M.P., S.S., F.B. and F.A.; Supervision, S.C. and F.A.; Project administration, S.C. All authors have read and agreed to the published version of the manuscript.
Funding
This research received no external funding.
Conflicts of Interest
The authors declare no conflict of interest.
References
- Owens, D.A. Twilight vision and road safety: Seeing more than we notice but less than we think. In Visual perception: The influence of H. W. Leibowitz; Andre, J., Owens, D.A., Harvey, L.O., Jr., Eds.; American Psychological Association: Washington, DC, USA, 2003; pp. 157–180. [Google Scholar]
- Plainis, S.; Murray, I.J. Reaction times as an index of visual conspicuity when driving at night. Ophthalmic Physiol. Opt. 2002, 22, 409–415. [Google Scholar] [CrossRef] [PubMed]
- Bassani, M.; Mutani, G. Effects of Environmental Lighting Conditions on Operating Speeds on Urban Arterials. Transp. Res. Rec. J. Transp. Res. Board 2012, 2298, 78–87. [Google Scholar] [CrossRef]
- Zhang, Y.; Lu, H.; Qu, W. Geographical Detection of Traffic Accidents Spatial Stratified Heterogeneity and Influence Factors. Int. J. Environ. Res. Public Heal. 2020, 17, 572. [Google Scholar] [CrossRef] [PubMed] [Green Version]
- Horberry, T.; E Anderson, J.; Regan, M.A. The possible safety benefits of enhanced road markings: A driving simulator evaluation. Transp. Res. Part F: Traffic Psychol. Behav. 2006, 9, 77–87. [Google Scholar] [CrossRef]
- Polus, A.; Katz, A. An analysis of nighttime pedestrian accidents at specially illuminated crosswalks. Accid. Anal. Prev. 1978, 10, 223–228. [Google Scholar] [CrossRef]
- Peden, M. World Report on Road Traffic Injury Prevention; WHO: Geneve, Switzerland, 2004; ISBN 92 4 156260 9. [Google Scholar]
- Illuminating Engineering Society of North America. American National Standard Practice for Roadway Lighting, IESNA-RP-8-00; Illuminating Engineering Society of North America: New York, NY, USA, 2000. [Google Scholar]
- Bullough, J.D.; Zhang, X.; Skinner, N.P.; Rea, M.S. Design and Evaluation of Effective Crosswalk Illumination. Final Raport FHWA-NJDOT-2009-003; Department of Transportation: Ewing Township, NJ, USA, 2009. [Google Scholar]
- Markvica, K.; Richter, G.; Lenz, G. Impact of urban street lighting on road users’ perception of public space and mobility behavior. Build. Environ. 2019, 154, 32–43. [Google Scholar] [CrossRef]
- Peña-García, A.; Hurtado, A.; Aguilar-Luzón, M. Impact of public lighting on pedestrians’ perception of safety and well-being. Saf. Sci. 2015, 78, 142–148. [Google Scholar] [CrossRef]
- Davidovic, M.; Djokic, L.; Cabarkapa, A.; Djuretic, A.; Skerovic, V.; Kostic, M. Drivers’ Preference for the Color of LED Street Lighting. IEEE Access 2019, 7, 72850–72861. [Google Scholar] [CrossRef]
- Doulos, L.; Sioutis, I.; Kontaxis, P.; Zissis, G.; Faidas, K. A decision support system for assessment of street lighting tenders based on energy performance indicators and environmental criteria: Overview, methodology and case study. Sustain. Cities Soc. 2019, 51, 101759. [Google Scholar] [CrossRef]
- Rossi, G.; Iacomussi, P.; Zinzi, M. Lighting Implications of Urban Mitigation Strategies through Cool Pavements: Energy Savings and Visual Comfort. Climate 2018, 6, 26. [Google Scholar] [CrossRef] [Green Version]
- Yao, Q.; Wang, H.; Uttley, J.; Zhuang, X. Illuminance Reconstruction of Road Lighting in Urban Areas for Efficient and Healthy Lighting Performance Evaluation. Appl. Sci. 2018, 8, 1646. [Google Scholar] [CrossRef] [Green Version]
- Saraiji, R.; Oommen, M.S. Dominant contrast as a metric for the lighting of pedestrians. Light. Res. Technol. 2014, 47, 434–448. [Google Scholar] [CrossRef]
- Saraiji, R. Vertical Illuminance Based Crosswalk Illumination. LEUKOS 2009, 6, 153–167. [Google Scholar] [CrossRef]
- Gibbons, R.B.; Hankey, J.M. Influence of Vertical Illuminance on Pedestrian Visibility in Crosswalks. Transp. Res. Rec. J. Transp. Res. Board 2006, 1973, 105–112. [Google Scholar] [CrossRef]
- Asdrubali, F.; Buratti, C.; Moretti, E.; D’Alessandro, F.; Schiavoni, S. Assessment of the Performance of Road Markings in Urban Areas: The Outcomes of the CIVITAS RENAISSANCE Project. Open Transp. J. 2013, 7, 7–19. [Google Scholar] [CrossRef] [Green Version]
- Jägerbrand, A.K.; Johansson, M.; Laike, T. Speed Responses to Speed Humps as Affected by Time of Day and Light Conditions on a Residential Road with Light-Emitting Diode (LED) Road Lighting. Safety 2018, 4, 10. [Google Scholar] [CrossRef] [Green Version]
- Bella, F.; Calvi, A.; D’Amico, F. Analysis of driver speeds under night driving conditions using a driving simulator. J. Saf. Res. 2014, 49, 45–52. [Google Scholar] [CrossRef]
- Bella, F.; Calvi, A. Effects of Simulated Day and Night Driving on the Speed Differential in Tangent–Curve Transition: A Pilot Study Using Driving Simulator. Traffic Inj. Prev. 2013, 14, 413–423. [Google Scholar] [CrossRef]
- Gilandeh, S.S.; Hosseinlou, M.H.; Anarkooli, A.J. Examining bus driver behavior as a function of roadway features under daytime and nighttime lighting conditions: Driving simulator study. Saf. Sci. 2018, 110, 142–151. [Google Scholar] [CrossRef]
- Bella, F.; Silvestri, M. Effects of safety measures on driver’s speed behavior at pedestrian crossings. Accid. Anal. Prev. 2015, 83, 111–124. [Google Scholar] [CrossRef]
- Várhelyi, A. Drivers’ speed behaviour at a zebra crossing: A case study. Accid. Anal. Prev. 1998, 30, 731–743. [Google Scholar] [CrossRef]
- Available online: https://www.une.org/encuentra-tu-norma/busca-tu-norma/norma?c=N0044124 (accessed on 25 March 2020).
- Available online: https://www.une.org/encuentra-tu-norma/busca-tu-norma/norma?c=N0048748 (accessed on 25 March 2020).
- Available online: https://www.une.org/encuentra-tu-norma/busca-tu-norma/norma/?c=N0046761 (accessed on 25 March 2020).
- Available online: https://www.une.org/encuentra-tu-norma/busca-tu-norma/norma/?c=N0052299 (accessed on 25 March 2020).
- Available online: https://www.eltraff.com/wp-content/uploads/2019/01/Scheda-Tecnica-TruSpeed.pdf (accessed on 25 March 2020).
- Chiusolo, S.; Dicembre, A.; Ricci, S.; Sorace, F. Automation of High Density Metro Lines: Rome Line A Case Study. Autom. People Mov. Transit Syst. 2011, 2011, 491–501. [Google Scholar]
- Rinelli, L. Peripheralization and Other Roman Stories. In Transcultural Cities: Border Crossing and Placemaking; Routledge: New York, NY, USA, 2013; Available online: http://manoa-hawaii.academia.edu/LorenzoRinelli/Papers/1759407/Peripheralization_and_other_Roman_stories (accessed on 25 March 2020).
- Patella, S.M.; Sportiello, S.; Petrelli, M.; Carrese, S. Workplace relocation from suburb to city center: A case study of Rome, Italy. Case Stud. Transp. Policy 2019, 7, 357–362. [Google Scholar] [CrossRef]
- Available online: http://store.uni.com/catalogo/ec-1-2018-uni-en-13201-3-2016 (accessed on 25 March 2020).
- Rosén, E.; Sander, U. Pedestrian fatality risk as a function of car impact speed. Accid. Anal. Prev. 2009, 41, 536–542. [Google Scholar] [CrossRef]
- Tefft, B.C. Impact Speed and a Pedestrian’s Risk of Severe Injury or Death. PsycEXTRA Dataset 2013, 50, 871–878. [Google Scholar] [CrossRef]
Figure 1.
LED lighting system.

Figure 2.
Speed data collection with the telelaser hidden in the car.
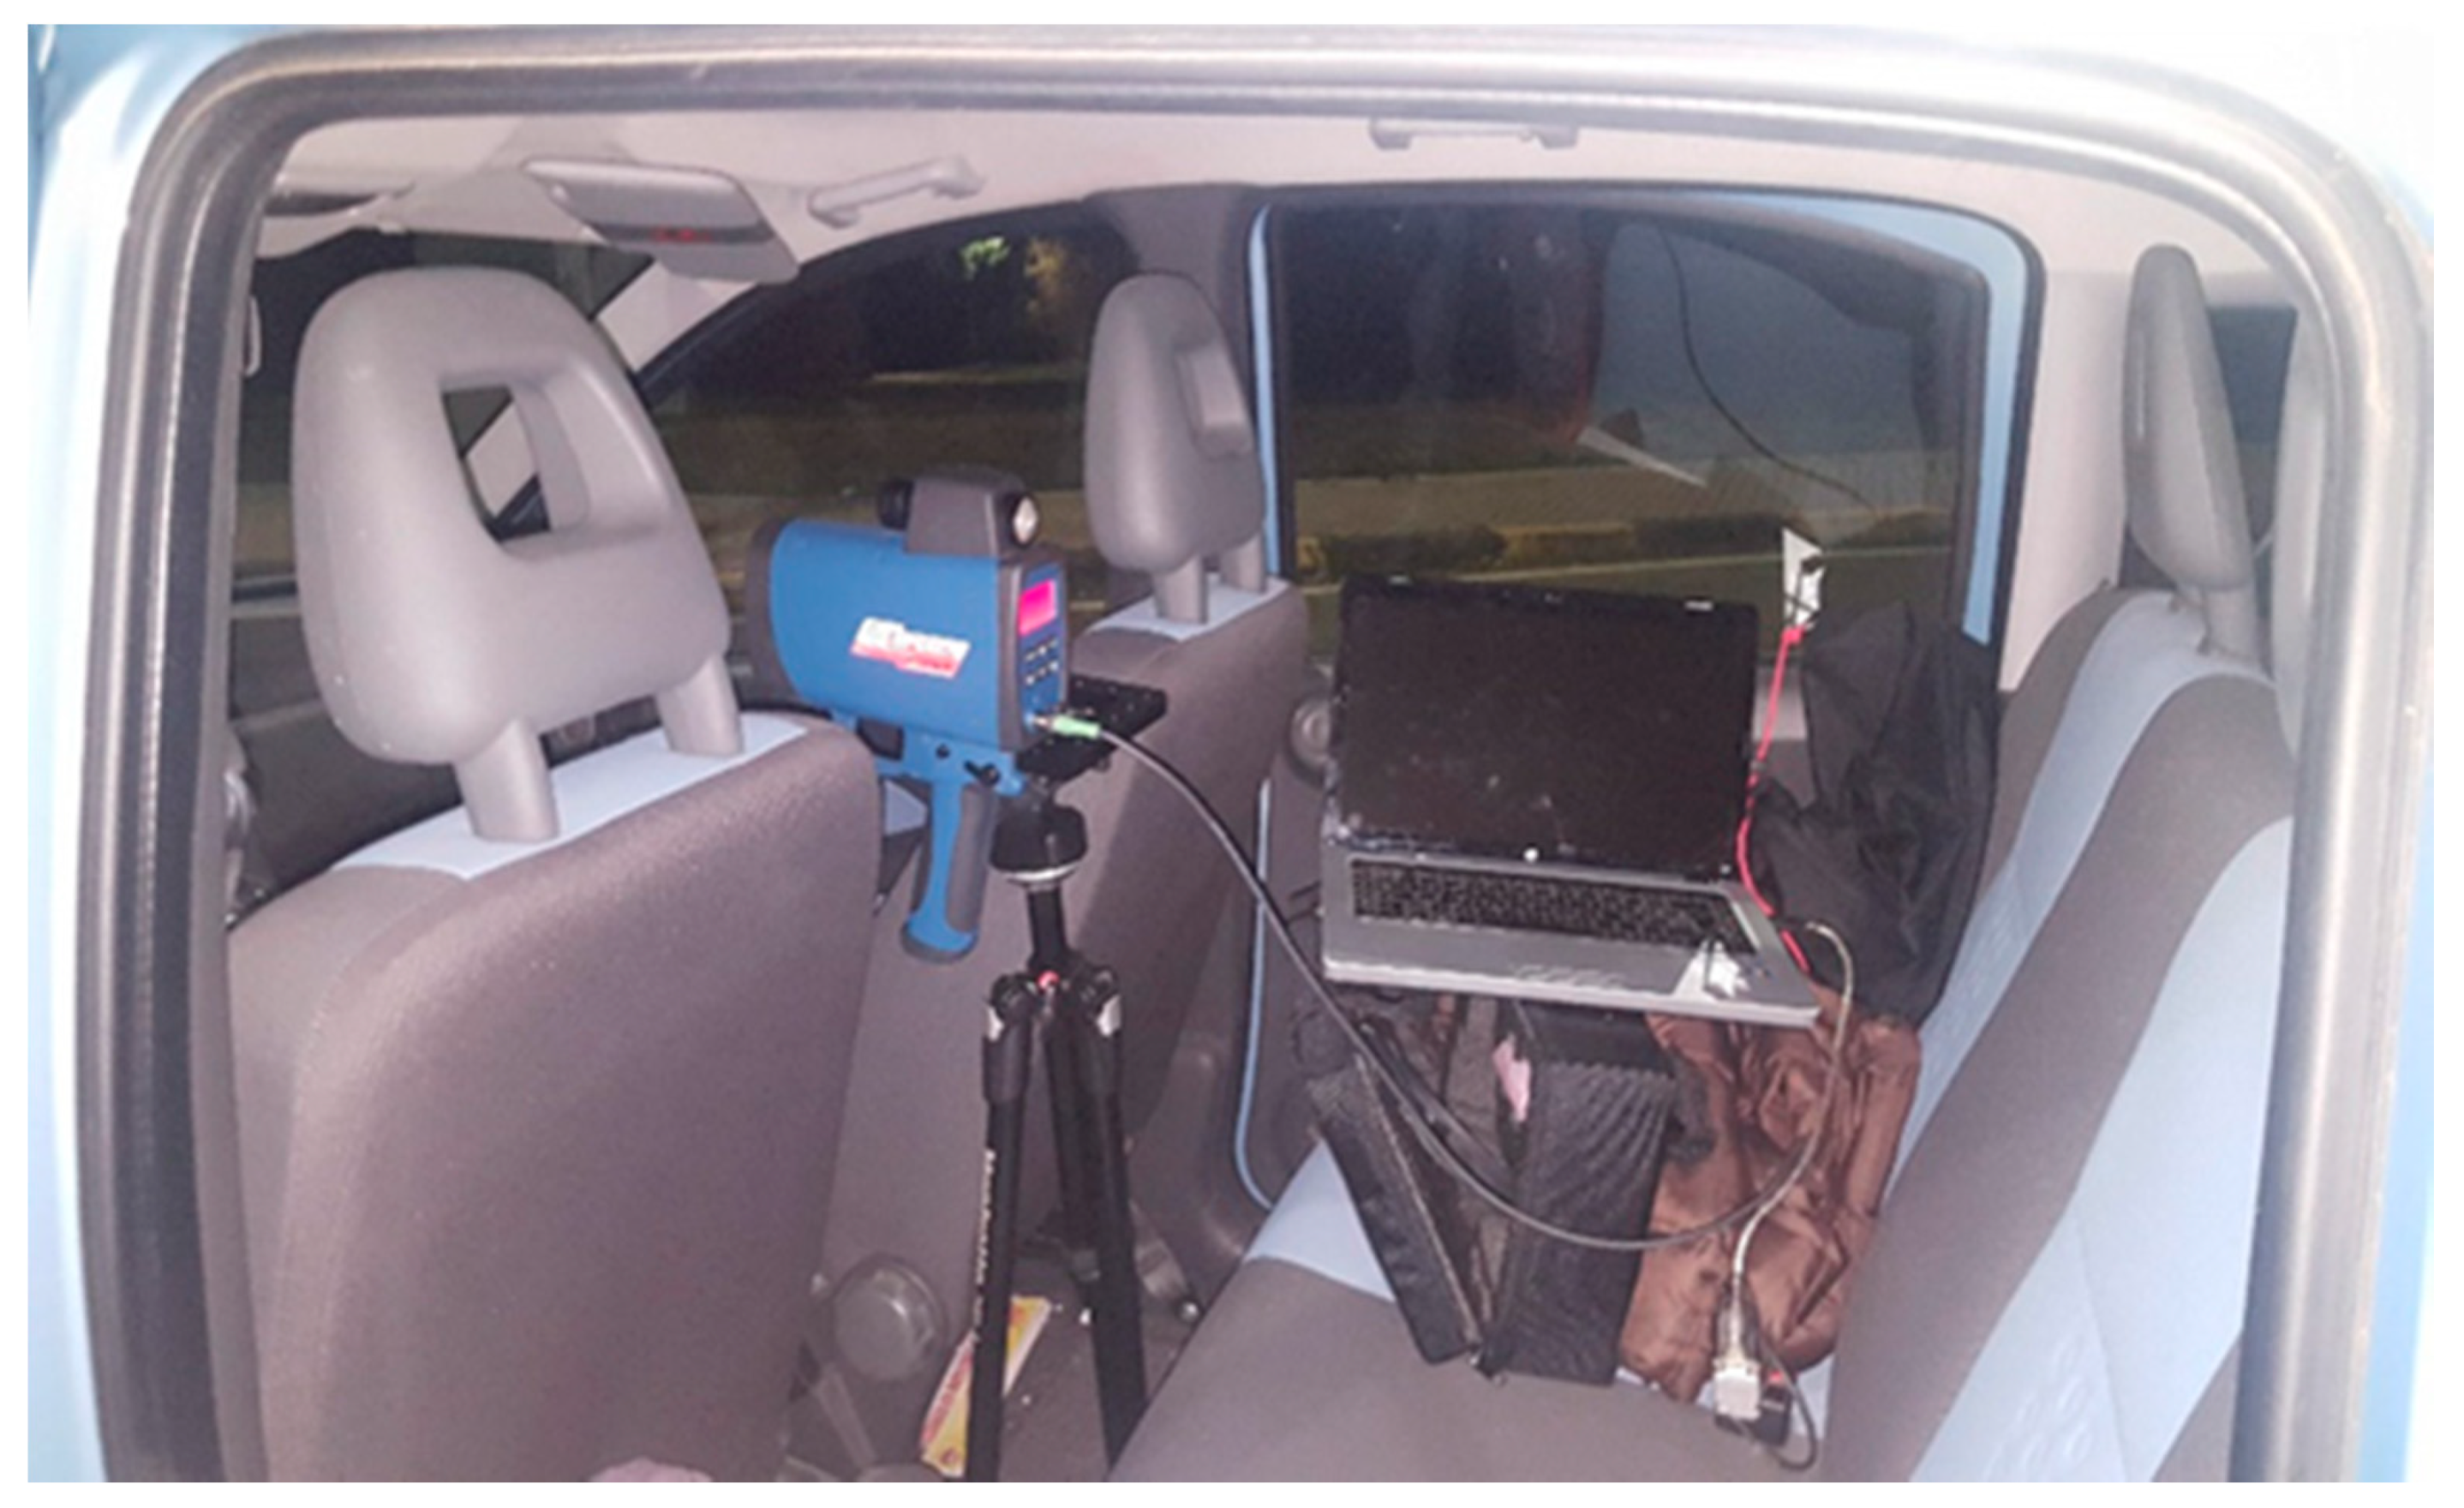
Figure 3.
Methodological scheme.

Figure 4.
Optical sensor.
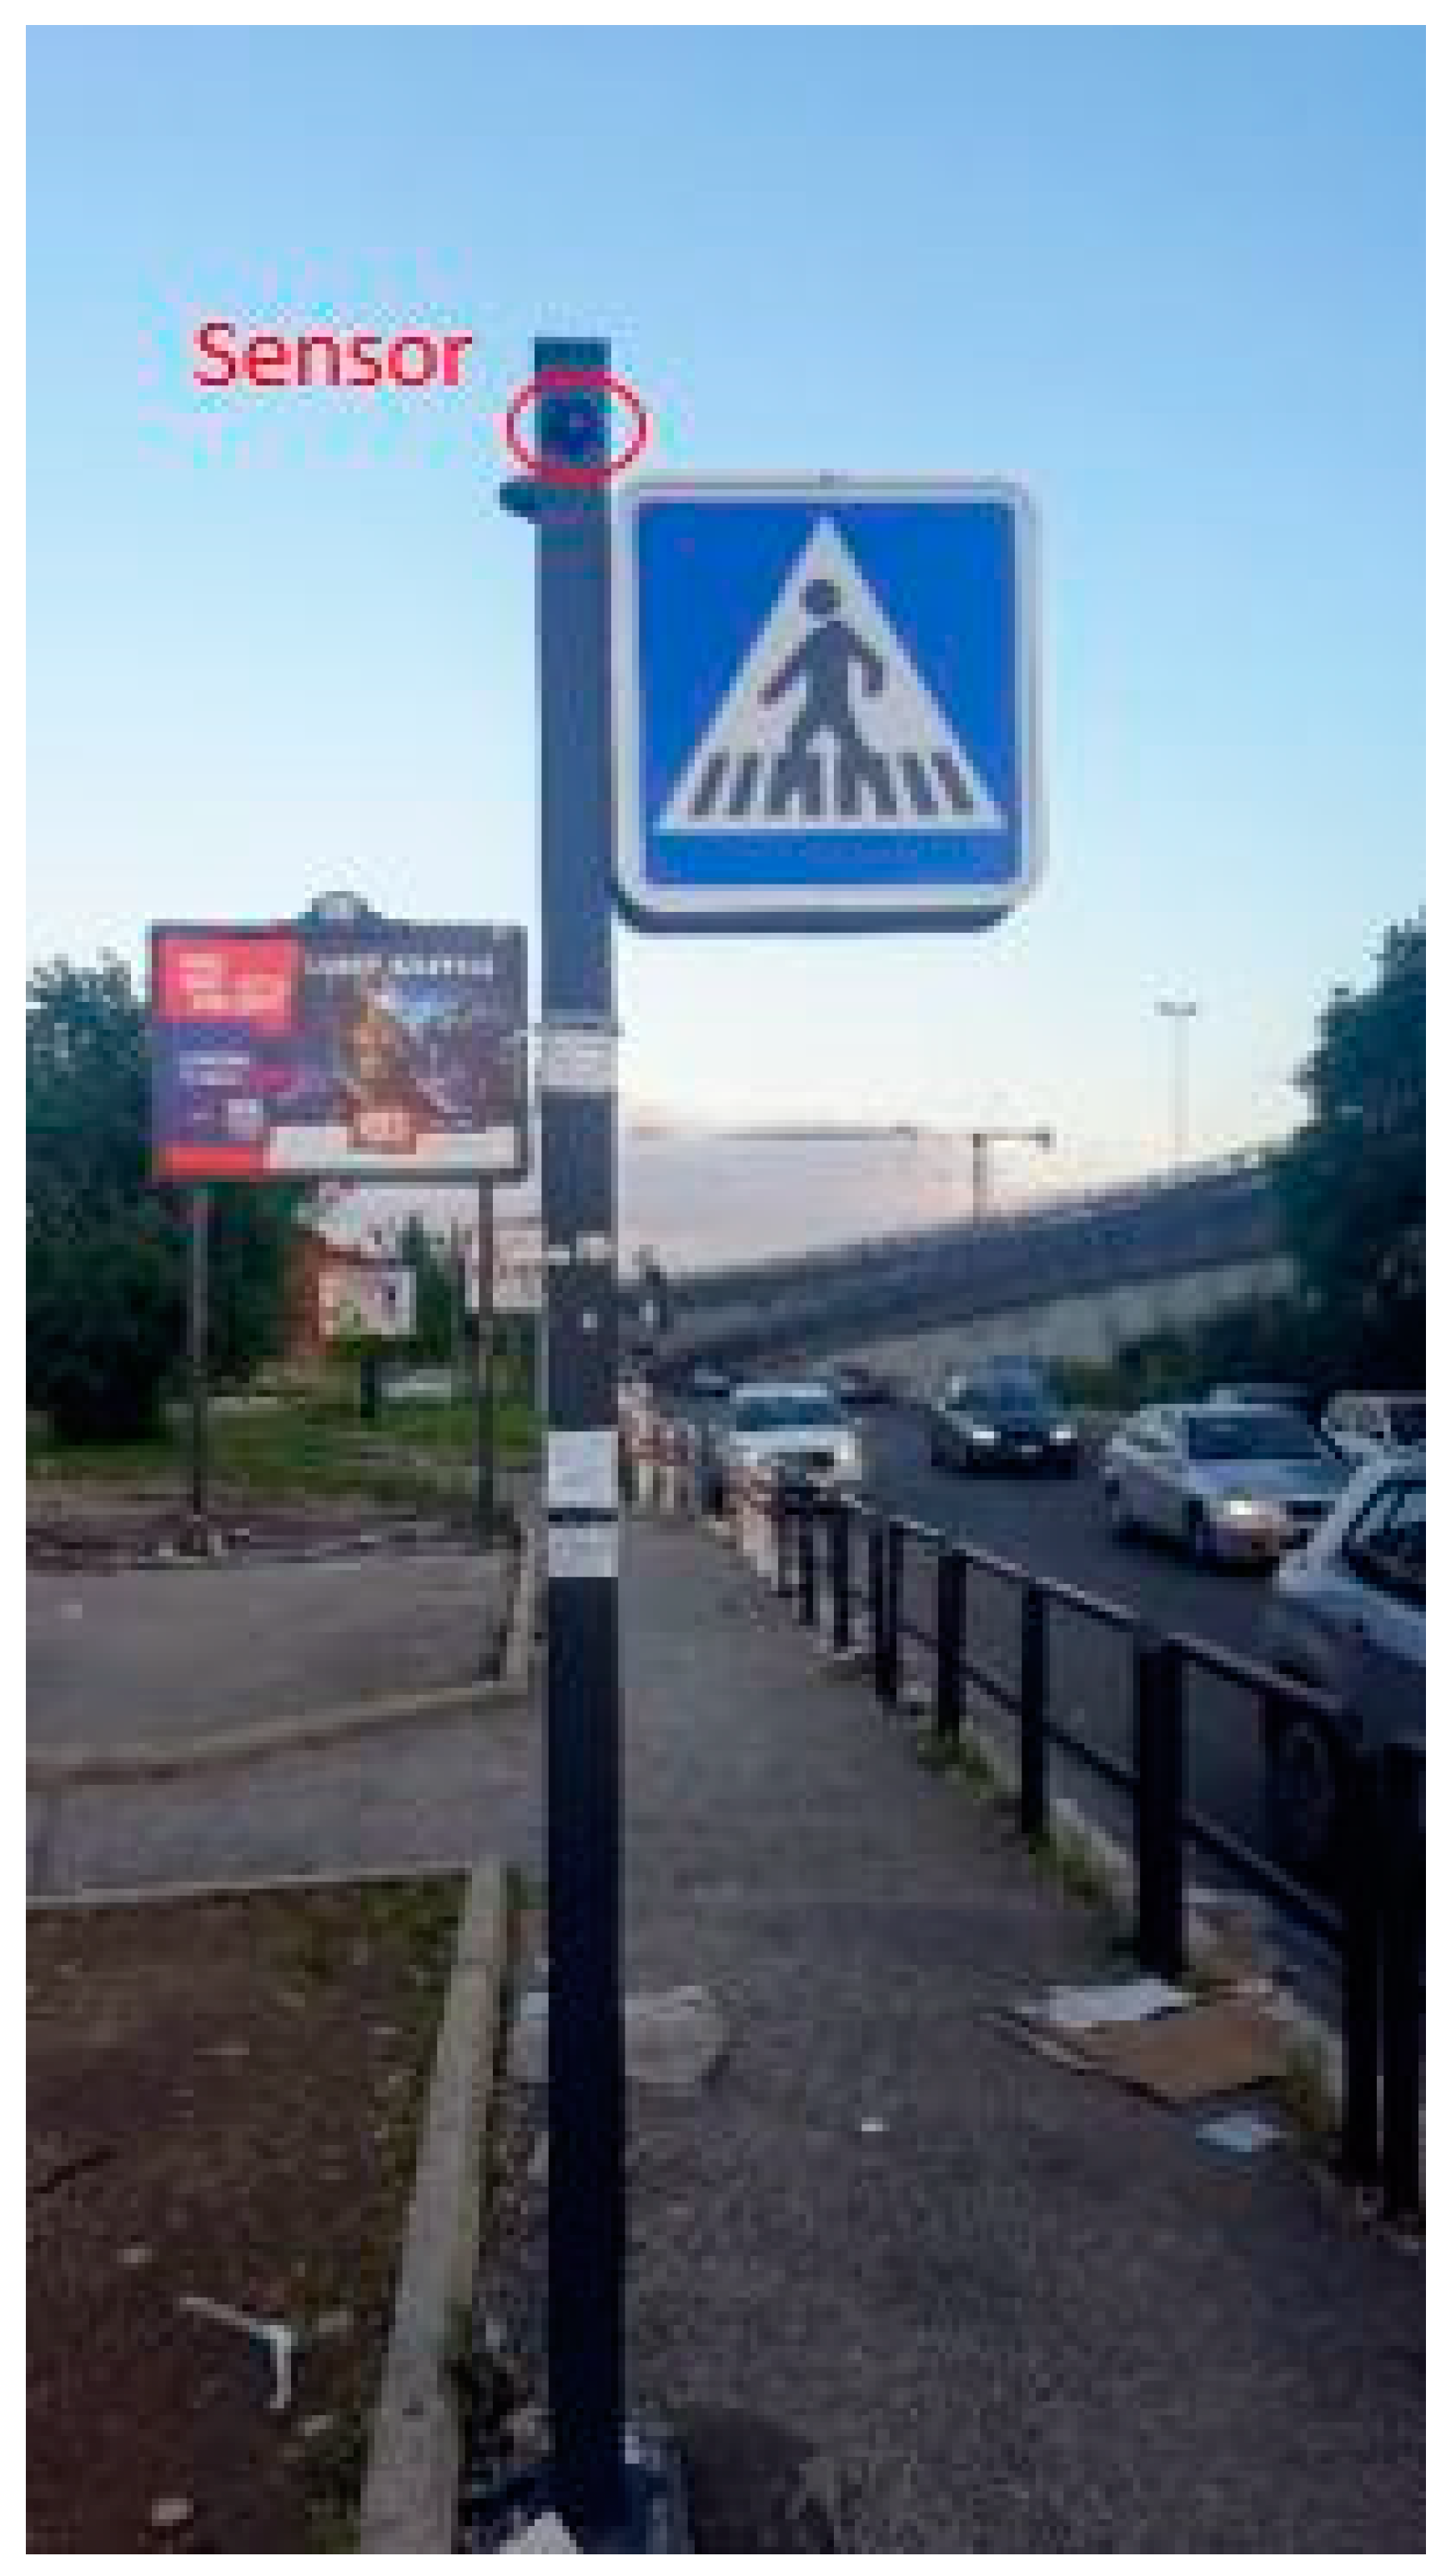
Figure 5.
The analyzed road segment.

Figure 6.
Mean speed profiles (No Pedestrian).

Figure 7.
Mean speed profiles (with pedestrian).
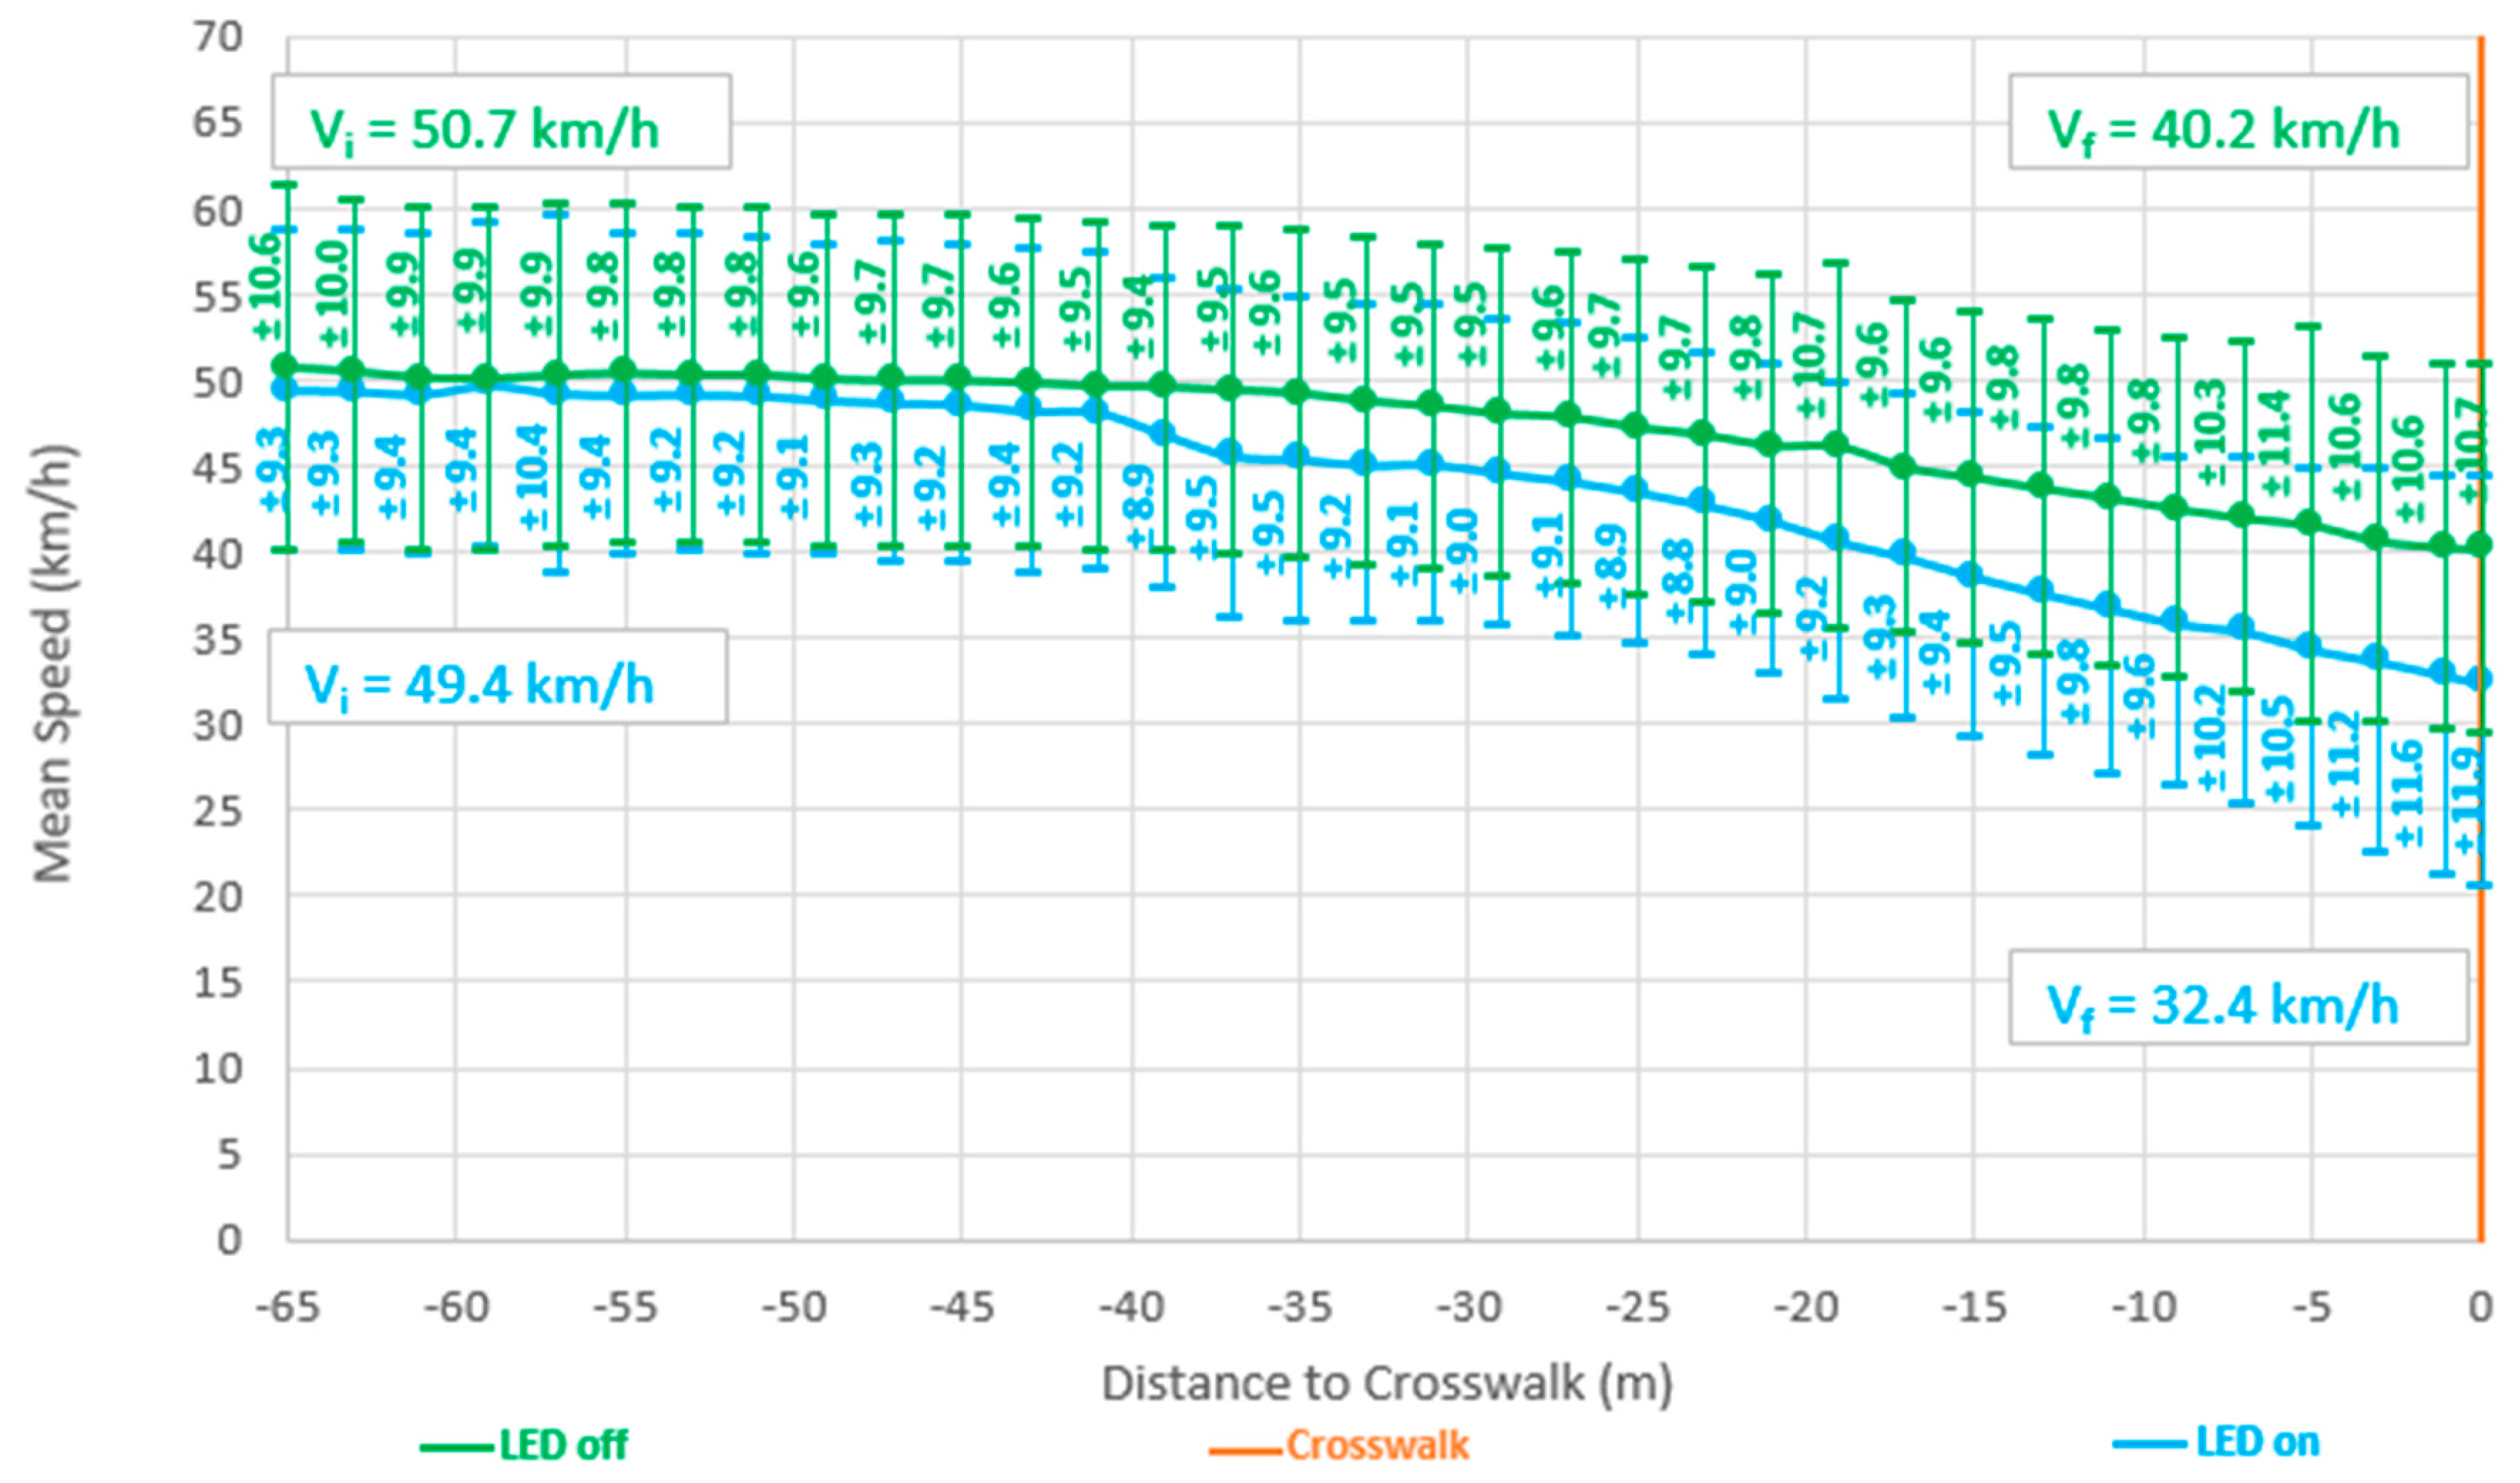
Figure 8.
Deceleration analysis over three distance ranges.

Table 1.
Mean speed comparison (no pedestrian).
| Case 1—No Pedestrian | |||
|---|---|---|---|
| Vi (km/h) | Vf (km/h) | ||
| LED off | 49.9 ± 7.6 | 47.7 ± 7.6 | −4.3% |
| LED on | 50.2 ± 8.8 | 39.9 ± 9.6 | −20.6% |
Table 2.
Mean speed comparison (with pedestrian).
| Case 2—with Pedestrian | |||
|---|---|---|---|
| Vi (km/h) | Vf (km/h) | ||
| LED off | 50.7 ± 10.6 | 40.2 ± 10.7 | −20.7% |
| LED on | 49.4 ± 9.3 | 32.4 ± 11.9 | −34.4% |
Table 3.
Deceleration comparison.
| Deceleration Analysis | ||
|---|---|---|
| LED on | LED off | |
| Deceleration (m/s2) | −0.83 | −0.57 |
© 2020 by the authors. Licensee MDPI, Basel, Switzerland. This article is an open access article distributed under the terms and conditions of the Creative Commons Attribution (CC BY) license (http://creativecommons.org/licenses/by/4.0/).
Share and Cite
MDPI and ACS Style
Patella, S.M.; Sportiello, S.; Carrese, S.; Bella, F.; Asdrubali, F. The Effect of a LED Lighting Crosswalk on Pedestrian Safety: Some Experimental Results. Safety 2020, 6, 20. https://0-doi-org.brum.beds.ac.uk/10.3390/safety6020020
AMA Style
Patella SM, Sportiello S, Carrese S, Bella F, Asdrubali F. The Effect of a LED Lighting Crosswalk on Pedestrian Safety: Some Experimental Results. Safety. 2020; 6(2):20. https://0-doi-org.brum.beds.ac.uk/10.3390/safety6020020
Chicago/Turabian StylePatella, Sergio Maria, Simone Sportiello, Stefano Carrese, Francesco Bella, and Francesco Asdrubali. 2020. "The Effect of a LED Lighting Crosswalk on Pedestrian Safety: Some Experimental Results" Safety 6, no. 2: 20. https://0-doi-org.brum.beds.ac.uk/10.3390/safety6020020
Note that from the first issue of 2016, this journal uses article numbers instead of page numbers. See further details here.