Using a Neural Network Analysis to Assess Stressors in the Farming Community

Psychology Department, Colorado State University, Fort Collins, CO 80523, USA
*
Author to whom correspondence should be addressed.
Safety 2020, 6(2), 21; https://0-doi-org.brum.beds.ac.uk/10.3390/safety6020021
Submission received: 17 February 2020
/
Revised: 10 April 2020
/
Accepted: 13 April 2020
/
Published: 16 April 2020
Abstract
:In the 1980s and 1990s, with decreasing numbers of full-time farmers and adverse economic conditions, chronic stress was common in farmers, and remains so today. A neural network was implemented to conduct an in-depth analysis of stress risk factors. Two Colorado farm samples (1992–1997) were combined (n = 1501) and divided into training and test samples. The outcome, stress, was measured using seven stress-related items from the Center for Epidemiologic Studies-Depression Scale. The initial model contained 32 predictors. Mean squared error and model fit parameters were used to identify the best fitting model in the training data. Upon testing for reproducibility, the test data mirrored the training data results with 20 predictors. The results highlight the importance of health, debt, and pesticide-related illness in increasing the risk of stress. Farmers whose primary occupation was farming had lower stress levels than those who worked off the farm. Neural networks reflect how the brain processes signals from its environment and algorithms allow the neurons “to learn”. This approach handled correlated data and gave greater insight into stress than previous approaches. It revealed how important providing health care access and reducing farm injuries are to reducing farm stress.
1. Introduction
Occupational stress among farmers is not a new issue. Researchers have assessed stress using standard survey techniques beginning in the 1980s [1,2]. In the 1990s, with the reduction in the number of farmers and full-time employees and the increase in part-time employment in farmers, researchers recognized the challenges that were occurring in rural areas [3,4,5]. Issues studied in association with farm stress included paperwork, new legislation, loss of family traditions, finances, isolation, media criticism, ill health, and the future of the farm [3,6]. That farmers experience on-going and complex stress is a fact acknowledged worldwide [7]. Farmers continuously experience feelings of a lack of control in response to chronic, unpredictable stressors [8]. Depressive and anxiety disorders can result from exposure to chronic, unpredictable environmental stress [9,10,11,12,13]; see [14] for a recent review on stressors and mental health in farmers.
Indicators of stress in farmers were first examined by Walker and Walker in 1986 in their initial development of the Farm Stress Inventory (FSI). Respondents were asked to report the frequency of experiencing 19 stress symptoms adapted in part from the Hopkins Symptom Checklist [15]. The items included increases in alcohol consumption and smoking, weight gain or loss, change in health, trouble relaxing, nightmares, chronic fatigue, sleep disruptions, frequent illness, headaches, forgetfulness, trouble concentrating, increase in arguments, behavior problems in children, marriage problems, back pain, losing one’s temper, and avoiding decisions.
Thu and colleagues (1997) used seven stress-related Center for Epidemiological Studies-Depression (CES-D) items [16] and 10 additional items from a neurological symptoms scale and summed them to create a stress score [17]. Items selected were comparable to the Perceived Stress Scale developed by Cohen and colleagues [18]. The CES-D included seven items: felt bothered by things that don’t usually bother you, had trouble keeping your mind on what you were doing, slept restlessly, did not enjoy life, not felt like eating or had a poor appetite, felt like everything you did was an effort, and felt unhappy. The neurological symptoms scale included tire easily, light-headed and dizzy, difficulty concentrating, trouble remembering things, relatives notice your memory problems, had to make notes to remember, hard to read written materials, felt irritable, difficulty falling asleep, and headaches.
In 1986, Walker and Walker initiated development of the first farm-specific stress survey, the Farming Stress Inventory (FSI), by asking 140 Canadian farmers to rank the top five farm stressors [8]. Financial stress was most common (83%), followed by unfavorable or unpredictable weather (75%), and government agricultural policies (75%). Further development of the scale involved interviewing 808 Canadian farmers and showing positive associations between stressors in the FSI and symptoms of stress [1]. Over half of the stressors most strongly predicting stress symptoms were unique to farming, demonstrating that using a stress scale designed for the general population may be missing important stressors in farmers.
Additional measures specific to farmers followed in the 1990s [19,20] with a call for the development of a theory specifically linked to farming as a basis for the development of farm stress measures [21]. However, research on farm-related occupational stress has lagged behind other industries [22]. The current approach to workplace stress focuses on the mismatch between work demands and pressures and the knowledge of the workers, their capabilities to do the work, and their ability to cope [22]. Using this perspective, the stressors associated with farming are left out of the approaches used for interventions, which have focused on stigma and attitudes towards employees suffering from stress and mental illness [22,23] but have neglected the role of the external environment (e.g., weather), regulations, and market forces.
Eberhardt and Pooyan (1990) interviewed six farmers to develop constructs related to areas of their work that concerned them [19]. Qualitative analysis of the interview data produced 28 items with a 7-category Likert scale to capture responses. The scale was tested in 11 farmers at a farm show and, after review by a farm stress counselor, was found to adequately represent farmer concerns. Subsequently, 362 of 1300 possible farmers responded by mail to the 28-item instrument (response rate 28%). Principal components analysis indicated that six constructs adequately captured the 28 items. The six constructs were: economics, geographic isolation, time pressures, climatic conditions, personal finances, and hazardous working conditions. The constructs formed the Farm Stress Survey (FSS) and were validated using a Life Satisfaction Scale, Emotional Strain Symptoms Scale, and illness frequency. The six factors accounted for 61.8% of the variance in the 28 survey items. The survey did not measure stress related to health or injury.
Deary and colleagues (1997) developed a survey based on the literature and items from the FSS and the FSI, modified for farmers in the United Kingdom [20]. Data from this study of 318 farmers from a variety of farm types (mixed, dairy, cereals, cattle, sheep) became the basis of the Edinburgh Farming Stress Inventory, which identified six domains they reported as causing high stress levels. The domains were described as farming bureaucracy, finances, isolation, uncontrollable natural forces, personal hazards, and time pressures. Using their scale, they found differences in stress levels by type of farming and that younger farmers and women had higher levels of farm stress. The constructs were similar to the FSS, again lacking heath and injury.
Several farm stress scales were developed after 2000 [24,25,26,27]. A 2008 study of 1343 Iowa farmers asked about a list of farm-related stressors (45% response rate) [24]. The stress items used were based on an unpublished pilot study. Respondents were asked to compare each of 62 items to the stress of being married. Farmers rated 44 items as being more stressful than marriage; 18 items were less so. Personal adversity (loss of spouse or children), disabling injuries, and crop losses were highest on the stress comparison. Farmers between the ages of 40–79 and females showed the highest stress levels.
The Farming Family Stressor Scale addressed stress in Australian farmers [25]. Based on a survey of 278 farm family members in 2010 and consisting of 29 items, the scale showed good reliability and validity. The domains of stressors included hazardous working conditions, geographic isolation, personal finances, time pressures, climate conditions, and general economic conditions. Health was not included.
Using a modified version of Welke’s Farm Ranch Stress Inventory [26] in a sample of 128 private pesticide applicators in North Carolina in 2012, several additional stressors were identified [27]. Substantial numbers of respondents said weather (60.2%), the future of the farm (29.7%), outsiders not understanding the nature of farming (25.2%), machinery problems (23.4%), commodity prices (45.3%), taxes (38.3%), health care costs (32.5%), and lack of family recreation time (13.3%) were “very stressful”. The farmers were mostly 40–59 years of age, had farmed at least 20 years, and worked more than 40 h per week on the farm. Welke’s survey included health care concerns and the future of the farm, which had not been reported previously.
Risk factors for stress are highly correlated; a factor can be both a source of stress and an outcome of stress, e.g., sleep deprivation, illness, injury. Variables associated with stress such as negative life events, substance use, farm workload, chemical exposures, social support, and pre-existing physical conditions are related and may be rare events. The presence of collinearity can result in small singular values in the design matrix, causing instability in estimators or non-convergence of the model [28]. Previous studies on correlated stressors have chosen to include only a single stressor and to remove stressors correlated with it, however, that can result in removing an important stressor with more proximal causal associations with stress. In addition, interactions among stressors have been ignored entirely. Stressors do not occur in isolation, especially on a farm. Classical statistical models cannot address these challenges.
A neural network is a learning algorithm that originated independently in psychology, statistics, and artificial intelligence. It is a nonlinear statistical model that uses a hidden layer and back propagation to minimize an error function [29]. Modeled on the functioning of the human brain, a neural network contains a hidden layer with nodes that represent neurons [30]. Each connection between nodes represents a synapse. A node (neuron) fires when the signal it receives exceeds a threshold value, resulting in being in an “on” or “off” state. The threshold value is typically modeled using a sigmoid activation function. The hidden layer, usually called “Z”, is not directly observed. This is analogous to latent variable models such as a structural equation model. The Z layer is an expansion of a linear function formed from a transformation of the original independent variables. The transformed vector of predictors is used in the activation function to produce the hidden units and then a linear transformation is applied to predict the outcome variable. Each hidden unit represents a different interaction term. For example, a model with two hidden units (neurons) can model a three-way interaction between predictors. The difference between the observed outcome and the predicted outcome is captured using the mean squared error (MSE) with the goal of minimizing the MSE. The parameters of the model are “learned” from the data using a back propagation algorithm in a forward and backward sweep [31,32].
Sources of stress in the agricultural community have remained unchanged for decades and remain multidimensional and complex. Asking farmers directly what they think is contributing to their stress levels might miss important risk factors for stress. It is unlikely that farmers understand the interplay and complexity of all possible contributors to stress they experience in a larger context. There have been no studies that have addressed stress in a sample of farmers without asking them directly about what they perceive their stressors are. The development of stress theory specific to farmers would benefit from an extrinsic approach with novel statistical methods linking correlated stressors to the stress response, allowing for complex interactions. The purpose of this study is to identify important farm stressors that could be used in a stress measure. Using data collected in 1992–1997 in eight counties in Colorado and in 1993 in a statewide survey in Colorado, we used the novel method of a neural network to ask two questions: (1) Can we identify a set of stressors out of 31 possible indicators that are most important in predicting stress based on the stress-related items in the CES-D and (2) can we validate the model by using a second set of test data to see how well we can reproduce the model with minimal errors.
2. Materials and Methods
2.1. Sample
Two Colorado farm samples were combined for these analyses. The Eight County Survey conducted by personal interview from 1992 to 1997 included 761 individuals from 479 farms and had a 57% response rate. This sample was collected using property value assessment lists or rural directories from northeastern Colorado. The Statewide Survey of 876 individuals from 485 farms conducted by telephone utilized data collected in 1993 and had a 70% response rate. These farms were identified using the Colorado Department of Motor Vehicles list of farm truck registrations. All farms met the US Bureau of Agriculture’s definition of a farm. The total sample size of complete cases was 1501.
2.2. Measures
2.2.1. Outcome Variables
Initial assessment of the seven-item CES-D scale used by Thu, et al. [17] showed that five of seven items load strongly on the somatic domain of the CES-D scale. The two remaining items, feeling happy and enjoying life, load more strongly on the positive affect domain, but with some level of crossover with the somatic domain. Overall, evidence suggests that the scale represents a measure of the somatic effects of stress and mood issues related to stress. To assess the validity of using only the CES-D scale items and excluding the neurological scale items, we conducted a regularized regression analysis on the CES-D items separately from the combined CES-D and neurological items. As described below, we statistically compared the 31 predictors to see how they differed between the two scales in regularized regression models. The results showed that the neurological items added very little to the CES-D items. The only exception was the number of alcoholic drinks consumed, where it was predictive in models with both CES-D items and the neurological items. The totality of these results suggests an adequate scale for measuring stress.
The seven CES-D items used by Thu and colleagues [17] and described above were summed to create a stress symptoms score. The frequency of each symptom in the past week was coded as 0 = rarely or none of the time (<1 day), 1 = some or a little of the time (1–2 days), 3 = occasionally or a moderate amount of the time (3–4 days), and 3 = most or all of the time (5–7 days). The ten neurological symptom items also described above were summed to create a score. The frequency of neurological symptoms in the past month were coded as 0 = not at all, 1 = a little, 2 = moderately, and 3 = quite a bit/extremely. The five-category neurological items were collapsed into four categories to align with the four response categories in the CES-D scale by combining the two upper categories. Only one of the farm samples contained both the CES-D scale and the neurological symptoms scale, so this sample of farm residents was used to compare predictors of the CES-D score to the combined CES-D and neurological symptoms score. Stress-related CES-D and neurological symptom scores were summed to create a total stress score matching the Thu et al. (1997) study [17]. Higher values of the stress scores represent greater levels of stress.
2.2.2. Explanatory Variables
Past year economic and farm-related characteristics included the number of families residing on the farm, number of acres of cropland in use, sales value of all crops, total number of workers on the farm, whether the operator or spouse worked on another farm, whether farming was the primary occupation (at least 50% of time spent farming), and number of days worked off the farm for at least four hours per day. The yes or no questions “Has your income decreased substantially?” and “Have you gone deeply into debt” were used to assess personal financial strain. We included the number of years the respondent had been involved in agriculture because younger farmers tend to have more debt than older farmers, resulting in greater stress, and may partially explain age as a significant predictor of stress [20,31]. Personal characteristics, health, and psychosocial factors included age, gender, education, marital status, alcohol and nicotine use, adverse life events (death of spouse, family member, or close friend, divorce), farm injury, hours of work per week, self-perceived health status, had health insurance, number of visits to a doctor, number of prescriptions, whether respondent had stopped working due to health problems, had a hospitalization, any chronic disease (heart disease, bronchitis, emphysema, stroke, diabetes, cirrhosis, multiple sclerosis, Parkinson’s disease, cancer), have a usual doctor when needed, whether cost prevented seeing a doctor when needed, experienced a pesticide-related illness, number of close relatives or friends, and number of clubs involved in.
2.3. Statistical Analysis
Descriptive statistics included frequencies and percentages for categorical variables and means and standard deviations (SD) for continuous variables. These analyses were conducted in SAS version 9.4. Ridge regression and neural network models were conducted in R.
2.3.1. Regularized Regression
Thu and colleagues (1997) used stress items from both the CES-D and the neurological symptoms scale, so it was important to test whether using only CES-D items was a valid approach to measuring stress in a subsequent neural network. We used regularized regression, which allows for correlated predictors [33,34]. We compared the regression models using the same 31 predictors and examined what predictors significantly predicted the CES-D stress scale and the combined scale. In addition, the results of these regression models could be compared to the results produced by the neural network. These analyses were conducted in R using the ridge package [35].
2.3.2. Training the Neural Network
The data set of complete data was randomly divided into a training set (n = 1126, 75%) and a testing set (n = 375, 25%) after standardizing the continuous variables. A total of 31 predictors and a single outcome, stress scale score, were used to test one to five hidden layers. After two hidden layers, the differences in MSE were small. This confirms the literature on neural networks where a single hidden layer is usually sufficient to allow for learning to occur [36]. Additionally, using only one hidden layer reduces the problem of overfitting, but to further reduce this complexity, we used random starting values near zero and incorporated a complexity penalization term to regularize the network. We then used MSE to identify the appropriate number of neurons in each layer. Two neurons produced the smallest MSE, which allows for modeling a cubic function. We then executed models generating the Akaike Information Criterion (AIC) and Bayesian Information Criterion (BIC) fit values and examined the weights for each variable on each of the two neurons in the hidden layer. In an iterative process, we pruned the network by removing one variable at a time where the weight was near zero until the MSE reached its lowest value.
Due to the difficulty of interpreting the weights in a neural network because of higher-order interactions being in the transformed function and the mechanics of the algorithm used, an importance measure was developed [37]. Olden summed the product of the connections between the input and hidden layers with the connections between the hidden layer and the output variable and scaled them to produce an estimate of effect size between the predictor and the outcome. Importance is a relative measure and predictors should be compared to one another within the same model. We used this importance measure to assess the magnitude of the stressor on the CES-D stress scale because neural networks do not generate a p value indicating the statistical significance of the predictor on the outcome.
2.3.3. Reproducibility Using the Testing Data
The quality of the predictions from the training data was measured using the standard loss function or difference between predicted outcome value based on the training data and actual observed outcome in the test data. We used 10-fold bootstrapped cross-validation to generate the prediction error in the test data. Quality of the model fit was evaluated by comparing the MSE for the training data to that for the testing data. Neural network analyses were conducted in neuralnet in the R package [38].
3. Results
3.1. The Training Sample
The training sample of 1131 farm residents was 57.1% male, 71.7% high school graduates, and 92.5% married (Table 1). The mean age of farmers was 48.8 years (SD = 13.1) and they averaged 30.6 years in agriculture (SD = 17.1). About 93% reported being in good, very good, or excellent health. The mean number of acres of cropland in use was 595 (SD = 1019) and farms averaged about six hired workers (SD = 10). The average hours per week of work over a year was reported to be 26.9 h (SD = 23.1).
3.2. Regularized Regression
In this analysis, we compared a model using the seven CES-D items as the stress outcome to a model that combined the CES-D items with the neurological items as the stress outcome. Gender (p = 0.02), decrease in income (p = 0.02), increase in debt (p = 0.0004), self-perceived health status (p < 0.0001), number of doctor visits (p = 0.04), having had a pesticide-related illness (p < 0.0001), and having a chronic disease (p = 0.0004) predicted stress measured by the CES-D scale items. In the combined stress scale, similar results were identified. Gender (p = 0.0002), decrease in income (p = 0.01), increase in debt (p < 0.0001), self-perceived health status (p < 0.0001), number of doctor visits (p = 0.0007), having had a pesticide-related illness (p < 0.0001), and having a chronic disease (p = 0.0002) predicted stress. In addition, number of alcoholic drinks consumed when drinking (p = 0.04) was also significant in the combined stress scale. No other differences were observed. The results were sufficiently similar that it seemed reasonable to use the CES-D stress items alone in a neural network approach.
3.3. Neural Network
The stress outcome was measured using seven items from the CES-D scale in this analysis. The initial model with 31 predictors showed AIC = 9791, BIC = 10,128, and error = 4829; the final model with 23 predictors resulted in AIC = 7304, BIC = 7560, and error = 3601. The MSE for the final training data was 3803 and for the test data 4246. The bootstrap cross-validation MSE values ranged from 3675 to 4749, indicating that the results were reproducible in a sample size of 377 respondents in the test data with 95% confidence.
The weights of each predictor on the two hidden units reflect the relative influence of the total information being processed in the network. These weights, although admittedly a black box, can be thought of as the increase in the activation level of a neuronal signal after processing a set of inputs. Larger weights indicate greater influence of a predictor on the outcome. Depending on the direction of the coding of the variable, the sign of the weights should reflect the direction of the effect. Fifteen of the predictors had weights of over 100 on at least one of the hidden units, suggesting that they were important in predicting stress (Table 2).
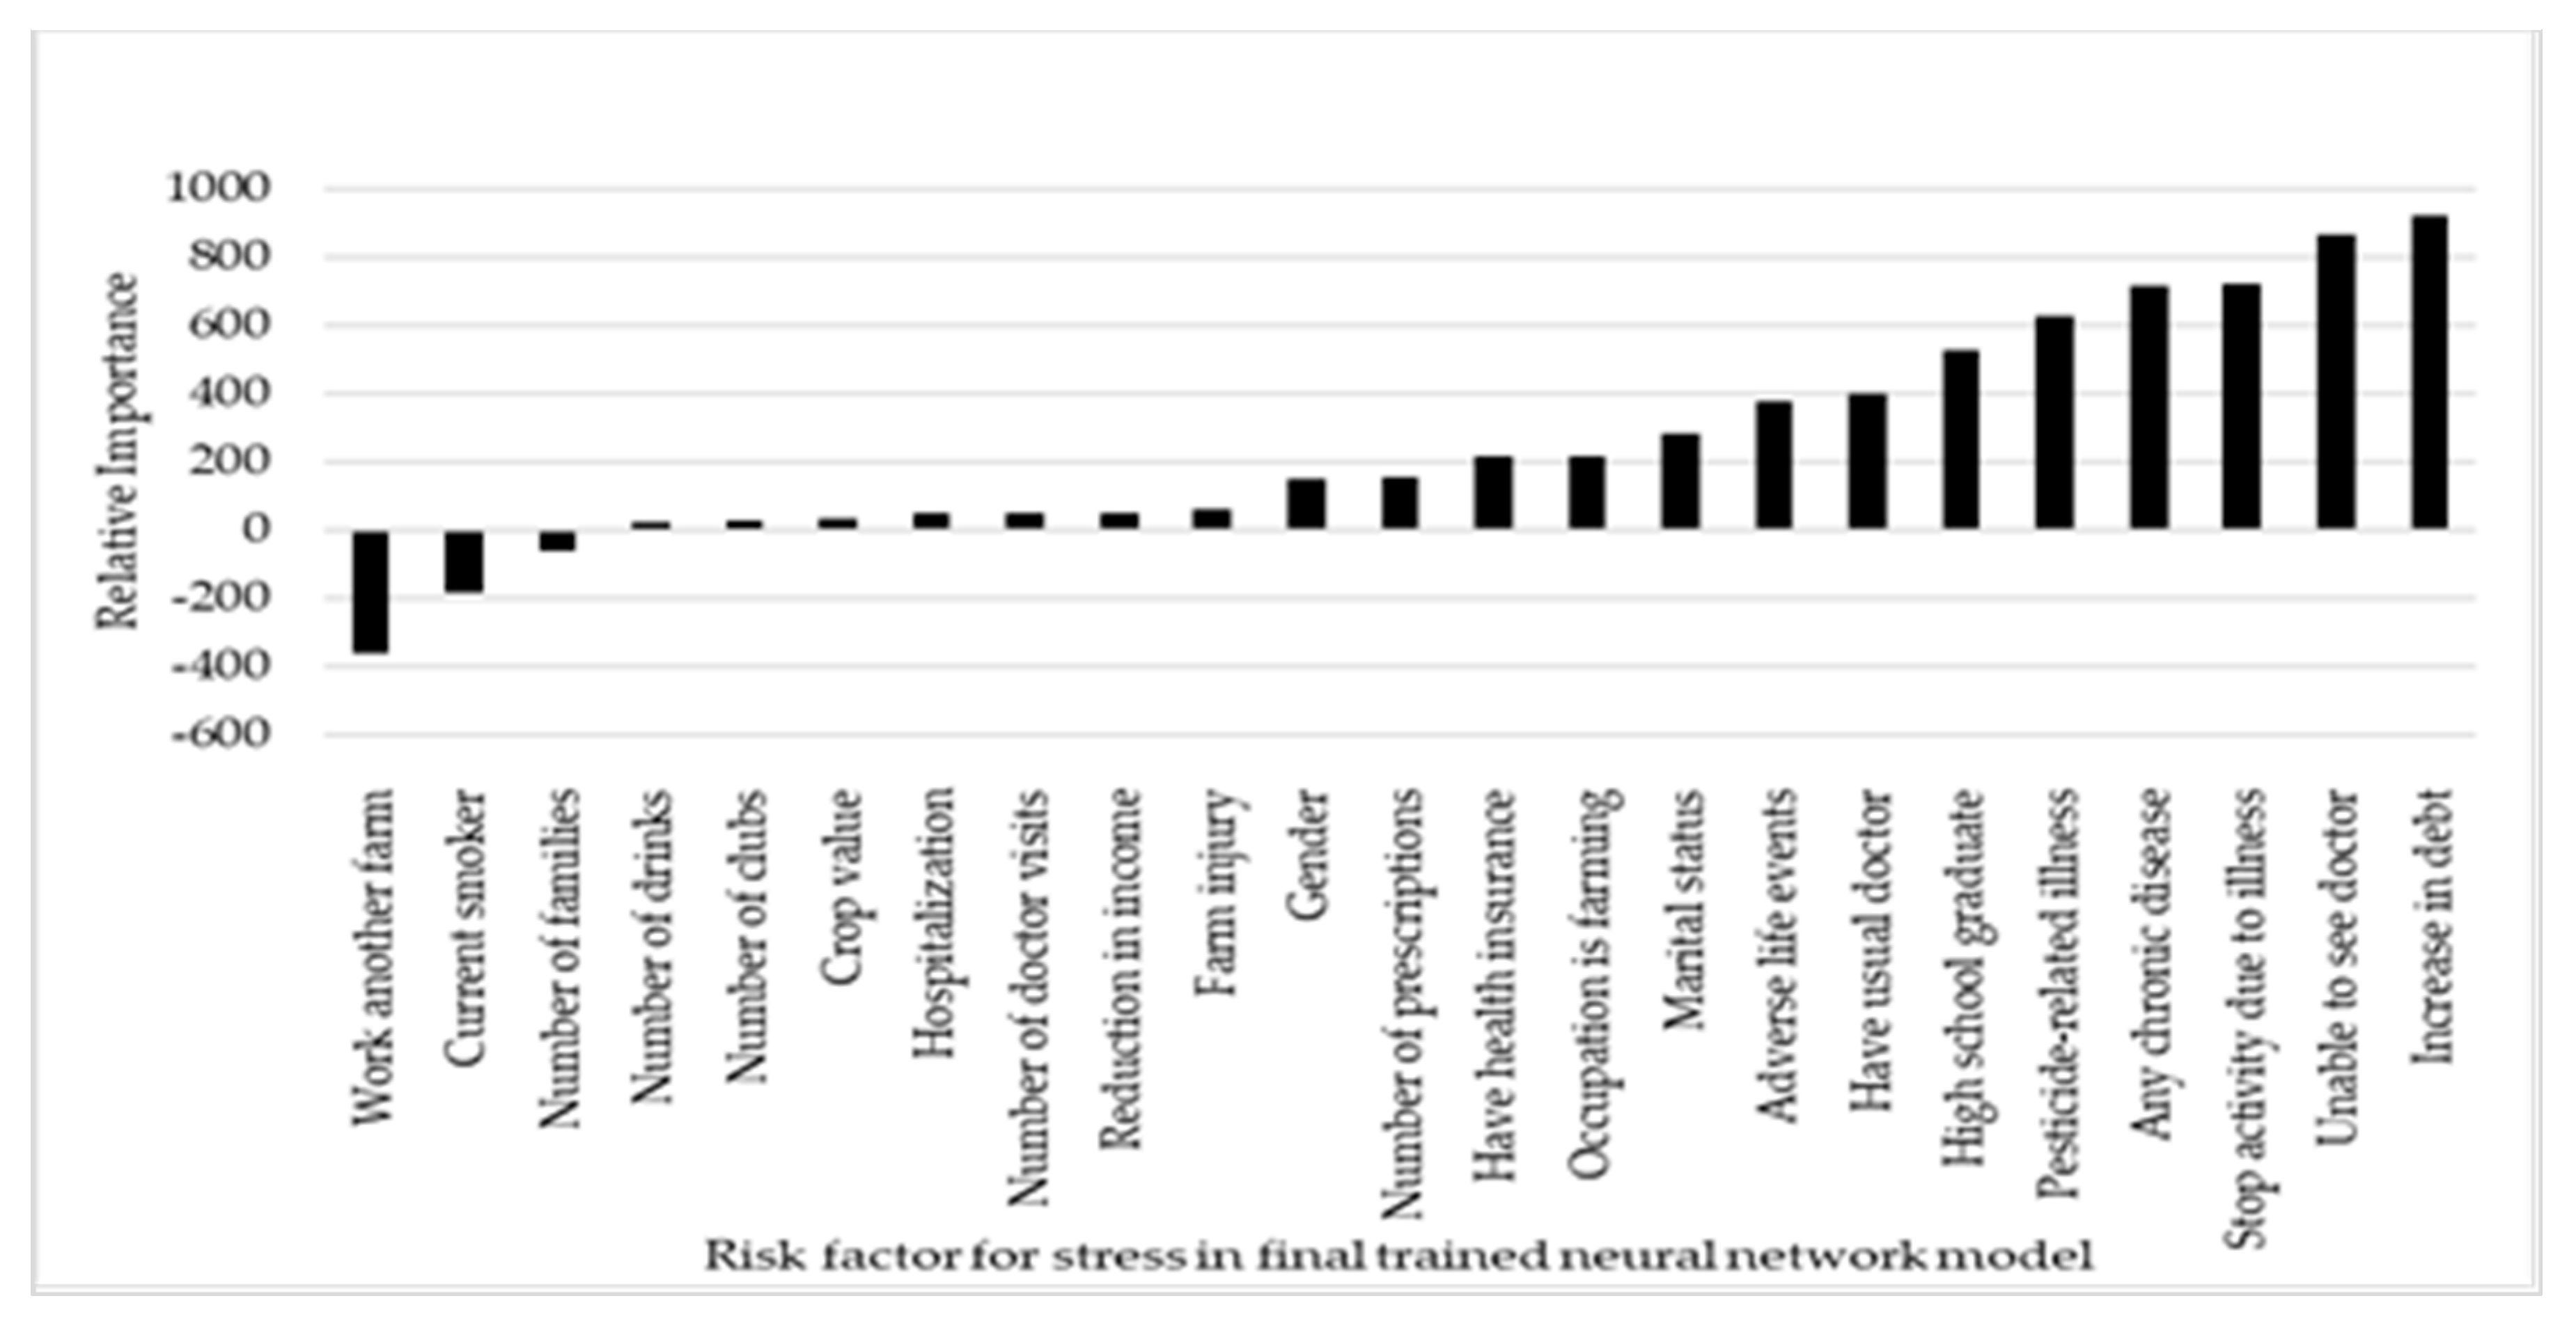
The importance measure in this neural network showed debt had the largest signal of all predictors (importance = 922). The next set of predictors of highest magnitude were the health indicators, where six of eight were greater than 100. Unexpectedly, having had a pesticide-related illness was in the top four at an importance of 626. Other important predictors were adversity and working on another farm (Table 2 and Figure 1). Married, male farm residents with a high school education were at the lowest levels of stress.
Potential stressors not shown to be important were the age of the farm resident, self-perceived health status, number of close relatives or friends, number of years working in agriculture, number of acres of cropland in use, the total number of workers on the farm, number of hours of work per week, and having paid employment off the farm.
The hidden layers had nearly equal weights on the stress level outcome, but with reversed signs (−11.3 and 11.6). This result suggests that interactions between the predictors are highly influential on stress and that non-linearities are present in the relationship between outcome and explanatory variables. These patterns of associations are not easily identified in classical regression methods and collinearity is an issue in standard methods.
4. Discussion
Using an approach designed to manage complexity, we identified predictors of stress that have not previously been considered. Our approach to better elucidate factors that increase stress in farmers used previously collected data but did not ask farmers directly about what they believe causes stress. Our results indicate that debt, healthcare, high pesticide exposures, and physical wellness are of highest importance to predicting stress in farmers. The relative importance of predictors appeared to group into those with magnitude of less than 100 (range 24.8–59.5) and those of magnitude greater than 100 (range 150–922) with a gap between the two groups. Several surprising results were seen in predictors with high importance compared to what has been reported in the literature. First, having had a pesticide-related illness had similar effects on stress levels as having a chronic disease. Second, many health-related risk factors showed very strong effects. In terms of access to health care, being able to see a doctor when it is needed, having a usual place to go for medical care, and having health insurance were strongly stress-reducing. Health status measured by having to stop activity due to illness, having a chronic disease, taking prescription medications, and being a current smoker also showed strong contributions to stress. Third, having a high school education reduced stress levels. Fourth, working on another farm strongly predicted higher stress levels and was more important than having farming as the primary occupation. As seen in every published study of stress in farmers, increase in debt was the strongest predictor of stress. Debt was far more important than income.
The second group of predictors were not as important, but removing them increased the MSE in the model. The more families on the farm, the lower the stress, may be providing a measure of social support. The number of alcoholic drinks consumed when drinking was associated with increased stress levels. Increased stress is known to increase alcohol consumption, which in turn, could increase stress due to reduced productivity. Having a hospitalization, increasing number of visits to the doctor in the past year, decreased income, and experiencing a work-related injury contributed to increased stress.
Two counter-intuitive findings were observed. A higher sales value of crops and being involved in more clubs increased stress levels, but their importance values were low. The directionality might be an unexpected product of interaction terms, reflecting the complexity of relationships between predictors. Possibly crop value is related to other economic factors such as debt. Debt might be so strong as to suppress the importance of crop sales. Maybe the number of clubs increases time away from the farm and elevates stress and does not act as a social support in farmers. The complex nature of these models makes understanding these findings difficult, although a great deal of work is currently being done to make these models more interpretable.
Aside from the strength of the importance of a high school education to protect against stress, the other demographic factors were not surprising and were commonly observed in previous studies. Females had higher stress levels and being married reduced stress. Adverse life events strongly increased stress levels. In contrast to previous studies, age and years in agriculture were not important in predicting stress levels. These are not characteristics that lend themselves to interventions and possibly are better accounted for by other risk and protective factors in the model. The neural network may be the better tool for identifying the underlying reasons that age and years in agriculture have been related to stress in previous studies, such as health measures and debt.
As is often the case when comparing regression models to neural networks, the neural network outperforms regression models [39,40] but not always [41]. Using a regularized regression model identified only seven of thirty-one covariates that significantly predicted stress level, however, the neural network identified different and a greater number predictors that were influencing stress. Since neural networks do not produce p values, it is the importance of the predictor in the model that provides additional information. Whether neural networks perform better than classical regression approaches may be a matter of how the variables interact with one another. Simply put, it may be a matter of how closely the process is best captured by a signal-processing model that reflects what happens in the brain. When environmental signals reach a threshold, the neuron is turned on, and the signaling pathway is activated. In the case of stressors, the result is the glucocorticoid cascade resulting in increased cortisol flooding the body. In the case of psychological traits such as stress, the allostatic load is best measured by high level interactions among a variety of inputs. In our model, two hidden nodes produced the lowest MSE, indicating that a model containing a third-degree polynomial adequately fit the data. This translates to a three-way interaction.
The ridge regression identified poorer self-perceived health status as increasing stress levels. In the neural network, self-perceived health status showed a weight near zero, indicating it was not contributing anything in explaining stress levels, however, many other health related predictors became highly influential. As we were able to reproduce these findings in the test data, this is a meaningful result and reveals possible targets of intervention in farm families.
It is interesting that an obvious difference in the CES-D items and the CES-D and neurological items combined is that being light-headed or dizzy and having headaches are not included in the CES-D symptoms, but each of these could easily be related to alcohol consumption. Half of the neurological symptoms were related to memory or concentration and could be strongly correlated with “having trouble keeping your mind on what you were doing” in the CES-D scale. Spearman’s correlation between the CES-D and neurological scale scores was 0.57 (p < 0.0001) so although statistically significant, they were only moderately correlated. Given the widespread use of the CES-D scale, if certain items in the scale form a stress subscale, it would be a readily available tool to measure stress. It might be that certain items in the CES-D scale capture stress and are also related to depression since these constructs overlap. Future work should compare the CES-D stress items with other validated stress scales in a general population sample. The CES-D stress items should also be compared with stress scales previously developed in farming samples to test their validity.
Designing interventions to address stress in farmers is challenging because so many of the important factors are a product of national and international economic policies. Commodity prices and weather are not amenable to intervention, but improving health care accessibility is. The results of this study provide greater detail and insight into the sources of stress in farm residents. As a first step, we need to improve access to health care in rural areas and prevent high pesticide exposure by continuing to provide safety training and promote the use of personal protective equipment. We should allow farmers to spend their time farming as their primary occupation without working off their farm. Keeping farmers healthy would reduce the overall burden of stressors they have been experiencing for decades and continue to experience. This study forms a foundation for future development of a farm-specific stress scale by identifying new risk factors and providing a better understanding of the importance of these factors in increasing stress levels and activating the stress response.
This study has several limitations. The data were collected in the 1990s and do not include extreme weather events, issues related to farm labor shortages, the future of the farm, changes in regulations, and low commodity prices resulting from trade policies, which are issues that have exacerbated the constant stress that farmers have been experiencing since the 1970s. Due to the lack of data, important stressors such as trade policies and extreme weather events were not included in this study, resulting in reduced generalizability to the current situation. However, these stressors have affected nearly all farmers equally in recent years. In addition, several conceptual models of stress include coping strategies and the only ones that were available in the data used were related to social support [42,43]. Future work should address stressors not included in this study and additional coping strategies in addition to the stressors identified in the present study. Additionally, more work is needed on using the subset of CES-D items as a measure of the stress response in other farm samples and in the general population.
5. Conclusions
Future studies on complex psychological constructs such as stress should utilize methods that mirror more closely how these cognitive processes produce a response. Neural networks often produce results that are more reproducible and identify risk factors not seen in classical regression models. In this study, the neural network highlighted the importance of health care access and availability and pesticide exposure. These factors should be included in future stress scales.
Author Contributions
C.B. conceptualized the idea for the study, devised the methodology, conducted formal analyses, and drafted the manuscript. L.S. was involved in securing funding for the initial study from which these data originated and assisted with writing, editing, and review of the manuscript. All authors have read and agreed to the published version of the manuscript.
Funding
This research was funded by the Centers for Disease Control and Prevention, the National Institutes of Occupational Safety and Health, grant number U04/CCU806060.
Conflicts of Interest
The authors declare no conflict of interest. The funders had no role in the design of the study; in the collection, analyses, or interpretation of data; in the writing of the manuscript, or in the decision to publish the results.
References
- Walker, L.S.; Walker, J.L. Stresses and occupational symptoms predictive of distress in farmers. Fam. Relat. 1987, 36, 374–378. [Google Scholar] [CrossRef]
- Linn, J.; Husaini, B. Determinants of psychological depression and coping behaviours of Tennessee farm residents. J. Commun. Psychol. 1987, 15, 503–513. [Google Scholar] [CrossRef]
- Booth, N.; Lloyd, K. Stress among farmers. Int. J. Soc. Psychiatry 1999, 46, 67–73. [Google Scholar] [CrossRef] [PubMed]
- Gregoire, A. The mental health of farmers. Occup. Med. 2002, 52, 471–476. [Google Scholar] [CrossRef] [PubMed] [Green Version]
- Thomas, H.V.; Lewis, G.; Thomas, D.R.; Salmon, R.L.; Chalmers, R.M.; Coleman, T.J.; Softley, P. Mental health of British farmers. Occup. Environ. Med. 2003, 60, 181–186. [Google Scholar] [CrossRef] [PubMed] [Green Version]
- Firth, H.M.; Williams, G.P.; Herbison, G.P.; McGee, R.O. Stress in New Zealand farmers. Stress Health 2007, 23, 51–58. [Google Scholar] [CrossRef]
- Kolstrup, C.L.; Kallioniemi, M.; Lundqvist, P.; Kymäläinen, H.-R.; Stallones, L.; Brumby, S. International perspectives on psychosocial working conditions, mental health, and stress of dairy farm operators. J. Agromed. 2013, 18, 244–255. [Google Scholar] [CrossRef] [Green Version]
- Walker, J.L.; Walker, L.S.; MacLennan, P.M. An informal look at farm stress. Psychol. Rep. 1986, 59, 427–430. [Google Scholar] [CrossRef]
- Bale, T.L. Sensitivity to stress: Dysregulation of CRF pathways and disease development. Horm. Behav. 2005, 48, 1–10. [Google Scholar] [CrossRef]
- Daviu, N.; Bruchas, M.R.; Moghaddam, B.; Sandi, C.; Beyeler, A. Neurobiological links between stress and anxiety. Neurobiol. Stress 2019, 11, 100191. [Google Scholar] [CrossRef]
- Kendler, K.S.; Karkowski, L.M.; Prescott, C.A. Stressful life events and major depression: Risk period, long-term contextual threat, and diagnostic specificity. J. Nerv. Ment. Dis. 1998, 186, 661–669. [Google Scholar] [CrossRef] [PubMed]
- Kendler, K.S.; Karkowski, L.M.; Prescott, C.A. Causal relationship between stressful life events and the onset of major depression. Am. J. Psychiatry 1999, 156, 837–841. [Google Scholar] [CrossRef] [PubMed]
- Kessler, R.C. The effects of stressful life events on depression. Annu. Rev. Psychol. 1997, 48, 191e214. [Google Scholar] [CrossRef] [PubMed]
- Yazd, S.D.; Wheeler, S.A.; Zuo, A. Key risk factors affecting farmers’ mental health: A systematic review. Int. J. Environ. Res. Public Health 2019, 16, 4849. [Google Scholar] [CrossRef] [PubMed] [Green Version]
- Derogatis, L.R.; Lipman, R.S.; Rickels, K.; Uhlenhuth, E.H.; Covi, L. The Hopkins symptom checklist (HSCL): A self-report symptom inventory. Behav. Sci. 1974, 19, 1–15. [Google Scholar] [CrossRef]
- Radloff, L.S. The CES-D scale: A self-report depression scale for research in the general population. Appl. Psychol. Meas. 1977, 1, 385–401. [Google Scholar] [CrossRef]
- Thu, K.; Lasley, P.; Whitten, P.; Lewis, M.; Donham, K.J.; Zwerling, C.; Scarth, R. Stress as a risk factor for agricultural injuries. J. Agromed. 1997, 4, 181–191. [Google Scholar] [CrossRef]
- Cohen, S.; Kamarck, T.; Mermelstein, R. A global measure of perceived stress. J. Health Soc. Behav. 1983, 24, 385–396. [Google Scholar] [CrossRef]
- Eberhardt, B.J.; Pooyan, A. Development of the Farm Stress Survey: Factorial structure, reliability, and validity. Educ. Psychol. Meas. 1990, 50, 393–402. [Google Scholar] [CrossRef]
- Dreary, I.J.; Willock, J.; McGregor, M. Stress in farming. Stress Med. 1997, 13, 131–136. [Google Scholar] [CrossRef]
- Stallones, L. Stress among farmers. J. Agric. Saf. Health 1990, 2, 5–6. [Google Scholar]
- Bhui, K.; Dinos, S.; Galant-Miecznikowska, M.; de Jongh, B.; Standfeld, S. Perceptions of work stress causes and effective interventions in employees working in public, private and non-governmental organisations: A qualitative study. BJPsych Bull. 2016, 40, 318–325. [Google Scholar] [CrossRef] [PubMed] [Green Version]
- Hanisch, S.; Twomey, C.; Szeto, A.; Birner, U.; Nowak, D.; Sabariego, C. The effectiveness of interventions targeting stigma of mental illness at the workplace: A systematic review. BMC Psychiatry 2016, 16, 1. [Google Scholar] [CrossRef] [PubMed] [Green Version]
- Freeman, S.; Schwab, C.; Jiang, Q. Quantifying stressors among Iowa farmers. J. Agric. Saf. Health 2008, 14, 431–439. [Google Scholar] [CrossRef]
- McShane, C.J.; Quirk, F.; Swinbourne, A. Development and validation of a work stressor scale for Australian farming families. Aust. J. Rural Health 2016, 24, 238–245. [Google Scholar] [CrossRef]
- Welke, C.K. Farmers/Ranchers: Stressors, Help-Seeking, and Job Satisfaction. Master’s Thesis, University of South Dakota, Vermillion, SD, USA, 2002. [Google Scholar]
- Kearney, G.D.; Rafferty, A.P.; Hendricks, L.R.; Allen, D.L.; Tutor-Marcom, R. A Cross-Sectional Study of Stressors among Farmers in Eastern North Carolina. N. C. Med. J. 2014, 75, 384–392. [Google Scholar] [CrossRef] [Green Version]
- Graham, M. Confronting multicollinearity in ecological multiple regression. Ecology 2003, 84, 2809–2815. [Google Scholar] [CrossRef] [Green Version]
- Intrator, O.; Intrator, N. Using neural nets for interpretation of nonlinear models. In Proceedings of the Statistical Computing Section, San Francisco, CA, USA, 8–12 August 1993; American Statistical Society: Alexandria, VA, USA, 1993; pp. 244–249. [Google Scholar]
- Hastie, T.; Tibshirani, R.; Friedman, J. The Elements of Statistical Learning. Data Mining, Inference, and Prediction, 2nd ed.; Springer Series in Statistics; Springer: Stanford, CA, USA, 2008; pp. 389–400. [Google Scholar]
- Hinton, G.E.; Osindero, S.; Teh, Y.W. A fast learning algorithm for deep belief nets. Neural Comput. 2006, 18, 1527–1554. [Google Scholar] [CrossRef]
- White, H. Learning in artificial neural networks. A statistical perspective. Neural Comput. 1989, 1, 425–464. [Google Scholar] [CrossRef]
- Zou, H.; Hastie, T. Regularization and variable selection via the elastic net. J. R. Stat. Soc. 2005, 67, 301–320. [Google Scholar] [CrossRef] [Green Version]
- Bare, B.B.; Hann, D.W. Applications of ridge regression in forestry. For. Sci. 1981, 27, 339–348. [Google Scholar]
- Cule, E.; De Iorio, M. Ridge regression in predictor problems: Automatic choice of the ridge parameter. Genet. Epidemiol. 2013, 37, 704–714. [Google Scholar] [CrossRef] [PubMed] [Green Version]
- Bishop, C.M. Neural Networks for Pattern Recognition; Clarendon Press: Oxford, UK, 1995. [Google Scholar]
- Olden, J.D.; Joy, M.K.; Death, R.G. An accurate comparison of methods for quantifying variable importance in artificial neural networks using simulated data. Ecol. Model. 2004, 178, 389–397. [Google Scholar] [CrossRef]
- Gunther, F.; Fritsch, S. neuralnet: Training of neural networks. R. J. 2010, 2, 30–38. [Google Scholar] [CrossRef] [Green Version]
- Marshall, D.B.; English, D.J. Neural network modeling of risk assessment in Child Protective Services. Psychol. Methods 2000, 5, 102–124. [Google Scholar] [CrossRef] [PubMed]
- Rodríguez-Entrena, M.; Salazar-Ordóñezb, M.; Becerra-Alonso, D. An assessment of the barriers to the consumers’ uptake of genetically modified foods: A neural network analysis. J. Sci. Food Agric. 2016, 96, 1548–1555. [Google Scholar] [CrossRef]
- Lee, K.-S.; Ahn, K.H. Artificial neural network analysis of spontaneous preterm labor and birth and its major determinants. J. Korean Med. Sci. 2019, 34, e128. [Google Scholar] [CrossRef]
- Hovey, J.D.; Seligman, L.D. The Mental Health of Agricultural Workers. In Agricultural Medicine; Lessenger, J.E., Ed.; Springer: New York, NY, USA, 2006; Chapter 22; pp. 282–299. [Google Scholar]
- Ang, H.; Lamm, F.; Tipples, R. The impact of stressors on psychological wellbeing of New Zealand farmers and the development of an explanatory conceptual model. Policy Pract. Health Saf. 2008, 6, 79–96. [Google Scholar]
Figure 1.
Relative importance of individual risk factors and covariates on increased stress in 1131 farm residents in Colorado from a neural network analysis, 1992–1997.
Figure 1.
Relative importance of individual risk factors and covariates on increased stress in 1131 farm residents in Colorado from a neural network analysis, 1992–1997.

Table 1.
Demographics and farm characteristics from a random sample of 1131 Colorado farm residents used in training a neural network *.
Table 1.
Demographics and farm characteristics from a random sample of 1131 Colorado farm residents used in training a neural network *.
| Demographic, Farm, and Personal Characteristic of Farm Resident | Frequency (%) |
|---|---|
| Demographic characteristics | |
| Gender of respondent | |
| Male | 646 (57.1) |
| Female | 485 (42.9) |
| Marital status | |
| Married | 1046 (92.5) |
| Not married (divorced, widowed, separated, never married) | 85 (7.5) |
| Education | |
| High school graduate | 811 (71.7) |
| Less than high school | 320 (28.3) |
| Smoking status | |
| Never or past smoker | 993 (87.8) |
| Current smoker | 138 (12.2) |
| Has your income decreased substantially (enough to be noticed)? | |
| No | 871 (77.0) |
| Yes | 260 (23.0) |
| Have you gone deeply into debt? | |
| No | 982 (86.8) |
| Yes | 149 (13.2) |
| Farm and farm work characteristics | |
| Sales value of all farm products in the past 12 months (commodity prices) | |
| 0–$39,000 | 445 (39.3) |
| $40,000–$99,000 | 426 (37.7) |
| $100,000 or more | 260 (23.0) |
| Farming is primary occupation (> 50% of time spent in farming or management) | |
| Yes | 608 (53.8) |
| No | 523 (46.2) |
| Worked on someone else’s farm or ranch in past year | |
| No | 900 (79.6) |
| Yes | 231 (20.4) |
| Work-related injury in the past 12 months | |
| No | 1030 (91.1) |
| Yes | 101 (8.9) |
| Have you ever become ill from any exposure to pesticides? | |
| No | 1041 (92.0) |
| Yes | 90 (8.0) |
| Physical and mental health-related characteristics | |
| Within the past six months, how many times have you visited a doctor? | |
| None | 467 (41.3) |
| 1–2 times | 438 (38.7) |
| 3–4 times | 115 (10.2) |
| 5 or more times | 111 (9.8) |
| How many prescription medicines are you now taking? | |
| None | 681 (60.2) |
| 1–2 medicines | 341 (30.2) |
| 3–4 medicines | 87 (7.7) |
| 5 or more medicines | 22 (1.9) |
| Has a doctor ever told you that you had any chronic disease (heart disease, bronchitis, emphysema, stroke, diabetes, cirrhosis multiple sclerosis, Parkinson’s disease, or cancer)? | |
| No | 960 (84.9) |
| Yes | 171 (15.1) |
| During the past 12 months have you had to cut down or stop activity because of ill health? | |
| No | 989 (87.4) |
| Yes | 142 (12.6) |
| Within the past 12 months have you been hospitalized? | |
| No | 1019 (90.1) |
| Yes | 112 (9.9) |
| Is there a particular clinic, health center, doctor’ office, or some other place that you usually go if you are sick or need advice about your health? | |
| Yes | 1029 (91.0) |
| No | 102 (9.0) |
| Do you have any kind of health care plan? | |
| Yes | 1047 (92.6) |
| No | 84 (7.4) |
| Was there a time during the last 12 months when you needed to see a doctor, but could not due to the cost? | |
| No | 1075 (95.0) |
| Yes | 56 (5.0) |
| Continuous characteristics | Mean (SD) |
| Number of clubs involved in | 1.96 (1.92) |
| Number of drinks of alcohol when drinking | 1.05 (1.90) |
| Number of families residing on the farm | 1.26 (2.06) |
* Order of categorical responses reflects order of coding used in the neural network model.
Table 2.
Weights and relative importance of 23 predictors from a trained and pruned neural network model with a single hidden layer and two hidden units in 1131 farm residents in Colorado, 1992–1997.
Table 2.
Weights and relative importance of 23 predictors from a trained and pruned neural network model with a single hidden layer and two hidden units in 1131 farm residents in Colorado, 1992–1997.
| Demographic, Farm, and Personal Characteristics of Farm Resident | Weights Unit 1 | Weights Unit 2 | Relative Importance |
|---|---|---|---|
| Demographic and personal characteristics | |||
| Gender of respondent | −90.4 | −147 | 150 |
| Marital status | −212 | −357 | 284 |
| High school education | 115 | 273 | 525 |
| Current smoker | −39.9 | −58.1 | −183 |
| Number of alcoholic drinks when drinking | 5.49 | 13.6 | 24.8 |
| Adverse life events | 144 | 293 | 375 |
| Decrease in income | −72.3 | −152 | 50.6 |
| Gone deeply into debt | 138 | 304 | 922 |
| Number of clubs involved in | −25.9 | −53.5 | 26.7 |
| Farm and farm work characteristics | |||
| Number of families on the farm | −18.0 | −36.5 | −61.1 |
| Sales value of all farm products | −17.4 | −42.1 | 34.8 |
| Farm is primary occupation | 35.4 | 60.4 | 217 |
| Worked on someone else’s farm or ranch | −93.2 | −199 | −361 |
| Work-related injury in the past 12 months | −77.2 | −157 | 59.5 |
| Pesticide-related illness | −140 | −227 | 626 |
| Physical and mental health-related characteristics | |||
| Number of visits to a doctor | 13.9 | 30.4 | 48.9 |
| Number of prescription medicines | 71.8 | 138 | 158 |
| Any chronic disease | 112 | 192 | 714 |
| Cut down or stopped activity because of ill health | −59.6 | −18.1 | 722 |
| Hospitalization | −242 | −473 | 47.7 |
| Usual source for medical care | 194 | 362 | 401 |
| Have health insurance | 85.3 | 187 | 216 |
| Needed to see a doctor, but could not due to the cost | −164 | −146 | 869 |
| Weight from hidden layer to stress variable | −11.3 | 11.6 | NA |
© 2020 by the authors. Licensee MDPI, Basel, Switzerland. This article is an open access article distributed under the terms and conditions of the Creative Commons Attribution (CC BY) license (http://creativecommons.org/licenses/by/4.0/).
Share and Cite
MDPI and ACS Style
Beseler, C.; Stallones, L. Using a Neural Network Analysis to Assess Stressors in the Farming Community. Safety 2020, 6, 21. https://0-doi-org.brum.beds.ac.uk/10.3390/safety6020021
AMA Style
Beseler C, Stallones L. Using a Neural Network Analysis to Assess Stressors in the Farming Community. Safety. 2020; 6(2):21. https://0-doi-org.brum.beds.ac.uk/10.3390/safety6020021
Chicago/Turabian StyleBeseler, Cheryl, and Lorann Stallones. 2020. "Using a Neural Network Analysis to Assess Stressors in the Farming Community" Safety 6, no. 2: 21. https://0-doi-org.brum.beds.ac.uk/10.3390/safety6020021
Note that from the first issue of 2016, this journal uses article numbers instead of page numbers. See further details here.