Fault-Event Trees Based Probabilistic Safety Analysis of a Boiling Water Nuclear Reactor’s Core Meltdown and Minor Damage Frequencies

1
Department of Electrical and Electronic Engineering, Imperial College London, London SW7 2AZ, UK
2
Centre for Electronics Frontiers, University of Southampton, Southampton SO17 1BJ, UK
Safety 2020, 6(2), 28; https://0-doi-org.brum.beds.ac.uk/10.3390/safety6020028
Submission received: 26 April 2020
/
Revised: 8 June 2020
/
Accepted: 15 June 2020
/
Published: 17 June 2020
Abstract
:A systematic probabilistic safety assessment for a boiling water nuclear reactor core is performed using fault trees and event trees analysis models. Based on a survey of the BWR’s safety systems against potential hazards, eight independent failure modes (initiating events) triggered scenarios are modelled and evaluated in the assembled fault-event trees, obtaining the two key outcome probabilities of interest, i.e., complete core meltdown (CCMD) frequency and minor core damage (MCD) frequency. The analysis results indicate that the complete loss of heat sink accounts for the initiating accident most vulnerable to CCMD (with a frequency of 1.8 × per year), while the large break in the reactor pressure vessel is the least susceptible one (with a frequency of 2.9 × per year). The quantitative risk assessment and independent review conducted in this case study contributed a reference reliability model for defense-in-depth core optimizations with reduced costs, informing risk-based policy decision making, licensing, and public understanding in nuclear safety systems.
1. Introduction
The merits of nuclear energy have been re-discovered over recent years to address the future global energy needs [1] in an environmentally conscious and resource-sustainable way [2]. Since the nuclear renaissance [3] and the subsequent increase in nuclear newbuild projects [4] globally, new needs for safety assessment [5,6] of the complex nuclear power system has arisen. Securing a very high level of design and operating safety with reduced costs will not only be technically required for the burgeoning nuclear sector, but also from the policy [7] point of view to approach the challenge in addressing the public’s negative perception [8] on nuclear power in the post-Fukushima era [9]. Since introducing revolutionary reactor technologies takes a long time, traditional light water reactors (LWR) will inevitably remain the dominant technology for many decades in the foreseeable future. Therefore, improving the safety margin and cost-efficiency of reactors in the existing fleet, such as pressurized water reactors (PWR) and boiling water reactors (BWR), exhibits the highest priority.
To this end, probabilistic safety assessment (PSA) [10,11] based on fault tree [12,13] and event tree [14] analyses present these characteristics and can be designed to tailor for the overall risk assessment of PWRs and BWRs. Historically developed for nuclear [15] and petrochemical [16] industries, fault tree and event tree methodologies have evolved and been well established in theory both deterministically [17], and stochastically [18]. However, relatively fewer applied studies or papers are reported concerning specifically the BWR core meltdown [19] and minor core damage [20] estimations in detail. Therefore, developing a reference model in this work and conducting an independent review is momentous in the fields of reliability assessment, safety forecasting, core optimization and thus helps inform safety-based policy decision making. It is of importance to give to the nuclear regulatory body and the academic community an independent verification of the core meltdown and the minor core damage frequency calculations (a case study for the BWR in this work), as an independent study; if available, multi-benchmarking creates trust in safety reports.
The risk-based approach applied in this work follows three steps. Firstly, defining all potential hazards and threats (initiating events) based on a survey of a standard BWR system architecture. Secondly, identifying risk control options (intermediate events) that can be established to control each risk element. Specifically, the empirical occurrence frequency of the initiating failure event and the corresponding unavailability frequency of each risk control option is specified. The final and key task is undertaking a failure mode and effect analysis (FMEA) incorporating the accident sequences using event trees and fault trees. Based on the premise that the probability of failure is dominated by the probability of the protection system to initiate on demand, the frequency of complete core meltdown (CCMD) and minor core damage (MCD) due to different plant faults are quantitatively evaluated. The modelling and analysis in this study provide a physical insight into the complex nuclear system, based on which risks and mitigation priorities are proposed, targeting cost effectiveness. The case study presented in this work can advantageously be used for training purposes. The potential beneficiaries are nuclear power plant operators, risk assessors, regulators, government energy policymakers, electricity suppliers and the wider academic community.
2. Materials and Methods
A combination of fault tree and event tree methods are applied in this study for calculating the BWR’s core meltdown and minor core damage frequencies. The fault tree approach [10,13] is deductive in nature. This top-down approach assumes that the system has failed in a certain way (e.g., a complete loss of heat sink as reported in Section 3.3), in an attempt to investigate the modes of the components’ behavior (lower-level independent events) leading up to this failure (top event). Boolean logic gates (e.g., OR gates, or AND gates) are used to graphically characterize the logical interrelationships between these events, with the lower-level events serving as the gate’s input, and the higher-level event as the gate’s output. In this way, the probability of a specific system failure (top event) is a function of the reliability of the lower-level basic events.
The event tree analysis [10,14] is an inductive approach that postulates an initiating event (e.g., the rupture of core shroud as detailed in Section 3.7), with a forward logic process in an attempt to derive the corresponding impact on the overall system (e.g., the core meltdown and the minor core damage that are of interest in this work). A series of independent intermediate events (e.g., the availability of the risk control options in this work) are split into binary (success or failure) trees, laying a path for evaluating the probabilities of the outcomes.
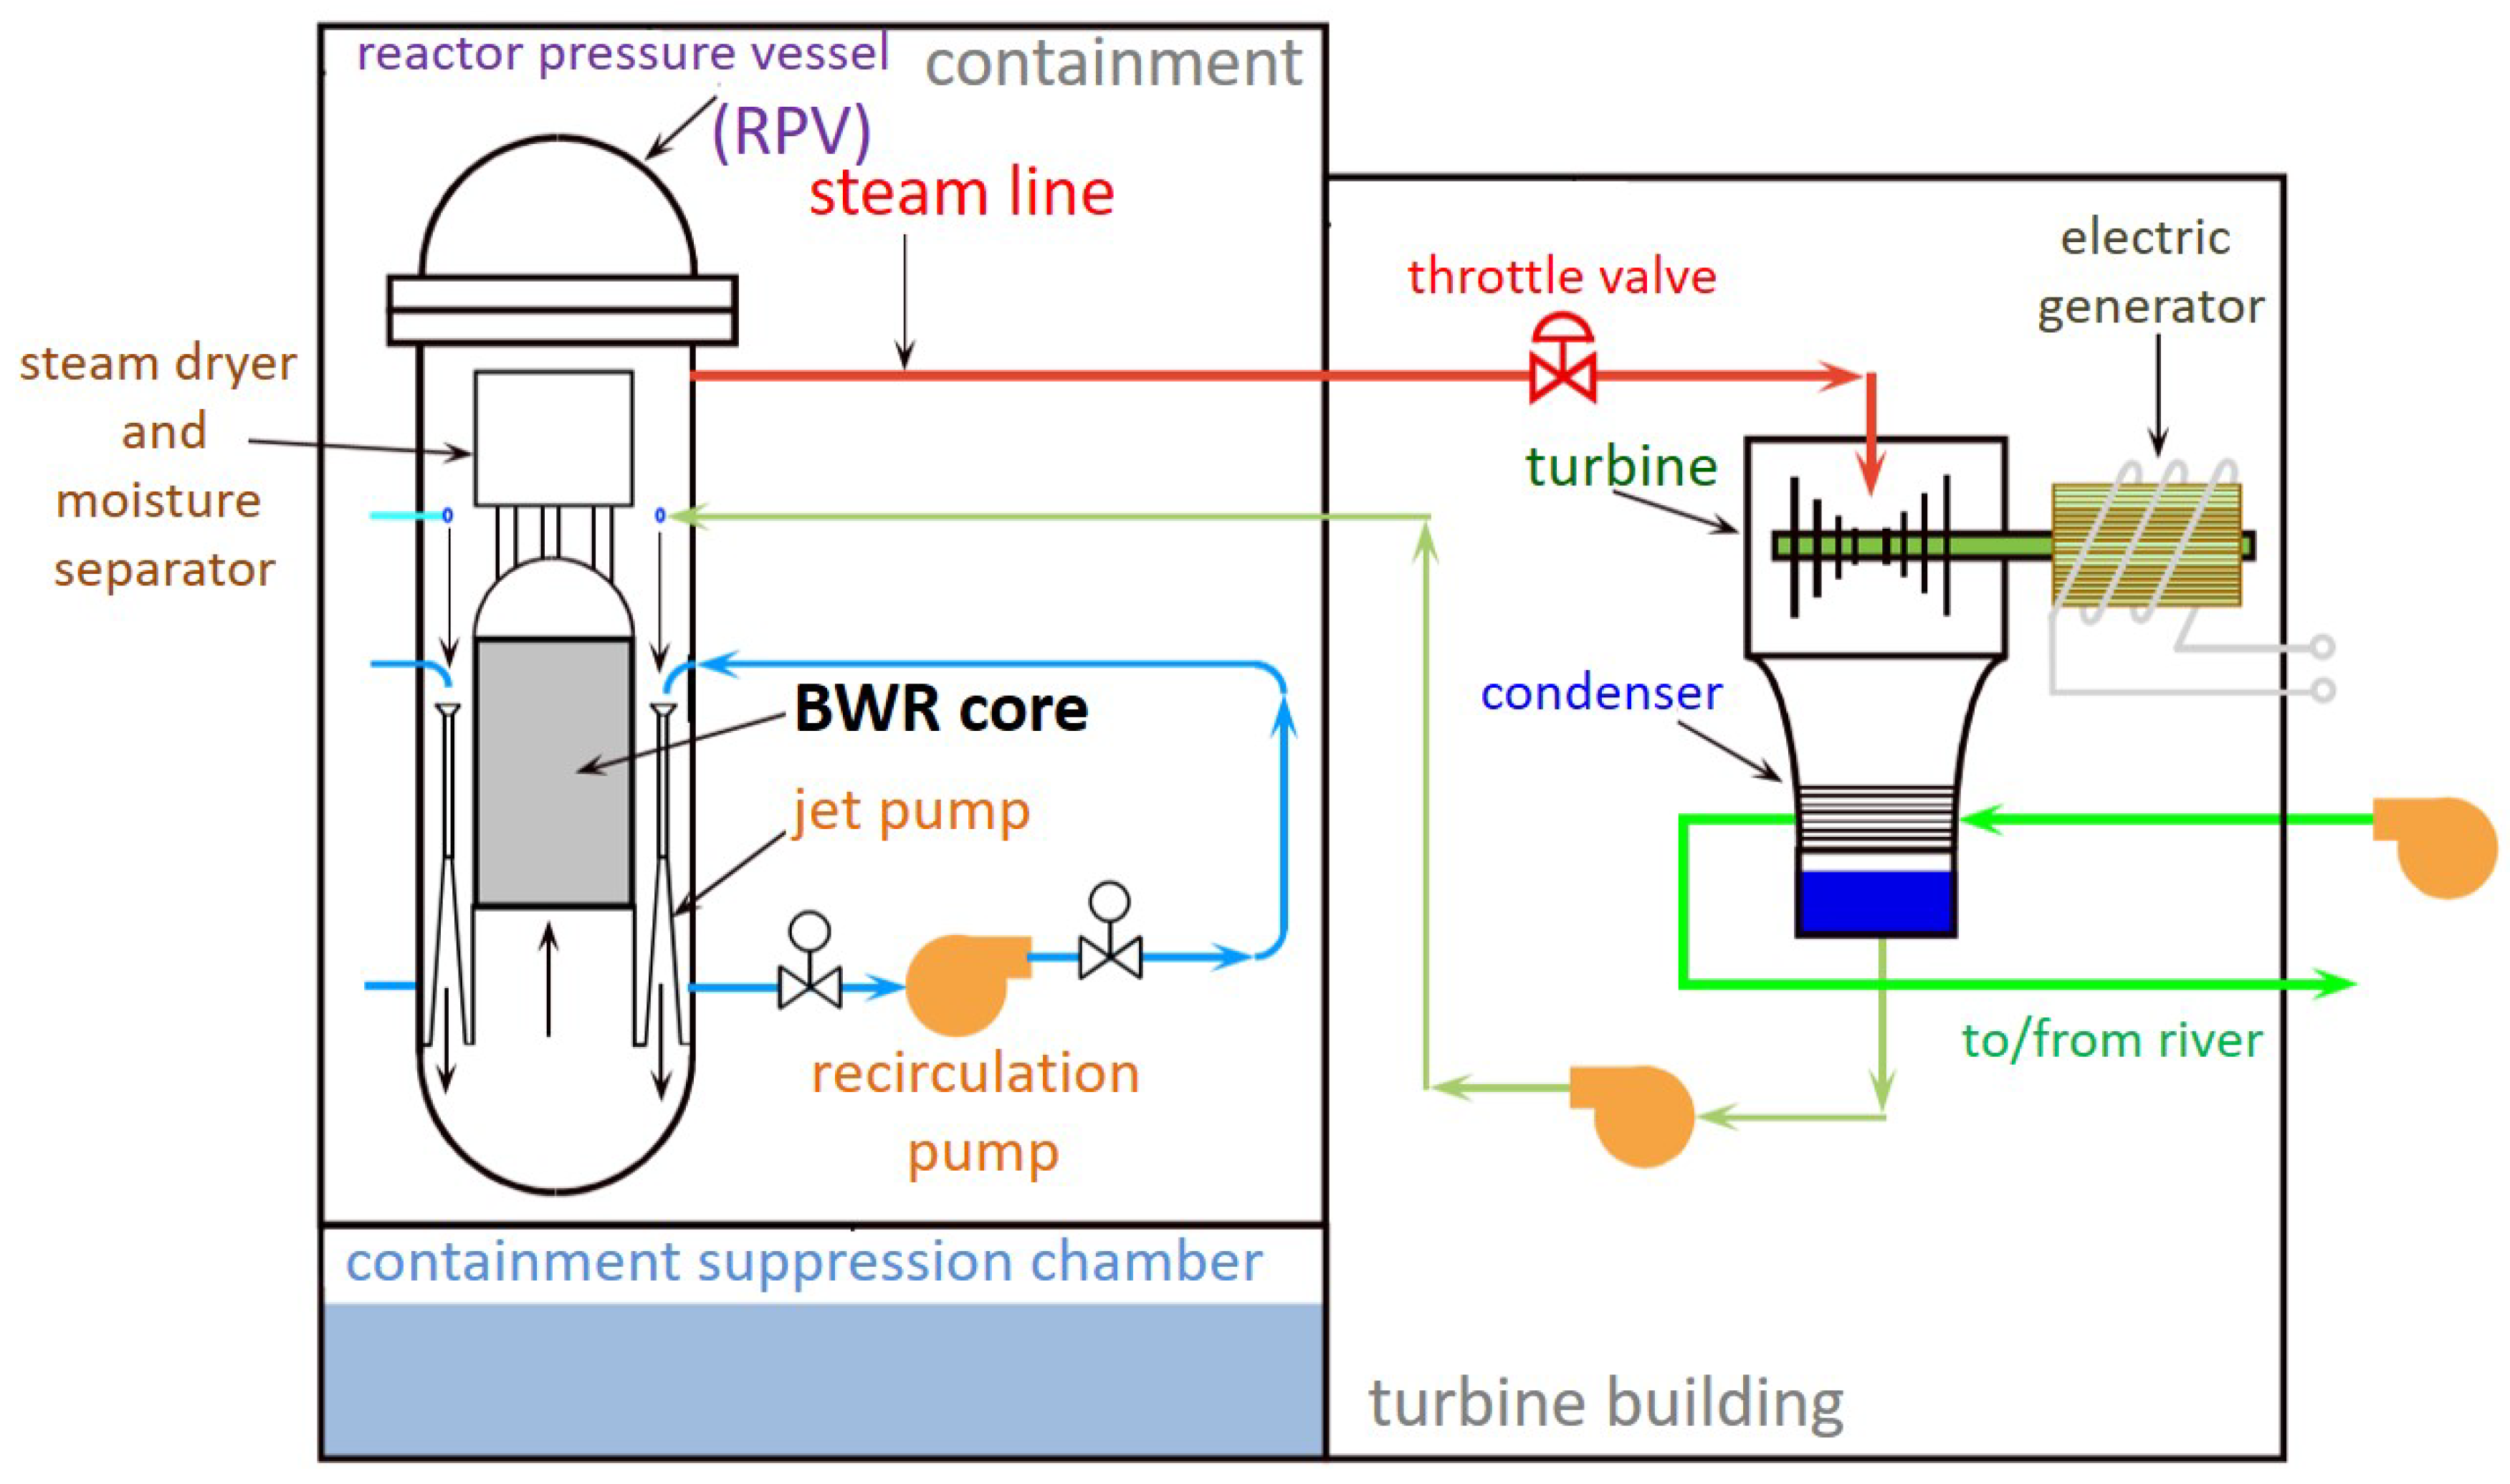
To identify the initiating events and the intermediate events progression for different failure modes, a survey of the BWR’s system architecture and the corresponding risk control measures are conducted as follows (Section 2.1 and Section 2.2). First, a current generation of BWR [21] plants are sketched in Figure 1, with a steam/water mixture developed within the reactor core. Unlike PWR plants, the plant operating pressure is considerably less, and hence significant amounts of boiling occur. The steam/water blend departs from the top of the core and enters the separator/drier district, where steam is isolated from water and is guided along the steam line to the main turbine which drives the electrical generator to supply the grid. In contrast with PWR, the BWR plant is free of a pressurizer and a steam generator, in this way it incorporates less pipework that could potentially rupture, with a consequence of a loss of coolant accident (LOCA) [22]. After leaving the primary turbine, the low-pressure steam streams into the condenser where it is condensed into water, and after that pumped by means of feed-water pumps back to the reactor pressure vessel (RPV). Note that the coolant flows through the core and hence the reactor power could be controlled via the recirculation and jet pumps as denoted in Figure 1 for varying the flow rate in the down-comer (i.e., the region between the core shroud and the RPV).
2.1. Survey of Safety Systems for Potential Hazards in BWR
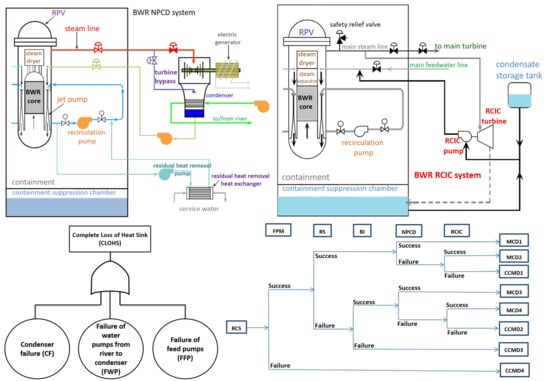
Both the control rod drive mechanisms [23] and the reactor scram (RS) system [24] are inserted from the bottom of the core. The RS system is initiated on trip signals from high power, high pressure, or low water levels. Should the RS fail then an independent boron injection (BI) system [25] is available to shut the plant down. The plant features a fission product monitor (FPM) [26] which cautions the operator in case minor core damage (MCD) has happened. Once the FPM initiates, the operator must shut the plant down, after which the core will proceed to generate decay heat, which is removed through turbine bypassing and steam dumping directly to the condenser, as illustrated in Figure 2 below for the normal plant cool-down (NPCD) system [21] depicted based on Figure 1. The plant has two loops and every loop can be utilized to cool the plant down for decay heat elimination. Should the normal method of plant cool-down (i.e., the NPCD system) fail, a standby reactor core isolation cooling (RCIC) system [27] kicks in with makeup water supplied from either the containment suppression chamber or the condensate storage tank for cooling the plant down, as illustrated in Figure 3.
Although the frequency of LOCA will be less for a BWR plant than that in a PWR plant, the BWR plant still has an emergency core cooling system (ECCS), which encompasses two high-pressure systems, i.e., a high-pressure coolant injection (HPCI) system and an automatic depressurization system (ADS) [28], as well as two low-pressure systems, i.e., low-pressure coolant injection (LPCI) and the core spray (CS) system [29], as depicted in Figure 4 and Figure 5 below for illustrations of the redundant logic.
2.2. Failure Mode Identification and BWR’s Risks Control Options
The principle plant faults that can potentially cause an accident are identified and summarized in Table 1. For each fault, its frequency per year is based on the empirical datasets [30,31] reported in 216 nuclear accidents and incidents (of various reactor types at the 95% confidence level). The event and fault trees concerning the initial plant response and the protection system that are potentially available will be detailed later in the next section. An assessment of the final state of the core if all protections fail or are unavailable is summarized in the “outcome without protections” column of Table 1, i.e., minor core damage (MCD), complete core meltdown (CCMD), or a combination of MCD and CCMD. If the plant is scrammed, the cooling system is required for one month [32] to cool the plant down, after which it could be assumed that the decay heat declines to a level that is insignificant to damage the core. We assume for this study that the probability of failure is dominated by the probability of the system to initiate on demand (although the exact unavailability rates of some components might be available in plant-specific PSA studies). The probability of failure on demand for each of the protection systems is identified in the following Table 2.
3. Fault-Event Trees Modelling and Results
Based on the initiating accidents and the mechanism of safety protection systems, as well as their corresponding failure rates as specified in Table 1 and Table 2, the total core meltdown and minor core damage frequencies are calculated systematically using fault tree and event tree methods. According to the survey (Section 2) of the safety systems for potential hazards in BWR as well as the fault-initiating events identified in Table 1, the reliability problem of the complex overall systems can mainly be decomposed into eight independent initial accident-triggered scenarios (that could lead to the outcome of either complete core meltdown or minor core damage to our knowledge), which are modelled, assembled, and evaluated as follows. Note that several uncertain external environments (detailed in the results discussion part in Section 4) are not evaluated in this study.
3.1. Continuous Rod Withdrawal Accident (CRWA)
The continuous rod withdrawal accident (CRWA) model assumes that if the accident occurs, the rise in the reactor power, temperature and pressure will cause the reactor scram (RS) to initiate using safety rods. Providing the scram system fails, the boron injection (BI) will subsequently kick in. Following the shutdown, the normal plant cool-down system (NPCD) from either side should initiate to remove the decay heat. In the case of both sides’ failure, the reactor core isolation cooling system (RCIC) should initiate to cool the plant down. Accordingly, the CRWA-triggered event tree is derived in Figure 6 below, presenting three failure-propagating scenarios that can result in the outcome of complete core meltdown (CCMD), denoted as CCMD 1, CCMD 2 and CCMD 3.
To quantitatively derive the probability (frequency per year) of the CRWA-induced complete core meltdown, i.e., P (CCMD by CRWA), we denote the occurrence probability of the initial event CRWA as P (CRWA), and the failure probability on demand of each intermediate event as F (RS), F (BI), F (NBCD) and F (RCIC). Therefore, P (CCMD 1), P (CCMD 2), P (CCMD 3) and the total P (CCMD by CRWA) of interest are calculated via Equations (1)–(4), respectively:
3.2. Main Turbine Failure (TF)
The main turbine failure (TF) model assumes that if an accident occurs, the temperature and pressure rise will cause the reactor scram (RS) to initiate using safety rods. If the scram system fails, the boron injection (BI) will subsequently kick in. Following the shutdown, the normal plant cool-down system (NPCD) from either side should initiate to remove the decay heat. In the case of both sides’ failure, the reactor core isolation cooling system (RCIC) should initiate to cool the plant down. The graphical representation is reported in Figure 7.
Following a similar calculation mechanism as the last subsection, the probability of the TF-induced complete core meltdown (CCMD) is given step by step through Equations (5)–(8), i.e.,
3.3. Complete Loss of Heat Sink (CLOHS)
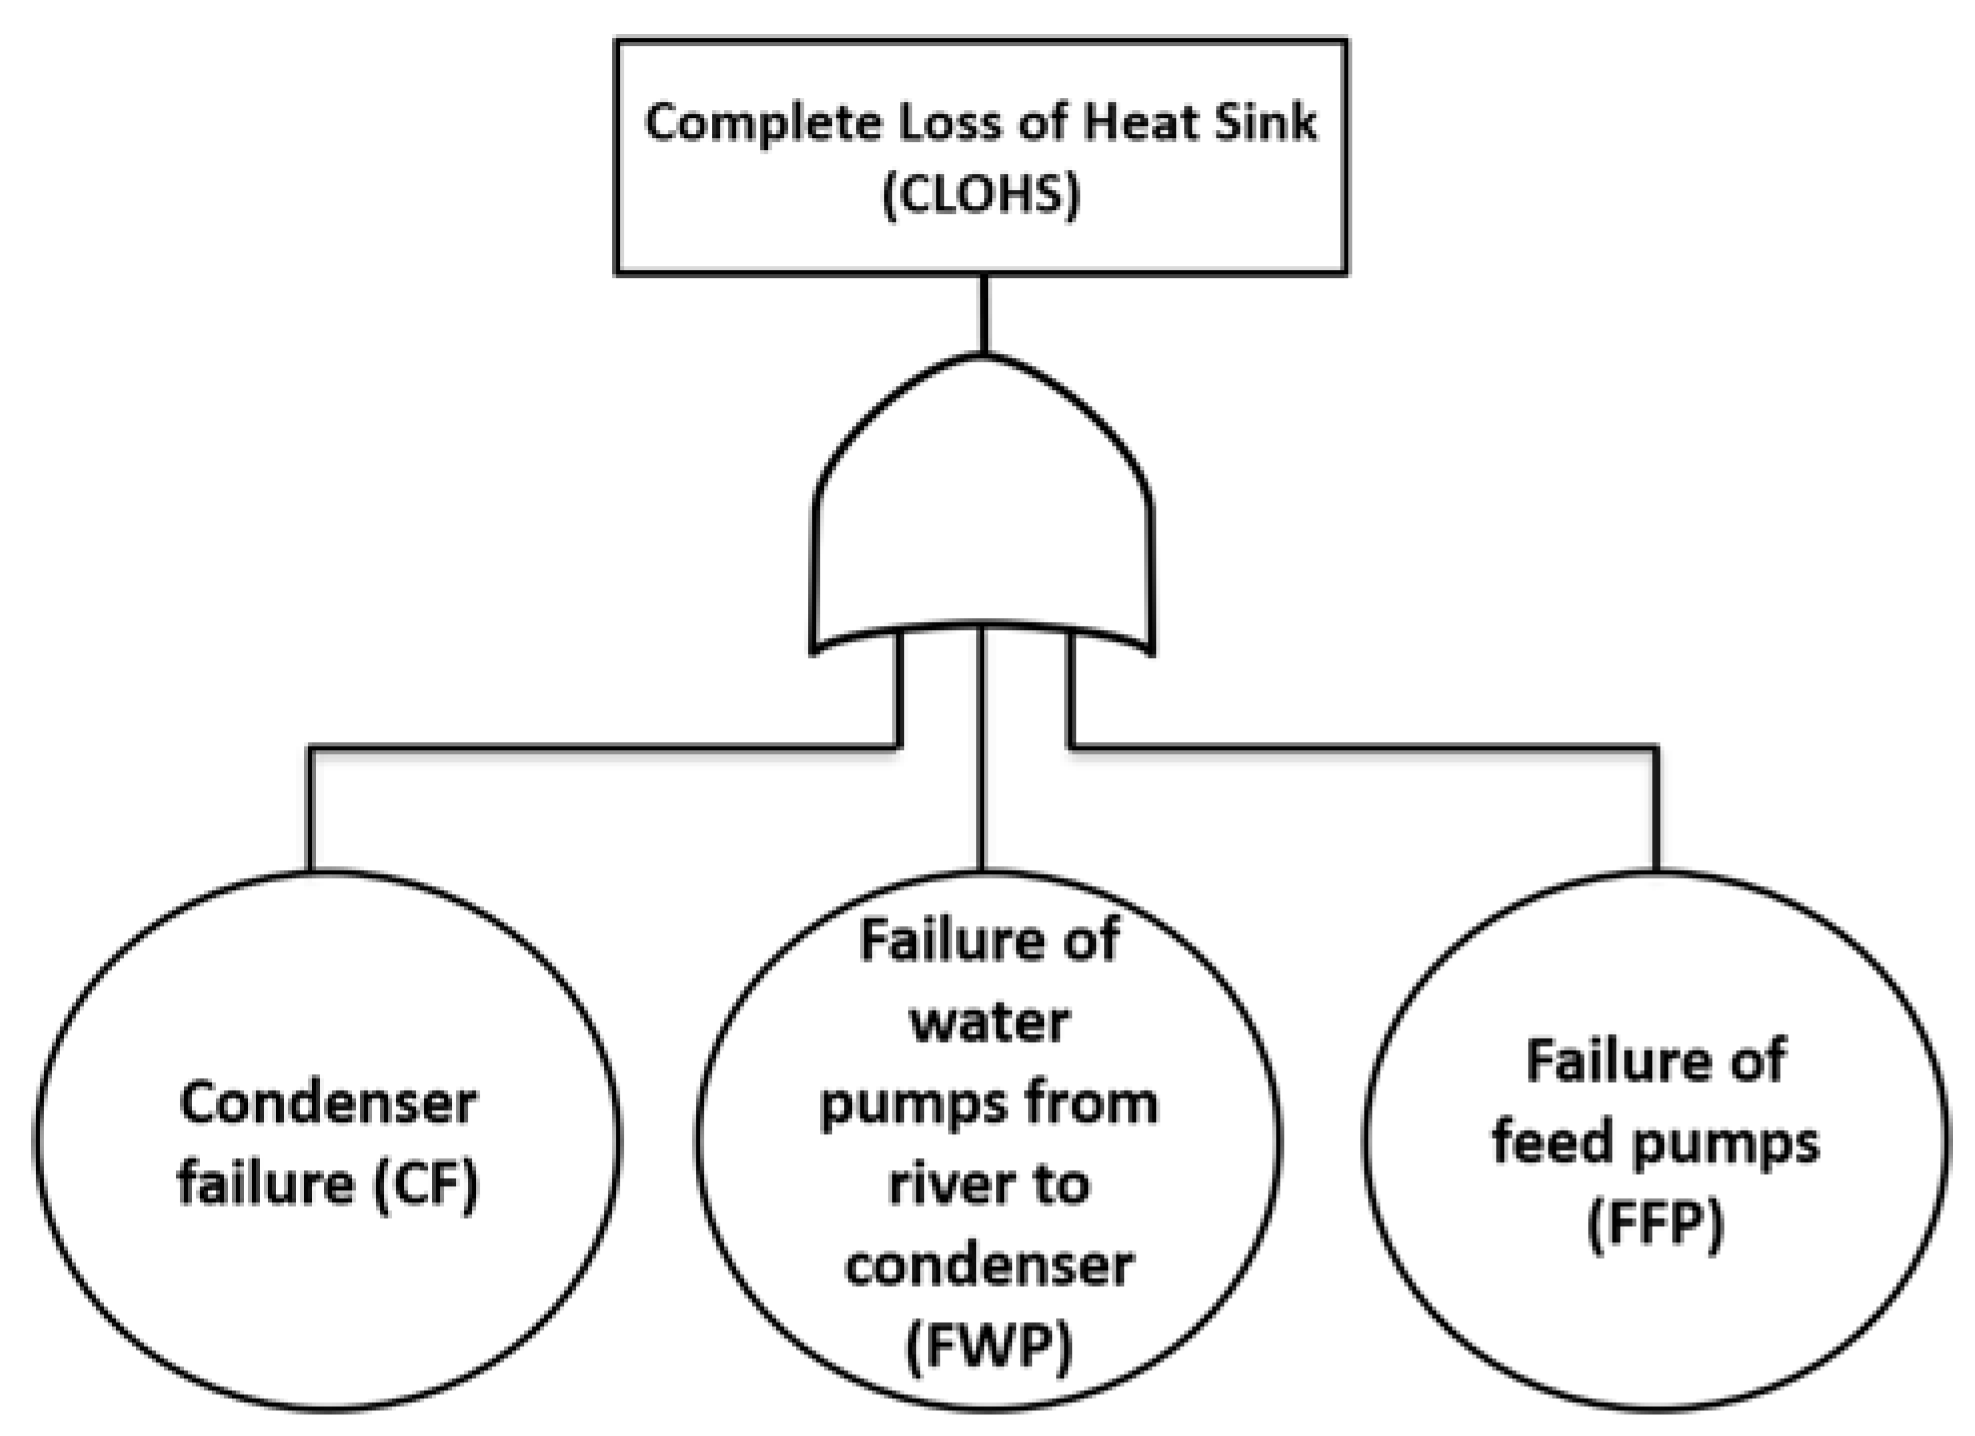
Note that any one of the following independent lower-level basic events will lead to the top event of a complete loss of heat sink (CLOHS) accident [36].
- Condenser failure (CF) on both sides
- Failure of both water pumps (FWP) from the river to condensers
- Failure of both feed pumps (FFP)
- The fault tree is developed accordingly using a logic OR Boolean gate shown in Figure 8 below.
According to the Boolean algebras [12] regarding the union of independent events, the fault tree shown in Figure 8 above can be translated to an equivalent Boolean equation. From the occurrence probability of the top event, CLOHS is thereby given by Equation (9) below based on the three independent basic events (CF, FWP, FFP), i.e.,
P (CLOHS) = P (CF) + P (FWP) + P (FFP).
Incorporating the probability of failure for the initiating events (CF, FWP, FFP) as specified in Table 1, we obtain P (CLOHS) = 3 × . Subsequently, the CLOHS event-tree model is developed assuming that if the accident occurs, the temperature and pressure rise will cause the reactor scram (RS) to initiate using safety rods. If the scram system fails, boron injection (BI) will subsequently kick in. Following the shutdown, the reactor core isolation cooling system (RCIC) should initiate to cool the plant down. The event tree is presented in Figure 9 below.
The probability of the CLOHS-induced complete core meltdown (CCMD) is thereby derived by Equations (10)–(13), i.e.,
Incorporating the probability of failure for the initiating event (CLOHS) as derived in Equation (9), and the failure probabilities on demand of the risk control options listed in Table 2 with Equations (10)–(13), we obtain the predicted result of P (CCMD by CLOHS) = 1.80002982 × .
3.4. Large Break in RPV (LBRPV)
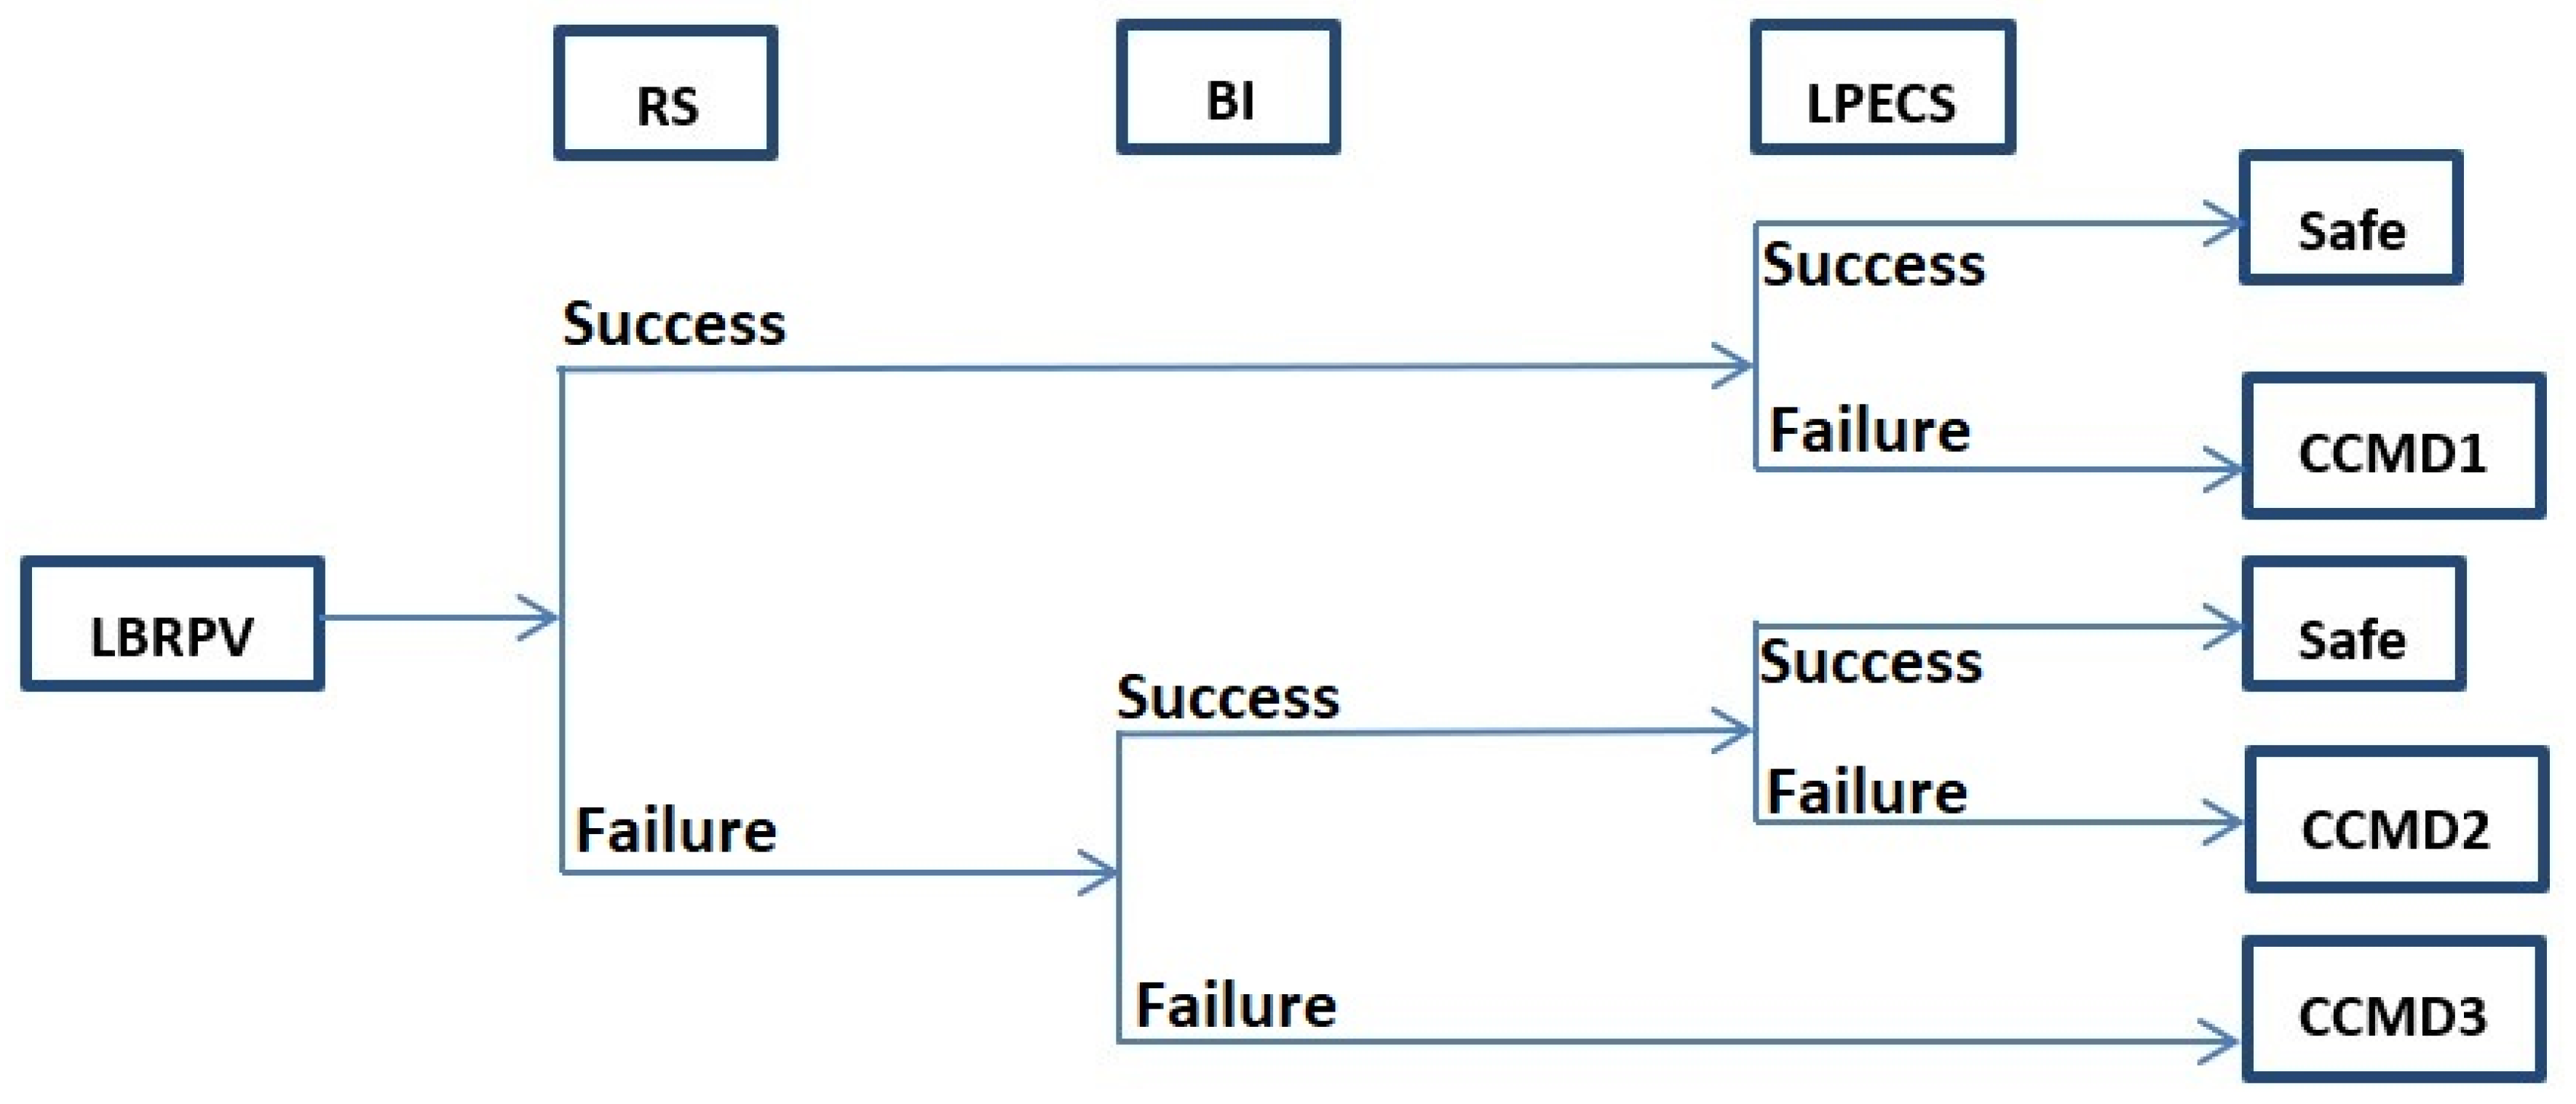
In a large break in RPV (LBRPV), pressure in the primary plant falls quickly, and the reactor shut down occurs. The high-pressure coolant injection (HPCI) system is not designed to provide protection. Instead, the low-pressure coolant injection (LPCI) system, or the core spray (CS) system, is available to provide protection. Thereby, the event-tree model assumes that if the accident occurs, the reactor scram (RS) initiates using safety rods to shut down the plant. If the scram system fails, the boron injection (BI) will subsequently kick in. Following the shutdown, the low-pressure emergency cooling system (LPECS) will initiate, including the low-pressure coolant injection (LPCI) or the core spray (CS) system. The failure frequency on demand of LPECS is calculated based on if LPCI and CS both fail at the same time, i.e., a fault tree with a logic AND Boolean gate is applied and shown in Figure 10 as governed by Equation (14) for the two independent events (LPCI, CS). The propagation of failure rates is presented in Figure 11 below.
F (LPECS) = F (LPCI) × F (CS).
The frequency of the LBRPV-triggered complete core meltdown (CCMD) is given by Equations (15)–(18), i.e.,
Incorporating the probability of failure for the initiating event (LBRPV) as specified in Table 1, the failure probabilities on demand of the risk control options listed in Table 2, as well as the derived F (LPECS) at Equation (14) into Equations (15)–(18), we obtain P (CCMD by LBRPV) = 2.97999971 × .
3.5. Rupture of Steam Line (RSL)
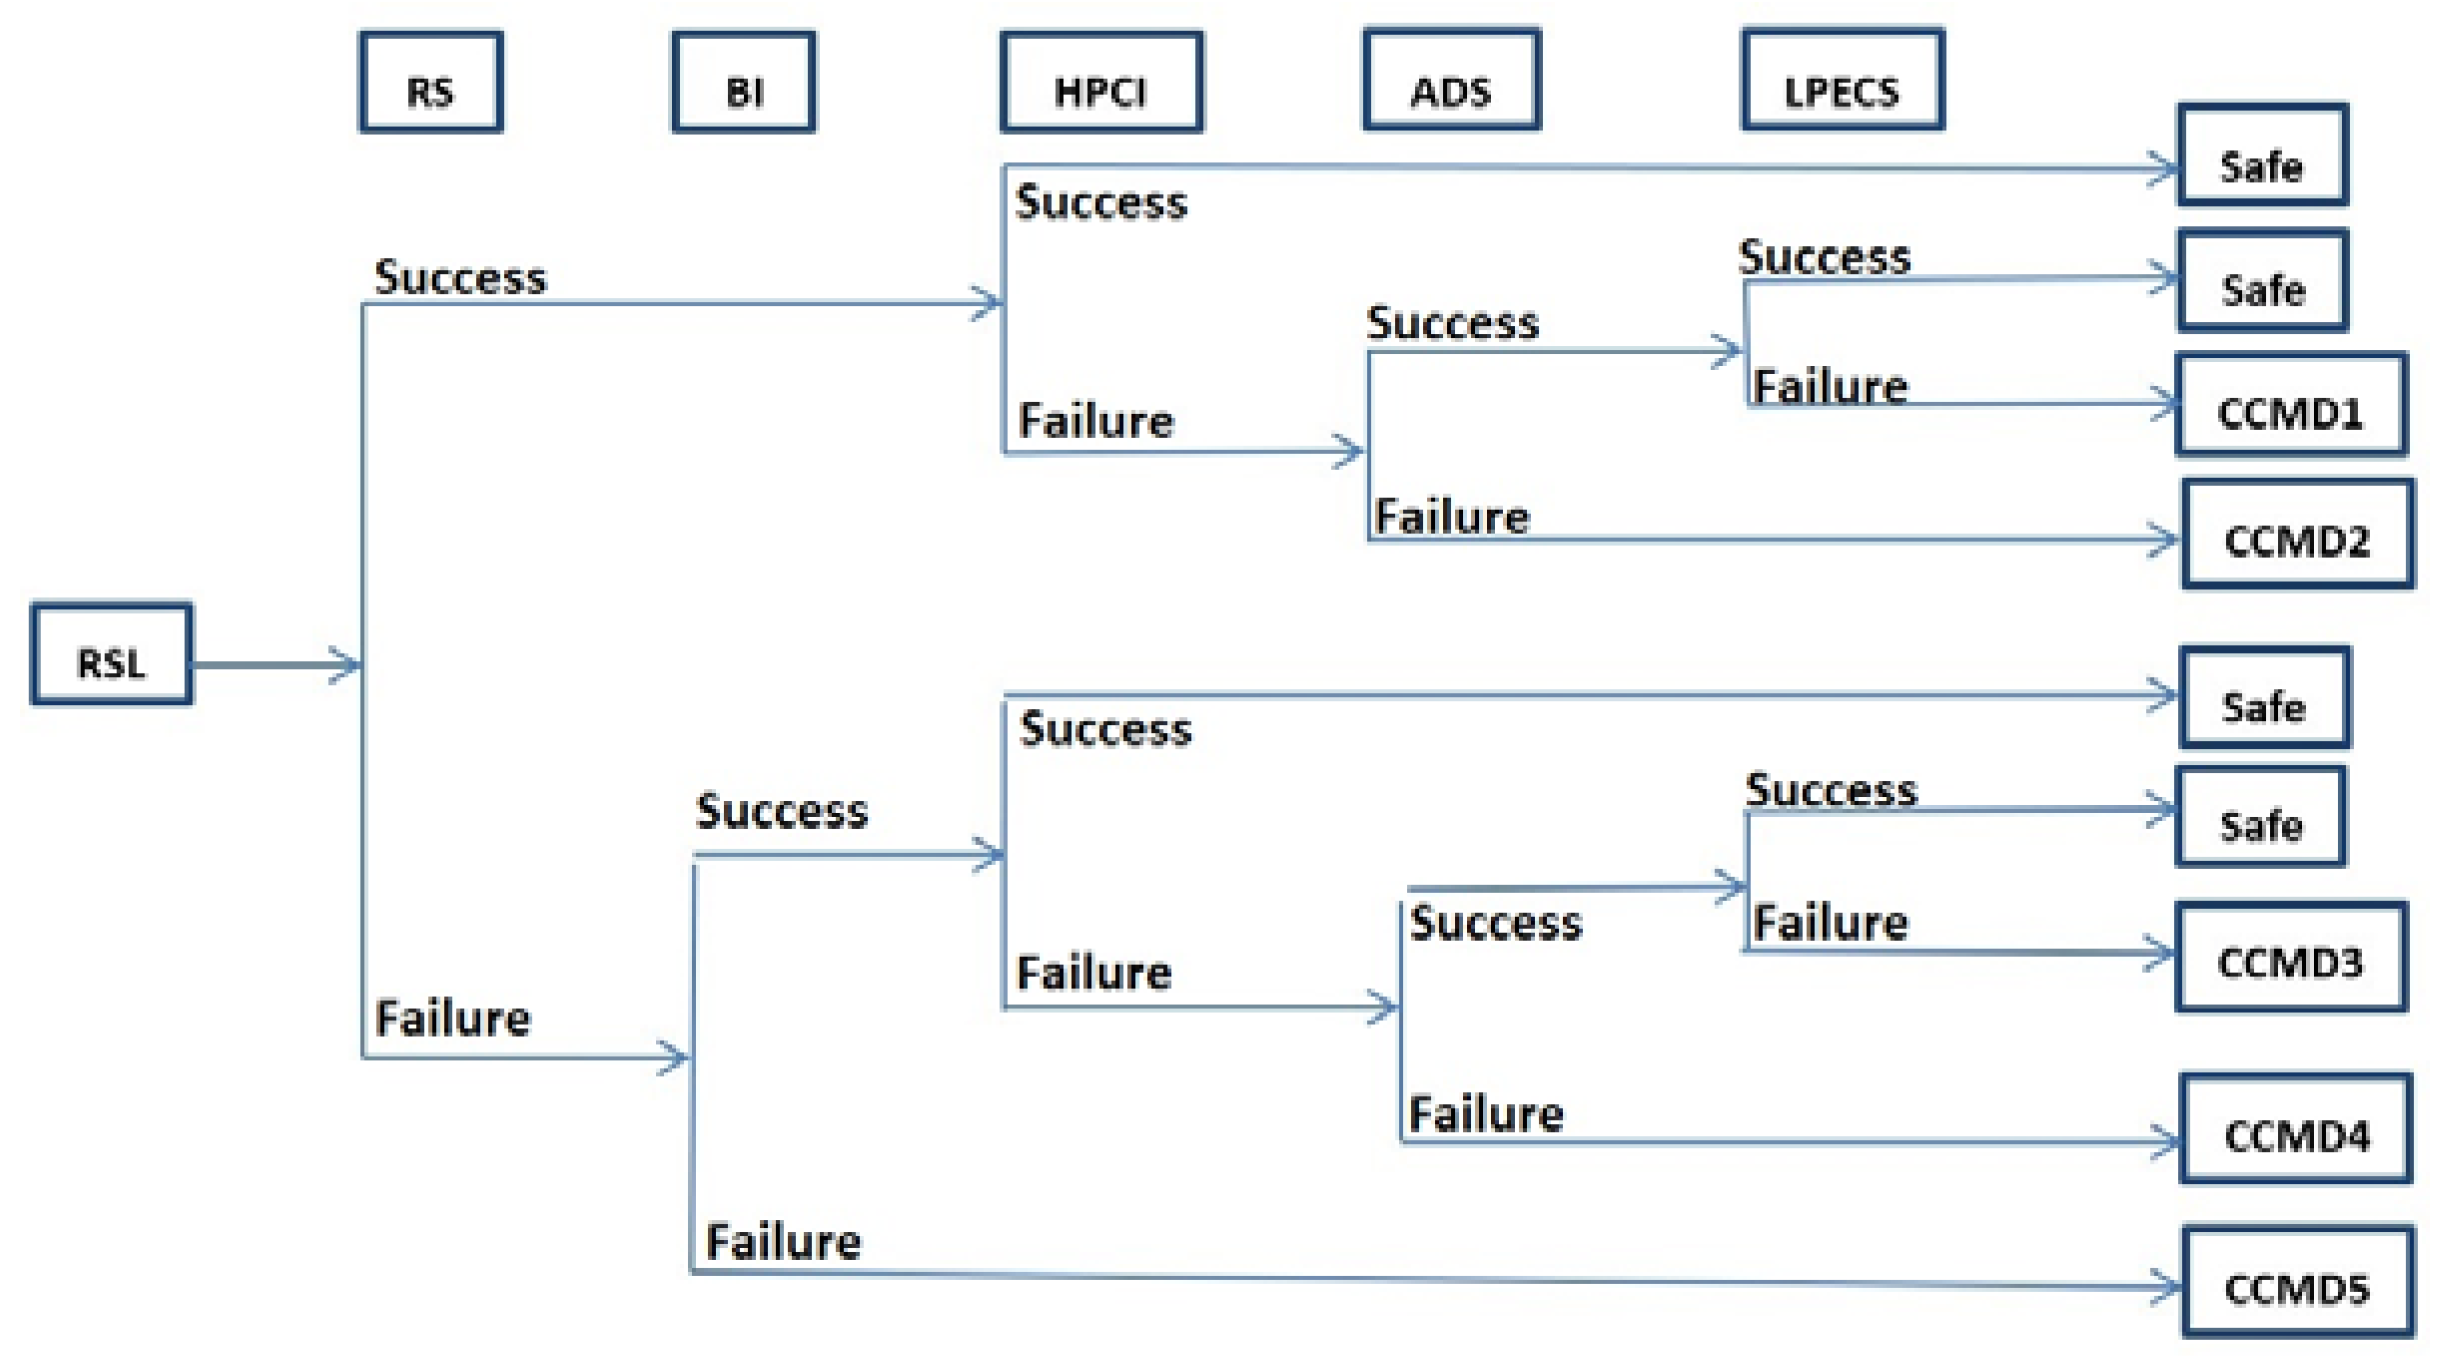
In the rupture of the steam line (RSL) accident between the RPV and the isolation valve, the RSL event-tree model assumes that if this intermediate-size leak occurs and pressure in the primary plant drops, the reactor scram (RS) initiates using safety rods to shut down the plant. If the scram system fails, the boron injection (BI) will subsequently kick in. Following the shutdown, the high-pressure coolant injection (HPCI) system provides protection. In the case of the HPCI failure, the automatic depressurization system (ADS) will permit the low-pressure emergency cooling system (LPECS) to initiate. Thereby, five different scenarios leading to CCMD are depicted in Figure 12 below.
Accordingly, the frequency of the RSL-triggered complete core meltdown (CCMD) is given by Equations (19)–(24), i.e.,
Incorporating the probability of failure for the initiating event (RSL) as specified in Table 1, the failure probabilities on demand of the risk control options listed in Table 2, as well as the derived F (LPECS) at Equation (14) into Equations (19)–(24), we obtain the result of P (CCMD by RSL) = 6.71726033 × .
3.6. Leak from Instrumentation Line (LIL)
Likewise, fault modelling of the leak from the instrumentation line (LIL) in RPV assumes that if the small leak occurs, pressure in the primary plant drops, the reactor scram (RS) initiates using safety rods to shut down the plant. If the scram system fails, the boron injection (BI) will subsequently kick in. Following the shutdown, the high-pressure coolant injection (HPCI) system provides protection. In the event of the HPCI failure, the automatic depressurization system (ADS) will permit the low-pressure emergency cooling system (LPECS) to initiate, including the low-pressure coolant injection (LPCI) or the core spray (CS) system. The event tree is drawn in Figure 13.
Accordingly, the probability of the LIL-triggered complete core meltdown (CCMD) is given by Equations (25)–(30), i.e.,
3.7. Rupture of Core Shroud (RCS)
Rupture of the core shroud (RCS) is not part of the pressurizing boundary but an uneven flow that could develop in the core due to debris coming off the core shroud and blocking off coolant flow channels. Minor core damage (MCD) could occur which will initiate the fission product monitor. Thereby, the RCS event-tree model assumes that MCD occurs from the start, initiating the fission product monitor (FPM), causing the reactor scram (RS) to initiate using safety rods. If the scram system fails, the boron injection (BI) will subsequently kick in. Following the shutdown, the normal plant cool-down system (NPCD) from either side should initiate to remove the decay heat. In the case of both sides’ failure, the reactor core isolation cooling (RCIC) system should initiate to cool the plant down. The event tree is depicted in Figure 14 below.
Accordingly, the failure rate of the RCS-triggered complete core meltdown (CCMD) is given by Equations (31)–(35), i.e.,
Incorporating the probability of failure for the initiating event (RCS) as specified in Table 1, the failure probabilities on demand of the risk control options listed in Table 2 into Equations (31)–(35), we obtain the result of P (CCMD by RCS) = 1.179919882 × . Meanwhile, the frequency of RCS-triggered minor core damage (MCD) is given by Equations (36)–(40), i.e.,
Incorporating the failure probabilities on demand into Equations (36)–(40), the result of P (MCD by RCS) is obtained as 9.988200801 × .
3.8. Breakup of Drier Structure Causing Local Channel Blockage (BDS-LCB)
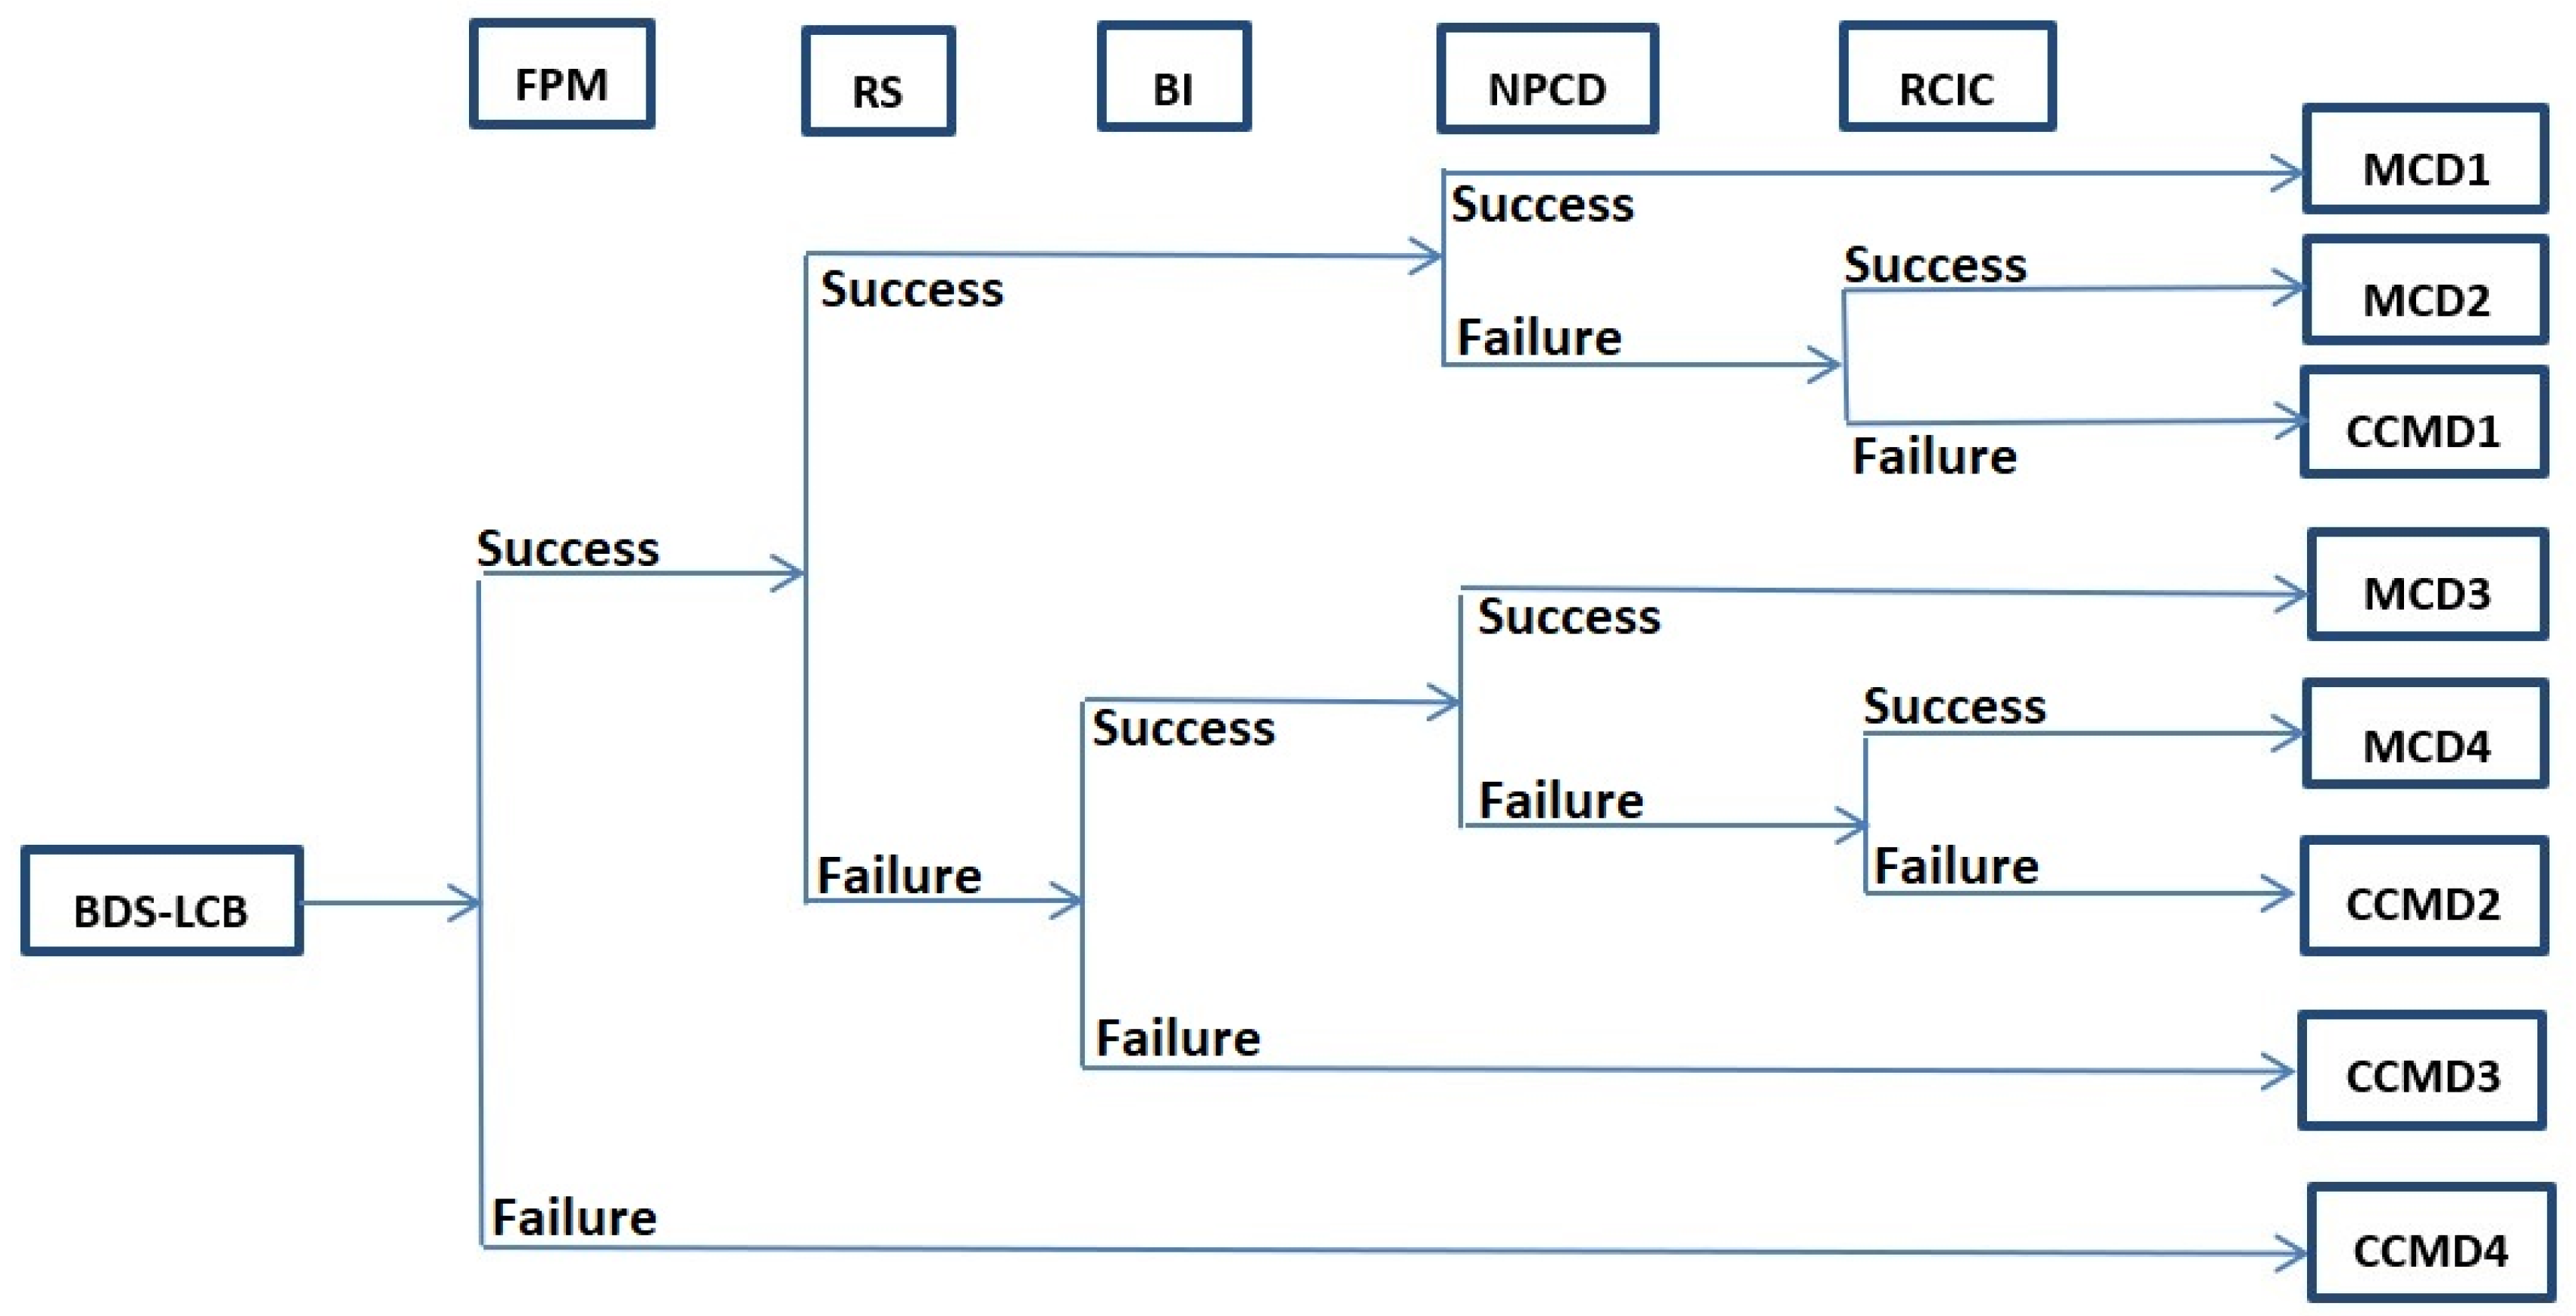
Likewise, the breakup of the drier structure causing local channel blockage (BDS-LCB) model assumes that minor core damage (MCD) happens from the start, initiating the fission product monitor (FPM), causing the reactor scram (RS) to initiate using safety rods. If the scram system fails, the boron injection (BI) will subsequently kick in. Following the shutdown, the normal plant cool-down system (NPCD) from either side should initiate to remove the decay heat. In the case of both sides’ failure, the reactor core isolation cooling (RCIC) system should initiate to cool the plant down. The event tree is presented in Figure 15 below.
The failure frequency of BDS-LCB-induced complete core meltdown (CCMD) is given by Equations (41)–(45), i.e.,
Incorporating the probability of failure for the initiating event (BDS-LCB) as specified in Table 1, the failure probabilities on demand of the risk control options listed in Table 2 into Equations (41)–(45), we obtain the result of P (CCMD by BDS-LCB) = 5.89959941 × .
The probability of BDS-LCB-triggered minor core damage (MCD) is derived by Equations (46)–(50), i.e.,
Incorporating the failure probabilities on demand into Equations (46)–(50), the result of P (MCD by BDS) is obtained as 4.9941004 × .
4. Summary of Results and Discussion
Heretofore, the BWR risk study evaluates eight types of independent accidents in the complex system that could lead to the outcome of either complete core meltdown (CCMD) or minor core damage (MCD). The results of the predicted frequencies are summarized in Table 3.
As observed from Table 3, the complete loss of heat sink (CLOHS) is the initiating accident that is most vulnerable to the outcome of the complete core meltdown (CCMD), while the large break in RPV (LBRPV) and the rupture of steam line (RSL) are least likely to result in the CCMD. Based on the quantified susceptibilities, an optimum balance between safety performance and costs could be attempted by placing the safety enhancement priority on mitigating the CLOHS-related lower-level events (i.e., condenser failure on both sides, failure of both water pumps from the river to condensers, and failure of both feed pumps), as well as improving the reliability of the risk control options for CLOHS, i.e., reactor scram (RS), boron injection (BI), and reactor core isolation cooling system (RCIC).
Factoring all the eight types of initiating accidents, the overall CCMD frequency per year is 2.81 × , and the total MCD frequency is 5.99 × , indicating a six-in-ten-thousand chance per year for an MCD to happen in the BWR. Arguably, the empirical data-based modelling results in this work provide a conservative yet insightful implication for the nuclear regulatory authority when reviewing the existing nuclear fleet and considering those claimed by the Generation III+ PWR systems using advanced technologies with highly reliable designs, e.g., EPR (AREVA) predicted with a MCD of 5.78 × per year [38], and AP1000 (Westinghouse) claimed with MCD of 1.23 × per year [39] subject to diverse modelling boundary conditions.
However, the fault-event trees established in this work are more deterministically oriented and entail a limited level of uncertainties regarding the events’ failure probabilities data collected from the empirical operating experiences of the system being investigated. Fuzzy-set logic [40,41,42] may be incorporated into the fault and event trees for model refinement of imprecision and uncertainty. Computer-aided synthesis, fuzzy neural networks [43], and Bayesian approaches [44,45,46,47] are worth exploring and integrating into the fault-event trees for further insights on the reliability analysis. Moreover, the assumption of using the failure probability on demand in this work associated to the event-tree model only represents the failures per demand of the component, but is not necessarily equivalent to the exact failure rate (i.e., the number of times the component failed in a given period of time).
It is also worth noting that the system boundary condition of the event trees model in this work is not coupled with uncertain external environments, such as earthquakes [48], malicious reactor attacks by terrorists [49], insider worker sabotage [50] and ever-increasing cyberattacks [51], the perspectives on which future research directions could focus. Last but not least, the fault-event tree approach in this work can expand the scenarios of applications in terms of nuclear in-core instrumentations, such as the reliability analysis of robots employed for inspection and maintenance [52] of civil nuclear reactors targeting an extended lifespan.
5. Conclusions
This work leverages fault tree and event tree approaches to deliver systematic reliability and risk assessment models for monitoring the safety performance of the complex BWR nuclear power plant system, concerning particularly the core complete meltdown and minor damage frequencies, the results of which enhance the existing body of knowledge and can inform the existing nuclear system regulations as well as the licensing of new nuclear power plants targeting in-depth safety, enhanced reliability and cost-efficiency. The potential beneficiaries are nuclear power plant operators, risk assessors, regulators, government energy policy makers, electricity suppliers, and the wider academic community. Furthermore, the assembled fault-event trees model the train of safety-related events for the complex BWR system into an understandable manner by visualizing the cause and effect relationship, which is highly desirable for the use in training purposes, thus assisting in public understanding and engagement in nuclear energy and nuclear safety.
Funding
This research received no external funding.
Acknowledgments
The author wishes to acknowledge the Cambridge Nuclear Energy Centre for the guidance in this case study, Imperial College London and University of Southampton for the support in this work.
Conflicts of Interest
The author declares no conflict of interest.
References
- Breyer, C. A Global Overview of Future Energy. In Future Energy; Elsevier: Amsterdam, The Netherlands, 2020; pp. 727–756. [Google Scholar]
- Eriksson, O. Nuclear Power and Resource Efficiency—A Proposal for a Revised Primary Energy Factor. Sustainability 2017, 9, 1063. [Google Scholar] [CrossRef] [Green Version]
- Merk, B.; Bankhead, M.; Litskevich, D.; Gregg, R.; Peakman, A.; Shearer, C. On a Roadmap for Future Industrial Nuclear Reactor Core Simulation in the U.K. to Support the Nuclear Renaissance. Energies 2018, 11, 3509. [Google Scholar] [CrossRef] [Green Version]
- Sekimoto, H. A Roadmap of Innovative Nuclear Energy System. J. Phys. Conf. Ser. 2017, 799, 012001. [Google Scholar] [CrossRef] [Green Version]
- Steijn, W.M.P.; Kampen, J.N.V.; Beek, D.V.; Groeneweg, J.; Gelder, P.V. An integration of human factors into quantitative risk analysis using Bayesian Belief Networks towards developing a ‘QRA+’. Saf. Sci. 2020, 122, 104514. [Google Scholar] [CrossRef]
- Cid, M.M.; Dies, J.; Tapia, C.; Diaz, P. Outage Key Safety Functions Configuration risk assessment for a three loops Westinghouse PWR. Nucl. Eng. Des. 2015, 291, 271–276. [Google Scholar] [CrossRef] [Green Version]
- Gattie, D.K. U.S. energy, climate and nuclear power policy in the 21st century: The primacy of national security. Electr. J. 2020, 33, 106690. [Google Scholar] [CrossRef]
- Goodfellow, M.J.; Dewick, P.; Wortley, J.; Azapagic, A. Public perceptions of design options for new nuclear plants in the UK. Process Saf. Environ. Prot. 2015, 94, 72–88. [Google Scholar] [CrossRef]
- Nishikawa, M.; Kato, T.; Homma, T.; Takahara, S. Changes in risk perceptions before and after nuclear accidents: Evidence from Japan. Environ. Sci. Policy 2016, 55, 11–19. [Google Scholar] [CrossRef]
- Zohuri, B.; Fathi, N. Probabilistic Risk Assessment. In Thermal-Hydraulic Analysis of Nuclear Reactors; Springer: Amsterdam, The Netherlands, 2015; pp. 479–488. [Google Scholar]
- Iman, R.L. Methods Used in Probabilistic Risk Assessment for Uncertainty and Sensitivity Analysis. In New Risks: Issues and Management. Advances in Risk Analysis; Cox, L.A., Ricci, P.F., Eds.; Springer: Boston, MA, USA, 1990; Volume 6. [Google Scholar]
- Purbaa, J.; Tjahyanib, D.; Deswandric. The implementation of fault tree analysis approaches in nuclear power plant probabilistic safety assessment. AIP Conf. Proc. 2019, 2180, 020010. [Google Scholar]
- Lee, W.; Grosh, D.; Tillman, F.; Lie, C. Fault Tree Analysis, Methods, and Applications—A Review. IEEE Trans. Reliab. 1985, 34, 194–203. [Google Scholar] [CrossRef]
- Ferdous, R.; Khan, F.; Sadiq, R.; Amyotte, P.; Veitch, B. Fault and event tree analyses for process systems risk analysis: Uncertainty handling formulations. Risk Anal. 2011, 31, 86–107. [Google Scholar] [CrossRef] [PubMed]
- Raju, S. Estimating the frequency of nuclear accidents. Sci. Glob. Secur. 2016, 24, 37–62. [Google Scholar] [CrossRef] [Green Version]
- Lavasani, S.M.; Zendegani, A.; Celik, M. An extension to Fuzzy Fault Tree Analysis (FFTA) application in petrochemical process industry. Process Saf. Environ. 2015, 93, 75–88. [Google Scholar] [CrossRef]
- Munera, H.A. A deterministic event tree approach to uncertainty, randomness and probability in individual chance processes. Theory Decis. 1992, 32, 21–55. [Google Scholar] [CrossRef]
- Jenab, K.; Dhillon, B.S. Stochastic fault tree analysis with self-loop basic events. IEEE Trans. Reliab. 2005, 54, 173–180. [Google Scholar] [CrossRef]
- Podowski, M.Z.; Luo, W.; Kirchner, R.F. Simulation of BWR core meltdown accidents using the APRIL and MAAP computer codes. In Proceedings of the Transactions of the Twenty-Second Water Reactor Safety Information Meeting, Bethesda, MD, USA, 24–26 October 1994. [Google Scholar]
- Villafuerte, J.O.; Durán, R.C.; López, H.H.; Martínez, E.A. Fundamentals of Boiling Water Reactor Safety Design and Operation. In Towards a Cleaner Planet; Springer: Berlin/Heidelberg, Germany, 2007. [Google Scholar]
- USNRC Technical Training Center. Boiling Water Reactor (BWR) Systems. In Reactor Concepts Manual; US Nuclear Regulatory Commission: Rockville, MD, USA, 2012. [Google Scholar]
- Nikitin, K.; Mueller, P.; Martin, J.; Doesburg, W.V.; Hiltbrand, D. BWR loss of coolant accident simulation by means of Relap5. Nucl. Eng. Des. 2016, 309, 113–121. [Google Scholar] [CrossRef]
- Greene, R.H. Maintenance of BWR control rod drive mechanisms. In Proceedings of the Nuclear Power Plant and Facility Maintenance Topical Meeting, Salt Lake City, UT, USA, 7–11 April 1991. [Google Scholar]
- Hurlebaus, D. An advanced scram system for BWR reactors. In Proceedings of the Reactor Congress 1977, Mannheim, Germany, 29 March–1 April 1977. (In German). [Google Scholar]
- Tinoco, H.; Buchwald, P.; Frid, W. Numerical simulation of boron injection in a BWR. Nucl. Eng. Des. 2010, 240, 221–234. [Google Scholar] [CrossRef]
- Lin, C.C.; Skarpelos, J.M. Monitoring of fission product release in a boiling water reactor. J. Radioanal. Nucl. Chem. 1997, 220, 173–181. [Google Scholar] [CrossRef]
- Lopez, H.; Erkan, N.; Okamoto, K. Reactor core isolation cooling system analysis of the Fukushima Daiichi Unit 2 accident with RELAP/ScdapSIM. J. Nucl. Sci. Technol. 2016, 53, 1899–1905. [Google Scholar] [CrossRef] [Green Version]
- Ramirez, G.C.; Chavez, M.C. Simulation of the automatic depressurization system (Ads) for a boiling water reactor (BWR) based on RELAP. In Proceedings of the 23rd SNM Annual Congress: Perspective and Development of Nuclear Energy after Fukushima, Oaxaca, Mexico, 29 July–1 August 2012; Sociedad Nuclear Mexicana: Mexico, Mexico, 2012. [Google Scholar]
- Hideo, N.; Yutaka, K.; Kanji, T. BWR Loss-ofCoolant Accident Tests at ROSA-III with High Temperature Emergency Core Coolant Injection. J. Nucl. Sci. Technol. 1988, 25, 169–179. [Google Scholar]
- Wheatley, S.; Sovacool, B.K.; Sornette, D. Reassessing the safety of nuclear power. Energy Res. Soc. Sci. 2016, 15, 96–100. [Google Scholar] [CrossRef] [Green Version]
- Minh, H.D.; Journé, V. Calculating nuclear accident probabilities from empirical frequencies. Environ. Syst. Decis. 2014, 34, 249–258. [Google Scholar]
- Ilas, G.; Liljenfeldt, H. Decay heat uncertainty for BWR used fuel due to modeling and nuclear data uncertainties. Nucl. Eng. Des. 2017, 319, 176–184. [Google Scholar] [CrossRef]
- Sembiring, T.M.; Pinem, S.; Liem, P.H. Analysis of NEA-NSC PWR Uncontrolled Control Rod Withdrawal at Zero Power Benchmark Cases with NODAL3 Code. Sci. Technol. Nucl. Install. 2017, 2017, 5151890. [Google Scholar] [CrossRef] [Green Version]
- Solis, J.; Ivanov, K.N.; Sarikaya, B.; Olson, A.M.; Hunt, K.W. Boiling Water Reactor Turbine Trip (TT) Benchmark. Volume I: Final Specifications; OECD Nuclear Energy Agency: Paris, France, 2001. [Google Scholar]
- IAEA. Assessment and Management of Ageing of Major Nuclear Power Plant Components Important to Safety: BWR Pressure Vessel Internals; Engineering Safety Section, IAEA: Vienna, Austria, 2005. [Google Scholar]
- Takahiro, S.; Makoto, N. Failure cause and failure rate evaluation on pumps of BWR plants in PSA Hypothesis testing for typical or plant specific failure rate of pumps. Denryoku Chuo Kenkyusho Hokoku 2009, 41, 1–45. [Google Scholar]
- Ivanov, K.; Olson, A.; Sartori, E. OECD/NRC BWR Turbine Trip Transient Benchmark as a Basis for Comprehensive Qualification and Studying Best-Estimate Coupled Codes. Nucl. Sci. Eng. 2004, 148, 195–207. [Google Scholar] [CrossRef]
- Godefroy, F. PSA Discussion and Conclusions. In Pre-Construction Safety Report of the UK EPR; AREVA: Paris, France, 2012; Volume 157, p. 6. [Google Scholar]
- Westinghouse. AP1000 Pre-Construction Safety Report; Westinghouse: Cranberry Township, PA, USA, 2009; p. 321. [Google Scholar]
- Kenarangui, R. Event-tree analysis by fuzzy probability. IEEE Trans. Rel. 1991, 40, 120–124. [Google Scholar] [CrossRef]
- Batzias, F.A.; Siontorou, C.C. Investigating the causes of biosensor SNR decrease by means of fault tree analysis. IEEE Trans. Instrum. Meas. 2005, 54, 1395–1406. [Google Scholar] [CrossRef]
- Mahmood, Y.A.; Ahmadi, A.; Verma, A.K.; Srividya, A.; Kumar, U. Fuzzy fault tree analysis: A review of concept and application. Int. J. Syst. Assur. Eng. Manag. 2013, 4, 19–32. [Google Scholar] [CrossRef]
- Chen, Y.; Zhen, Z.; Yu, H.; Xu, J. Application of Fault Tree Analysis and Fuzzy Neural Networks to Fault Diagnosis in the Internet of Things (IoT) for Aquaculture. Sensors 2017, 17, 153. [Google Scholar] [CrossRef] [PubMed] [Green Version]
- Mohan, V.D.; Vardon, P.; Hicks, M.; Gelder, P.V. Uncertainty Tracking and Geotechnical Reliability Updating Using Bayesian Networks. In Proceedings of the 7th International Symposium on Geotechnical Safety and Risk (ISGSR), Taipei, Taiwan, 11–13 December 2019. [Google Scholar]
- Febres, J.D.; Mohamadi, F.; Mariscal, M.A.; Herrera, S.; García-Herrero, S. The Role of Journey Purpose in Road Traffic Injuries: A Bayesian Network Approach. J. Adv. Transp. 2019, 2019, 6031482. [Google Scholar] [CrossRef]
- Tolo, S.; Patelli, E.; Beer, M. Robust vulnerability analysis of nuclear facilities subject to external hazards. Stoch. Environ. Res. Risk Assess. 2017, 31, 2733–2756. [Google Scholar] [CrossRef] [Green Version]
- Lye, A.T.; Hector, E.L.; Patelli, E. Conversion of Fault Tree into Credal Network for Probabilistic Safety Assessment of a Nuclear Power Plant. In Proceedings of the 3rd International Conference on Nuclear Power Plants, London, UK, 10–11 June 2019. [Google Scholar]
- Ebisawa, K.; Teragaki, T.; Nomura, S.; Abe, H.; Shigemori, M.; Shimomoto, M. Concept and methodology for evaluating core damage frequency considering failure correlation at multi units and sites and its application. Nucl. Eng. Des. 2015, 288, 82–97. [Google Scholar] [CrossRef] [Green Version]
- Helfand, I.; Forrow, L.; Tiwari, J. Nuclear terrorism. BMJ 2002, 324, 356–359. [Google Scholar] [CrossRef] [PubMed]
- International Atomic Energy Agency. Engineering Safety Aspects of the Protection of Nuclear Power Plants against Sabotage; IAEA Nuclear Security Series No. 4; IAEA: Vienna, Italy, 2007. [Google Scholar]
- The Economist. A Cyber-Attack on an Indian Nuclear Plant Raises Worrying Questions. Available online: https://www.economist.com/asia/2019/11/01/a-cyber-attack-on-an-indian-nuclear-plant-raises-worrying-questions (accessed on 20 April 2020).
- Ferguson, T.; Lu, L. Fault tree analysis for an inspection robot in a nuclear power plant. IOP Conf. Ser. Mater. Sci. Eng. 2017, 235, 012003. [Google Scholar] [CrossRef] [Green Version]
Figure 1.
Schematic of a standard boiling water reactor (BWR) plant in this study.

Figure 2.
Sketch of the normal plant cool-down (NPCD) system to remove the decay heat.

Figure 3.
Sketch of the BWR standby reactor core isolation cooling (RCIC) system.

Figure 4.
Sketch of the BWR high-pressure coolant injection (HPCI) system.

Figure 5.
Sketch of the BWR core spray (CS) system and low-pressure coolant injection (LPCI) system.
Figure 5.
Sketch of the BWR core spray (CS) system and low-pressure coolant injection (LPCI) system.

Figure 6.
Event tree model developed for CCMD initiated by the CRWA accident.

Figure 7.
Event tree model developed for CCMD initiated by the TF accident.

Figure 8.
Fault tree model developed for the complete loss of heat sink (CLOHS) accident.

Figure 9.
Event tree model developed for CCMD initiated by the CLOHS accident.

Figure 10.
Fault tree model developed for the failure of LPECS.

Figure 11.
Event tree model developed for CCMD initiated by LBRPV accident.

Figure 12.
Event tree model developed for CCMD initiated by the RSL accident.

Figure 13.
Event tree model developed for CCMD initiated by the LIL accident.

Figure 14.
Event tree model developed for CCMD and MCD initiated by the RCS accident.

Figure 15.
Event tree model developed for CCMD and MCD initiated by the BDS-LCB accident.


Table 1.
Fault-initiating events identification for BWR.
| Plant Fault Event | Event Frequency per Year | Final Outcome Without Protections |
|---|---|---|
| Continuous rod withdrawal (CRWA) accident [33] | 5 × | Complete core meltdown (CCMD) |
| Both main turbines failure (TF) [34] | 2 × | CCMD |
| Rupture of core shroud (RCS) [35] | 1 × | Minor core damage (MCD) or MCD and CCMD |
| Condenser failure (CF) on both sides [36] | 5 × | CCMD |
| Failure of both water pumps (FWP) [36] | 2 × | CCMD |
| Failure of both feed pumps (FFP) [36] | 5 × | CCMD |
| Large break in RPV (LBRPV) [35] | 1 × | CCMD |
| Rupture of steam line (RSL) [34] | 1 × | CCMD |
| Leak from instrumentation line (LIL) in RPV [35] | 1 × | CCMD |
| Breakup of drier structure causing local channel blockage (BDS-LCB) [37] | 5 × | MCD or MCD and CCMD |
Table 2.
Empirical failure probability on demand of the BWR protection systems.
| Failure Mode of BWR Protection System | Failure Probability on Demand |
|---|---|
| Failure of reactor scram (RS) system using safety rods [23] | 1 × |
| Failure of reactor shut down using boron injection (BI) [25] | 1 × |
| Failure of normal plant cool-down (NPCD) system [21] | 3 × |
| Failure of reactor core isolation cooling (RCIC) system [27] | 6 × |
| Failure of core spray (CS) system [29] | 1.6 × |
| Failure of high-pressure coolant injection (HPCI) system [28] | 6 × |
| Failure of automatic depressurization system (ADS) [28] | 1.1 × |
| Failure of low-pressure coolant injection (LPCI) system [29] | 1.8 × |
| Failure of fission product monitor (FPM) [26] | 1 × |
Table 3.
Modelling results of CCMD and MCD frequencies per year (based on the frequencies of initiating events at the 95% confidence level).
Table 3.
Modelling results of CCMD and MCD frequencies per year (based on the frequencies of initiating events at the 95% confidence level).
| BWR Accident Type | CCMD Frequency | MCD Frequency |
|---|---|---|
| Continuous rod withdrawal accident (CRWA) | 9.00499910 × | Not applicable |
| Main turbine failure (TF) | 3.60199964 × | Not applicable |
| Complete loss of heat sink (CLOHS) | 1.80002982 × | Not applicable |
| Large break in RPV (LBRPV) | 2.97999971 × | Not applicable |
| Rupture of steam line (RSL) | 6.71726033 × | Not applicable |
| Leak from instrumentation line in RPV (LIL) | 6.71726033 × | Not applicable |
| Rupture of core shroud (RCS) | 1.179919882 × | 9.98820080 × |
| Breakup of drier structure causing local channel blockage | 5.899599410 × | 4.99410040 × |
| Total | 2.808022798 × | 5.99292048 × |
© 2020 by the author. Licensee MDPI, Basel, Switzerland. This article is an open access article distributed under the terms and conditions of the Creative Commons Attribution (CC BY) license (http://creativecommons.org/licenses/by/4.0/).
Share and Cite
MDPI and ACS Style
Li, J. Fault-Event Trees Based Probabilistic Safety Analysis of a Boiling Water Nuclear Reactor’s Core Meltdown and Minor Damage Frequencies. Safety 2020, 6, 28. https://0-doi-org.brum.beds.ac.uk/10.3390/safety6020028
AMA Style
Li J. Fault-Event Trees Based Probabilistic Safety Analysis of a Boiling Water Nuclear Reactor’s Core Meltdown and Minor Damage Frequencies. Safety. 2020; 6(2):28. https://0-doi-org.brum.beds.ac.uk/10.3390/safety6020028
Chicago/Turabian StyleLi, Jinfeng. 2020. "Fault-Event Trees Based Probabilistic Safety Analysis of a Boiling Water Nuclear Reactor’s Core Meltdown and Minor Damage Frequencies" Safety 6, no. 2: 28. https://0-doi-org.brum.beds.ac.uk/10.3390/safety6020028
Note that from the first issue of 2016, this journal uses article numbers instead of page numbers. See further details here.