Driver Take-Over Reaction in Autonomous Vehicles with Rotatable Seats


1
Department of Systems Design Engineering, University of Waterloo, Waterloo, ON N2L 3G1, Canada
2
Department of Mechanical, Materials and Manufacturing Engineering, University of Nottingham, Ningbo 315100, China
*
Author to whom correspondence should be addressed.
Safety 2020, 6(3), 34; https://0-doi-org.brum.beds.ac.uk/10.3390/safety6030034
Submission received: 13 March 2020
/
Revised: 14 June 2020
/
Accepted: 19 June 2020
/
Published: 1 July 2020
Abstract
:A new concept in the interior design of autonomous vehicles is rotatable or swivelling seats that allow people sitting in the front row to rotate their seats and face backwards. In the current study, we used a take-over request task conducted in a fixed-based driving simulator to compare two conditions, driver front-facing and rear-facing. Thirty-six adult drivers participated in the experiment using a within-subject design with take-over time budget varied. Take-over reaction time, remaining action time, crash, situation awareness and trust in automation were measured. Repeated measures ANOVA and Generalized Linear Mixed Model were conducted to analyze the results. The results showed that the rear-facing configuration led to longer take-over reaction time (on average 1.56 s longer than front-facing, p < 0.001), but it caused drivers to intervene faster after they turned back their seat in comparison to the traditional front-facing configuration. Situation awareness in both front-facing and rear-facing autonomous driving conditions were significantly lower (p < 0.001) than the manual driving condition, but there was no significant difference between the two autonomous driving conditions (p = 1.000). There was no significant difference of automation trust between front-facing and rear-facing conditions (p = 0.166). The current study showed that in a fixed-based simulator representing a conditionally autonomous car, when using the rear-facing driver seat configuration (where participants rotated the seat by themselves), participants had longer take-over reaction time overall due to physical turning, but they intervened faster after they turned back their seat for take-over response in comparison to the traditional front-facing seat configuration. This behavioral change might be at the cost of reduced take-over response quality. Crash rate was not significantly different in the current laboratory study (overall the average rate of crash was 11%). A limitation of the current study is that the driving simulator does not support other measures of take-over request (TOR) quality such as minimal time to collision and maximum magnitude of acceleration. Based on the current study, future studies are needed to further examine the effect of rotatable seat configurations with more detailed analysis of both TOR speed and quality measures as well as in real world driving conditions for better understanding of their safety implications.
1. Introduction
Autonomous vehicles use sensors and advanced control systems to navigate and move on the road with little or no input from human drivers. Society of Automotive Engineers (SAE) taxonomy for autonomous vehicles defines five levels of automation ranging from driver assistance at Level 1 to full automation at Level 5 [1]. As the development of advanced technology and algorithms, autonomous vehicles are taking more and more driving-related tasks that are used to be assigned to drivers. When drivers do not have to constantly monitor the road, there is an opportunity for other activities such as relaxation, social conversation, entertainment and working [2]. The social conversation includes both communication among passengers in the vehicle and remote communication such as talking over the phone and online chatting when there is only one person in the vehicle. The change of in-vehicle tasks will also require new vehicle interior design.
An interesting concept in recent vehicle interior design is rotatable or swivelling seats that allow the driver and the passenger sitting in the front row to rotate their seats and face backwards [2]. It applies to situations with more than one or two persons in a car, such as family trips with children and carpooling. Automobile manufactures have filed patents for reconfigurable seats that can be changed from front-facing to rear-facing, e.g., [3]. Such design is expected to better support conversation and social interactions among drivers and passengers [4]. Sitting in such rear-facing seats is also expected to be safer during frontal collisions, as demonstrated in a computer simulation study [5]. However, a potential disadvantage of rotatable seats is that longer reaction time is expected when a driver in a rear-facing position must take-over control from the automation due to the extra time needed to turn back. If take-over request warning can be issued early enough with the consideration for the seat turning time, is it still feasible for driver take-over in rotatable seats? The goal of the current study is to examine driver take-over reaction in such situations, which can help analyze the feasibility and safety of take-over control with rotatable seats. Three major variables to measure the human aspects of take-over control in partially automated vehicles include reaction time, situation awareness and trust, which will be introduced in the following paragraphs.
Driver take-over control is a necessary fallback mechanism in autonomous vehicles when technology is not sufficient for full automation. For example, in SAE Level 3 (conditional automation), the automation has its limitation and is not expected to be able to safely handle all driving conditions. When the driving condition is beyond the designed boundary of functionality or when erroneous and conflicting sensor information is presented, the vehicle will request the driver to take over control.
Recent studies have examined driver take-over reaction in the traditional front-facing seat setup, e.g., [6,7]. Typically, experiments are conducted using driving simulators to minimize the risk exposed to participants. Participants usually start a trial while the car drives autonomously. During autonomous driving, participants can be instructed to either engage in or refrain from non-driving tasks such as reading a newspaper or playing a game. Then at times, pre-programmed events occur, such as an accident that happens ahead and blocks the lane. At this moment, the simulator issues take-over request (TOR) that asks the participant to manually take over control of the vehicle. TOR can be delivered via different perceptual modalities, including visual, auditory and haptic channels. Participants’ reaction to TOR is recorded and analyzed. The most frequently used take-over performance measure is take-over reaction time, also called intervention time or take-over time. It is defined as the duration from the onset of TOR to the first moment of the driver’s reaction, either braking or steering in response to the TOR. The threshold value to determine the onset of brake response is usually 10% brake pedal press, and the threshold value to determine the onset of steering response is usually 2 degrees of steering wheel change [8]. The previous review showed that although there is a significant difference of take-over reaction time across different situations, its value is typically within a range of 1 s to 4 s [6].
Previous research has identified factors affecting take-over behavior [9]. Among them, two very important factors are time budget and non-driving related tasks [10], both of which were considered in the current study’s experimental design. Time budget, also called TOR lead time, refers to the duration from the onset of TOR warning to the moment of the system limit, for example, when the car hits an obstacle if no driver control is taken after the TOR warning. Studies have found that take-over reaction time generally increases as more time budget is available. For example, Gold et al. [8] found that take-over reaction time increased from 2.1 s in the 5 s time budget condition to 2.9 s in the 7 s time budget condition. It means that when the situation such as potential collision is not imminent, drivers tend to spend more time first checking the environment, thinking and planning reactions before carrying out the actions. When time budget is longer than 10 s, take-over behavior generally stays the same [11]. Note that very large time budget is equivalent to manual driving. When making comparison across conditions with a different time budget, it is better to use remaining action time rather than take-over reaction time. Remaining action time is calculated as time budget minus take-over reaction time. Greater remaining action time generally represents better performance and safer take-over behavior. For example, Gold et al. [8] found that remaining action time increased from 2.9 s in the 5 s time budget condition to 4.1 s in the 7 s time budget condition.
Non-driving related task is another important factor affecting take-over behavior. If a driver is engaged in tasks that take a significant amount of visual or mental resources away from monitoring the scene or the tasks require hands to be away from the steering wheel, they are likely to impair preparedness and reduce take-over performance. It has been shown that a wide range of non-driving related tasks, including reading, typing, watching a video, playing a game and taking a nap, all reduced take-over performance and made responses slower in comparison to the baseline condition of constantly monitoring the road [11]. Higher levels of non-driving related task engagement, for example, in terms of more eye glances away from the road, are associated with poorer take-over performance [9]. Standard tests have been established to represent typical non-driving related tasks. Surrogate reference task (SuRT) can be used to occupy visual and motor resources, representing visual-motor tasks such as using mobile phones or vehicle center console. SuRT requires participants to visually search for a target circle (slightly larger) among other smaller circles and press keys to select and identify the target [12]. Auditory n-back tasks are often used to represent speech interface and cognitive workload [13]. Researchers have also built regression [10] and cognitive architecture simulation models [14] of take-over reaction time.
While take-over reaction time is a frequently used measure, it records only one timestamp along the entire course of driver action after TOR. Before the first action of the steering wheel or pedal control, drivers need to shift attention back onto the road from non-driving related tasks, move hands back to the steering wheel, foot back to the pedal, visually scan the environment, regain situation awareness and make a decision. After taking the first action, as recorded by take-over reaction time, drivers continue to control the vehicle, maintain stability, avoid collision by steering or braking and return to normal driving. In addition to time measures, there are also take-over quality measures such as crash rate, minimal time-to-collision and maximum magnitude of acceleration.
Driver situation awareness and trust in autonomous vehicles are also important measures to evaluate human-machine interaction in autonomous vehicles [15]. Situation awareness is a construct that represents the degree to which an operator’s perception and understanding of the current task and conditions support the optimal performance of the task. Situation awareness includes the perception of the elements in the environment within a volume of time and space, the comprehension of their meaning and the projection of their status in the near future [16]. Situation awareness is an important measure, especially for human-automation interaction, because in such interaction, human operators’ work is often limited to monitoring and supervising automation without the need to manually carry out the tasks. When there is no explicit action required from the operators, performance indexes such as reaction time and error rate cannot be measured any more. Situation awareness provides a measure for monitoring tasks. It can measure how well an operator has collected and analyzed information related to the task before taking any action. A recent literature review [17] showed that automated driving might affect situation awareness positively or negatively, depending on the driver’s motivation and task instructions of the experiment. If drivers are instructed or motivated to carefully monitor the environment when the vehicle is driven by itself, situation awareness can be improved in comparison to manual driving. However, if drivers are engaged in non-driving related tasks, situation awareness can be impaired.
Human trust in automation is an important factor to be considered in the design of autonomous vehicles [18]. An appropriate level of trust is needed to match the automation’s level of reliability. A higher level of trust can cause drivers to look less at the road and spend more time with non-driving related tasks [19]. Higher trust is also linked to longer take-over reaction time [20]. Researchers have found that trust in autonomous vehicles can be increased by presenting more information about how the automation works to the drivers, for example, by augmenting sensor data on a car’s windshield to show traffic objects identified by the automation [21].
In the current study, we used a TOR task in a driving simulator to compare two conditions, front-facing and rear-facing while sitting in a conditionally automated car (SAE Level 3). It is intuitive to expect that reaction time in the rear-facing condition will be slower than the front-facing condition because of the physical turning time involved. A previous study has shown this effect in the case of a reclined driver seat [22]; when drivers need to take over from a laid-back posture on the reclined seat, the reaction time of hands-on steering wheel significantly increased. However, it is not clear if this effect of increased reaction time can be compensated by simply giving additional time budget of TOR. The rear-facing setup and the additional seat turning action may further impose a cognitive challenge because it is more difficult to monitor and understand the driving environment when facing the rear. To examine this question, we measured physical turning time and take-over reaction time in the driving simulator with a rotatable seat setup.
2. Methods
2.1. Participants
Thirty-six adult drivers (23 males and 13 females) participated in this study. Their average age was 32 years (SD = 8 years). Their average driving experience was 7 years (SD = 4 years). The participants were recruited via an advertisement sent on social media. The participants were not students.
2.2. Apparatus
The driving simulation software was OpenDS (https://opends.dfki.de/). A compact car (Chery QQ) was placed inside the laboratory, with the car’s steering wheel and the pedals replaced by Logitech G29 steering and pedals. The scenes were projected onto four screens (1920 × 1080 pixels each) surrounding the car. Sound was played through loudspeakers. Figure 1 shows the driving simulator used in the current study. The rotation mechanism of the seat was similar to a rotating office chair (Figure 2). The participants rotated the seat by themselves. There was no locking mechanism implemented in this prototype.
2.3. Task and Experimental Design
A within-subject design was used. The two independent variables included time budget (low or high) and seat facing (front or rear). For the front-facing condition, low time budget had five seconds, whereas high time budget had seven seconds. For the rear-facing condition, the time budget values were increased by two seconds to compensate for the time duration needed to physically turn the seat. That is, a low time budget of seven seconds and a high time budget of nine seconds were used for the rear-facing condition. The time compensation of two seconds was determined by measuring the average time needed to complete turning the seat. In a pilot test, 43 participants performed the seat turning action in the driving simulator, and their mean turning time duration was 2.0 s (SD = 0.7 s).
Participants were asked to engage in a SuRT task [23] while the car drove by itself. Participants were informed that if the car could not handle any emergency, it would ask the driver to take over control. When hearing the take-over request warning, drivers should stop other tasks at hand and attend the driving task immediately to take any necessary actions for driving safely. The SuRT task was used to represent visually demanding non-driving related tasks. The driving scenario was set on a highway with a speed limit at 100 km/h. The emergency was created by a vehicle stopped in front of the road. The TOR warning was an audio speech “Take over! Take over!”
After each condition, situation awareness was measured using 3D-SART [24], which has a total of three questions. Automation trust was measured using the overall average score from the questionnaire developed by Bisantz and Seong [25] with a total of 12 questions. TOR reaction time measures were recorded in the driving simulator. In addition, a baseline condition of manual driving was also tested for providing a baseline for situation awareness.
Power analysis using G*Power [26] version 3.1.9.7 showed that a sample size of 36 participants was expected to reach a power of 0.95, assuming α error probability of 0.05 and effect size f of 0.31 for the repeated measures ANOVA of take-over reaction time and remaining action time. This power analysis used the setting of two measures (two facing conditions) and the assumption of correlation 0.5.
2.4. Procedure
Participants were informed in writing about the tasks of the experiment and the function of the simulated autonomous vehicle. They were informed that the car could drive by itself, but there were situations in which the automation could not handle so that they would be requested to take over control. Before the formal study, participants were provided time to get familiar and practice with the driving simulator. This practice also gave time to identify any motion sickness symptoms with the driving simulator. Participants were told that they could stop their participation at any time if they felt uncomfortable or just wanted to stop. Informed consent was obtained from each participant. This study was reviewed and approved by a research ethics committee at the University of Nottingham Ningbo China.
2.5. Data Analysis
Statistical analysis was performed using SPSS version 21. Repeated measures ANOVA, paired sample T-test and Pearson correlation were conducted to analyze scale variables including take-over reaction time, remaining action time, situation awareness and trust. Generalized Linear Mixed Model was conducted to analyze the binomial variable (crashed or not from each trial).
3. Results
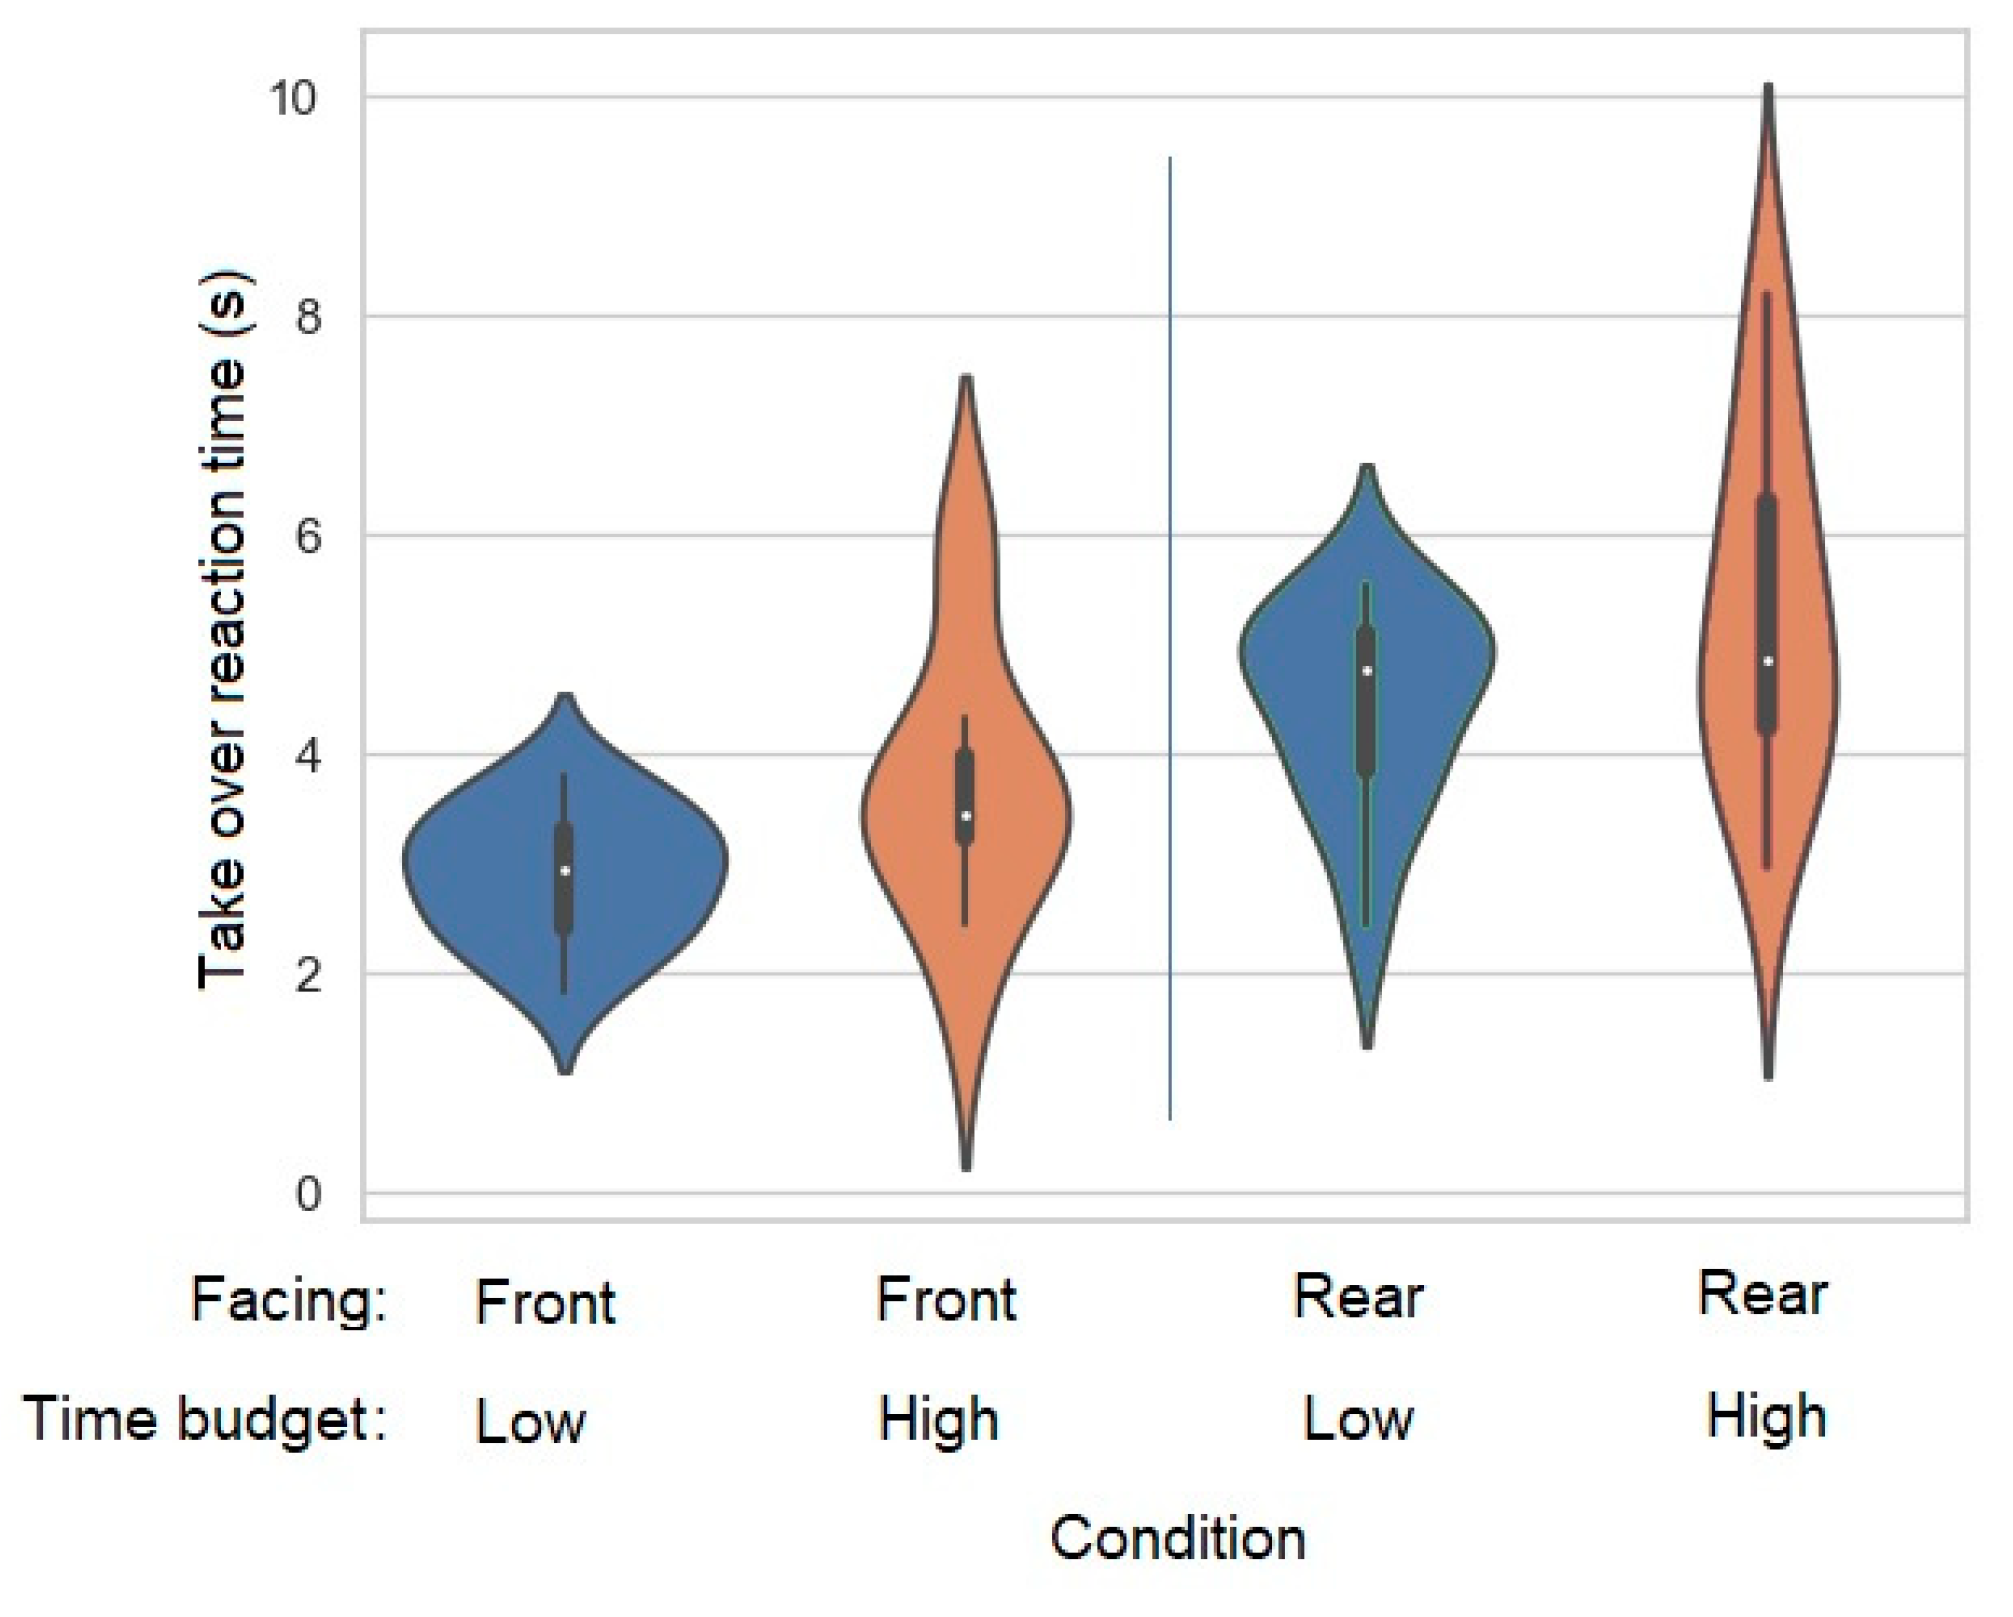
Regarding take over reaction time (Table 1), the front-facing condition was significantly faster than the rear-facing condition, F(1, 11) = 44.462, p < 0.001, ηp2 = 0.802. The effect of time budget was significant, F(1, 11) = 6.693, p = 0.025, ηp2 = 0.378. The interaction effect was not significant, F(1, 11) = 0.020, p = 0.890, ηp2 = 0.002. Comparing front-facing and rear-facing with both seven-second time budget, take-over reaction time from rear-facing is significantly longer by 0.71 s (t(19) = 3.647, p = 0.002, d = 0.816). In comparison to the front-facing condition, the increment of take-over reaction time in the rear-facing condition was about 1.6 s on average. It was significantly shorter than participants’ time needed to physically turn the seat (2.0 s on average; t(64) = 2.229, p = 0.029, d = 0.571). Figure 3 shows the violin plot of take-over reaction time results from different conditions.
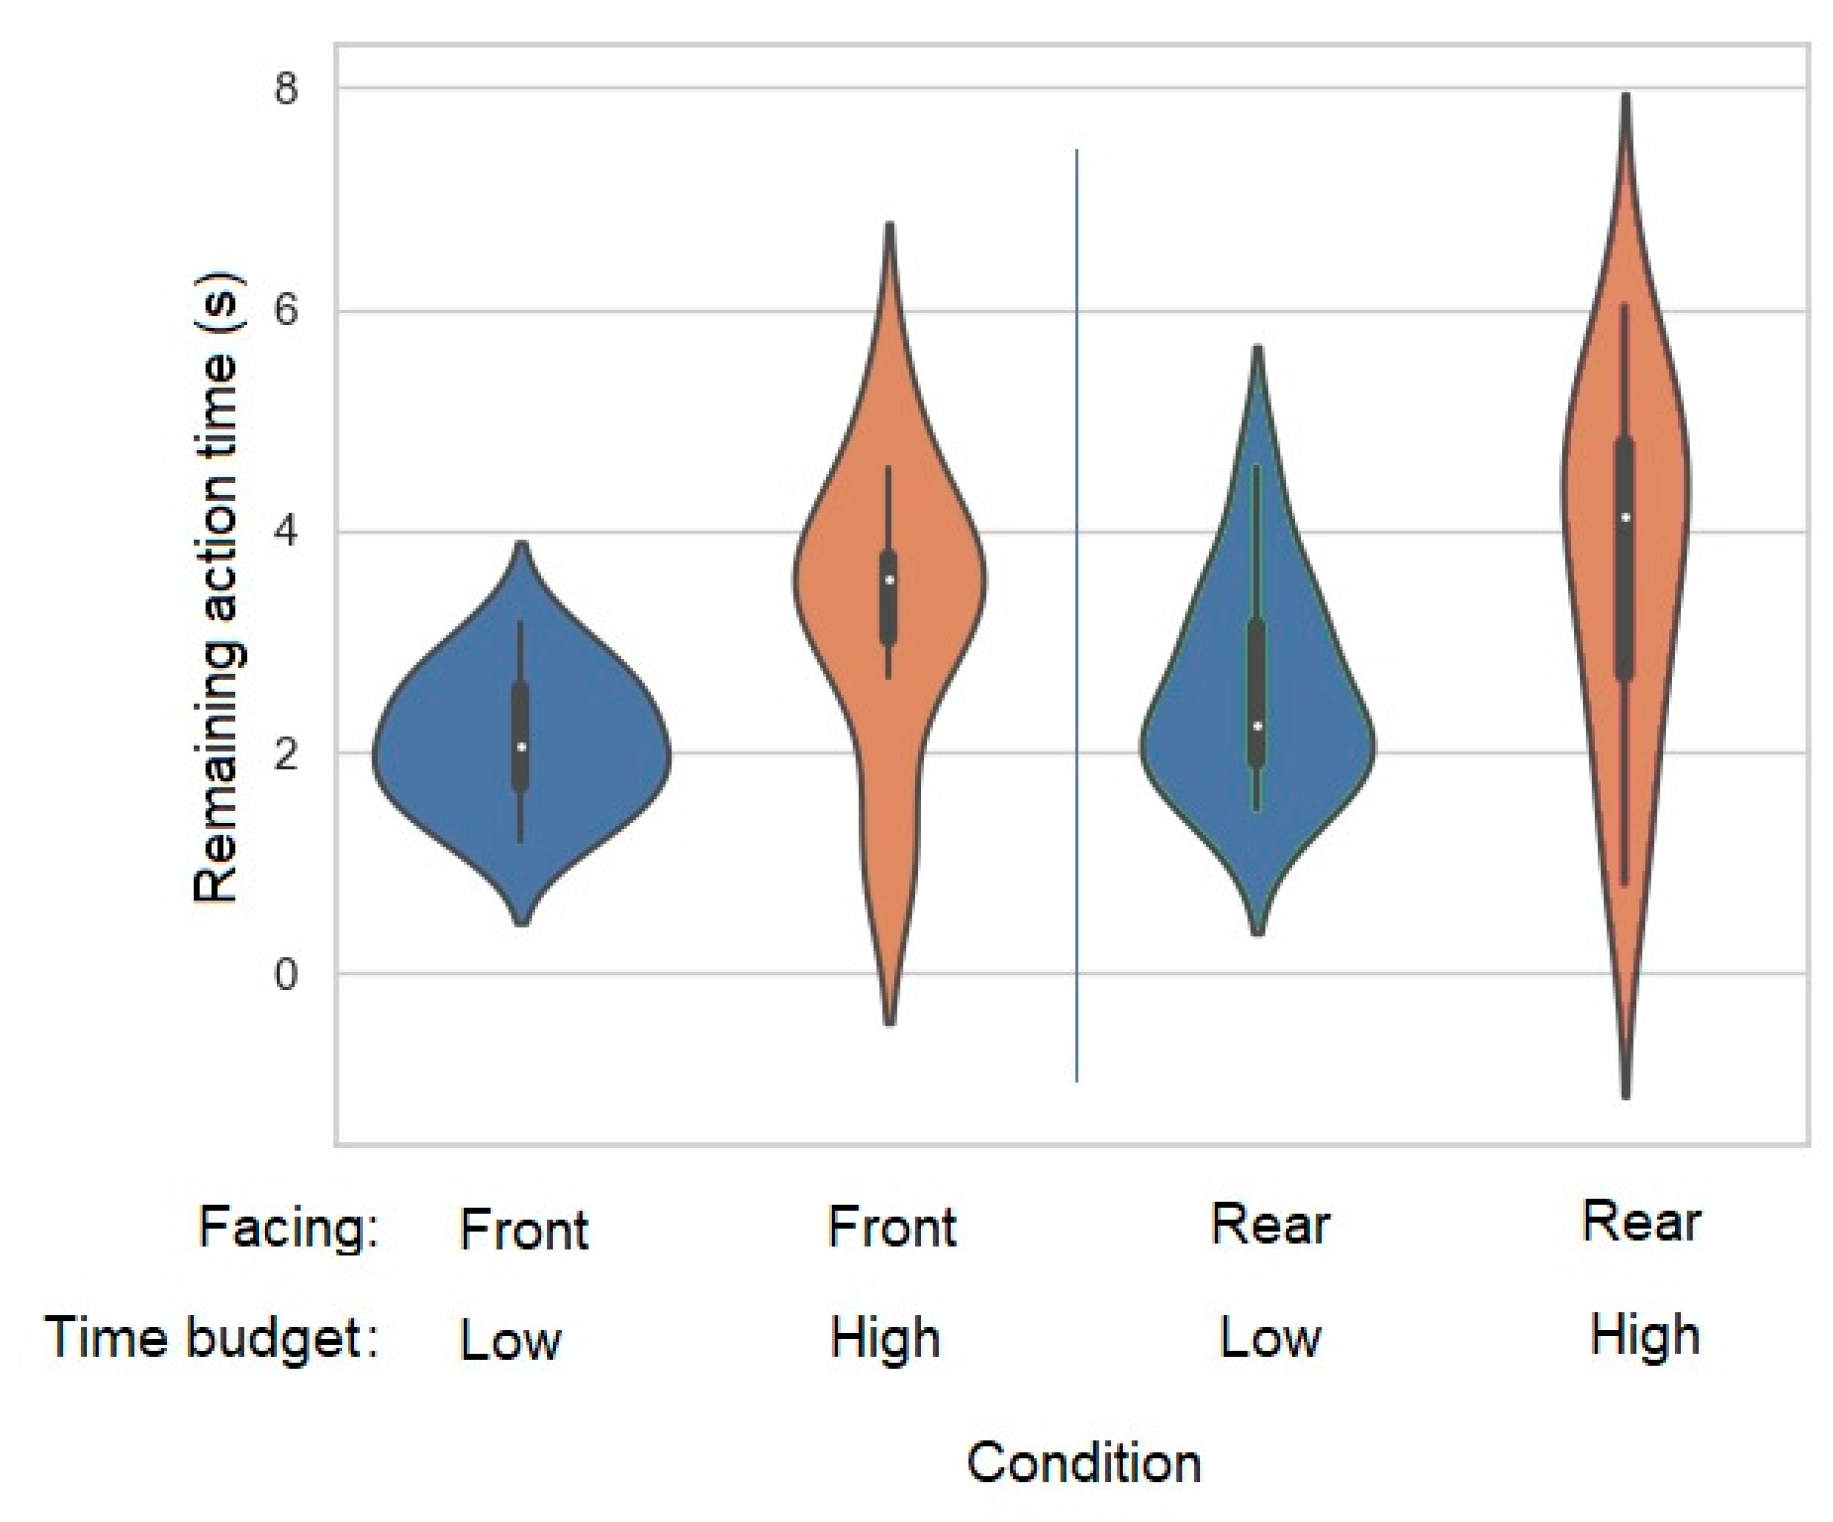
Regarding remaining action time (Table 2), the effect of time budget was significant, F(1, 11) = 12.389, p = 0.005, ηp2 = 0.530. The effect of seat facing was not significant, F(1, 11) = 3.508, p = 0.088, ηp2 = 0.242. The interaction effect was not significant, F(1, 11) = 0.020, p = 0.890, ηp2 = 0.002. Comparing front-facing and rear-facing with both seven-second time budget, remaining action time from rear-facing is significantly shorter by 0.71 s (t(19) = 3.647, p = 0.002, d = 0.816). Figure 4 shows the violin plot of remaining action time results from different conditions.
Regarding the crash result in each trial (crashed or not), Generalized Linear Mixed Model analysis found no significant difference across all the conditions, facing (F(1, 135) = 1.668, p = 0.199), time budget (F(1, 135) = 1.773, p = 0.185), interaction (F(1, 135) = 0.098, p = 0.755). Chi-square test also showed no significant association between test conditions and crash (χ2(3) = 6.750, p = 0.08). Overall, the rate of crash was 11% (front-facing low time budget: 22.2%, front-facing high time budget: 5.6%, rear-facing low time budget: 11.1%, rear-facing high time budget: 5.6%). In comparison, there was no crash in the manual driving baseline condition.
Regarding situation awareness, the effect of task condition was significant when adding the manual driving baseline as a third condition, F(2, 70) = 15.452, p < 0.001, ηp2 = 0.306. Pairwise comparison (Bonferroni adjustment) showed that situation awareness in both autonomous driving conditions (front-facing 51, rear-facing 50, on a scale of 0–100) were significantly lower (t(35) = 4.707, p < 0.001, d = 0.784, two-tailed; t(35) = 4.787, p < 0.001, d = 0.798) than the manual driving condition (61), and there was no significant difference between the two autonomous driving conditions (t(35) = 0.745, p = 1.000).
Regarding automation trust, paired sample T-test showed no significant difference between front-facing (3.8, on a scale of 0–6) and rear-facing (3.6), t(35) = 1.415, p = 0.166 (two-tailed). Pearson correlation was calculated between variables including trust, situation awareness, take-over reaction time, remaining action time and crash rate. Values from different conditions of the same participant were averaged. The results are shown in Table 3. Only the correlation between take-over reaction time and remaining action time was significant (p < 0.01).
4. Discussions
The results confirmed that facing rear with a rotatable driver seat in an SAE Level 3 autonomous vehicle increases take-over reaction time, which is not surprising because physically rotating the seat will take extra time. However, it is important to note that the delay duration (about 1.6 s) was shorter than the time needed to physically turn the seat in the current experiment setup, which is about two seconds on average. This is also noticed in the remaining action time results. When an additional two seconds were added in the high time budget condition to compensate for the time needed to rotate the seat in the rear-facing condition, the remaining action time in the rear-facing conditions became longer than the front-facing conditions. It means that drivers did not fully use the additional two-second compensation. Instead, after turning back to facing front, they took actions faster than they would do in the front-facing conditions. When people feel more stressed, they tend to consider fewer factors in the decision-making process and respond faster [27]. Perhaps the drivers in the current study perceived a higher level of time pressure in the rear-facing conditions because they knew that turning the seat would delay them from taking actions.
When people act faster, it may have the cost of reduced accuracy. This effect is commonly known as the speed-accuracy trade-off effect [28]. Drivers in the rear-facing conditions may sacrifice take-over response quality for faster response speed. The results from the current study showed no significant difference in the crash rate between facing front and rear. This suggests that the effect of a speed-accuracy trade-off, if any, is not large enough to make a difference in crash rate. To analyze more detail of TOR quality, other measures such as minimal time to collision and maximum magnitude of acceleration might be used. These measures may show a difference even when there is no change in crash rate. However, we were not able to collect these measures in the current experiment due to technical limitation of the driving simulator software. Future studies are needed to examine this question further.
When facing front in an autonomous vehicle, a driver’s situation awareness may increase or decrease in comparison to manual driving, depending on the driver’s priority and strategy. If the driver prioritizes monitoring the environment, situation awareness is likely to increase; if the driver prioritizes non-driving related tasks, situation awareness is likely to decrease. However, when facing the rear, drivers do not have the option of monitoring the environment because they cannot see the road and traffic in front of the car. As a result, the rear-facing condition in autonomous vehicles is more likely to result in decreased situation awareness. The current study found that situation awareness in both autonomous vehicle conditions was reduced in comparison to the manual driving baseline condition, but no significant difference between front-facing and rear-facing conditions was found. Since a visually demanding non-driving related task was presented, the results suggest that the participants engaged in the non-driving related task in both autonomous driving conditions, and situation awareness was equally impaired in both conditions.
Regarding automation trust, observing the operation of automation may affect trust, depending on the operation is perceived as positive or negative. Front-facing provides more opportunities for drivers to observe the automation, and in the current experiment, no incident was programmed before the occurrence of TOR. As a result, front-facing may help increase automation trust in this case. However, the results showed no significant difference between front-facing and rear-facing conditions in terms of automation trust. Perhaps the duration of the driving test was relatively short (several minutes for each trial) to make any difference.
Physical movement time and reaction time are affected by individual difference, such as age [29]. Therefore, the interpretation of the current results should be limited to the relatively young sample (average age 32 years). To address this limitation, future studies need to include senior drivers and measure individual factors such as movement time, simple reaction time and anthropometric values. The seat rotation mechanism used in the current prototype was simple. No locking mechanism was implemented, and participants rotated the seat by themselves. The mean turning time duration was 2.0 s (SD = 0.7 s). The turning time factor should be considered when comparing results from different seats in the future.
TOR in SAE Level 3 automation is very difficult to design properly. First, a technical issue is how to predict the events of automation failure or system limit as early and accurately as possible. Second, a human factors issue is how long a human driver needs to be noticed in advance in order to safely take over control from automation. In the current study, we focus on the second issue. If the time budget of TOR is set too short, drivers may not have enough time to respond safely. If the time budget is set too long, drivers may consider it as a false alarm and be bothered. Ideally, automation should dynamically determine the time budget of warning based on the preparedness of drivers, but drivers’ cognitive capability and preparedness at the moment of TOR vary and are difficult to predict. In addition, driver behavior and response after TOR are also affected by the perceived level of urgency. In the case of rear-facing, drivers may feel a higher level of urgency due to the natural understanding of reduced preparedness when facing the rear. In such cases, perhaps a better design is to use a gradual alarm or pre-alarm warning to remind drivers, gradually increase preparedness and avoid overreaction. In this research field, there is also the discussion of avoiding SAE Level 3 automation at all, leaving only lower levels of assistance and higher levels of highly automated cases. However, a manual fallback mechanism may still be needed even for highly automated vehicles. Currently, there is not enough evidence to support an optimal design decision. The concept of rotatable seats must be carefully tested to ensure traffic safety. It may provide better communication experience but may at the same time hinder a driver’s control of the vehicle. Reconfigurable seat designs e.g., [3] need to be compared with other alternatives such as mirrors and cameras installed in a vehicle to support communication among passengers. Data regarding both traffic safety and communication comfort need to be collected to inform designers and regulators. More future research is needed to further investigate these questions. In the current study, the overall crash rate was about 11% in the conditional automation conditions; in contrast, there was no crash in the manual driving baseline condition. This suggests that take-over control actions may be too dangerous when the time budget is short (five to nine seconds in the current study), no matter whether with or without rotatable seats. For automated driving, human take-over control might work for well-planned transitions with a very long time budget, for example, in the event of exiting a highway, which is known in advance, but it may be too dangerous for any emergency situations.
Both motion-based simulators, e.g., [8,9] and fixed-based simulators, e.g., [11,14] have been used to examine driver TOR behavior. Motion-based simulators can provide motion cues such as acceleration, but they are more expensive to operate. In the current study, a fixed-based simulator was used, so the results would not reflect any motion-related factors. Since fixed-based simulators cannot fully represent all the factors in real-world driving, such as stress, motion and vibration, the safety implications of the current results should be interpreted with caution, and the impact of rotatable seats should be further examined in real-world driving to inform automotive manufactures. Hopefully, the current research could provide some discussion and a first step for future work.
In conclusion, the current study showed that in a fixed-based simulator representing a conditionally autonomous car, when using the rear-facing driver seat configuration (where participants rotated the seat by themselves), participants had longer take-over reaction time overall due to physical turning, but they intervened faster after they turned back their seat for take-over response in comparison to the traditional front-facing seat configuration. This behavioral change might be at the cost of reduced take-over response quality. Crash rate was not significantly different in the current laboratory study. A limitation of the current study is that the driving simulator does not support other measures of TOR quality, such as minimal time to collision and maximum magnitude of acceleration. Based on the current study, future studies are needed to further examine the effect of rotatable seat configurations with more detailed analysis of both TOR speed and quality measures as well as in real-world driving conditions for better understanding of their safety implications.
Author Contributions
Conceptualization, S.C., P.T. and X.S.; methodology, S.C., P.T. and X.S.; formal analysis, S.C.; investigation, P.T. and X.S.; resources, X.S.; writing—original draft preparation, S.C.; writing—review and editing, S.C., P.T. and X.S.; project administration, X.S.; funding acquisition, X.S. and S.C. All authors have read and agreed to the published version of the manuscript.
Funding
This work was partially funded by the Natural Sciences and Engineering Research Council of Canada (NSERC) Discovery Grant to S.C. [RGPIN-2015-04134].
Acknowledgments
We would like to thank the Hefeng-Nottingham Innovative Design Lab for funding and supporting this research.
Conflicts of Interest
The authors declare no conflicts of interest. The funders had no role in the design of the study; in the collection, analyses, or interpretation of data; in the writing of the manuscript; or in the decision to publish the results.
References
- SAE International. Taxonomy and Definitions for Terms Related to Driving Automation Systems for On-Road Motor Vehicles; SAE International: Warrendale, PA, USA, 2018. [Google Scholar]
- Pettersson, I.; Karlsson, I.M. Setting the stage for autonomous cars: A pilot study of future autonomous driving experiences. IET Intell. Transp. Syst. 2015, 9, 694–701. [Google Scholar] [CrossRef]
- Cuddihy, M.A.; Rao, M.K. Autonomous Vehicle with Reconfigurable Seats. U.S. Patent 9340126B2, 17 May 2016. [Google Scholar]
- Jorlöv, S.; Bohman, K.; Larsson, A. Seating Positions and Activities in Highly Automated Cars–A Qualitative Study of Future Automated Driving Scenarios. In Proceedings of the International Research Conference on the Biomechanics of Impact, Antwerp, Belgium, 13–15 September 2017; pp. 13–22. [Google Scholar]
- Jin, X.; Hou, H.; Shen, M.; Wu, H.; Yang, K.H. Occupant Kinematics and Biomechanics with Rotatable Seat in Autonomous Vehicle Collision: A Preliminary Concept and Strategy. In Proceedings of the International Research Conference on the Biomechanics of Impact, Athens, Greece, 12–14 September 2018; pp. 106–113. [Google Scholar]
- Eriksson, A.; Stanton, N.A. Takeover time in highly automated vehicles: Noncritical transitions to and from manual control. Hum. Factors 2017, 59, 689–705. [Google Scholar] [CrossRef] [PubMed]
- Happee, R.; Gold, C.; Radlmayr, J.; Hergeth, S.; Bengler, K. Take-over performance in evasive manoeuvres. Accid. Anal. Prev. 2017, 106, 211–222. [Google Scholar] [CrossRef] [PubMed]
- Gold, C.; Damböck, D.; Lorenz, L.; Bengler, K. “Take Over!” How Long Does it Take to Get the Driver Back into the Loop? In Proceedings of the Human Factors and Ergonomics Society Annual Meeting; SAGE Publications Sage CA: Los Angeles, CA, USA, 2013; Volume 57, pp. 1938–1942. [Google Scholar]
- Zeeb, K.; Buchner, A.; Schrauf, M. What determines the take-over time? An integrated model approach of driver take-over after automated driving. Accid. Anal. Prev. 2015, 78, 212–221. [Google Scholar] [CrossRef] [PubMed]
- Gold, C.; Happee, R.; Bengler, K. Modeling take-over performance in level 3 conditionally automated vehicles. Accid. Anal. Prev. 2018, 116, 3–13. [Google Scholar] [CrossRef] [PubMed]
- Wan, J.; Wu, C. The effects of lead time of take-over request and nondriving tasks on taking-over control of automated vehicles. IEEE Trans. Hum. Mach. Syst. 2018, 48, 582–591. [Google Scholar] [CrossRef]
- International Organization for Standardization. Road Vehicles—Ergonomic Aspects of Transport Information and Control Systems—Calibration Tasks for Methods Which Assess Driver Demand Due to the Use of In-Vehicle Systems; ISO: Geneva, Switzerland, 2012. [Google Scholar]
- Mehler, B.; Reimer, B.; Coughlin, J.F.; Dusek, J.A. Impact of incremental increases in cognitive workload on physiological arousal and performance in young adult drivers. Transp. Res. Rec. 2009, 2138, 6–12. [Google Scholar] [CrossRef]
- Deng, C.; Cao, S.; Chaozhong, W.; Nengchao, L. Modeling driver take-over reaction time and emergency response time using an integrated cognitive architecture. Transp. Res. Rec. 2019. [Google Scholar] [CrossRef]
- Parasuraman, R.; Sheridan, T.B.; Wickens, C.D. Situation awareness, mental workload, and trust in automation: Viable, empirically supported cognitive engineering constructs. J. Cogn. Eng. Decis. Mak. 2008, 2, 140–160. [Google Scholar] [CrossRef]
- Endsley, M.R. Situation Awareness Global Assessment Technique (SAGAT). In Proceedings of the IEEE 1988 National Aerospace and Electronics Conference, Dayton, OH, USA, 23–27 May 1988; Volume 3, pp. 789–795. [Google Scholar]
- De Winter, J.C.; Happee, R.; Martens, M.H.; Stanton, N.A. Effects of adaptive cruise control and highly automated driving on workload and situation awareness: A review of the empirical evidence. Transp. Res. Part F Traffic Psychol. Behav. 2014, 27, 196–217. [Google Scholar] [CrossRef] [Green Version]
- Lee, J.D.; See, K.A. Trust in automation: Designing for appropriate reliance. Hum. Factors 2004, 46, 50–80. [Google Scholar] [CrossRef] [PubMed]
- Körber, M.; Baseler, E.; Bengler, K. Introduction matters: Manipulating trust in automation and reliance in automated driving. Appl. Ergon. 2018, 66, 18–31. [Google Scholar] [CrossRef] [PubMed] [Green Version]
- Payre, W.; Cestac, J.; Delhomme, P. Fully automated driving: Impact of trust and practice on manual control recovery. Hum. Factors 2016, 58, 229–241. [Google Scholar] [CrossRef] [PubMed]
- Wintersberger, P.; von Sawitzky, T.; Frison, A.-K.; Riener, A. Traffic Augmentation as a Means to Increase Trust in Automated Driving Systems. In Proceedings of the 12th Biannual Conference on Italian SIGCHI Chapter, Cagliari, Italy, 18–20 September 2017; pp. 1–7. [Google Scholar]
- Yang, Y.; Gerlicher, M.; Bengler, K. How Does Relaxing Posture Influence Take-Over Performance in an Automated Vehicle? In Proceedings of the Human Factors and Ergonomics Society Annual Meeting; SAGE Publications Sage CA: Los Angeles, CA, USA, 2018; Volume 62, pp. 696–700. [Google Scholar]
- Radlmayr, J.; Gold, C.; Lorenz, L.; Farid, M.; Bengler, K. How Traffic Situations and Non-Driving Related Tasks Affect the Take-Over Quality in Highly Automated Driving. In Proceedings of the Human Factors and Ergonomics Society Annual Meeting; Sage Publications Sage CA: Los Angeles, CA, USA, 2014; Volume 58, pp. 2063–2067. [Google Scholar]
- Selcon, S.; Taylor, R.; Shadrake, R. Multi-Modal Cockpit Warnings: Pictures. Words. or Both? In Proceedings of the Human Factors and Ergonomics Society Annual Meeting; SAGE Publications Sage CA: Los Angeles, CA, USA, 1992; Volume 36, pp. 57–61. [Google Scholar]
- Bisantz, A.M.; Seong, Y. Assessment of operator trust in and utilization of automated decision-aids under different framing conditions. Int. J. Ind. Ergon. 2001, 28, 85–97. [Google Scholar] [CrossRef]
- Faul, F.; Erdfelder, E.; Lang, A.-G.; Buchner, A. G* Power 3: A flexible statistical power analysis program for the social, behavioral, and biomedical sciences. Behav. Res. Methods 2007, 39, 175–191. [Google Scholar] [CrossRef]
- Weltman, G.; Smith, J.E.; Egstrom, G.H. Perceptual narrowing during simulated pressure-chamber exposure. Hum. Factors 1971, 13, 99–107. [Google Scholar] [CrossRef] [PubMed]
- Wickelgren, W.A. Speed-accuracy tradeoff and information processing dynamics. Acta Psychol. 1977, 41, 67–85. [Google Scholar] [CrossRef]
- Spirduso, W.W. Reaction and movement time as a function of age and physical activity level. J. Gerontol. 1975, 30, 435–440. [Google Scholar] [CrossRef] [PubMed]
Figure 1.
The driving simulator used in the current study.

Figure 2.
Seat configurations (a) facing rear and (b) facing front.

Figure 3.
Take-over reaction time results from different conditions in violin plot. Median is shown by the white dot. Interquartile range is shown by the black bar. The range between the lower/upper adjacent values is shown by the black line. The violin shape shows the probability density smoothed by kernel density estimation. The plot was generated using the Seaborn library in Python.

Figure 4.
Remaining action time results from different conditions in violin plot. Median is shown by the white dot. Interquartile range is shown by the black bar. The range between the lower/upper adjacent values is shown by the black line. The violin shape shows the probability density smoothed by kernel density estimation. The plot was generated using the Seaborn library in Python.

Figure 5.
Trajectories from the four conditions, (a) front-facing low time budget; (b) front-facing high time budget; (c) rear-facing low time budget, and (d) rear-facing high time budget. The vertical red bar represents the location of the obstacle. Horizontal solid lines represent lane boundaries in the three-lane setup. Horizontal dash lines represent lane centres. The width of a lane was 4 m.


Table 1.
Take-over reaction time results from different conditions.
| Take over Reaction Time (s) | Time Budget Low | Time Budget High |
|---|---|---|
| Front-facing | Mean = 2.89 s; Max = 3.81 s 95% CI (2.55 s, 3.23 s) | Mean = 3.71 s; Max = 5.95 s 95% CI (3.02 s, 4.40 s) |
| Rear-facing | Mean = 4.42 s; Max = 5.52 s 95% CI (3.91 s, 4.94 s) | Mean = 5.30 s; Max = 8.19 s 95% CI (4.41 s, 6.19 s) |
Note: For the front-facing condition, low time budget had five seconds, whereas high time budget had seven seconds. For the rear-facing condition, a low time budget of seven seconds and a high time budget of nine seconds were used. The time compensation of two seconds was determined by measuring participants’ average time needed to complete turning the seat.
Table 2.
Remaining action time results from different conditions.
| Remaining Action Time (s) | Time Budget Low | Time Budget High |
|---|---|---|
| Front-facing | Mean = 2.11 s; Min = 1.19 s 95% CI (1.77 s, 2.45 s) | Mean = 3.29 s; Min = 1.05 s 95% CI (2.60 s, 3.98 s) |
| Rear-facing | Mean = 2.58 s; Min = 1.48 s 95% CI (2.06 s, 3.09 s) | Mean = 3.70 s; Min = 0.81 s 95% CI (2.81 s, 4.59 s) |
Note: For the front-facing condition, low time budget had five seconds, whereas high time budget had seven seconds. For the rear-facing condition, a low time budget of seven seconds and a high time budget of nine seconds were used. The time compensation of two seconds was determined by measuring participants’ average time needed to complete turning the seat.
Table 3.
Pearson correlation between variables.
| r | Trust | Situation Awareness | Take Over Reaction Time | Remaining Action Time | Crash Rate |
|---|---|---|---|---|---|
| Trust | - | 0.135 | 0.208 | −0.143 | 0.230 |
| Situation awareness | - | 0.227 | −0.324 | 0.126 | |
| Take over reaction time | - | −0.904 ** | −0.059 | ||
| Remaining action time | - | 0.169 | |||
| Crash rate | - |
** p < 0.01.
© 2020 by the authors. Licensee MDPI, Basel, Switzerland. This article is an open access article distributed under the terms and conditions of the Creative Commons Attribution (CC BY) license (http://creativecommons.org/licenses/by/4.0/).
Share and Cite
MDPI and ACS Style
Cao, S.; Tang, P.; Sun, X. Driver Take-Over Reaction in Autonomous Vehicles with Rotatable Seats. Safety 2020, 6, 34. https://0-doi-org.brum.beds.ac.uk/10.3390/safety6030034
AMA Style
Cao S, Tang P, Sun X. Driver Take-Over Reaction in Autonomous Vehicles with Rotatable Seats. Safety. 2020; 6(3):34. https://0-doi-org.brum.beds.ac.uk/10.3390/safety6030034
Chicago/Turabian StyleCao, Shi, Pinyan Tang, and Xu Sun. 2020. "Driver Take-Over Reaction in Autonomous Vehicles with Rotatable Seats" Safety 6, no. 3: 34. https://0-doi-org.brum.beds.ac.uk/10.3390/safety6030034
Note that from the first issue of 2016, this journal uses article numbers instead of page numbers. See further details here.