Effectiveness Evaluation of Section Speed Control in Czech Motorway Work Zones


CDV—Transport Research Centre, Líšeňská 33a, 63600 Brno, Czech Republic
*
Author to whom correspondence should be addressed.
Safety 2020, 6(3), 38; https://0-doi-org.brum.beds.ac.uk/10.3390/safety6030038
Submission received: 26 June 2020
/
Revised: 29 July 2020
/
Accepted: 13 August 2020
/
Published: 15 August 2020
Abstract
:The goal of section speed control is to increase speed limit compliance in the monitored road sections, decrease speed variance and improve traffic safety. General experience with section speed control on motorways is positive, with significant improvements in both speed and safety performance. The presented study focused on a unique application of section speed control in motorway work zones in the Czech Republic. Effectiveness was monitored (in terms of average speed, speeding and accident rates) in three sections and four time periods (normal operation, work zone, work zone with section speed control, normal operation), which allowed discerning individual effects of work zone and section speed control. In addition, a novel data source—floating car data—was used. Work zones were found to increase accident rates compared to normal operation and decrease with the introduction of section speed control. The effects on average speed, speed variance and speeding were positive, although smaller compared to the studies conducted in non-work zone conditions.
1. Introduction
Speed has been recognised as the most influential risk factor. Internationally, speed is an essential contributory factor in around 30% of fatal accidents [1]. This proportion may be even higher, for example, on Czech roads, speeding has been attributed to approx. 40% of fatal accidents in recent years, making it the most frequent cause of road deaths. One of the speed management techniques is section speed control (SSC), also known as average speed enforcement (ASE). The goal of SSC is to increase speed limit compliance in the monitored road sections and thus decrease speed variance and improve traffic safety. The SSC system involves the installation of a series of cameras along a motorway section. The cameras detect and identify vehicles through automatic number plate recognition and optical character recognition. Using time of such detections and the distance between them, the average speed of a vehicle is calculated. If the corresponding average speed of a vehicle exceeds the legal posted speed limit for that road section, image and offence data are transmitted to a central processing unit via a communication network [2].
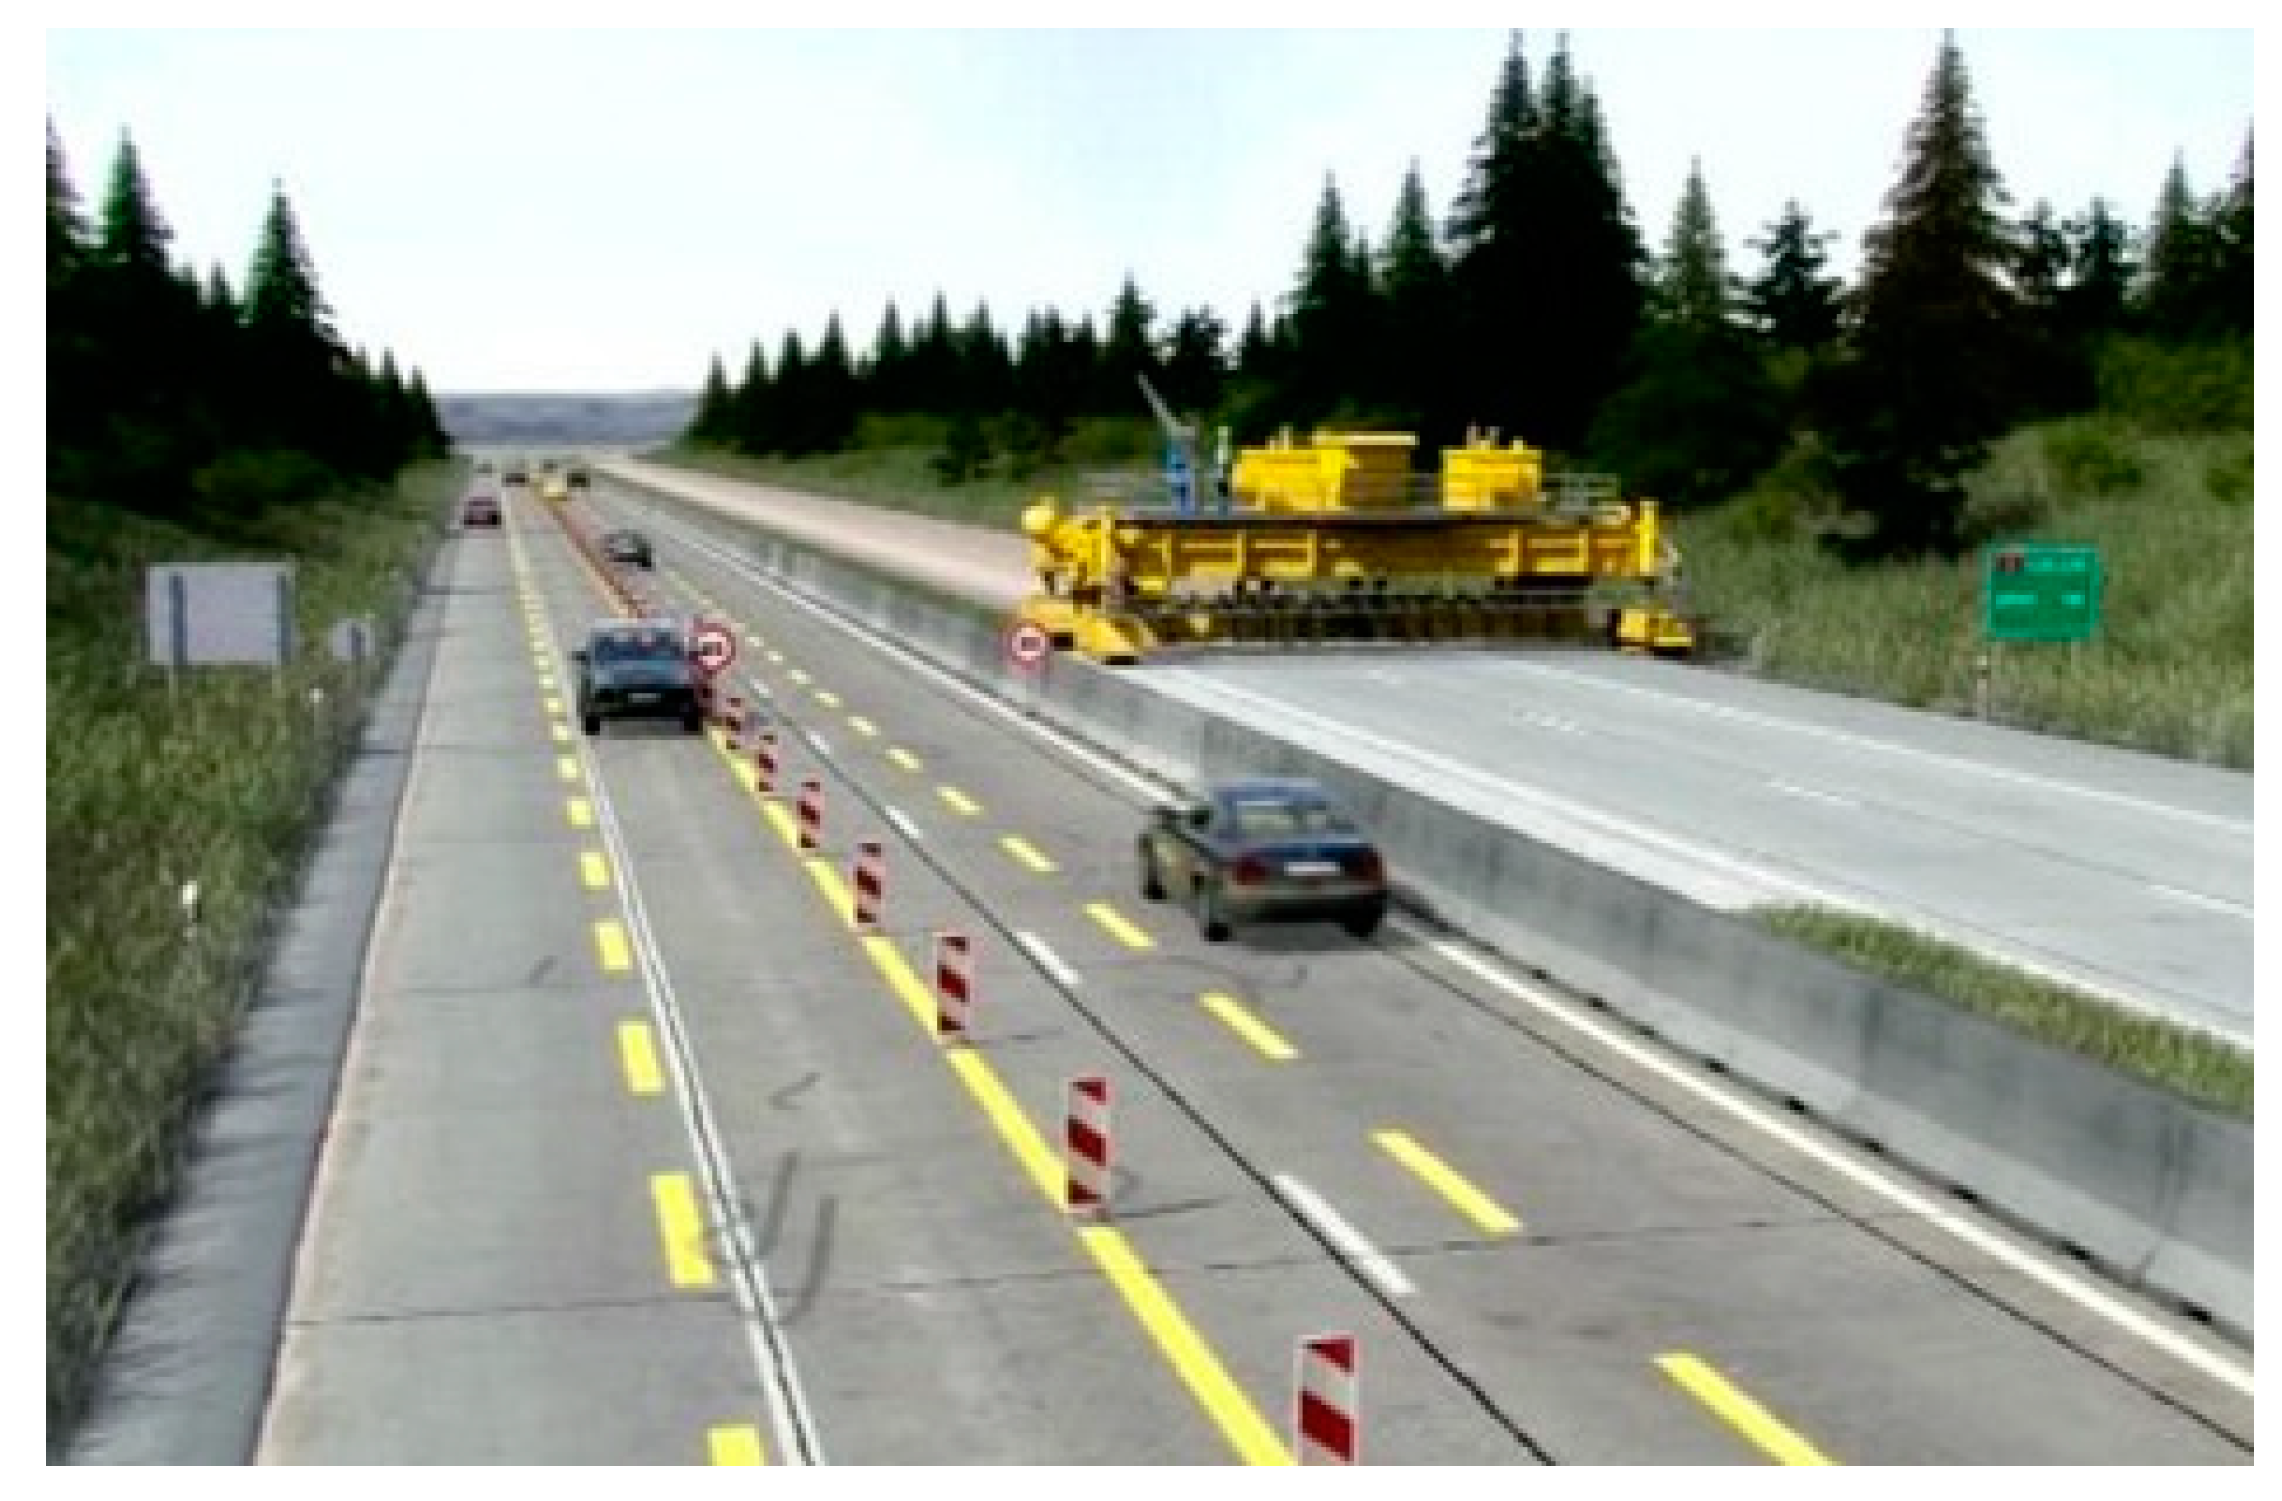
Various international studies focused on the effectiveness of SSC in terms of the reduction of average speed and/or accident frequency. Their experience was generally positive—significant reductions in both speeds and accidents were found. However, SSC on Czech roads has not been evaluated yet. In addition, local SSC is currently used in work zones with reduced lane number and width (see Figure 1), where driving is likely to be different from normal motorway operation. To the authors’ best knowledge, no application of SSC in a motorway work zone was reported or evaluated in international literature. The presented study aimed to fill this gap by assessing the effectiveness of SSC in selected Czech motorway work zones.
2. Literature Review
As mentioned, a number of international studies focused on effectiveness of SSC in terms of the reduction of average speed and/or accident frequency and found generally positive results, i.e., both speed and accident reductions. Several examples may be listed:
- De Pauw et al. [3] evaluated the effect of SSC on driving speed in two Belgian motorway locations. Speed was monitored 6 km upstream and downstream from the sections. Through comparing the conditions before and after SSC, considerable decreases were found of about 6 km/h in the average speed, and 74% in the odds of drivers exceeding the speed limit. In addition, a decrease in the speed variability was observed.
- In Norway, Høye [4] studied the effects of SSC in 14 sites, using an empirical Bayes before-after study. The number of killed or severely injured was found to be significantly reduced by 49% at the SSC sites—the author even stated that the accident reductions were larger than one would expect as a result from the speed reductions.
- Montella et al. [5] investigated SSC in seven sections on two Italian motorways. They observed large reductions in the number of severe violations (84% and 77% in the number of light and heavy vehicles exceeding the speed limits more than 20 km/h), as well as the decrease in the standard deviation of speeds (26% and 20% for light and heavy vehicles).
Some studies collected speeds from floating car data (FCD), i.e., continuous position recordings of vehicle fleets. In contrast to traditional evaluations, based only on selected road locations, FCD enable studying continuous speed profiles and indicating for example so called “kangaroo jumps” (V-shaped speed profiles) and long-term (halo) effects [6,7].
3. Data Collection
3.1. Data Collection Frames
Before data collection, both time and spatial data collection frames were defined.
3.1.1. Time Frame
To be able to discern the individual effects of work zone and section speed control (SSC), we considered four time periods: Normal operation “before”; work zone; work zone with SSC; normal operation “after”. Table 1 presents the overview of time periods, together with their graphical symbols.
Using the defined time periods (TPs), we planned to compare changes in driving behaviour and safety as follows:
- TP1 → TP2 … a change due to installation of a work zone.
- TP2 → TP3 … a change due to start of SSC.
- TP3 → TP4 … a change due to removal of a work zone and SSC.
In addition, cumulative changes could be analysed, such as:
- TP1 × TP3 … a change due to installation of a work zone and section speed control.
- TP1 × TP4 … behavioural adaptation back into the uninfluenced conditions.
Time frames were defined with a goal to maximise the overlaps of all utilised datasets. Complete duration of time periods TP2 and TP3 was defined based on information provided by Road and Motorway Directorate. Normal operation time periods TP1 and TP4 were defined as 3-month periods. The final dates of each time period are summarised in Figure 2.
Time periods were usually without interruption. One exception is a break between TP2 and TP3 in section 06, during which operation was normal—this break was analysed as an independent time period.
3.1.2. Spatial Frame
At the time of the study, three sections with a history of section speed control were available for analysis. These sections were on the main Czech motorway D1, which connects the capital city Prague with the second largest city Brno. The sections were labelled by their numbers 06, 20, 25. Basic characteristics are listed in Table 2.
The spatial frame of the sections was defined by work zone lengths. To enable detecting potential speed changes before and after work zones, the length was extended by 1 km upstream and downstream of work zones.
Within the defined time and spatial frames, four sources of data were retrieved: Traffic volumes, speed, speeding offences and accidents.
3.2. Traffic Volumes
Our original idea was to use the number of vehicles, identified by SSC (maintained by Road and Motorway Directorate), as an indicator of traffic volume. However, we found that SSC data had frequent outages and some archival data were unavailable. Therefore, we had to use AADT values from 2016 national traffic census as an alternative indicator. The original values were factored up to a level of analysis year and split evenly between driving directions, following Czech technical guidelines, based on adjustment factors derived from traffic forecasts [9,10].
3.3. Speed
Operating speeds were obtained from floating car data (FCD), purchased from a third party. The FCD sample was collected from approx. 40,000 vehicles, of which approx. 80% were personal vehicles). Speed precision was estimated as ±2 km/h.
Data consisted of anonymised vehicle ID, date and time, longitude, latitude and speed. Data recording frequency varied between 5 and 60 s. In each section, data from more than 30,000 vehicles was used (between 1000 and 2000 drives in each analysed day)—for details, see Table 3.
3.4. Speeding Offences
Czech Road Act distinguishes speeding offences categories based on three thresholds above the speed limit:
- Category 1: More than 10 km/h above but less than 30 km/h above the speed limit.
- Category 2: 30 km/h and more above the speed limit.
- Category 3: 50 km/h and more above the speed limit.
Using the work zone speed limit 80 km/h and speeding enforcement tolerance (+3 km/h up to 100 km/h; +3% above 100 km/h), the following speed offence categories are relevant for SSC:
- Category 1: 95–113 km/h.
- Category 2: 114–133 km/h.
- Category 3: ≥134 km/h.
Data from SSC are sent to traffic police and then transferred to responsible municipalities. We requested data from four relevant municipalities.
3.5. Accidents
The basic information on accidents in analysed road sections was retrieved from a public on-line portal JDVM (http://www.jdvm.cz/). Further details on selected accidents were obtained from Traffic Police.
4. Analysis
Analysis is described in three subsections: (1) speed analysis, (2) analysis of speeding offences, and (3) analysis of accident rates. Considering time frame of analysis and data character, selected time units were weeks (in analyses 1 and 2) or months (in analysis 3).
4.1. Average Speed Analysis
Based on floating car data, we analysed average speed, using two kinds of speed profiles: Speed profile “in time” and speed profile “in length”.
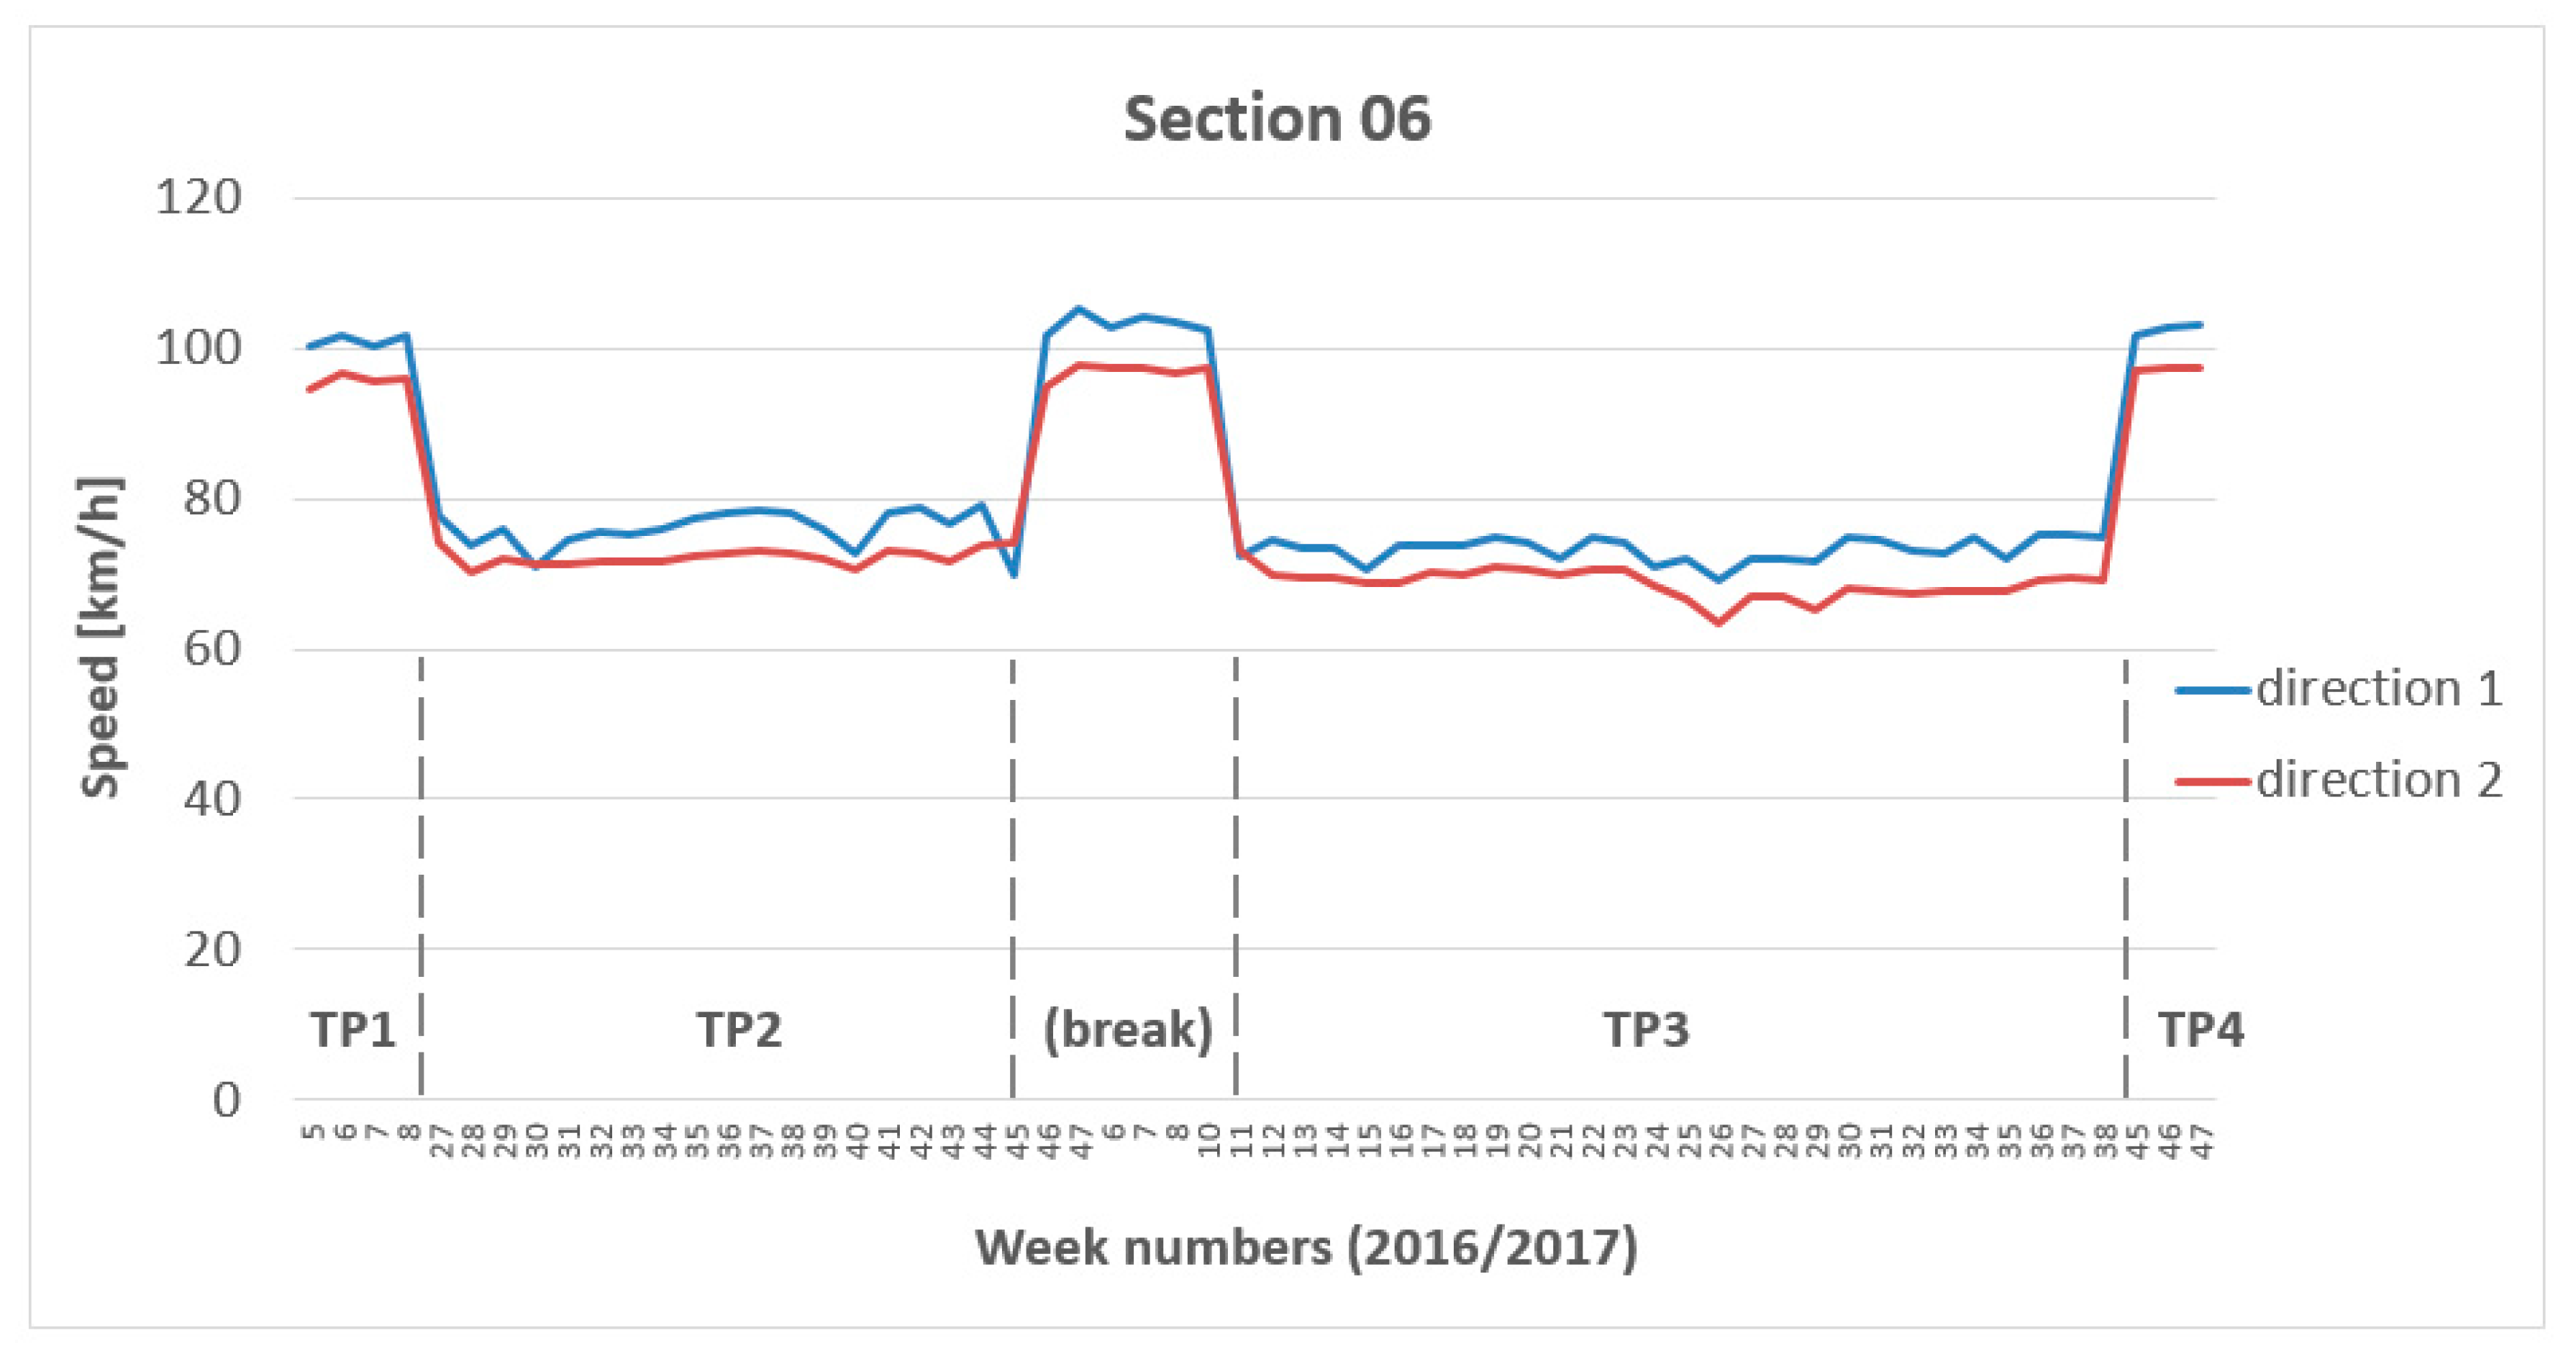
The first example—speed profile “in time” (Figure 3)—illustrates changes between time periods: speed decrease due to a work zone, followed by an additional decrease due to section speed control. During normal operation (first and final time periods, as well as a break in the middle), the speeds were relatively similar.
The second example (Figure 4) presents a graph of the standard deviation of average speed (speed variance), which is relatively similar to the previous speed profile (Figure 3).
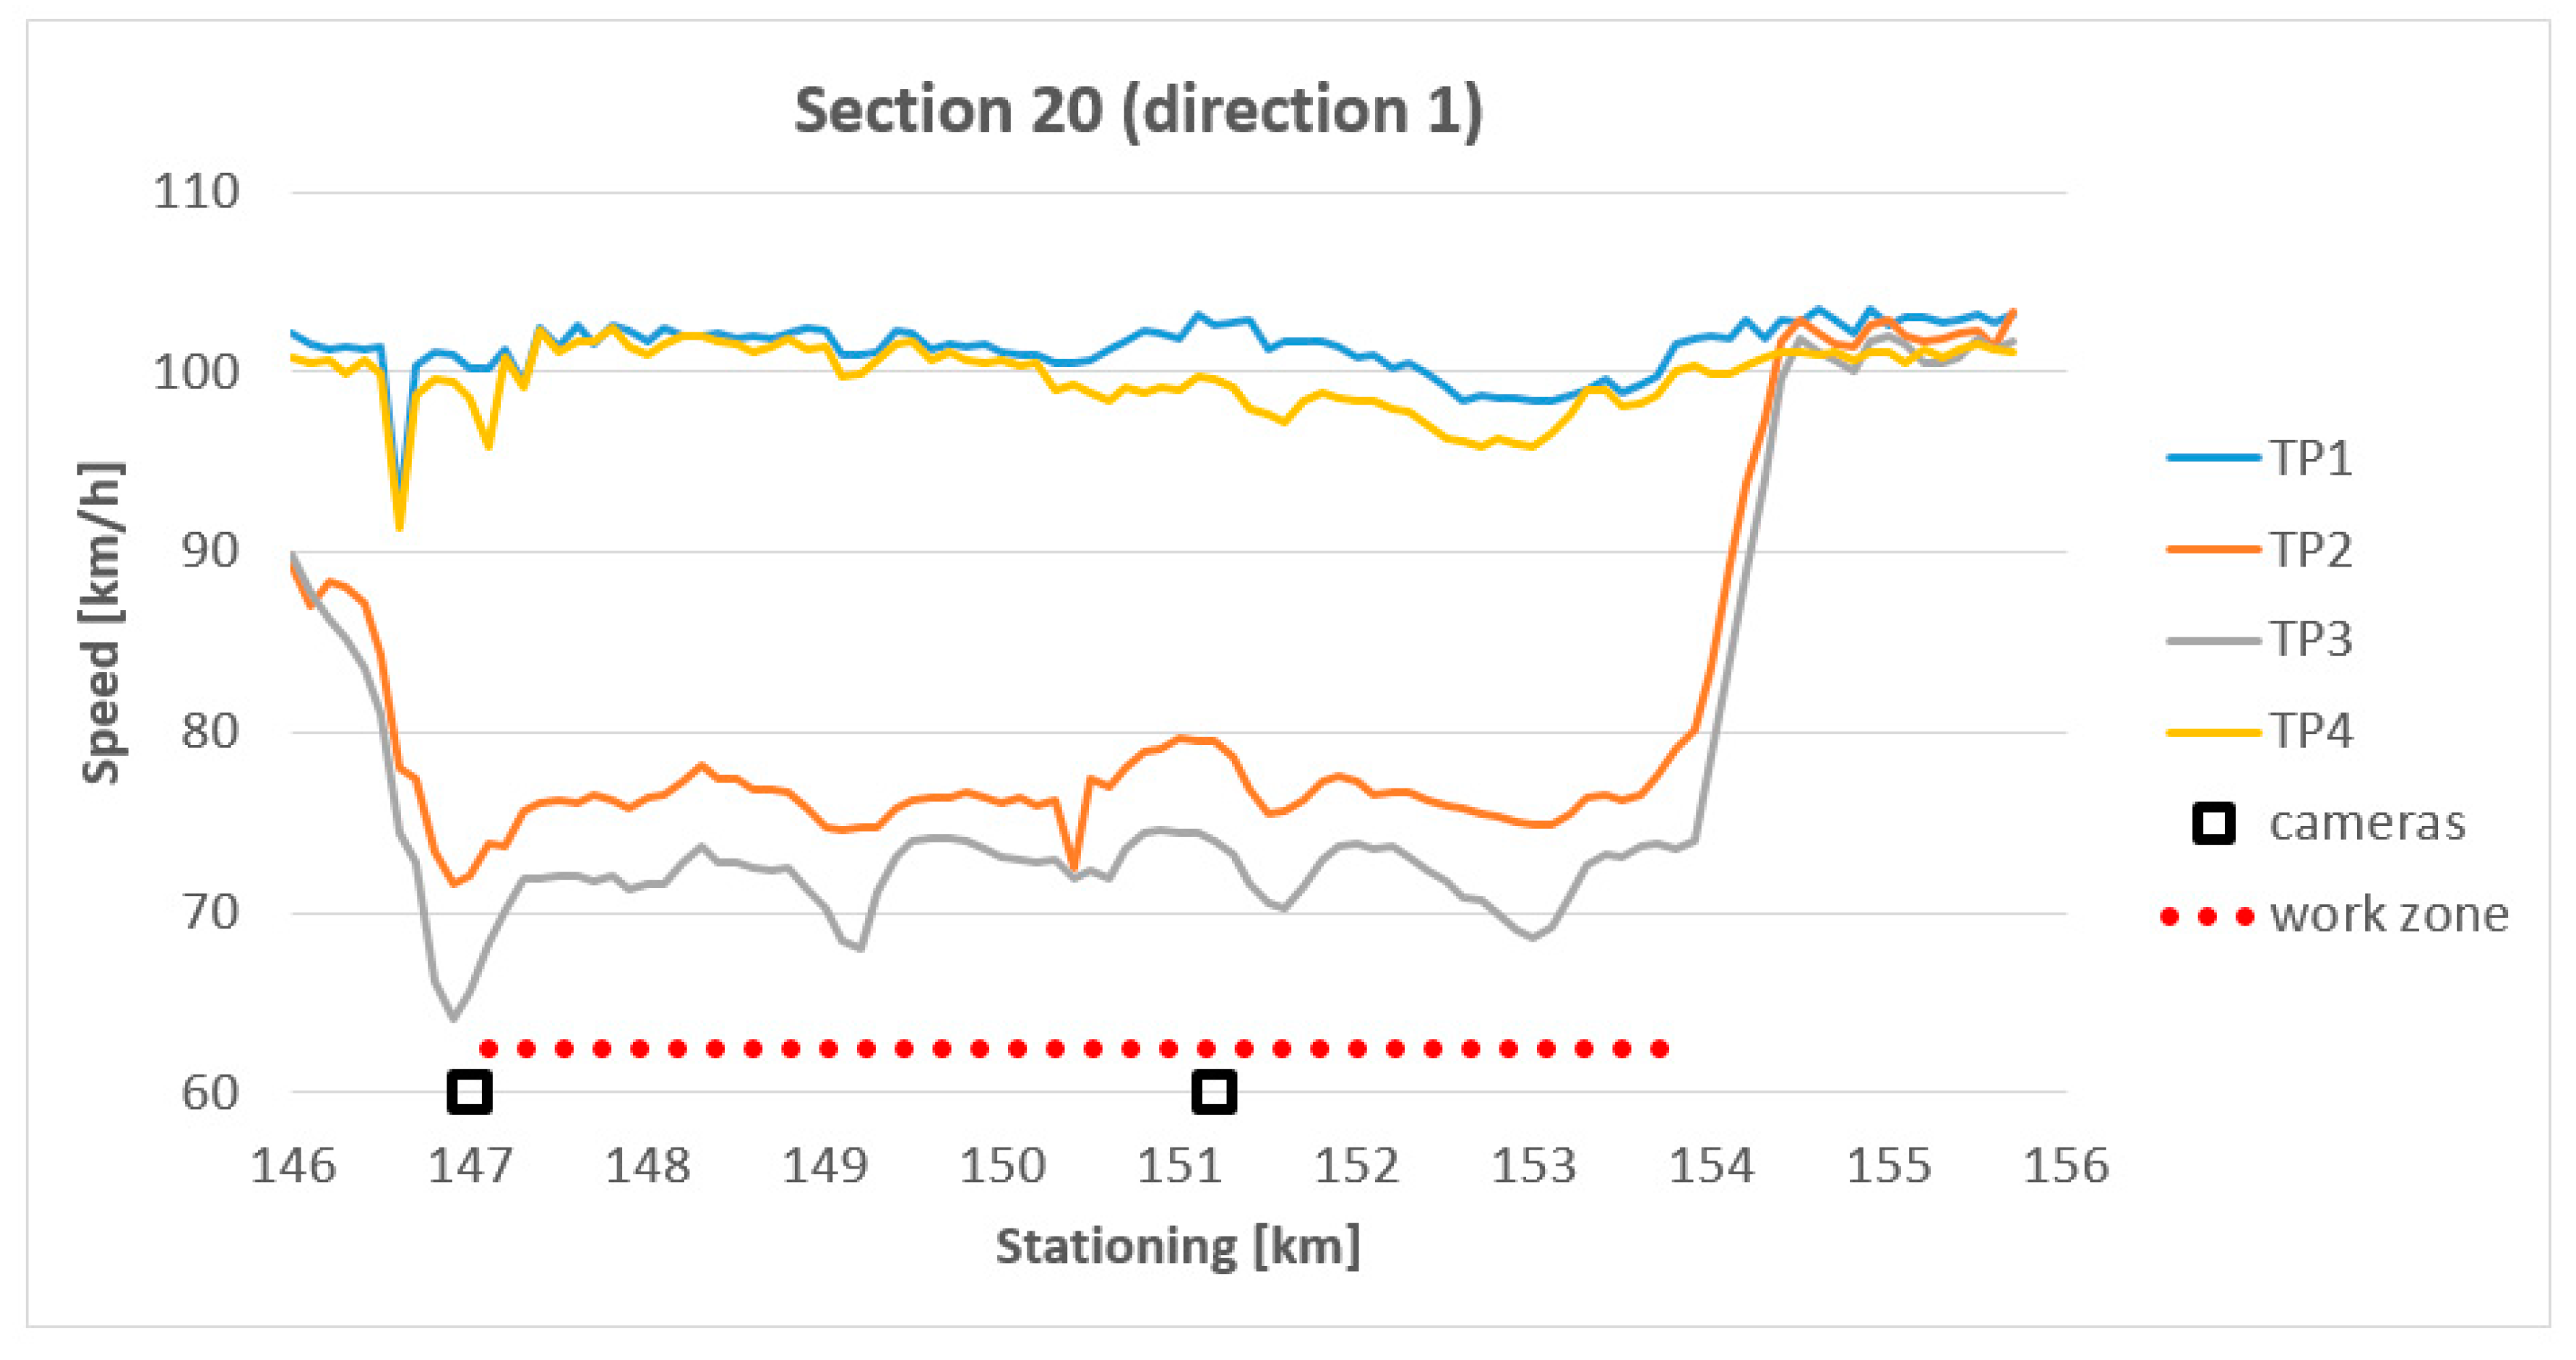
The third example—speed profile “in length” (Figure 5)—also illustrates the differences between time periods. It also shows that the remarkable speed decreases occur in the beginning and the end of a work zone (i.e., independently on the location of SSC cameras).
Using mean indicator values per time periods, the following results were obtained:
- The effect of work zones (i.e., transition between time periods TP1 → TP2) was associated with a speed decrease by approx. 20 km/h.
- With introduction of SSC (TP2 → TP3), speed dropped by additional approx. 3 km/h.
- Speeds “after SSC” (TP4) were similar to speeds “before SSC” (TP1).
- Both work zones and SSC were thus associated with speed reduction; the same effect was found for standard deviation of speed (speed variance).
4.2. Analysis of Speeding Offences
Originally, we planned to distinguish individual speeding categories, as defined in Section 3.4. However, since over 95% of offences were in category 1, we analysed the sample as a whole. We used the indicator of speeding rate, defined as a number of speeding records divided by traffic volume.
The speeding rates were up to 3.5%. Interestingly, common (non-work zone) speeding rates, based on information from traffic police section speed cameras, are only around 0.9% [11].
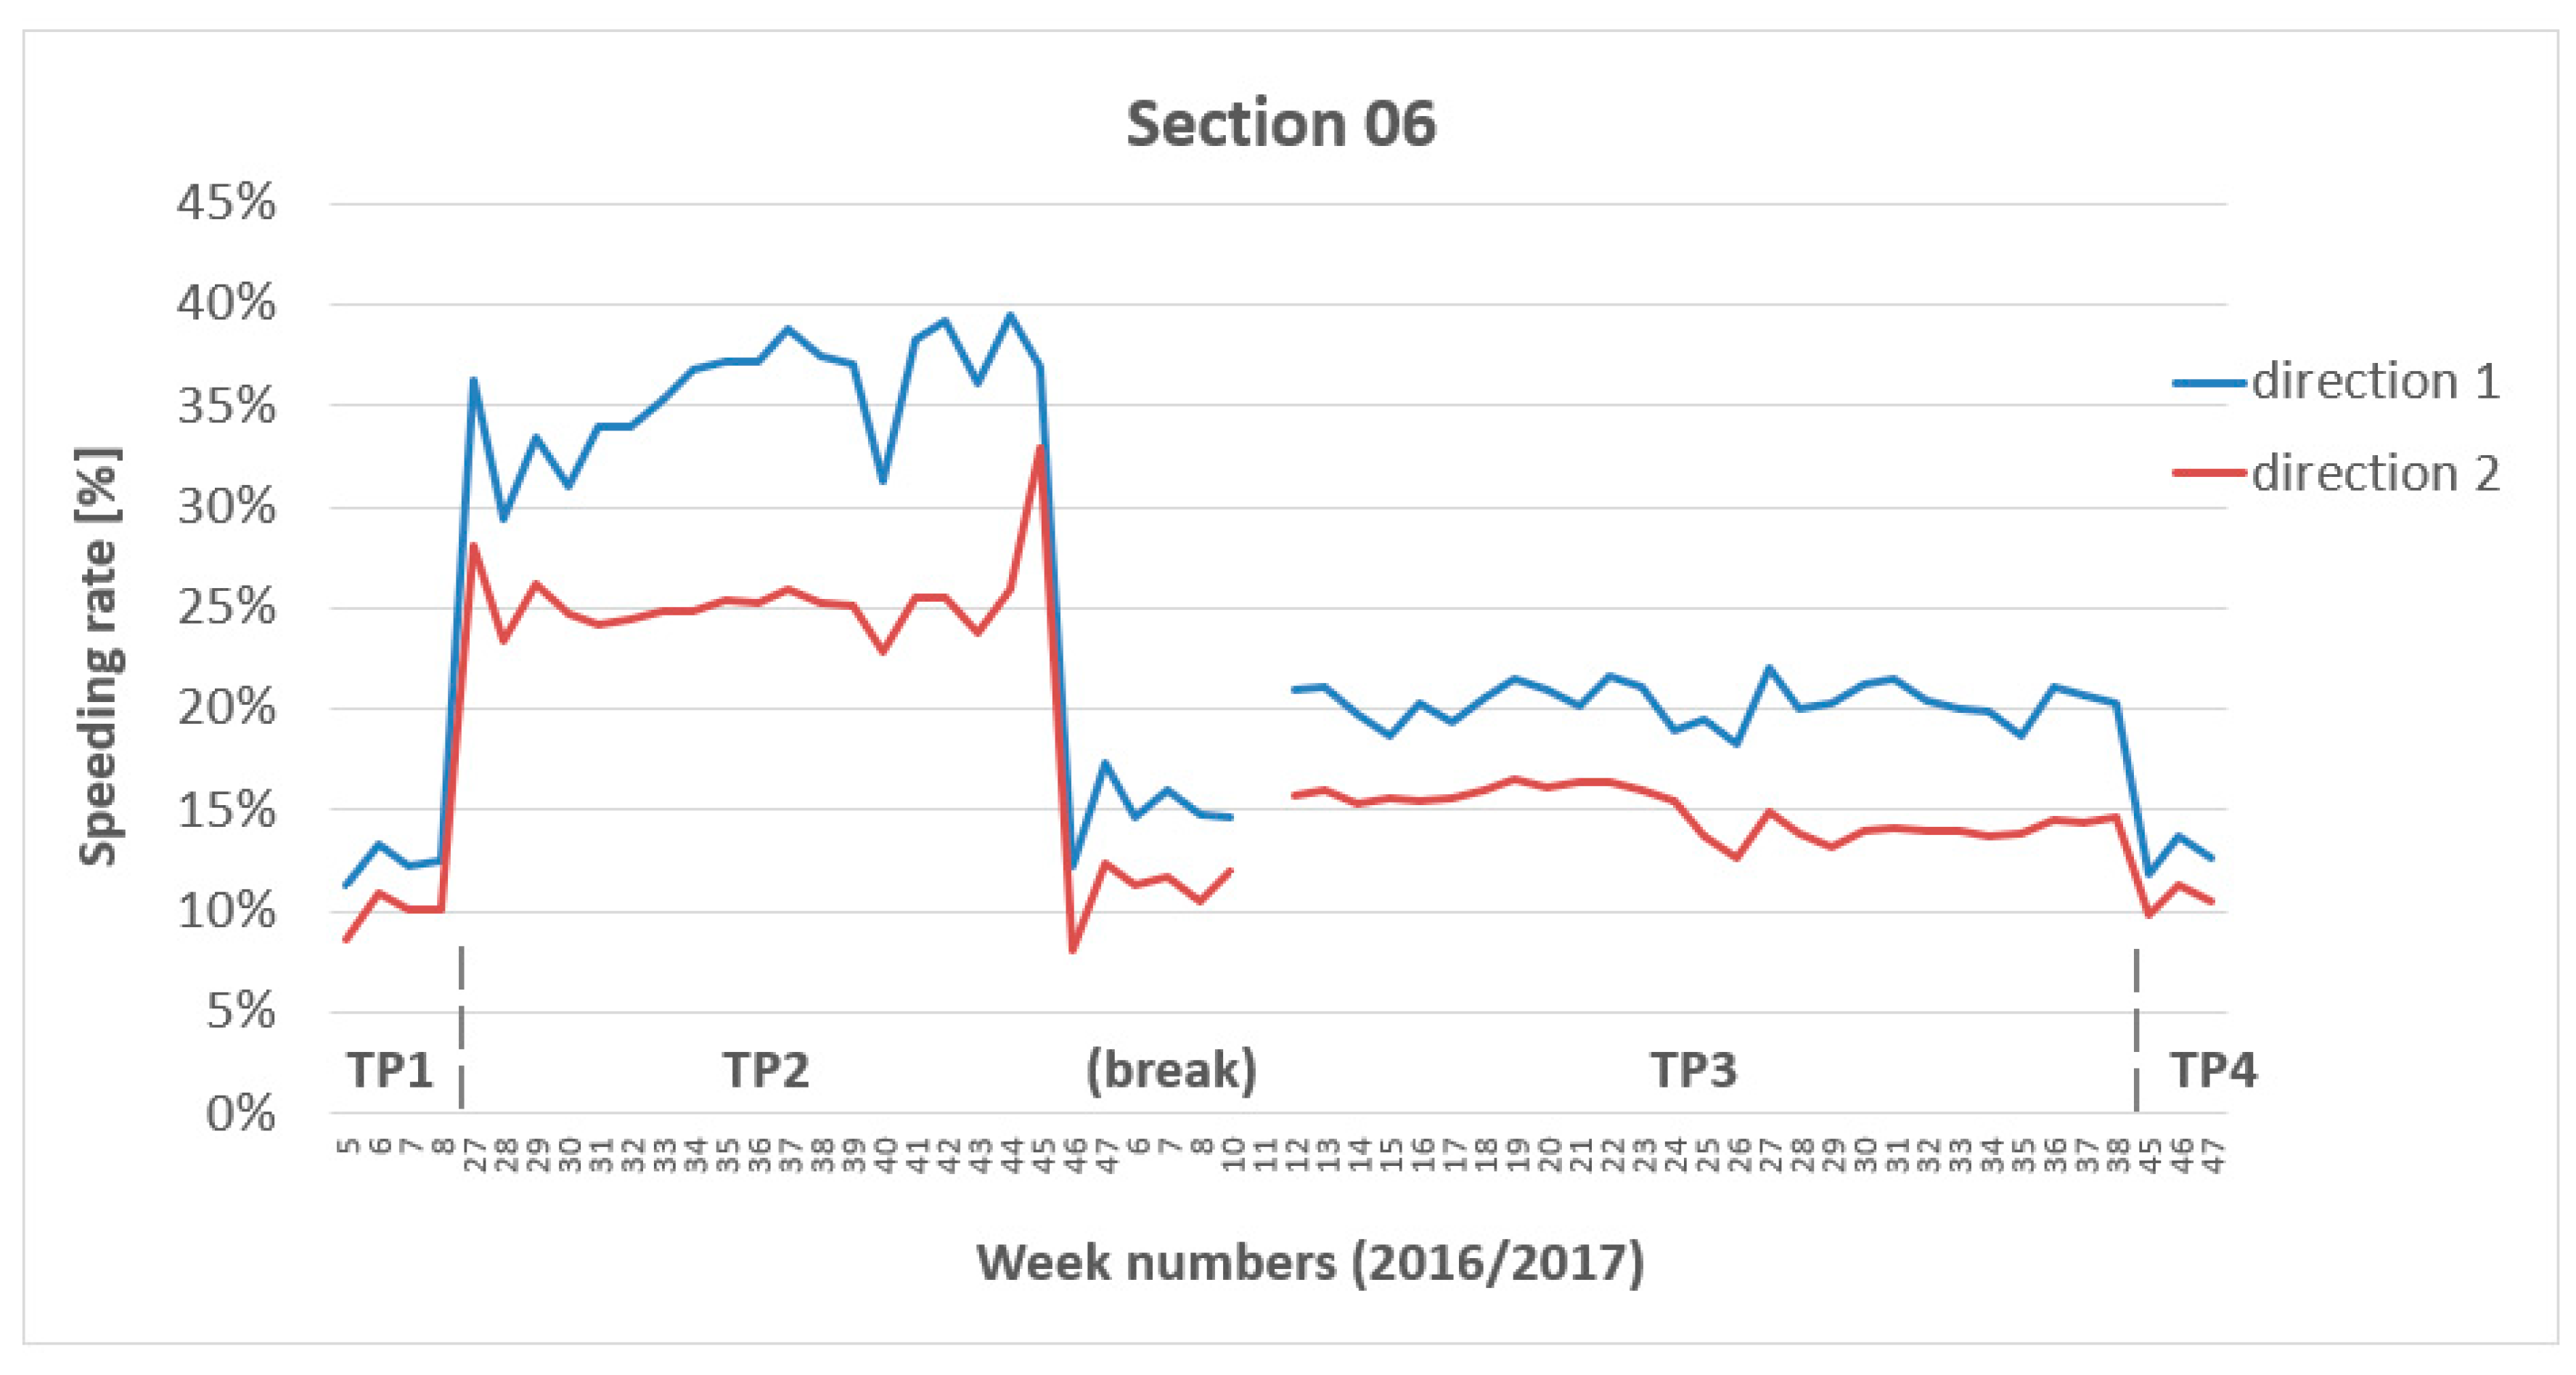
Nevertheless, information from SSC itself does not allow quantifying speeding in non-SSC time periods. Therefore, an alternative approach was also used—calculating speeding rate from floating car data, defined as number of records above the speed limit divided by traffic volume. While this resulted in values, incompatible with the above-mentioned speeding rates, this approach enabled comparison across all time periods. The speeding rates were around 30% during work zone regime, and 20% under section speed control. An example graph is in Figure 6.
4.3. Analysis of Accident Rates
Firstly, several cases of accidents not related to motorway operation (e.g., on interchanges, fuel stations, resting areas) were discarded. The remaining 100 accidents were analysed.
Secondly, relative proportions of accident severity levels and accident types were compared to population (national motorway accident statistics 2006–2007) using a chi-square test. While severity categories were consistent across population and sample (see Table 4), there were some statistically significant differences regarding accident types (Table 5): the ratio between single-vehicle and side-swipe accidents was 16%:60% in the studies sample, but almost the opposite (approx. 70%:9%) in the population. The study of accident reports revealed that the overrepresented side-swipe accidents were without injuries, due to the inattention of drivers, who were not used to parallel driving or overtaking in narrow work zone lanes.
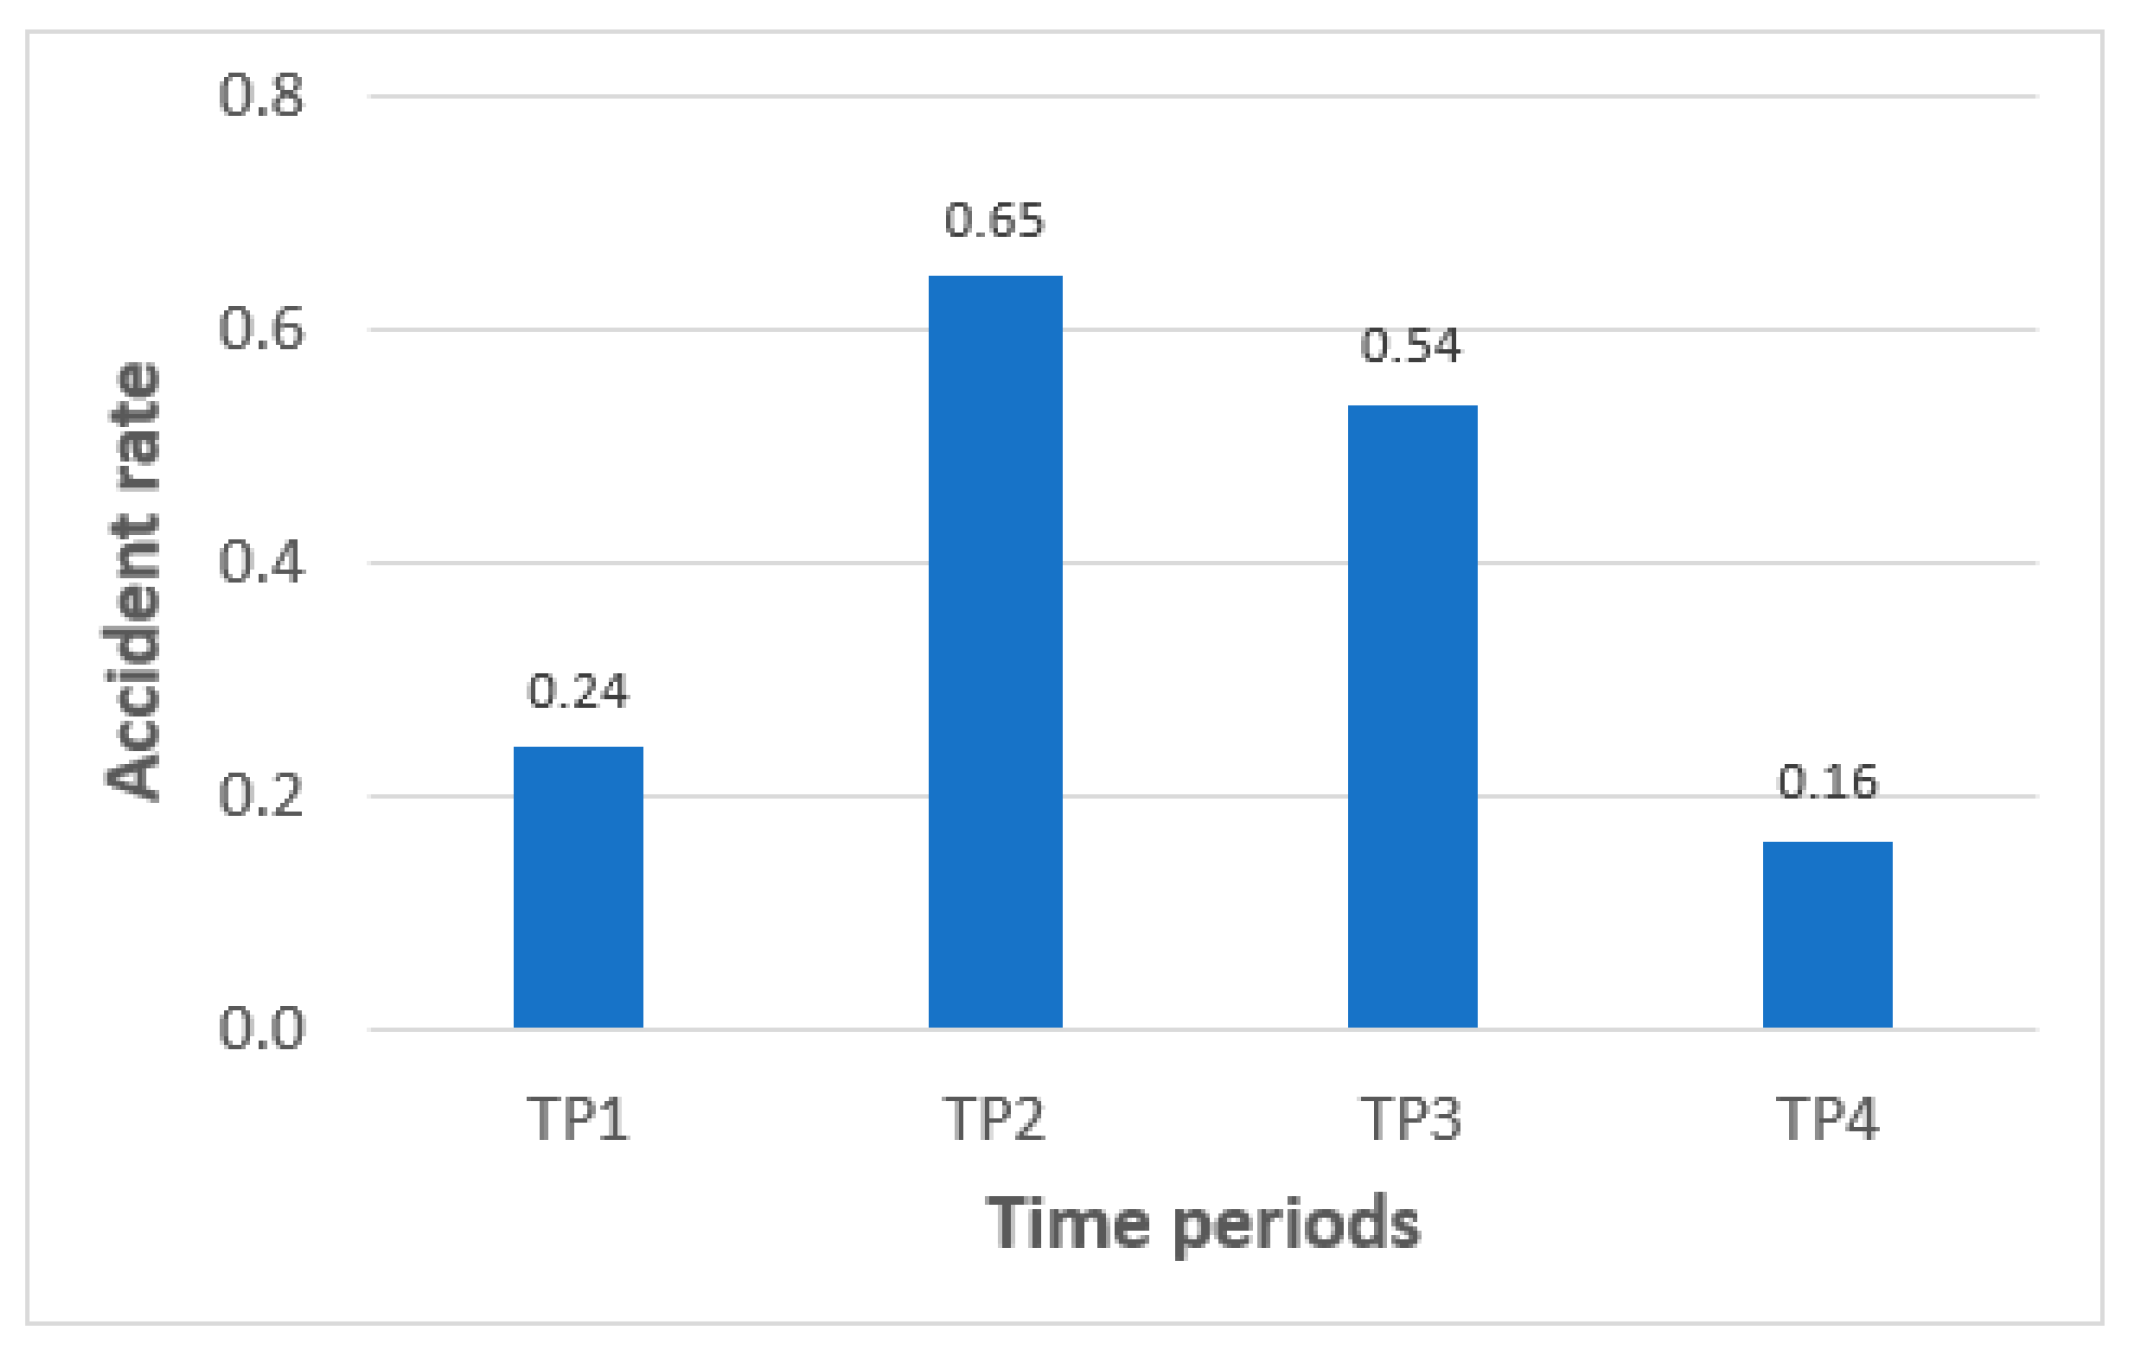
Thirdly, accident rates for each time period were calculated, based on the standard formula:
where is the accident rate (106veh-km−1year−1), is the number of accidents, is the annual average daily traffic volume (veh/day), is the length of road section (km), and is the length of time period (year). Since accidents were relatively rare, data from additional road sections were also used (in total 13 sections). A comparison is presented in Figure 7:
- Work zones (starting in TP2) were found to increase accident rates compared to normal operation (TP1) by approx. 170%. This increase was related to the mentioned overrepresentation of side-swipe accidents.
- With introduction of section speed control (TP3), accident rate decreased by approx. 17%.
- Another decrease occurred with the return to normal operation (TP4).
5. Results
The reported study aimed to evaluate the effectiveness of section speed control in Czech motorway work zones. We monitored the effectiveness in three sections (in terms of average speed, speed variance, speeding and accident rates) and four time periods (normal operation, work zone, work zone with section speed control, normal operation), which allowed for discerning individual effects of the two concurrent measures—work zone and section speed control.
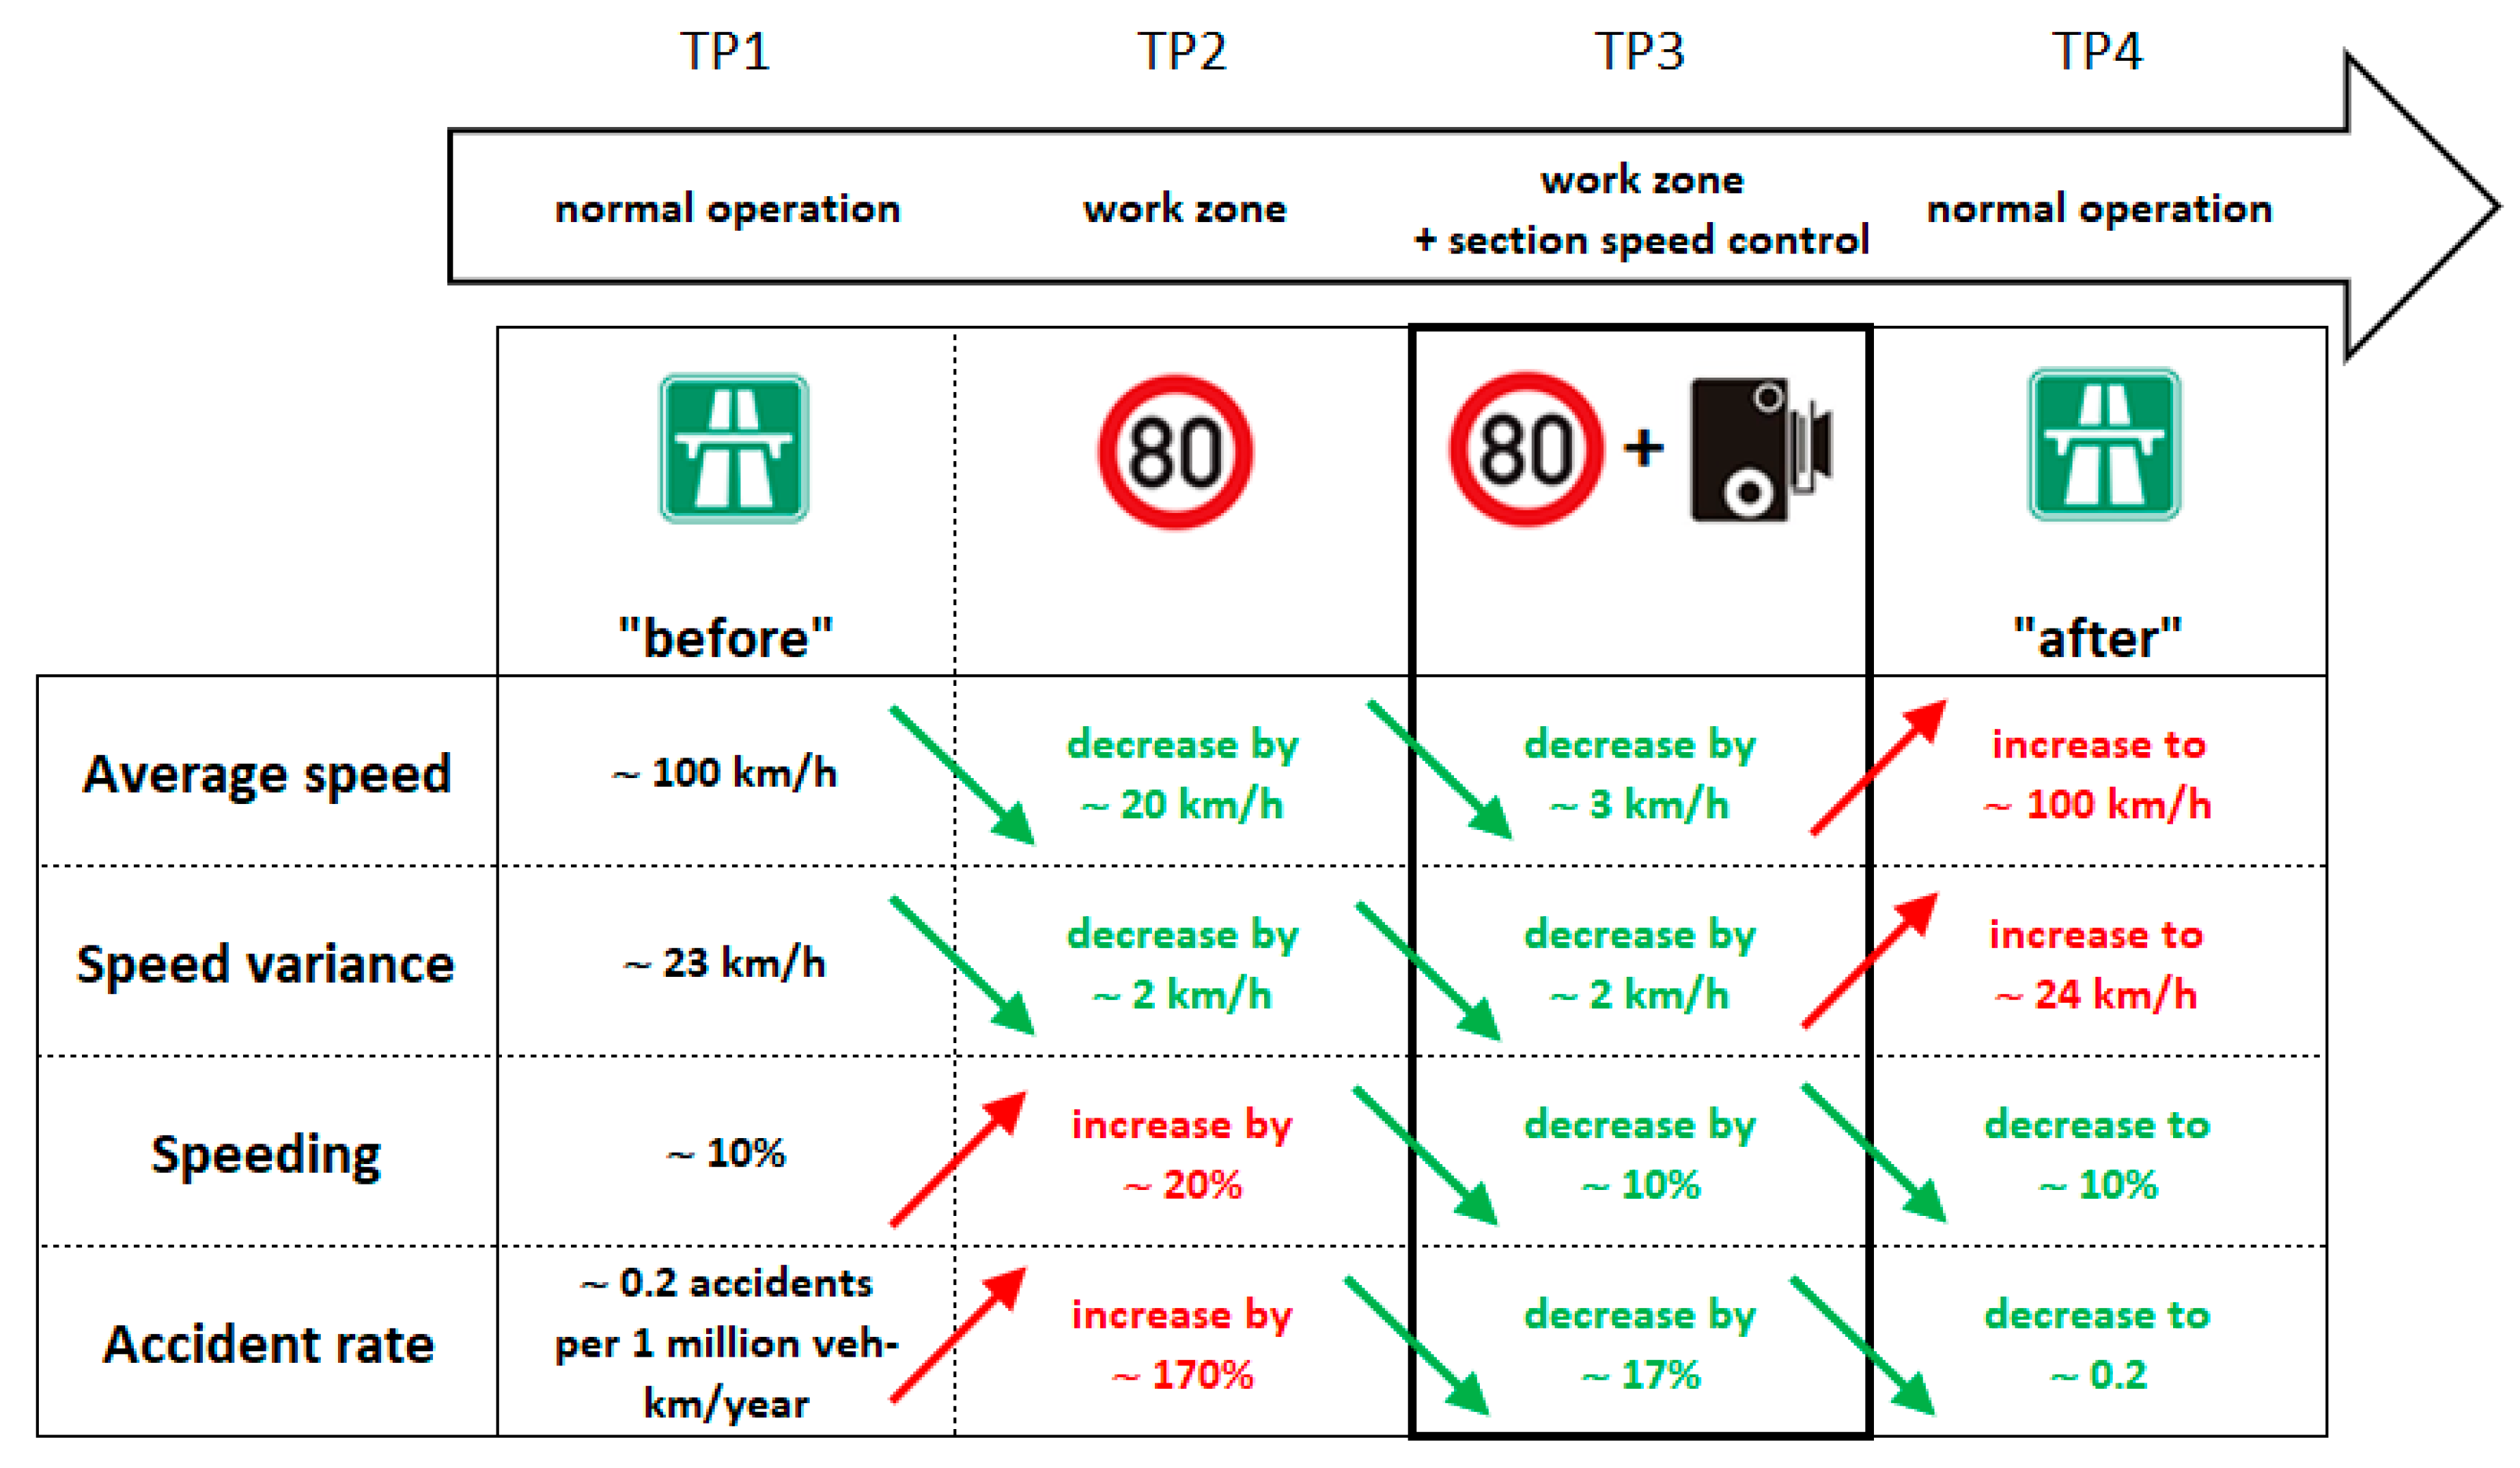
A graphical overview of all findings is presented in Figure 8. Green arrows indicate decreases in the studied indicators, i.e., safety improvement; on the contrary, red arrows indicate increases, i.e., the deterioration of safety. The part in the bold frame relates to the effects of section speed control.
6. Discussion and Conclusions
The overview in Figure 8 enables the following conclusions:
- The work zone itself, i.e., driving in limited cross-section, was associated with lower speed and speed variance, but a higher accident rate. Nevertheless, accidents were typically side-swipes, without injuries.
- Adding section speed control to the work zones helped decrease all indicators (average speed, speed variance, speeding, accident rate).
- After the removal of work zones and section speed control, all indicators returned to almost original values.
The main finding was that section speed control (SSC) is really effective—in addition to the work zone itself, it helps reducing speed and accidents even more. This information is currently communicated by stakeholders (Ministry of Transport, Road and Motorway Directorate) to the public. In addition, the Ministry of Transport has recently launched a media campaign focusing on safe driving in motorway work zones.
In addition, the study illustrated how floating car data (FCD) may enrich the speed analyses. Similar to previous FCD-based studies, the presented study also found V-shapes in speed profiles, known as “kangaroo jumps”. Interestingly, such jumps were found in the beginning and the end of a work zone, i.e., independently on the location of SSC cameras.
Nevertheless, the final results were influenced by a combination of work zone and section speed control effects. On one hand, section speed control is believed to be the most effective speed management measure in work zones [12]. On the other hand, a number of reviews indicated that work zones have higher accident frequency when compared to normal conditions; although, the accidents are usually less severe than accidents in non-work zone sections [13,14,15,16]. The overrepresentation of side-swipe accidents in work zones was also found in several studies [17,18,19]. This may be why the effects of section speed control, as reported in the framed box in Figure 8, were remarkably smaller compared to previous evaluations in non-work zone conditions (as reviewed by [2,8]). It may be even biased by varying international definitions of accident severity levels.
In the end, several limitations were encountered and should be considered in following studies:
- In the time of evaluation, only three sections were available for detailed analysis, which is a major limiting factor. Data from additional sections were used only in accident rate analysis. Future studies may use increased sample sizes.
- Representativeness of floating car data depends on the source vehicle fleet characteristics. In our case, the presence of heavy goods vehicles in the fleet could have shifted the results towards lower speed and speeding rates.
- Due to incomplete traffic volume data from section speed control, we used aggregated AADT data, which does not reflect changes between time periods and driving directions. This could have biased the volume-related indicators (speeding rates and accident rates).
Author Contributions
Conceptualization and methodology, J.A., V.V.; data collection, R.T., J.E., Z.K.; analysis, J.A., R.T., J.E.; writing—original draft preparation, J.A.; writing—review and editing, J.A., V.V. All authors have read and agreed to the published version of the manuscript.
Funding
The study was conducted with the financial support of Czech Ministry of Education, Youth and Sports under the National Sustainability Programme I project of Transport R&D Centre (LO1610), using the research infrastructure from the Operation Programme Research and Development for Innovations (CZ.1.05/2.1.00/03.0064).
Acknowledgments
We thank following persons for providing information and data: Miroslav Soukup (Road and Motorway Directorate—information on section speed control); Jaroslav Altmann (Princip a.s.—floating car data); Jana Fabiánová (Traffic Police Directorate—accident data); Miloš Burian, Leona Neubauerová, Jiří Pospíchal and Ivana Vrzalová (data on speeding offences from Rosice, Šlapanice, Velké Meziříčí and Vlašim municipalities).
Conflicts of Interest
The authors declare no conflict of interest. The funders had no role in the design of the study; in the collection, analyses, or interpretation of data; in the writing of the manuscript, or in the decision to publish the results.
References
- Speed and Speed Management—Summary. Available online: https://ec.europa.eu/transport/road_safety/specialist/observatory/analyses/traffic_safety_syntheses/safety_synthesies_en (accessed on 26 June 2020).
- Soole, D.W.; Watson, B.C.; Fleiter, J.J. Effects of average speed enforcement on speed compliance and crashes: A review of the literature. Acc. Anal. Prev. 2013, 54, 46–56. [Google Scholar] [CrossRef] [PubMed] [Green Version]
- De Pauw, E.; Daniels, S.; Brijs, T.; Hermans, E.; Wets, G. Automated section speed control on motorways: An evaluation of the effect on driving speed. Acc. Anal. Prev. 2014, 73, 313–322. [Google Scholar] [CrossRef] [PubMed]
- Høye, A. Safety effects of section control—An empirical Bayes evaluation. Acc. Anal. Prev. 2015, 74, 169–178. [Google Scholar] [CrossRef] [PubMed]
- Montella, A.; Punzo, V.; Chiaradonna, S.; Mauriello, F.; Montanino, M. Point-to-point speed enforcement systems: Speed limits design criteria and analysis of drivers’ compliance. Transp. Res. C 2015, 53, 1–18. [Google Scholar] [CrossRef]
- Vanlommel, M.; Houbraken, M.; Audenaert, P.; Logghe, S.; Pickavet, M.; De Maeyer, P. An evaluation of section control based on floating car data. Transp. Res. C 2015, 58, 617–627. [Google Scholar] [CrossRef]
- Bar-Gera, H.; Schechtman, E.; Musicant, O. Evaluating the effect of enforcement on speed distributions using probe vehicle data. Transp. Res. F 2017, 46, 271–283. [Google Scholar] [CrossRef]
- Installation of Section Control and Speed Cameras. Available online: https://www.roadsafety-dss.eu/assets/data/pdf/synopses/Installation_of_section_control_speed_cameras_23102017.pdf (accessed on 26 June 2020).
- Bartoš, L.; Richtr, A.; Martolos, J.; Hála, M. Prognóza Intenzit Automobilové Dopravy, 2nd ed.; EDIP: Plzeň, Czech Republic, 2012. [Google Scholar]
- Bartoš, L.; Martolos, J. Stanovení Intenzit Dopravy na Pozemních Komunikacích, 2nd ed.; EDIP: Plzeň, Czech Republic, 2012. [Google Scholar]
- Vyhodnocení Resortního akčního plánu bezpečnosti a plynulosti silničního provozu za rok. 2017. Available online: https://www.mvcr.cz/clanek/archiv-resortnich-akcnich-planu-bezpecnosti-a-plynulosti-silnicniho-provozu.aspx (accessed on 26 June 2020).
- Debnath, A.K.; Blackman, R.; Haworth, N. Speeding through roadworks: Understanding driver speed profiles and ways to reduce speeding. In Proceedings of the 2015 Australasian Road Safety Conference, Gold Coast, Australia, 14–16 October 2015. [Google Scholar]
- Gundy, C.M. Road Work Zone Accident Studies; Leidschendam: SWOV, The Netherlands, 1998. [Google Scholar]
- Khattak, A.J.; Khattak, A.J.; Forrest, M. Effects of work zone presence on injury and non-injury crashes. Acc. Anal. Prev. 2002, 34, 19–29. [Google Scholar] [CrossRef]
- Yang, H.; Ozbay, K.; Ozturk, O.; Xie, K. Work Zone Safety Analysis and Modeling: A State-of-the-Art Review. Traff. Inj. Prev. 2015, 16, 387–396. [Google Scholar] [CrossRef] [PubMed]
- Theofilatos, A.; Ziakopoulos, A.; Papadimitriou, E.; Yannis, G.; Diamandouros, K. Meta-analysis of the effect of road work zones on crash occurrence. Acc. Anal. Prev. 2017, 108, 1–8. [Google Scholar] [CrossRef] [PubMed]
- Pigman, J.G.; Agent, K.R. Highway Accidents in Construction and Maintenance Work Zones. Transp. Res. Rec. 1990, 1270, 12–21. [Google Scholar]
- Wang, J.; Hughes, W.E.; Council, F.M.; Paniati, J.F. Investigation of Highway Work Zone Crashes: What We Know and What We Don’t Know. Transp. Res. Rec. 1996, 1529, 54–62. [Google Scholar] [CrossRef]
- Garber, N.; Zhao, M. Distribution and Characteristics of Crashes at Different Work Zone Locations in Virginia. Transp. Res. Rec. 2002, 1794, 19–25. [Google Scholar] [CrossRef]
Figure 1.
Illustration of a motorway work zone (source: iDnes.cz).

Figure 2.
Summary of defined time periods.

Figure 3.
Example of a speed profile “in time” (TP denotes analysed time periods).

Figure 4.
Example graph of standard deviation of average speed (speed variance).

Figure 5.
Example of a speed profile “in length”.

Figure 6.
Example graph of speeding rates in time (TP denotes analysed time periods).

Figure 7.
Comparison of accident rates in the analysed time periods.

Figure 8.
Graphical overview of the effectiveness evaluation findings.


Table 1.
Overview of analysed time periods and their graphical symbols.
| TP1 | Normal operation “before” |  |
| TP2 | Work zone |  |
| TP3 | Work zone with section speed control |  |
| TP4 | Normal operation “after” |  |
Table 2.
Basic characteristics of studied work zone and SSC sections.
| Section | Work Zone Characteristics [km] | SSC Characteristics [km] | ||||
|---|---|---|---|---|---|---|
| Location | Length | Location | Length | |||
| 06 | 49 | 56 | 7 | 48.5 | 55.6 | 7.1 |
| 20 | 146 | 153 | 7 | 147.0 | 151.2 | 4.2 |
| 25 | 178 | 182 | 4 | 178.4 | 181.9 | 3.5 |
Table 3.
Summary characteristics of collected floating car data (FCD).
| Section | Approx. Number of Records | Number of Vehicles | Average Daily Number of Drives |
|---|---|---|---|
| 06 | 23 million | 39,717 | 1321 |
| 20 | 12 million | 32,331 | 1359 |
| 25 | 9 million | 29,544 | 2085 |
Table 4.
Comparison of accident severity levels between population and the studied sample.
| Population | Sample | |||
|---|---|---|---|---|
| Accident Severity | Frequency | Percentage | Frequency | Percentage |
| Fatal | 63 | 0.7% | 0 | 0.0% |
| Severe injury | 127 | 1.5% | 2 | 2.0% |
| Slight injury | 1088 | 12.6% | 18 | 18.0% |
| Property damage only | 7356 | 85.2% | 80 | 80.0% |
| Total | 8634 | 100.0% | 100 | 100.0% |
The Pearson’s chi-square test indicated no statistically significant differences (N = 8734, Fisher’s exact test = 3.129, df = 3, p > 0.05).
Table 5.
Comparison of accident types between population and the studied sample.
| Population | Sample | |||
|---|---|---|---|---|
| Accident Type | Frequency | Percentage | Frequency | Percentage |
| Single-vehicle | 6004 | 69.5% | 16 | 16.0% |
| Head-on | 70 | 0.8% | 0 | 0.0% |
| Side-swipe | 742 | 8.6% | 60 | 60.0% |
| Side | 311 | 3.6% | 6 | 6.0% |
| Rear | 1507 | 17.5% | 18 | 18.0% |
| Total | 8634 | 100.0% | 100 | 100.0% |
The Pearson’s chi-square test indicated statistically significant differences between categories in bold italics (N = 8734, Fisher’s exact test = 188.792, df = 3, p < 0.05).
© 2020 by the authors. Licensee MDPI, Basel, Switzerland. This article is an open access article distributed under the terms and conditions of the Creative Commons Attribution (CC BY) license (http://creativecommons.org/licenses/by/4.0/).
Share and Cite
MDPI and ACS Style
Ambros, J.; Turek, R.; Elgner, J.; Křivánková, Z.; Valentová, V. Effectiveness Evaluation of Section Speed Control in Czech Motorway Work Zones. Safety 2020, 6, 38. https://0-doi-org.brum.beds.ac.uk/10.3390/safety6030038
AMA Style
Ambros J, Turek R, Elgner J, Křivánková Z, Valentová V. Effectiveness Evaluation of Section Speed Control in Czech Motorway Work Zones. Safety. 2020; 6(3):38. https://0-doi-org.brum.beds.ac.uk/10.3390/safety6030038
Chicago/Turabian StyleAmbros, Jiří, Richard Turek, Jan Elgner, Zuzana Křivánková, and Veronika Valentová. 2020. "Effectiveness Evaluation of Section Speed Control in Czech Motorway Work Zones" Safety 6, no. 3: 38. https://0-doi-org.brum.beds.ac.uk/10.3390/safety6030038
Note that from the first issue of 2016, this journal uses article numbers instead of page numbers. See further details here.