Risk Assessment of a Battery-Powered High-Speed Ferry Using Formal Safety Assessment

 ,
,  ,
,  ,
, 
Abstract
:1. Introduction
2. Methodology
2.1. Formal Safety Assessment
2.2. Hazard Identification and Risk Assessment
log (Risk) = log (Frequency) + log (Consequence),
RI = FI + CI,
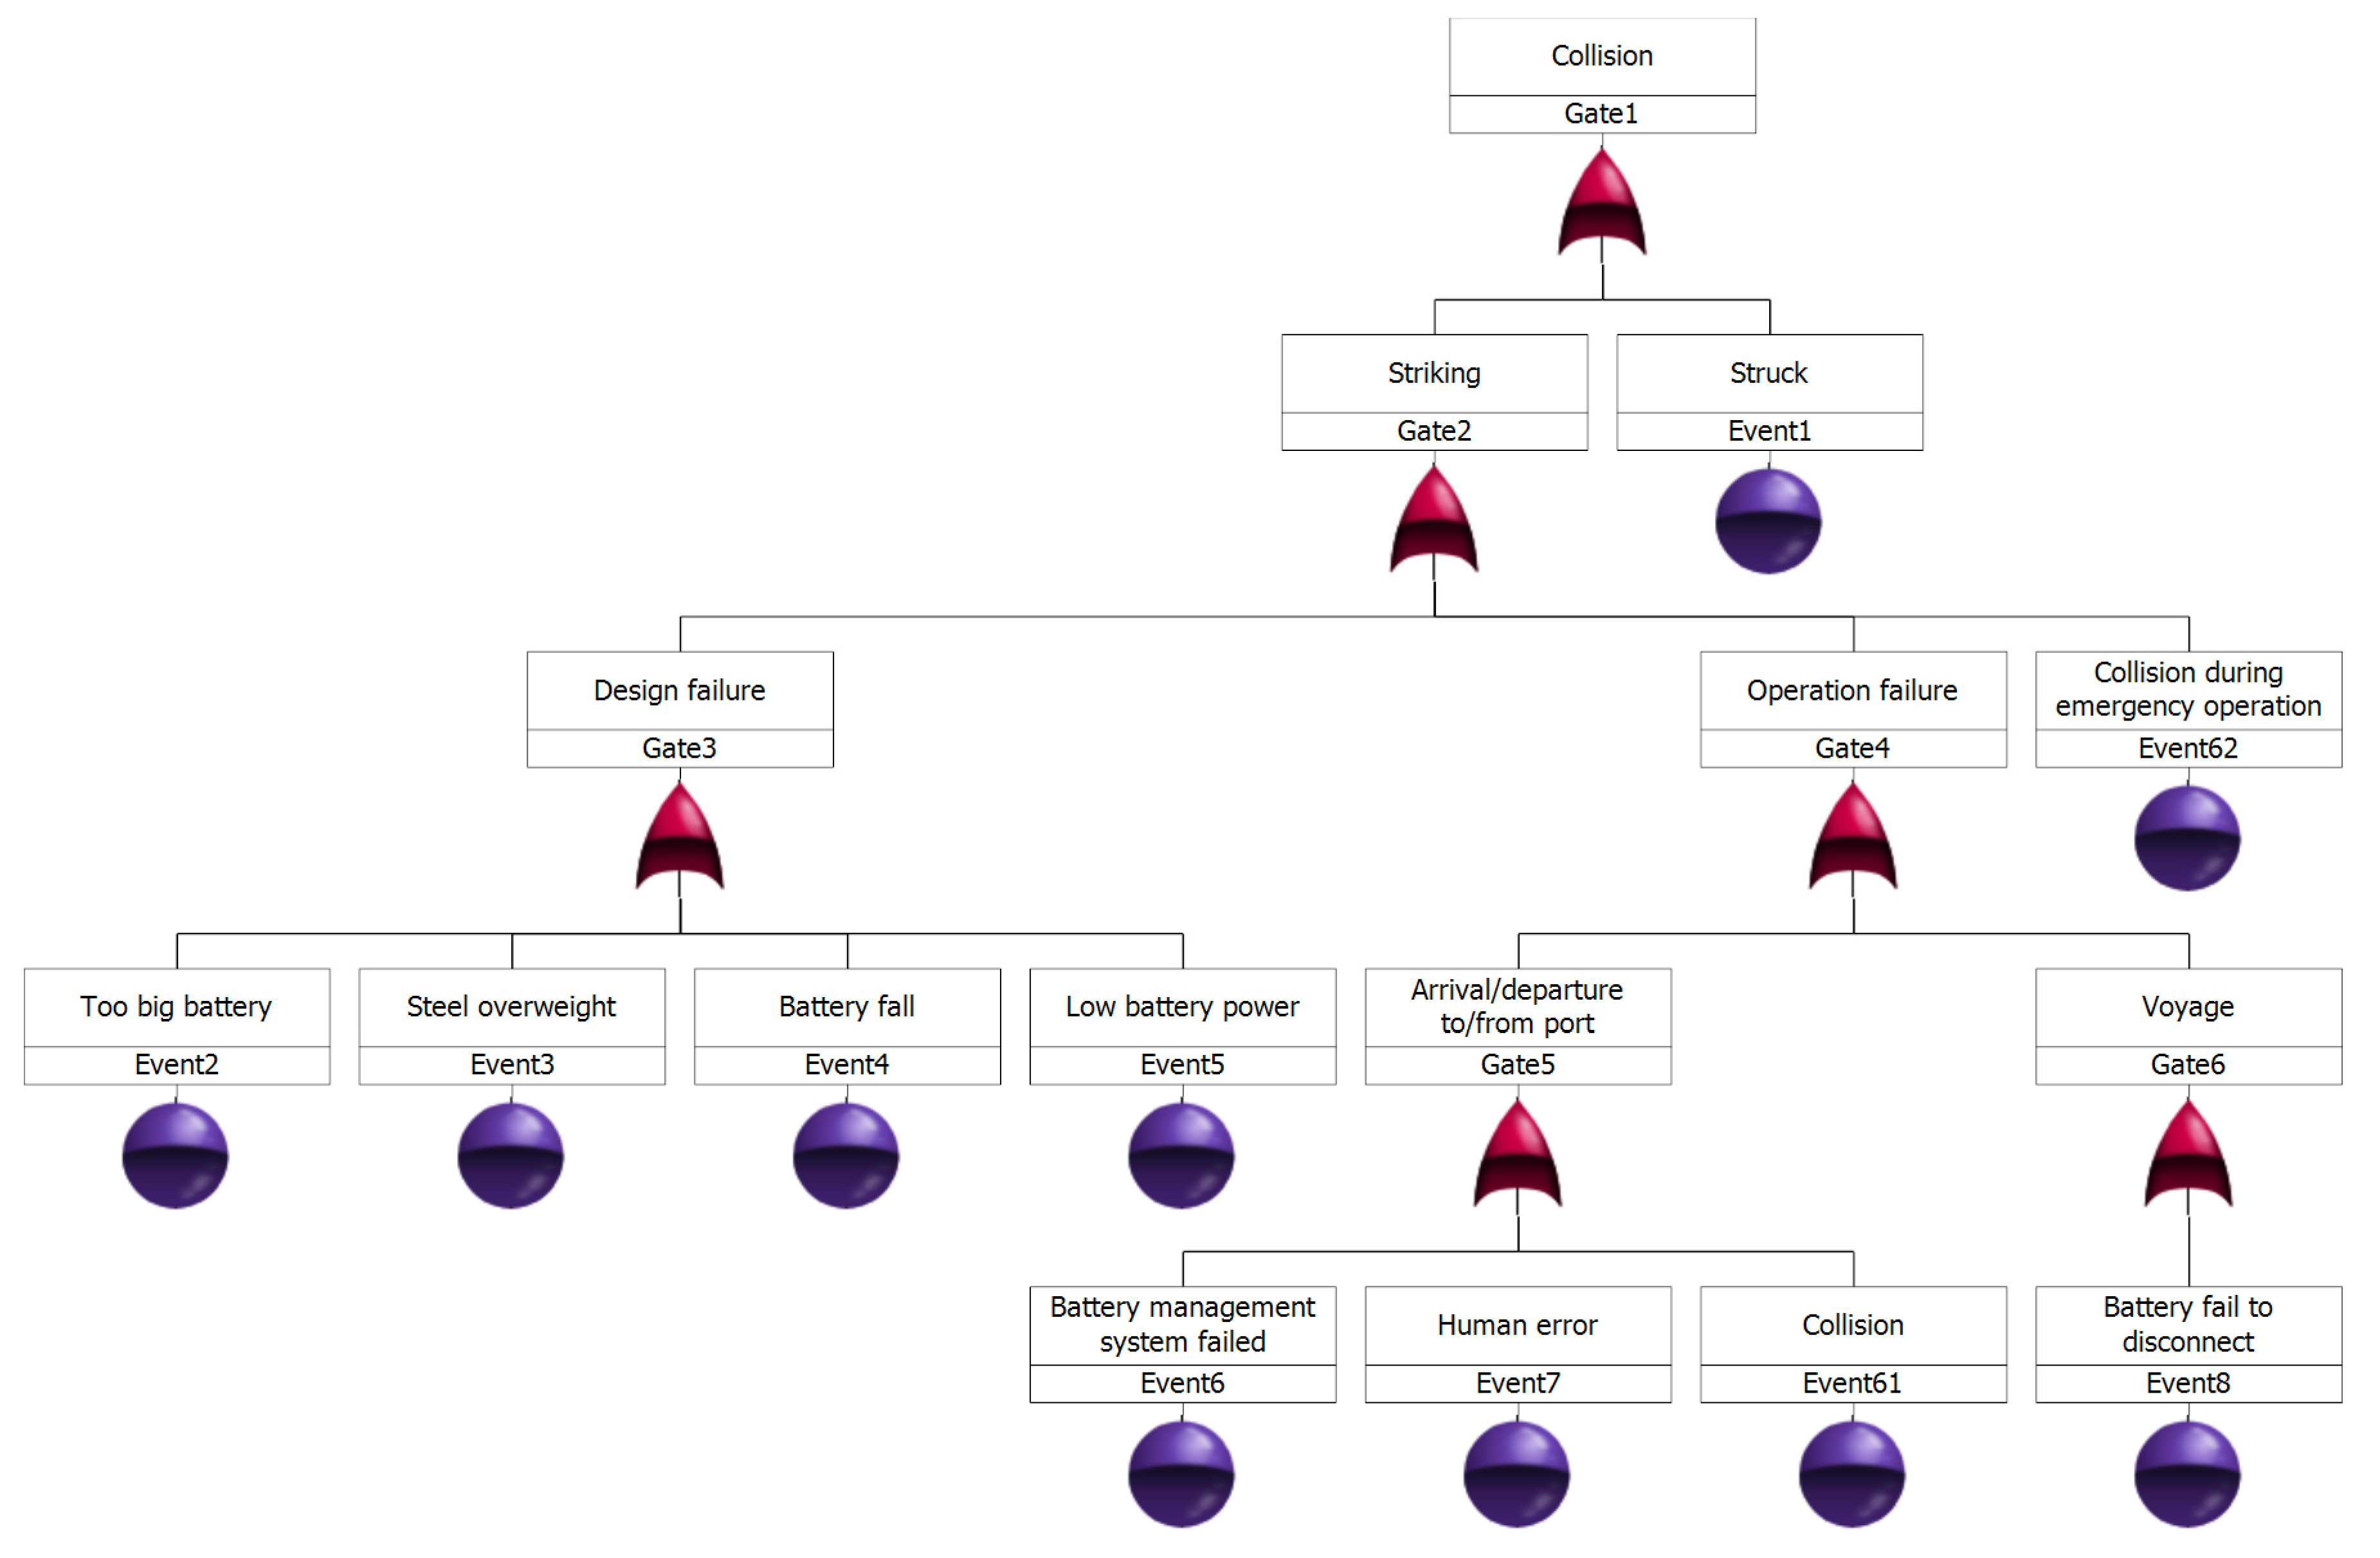
2.3. Fault Tree Analysis
- A, B are events under consideration;
- P(A), P(B) presents the independent probabilities of A and B;
- P(A|B) presents the probability of A given B is true;
- P(B|A) presents the probability of B given A is true.
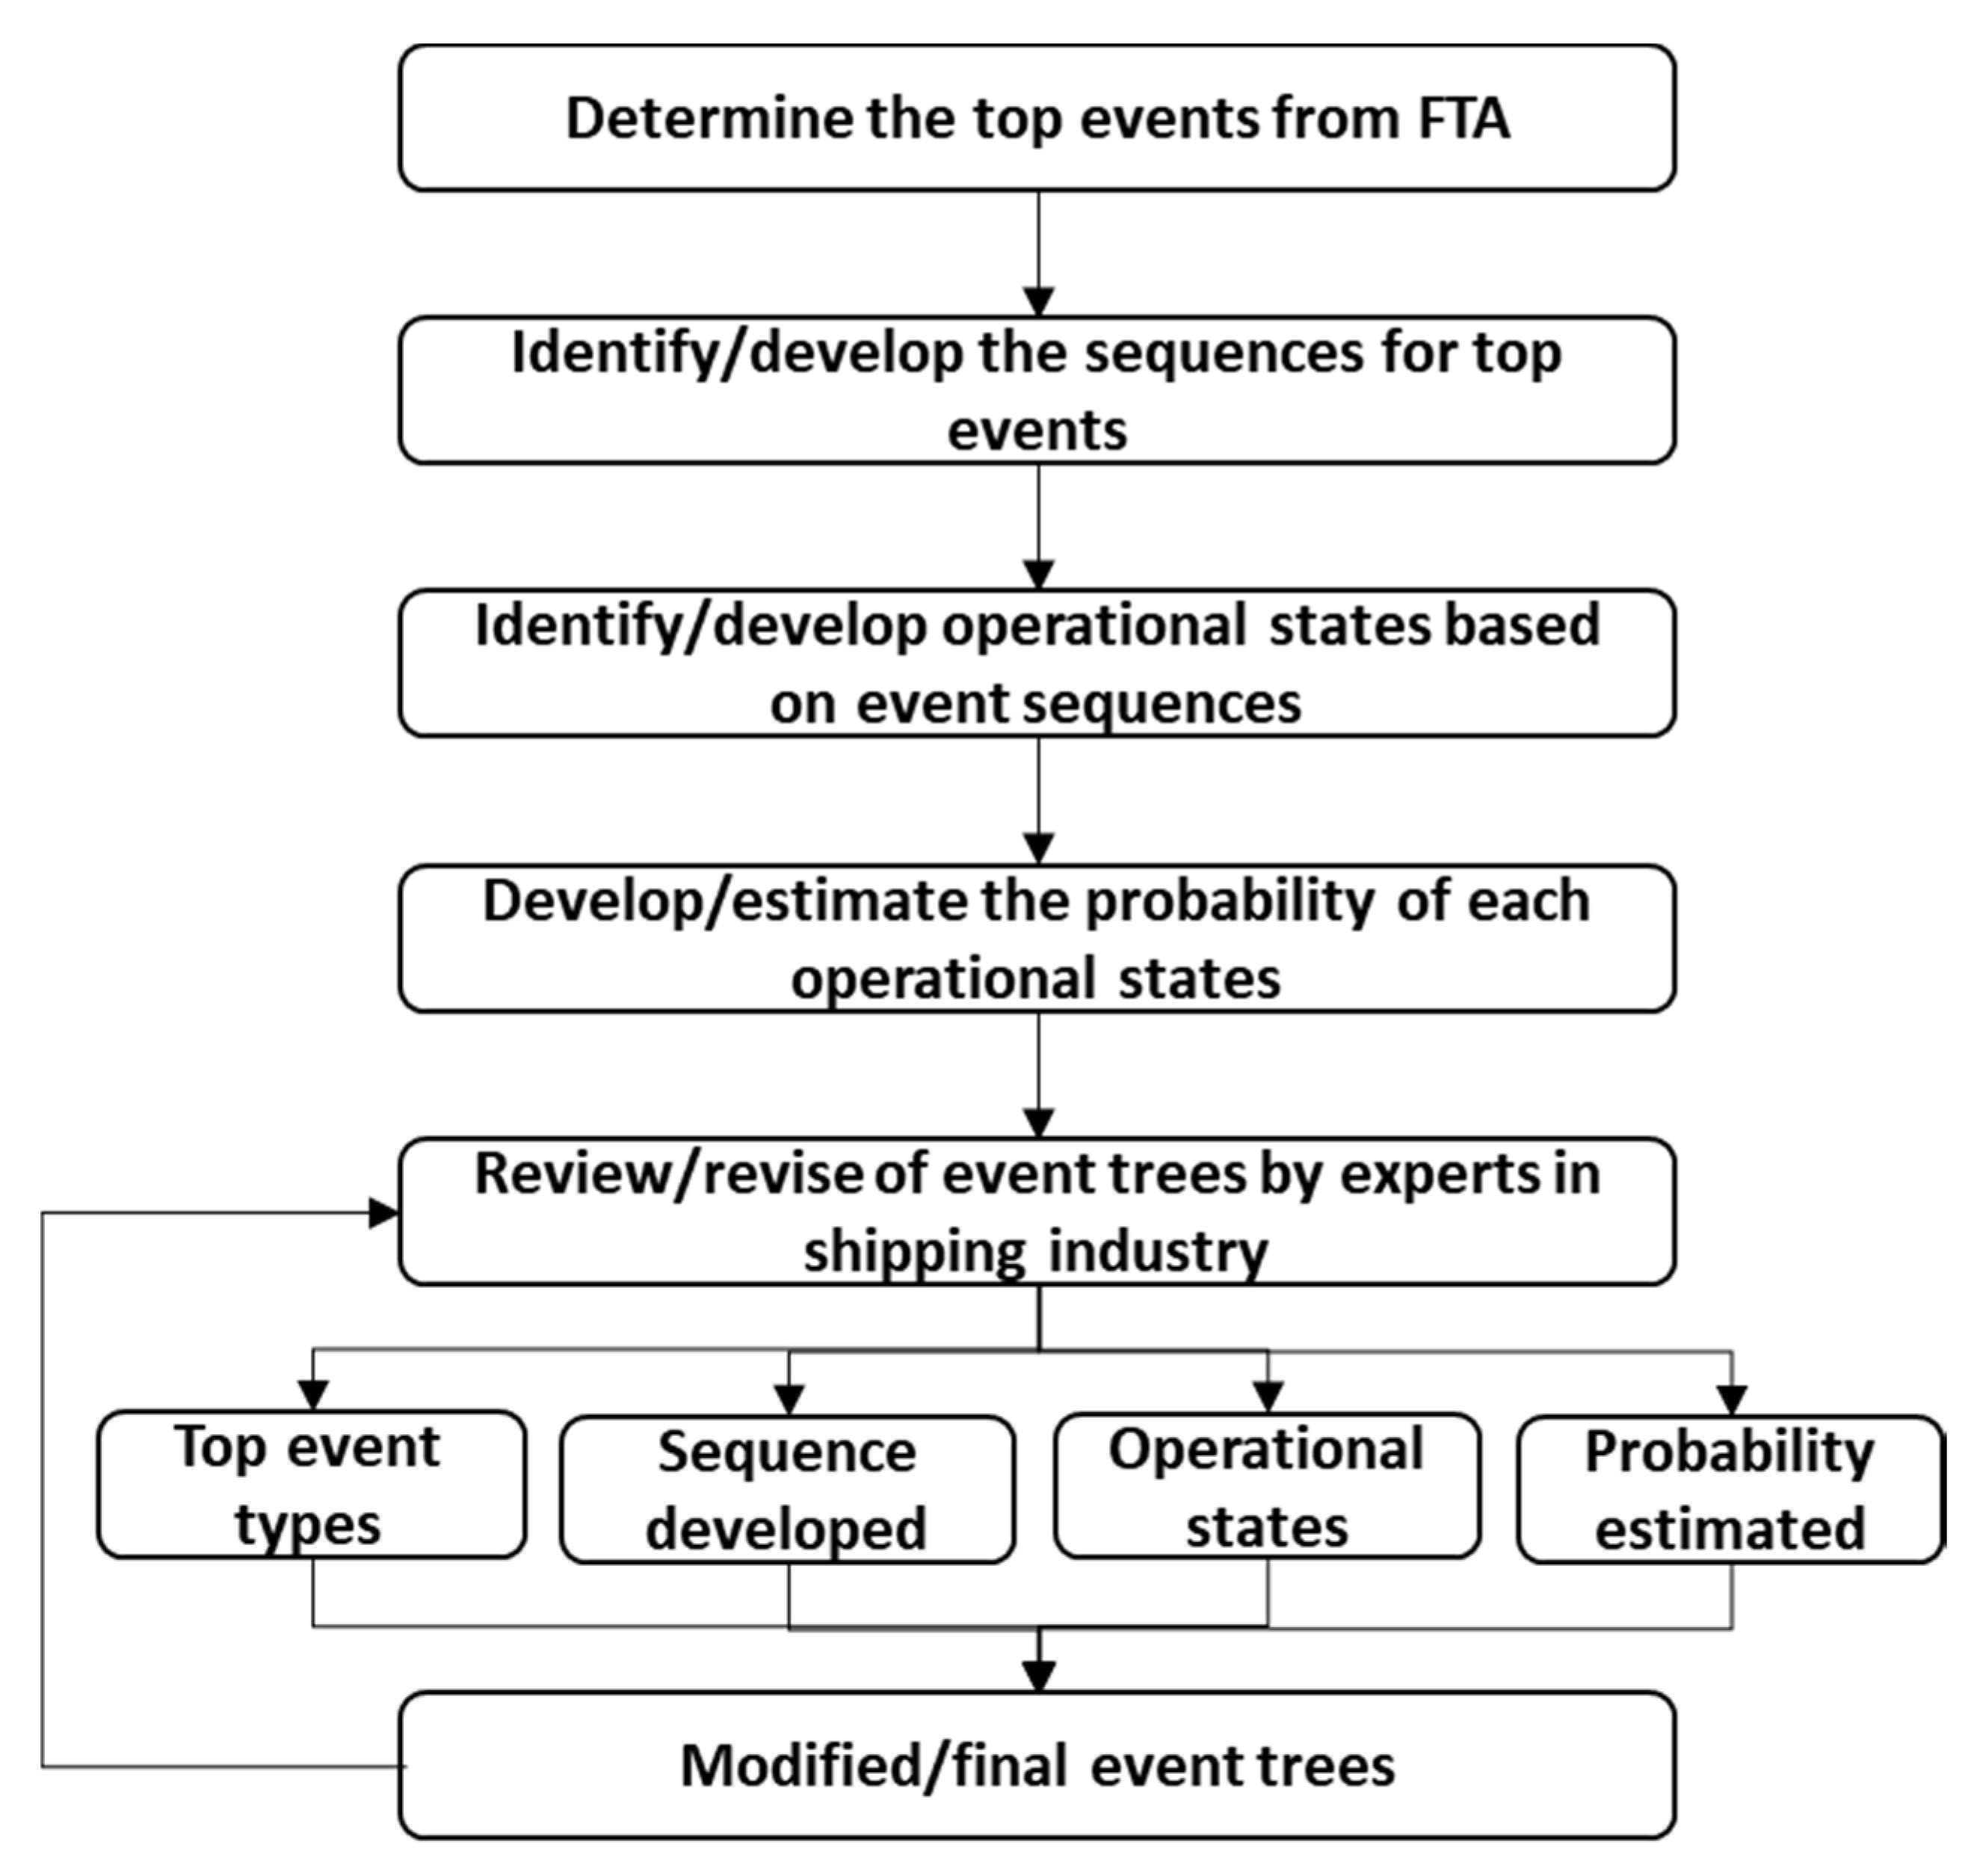
2.4. Event Tree Analysis
- Cruise ship and ferry have construction prices of €700M and €5M respectively;
- Cost of averting fatality (CAF) is €7.45M according to GOALDS project, although previous FSAs have used a value of €3M;
- Maximum number (capacity) of passengers and crews on board cruise ship and ferry are 8000 and 150, respectively;
- Average numbers of people on board cruise ship and ferry at peak hours are 5493 and 103 respectively;
- The environmental impact due to the sinking of the vessel is considered as: a deep sea salvage will cost €5M and a near shore (shallow water) salvage will cost €1M.
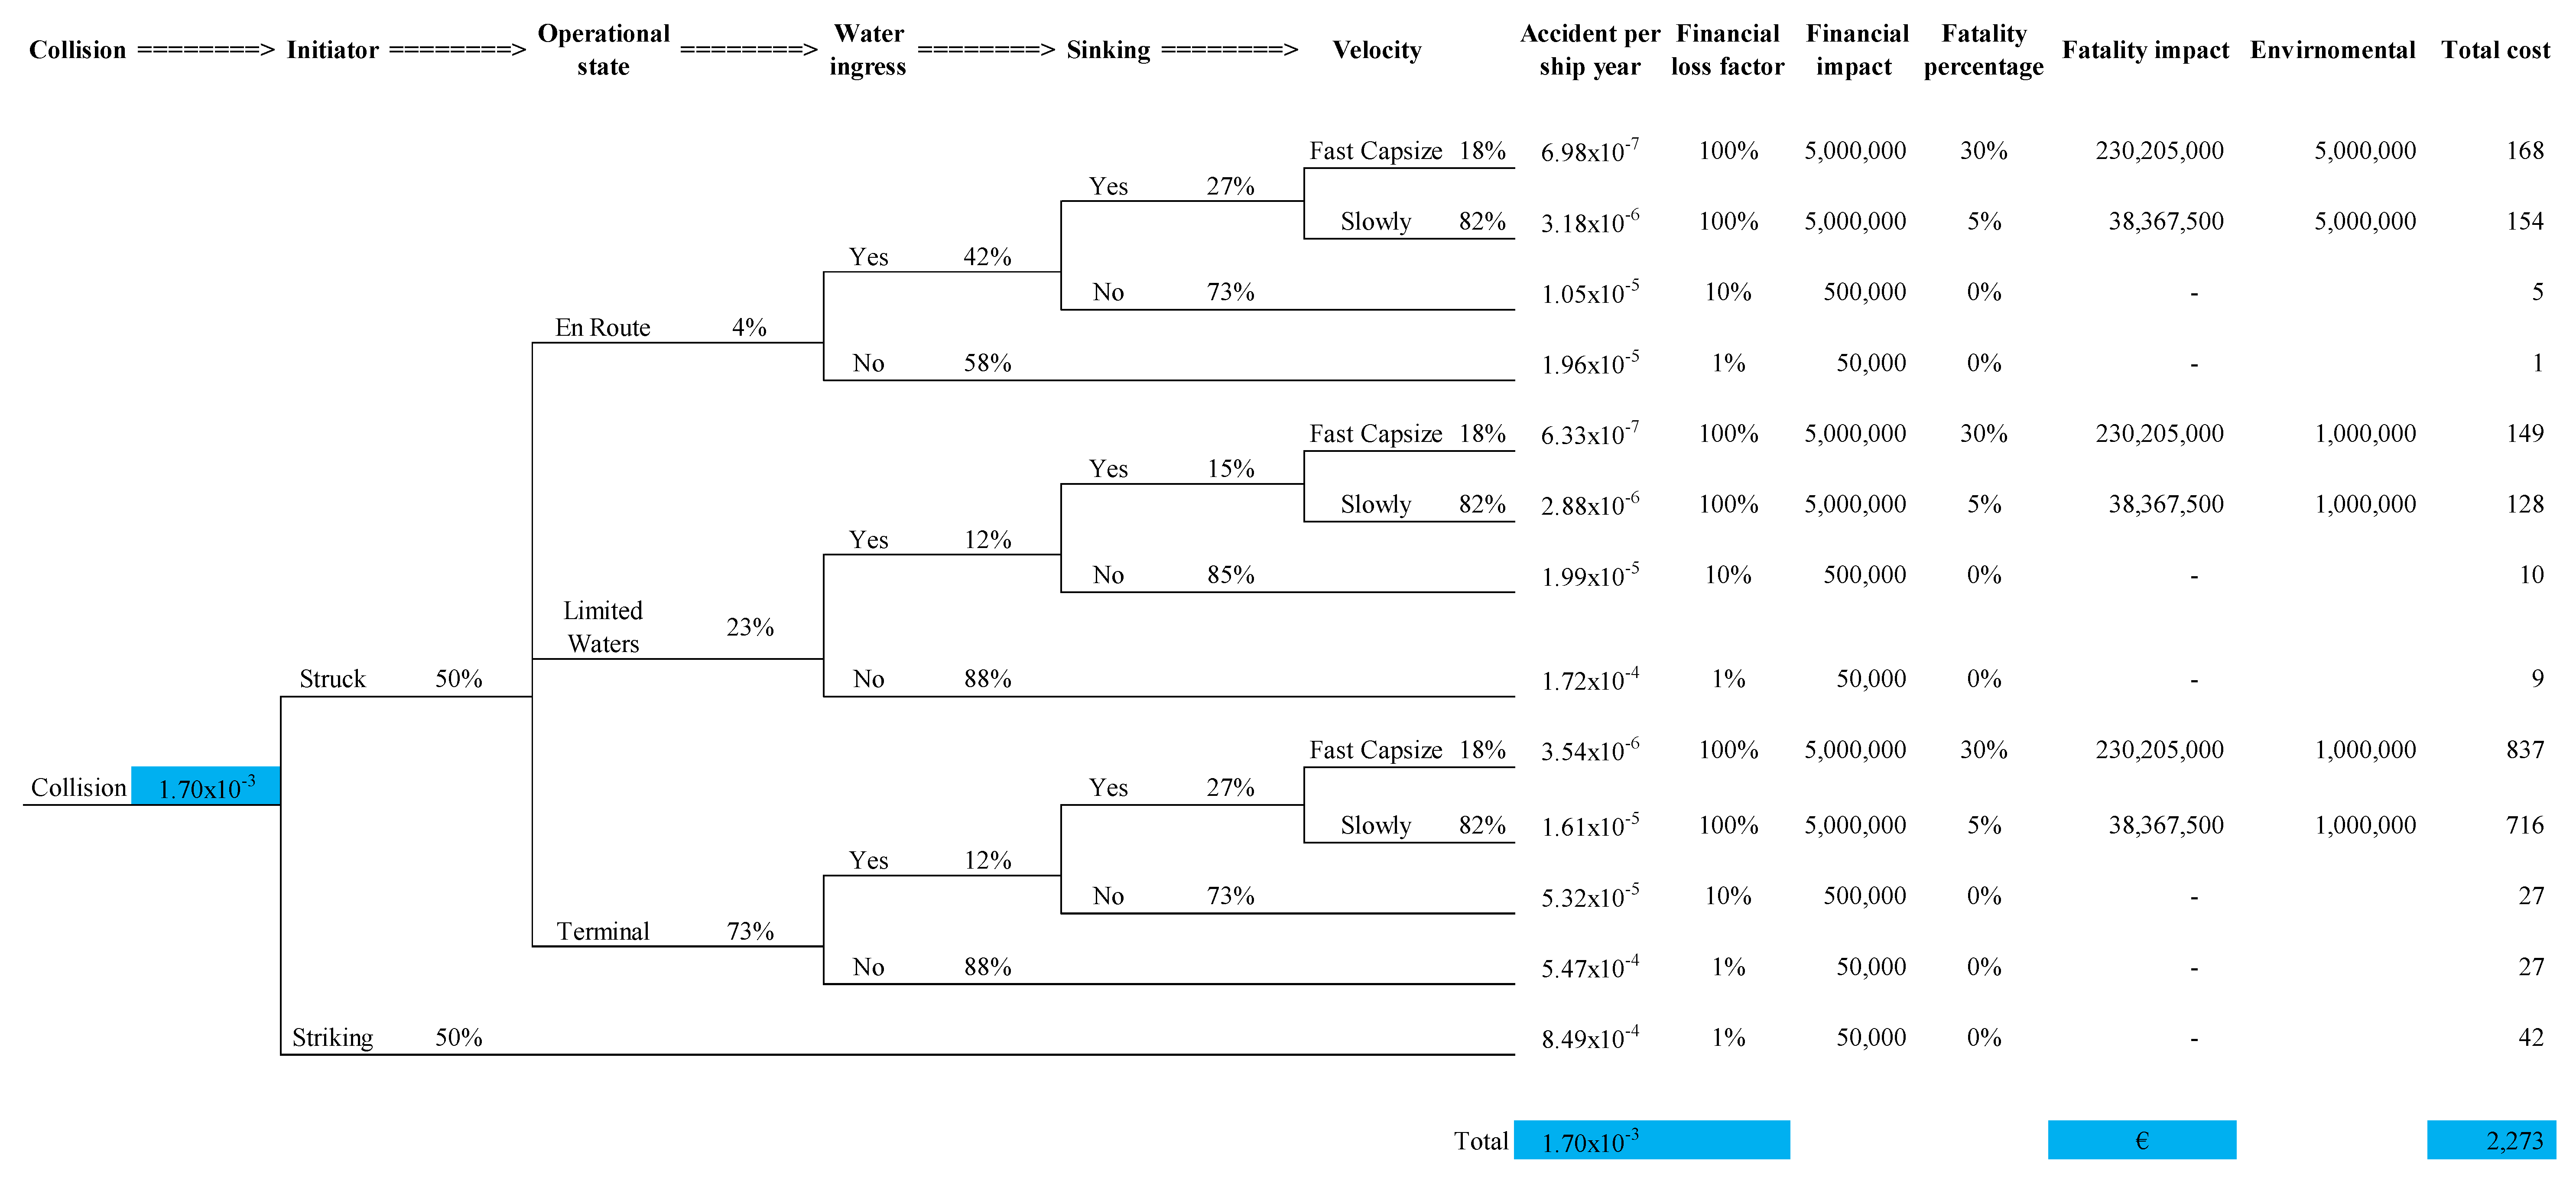
- The probability of getting struck and striking other ships is 50–50 for high-speed battery driven ferry; it is 37.5% and 62.5% for larger passenger ships;
- In this project, the probability of water ingress under condition of getting struck in limited waters is 12% which is 42% for larger passenger ships;
- The probability of sinking under condition of water ingress after getting struck in limited waters is 15% in this study and it is 27% for larger passenger ships;
- The rest highlighted are agreed to have the same probability for both types of vessels.
- Collision:
- The financial loss factor is 10% for water ingress only and 1% for non-water ingress;
- The fatality rate is 30% under fast capsizing and 5% for slowly capsizing;
- A deep-sea salvage will cost €5M and a near shore (shallow water) one will cost €1M;
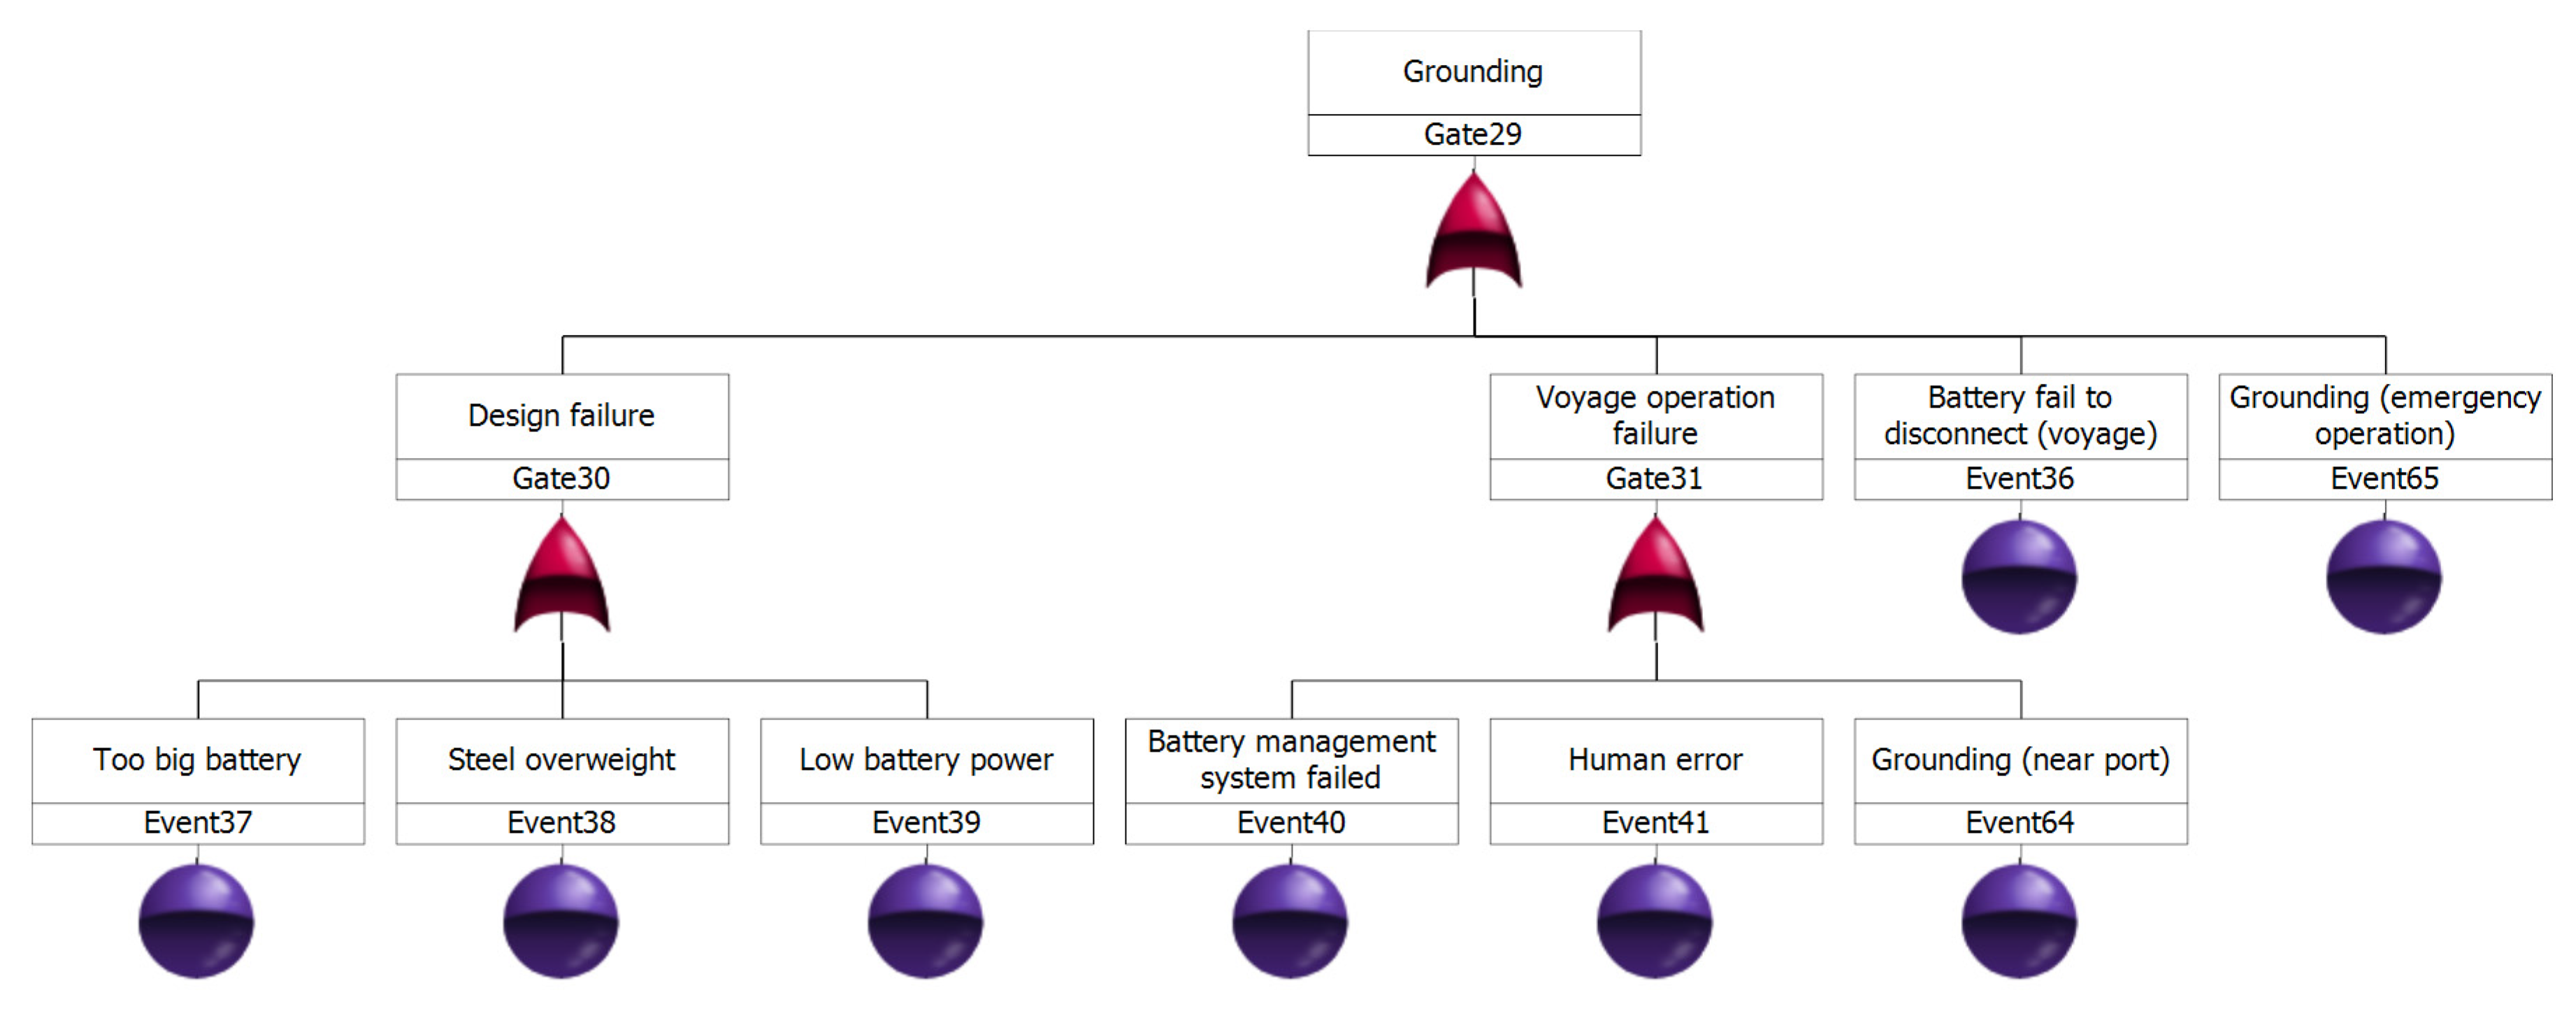
- Grounding:
- The financial loss factor is 10% for water ingress only and 1% for non-water ingress;
- The fatality rate is 5% for water ingress; the fatality rate is 30% under fast capsizing and 18% for slowly capsizing;
- There will be only near shore salvage which will cost €1M;
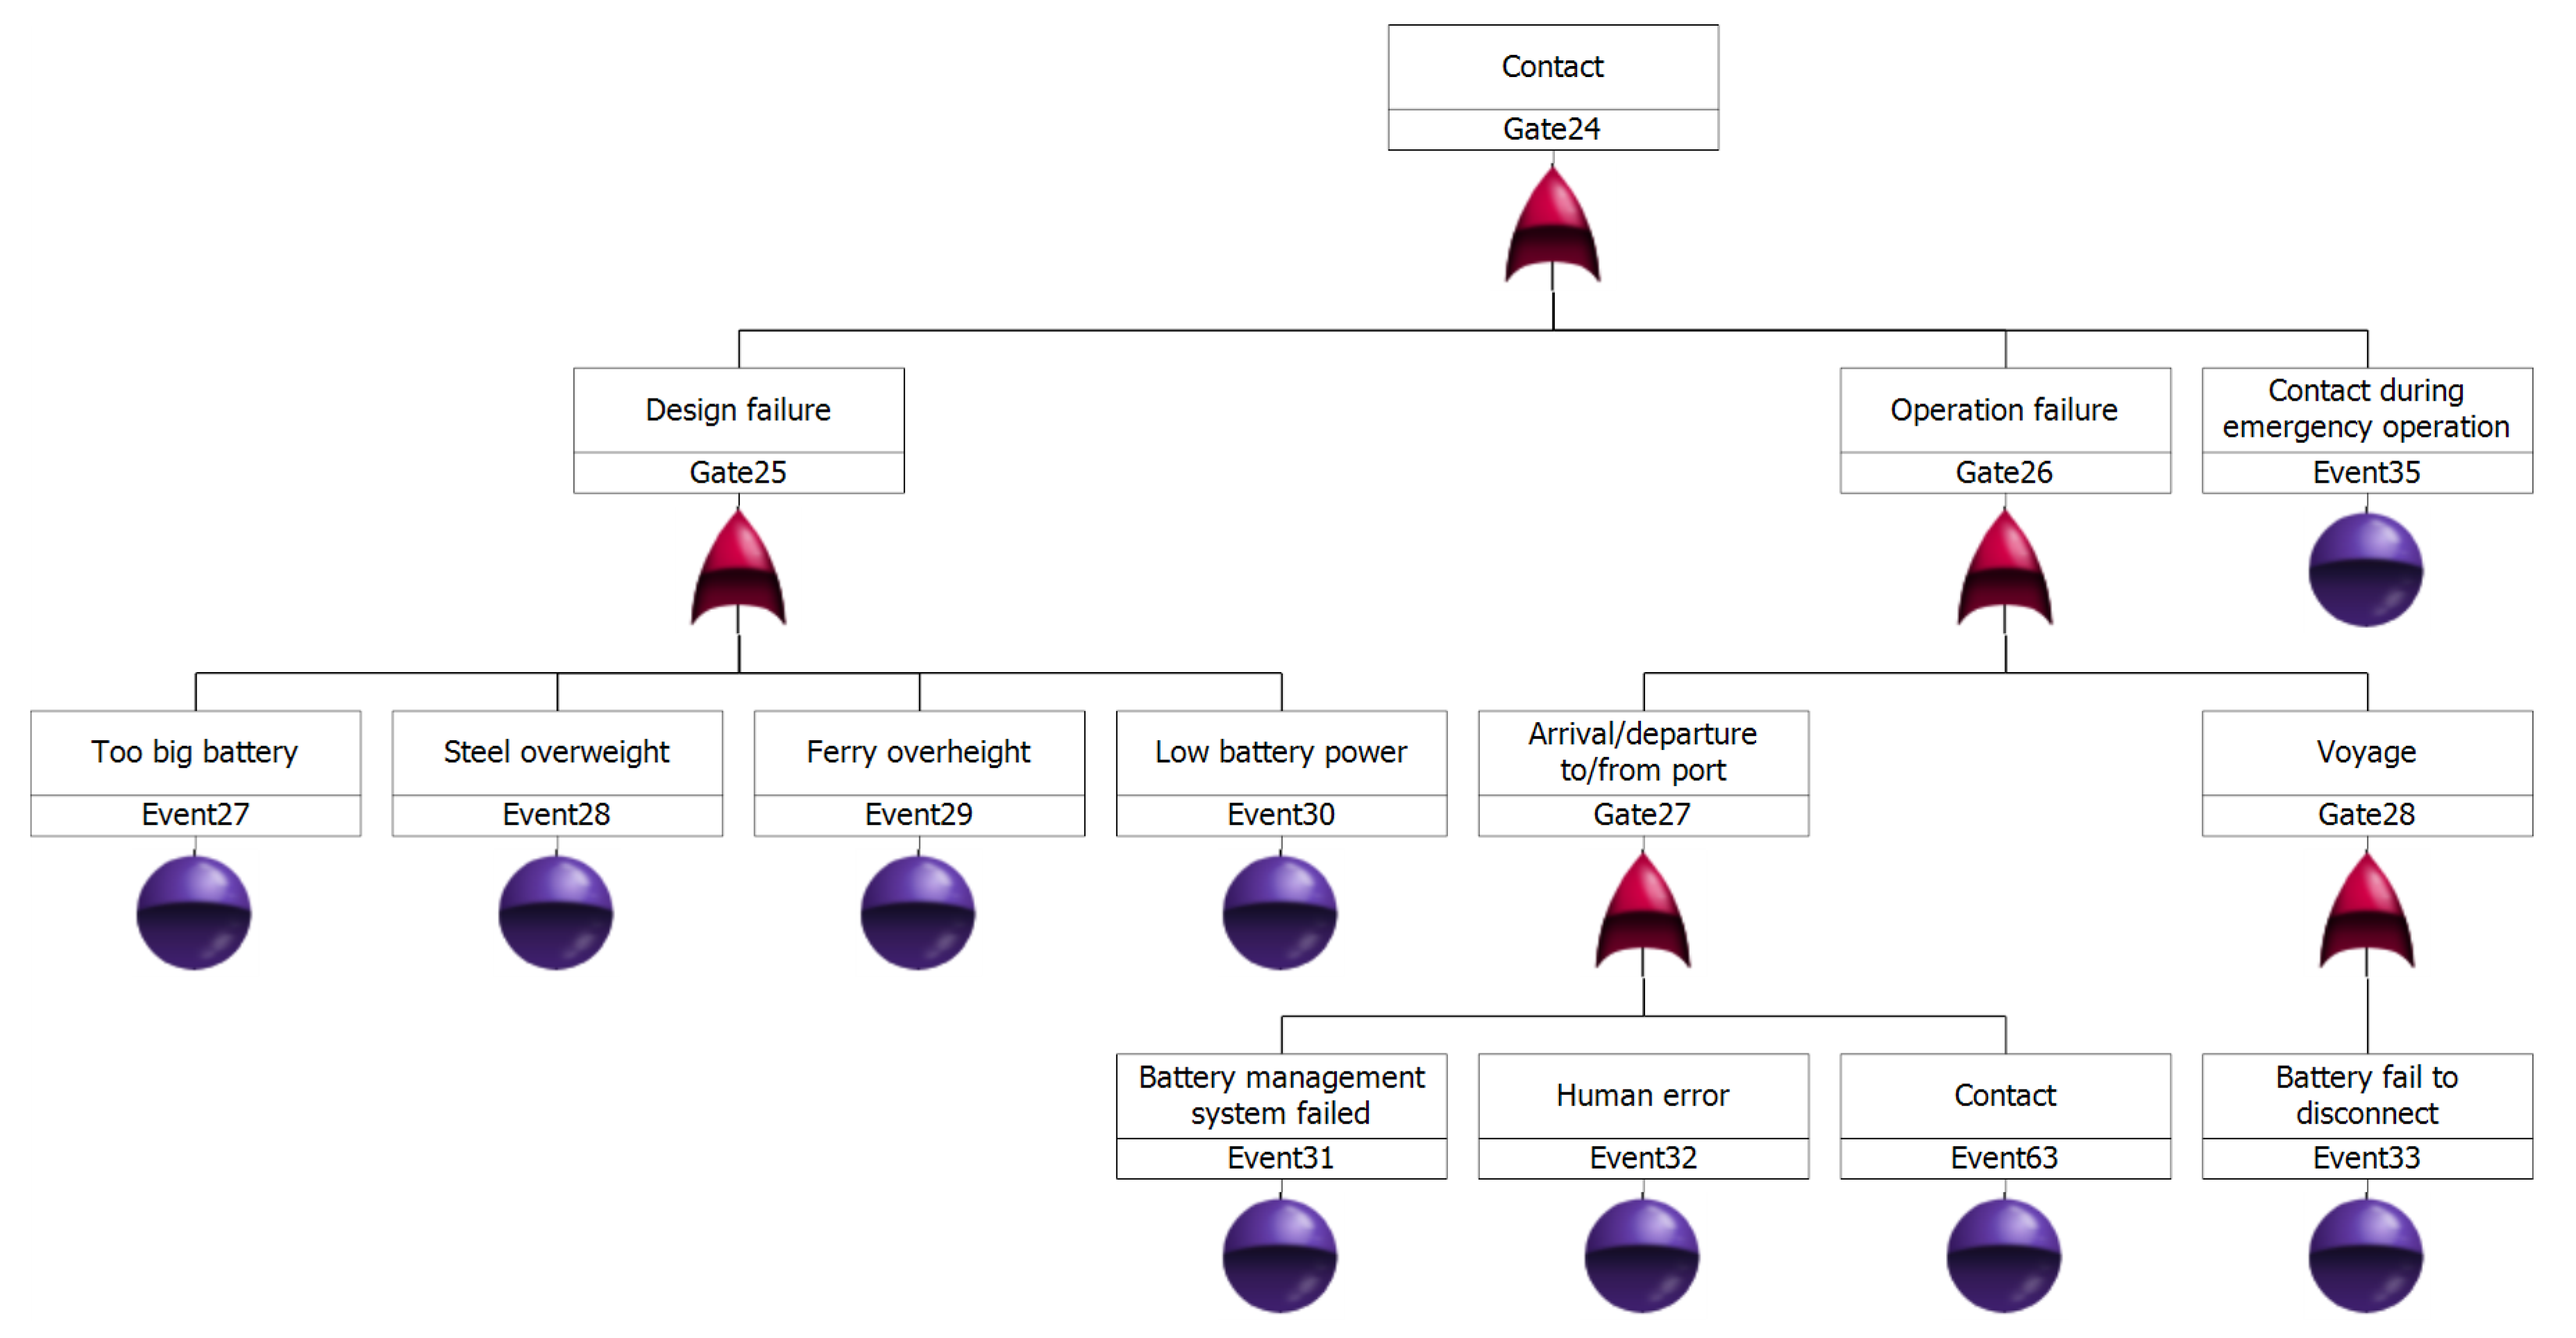
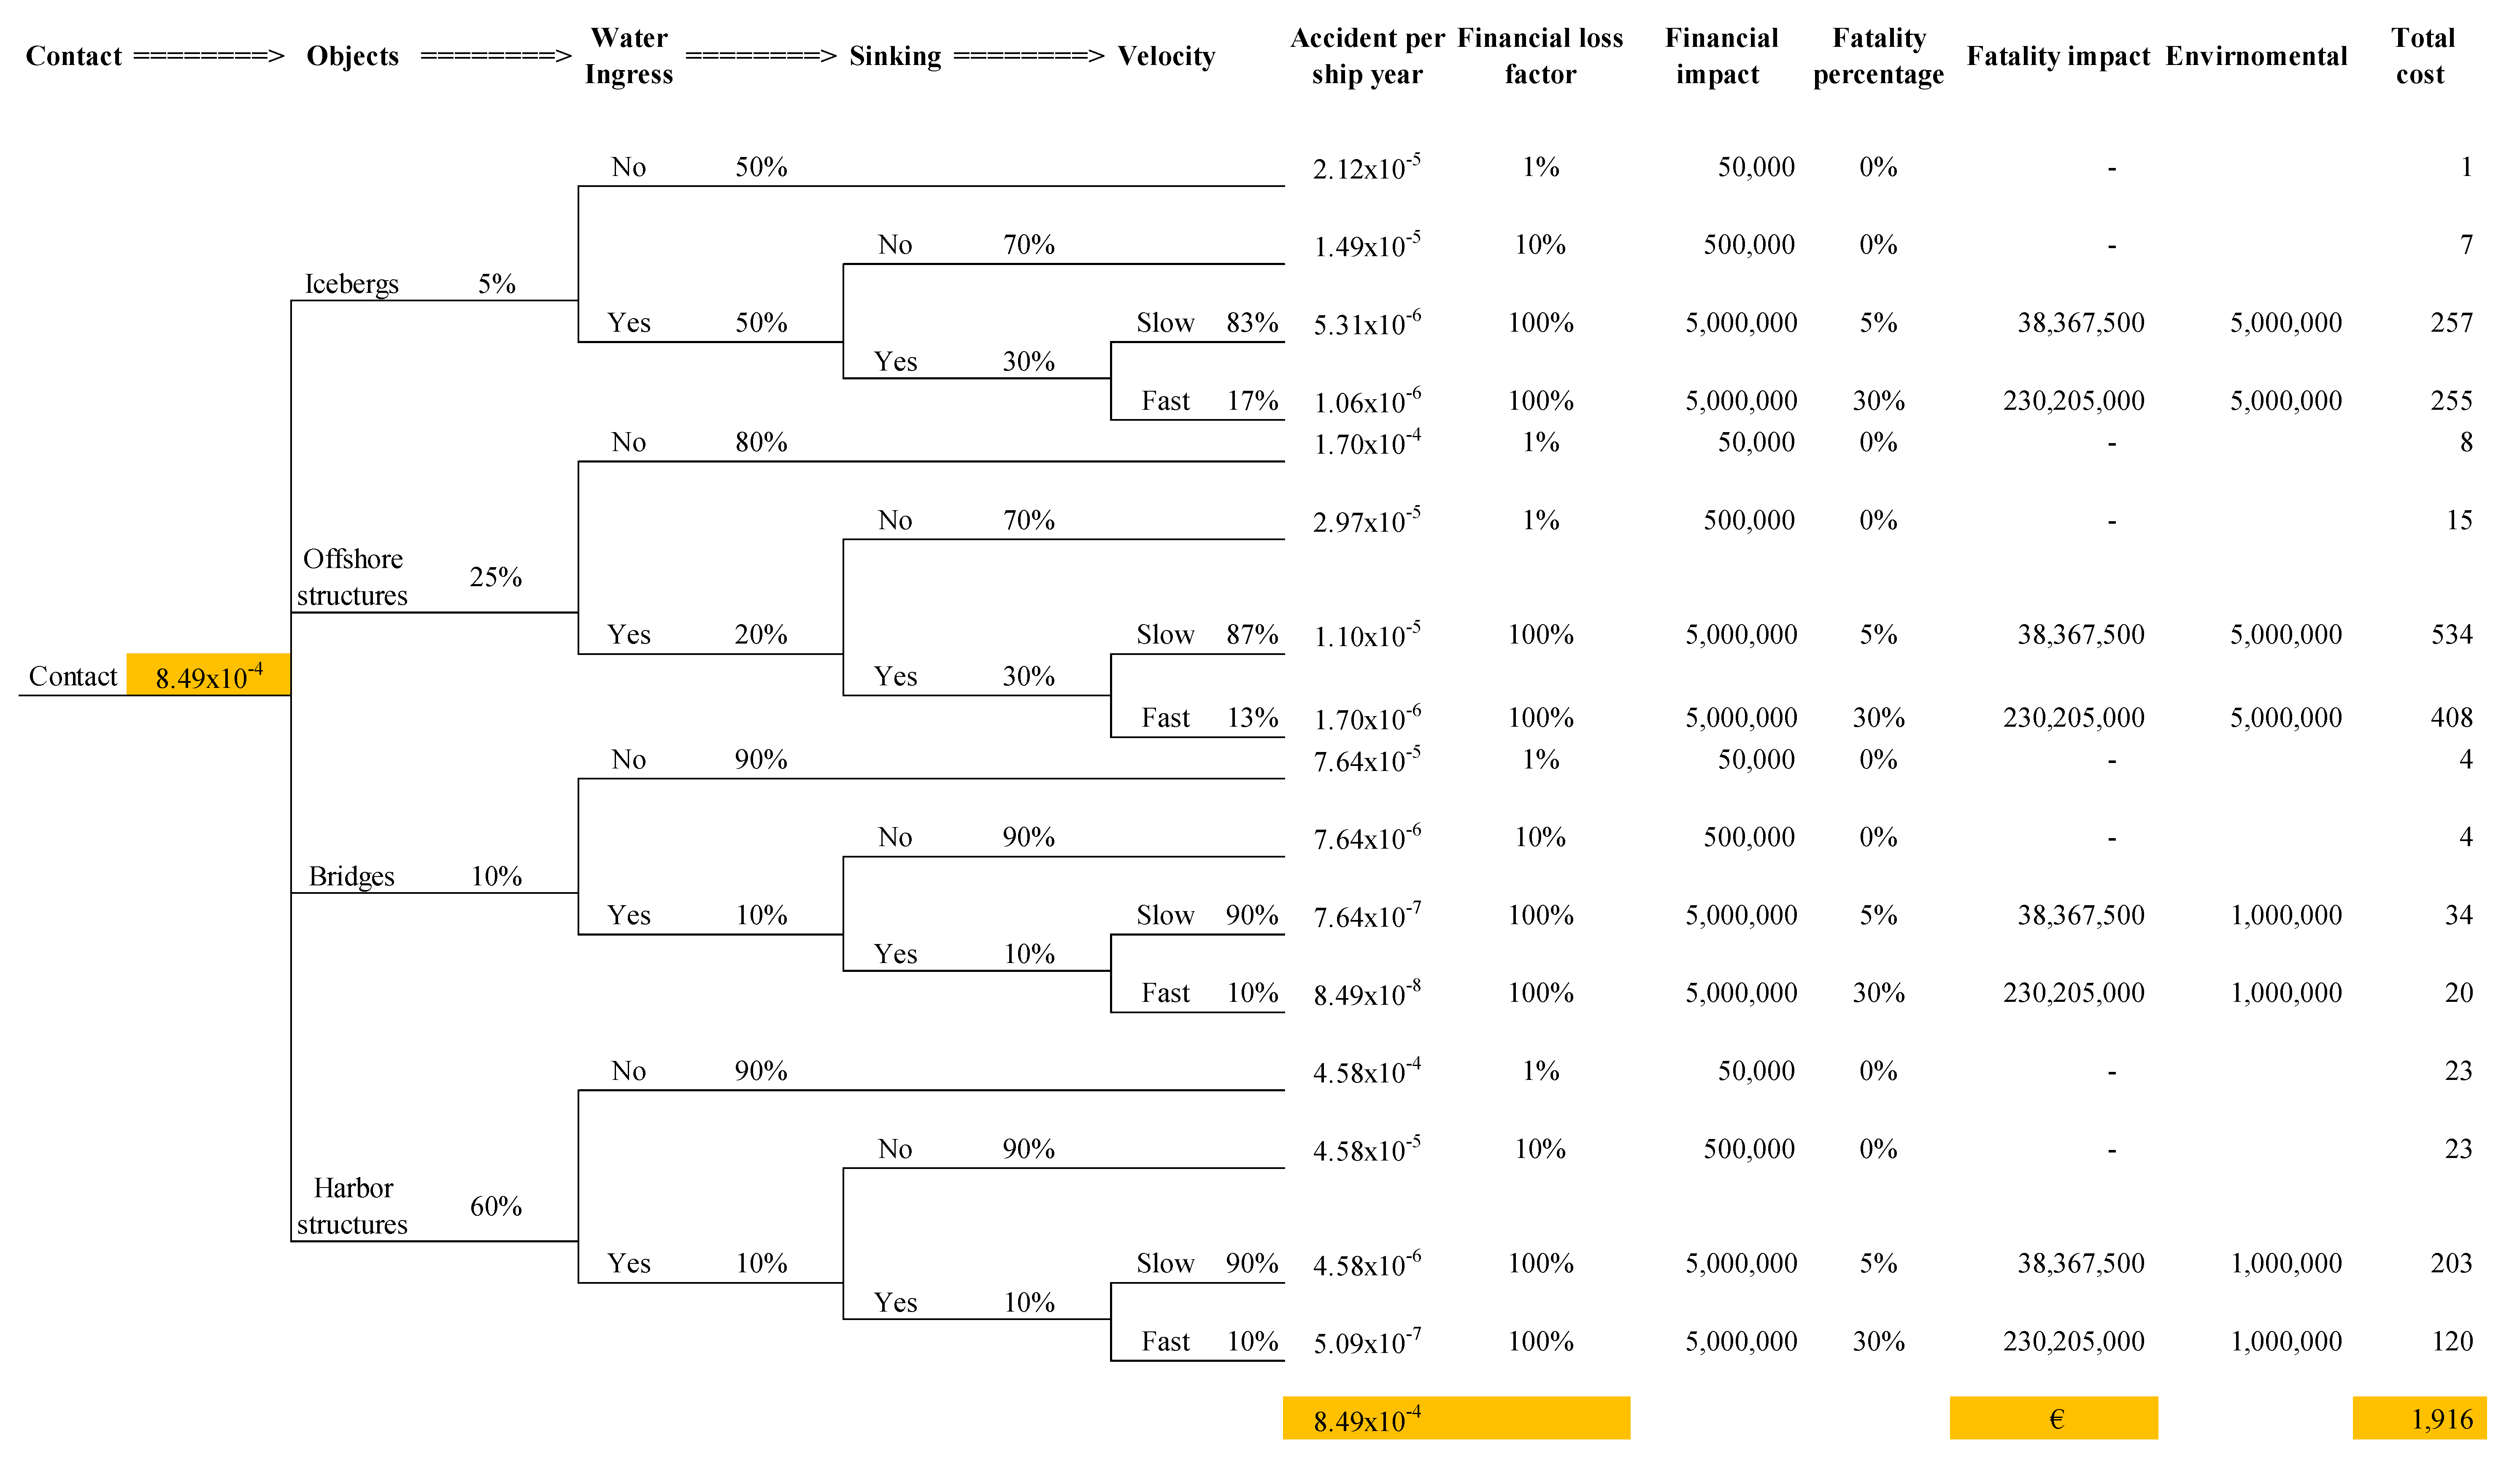
- Contact:
- The financial loss factor is 10% for water ingress only and 1% for non-water ingress;
- The fatality rate is 30% under fast capsizing and 5% for slowly capsizing;
- A deep-sea salvage will cost €5M and a near shore (shallow water) one will cost €1M;
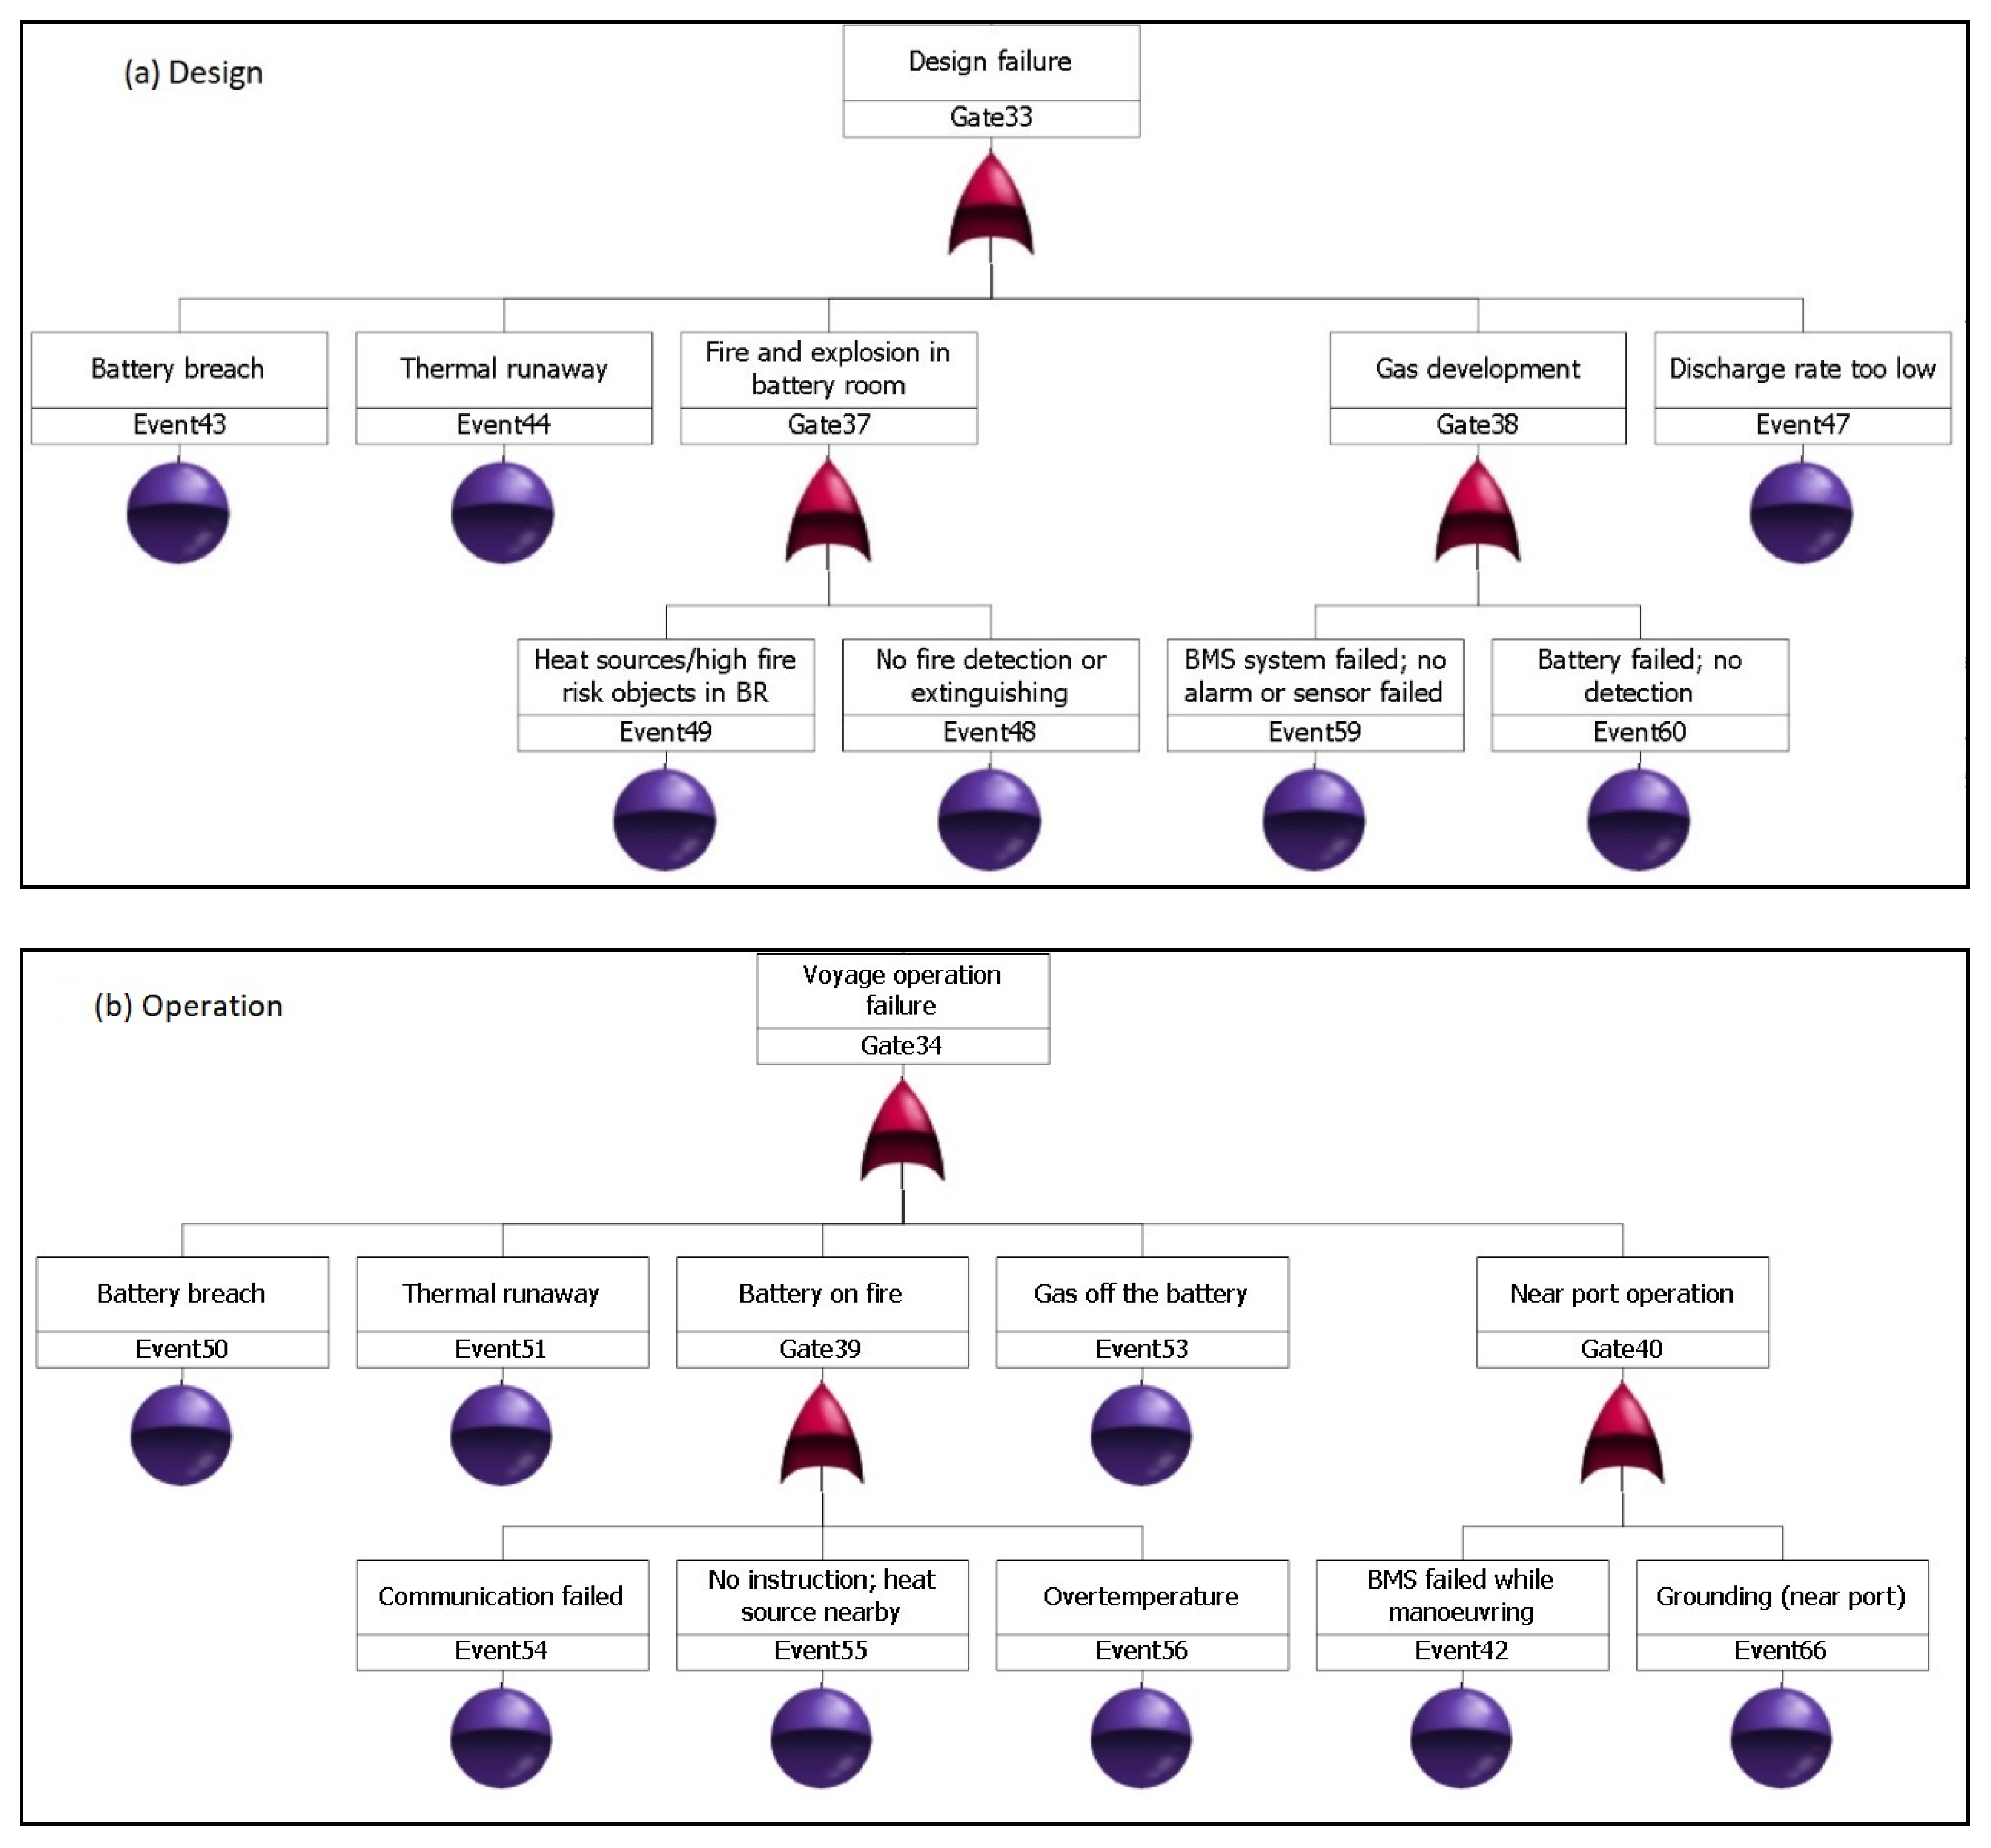
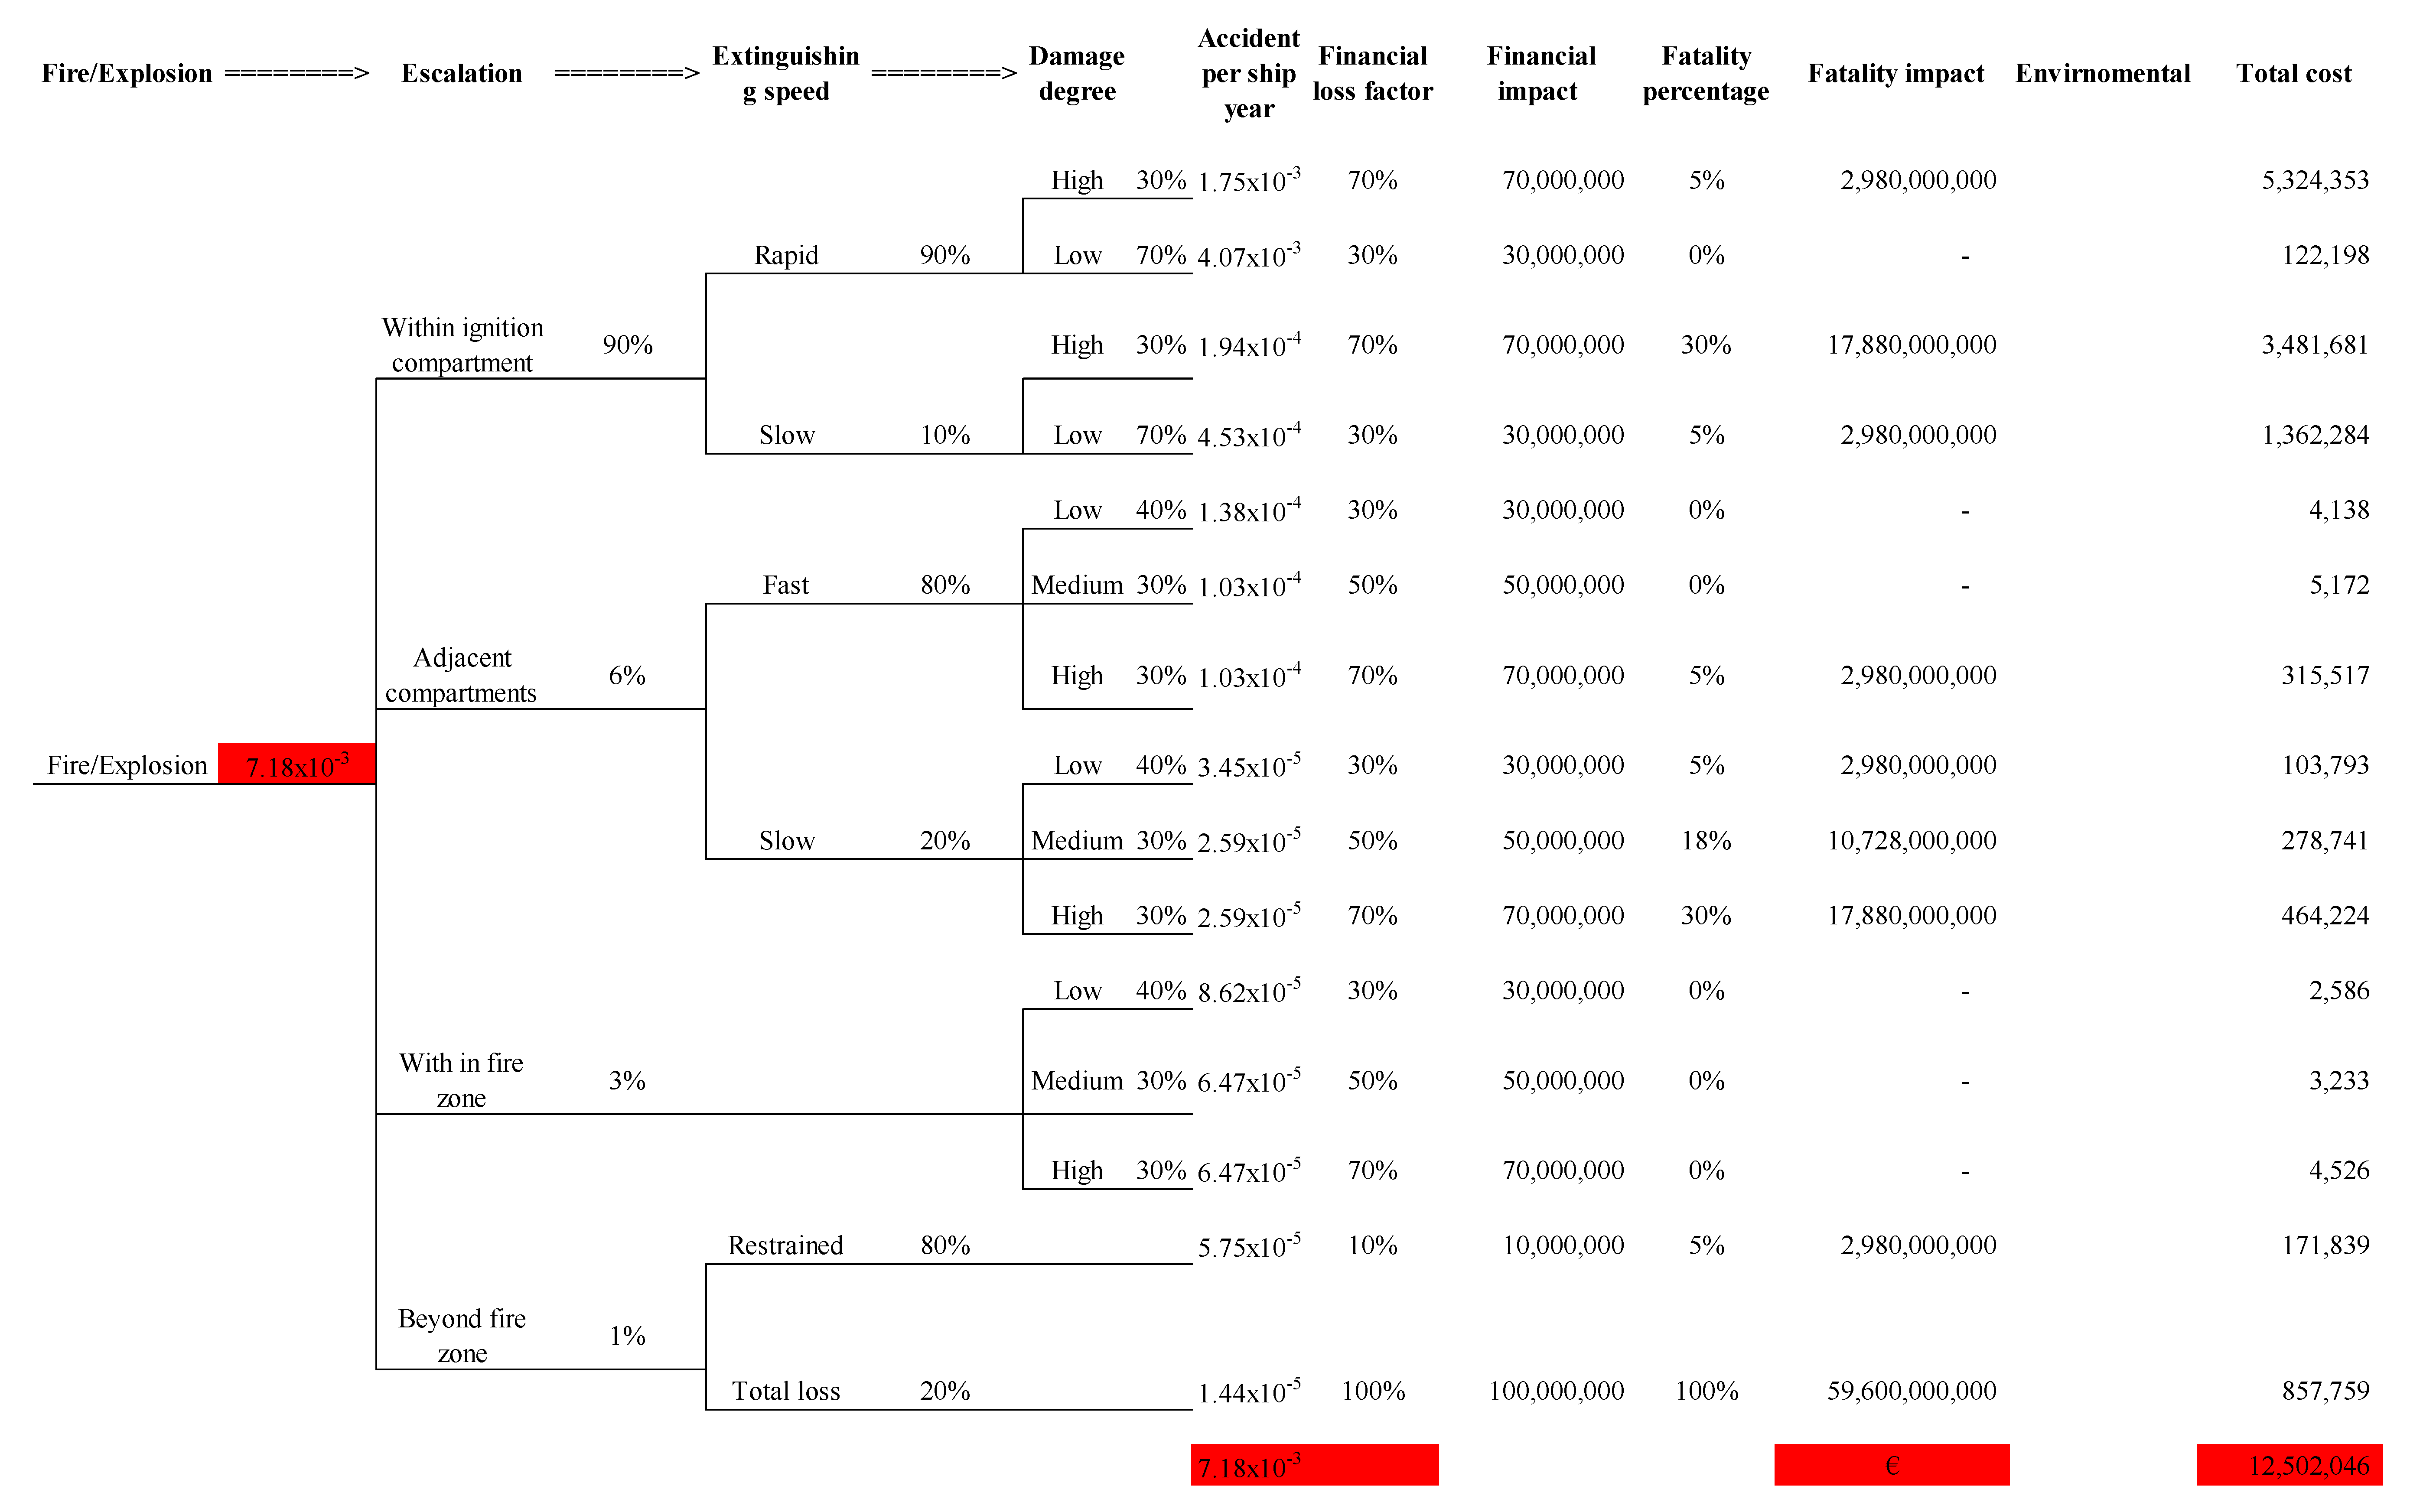
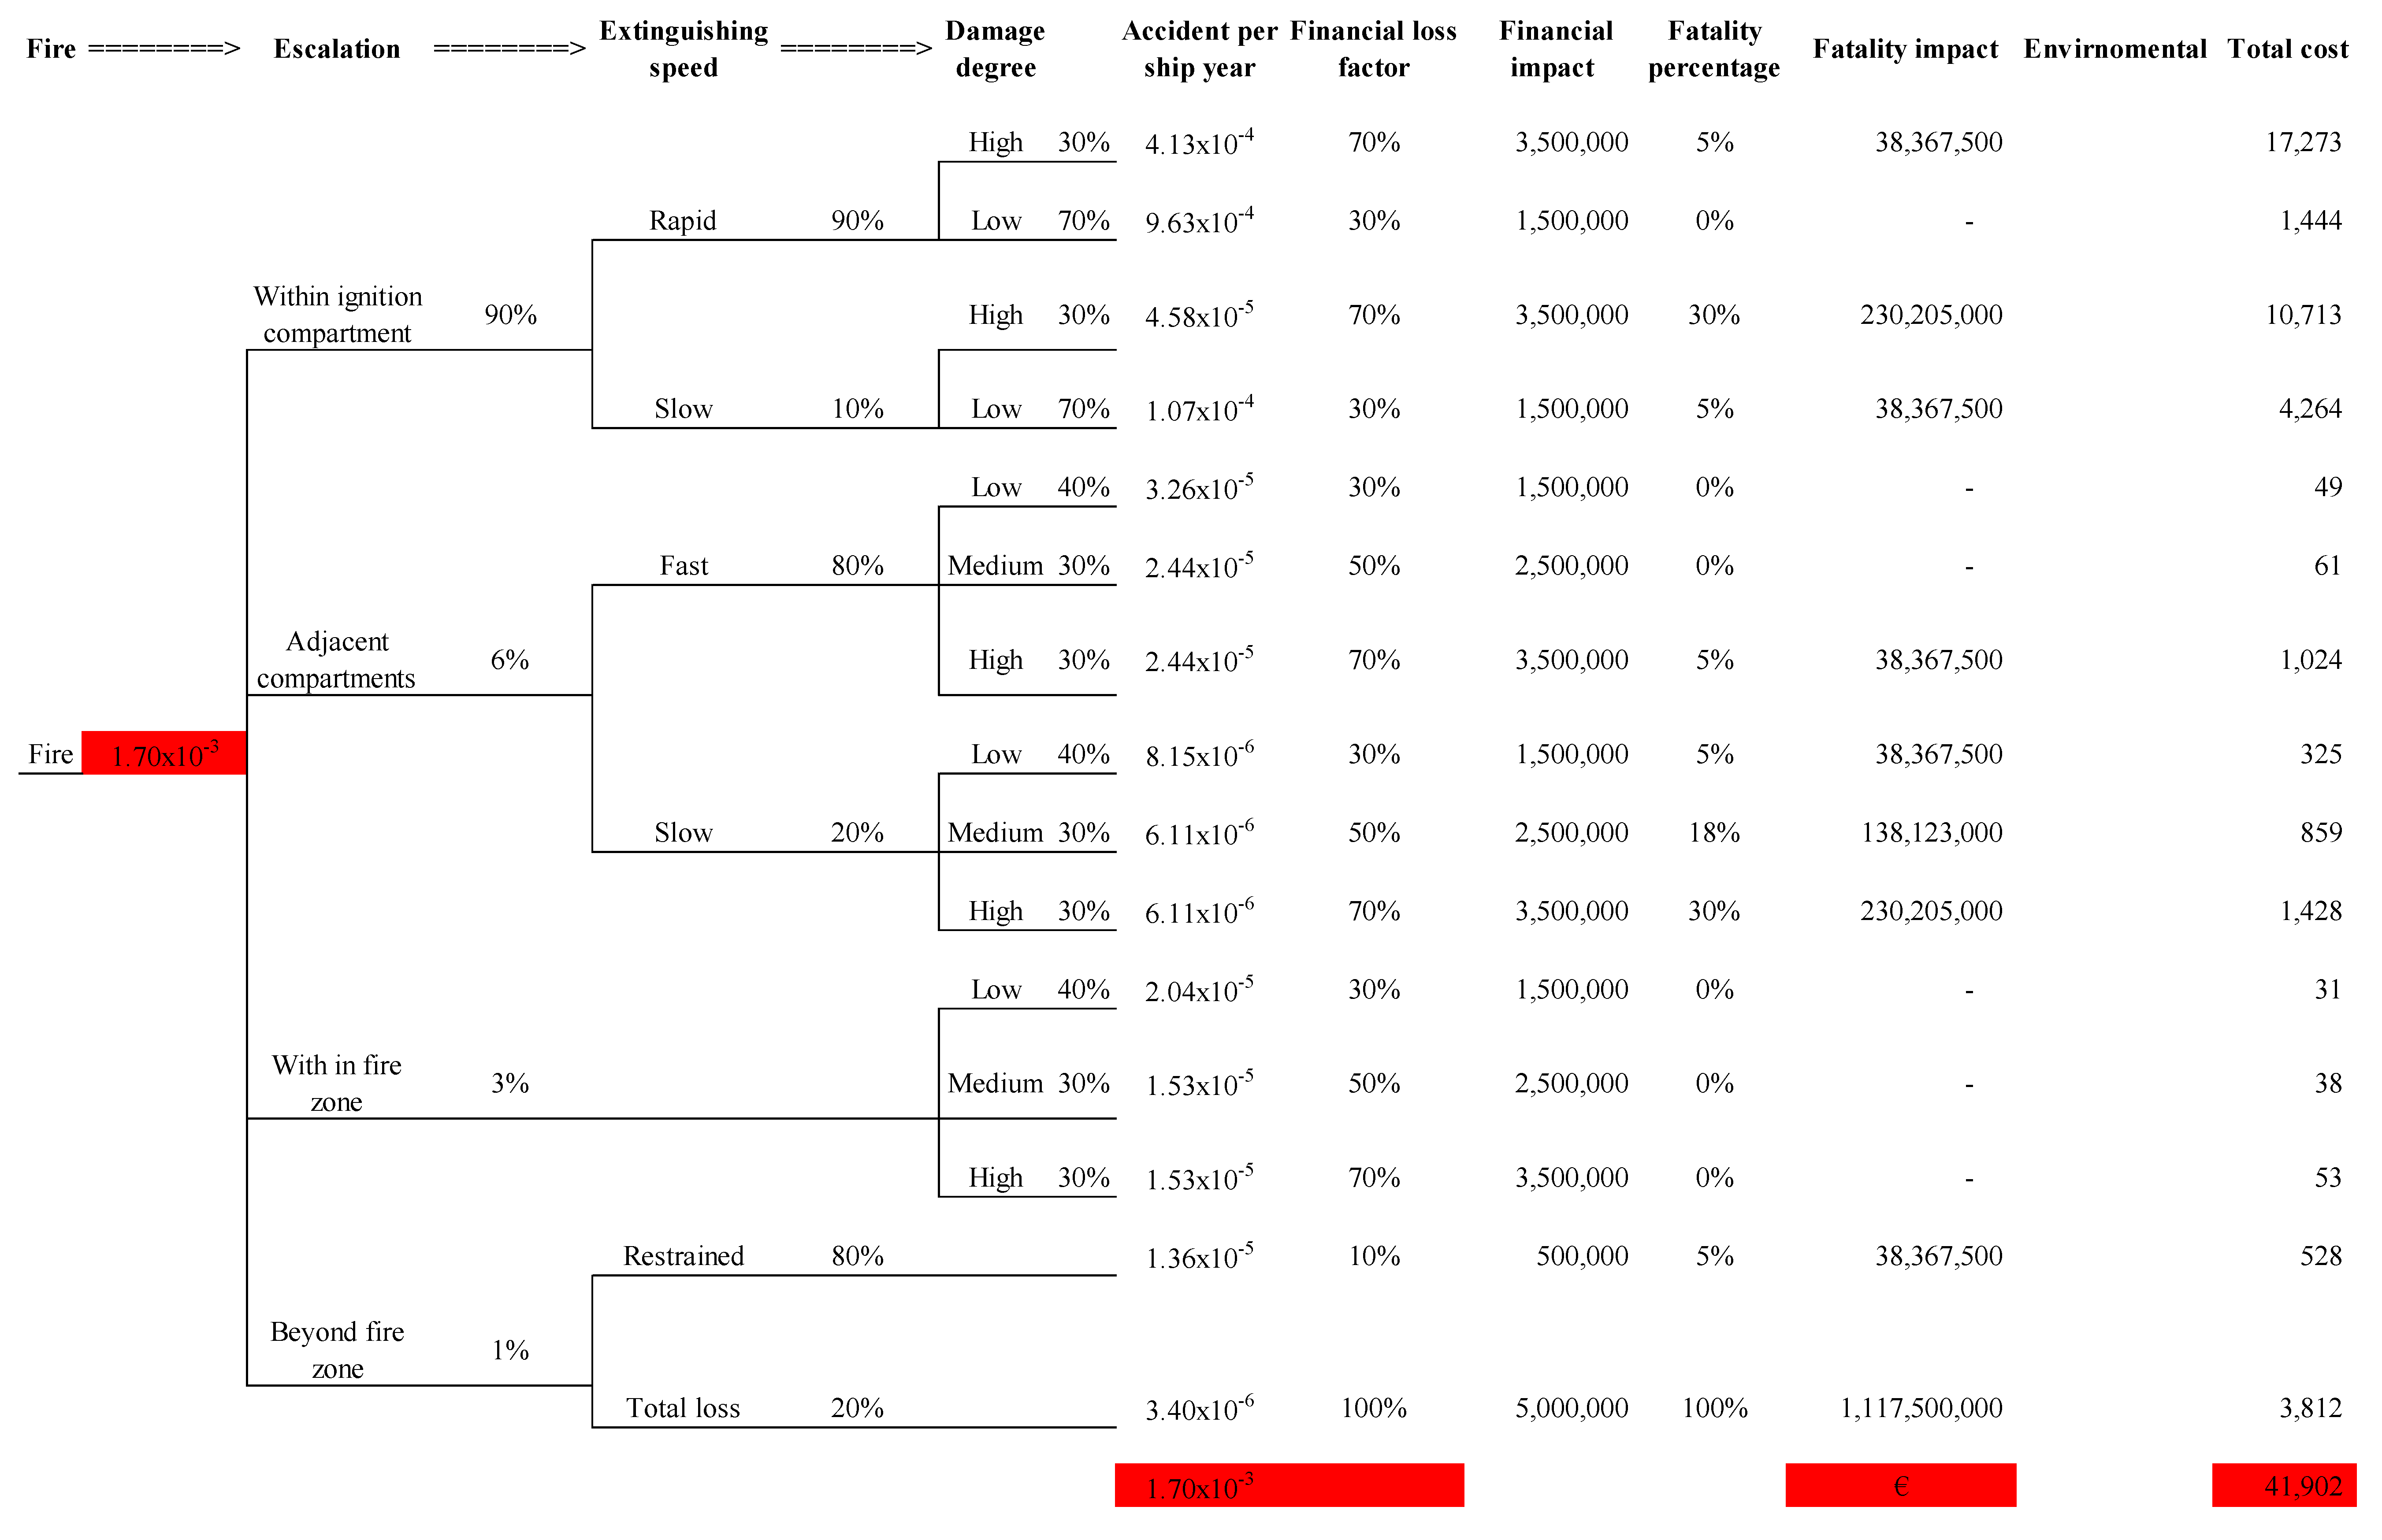
- Fire
- High, medium and low damage degree fire have financial loss factor of 70%, 50%, and 30%, respectively;
- Restrict fire inside the ignition compartment but rapidly suppressed will have fatality rates of 5% and 0% for high and low damage degree; for slow fire suppression situation, the fatality rates rise to 30% and 5%.
- For fire expanded to the other compartment, when the fire is suppressed fast, the fatality rates are 5%, 0% and 0% for high, medium and low damage degree; for slow fire suppression, the rates rise to 30%, 18% and 5%;
- No salvage required.
- IR is the individual risk;
- F is the frequency;
- P is the resulting casualty probability;
- E is the factional exposure to that risk.
2.5. Cost-Benefit Analysis of Risk Control Options
- ΔC is the cost per ship of the risk control option during the lifetime of the vessel.
- ΔB is the economic benefit per ship resulting from the implementation of the risk control option during the lifetime of the vessel.
- ΔR is the risk reduction per ship, in terms of the number of fatalities averted, implied by the risk control option during the lifetime of the vessel.
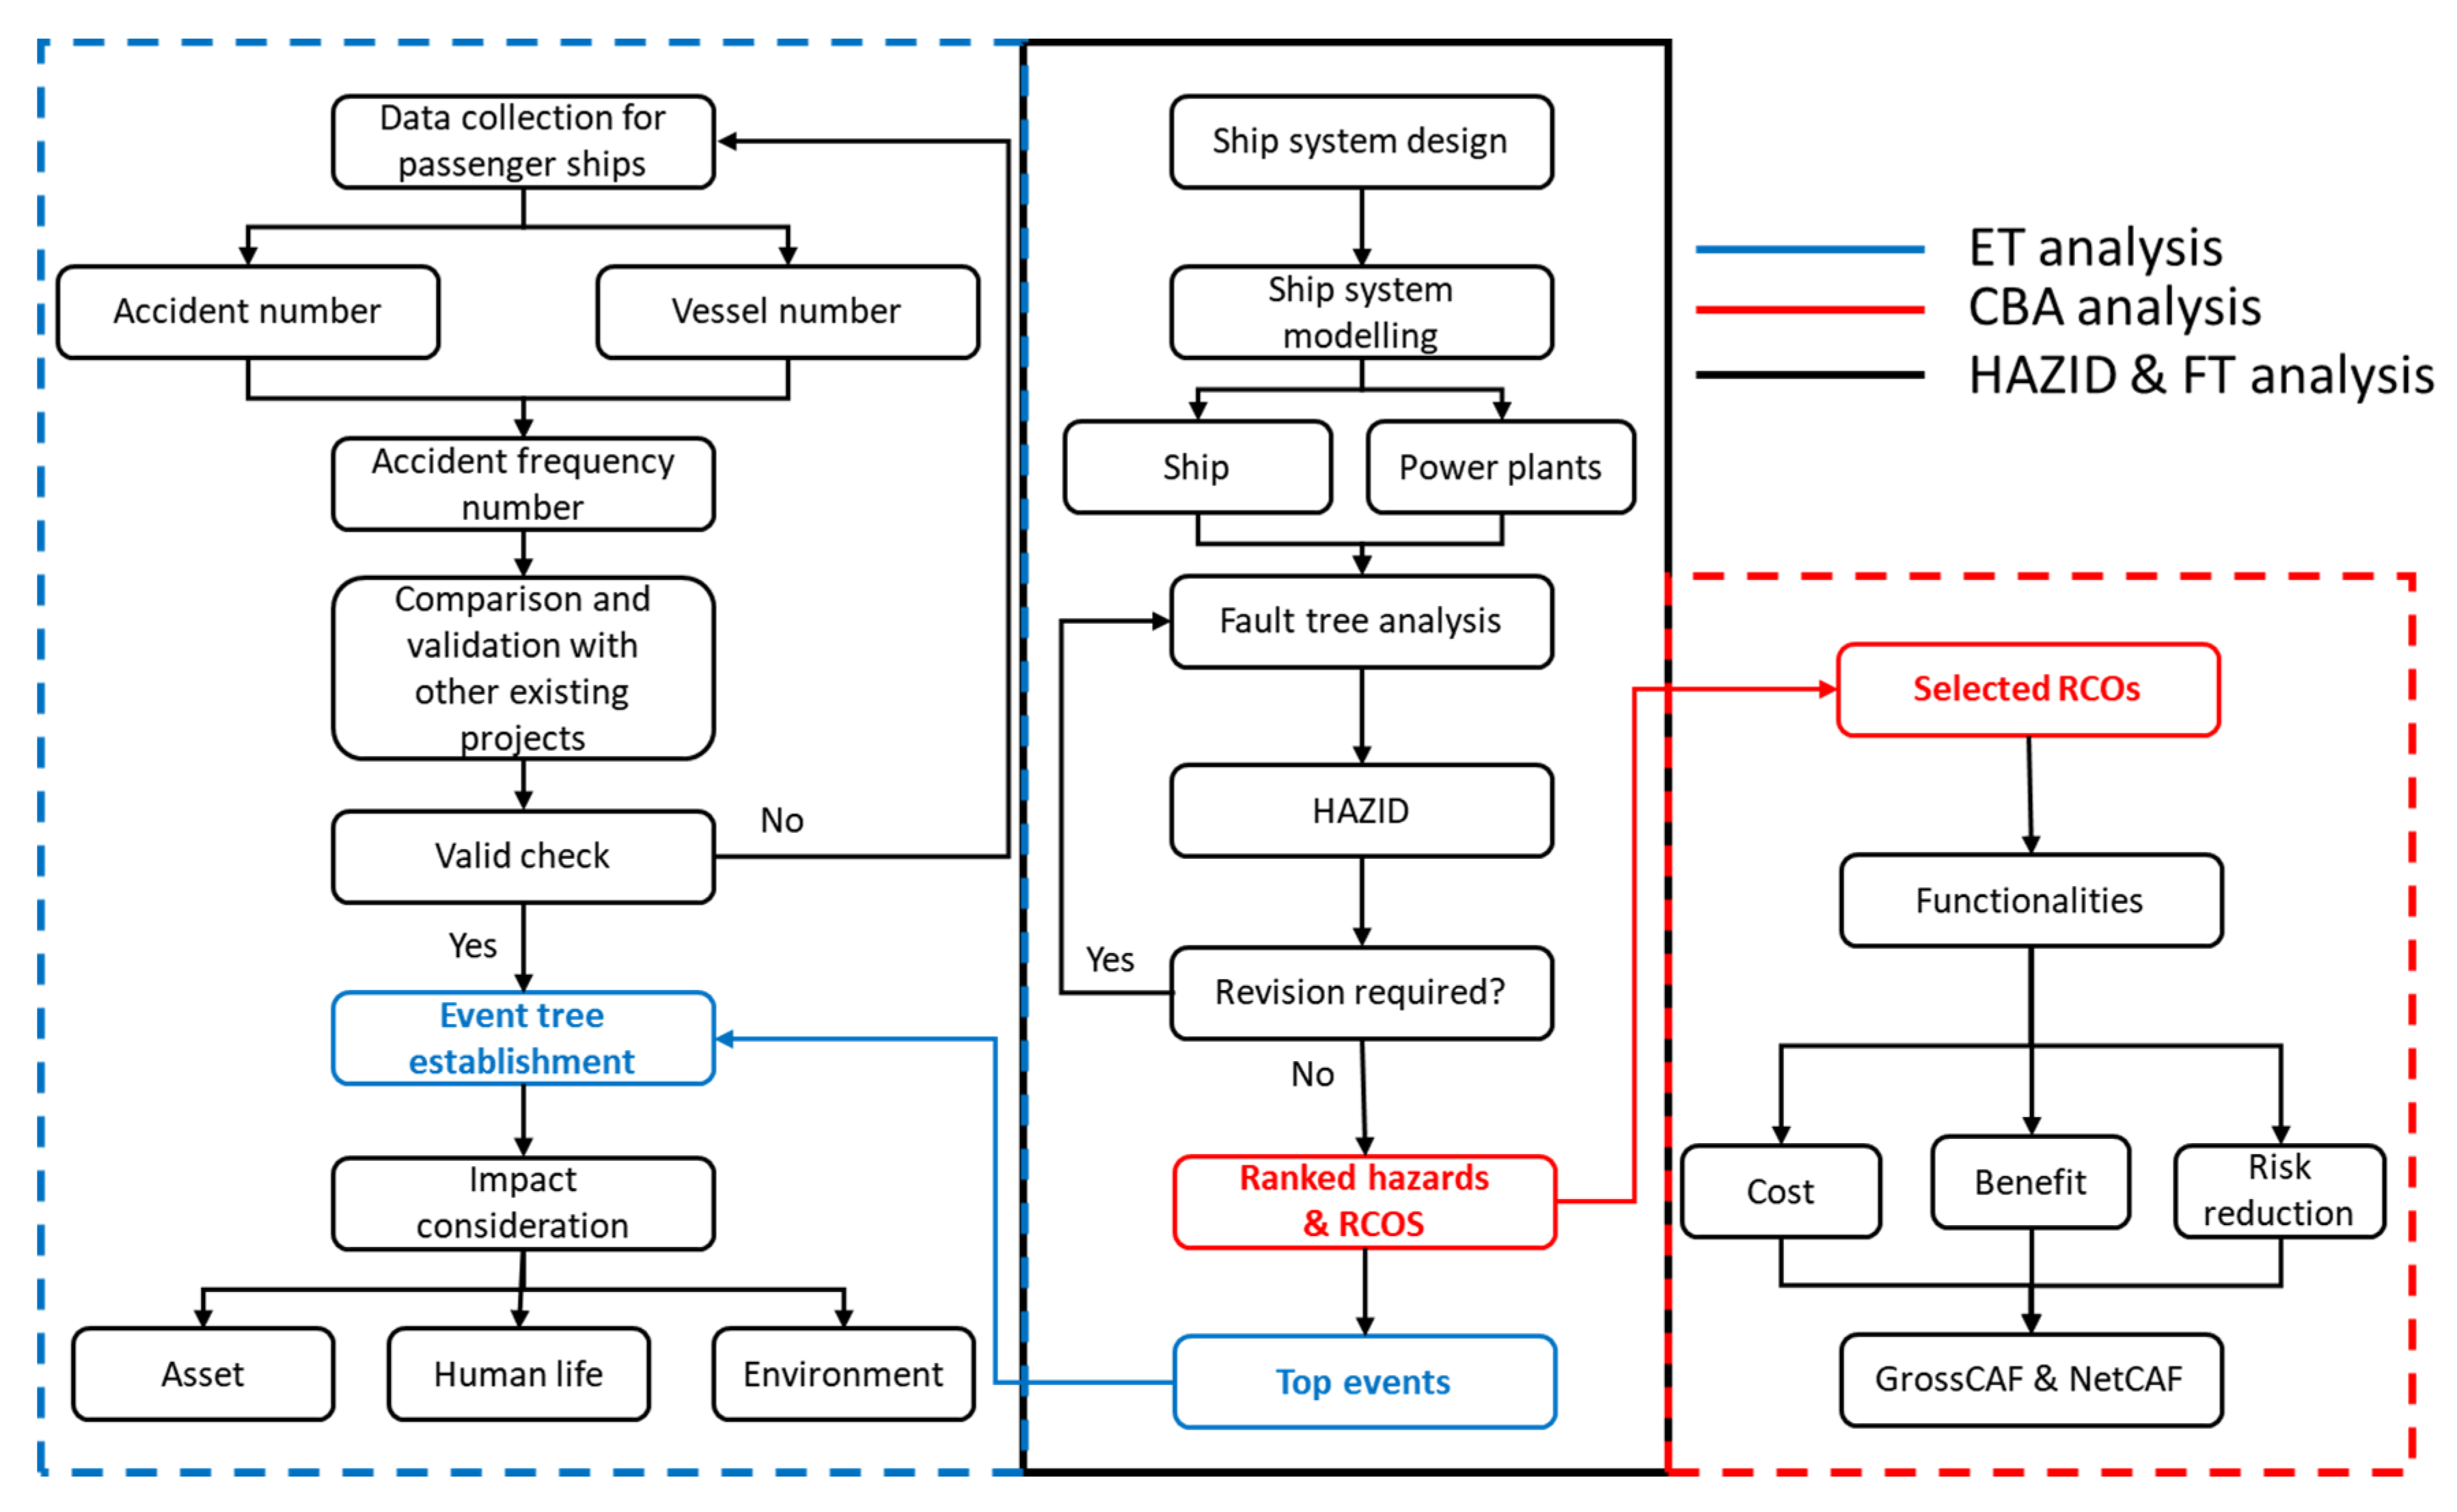
2.6. General Approach
3. Case Study
3.1. Case Ship
3.2. Battery System
3.3. Scope of This Study
4. Risk Assessment Results and Discussion
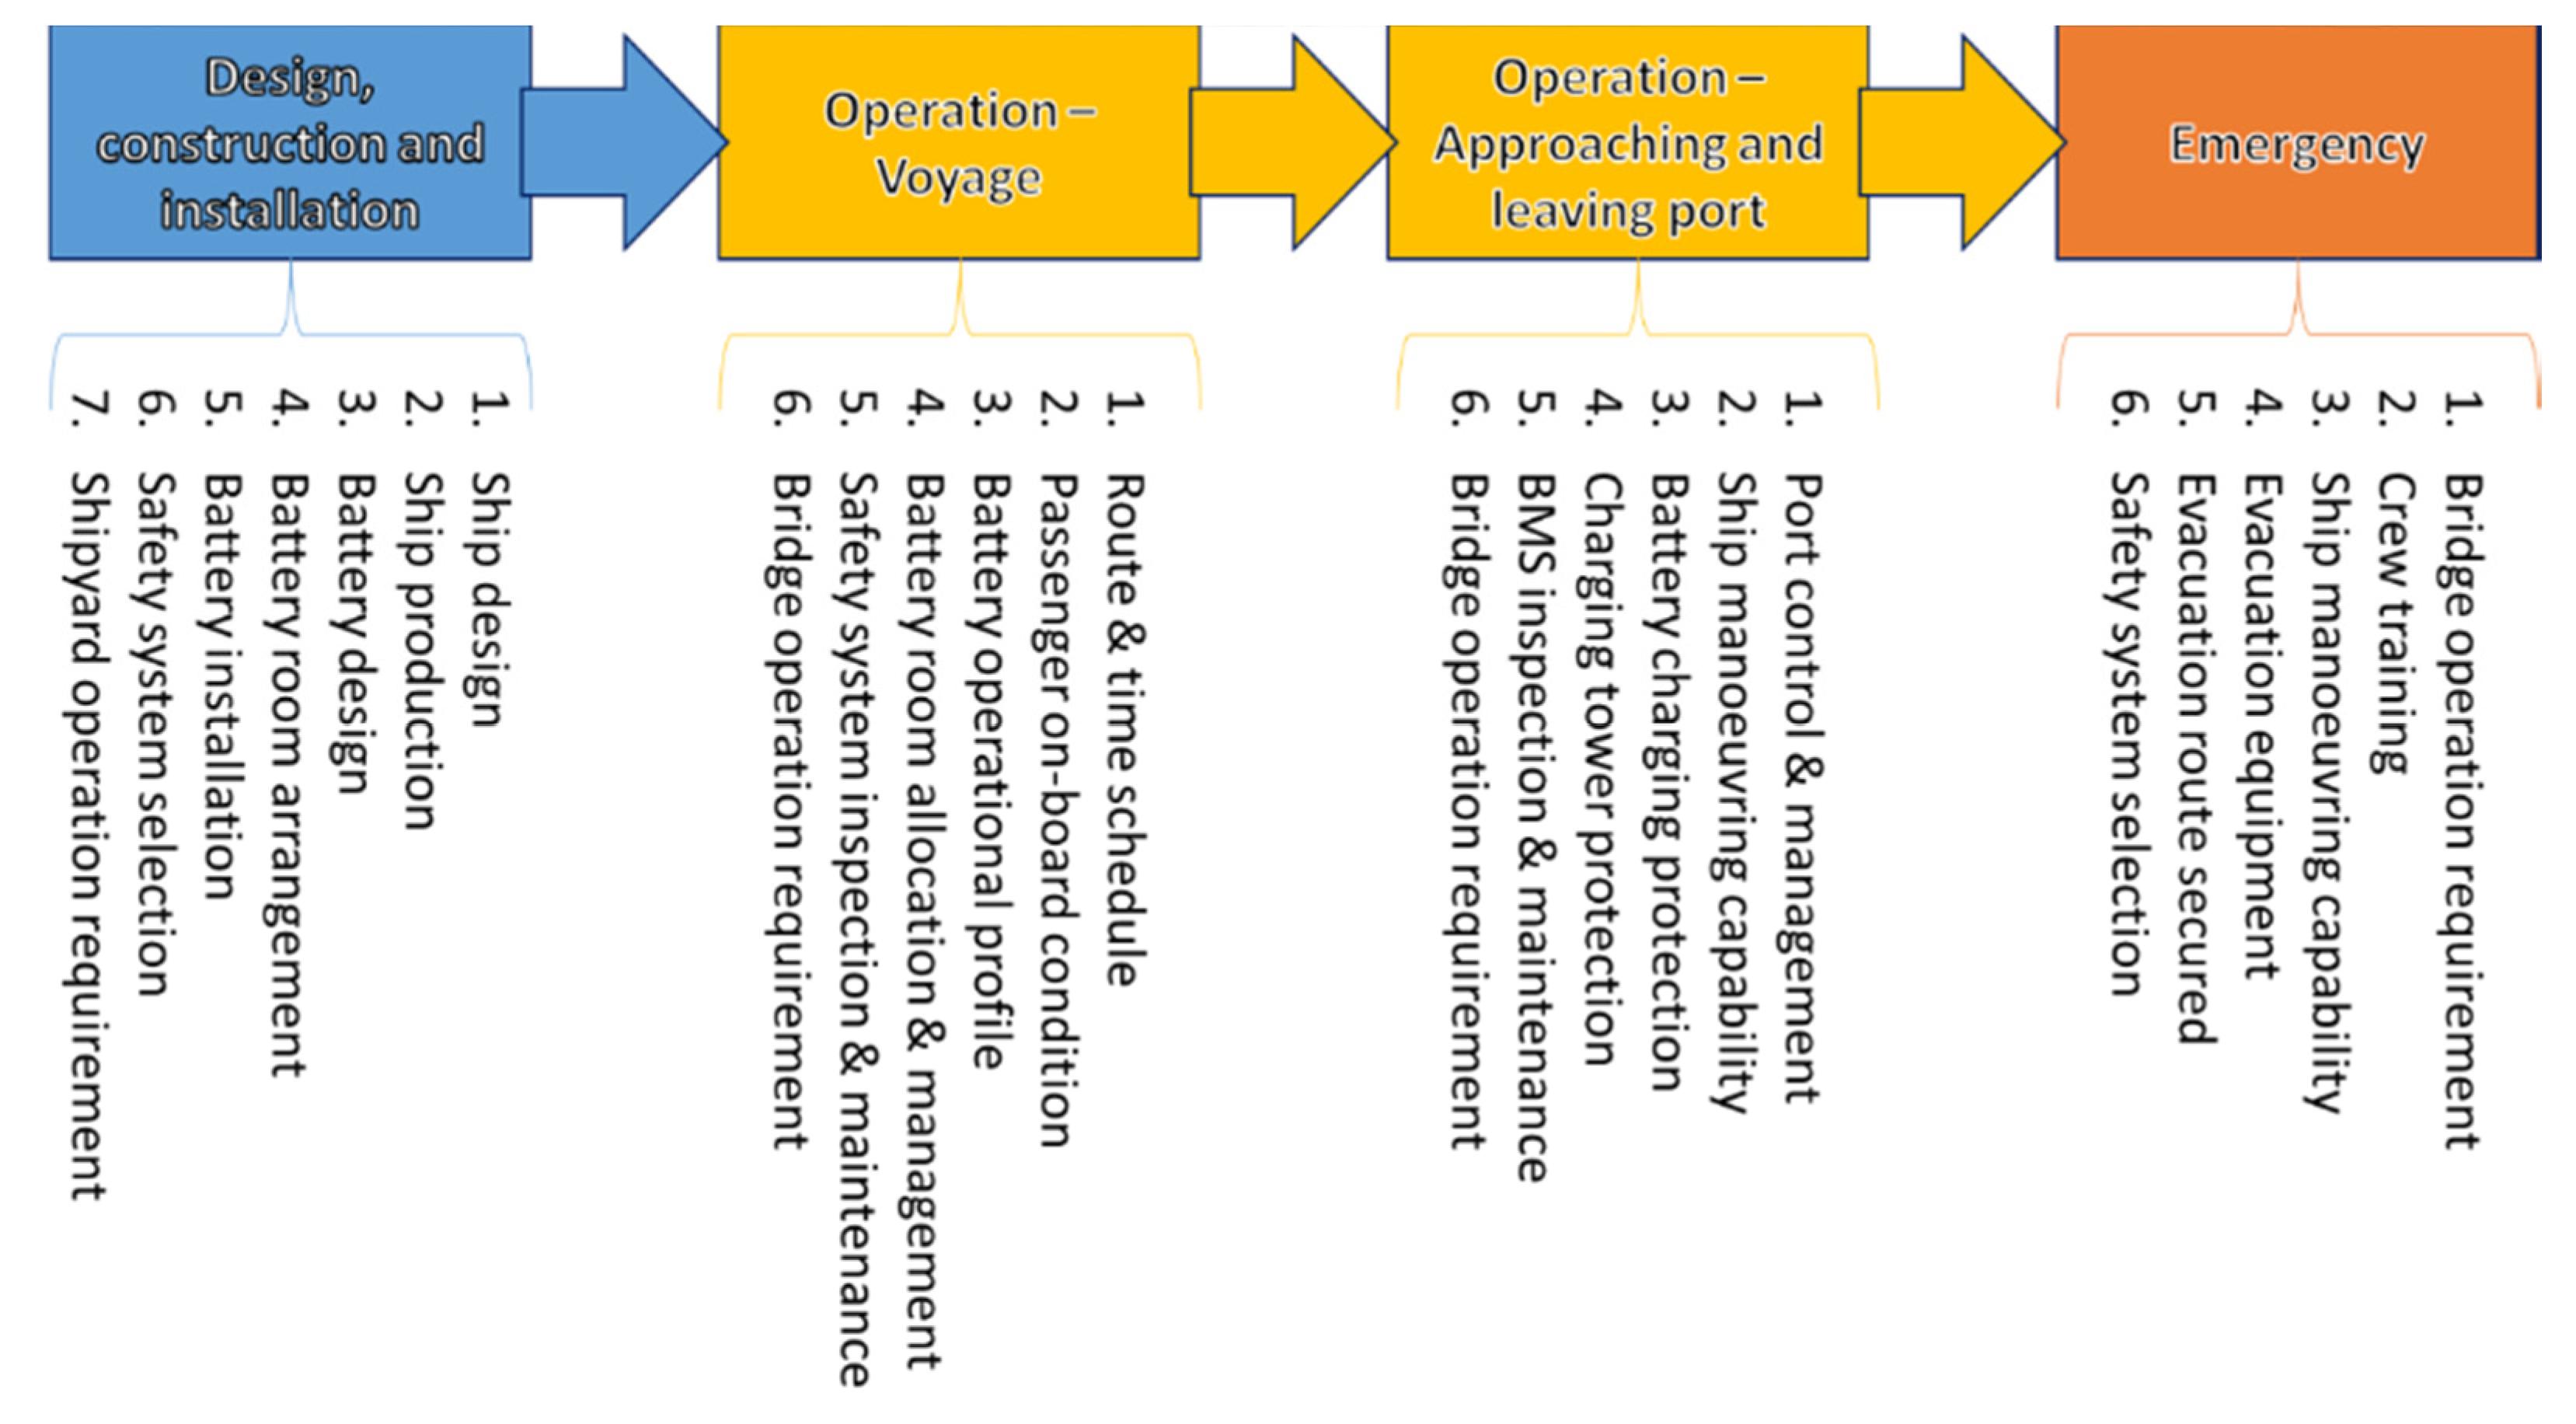
4.1. HAZID
- Design, construction, installation (21 hazards);
- Operation (25 hazards);
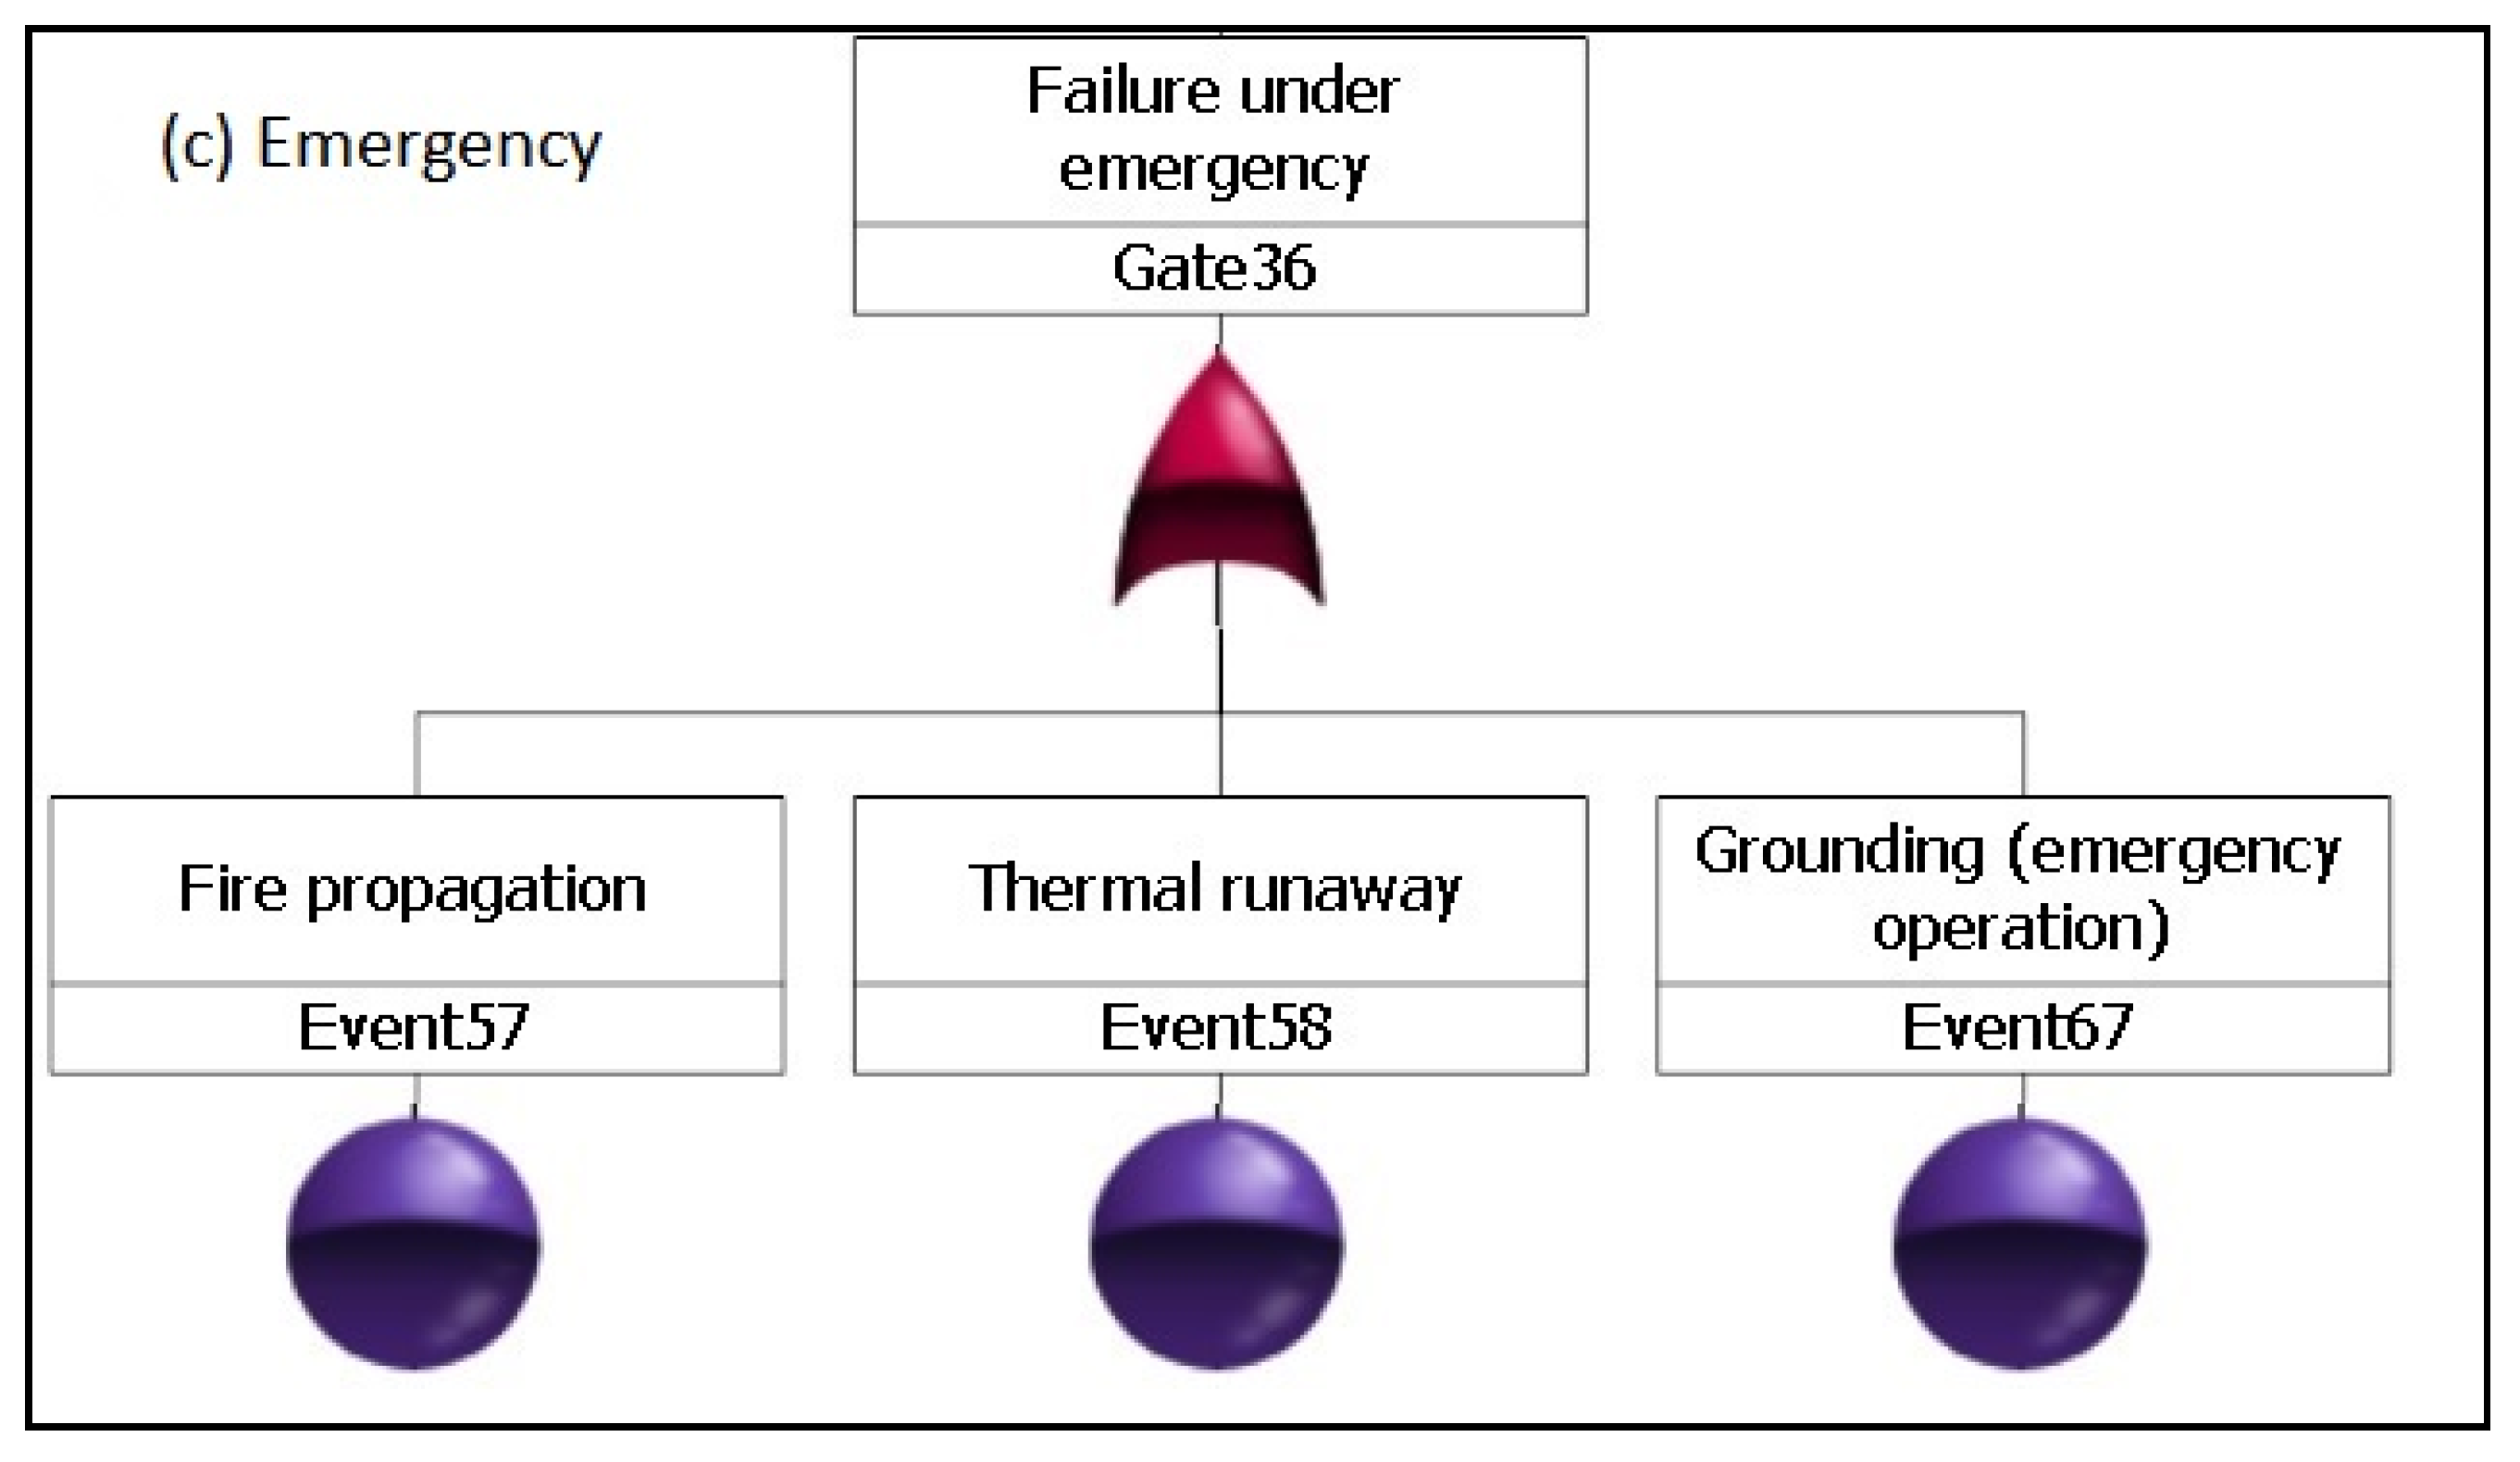
- Emergency (9 hazards).
4.2. Uncertainty Analysis
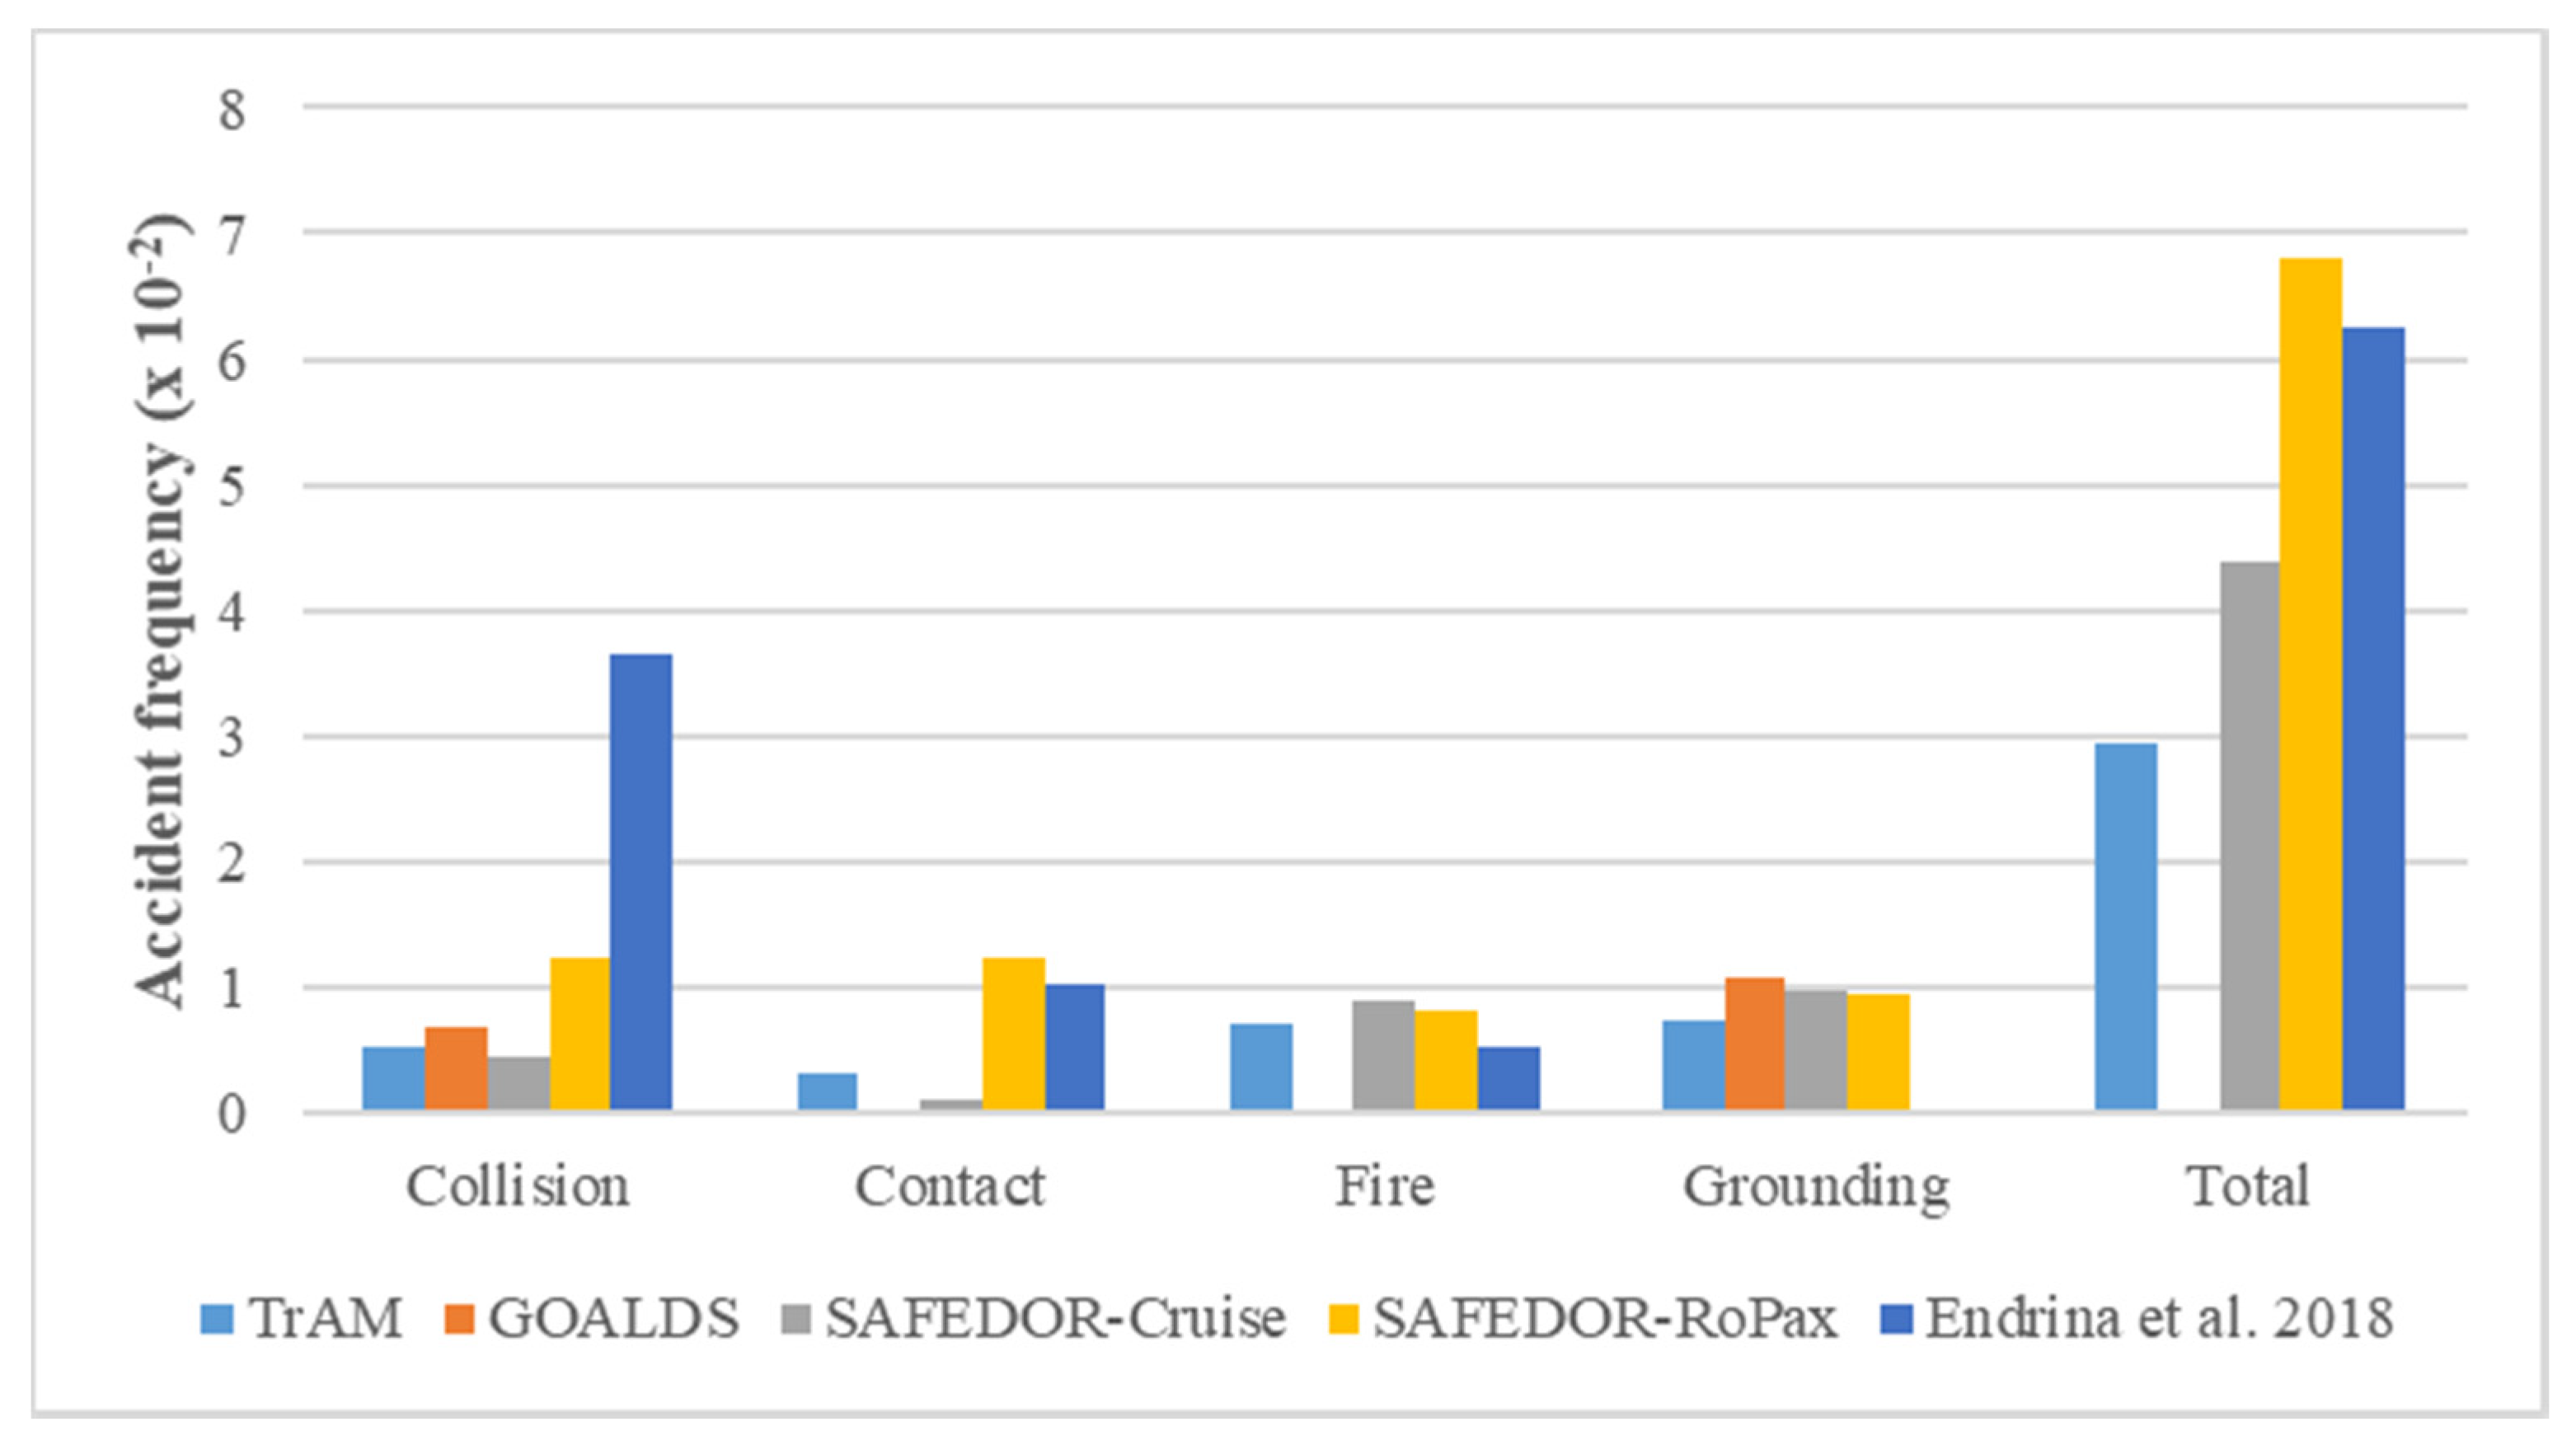
4.3. Accident Statistics
4.4. Event Tree Analysis
- Collision
- ○
- Struck/Striking = > Operational state = > Water Ingress = >Sinking = > Consequences
- Contact
- ○
- Contact Objects = > Water Ingress = >Sinking = > Fatalities = > Consequences
- Fire
- ○
- Escalation = > Extinguishing speed = > Damage degree = > Consequences
- Grounding
- ○
- Navigation = > Sea Bed = > Water Ingress = > Staying Aground = > Afloat = > Consequences
4.5. RCOs and Cost Assessment
- 1.
- Move the battery room on the main deck:
- 2.
- Select proper firefighting system:
- 3.
- Add alarm system:
- 4.
- Pre-test system/equipment:
- 5.
- Supply protection for crew:
- 6.
- Regular inspection and maintenance:
- 7.
- Crew training:
5. Conclusions and Recommendations
- The accident frequencies for vessels, and high-speed battery-driven ferries, are not significantly different from the ones for larger passenger ships;
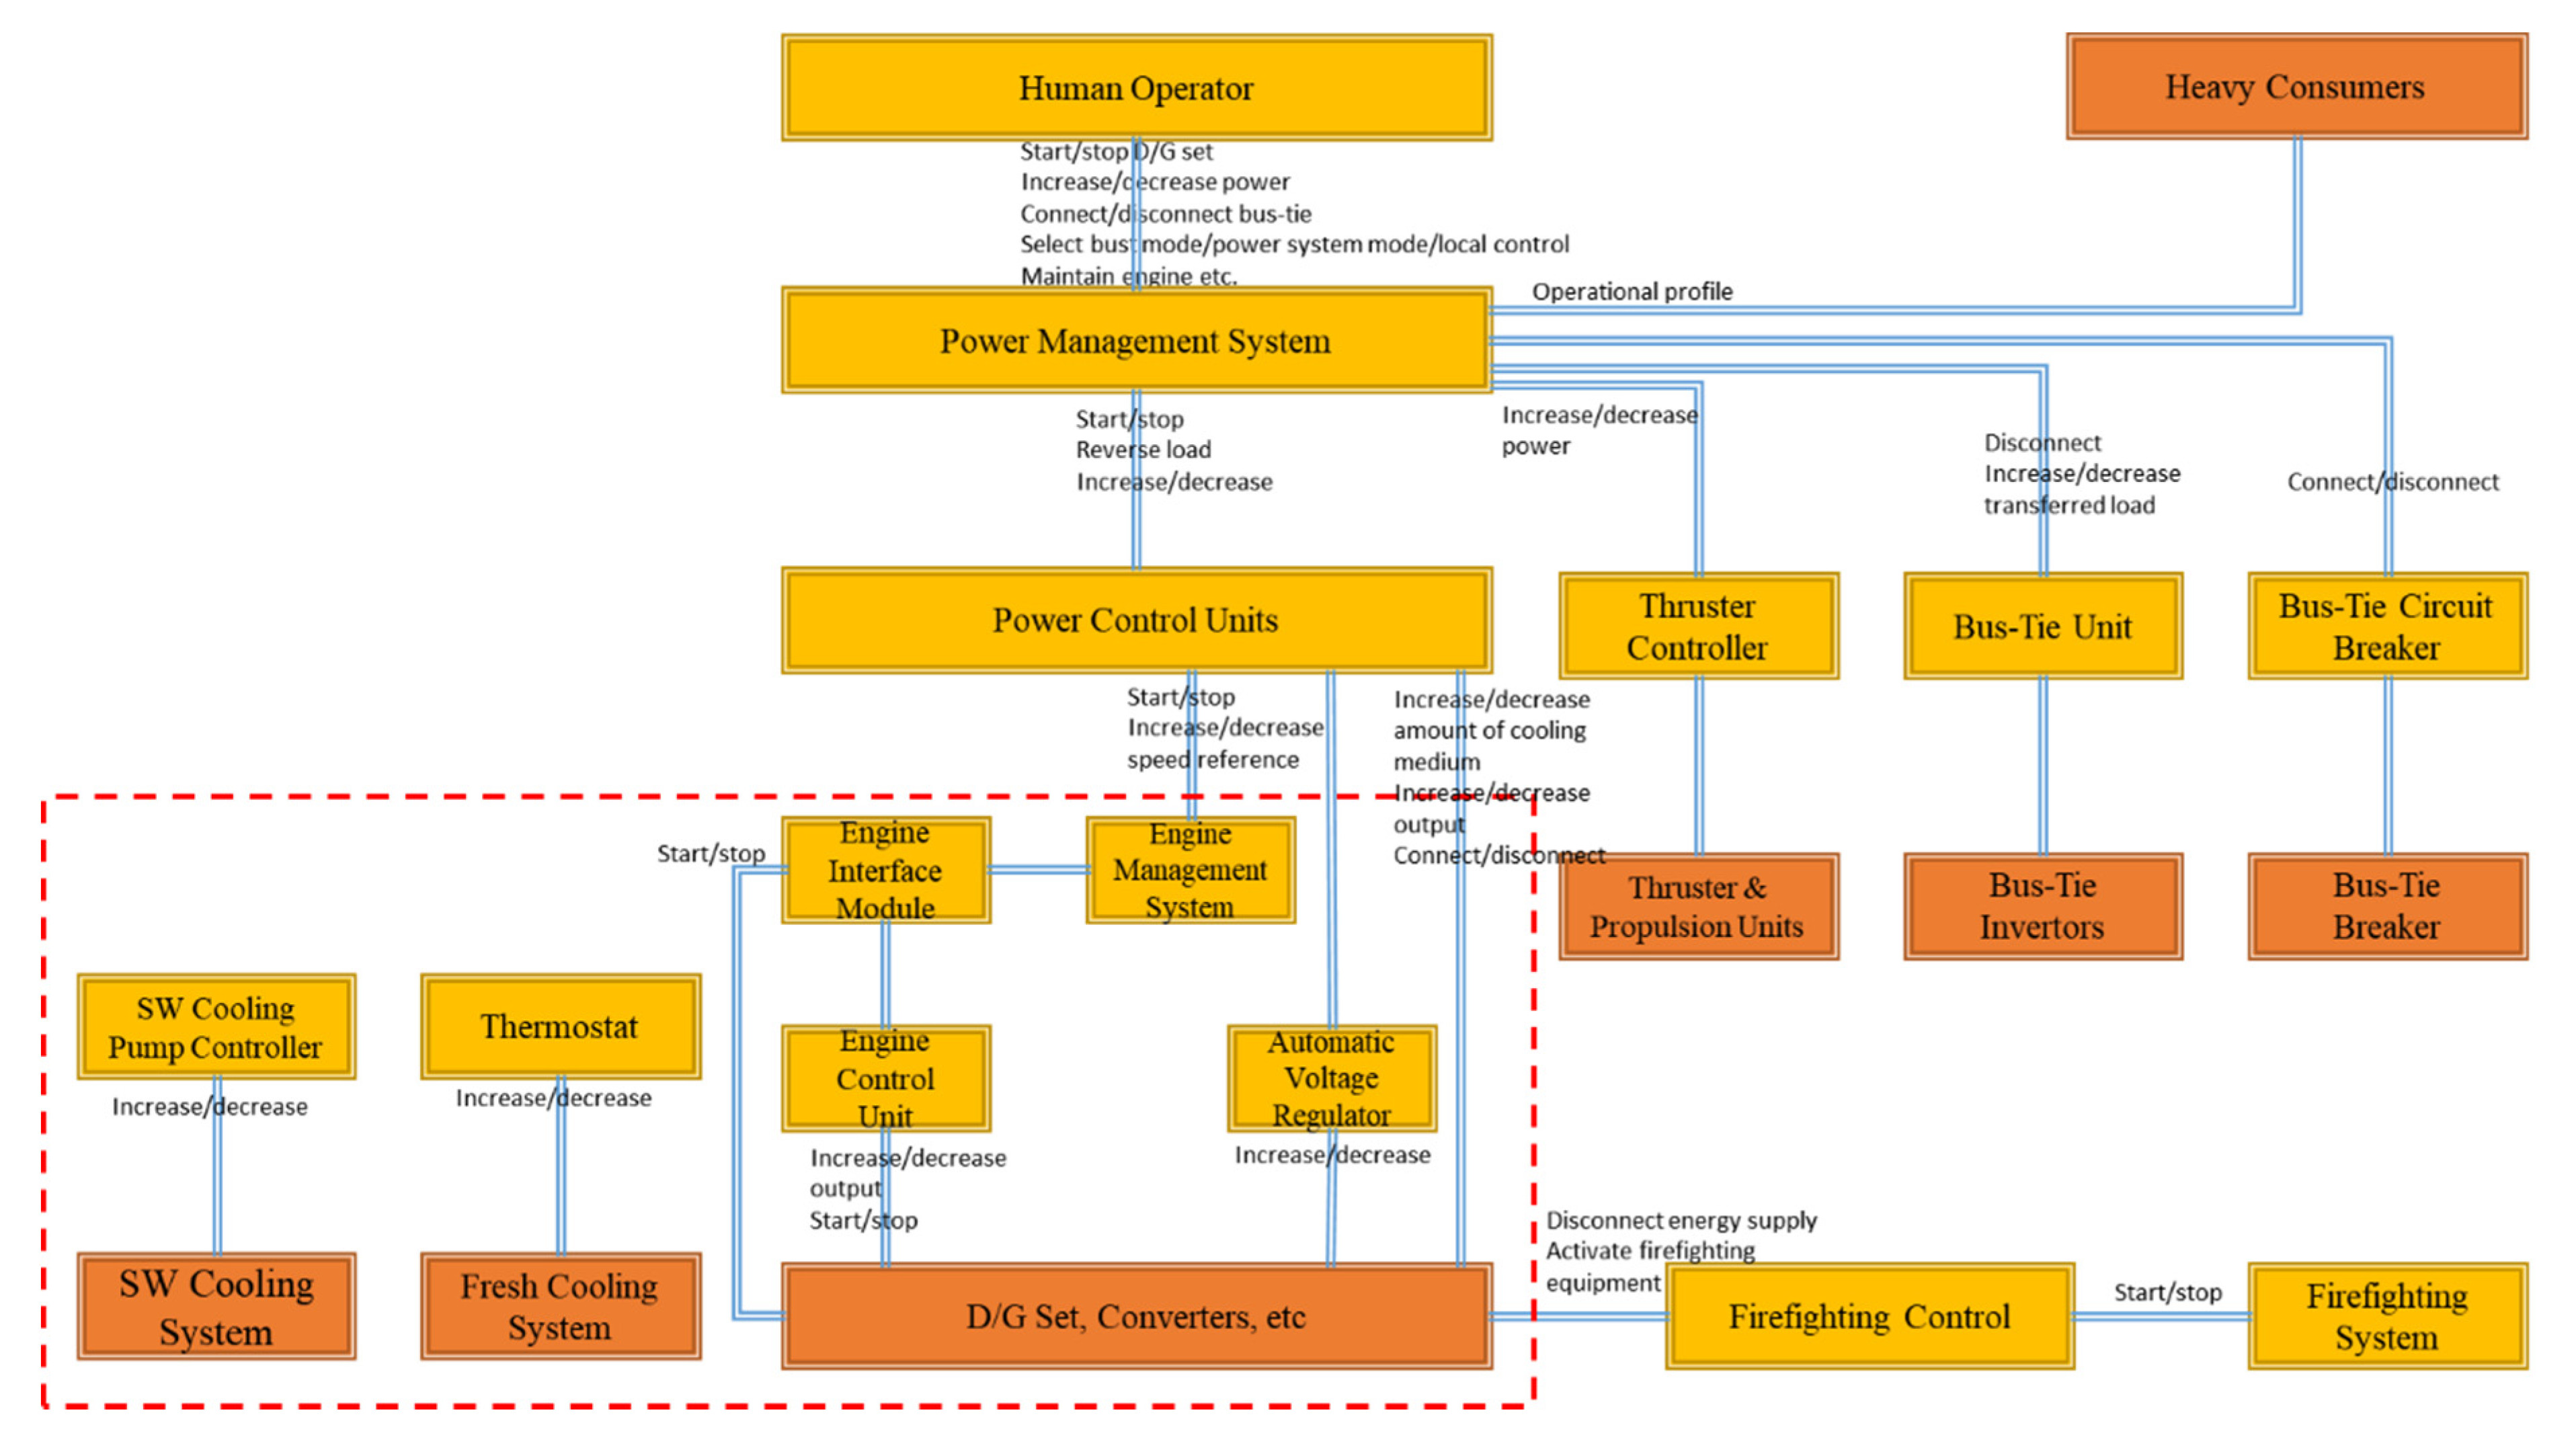
- The system architecture (Figure 4), especially the battery management system, does not raise any concerns regarding higher accident frequencies. This needs to be confirmed with the final battery management system (BMS) design and the more detailed analysis the manufacturer will perform as the ship design progresses;
- The updated event trees and the quantitative risk assessment show that the vessel’s design is as safe as existing ships.
- Risk control options for further reduction of the risk have been examined. Among all the proposed risk control options, the relocation of the battery room on the main deck is the most cost-effective RCO.
Author Contributions
Funding
Acknowledgments
Conflicts of Interest
Abbreviations
| € | Euro |
| AC | Alternating Current |
| CAF | Cost of Averting Fatality |
| CAPEX | Capital Expenditures |
| CBA | Cost-benefit Analysis |
| CI | Consequence Indices |
| CO2 | Carbon Dioxide |
| DC | Direct Current |
| DG | Diesel Generator |
| EMSA | European Maritime Safety Agency |
| ET | Event Tree |
| ETA | Event Tree Analysis |
| FAR | Fatality Accident Rate |
| FIRESAFE | Study Investigating Cost Effective Measures for Reducing the Risk from Fires on Ro-Ro Passenger Ships |
| FSA | Formal Safety Assessment |
| FT | Fault Tree |
| FTA | Fault Tree Analysis |
| FW | Fresh Water |
| GHG | Greenhouse Gas |
| GISIS | Global Integrated Shipping Information System |
| GOALDS | Goal Based Damage Ship Stability |
| GrossCAF | Gross Cost to Avert a Fatality |
| h | Hour |
| HAZID | Hazard Identification |
| HSC | High-speed Craft |
| IMO | International Maritime Organization |
| K | Thousand |
| LCA | Life Cycle Assessment |
| LOA | Length Overall |
| M | Million |
| MSC | Maritime Safety Committee |
| NetCAF | Net Cost to Avert a Fatality |
| NMA | Norwegian Maritime Authority |
| OPEX | Operating Expenses |
| P | Probability |
| PI | Probability Indices |
| PLL | Potential Loss of Life |
| PoB | Passengers on Board |
| PV | Photo Voltaic |
| RCOs | Risk Control Options |
| RI | Risk Indices |
| RoPax | Ro-Ro Passenger Ship |
| SAFEDOR | Design, Operation and Regulation for Safety |
| STABALID | Stationary Batteries Li-ion Safe Deployment |
| SW | Sea Water |
| TrAM | Transport: Advanced and Modular |
| VCG | Vertical Centre of Gravity |
| ZEBRA | Zero Emissions Batteries Research Activity |
Appendix A. Risk Register
| Hazards | RCOs | P | C | R | |||
| No. | Initial Accidental Event | Cause | Consequence | ||||
| Design, construction, installation | |||||||
| 1 | Ferry over-height | Designed battery pack didn’t comply with the height requirement for ferries operated area | Contact | Check design to fulfil the requirement | 1.27 * | 4.10 | 5.37 |
| 2 | Too big battery | Too large battery in size and weight | Failed the classification check | Design optimization | 1.00 | 4.20 | 5.20 |
| 3 | Steel overweight | Change of ferry structure and design due to battery system | Failed the classification check | Design optimization | 1.10 | 4.60 | 5.70 |
| 4 | Battery breach | Physical damage: cut, shock, vibrations, metal projection | Fire, Corrosion, Asphyxia | Pre-test system/equipment when arrived and after installation | 1.40 | 4.60 | 6.00 |
| 5 | Battery fail to start | Component damaged due to harsh installation environment | Power unavailability | Check and test system when arrived and after installation; follow the installation manual | 1.64 | 4.10 | 5.74 |
| 6 | Thermal runaway | Occur flame or heat source | Fire | Install firefighting system | 1.33 | 4.66 | 5.99 |
| 7 | Battery room damaged | Didn’t comply the ship hull design rule: keep certain distance between battery room wall and outer hull during collision contact and grounding | Flooding, ship power loss | Check design to fulfil the requirement | 1.09 | 2.10 | 3.19 |
| 8 | Loss of propulsion or steering | Battery room contains other systems supporting essential vessel services | Ship power loss | Remove unnecessary systems in battery room | 1.17 | 3.34 | 4.51 |
| 9 | Battery room damaged | Battery room is positioned before the collision bulkhead | Flooding | Follow DNV GL’s regulation on battery room arrangement | 1.09 | 2.10 | 3.19 |
| 10 | Loss of essential services | Battery room contains other systems supporting essential vessel services | Other essential services failed | Follow DNV GL’s regulation to avoid other systems in battery room | 1.64 | 2.64 | 4.28 |
| 11 | Fire and explosion in battery room | Heat sources or high fire risk objects in battery room | Fire and explosion | Follow DNV GL’s regulation on battery room arrangement | 1.18 | 3.00 | 4.18 |
| 12 | Gas development (toxic, flammable, corrosive) | No system equipped; not start automatically; low capacity; no local start-stop system; lack of monitoring; no alarm system; sensor malfunctioning | Asphyxia; fire | Follow DNV GL’s regulation on ventilation requirement | 1.09 | 4.64 | 5.73 |
| 13 | Release of flammable/toxic gases | Failure/damage of the battery system; lack of detection | Fire and explosion | Follow DNV GL’s regulation on Hazardous area design | 1.09 | 4.82 | 5.91 |
| 14 | Fire and explosion in battery room | No fire assessment; no detection methods; improper fire extinguishing | Fire and explosion | Design follow DNV GL’s regulation on Fire integrity | 1.09 | 6.10 | 7.19 |
| 15 | Short circuit in battery or power system | Fail to shut the battery: 1 No circuit breaker available; 2 no fuses available; 3 wrong breaker selected. | Power loss | Equip with switchgear | 1.42 | 4.50 | 5.92 |
| 16 | Overvoltage and under-voltage | Bad converter design | Potentially fire | Test of converters and regular inspection; add alarm | 1.25 | 3.34 | 4.59 |
| 17 | Battery system unavailable | Insufficient testing: interface, converter, system and its auxiliaries, and the installation space (possible ventilation, liquid cooling, gas detection, fire detection, leakage detection) | Battery damaged | Test of the whole system and regular inspection; add alarm; and add condition monitoring system | 1.67 | 3.00 | 4.67 |
| 18 | Battery out of power | Selected battery capacity insufficient | Other essential services failed | Design to fulfil the power requirement | 1.50 | 3.00 | 4.50 |
| 19 | Battery fall | Collision; too high battery (improper design) | Battery damaged; injury | Reduce stack height; batteries shall be properly attached to the ship hull. | 1.17 | 3.00 | 4.17 |
| 20 | Low battery power | Low capacity of battery; low charging rate of charging system | Power unavailability | Understand and match the system to the operational profile | 1.08 | 2.34 | 3.42 |
| 21 | Evacuation obstructed | Evacuation station too close to battery room | Fail to evacuate | Evacuation plan simulation; risk based ship design. | 1.00 | 3.00 | 4.00 |
| Operation | |||||||
| a. Voyage | |||||||
| 1 | Battery breach | Cut, shock, vibrations, metal projection on battery | Fire, corrosion, asphyxia | Restrict access to and objects in battery rooms | 1.00 | 5.00 | 6.00 |
| 2 | Thermal runaway | Heat sources or high fire risk objects in battery rooms | Fire, corrosion, asphyxia | Comply with the rule of no heat source in battery rooms and install alarming and firefighting system | 1.20 | 5.20 | 6.40 |
| 3 | Battery on fire | No communication between EMS and the packs | Fire | Keeping the packs powered up; ensure ESS parameters are showing on the interface; and install alarming and firefighting system; | 1.64 | 5.18 | 6.82 |
| 4 | External short circuit | Wire aging, bad insulation | System failed; injuries | Wear protection gloves and check and replace aging wire | 1.55 | 3.36 | 4.91 |
| 5 | Gas off the battery (toxic, flammable, corrosive) | Failure/damage of the battery system | Fire, corrosion, asphyxia | Ventilation system | 1.09 | 4.28 | 5.37 |
| 6 | Battery fail to disconnect | Battery management system failed; no emergency disconnections | Fire | Regularly maintenance the BMS; disconnection switch installed | 1.10 | 3.90 | 5.00 |
| 7 | Internal thermal incident | No emergency instruction; aging wire | Battery damaged | Include instructions and avoid heat or sparks | 1.60 | 2.80 | 4.40 |
| 8 | External fire | No emergency instruction; heat source nearby | Fire and explosion | Prepare emergency document; keep battery from heat, spark and fire; firefighting system | 1.27 | 4.28 | 5.55 |
| 9 | System failed | Lack of systematic maintenance and function testing and observation | Battery damaged | Advance inspection and testing; maintenance and change regularly; condition based monitoring system | 1.55 | 2.64 | 4.19 |
| 10 | Fire and explosion | Over-temperature | Fire and explosion | Ventilation system; avoid heat source in BM and install alarming and firefighting system; | 1.30 | 5.80 | 7.10 |
| 11 | Battery fall | Collision; too high battery (improper design) | Battery damaged; injury | Reduce stack height; strength and maintain battery shelves | 1.00 | 3.20 | 4.20 |
| 12 | No cooling of battery | Failures of fans; loss of coolant | Battery damaged | Include monitoring and inspection | 1.73 | 2.26 | 3.99 |
| 13 | Passenger get in the battery room | Lack of sign and warning | Battery damaged; injury | Add warning sign; lock the battery room | 1.09 | 1.18 | 2.27 |
| 14 | Terrorism | Enormous media attention | Loss of ship, fatalities | Apply ISPS Code, anti-piracy procedures to be in place and ship security | 1.00 | 5.90 | 6.90 |
| 15 | Cyber-attack/connect to wrong system | Enormous media attention; lack of cyber security protection | Loss of ship | Include security system; cautions of spam emails and regulating the remote access | 1.27 | 3.90 | 5.17 |
| 16 | Damage to the hull | Electrical-chemical corrosion due to high DC from shore charging to ship | Corrosion | Supply protection for crew; regular inspection and maintenance | 1.00 | 5.00 | 6.00 |
| 17 | Battery life span shortened | Battery working at adverse SOC | Battery damaged | Detection; alarm systems | 1.00 | 3.00 | 4.00 |
| b. Arrival/departure to/from port | |||||||
| 1 | Battery overcharging/overheating | No automatic disconnection or lack of monitoring; failure of temperature sensors | Battery damaged | Charging/discharging failure shall give alarm at a manned control station. | 1.30 | 2.40 | 3.70 |
| 2 | Battery fail to start | Component damaged due to bad battery operation and harsh operation conditions | Battery damaged | Check and test system before servicing; follow the operation manual | 1.70 | 2.00 | 3.70 |
| 3 | Battery management system failed | Overvoltage and under-voltage without protection | Fire | Converter designed following regulation | 1.64 | 3.18 | 4.82 |
| 4 | Human error | Lack of crew training on manoeuvring | Collision, contact, grounding | Train crew before onboard and provide guide for operation. | 2.55 | 3.36 | 5.91 |
| 5 | Collision | Operation failure, Struck by other ship | Total loss | Enhance navigation system; crew training | 1.00 | 7.00 | 8.00 |
| 6 | Contact | Bad manoeuvring | Hull damaged | Train crews; include anti-contact equipment | 2.00 | 1.00 | 3.00 |
| 7 | Grounding | Mooring ropes broke; An insufficient or improper information of the port or the navigational water ways | Hull damaged | Navigation system/plan; berthing system | 2.00 | 3.00 | 5.00 |
| 8 | Charging station damaged | Lack of protection: hit by objects (cable, plug, etc.); electrical hazard; overheating | System/equipment damaged | Pre-test system/equipment; standard electrical safeguarding (fuses, breakers, overvoltage protection, power control, etc.) | 1.00 | 5.00 | 6.00 |
| Emergency operation | |||||||
| 1 | Fire propagation | Improper firefighting system; fire door failure; no detection or alarm | Total loss | Apply proper firefighting and alarming system; regular inspection and maintenance on fire door; | 1.10 | 5.40 | 6.50 |
| 2 | Evacuation failed | Lack of ladders, rope, lifebuoy and life jacket; evacuation blocked | Fatalities | Evacuation equipment check; arrangement of evacuation route | 1.00 | 5.60 | 6.60 |
| 3 | Collision | Operation failure, struck by other ship | Total loss | Enhance navigation system; crew training | 1.50 | 6.60 | 8.10 |
| 4 | Contact | Bad manoeuvring | Hull damaged | Train crews; include anti-contact equipment | 2.40 | 2.40 | 4.80 |
| 5 | Thermal runaway | Battery power down during events; no other packs running | Fire | Keep battery power on; run other battery systems | 1.10 | 3.80 | 4.90 |
| 6 | Crew unsafe when entering the room | Lack of ventilation, protection, initial assessment and check | Asphyxia | Keep the ventilation system running, Supply protection for crew; inspection before entering the site | 1.10 | 5.20 | 6.30 |
| 7 | Crew unsafe when removing damaged equipment | Lack of ventilation; system still working while removing; lack of training, assessment, monitoring, inspection of other module in same column | Asphyxia | Keep the ventilation system running; crew training; assessing and monitoring before crew entering to remove | 1.10 | 5.00 | 6.10 |
| 8 | Grounding | Mooring ropes broke; An insufficient or improper information of the port or the navigational water ways | Hull damaged | Navigation system/plan; berthing system | 2.00 | 3.00 | 5.00 |
| 9 | Flooding | Contact, collision, grounding. | Capsizing | Regular inspection and maintenance on ship hull and watertight doors | 1.00 | 5.00 | 6.00 |
| * Different colours were used to show the levels of frequency, consequences and risks: green = low; yellow = medium; red = high. | |||||||
References
- Smith, T.W.P.; Jalkanen, J.P.; Anderson, B.A.; Corbett, J.J.; Faber, J.; Hanayama, S. Third IMO GHG Study 2014: Executive Summary and Final Report; International Maritime Organization: London, UK, 2015. [Google Scholar]
- Galloway, R.C.; Dustmann, C.H. ZEBRA battery-material cost availability and recycling. In Proceedings of the EVS 20, 20th International Electric Vehicle Symposium and Exposition, Powering Sustainable Transportation, Conference Proceedings, Long Beach, CA, USA, 15–19 November 2003; pp. 1–9. [Google Scholar]
- Dai, Q.; Kelly, J.C.; Gaines, L.; Wang, M. Life cycle analysis of lithium-ion batteries for automotive applications. Batteries 2019, 5, 48. [Google Scholar] [CrossRef] [Green Version]
- Dunn, J.B.; Gaines, L.; Kelly, J.C.; Gallagher, K.G. Life cycle analysis summary for automotive lithiumion battery production and recycling. In REWAS 2016: Towards Materials Resource Sustainability; Springer: Cham, Switzerland, 2016; pp. 73–79. [Google Scholar] [CrossRef]
- Raugei, M.; Winfield, P. Prospective LCA of the production and EoL recycling of a novel type of Li-ion battery for electric vehicles. J. Clean. Prod. 2019, 213, 926–932. [Google Scholar] [CrossRef] [Green Version]
- Zhao, S.; You, F. Comparative Life-Cycle assessment of li-ion batteries through process-based and integrated hybrid approaches. ACS Sustain. Chem. Eng. 2019, 7, 5082–5094. [Google Scholar] [CrossRef]
- Hiremath, M.; Derendorf, K.; Vogt, T. Comparative life cycle assessment of battery storage systems for stationary applications. Environ. Sci. Technol. 2015, 49, 4825–4833. [Google Scholar] [CrossRef] [PubMed]
- Matheys, J.; Timmermans, J.M.; Van Mierlo, J.; Meyer, S.; Van Den Bossche, P. Comparison of the environmental impact of five electric vehicle battery technologies using LCA. Int. J. Sustain. Manuf. 2009, 1, 318–329. [Google Scholar] [CrossRef]
- Kluiters, E.C.; Schmal, D.; Ter Veen, W.R.; Posthumus, K.J.C.M. Testing of a sodium/nickel chloride (ZEBRA) battery for electric propulsion of ships and vehicles. J. Power Sources 1999, 80, 261–264. [Google Scholar] [CrossRef]
- Lan, H.; Wen, S.; Hong, Y.Y.; Yu, D.C.; Zhang, L. Optimal sizing of hybrid PV/diesel/battery in ship power system. Appl. Energy 2015, 158, 26–34. [Google Scholar] [CrossRef] [Green Version]
- Misyris, G.S.; Marinopoulos, A.; Doukas, D.I.; Tengnér, T.; Labridis, D.P. On battery state estimation algorithms for electric ship applications. Electr. Power Syst. Res. 2017, 151, 115–124. [Google Scholar] [CrossRef]
- Yu, W.; Zhou, P.; Wang, H. Evaluation on the energy efficiency and emissions reduction of a short-route hybrid sightseeing ship. Ocean Eng. 2018, 162, 34–42. [Google Scholar] [CrossRef] [Green Version]
- Zahedi, B.; Norum, L.E.; Ludvigsen, K.B. Optimized efficiency of all-electric ships by dc hybrid power systems. J. Power Sources 2014, 255, 341–354. [Google Scholar] [CrossRef]
- Jones, C.; Peshev, V.; Gilbert, P.; Mander, S. Battery storage for post-incentive PV uptake? A financial and life cycle carbon assessment of a non-domestic building. J. Clean. Prod. 2017, 167, 447–458. [Google Scholar] [CrossRef]
- Norwegian Maritime Authority Battery Fire with Subsequent Gas Explosion. 2019. Available online: https://www.sdir.no/en/shipping/legislation/directives/battery-fire-with-subsequent-gas-explosion/ (accessed on 1 July 2020).
- Wang, Q.; Mao, B.; Stoliarov, S.I.; Sun, J. A review of lithium ion battery failure mechanisms and fire prevention strategies. Prog. Energy Combust. Sci. 2019, 73, 95–131. [Google Scholar] [CrossRef]
- Soares, F.J.; Carvalho, L.; Costa, I.C.; Iria, J.P.; Bodet, J.M.; Jacinto, G.; Lecocq, A.; Roessner, J.; Caillard, B.; Salvi, O. The STABALID project: Risk analysis of stationary Li-ion batteries for power system applications. Reliab. Eng. Syst. Saf. 2015, 140, 142–175. [Google Scholar] [CrossRef] [Green Version]
- Jeong, B.; Oguz, E.; Wang, H.; Zhou, P. Multi-criteria decision-making for marine propulsion: Hybrid, diesel electric and diesel mechanical systems from cost-environment-risk perspectives. Appl. Energy 2018, 230, 1065–1081. [Google Scholar] [CrossRef] [Green Version]
- Andersson, P.; Wikman, J.; Arvidson, M.; Larsson, F.; Willstrand, O. Safe Introduction of Battery Propulsion at Sea. Safety and Transport Borås, Sweden. 2017. Available online: http://www.diva-portal.org/smash/get/diva2:1118026/FULLTEXT01.pdf (accessed on 1 July 2020).
- DNV GL. Rules For Classification Ships. DNV GL AS: Oslo, Norway, 2019. Available online: https://rules.dnvgl.com/ServiceDocuments/dnvgl/#!/industry/1/Maritime/1/DNV%20GL%20rules%20for%20classification:%20Ships%20(RU-SHIP) (accessed on 1 July 2020).
- IMO. Revised Guidelines for Formal Safety Assessment (Fsa) for Use in the Imo Rule-Making Process; IMO: London, UK, 2018. [Google Scholar]
- Kristiansen, S. Maritime Transportation: Safety Management and Risk Analysis; Routledge: London, UK, 2013. [Google Scholar]
- Hamann, R.; Olufsen, O.; Zaraphonitis, G. The GOAL based damage stability project (GOALDS)—Development of a new risk-based damage. In Proceedings of the 11th International Ship Stability Workshop, Belgrade, Serbia, 5–7 June 2017; Volume 8. [Google Scholar]
- Grønstøl, E. SAFEDOR—HAZID for RoPax—Design, Operation and Regulation for Safety; SAFEDOR: Hamburg, Germany, 2006. [Google Scholar]
- Nilsen, O.V. SAFEDOR—HAZID for Cruise Ship—Design, Operation and Regulation for Safety; SAFEDOR: Hamburg, Germany, 2006. [Google Scholar]
- EMSA. Study Investigating Cost Effective Measures for Reducing the Risk from Fires on ro-ro Passenger Ships (FIRESAFE) Appendix: Sensitivity and Uncertainty Analyses. EMSA, Euroupean Union, 2016. Available online: http://www.emsa.europa.eu/firesafe/download/4580/2904/23.html (accessed on 1 July 2020).
- Goerlandt, F.; Reniers, G. On the assessment of uncertainty in risk diagrams. Saf. Sci. 2016, 84, 67–77. [Google Scholar] [CrossRef]
- IMO. GISIS: Marine Casualties and Incidents Database; IMO: London, UK, 2019. [Google Scholar]
- IHS Markit. Sea-Web Ships: Ship Details & Technical Specifications; IHS Markit: London, UK, 2019. [Google Scholar]
- Endrina, N.; Rasero, J.C.; Konovessis, D. Risk analysis for RoPax vessels: A case of study for the Strait of Gibraltar. Ocean Eng. 2018, 151, 141–151. [Google Scholar] [CrossRef]


| FI | Frequency | Definition | F (per Ship Year) |
|---|---|---|---|
| 7 | Frequent | Likely to occur once per month on one ship | 10 |
| 5 | Reasonably probable | Likely to occur once per year in a fleet of 10 ships, i.e., likely to occur a few times during a ship’s life | 0.1 |
| 3 | Remote | Likely to occur once per year in a fleet of 1000 ships, i.e., likely to occur in the total life of several similar ships | 1 × 10⁻³ |
| 1 | Extremely remote | Likely to occur once in the lifetime (20 years) of a world fleet of 5000 ships | 1× 10⁻⁵ |
| SI | Severity | Ship Safety & Technology | Equivalent Fatalities |
|---|---|---|---|
| 1 | Minor | Local equipment damage (repair on board possible, downtime negligible) | 0.01 |
| 2 | Significant | Non-severe ship damage—(port stay required, downtime 1 day) | 0.1 |
| 3 | Severe | Severe damage—(yard repair required, downtime < 1 week) | 1 |
| 4 | Catastrophic | Total loss (of, e.g., a medium size merchant ship) | 10 |
| PI Probability | SI Severity | ||||
|---|---|---|---|---|---|
| 1 | 2 | 3 | 4 | ||
| Minor | Significant | Severe | Catastrophic | ||
| 7 | Frequent | 8 | 9 | 10 | 11 |
| 6 | Probable | 7 | 8 | 9 | 10 |
| 5 | Reasonably probable | 6 | 7 | 8 | 9 |
| 4 | Little probable | 5 | 6 | 7 | 8 |
| 3 | Remote | 4 | 5 | 6 | 7 |
| 2 | Very remote | 3 | 4 | 5 | 6 |
| 1 | Extremely remote | 2 | 3 | 4 | 5 |
| Main Dimensions | |||
|---|---|---|---|
| Length | 29.32 m | Number of stops | up to 12 |
| Breadth | 9 m | Passengers | 147 |
| Demihull breadth | 2.44 m | Crew | 3 |
| Draft | 1.26 m | Motor | 2 × 550 kW |
| Lightship | 200 tones | Battery capacity | 1.3 MWh |
| Operational speed | 23 knots | Route length | 23 nm |
| Service hours per day | Up to 20.5 | Serviced per day | 14 times |
| No | Hazard Description | Frequency | Consequence |
|---|---|---|---|
| 1 | Ferry overheight—contact with bridge | 1.27 | 4.10 |
| 2 | Too big battery—structural failure | 1.00 | 4.20 |
| 3 | Steel overweight—structural failure | 1.10 | 4.60 |
| 4 | Battery breach—fire, corrosion, asphyxia | 1.40 | 4.60 |
| 5 | Battery fail to start—battery unavailability during critical operations | 1.64 | 4.10 |
| 6 | Thermal runaway—fire | 1.33 | 4.66 |
| 7 | Battery room damaged—flooding, ship power loss | 1.09 | 2.10 |
| 8 | Loss of propulsion or steering—ship power loss | 1.17 | 3.34 |
| 9 | Battery room damaged—flooding | 1.09 | 2.10 |
| 10 | Loss of essential services—other essential services failed | 1.64 | 2.64 |
| 11 | Fire and explosion in battery room—fire and explosion | 1.18 | 3.00 |
| 12 | Gas development (toxic, flammable, corrosive)—asphyxia; fire | 1.09 | 4.64 |
| 13 | Release of flammable/toxic gases—fire and explosion | 1.09 | 4.82 |
| 14 | Fire and explosion in battery room—fire and explosion | 1.09 | 6.10 |
| 15 | Short circuit in battery or power system—power loss; fatality | 1.42 | 4.50 |
| 16 | Overvoltage and undervoltage—potentially fire | 1.25 | 3.34 |
| 17 | Battery system unavailable—battery damaged | 1.67 | 3.00 |
| 18 | Battery out of power—other essential services failed | 1.50 | 3.00 |
| 19 | Battery fall—battery damaged; injury | 1.17 | 3.00 |
| 20 | Discharge rate too low—power unavailability | 1.08 | 2.34 |
| 21 | Evacuation obstructed | 1.00 | 3.00 |
| No | Hazard Description | Frequency | Consequence |
|---|---|---|---|
| 1 | Battery breach—fire, corrosion, asphyxia | 1.00 | 5.00 |
| 2 | Thermal runaway—fire, corrosion, asphyxia | 1.20 | 5.20 |
| 3 | Battery on fire—fire, total loss | 1.64 | 5.18 |
| 4 | Short circuit—short circuit, fatalities | 1.55 | 3.36 |
| 5 | Gas off the battery (toxic, flammable, corrosive)—fire, corrosion, asphyxia | 1.09 | 4.28 |
| 6 | Battery fail to disconnect—fire | 1.10 | 3.90 |
| 7 | Internal thermal incident—battery damaged | 1.60 | 2.80 |
| 8 | External fire—fire and explosion | 1.27 | 4.28 |
| 9 | System failed—battery damaged | 1.55 | 2.64 |
| 10 | Fire and explosion—fire and explosion | 1.30 | 5.80 |
| 11 | Battery fall—battery damaged; injury | 1.00 | 3.20 |
| 12 | No cooling of battery—battery damaged | 1.73 | 2.26 |
| 13 | Passenger get in the battery room—battery damaged; injury | 1.09 | 1.18 |
| 14 | Terrorism—loss of ship, fatalities | 1.00 | 5.90 |
| 15 | Cyber-attack—loss of ship | 1.27 | 3.90 |
| 16 | Damage to the hull—corrosion | 1.00 | 5.00 |
| 17 | Battery life span shortened—battery damaged | 1.00 | 3.00 |
| No | Hazard Description | Frequency | Consequence |
|---|---|---|---|
| 1 | Battery overcharging—battery damaged | 1.30 | 2.40 |
| 2 | Battery fail to start—battery damaged | 1.70 | 2.00 |
| 3 | Battery management system failed—fire | 1.64 | 3.18 |
| 4 | Human error—collision, contact, grounding | 2.55 | 3.36 |
| 5 | Collision—total loss | 1.00 | 7.00 |
| 6 | Contact—hull damaged | 2.00 | 1.00 |
| 7 | Grounding—hull damaged | 2.00 | 3.00 |
| 8 | Charging station damaged—system/equipment damaged | 1.00 | 5.00 |
| No | Hazard Description | Frequency | Consequence |
|---|---|---|---|
| 1 | Fire propagation—total loss | 1.10 | 5.40 |
| 2 | Evacuation failed—fatalities | 1.00 | 5.60 |
| 3 | Collision—total loss | 1.50 | 6.60 |
| 4 | Contact—hull damaged | 2.40 | 2.40 |
| 5 | Thermal runaway—fire | 1.10 | 3.80 |
| 6 | Crew unsafe when entering the room—asphyxia | 1.10 | 5.20 |
| 7 | Crew unsafe when removing damaged equipment—asphyxia | 1.10 | 5.00 |
| 8 | Grounding—hull damaged | 2.00 | 3.00 |
| 9 | Flooding—capsizing | 1.00 | 5.00 |
| Evidence Type | Confidence Level | ||
|---|---|---|---|
| Strong | Medium | Weak | |
| Judgments supported by experts | Over 75% | 25~75% | Less than 25% |
| Assumptions agreed by experts | Over 75% | 25~75% | Less than 25% |
| Hazard Number | Design, Construction & Installation | Operation | Emergency | |||
|---|---|---|---|---|---|---|
| Frequency | Consequence | Frequency | Consequence | Frequency | Consequence | |
| 1 | 75% | 42% | 75% | 75% | 90% | 20% |
| 2 | 83% | 42% | 75% | 58% | 100% | 40% |
| 3 | 75% | 67% | 42% | 50% | 50% | 80% |
| 4 | 50% | 25% | 33% | 58% | 40% | 70% |
| 5 | 58% | 50% | 83% | 25% | 90% | 50% |
| 6 | 67% | 50% | 83% | 50% | 90% | 50% |
| 7 | 83% | 17% | 92% | 42% | 90% | 60% |
| 8 | 83% | 42% | 50% | 58% | ||
| 9 | 83% | 50% | 67% | 8% | ||
| 10 | 42% | 58% | 33% | 58% | ||
| 11 | 75% | 75% | 58% | 25% | ||
| 12 | 83% | 58% | 50% | 58% | ||
| 13 | 83% | 83% | 83% | 58% | ||
| 14 | 83% | 50% | 50% | 58% | ||
| 15 | 58% | 42% | 83% | 83% | ||
| 16 | 75% | 42% | 92% | 8% | ||
| 17 | 50% | 83% | 67% | 50% | ||
| 18 | 50% | 67% | 58% | 58% | ||
| 19 | 83% | 67% | 42% | 42% | ||
| 20 | 92% | 50% | 58% | 33% | ||
| 21 | 58% | 58% | ||||
| Year | 1999 | 2000 | 2001 | 2002 | 2003 | 2004 | 2005 | 2006 | 2007 | 2008 | 2009 |
| Ships in service | 132 | 152 | 162 | 143 | 142 | 162 | 158 | 124 | 158 | 204 | 213 |
| Year | 2010 | 2011 | 2012 | 2013 | 2014 | 2015 | 2016 | 2017 | 2018 | 2019 | Total |
| Ships in service | 247 | 219 | 244 | 224 | 265 | 259 | 271 | 343 | 448 | 602 | 4872 |
| No of Accidents | Percentage | Accident Frequency | ||
|---|---|---|---|---|
| This Study | Other Projects | |||
| Capsizing | 23 | 16.08% | 4.72 × 10⁻³ | |
| Collision | 26 | 18.18% | 5.34 × 10⁻³ | (a) 6.99 × 10⁻³ (GOALDS) (b) 4.6 × 10⁻³ (MSC_85-17-1 *) (c) 1.25 × 10⁻² (MSC_85-17-2) (d) 3.65 × 10⁻² (Endrina et al. 2018 [30]) |
| Contact | 15 | 10.49% | 3.08 × 10⁻³ | (a) 1.2 × 10⁻³ (MSC_85-17-1) (b) 1.25 × 10⁻² (MSC_85-17-2) (c) 1.04 × 10⁻² (Endrina et al. 2018 [30]) |
| Fire | 35 | 24.48% | 7.18 × 10⁻³ | (a) 8.9 × 10⁻³ (MSC_85-17-1) (b) 8.28 × 10⁻³ (MSC_85-17-2) (c) 5.21 × 10⁻³ (Endrina et al. 2018 [30]) |
| Grounding | 36 | 25.17% | 7.39 × 10⁻³ | (a) 1.07 × 10⁻² (GOALDS) (b) 9.8 × 10⁻³ (MSC_85-17-1) (c) 9.57 × 10⁻³ (MSC_85-17-2) |
| Flooding | 2 | 1.40% | 4.11 × 10⁻⁴ | |
| Machinery damage | 6 | 4.20% | 1.23 × 10⁻³ | (a) 1.87 × 10⁻² (MSC_85-17-2) (b) 1.04 × 10⁻² (Endrina et al. 2018 [30]) |
| Total | 143 | 100% | 2.94 × 10⁻² | (a) 4.4 × 10⁻² (MSC_85-17-1) (b) 6.80 × 10⁻² (MSC_85-17-2) (c) 6.25 × 10⁻² (Endrina et al. 2018 [30]) |
| Year | 2006 | 2007 | 2008 | 2009 | 2010 | 2011 | 2012 | 2013 | 2014 | 2015 | 2016 | 2017 | 2018 | Sum |
|---|---|---|---|---|---|---|---|---|---|---|---|---|---|---|
| Ferry in service | 52 | 69 | 76 | 84 | 85 | 78 | 98 | 84 | 102 | 97 | 101 | 108 | 144 | 1178 |
| Accident | No of Accidents | Percentage | Accident Frequency |
|---|---|---|---|
| Capsizing/listing | 2 | 22.22% | 1.70 × 10⁻³ |
| Collision | 2 | 22.22% | 1.70 × 10⁻³ |
| Contact | 1 | 11.11% | 8.49 × 10⁻⁴ |
| Fire | 2 | 22.22% | 1.70 × 10⁻³ |
| Stranding/grounding | 2 | 22.22% | 1.70 × 10⁻³ |
| Flooding | 0 | 0% | 0 |
| Machinery damage | 0 | 0% | 0 |
| Total | 9 | 100% | 7.64 × 10⁻³ |
| Hazard Category | Ind. Risk | Fatalities | Incidents | Fatal Accidents | Total Loss | 8000 People on Board | |
|---|---|---|---|---|---|---|---|
| (per Year) | (per Year) | (per Year) | (per Year) | (per Year) | FAR | % | |
| Collision | 1.03 × 10⁻⁵ | 8.22 × 10⁻² | 5.34 × 10⁻³ | 1.08 × 10⁻⁴ | 1.08 × 10⁻⁴ | 0.18 | 5.12 |
| Grounding | 1.40 × 10⁻⁴ | 1.12 | 7.39 × 10⁻³ | 6.74 × 10⁻³ | 7.19 × 10⁻⁵ | 2.44 | 69.72 |
| Contact | 7.58 × 10⁻⁶ | 6.06 × 10⁻² | 3.08 × 10⁻³ | 9.08 × 10⁻⁵ | 9.08 × 10⁻⁵ | 0.13 | 3.78 |
| Fire/Explosion | 4.29 × 10⁻⁵ | 3.43 × 10⁻¹ | 7.18 × 10⁻³ | 2.65 × 10⁻³ | 1.44 × 10⁻⁵ | 0.75 | 21.38 |
| Total | 2.01 × 10⁻⁴ | 1.61 | 2.30 × 10⁻² | 9.60 × 10⁻³ | 2.85 × 10⁻⁴ | 3.505 | 100.00 |
| Hazard Category | Ind. Risk | Fatalities | Incidents | Fatal Accidents | Total Loss | 150 People on Board | |
|---|---|---|---|---|---|---|---|
| (per Year) | (per Year) | (per Year) | (per Year) | (per Year) | FAR | % | |
| Collision | 3.27 × 10⁻⁶ | 4.90 × 10⁻⁴ | 1.70 × 10⁻³ | 3.44 × 10⁻⁵ | 3.44 × 10⁻⁵ | 0.004 | 6.93 |
| Grounding | 3.22 × 10⁻⁵ | 4.82 × 10⁻³ | 1.70 × 10⁻³ | 1.55 × 10⁻³ | 1.65 × 10⁻⁵ | 0.035 | 68.21 |
| Contact | 1.57 × 10⁻⁶ | 2.36 × 10⁻⁴ | 8.49 × 10⁻⁴ | 1.95 × 10⁻⁵ | 1.95 × 10⁻⁵ | 0.002 | 3.34 |
| Fire/Explosion | 1.01 × 10⁻⁵ | 1.52 × 10⁻³ | 1.70 × 10⁻³ | 6.27 × 10⁻⁴ | 3.40 × 10⁻⁶ | 0.011 | 21.52 |
| Total | 4.72 × 10⁻⁵ | 7.07 × 10⁻³ | 5.94 × 10⁻³ | 2.23 × 10⁻³ | 7.38 × 10⁻⁵ | 0.052 | 100 |
| Results | Large Passenger Ship | Ferry (This Study) |
|---|---|---|
| Individual risk per sailing | 5.61 × 10⁻⁷ | 1.19 × 10⁻⁸ |
| Max sailing per year for crew member | 180 | 1650 * |
| Max sailing per year for any passenger | 20 | 600 ** |
| Max individual risk for crew member | 1.01 × 10⁻⁴ | 1.96 × 10⁻⁵ |
| Max individual risk for passenger | 1.12 × 10⁻⁵ | 7.14 × 10⁻⁶ |
| Fatalities per 108 person hours (FAR) | 3.505 | 0.052 |
| Fatalities per 108 person km | 0.081 | 0.028 |
| Fatalities per 108 person sailings | 56.080 | 1.191 |
| RCOs | 1 | 2 | 3 | 4 | 5 | 6 | 7 |
|---|---|---|---|---|---|---|---|
| PLL (fatalities/ship-year) | 1.61 | ||||||
| Reduction | 10% | 10% | 5% | 5% | 5% | 7.5% | 7.5% |
| ΔPLL (fatalities/ship-year) | 0.161 | 0.161 | 0.080 | 0.080 | 0.080 | 0.120 | 0.120 |
| Cost (€) | −30,000 | 20,000 | 10,000 | 20,000 | 5000 | 0 | 10,000 |
| Annual Maintenance Cost (€) | 0 | 5000 | 2500 | 0 | 1000 | 5000 | 1000 |
| ΔC (€) | −30,000 | 82,311 | 41,156 | 20,000 | 17,462 | 62,311 | 22,462 |
| Gross CAF (€) | −9339 | 25,624 | 25,624 | 12,452 | 10,872 | 25,864 | 9323 |
| Annual Benefit (€) | 26,544 * | 0 | 0 | 0 | 0 | 0 | 0 |
| ΔB (€) | 330,802 | 0 | 0 | 0 | 0 | 0 | 0 |
| NetCAF (€) | −112,319 | 25,624 | 25,624 | 12,452 | 10,872 | 25,864 | 9323 |
© 2020 by the authors. Licensee MDPI, Basel, Switzerland. This article is an open access article distributed under the terms and conditions of the Creative Commons Attribution (CC BY) license (http://creativecommons.org/licenses/by/4.0/).
Share and Cite
Wang, H.; Boulougouris, E.; Theotokatos, G.; Priftis, A.; Shi, G.; Dahle, M.; Tolo, E. Risk Assessment of a Battery-Powered High-Speed Ferry Using Formal Safety Assessment. Safety 2020, 6, 39. https://0-doi-org.brum.beds.ac.uk/10.3390/safety6030039
Wang H, Boulougouris E, Theotokatos G, Priftis A, Shi G, Dahle M, Tolo E. Risk Assessment of a Battery-Powered High-Speed Ferry Using Formal Safety Assessment. Safety. 2020; 6(3):39. https://0-doi-org.brum.beds.ac.uk/10.3390/safety6030039
Chicago/Turabian StyleWang, Haibin, Evangelos Boulougouris, Gerasimos Theotokatos, Alexandros Priftis, Guangyu Shi, Mikal Dahle, and Edmund Tolo. 2020. "Risk Assessment of a Battery-Powered High-Speed Ferry Using Formal Safety Assessment" Safety 6, no. 3: 39. https://0-doi-org.brum.beds.ac.uk/10.3390/safety6030039