Article

Development and Reliability Review of an Assessment Tool to Measure Competency in the Seven Elements of the Risk Management Process: Part One—The RISKometric

1
School of Systems Engineering, College of People, Technology and Systems, Brisbane 4006, Australia
2
Sustainable Minerals Institute, The University of Queensland, Brisbane 4072, Australia
3
School of Engineering, Sichuan Normal University, Chengdu 610066, China
4
Human Factors Team, Monash University Accident Research Centre, Melbourne 3800, Australia
*
Author to whom correspondence should be addressed.
Submission received: 14 March 2020 / Revised: 14 December 2020 / Accepted: 21 December 2020 / Published: 29 December 2020

Abstract

:
Ineffective and inefficient workforce involvement can negatively impact risk management practice for work health and safety (WHS) issues. Often the risk management process is undertaken by a single person, or by teams without a facilitator and without regard to the participants’ levels of competency in the risk management process. This study aimed to develop a tool to assess the competence of individuals in different elements of the risk management process and then review its reliability. This tool, termed the RISKometric, incorporated a 360° performance review method whereby peers upline and downline colleagues and the individual themselves gave competence ratings. The RISKometric was tested using 26 participants. Results showed that a significant positive relationship existed between the feedback given by peers and downline colleagues. Initial results gained from using the tool suggest it is able to discriminate the competence of participants, in each of the elements of risk management, through the opinions of self and others. In future research, we test assumptions through a further two studies. Firstly, that individuals’ RISKometric results are comparable with their performance in a risk scenario exercise; so, providing validity for the tool. Secondly, that a collectively-optimised team (formed using the Riskometric) can perform a risk assessment exercise better than marginally- or sub-optimised teams.

1. Introduction

Ineffective and inefficient workforce involvement can negatively impact risk management practices in a WHS context [1]. In most jurisdictions in Australia, it is a requirement of WHS legislation that a risk management approach be taken to control all aspects of risk to health and safety associated with hazards. International standards, codes of practice, and industry guidelines describe best practice methods for steps in the risk management process, including advice about the collective knowledge and experience of groups conducting risk assessments concerning both the hazard and risk assessment techniques.
Since 2004, the risk management approach has been modelled on a seven-step process as detailed in AS/NZS 4360 the forerunner to ISO 31,000 in 2009, and recently updated as the second edition in 2018. Marling et al. [2] summarise these seven steps as follows:
  • Establishing the context;
  • Risk identification;
  • Risk analysis;
  • Risk evaluation;
  • Risk treatment;
  • Communication and consultation, and
  • Monitoring and reviewing.
They typically encourage the involvement of a representative cross-section of the workforce and the use of external expertise where necessary to ensure the knowledge and experience of those involved is comprehensive and current. The forming of risk assessment groups within organisations is challenging. Recent research has identified that both formal and informal risk management processes are commonly conducted in an ad-hoc manner, often using individuals working alone, or in teams that are not collectively competent in the seven elements of the risk management process [1]. This non-ideal process may be due to a lack of resources. An implication is that complex and challenging WHS risks (as experienced in high-risk organisations) are not being informed by the innovative decision-making of teams of competent personnel. Instead, solutions rely on the outcomes of teams that are assembled by chance or convenience.
A tool that could be used to assess workers’ competence in the risk management process may be a helpful first step in assembling competent risk management teams [1]. This study aimed to develop a tool to elicit information about the level of competence of individuals in each of the seven elements of the risk management process, which if reliable, could subsequently be used in further studies to assemble competent risk management teams. This tool, termed the RISKometric, incorporates a 360° performance review method whereby peers, upline and downline colleagues and the individual themselves all give feedback about risk management competency levels for an individual.

1.1. 360° Performance Review Definition

There are many definitions of a 360° performance review (see Tornow, [3]; Hoffman, [4]; Lepsinger and Lucia, [5]; Peters, [6]; Handy et al., [7]), but perhaps Coate’s [8] simple definition, that it is a method of multi-source appraisal, best explains its most salient feature. Espinilla et al. [9] take it a step further by explaining that it is used to assist people to be more self-aware of their performance. A definition that incorporates these ideas, as given by Yukl and Lepsinger [10], Jones and Bearley [11] and Mabey [12], is an appraisal and feedback to a recipient, with input from multiple sources, such as upline, peers and downline and then feeding those results back to set a plan of action for improvement.
McCarthy and Garavan [13] and Hannum [14] note that 360° performance review tools have been used since the 1970s, but did not become prevalent until the 1990s. Nowack [15] discusses five models for consideration in the design of 360° performance review tools; namely job analysis, strategic planning, career development, personality and competency. The RISKometric tool is based on Nowack’s competency model as it is an assessment of competency. Hogg [16] defines competency as those characteristics that lead to a demonstration of skills and abilities, resulting in effective and efficient performance.

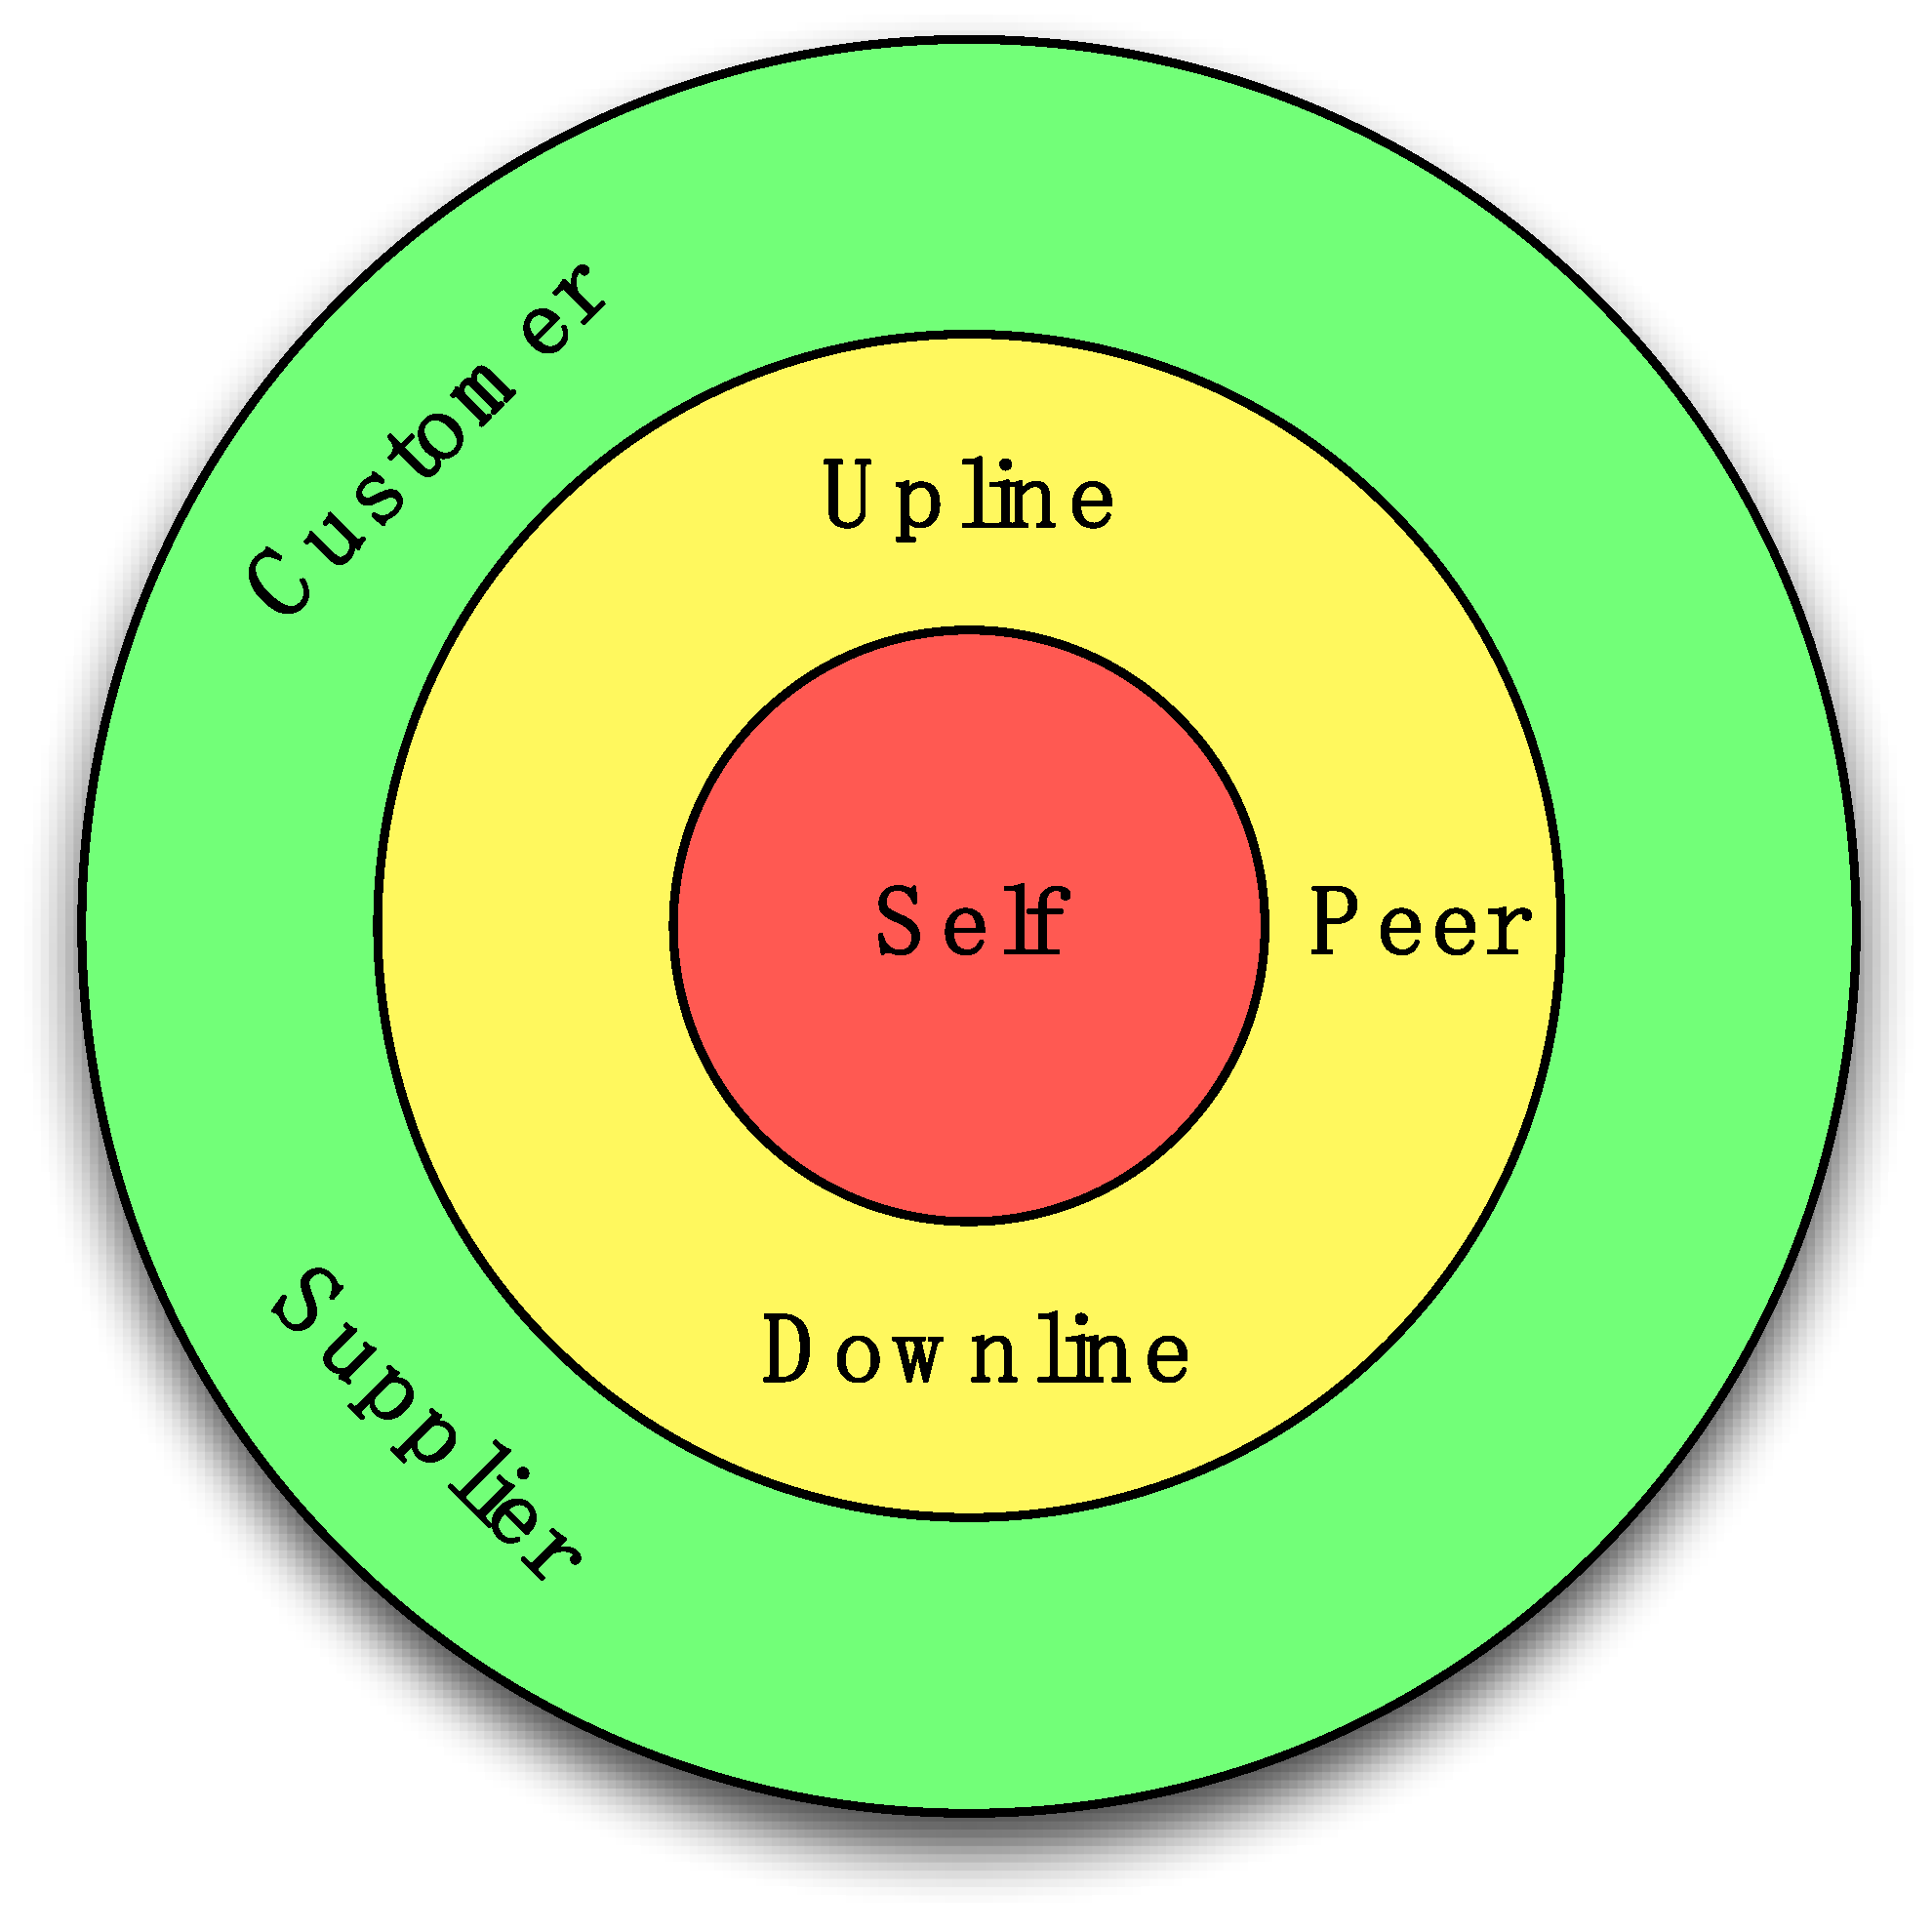
1.2. 360° Performance Review—Multiple Sources of Feedback

The four most common sources of feedback in a 360° performance review are upline and downline colleagues, peers, and self (McCarthy and Garavan, [13]; Craig and Hannum, [17]). Espinilla et al. [9] suggest that raters (those who provide feedback) must be people who socialise with the person being assessed. They do not define ‘socialise’, but it can be assumed as meaning interactions that occur between workers, with respect to work-related tasks. Doherty and Brodsky [18] describe the multi-source feedback given in a 360° performance review as a full-circle appraisal and Espinilla et al. [9] illustrate this concept using a schematic very similar to that shown in Figure 1. Figure 1 has been adapted by the researchers to include Carson’s [19] and Doherty and Brodsky’s [18] views regarding the value of using customers, both internal and external, and suppliers as raters.

1.3. The Collection and Delivery of Feedback

Considerable attention has been given to the collection and delivery of feedback, especially regarding anonymity of data and the use and storage of feedback, and the subsequent legal ramifications (Doherty and Brodsky, [18]). In this context, Doherty and Brodsky [18] discuss the advantages of web-based tools to collect 360° performance review feedback, including that it may better ensure raters’ confidentiality and foster honest responses. Doherty and Brodsky [18] claim that the electronic method increases participation and produces faster results. Both Penny [20] and Smither et al. [21] found that compared to a paper-based instrument, online web-based 360° tools provide better inter-rater reliability. Craig [17] further adds that this is providing the versions are as similar as possible.

1.4. Benefits and Limitations of 360° Performance Review Assessment

DeNisi and Kluger [22] contend that performance improvements cannot be attained without feedback, while Hackman and Oldham [23] propose that feedback increases job satisfaction. On this basis, McCarthy and Garavan [13] assert that the 360° performance review is primarily used as a development tool for learners, giving them a perspective of their current status of performance so that improvement strategies can be put in place. They also contend that the 360° performance review enhances two-way communication. Additional benefits include taking into account the intricacies and complexities of management and the value of input from sources other than that given by upline colleagues (Becker and Klimoski, [24]). Church et al. [25] support this by claiming that multiple sources are better than an individual one for assessment.
London and Beatty [26] argue that 360° performance reviews assist in the building of effective relationships as they increase the opportunity for participation by all, can detect and resolve conflict and can be a vehicle to demonstrate respect for the opinions of all parties by all parties. In other words, the 360° performance review enables a ‘full-circle’ of respect. Hazucha et al. [27] postulate that this increased participation and respect goes a long way towards acceptance of feedback and inspires individuals to put in place action to build on strengths and work on weaknesses. Another advantage of the 360° performance review process is that upline, peer and downline raters can provide feedback anonymously thus negating the discomfort that people often get when delivering criticism to a colleague (Folger and Cropanzano, [28]).
This positive use of feedback has been argued to enhance team effectiveness, as the person being assessed gain a better understanding of how their upline and downline colleagues and peers perceive their performance. This feedback also enables them to start a conversation about how to undertake a gap analysis that helps them to identify and understand potential blind-spots (Doherty and Brodsky, [18]) and how to work on those characteristics that need improving (Lepsinger and Lucia, [5]).
A robust finding is that feedback from downline colleagues is associated with positive change (Hegarty, [29]; Atwater et al. [30]; Reilly et al. [31]; Walker and Smither, [32]), and this is supported by Smither et al. [33]), Atwater et al. [34], and Morgan et al. [35]. Research undertaken by Wexley and Klimoski [36], Kane and Lawler [37] and Cardy and Dobbins [38] suggest that feedback from downline colleagues is of a higher quality because they are best placed to assess a person’s competencies and performance. Bettenhausen and Fedor [39] suggest that feedback from downline colleagues may undermine a supervisor’s authority.
Lawler et al. [40]) and Meyer [41] argue that those who give and receive feedback in the traditional manner that is the top-down/one-way feedback approach, generally view it negatively and in particular upline colleagues find it a burdensome and unpleasant duty. Napier and Latham [42] posit that often those in a downline position being assessed often do not see any value in traditional top-down/one-way feedback. Bernardin and Beatty [43] note that the top-down/one-way approach is a characteristic of organisations with an autocratic style of management.
London et al. [44] maintain that a potential weakness of the 360° performance review process is that employees may feel threatened by the feedback they receive. This finding is supported by Kaplan [45], who determined that some people might become defensive when presented with negative feedback. London and Beatty [26] raise the issue of the potentially enormous administrative effort required to undertake the 360° performance review process. A related issue is that of survey fatigue, where a person may have to fill in many surveys (e.g., a manager for several downline staff) (Bracken, [46]; Kaplan, [47]; London and Beatty, [26]). Moses et al. [47]) and Kanouse [48] highlight other potential difficulties that may result when raters are not suitably trained in how to use the tool, including:
  • a limited or non-existent frame of reference;
  • the rater using generalities rather than specifics when rating;
  • the rater using an ancient history of the ratee based on memory, or
  • the rater not being specifically equipped to make the rating, e.g., new to the job.

1.5. Rating Scales and Reliability and Validity Concerns (Biases)

Similar to traditional measures (e.g., top-down, autocratic), 360° performance reviews commonly use rating scales to measure competence. Rou and Rou [49] discuss rating scales as being based on frequency (how often) or mastery (how good) and thought is required to determine which scale to use. They further raise the issue of how many points to have on the scale and the dangers of a mid-range response, such as ‘average’ or ‘neither satisfied nor dissatisfied’, whereby raters may be tempted to apply a vague of non-committed response.
Consideration also needs to be given to data reliability and validity, as ratings are subject to biases, such as leniency, halo and stereotyping effects (London and Beatty, [26]). McCarthy and Garavan [13] claim that the use of multi-source data should help alleviate biases to a certain extent. This finding is supported by Church et al. [25], who contend that it should also yield more valid and reliable results for the person being rated.
An issue raised by McEvoy and Buller [50], Fedor and Bettenhausen [51] and Cardy and Dobbins [38] is that the 360° performance review process may create a ‘popularity contest’ environment whereby individuals may display inappropriate behaviours to become popular with the hope of a getting lenient rating. For example, upline personnel become overly concerned with winning downline colleagues’ approval.
Kane and Lawler [37] found that peer feedback was typically less affected by reliability and validity concerns, including biases. A number of authors also purport that peers are the best cohort to judge performance as they are more likely to be in teams and work directly with the individual being assessed (Fedor et al., [51], Bettenhausen and Fedor, [39]; Murphy and Cleveland, [52]; Wexley and Klimoski, [36]; Kane and Lawler, [37]). One concern regarding peer feedback is that peers may give lower ratings to enhance their own standing within the group (Cardy and Dobbins, [38]).
McEvoy and Beatty [53] and Atkins and Wood [54] explore in detail the issue of ‘self’ versus ‘others’ ratings. In summary, they found that the average of upline, peer and downline ratings were the best predictors of performance and better than upline ratings alone. Additionally, self-ratings were negatively and non-linearly related to performance; the highest self-raters (over-raters) had the lowest performance, and mid-range raters had the best performance. They also found that ratings by upline colleagues highlighted over-raters, but not under-raters (perhaps modest self-raters were underestimated by their upline), and peers overestimated the performance of poor performers (perhaps to boost their own assessment).
Research undertaken in military and educational settings demonstrates that 360° performance reviews have reliability estimates as high as 0.9 (Doherty and Brodsky, [18]). Although it should be noted, they do not distinguish if this reliability estimate is across the various rater groups or between one’s rating and performance.

1.6. Summary of Literature

McCarthy and Garavan [13] contend that there are substantial returns for individuals and organisations that engage in 360° performance reviews. From the above discussion, it can be deduced that feedback from multiple sources: upline and downline colleagues, peers, and self have a role to play in awareness of one’s performance. The main advantages being enforcing two-way communication; identifying gaps and blind-spots, and breaking down autocratic structures within organisations. These lead to better work relationships, increased respect and increased job satisfaction and individual and team performance.
There are also disadvantages from undertaking 360° performance reviews, the main ones being the potential undermining of supervisory authority; the effort required for administration of the process and training people in the process, and fatigue, if the process is mixed in with multiple other work-related surveys.
In summary, it appears from the literature that a measure of an individual’s competency in each of the elements is possible using a tool based on a 360° performance review.

2. Aim

This study aimed to develop and appraise an instrument that assesses the level of competence of an individual in each of the seven elements of the risk management process, as defined in ISO 3100:2009, through the perceptions of others. Two further studies aimed to:
  • firstly, test further the RISKometric tool, whereby individuals’ RISKometric results were compared with their performance in a risk scenario exercise; so providing validity for the tool, and
  • secondly, use the individual performance results to assemble collectively-, marginally- or sub-optimised teams, who undertook the risk scenario exercise to examine any team-effect on performance.

3. Method

3.1. Participants

Twenty-six participants were recruited to be involved in the review of the RISKometric tool. They were contacted by email to gauge their interest in being part of the study. Their ages ranged from 28 to 64 years (M = 49.65 years, SD = 12.10 years) and there were 22 males and four females. They had a collective experience of 802 years in risk management (M = 30.84 years, R = 36 years, SD = 12.66) noting that they had been practising risk management in their vocations for a minimum of eight years. The participants were from the five tiers of various organisations conducting high-risk activities, e.g., mining, construction and transport, namely board members/senior executives (n = 3); senior managers (n = 9); middle managers (n = 4); supervisors/foremen/team leaders (n = 6), and operators/workers (n = 4).
The University of Queensland Human Ethics Committee approved the procedures of this study. The participants came from a group of people with professional ties to the researcher and were selected on a stratified basis by the researcher on a convenience basis, i.e., known to the researcher and presumed willing to assist in an objective manner (Sincero, 2015). As such, they are not a representative random sample.

3.2. Procedure and Material

The RISKometric asked participants and their raters to assess the competence of participants on the seven elements of the risk management process. To assist respondents in making valid and reliable ratings, each element was explained using the plain English interpretations (PEI) of each developed and validated by Marling et al. [2]. Participants and their raters were asked to rate the participant’s competence on each element using a six-point Likert scale, where zero represented no competency and five an expert level of competency. The six-point scale was used to avoid central tendencies. There was also the option of adding text for further explanation of the score that was selected.
The RISKometric was administered using the web-based SurveyMonkey® platform. The participants were asked to send a URL link of the RISKometric to one upline colleague, at least two peers and two downline colleagues for them to complete the assessment on behalf of the participant. These raters were given the participants’ unique six-digit identification code (as defined by the participant). The participants were also required to assess their own competency using the RISKometric.
Participants were asked to choose raters based on the following criteria:
  • raters would give an honest rather than a ‘rosy’ critique, and
  • raters had observed them in a risk management process.
Due to their position in the organisation, board members/senior executives did not have an upline rater, and operators/workers did not have a downline rater.
The online survey format comprised the following:
  • an introduction page that explained the purpose of the study, instructions, ethics/informed consent, an option to terminate their participation at this stage should they want to;
  • a question asking whether the respondent was the participant or a rater;
  • each participant’s unique six-digit identification code;
  • a question asking participants their level in the organisation (for participants only);
  • a question asking raters what their relationship was to the participant (i.e., upline, peer, downline colleague) (for raters);
  • the survey proper that for each element included: the PEI, a question asking respondents to give a competence rating, and an open question that allowed respondents to provide extra information to support rating, and
  • a ‘thank you’ for completing the survey.
The purpose of the RISKometric was clearly defined as gathering information about participants to allow the forming of collectively-optimised teams to undertake risk management activities. All participants were asked to be honest and to negate halo and leniency effects; equally, they were given prior opportunity to clarify any terms they did not understand.
Two participants indicated that they had recently started a new job and that their new colleagues may not know them well enough to rate effectively their competencies and so used colleagues from their previous employment. Despite being given the option to receive the RISKometric feedback, none of the participants requested it.

3.3. Analysis Strategy

In this study, feedback about participants’ competency in each of the elements came from four different sources—self (i.e., participants), and upline, peers and downline colleagues. Spearman rank-order correlation coefficient tests were conducted to determine the degree of association of ratings from these four groups. Separate correlations were conducted for each of the elements. Some participants received feedback from more than one peer and downline, in these instances, the median of the ratings were used to form one rating.

4. Results

The medians and interquartiles, and correlations of self, and upline, peer and downline colleagues’ ratings for each of the seven risk management elements are shown in Table 1.
Across all elements, all median self-ratings rated as a 3. All self-ratings rated the same as upline ratings except in three elements being one score higher, those being ‘Risk Identification’, ‘Risk Analysis’, and ‘Communication and Consultation’. All self-ratings were higher than peer in the range of one to two scores. All self-ratings were higher than downline in the range of one to two scores. All Peer and downline scores were within a half a score of each other. This suggests a common pattern of responding, independent of the tier of the organisation in which the participant was employed. That is, peers and downline colleagues, rated the participant less favourably, while upline colleagues tended to rate participants more favourably.
Spearman rank-order correlation tests were then run to determine associations between the ratings of the different groups. As shown in Table 1, across all elements, the correlations between the ratings of peers and downline colleagues were significantly and positively correlated. Peer and downline coefficients for six of the elements ranged between 0.76 and 0.90, representing strong associations. For two elements—Context and Risk Analysis, significant, moderate, and positive associations existed between ratings given by upline and peer and downline groups. Interestingly, there were no significant correlations between self-ratings and other groups’ ratings. Apparent in these outcomes is that the type of feedback given by peer and downline groups is similar, and generally different from that of upline colleagues, and all three groups provide a different perspective than that of the participant’s own appraisal.

5. Discussion

This study aimed to develop and review an assessment tool, termed the RISKometric, to assess the competence of individuals in each of the seven elements of the risk management process. A 360° performance review method was used whereby competence ratings were given by peers, upline and downline colleagues and the individual themselves.
A common pattern across the seven elements was found, this being that upline colleagues and participants (self-ratings) typically gave more favourable ratings (more competent) than downline colleagues and peers (see Table 1). Across all elements, upline and self-ratings nearly always fell within the average to high-level of competency ranges. In comparison, peer and downline ratings typically fell within the below average competency range. This result highlights the importance of using a 360-degree method for reviewing the performance of an individual because it draws on the opinions of different sources. Together these may form a complete picture of an individual’s abilities.
The fact that these sources see the individual performing their tasks from a different perspective adds to the richness of the feedback, i.e., a more complete picture of that individual.
One explanation for the high ratings given by self and upline colleagues is that leniency or halo effects affected their feedback. Self-ratings, as might be expected, are especially prone to these effects (Fox et al., [55]; McEvoy and Beatty, [53]; Atkins and Wood, [54]). Self-ratings have also been found to be lacking validity, as results have shown them to be negatively and non-linearly related to performance (McEvoy and Beatty, [53]). McEvoy and Beatty [53] have previously found that upline feedback alone was not a good predictor of performance.
Inter-rater correlations were used to help identify the degree of association between the feedback given by raters (self, peers, and upline and downline colleagues). These outcomes confirmed across all elements, the differences in mean ratings. The ratings given by peers and downline colleagues were found to be strongly and positively associated; with all but one of the coefficients ranging between 0.76 and 0.90. The other coefficient was 0.43. There were no other consistent significant correlations between other raters’ feedback.
The descriptive results and inferential statistics results suggest that peers and downline colleagues similarly rated participants’ competence, and their feedback was less favourable than that given by other sources (self and upline colleagues). Prior research has found that the feedback from downline colleagues and peers is more similar to objective measures of performance because their high level of interaction in tasks and activities allows them to assess better a person’s competencies and performance (Bettenhausen and Fedor, [39]; Fedor et al., [51]; Wexley and Klimoski, [36]; Kane and Lawler, [37]; Murphy and Cleveland, [52]; Cardy and Dobbins, [38]).
The results of this study support those of McEvoy and Beatty, [53] and Atkins and Wood, [54] who found that the average of upline, peer and downline ratings are the best predictors of performance and better than upline ratings alone.
The study has highlighted the usefulness of gaining feedback from multiple sources, as is done in the 360° performance review method. In turn, using multiple sources of feedback in the RISKometric tool appears to have shown that the competence ratings of peers and downline colleagues may provide beneficial in developing teams that are collectively competent in the seven elements of the risk management process.

6. Conclusions

This research provides a method for identifying where people are perceived to be competent in each of the seven elements of the risk management process, based on the perception of themselves, and their upline, peers and downline. Too many times, risk management is undertaken in an ad-hoc manner in workplaces, and this 360° method could help assemble teams that are collectively competent in the seven elements of the risk management process. The outcome of such is that team performance in risk management is better than individual performance and even better than a collective of individuals when the team has been collectively-optimised for competence in the seven elements of the risk management process. A further study to test this hypothesis will be the result of a subsequent paper.
With the recent focus on managing the triple bottom line of time, cost and quality, the importance of collectively managing WHS risk cannot be over-emphasised (Zou and Sunindijo, [56]). This research can be seen as the first steps for widespread use in collectively-optimising risk management teams across a number of industries, not just the mining and construction industry where much of the research focused. Many of these industries have an unrealistic vision of ‘zero harm’, or what Burnham [57] describes as counterproductive to WHS efforts. So this process of using Marling et al.’s [2] PEIs and a tool to measure perception of competency, based on the 360° method, may help move them to the realm of making sense of risk and integrating appropriate risk-taking within their business operations.
This study is just the starting point. The next step is to capture this information in such a way to measure risk management competency in the seven elements of the risk management process through completing risk scenarios and then to use these findings to optimise risk forum teams. These next steps will provide validation, or otherwise, of the 360° method described here.

Author Contributions

The research was performed by G.M. It was supervised by T.H. and J.H. The paper was written mainly by G.M., with active input from the other two authors throughout. All authors have read and agreed to the published version of the manuscript.

Funding

This research received no external funding.

Conflicts of Interest

The authors declare no conflict of interest.

References

  1. Marling, G.J. Optimising Risk Management Team Processes. Ph.D. Thesis, University of Queensland, Brisbane, Australia, 2015. [Google Scholar]
  2. Marling, G.J.; Horberry, T.; Harris, J. Development and validation of plain English interpretations of the seven elements of the risk management process. Safety 2019, 5, 75. [Google Scholar] [CrossRef] [Green Version]
  3. Tornow, W. Perceptions or reality: Is multi-perspective measurement a means to an end? Hum. Resour. Manag. 1993, 32, 221–229. [Google Scholar] [CrossRef]
  4. Hoffman, R. Ten reasons why you should be using 360-degree feedback. HR Mag. 1995, 40, 82–86. [Google Scholar]
  5. Lepsinger, R.; Lucia, A. The Art and Science of 360˚ Feedback; Jossey-Bass-Pfeiffer: San Francisco, CA, USA, 2009. [Google Scholar]
  6. Peters, H. Peer coaching for executives. Train. Dev. 1996, 50, 39–42. [Google Scholar]
  7. Handy, L.; Devine, M.; Heath, L. 360˚ Feedback: Unguided Missile or Powerful Weapon? Ashridge Management Research Group: Berkhamsted, UK, 1996.
  8. Coates, D. Don’t tie 360 feedback to pay. Training 1998, 35, 68–75. [Google Scholar]
  9. Espinilla, M.; De Andrés, R.; Martínez, F.J.; Martínez, L. A 360-degree performance appraisal model dealing with heterogeneous information and dependent criteria. Inf. Sci. 2003, 222, 459–471. [Google Scholar] [CrossRef]
  10. Yukl, G.; Lepsinger, R. How to get the most out of 360˚ feedback. Training 1995, 32, 45–50. [Google Scholar]
  11. Jones, J.E.; Bearley, W.L. 360˚ Feedback: Strategies, Tactics and Techniques for Developing Leaders; HRD Press: Armherst, MA, USA, 1996. [Google Scholar]
  12. Mabey, C. Closing the circle: Participant views of a 360 degree feedback programme. Hum. Resour. Manag. J. 2001, 11, 41–53. [Google Scholar] [CrossRef]
  13. McCarthy, A.; Garavan, T.N. 360° feedback process: Performance, improvement and employee career development. J. Eur. Ind. Train. 2001, 25, 5–32. [Google Scholar] [CrossRef]
  14. Hannum, K.M. Measurement Equivalence of 360°-Assessment Data: Are different raters rating the same constructs? Int. J. Sel. Assess. 2007, 15, 293–301. [Google Scholar] [CrossRef]
  15. Nowack, K. 360˚ feedback: The whole story. Train. Dev. 1993, 47, 69–73. [Google Scholar]
  16. Hogg, B. The AMA Competency Programme. Development Centers: Realizing the Potential of Your Employees through Assessment and Development; The Tata-McGraw-Hill Training Series: London, UK, 1989. [Google Scholar]
  17. Craig, S.B.; Hannum, K. Research update: 360-degree performance assessment. Consult. Psychol. J. Pr. Res. 2006, 58, 117–124. [Google Scholar] [CrossRef]
  18. Doherty, E.G.; Brodsky, D. Educational perspectives the 360-degree assessment: A new paradigm in trainee evaluation. NeoReviews 2011, 12, 191–197. [Google Scholar] [CrossRef] [Green Version]
  19. Carson, M. Saying it like it isn’t: The pros and cons of 360-degree feedback. Bus. Horiz. 2006, 49, 395–402. [Google Scholar] [CrossRef]
  20. Penny, J.A. Exploring differential item functioning in a 360-degree assessment: Rater source and method of delivery. Organ. Res. Methods 2003, 6, 61–79. [Google Scholar] [CrossRef]
  21. Smither, J.W.; Walker, A.G.; Yap, M.K.T. An examination of the equivalence of web-based versus paper-and-pencil up- ward feedback ratings: Rater- and ratee-level analyses. Educ. Psychol. Meas. 2004, 64, 40–61. [Google Scholar] [CrossRef]
  22. Denisi, A.S.; Kluger, A.N. Feedback effectiveness: Can 360-degree appraisals be improved? Acad. Manag. Perspect. 2000, 14, 129–139. [Google Scholar] [CrossRef]
  23. Hackman, J.R.; Oldham, G.R. Work Redesign; Addison-Wesley: Reading, MA, USA, 1980. [Google Scholar]
  24. Becker, T.E.; Klimoski, R.J. A field study of the relationship between the organizational feedback environment and performance. Pers. Psychol. 1989, 42, 343–358. [Google Scholar] [CrossRef]
  25. Church, A.H.; Bracken, D.W. Advancing the state of the art of 360-degree feedback guest editors’ comments on the research and practice of multirater assessment methods. Group Organ. Manag. 1997, 22, 149–161. [Google Scholar] [CrossRef]
  26. London, M.; Beatty, R. 360° feedback as a competitive advantage. Hum. Resour. Manag. 1993, 32, 353–372. [Google Scholar] [CrossRef]
  27. Hazucha, J.F.; Hezlett, S.A.; Schneider, R.J. The impact of 360-degree feedback on management skills development. Hum. Resour. Manag. 1993, 32, 325–351. [Google Scholar] [CrossRef]
  28. Folger, R.; Cropanzano, R. Organizational Justice and Human Resource Management; SAGE Publications: Yhousand Oaks, CA, USA, 1998. [Google Scholar]
  29. Hegarty, W.H. Using subordinate ratings to elicit behavioral changes in supervisors. J. Appl. Psychol. 1974, 59, 764–766. [Google Scholar] [CrossRef]
  30. Atwater, L.; Roush, P.; Fischthal, A. The influence of upward feedback on self- and follower ratings of leadership. Pers. Psychol. 1995, 48, 35–59. [Google Scholar] [CrossRef]
  31. Reilly, R.; Smither, J.; Vasilopoulos, N. A longitudinal study of upward feedback. Pers. Psychol. 1996, 49, 599–612. [Google Scholar] [CrossRef]
  32. Walker, A.; Smither, J. A five-year study of upward appraisal feedback: What managers do with their results matters. Pers. Psychol. 1999, 52, 393–423. [Google Scholar] [CrossRef]
  33. Smither, J.; London, M.; Vasilopoulos, N.; Reilly, R.; Millsap, R.; Salvemini, N. An examination of the effects of an upward feedback program over time. Pers. Psychol. 1995, 48, 1–34. [Google Scholar] [CrossRef]
  34. Atwater, L.; Waldman, D.; Atwater, D.; Cartier, P. An upward feedback field experiment: Supervisors’ cynicism, reactions, and commitment to subordinates. Pers. Psychol. 2000, 53, 275–297. [Google Scholar] [CrossRef]
  35. Morgan, A.; Cannan, K.; Cullinane, J. 360° feedback: A critical enquiry. Pers. Rev. 2005, 34, 663–680. [Google Scholar] [CrossRef]
  36. Wexley, K.; Klimoski, R. Performance appraisal: An update. In Research in Personnel and Human Resources Management, 2nd ed.; Rowland, K., Ferris, G., Eds.; JAI Press: Greenwich, CT, USA, 1984. [Google Scholar]
  37. Kane, J.; Lawler, E. Methods of peer assessment. Psychol. Bull. 1978, 8, 555–586. [Google Scholar] [CrossRef]
  38. Cardy, R.; Dobbins, G. Performance Appraisal: Alternative Perspectives; Southwestern Publishing: Cincinnati, OH, USA, 1994. [Google Scholar]
  39. Bettenhausen, K.; Fedor, D. Peer and upward appraisals: A comparison of their benefits and problems. Group Organ. Manag. 1997, 22, 236–263. [Google Scholar] [CrossRef]
  40. Lawler, E.; Mohrman, A.; Resnick, S. Performance appraisal revisited. Organ. Dyn. 1984, 13, 20–35. [Google Scholar] [CrossRef]
  41. Meyer, H. A solution to the performance appraisal feedback enigma. Acad. Manag. Perspect. 1991, 5, 68–76. [Google Scholar] [CrossRef]
  42. Napier, N.; Latham, G. Outcome expectancies of people who conduct performance appraisals. Pers. Psychol. 1986, 39, 827–837. [Google Scholar] [CrossRef]
  43. Bernardin, H.J.; Beatty, R. Can subordinate appraisals enhance managerial productivity? Sloan Manag. Rev. 1987, 28, 63–73. [Google Scholar]
  44. London, M.; Wohlers, A.; Gallagher, P. 360˚ feedback surveys: A source of feedback to guide management development. J. Manag. Dev. 1990, 9, 17–31. [Google Scholar] [CrossRef]
  45. Kaplan, R. 360-degree feedback PLUS: Boosting the power of co-worker ratings for executives. Hum. Resour. Manag. 1993, 32, 299–314. [Google Scholar] [CrossRef]
  46. Bracken, D. Multisource (360˚) feedback: Surveys for individual and organizational development. In Organizational Surveys: Tools for Assessment and Change; Kraut, A., Ed.; Jossey-Bass: San Francisco, CA, USA, 1996; pp. 117–143. [Google Scholar]
  47. Moses, J.; Hollenbeck, G.; Sorcher, M. Other people’s expectations. Hum. Resour. Manag. 1993, 32, 283–297. [Google Scholar] [CrossRef]
  48. Kanouse, D. Why multi-rater feedback systems fail. HR Focus 1998, 75, 3–4. [Google Scholar]
  49. Rou, T.V.; Rou, R. The Power of 360 Degree Feedback; Sage Publications: New Delhi, India, 2014. [Google Scholar]
  50. McEvoy, G.; Buller, P. user acceptance of peer appraisals in an industrial setting. Pers. Psychol. 1987, 40, 785–797. [Google Scholar] [CrossRef]
  51. Fedor, D.; Bettenhausen, K.; Davis, W. Peer reviews: Employees’ dual roles as raters and recipients. Group Organ. Manag. 1999, 24, 92–120. [Google Scholar] [CrossRef]
  52. Murphy, K.; Cleveland, J. Performance Appraisal: An Organizational Perspective; Allyn & Bacon: Boston, MA, USA, 1991. [Google Scholar]
  53. McEvoy, G.; Beatty, R. Assessment centres and subordinate appraisal of managers: A seven-year longitudinal examination of predictive validity. Pers. Psychol. 1989, 42, 37–52. [Google Scholar] [CrossRef]
  54. Atkins, P.W.B.; Wood, R.E. Self- versus others’ ratings as predictors of assessment center ratings: Validation evidence for 360-degree feedback programs. Pers. Psychol. 2002, 55, 871–904. [Google Scholar] [CrossRef]
  55. Fox, S.; Caspy, T.; Reisler, A. Variables affecting leniency, halo and validity of self-appraisal. J. Occup. Organ. Psychol. 1994, 67, 45–56. [Google Scholar] [CrossRef]
  56. Zou, P.X.W.; Sunindijo, R.Y. Skills for managing safety risk, implementing safety task, and developing positive safety climate in construction project. Autom. Constr. 2013, 34, 92–100. [Google Scholar] [CrossRef]
  57. Burnham, M. Targeting zero. Professional safety. J. Am. Soc. Saf. Eng. 2015, 60, 40–45. [Google Scholar]
Figure 1. A model of feedback that raters used in a 360° performance.
Safety 07 00001 g001
Table 1. Median and interquartile ranges and correlation coefficients of the ratings of self, and upline, peers and downline colleagues for the seven elements of the risk management process.
ElementCorrelation Coefficient (r)Descriptives
SelfUplinePeersDownlineMedianQuartile Array 1 (Q1)Quartile Array 3 (Q3)Interquartile Range (IQR = Q3 − Q1)
Context
Self1 3.002.254.001.75
Upline−0.2581 3.003.004.001.00
Peers0.0530.444 *1 2.001.003.002.00
Downline−0.0340.661 **0.849 **12.002.003.001.00
Risk identification
Self1 3.003.004.001.00
Upline−0.0121 4.003.004.001.00
Peers0.1530.3971 2.002.003.001.00
Downline0.3060.3830.875 **12.002.004.002.00
Risk analysis
Self1 3.002.254.001.75
Upline0.0221 4.002.004.002.00
Peers−0.0770.601 **1 1.001.002.001.00
Downline0.0250.606 **0.895 **11.501.002.751.75
Risk evaluation
Self1 3.002.004.002.00
Upline0.0871 3.002.504.001.50
Peers0.1740.1111 1.001.002.001.00
Downline0.2620.3110.763 **11.501.002.001.00
Risk treatment
Self1 3.003.004.001.00
Upline−0.1871 3.002.004.002.00
Peers−0.1160.0911 2.001.002.001.00
Downline0.1290.1520.765 **12.001.003.002.00
Communication and consultation
Self1 3.002.004.002.00
Upline01 4.002.504.001.50
Peers−0.1950.0911 1.001.002.001.00
Downline0.0200.1130.797 **11.001.002.001.00
Monitoring and reviewing
Self1 3.002.004.002.00
Upline−0.1491 3.002.004.002.00
Peers0.2760.1821 1.001.002.001.00
Downline−0.3510.2490.429 *11.001.001.751.75
Note. * is correlation is significant at the 0.05 level and ** is p < 0.01, (2-tailed).
Publisher’s Note: MDPI stays neutral with regard to jurisdictional claims in published maps and institutional affiliations.

