Fall-Protection Harness Training: Donning Skill Improves with Up to Four Repetitions


Department of Safety, Health, and Industrial Hygiene, Montana Technological University, Butte, MT 59701, USA
*
Author to whom correspondence should be addressed.
Safety 2021, 7(1), 16; https://0-doi-org.brum.beds.ac.uk/10.3390/safety7010016
Submission received: 18 August 2020
/
Revised: 11 December 2020
/
Accepted: 7 January 2021
/
Published: 23 February 2021
(This article belongs to the Special Issue Methods and Instruments for Evaluating and Measuring Safety)
Abstract
:Injuries and fatalities from falling remain a major occupational safety concern. Among the multiple tactics for preventing fatal falls is the use of personal fall protection involving wearing a harness connected to a secure anchor point. This requires training to ensure trainees understand the importance of fall protection and have the skill to implement it correctly. One important skill is donning a fall protection harness and adjusting the straps. Those who conduct training on fall protection need to coach trainees through the steps involved in donning a harness. This study was undertaken to learn the benefits of practicing with the guidance of a coach. The experiment had university student volunteers watch a training video twice and then don a harness four times while being coached. Times for each of the five steps involved in donning and adjusting a harness were obtained for the 22 subjects who completed all steps. Time was used as the measure of skill level. The step of adjusting the leg straps accounted for the most time in all of the four repetitions. Total time to don fall protection was reduced with practice. The reduction followed a learning curve function based on a power model. According to this model, each doubling of the number of repetitions results in a 22.1% reduction in total time to don the harness.
1. Introduction
Many workers are exposed to the risk of falling from an elevated position. Results of falls vary, but many falls end in blunt force trauma causing serious injury and death [1] (p. 17). This article provides data on the incidence of occupational deaths from falling, compares fall-related death rates among four large industrial sectors, summarizes strategies for protecting workers exposed to fall hazards, and presents the rationale for investigating the strategy of using personal fall-protection equipment to save a worker after a fall. The research described in this article examined a particular aspect of personal fall protection—training people to don a fall-protection harness and adjust the straps to achieve a fit conforming with recommendations.
1.1. Occupational Fatalities in the United States
Occupational falls occur in all industries [1] (pp. 18–20). Deaths and injuries from falling have a long history of recognition and gradual development of standards [1] (pp. 9–12, 46–57). For this article, retrospective data from the United States are provided to illustrate the significance of occupational fatalities resulting from falls. The source of data for this was a national data system maintained by the US Bureau of Labor Statistics (BLS) containing records on occupational fatalities [2,3]. These records include the fatality experiences of different industries, classified by the North American Industry Classification System (NAICS) [4]. To illustrate, the 2018 fatality experiences in the four largest employment sectors under the Goods Producing and Service category are compared in Table 1 [2,3]. The construction industries had the most fatalities and the largest portion (33.5%) of fatalities classified as “falls, slips, trips” [2,3]. The four industrial sectors listed in Table 1 accounted for 2085 of the 5250 total occupational fatalities in the United States in 2018 [2]. Of course, each industrial sector has many diverse jobs, so the risks do not fully reflect differences such as wage employees versus managerial employees.
For fatal fall experiences, the Census of Fatal Occupational Injuries by BLS provides information about the event most directly leading to occupational fatalities [5]. Table 2 provides all industry data on the events preceding occupational fatal falls. Falls to a lower level accounted for the most fatal falls (615) and the largest percentage of all fatal falls (79.2%). Data such as that those cited, led the investigators to select fall protection as their general area for research. Within that general area, the researchers decided to create an experiment on training people to effectively don a fall-protection harness and adjust the straps according to instructions by the harness manufacturer.
1.2. Strategies for Reducing Risk of Falls
The data in Table 2 documents the need for more effective fall-protection practices in the United States. This is in spite of regulations providing minimal safe practices and voluntary standards providing best practices [1] (pp. 9–12), [6]. A list of risk-reduction strategies for fall hazards is provided by Ellis as follows [1]:
- Eliminating the fall hazard;
- Preventing fall hazards, by guarding or restraint;
- Arresting falls after they occur; and
- Applying administrative techniques as a last resort.
Strategy 3 includes using a net to catch a fallen worker and using personal fall-protection equipment [1] (p. 32). Personal fall protection involves having the worker wear a fall-protection harness with a D-ring located behind the upper back and having it connected to a lanyard or cabling connected to a secure anchor. Some arrangements include a retractable lifeline between the D-ring and the anchor. In addition to having personnel use the equipment, the employer needs a plan for rescuing a fallen worker [1] (pp. 455–486).
Hierarchies for hazard control come into play when conducting risk assessments. The basic risk assessment process for occupational safety and health is to start by identifying a hazard and each risk posed by the hazard, then exploring various options for reducing each risk [7]. Having a particular hierarchy of controls helps a risk assessment team follow a logical process while seeking ways to reduce the risk of a particular hazard to an acceptable level. The study reported here addressed strategy 3 in the hierarchy list―arresting falls after they occur.
The regulatory strategy employed by the US Occupational Safety and Health Administration (OSHA) uses regulations requiring fall protection programs, employee training, and other practices [8,9,10]. However, achieving compliance is not easy. OSHA publishes a list of the most cited standards across all industries annually. Two fall-protection standards are on the 2018 top-10 list [11]. The most cited was not having a fall-protection program, and the eighth most cited was not meeting the fall-protection training requirements [11].
A fall-protection program is expected to address both fall prevention and fall protection [8,9,10]. Fall prevention involves engineered controls and work practices for preventing the occurrence of falls, whereas, fall protection involves post-fall means, such as nets to catch a falling worker and personal fall-protection systems involving a harness connected to a secure anchor [1] (p. 6). The personal fall-protection approach can be effective if used, but information from the US National Institute for Occupational Safety and Health (NIOSH), revealed that only 18 out of 325 (5.5%) victims of the fatal falls investigated by NIOSH staff were wearing a fall-protection harness, and 13 of those were not tied off [12]. This suggests a major challenge lies in getting workers to consistently use personal fall-protection harnesses with an anchorage system in place.
Getting workers to use available fall protection starts with training. In the United States, training is required but the quality of training is flexible [8,9,10]. The applicable minimum training is to “train each employee in the procedures to be followed to minimize these hazards.” Thus, a training program for workers who will be using a personal fall-protection system can meet this minimum without even providing hands-on experience properly inspecting, donning, and adjusting the straps of their harness.
What should a quality training program include? According to adult learning theory, effective training for adult learners includes providing multiple learning activities [13,14]. The least effective are lectures and reading, while effectiveness increases as activities involve more active participation and hands-on experiences [15]. More specifically for fall protection training, McCurley offers insights gained from extensive experience training workers on fall-protection and rescue [16]. He shared the following observations.
- Effective training “requires attention to improving worker’s knowledge and skills specific to fall protection, as well as their preparation through the availability of proper equipment along with hands-on training.”
- Effective fall-protection training should be organized so it mimics as closely as possible the actual work environment and practices.
- Employees should be given an opportunity to practice and apply learned knowledge and skills.
1.3. Research on Personal Fall-Protection Harnesses
Research on harness fitting and usage has been conducted by the NIOSH Division of Safety Research [17,18,19]. The fall arrest of a worker wearing an incorrectly adjusted harness can inflict serious injuries, some of which are noted by the leader of the NIOSH research team [18]. One such scenario is when the chest strap is too loose, which may cause a fallen worker to slip out and fall to the ground. Another scenario is when the chest strap is too high. It can contact the neck and restrict airflow while suspended. Another scenario occurs when the leg straps are not adjusted properly, in which case the worker can suffer a severe and permanent groin injury when the fall is arrested; in addition, once suspended, the leg straps can interfere with circulation [17,19]. These undesirable results can be avoided by properly adjusting the straps on a properly fitted harness [17,18,19].
What is involved in properly fitting a harness? In a study by the NIOSH Division of Safety Research, construction workers (72 male and 26 female) were suspended in a full-body construction harness [17]. They were scanned to evaluate the fit and sizing efficacy of the harness system. Based on the study, the authors provided the following parameters for a good fit for a construction style harness [17].
- The thigh strap should be snug but should not cut off circulation. This is a comfort issue when standing but becomes a safety issue in post-fall suspension. The rule of thumb is that no more than two fingers should be able to be inserted between the thigh strap and the thigh.
- The chest strap should fall just below the sternum. Inadequate chest ring location can interfere with a person’s work, especially for female workers.
- The harness should hold the body no more than 30 degrees off vertical in suspension. This is a safety as well as a comfort issue. With loose shoulder straps, the angle of the suspended person is increased.
- The back D-ring should fall between the shoulder blades. This helps distribute the force of the fall arrest over the body’s frame.
As noted in the list, a properly fitting harness affects both comfort and safety. Comfort is important because it will encourage workers to use their fall-protection equipment, whereas discomfort will provide a disincentive to use. Safety is important because of both traumatic injury when a fall is suddenly arrested and the potential for harm resulting from remaining suspended [18,19]. In addition to comfort and safety, the time it takes to don and properly adjust all the straps may be seen as a disincentive to use the equipment. An effective training program has the potential for workers to build skills at donning and adjusting a harness and limiting the disincentives involved.
1.4. Research Issue and Project Aim
What is the value of more than one practice donning and adjusting? How does practice combined with coaching affect the skill of donning a fall-protection harness? The time to complete one donning and adjusting cycle by an individual is expected to follow a decreasing time with each repetition of practice. According to Welford, this reducing time pattern is due to the practice leading to improved skill by attainment of “uniformity and elimination of wasted motions” [20]. In the era of time and motion studies, industrial engineers had an interest in having a mathematical model for supporting time studies they used for establishing standard cycle times for production work [21,22,23]. DeJong presented two equations for predicting the time reduction based on the number of repetitions of the task [21]. One equation applied to tasks for which no minimum time is known or assumed; the other applied to tasks for which a minimal asymptote he called “incompressible time” is considered. Ergonomists had an interest in understanding the process of learning manual skills, and Crossman advanced a theory [24]. Both DeJong and Crossman cited earlier studies from manufacturing operations and controlled studies showing consistent patterns of reducing cycle times [21,24]. One interesting study they cited used time data from a cigar-making factory. The cigar makers needed perceptual and manual skills. The data consisted of women assemblers making cigars for extended times. Defining the number of cigars made per week as a cycle, and assuming a year consists of 50 weeks, then two years would be 100 cycles for which the learning curve model fit. After two or three years, the learning appeared to have reached a point of no more reduction. Crossman also cited time studies of trainees learning to operate industrial machines by performing 50 practice cycles that found time reductions followed DeJong’s first equation [24].
The term “learning curve” refers to the change in a performance variable with the number of practices. In the medical literature, the performance variable is often used for improvements in skill, such as a surgeon learning a new procedure [25]. In the industrial engineer field, the performance variable is usually time [23]. For studying the learning that takes place by donning and adjusting straps of a fall-protection harness, time can be objectively measured, while a fully-objective way to measure harness fit is lacking.
DeJong’s first equation indicates that for learners practicing a new task, doubling of repetitions (R) resulted in a decrease in cycle time (TR) of about 20 percent [21]. Another way to express it is that when R is doubled, T2R = 0.8 TR [20,21,23,24]. Equation (1) may be used to predict TR when the time for the initial repetition is known (T1) and an exponent of reduction (B) has been determined:
The exponent was historically determined by plotting on log-log graph paper the log of cycle time on the y-axis against the log of repetitions on the x-axis. The downward slope of the line was used to determine B. According to the authors cited [20,21,22,23], the typical slope of −0.32 corresponds to a “20% learning curve,” or the equivalent “80% learning curve.” With easier access to statistical programs, the approach to determine B from collected data is to first take the log of both sides of Equation (1) to obtain Equation (2). By fitting Equation (2) with linear regression, the slope term (B) will be the exponent term in Equation (1):
The project reported here was undertaken to provide objective data on how skill develops through multiple practices at donning a fall-protection harness and adjusting the straps while being coached. Building on the previously mentioned advice of McCurley [16], a study was designed to provide trainees with a harness that matches their body size, personal coaching that mimics a sound method of instruction, and the opportunity to learn by practicing the skill of donning a fall-protection harness and adjusting the various straps to provide a fit conforming to the harness manufacturer’s instructions. The study sought to learn how performing multiple practices contributes to skill development. In order to measure skill development objectively, we used the time to complete each donning process.
Our initial expectation was that the time to don a harness and adjust the straps would be longer on the initial repetition and reduced with each subsequent repetition. The specific aim of the project was to quantitatively characterize how the time to don and adjust a harness, while being coached, changes with the number of repetitions using the learning curve model in Equation (1).
2. Materials and Methods
2.1. Experimental Design
The experiment was designed to examine a single factor, repetition, consisting of four factor levels (the repetitions). Each subject was scheduled to perform the four repetitions in the same order. A sample size of 25 subjects was based on the senior investigator’s judgment developed from previous human subject experiments. The intent of his plan was to create a set of experimental data for examining the hypothesis that the mean times of each repetition are equal, with the alternative hypothesis that all four mean times were not equal. The same data set would also support analyses to examine how well the learning curve in Equation (1) fits the observed mean times.
2.2. Recruiting Subjects
All subjects gave their informed consent prior to participating in the study. The study was performed in accordance with the Declaration of Helsinki. The study protocol was accepted and approved by the University of Montana’s Institutional Review Board for the Protection of Human Subjects in Research prior to recruiting subjects (IRB Protocol No. 108-18, 9 May 2018). Students attending undergraduate classes in Occupational Safety and Health (OSH) were recruited from classes not taught by any of the authors. A majority of students in those courses were majoring in OSH, while a minority were civil engineering majors. Following a PowerPoint presentation explaining the study, a signup sheet was circulated and subsequently used to contact volunteers.
Students in the classes were invited to sign up if they would like to participate. Requirements for participation were being over the age of 18, having no prior fall-protection training, and being capable of putting on a harness and adjusting the straps.
2.3. Equipment
The DBI Sala ExoFit XP Full Body Harness (3M Fall Protection, Red Wing, MN, USA) [26] was chosen for the study. Features we liked included it was available in five sizes, it was designed for use in construction, and it came with quick-connect buckles that allow precisely fitting a variety of differently-sized individuals. The five harness sizes available for the study were extra-small, small, medium, large, and extra-large. The leg-strap buckle is shown in Figure 1.
2.4. Procedure
2.4.1. Preliminary Steps
Upon arrival in the lab, participants were provided with a unisex tank top t-shirt that allowed a clear view of shoulders and avoided interference with the task. They wore their own jeans or other pants. After changing into the t-shirt, they received instructions on the tasks involved. They watched a training video from the harness manufacturer’s website on properly donning the particular model of harness they were going to use. It showed a person performing the steps of properly donning the harness by shaking out the harness, putting it on using the same motion as putting on a backpack, positioning the D-ring between the shoulder blades, and adjusting the straps (legs, shoulder, chest, and belt).
After watching the video once, the risks and benefits of participation were explained, and the student was invited to consent by signing the approved consent form. Following the consent form signing, the subject again watched the training video. The next process was finding a harness that fit the individual. That involved measuring the subject’s height and weight, consulting the harness manufacturer’s guide to size selection based on height and weight [27], and trying on the selected harness. For some subjects, the harness did not fit well, so an alternative size was selected. The final decision on which harness to use was made by the subject.
2.4.2. Harness and Donning Procedures
The selected harness was prepared for the first repetition by setting all straps to the original length when taken out of the manufacturer’s packaging. This was repeated for each repetition. The harness was placed on a table with straps in an extended position as shown in Figure 2.
Each subject donned a harness four times while being recorded with a video camera. After a subject stated their donning was completed, the subject posed for observation, and a photo was taken by facing the video camera and the still camera, then rotating to the left 90 degrees and posing to show their right side, then rotating again to show their back, then rotating 90 degrees so their left side was visible. The coach visually assessed the fit by looking at each perspective using the following attributes:
- Leg strap tightness appeared too tight, too loose, or adequate;
- Chest strap position appeared too low, too high, or mid-chest;
- Shoulder strap adjustment appeared too tight on shoulders, too loose on shoulders, and at reasonable tension; and
- Location of dorsal D-ring appeared too low, too high, or in between shoulder blades.
The coach provided feedback after each donning process if any of the harness straps did not conform to any of the applicable attributes. The observer did not touch the straps to check for tightness due to concerns by the Institutional Review Board. Once the observations and feedback were completed, the subject removed their harness and took some free time while the coach restored the straps to the original length. The harness was again laid on the table for the next repetition. Subjects started their next repetition when they felt ready. After completing the four repetitions, subjects were given, as a token of appreciation, a choice of 10 Dollars or a one-point addition to their course grade percentage.
2.4.3. Preparing Time Data for Analyses
In order to move from videotape recordings to data suitable for statistical analyses, the following five steps were needed:
- Videotapes of each subject performing each repetition were transferred to a computer;
- The video recordings were reviewed with the aid of Observer XT software (Version 11, Noldus Information Technology, Inc., Leesburg, VA, USA) to determine times for each step [29];
- Time data were transferred to a Microsoft Excel® spreadsheet (Release 2019, Microsoft Corporation, Edmonds, WA, USA) for limited analyses;
- The data were copied to Minitab statistical software (Release 2019, Minitab Corporation, State College, PA, USA) for statistical analyses [30].
In Step 2, the Observer XT software [29] was used to precisely determine the time to complete each step and the overall time to complete the donning process. In addition, reviewing the videos helped find some mistakes or troubles not noticed during the harness donning process.
2.4.4. Programming Observer XT 11 Software
The Observer XT 11 software is a flexible software program for the collection, analysis, and presentation of observable data [29]. It was programmed to facilitate getting times for the steps in a harness donning process. The program was formatted to break down the total donning process into five steps. Figure 3 provides examples of subjects performing the steps. Each of the five steps was given a predetermined key on the keyboard, along with a key to tracking the overall time of each donning process. Timing began when the subject started. After that, a programmed key was pressed when each task was completed. That time was the start time for the next step. When the last step was completed, the overall time key was pressed.
A spreadsheet was used to store each subject’s times for each step; total time of process; subject’s height and weight; the size of the harness used; and any communication or harness issues that were experienced.
2.5. Analyses
Three of the original 25 subjects were fitted with the extra small harness that did not come with a waist belt. Because these subjects did not include adjusting the belt, a post-experiment decision was made to omit their data from that of the 22 who included time to adjust the waist belt.
Analyses of the time data from 22 subjects consisted of a graphical comparison of times for each repetition, including total time and step-specific times. A one-way analysis of variance (ANOVA) [31] was performed for each of the five donning step times and the total time to determine if completion times differed with repetition. Linear regression was used to determine the exponent for Equation (1) (the slope term) by regressing the log of time against the log of repetition. All statistical tests used Minitab 19 [30].
3. Results
3.1. Subjects Demographics
Demographics of the 25 volunteer subjects are provided in Table 3. The two male subjects who could not get a snug fit with the leg straps weighed 47.6 Kg and 50.8 Kg. Time data for both were removed due to using the extra small harness with no waist belt. The third person removed was a female who found the extra small harness fit her legs. Three of the 25 subjects chose to receive $10 USD for participation while the others chose the extra credit option.
3.2. Components of Total Donning Time
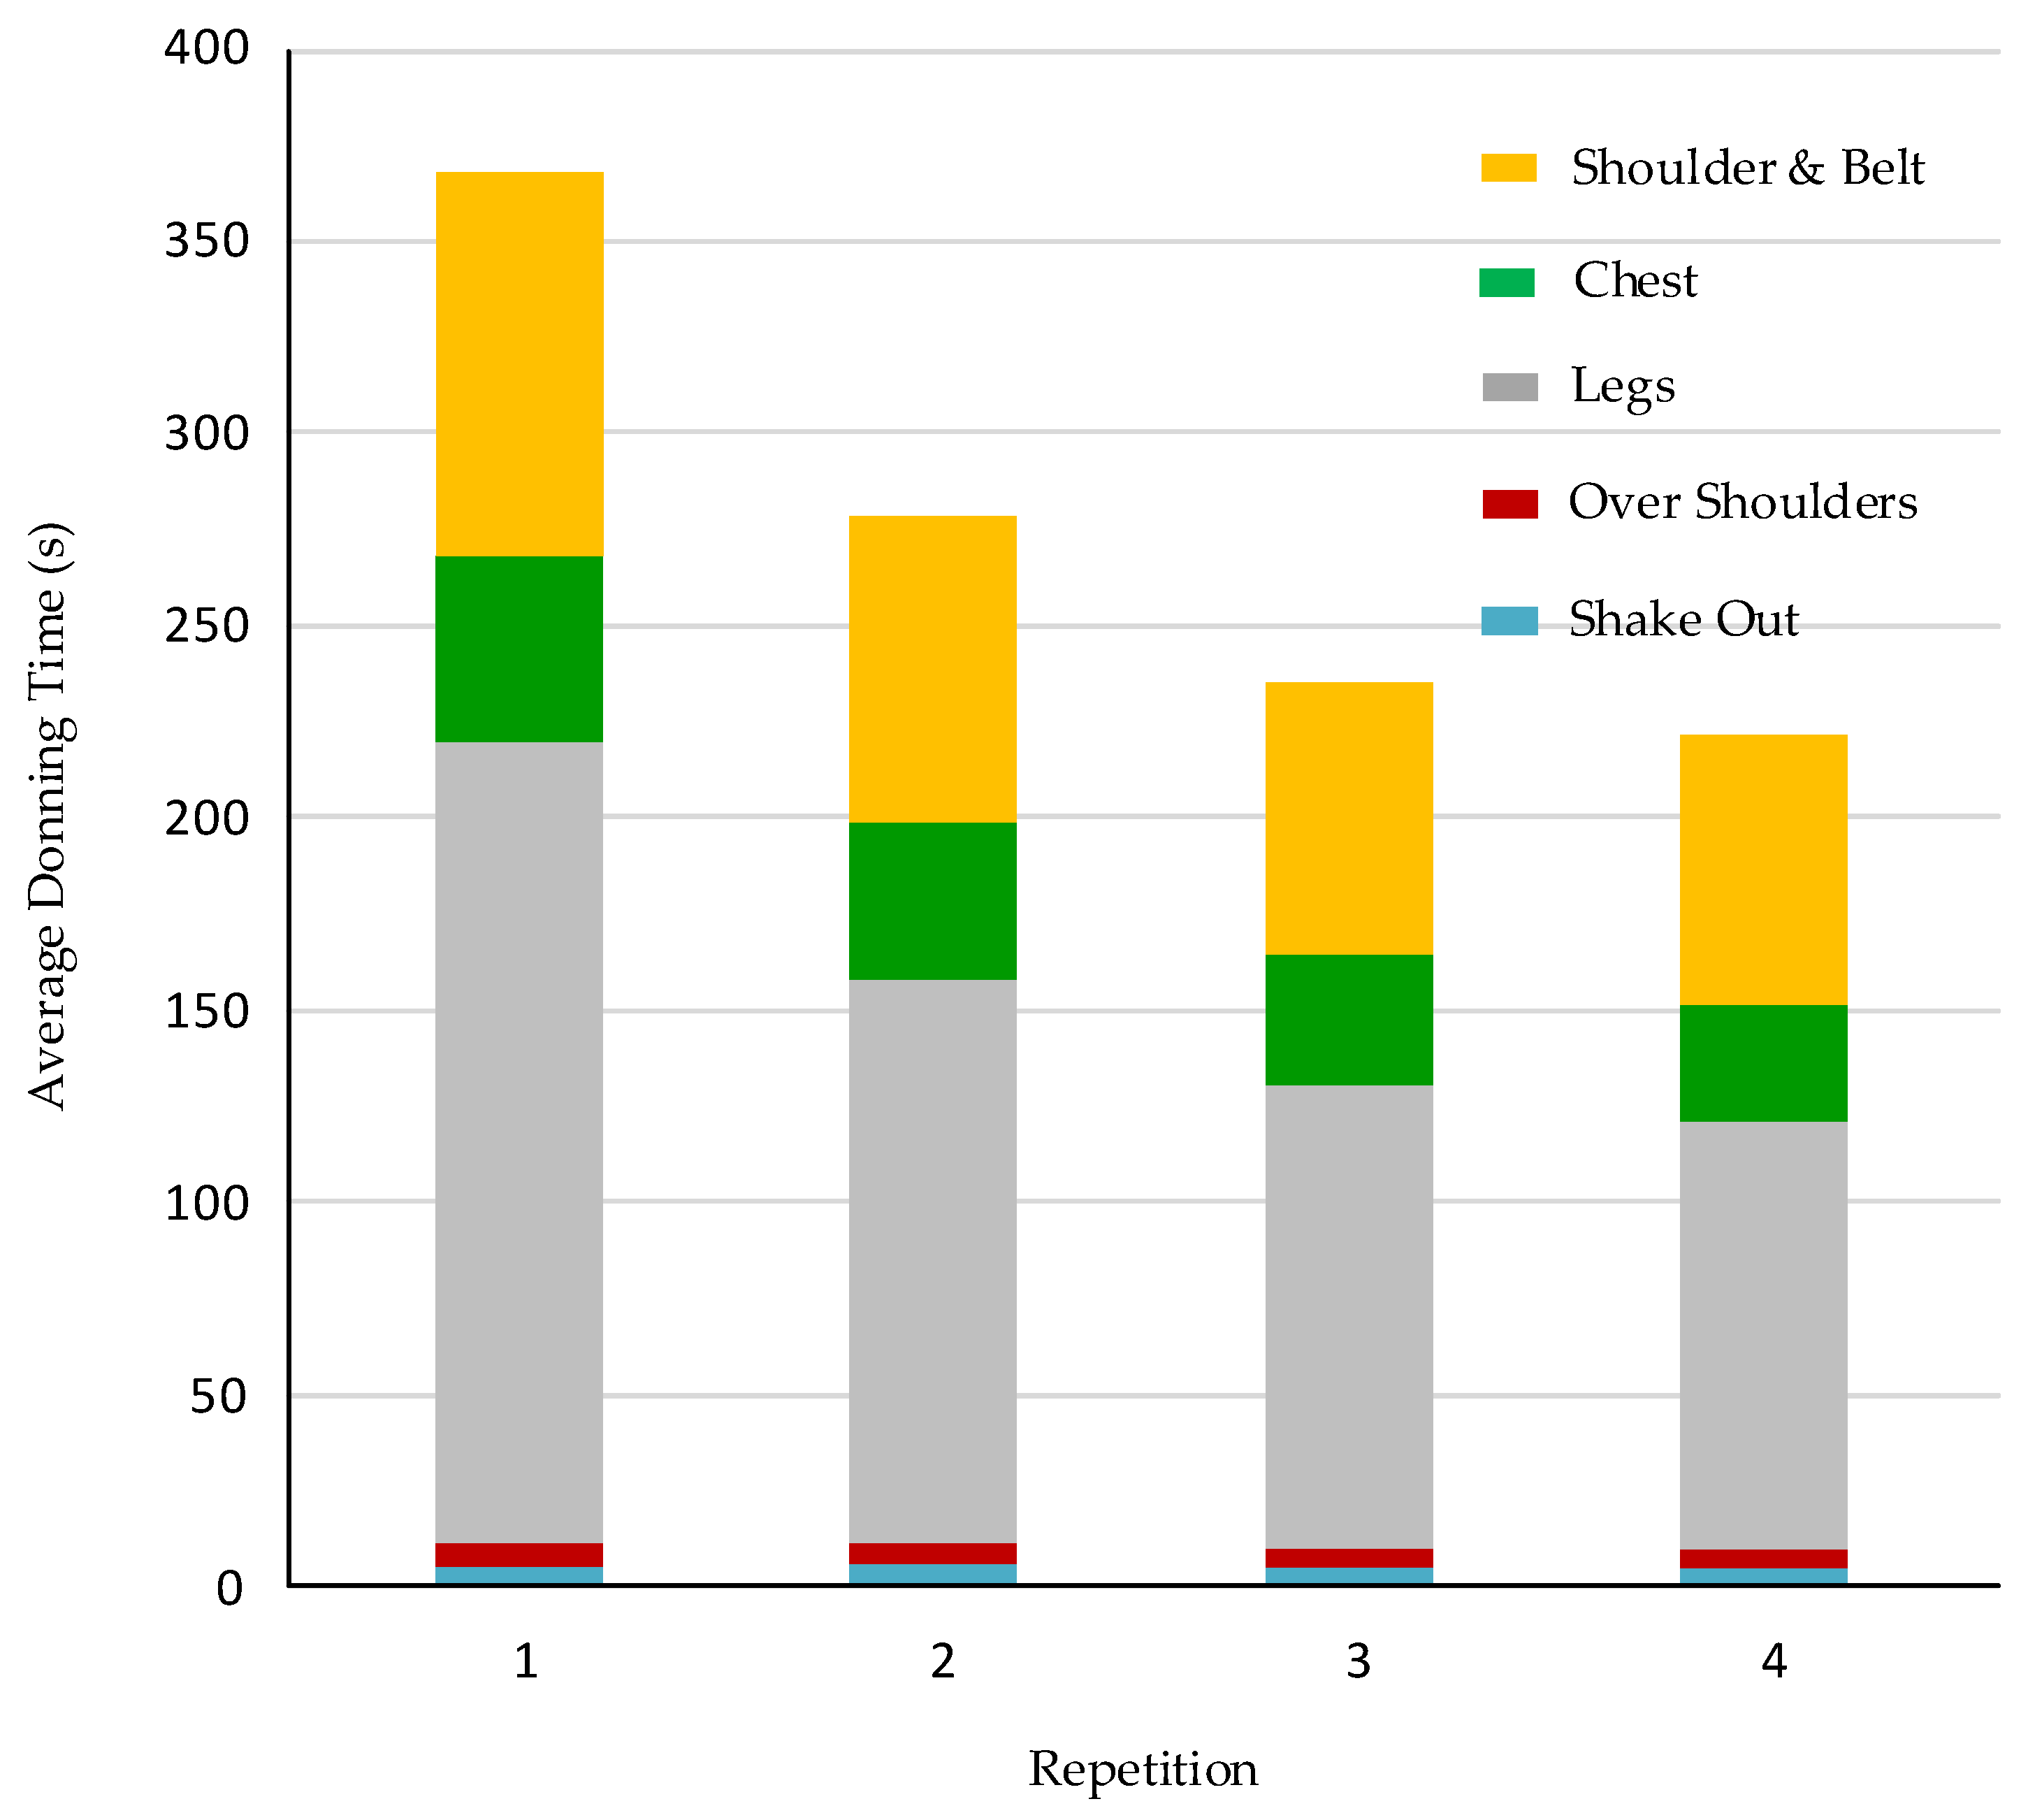
The precise mean times to complete each of the four repetitions are presented in Table 4 along with standard deviation (SD). Details are in Table S1 in the Supplementary Materials. The time to adjust the leg straps constituted the largest contribution to total time. The step taking the second most time was adjusting the shoulder straps. The graphical comparison used the stacked bar chart in Figure 4 to reflect the relative contributions of step times to the total time of each repetition. The stacked bars show a decreasing trend in total time.
The statistical approach had two parts. The first was a one-way analysis of variance to determine that the total times of each repetition are not the same [31]. That analysis also determined which repetition times differed from each other repetition (the contrasts) using the Tukey multiple comparison method [30,31]. The Tukey method uses the assumption of equal variances. According to Rossi, if the ratio of the level with the largest variance to that with the smallest variance is less than four, the assumption may be made [31]. For these data, the ratio was 2.6. Results are in Table 5.
A comparison of the data for 22 subjects in Table 5 with the same analyses of all 25 subjects revealed the following. Based on the null hypothesis that all four steps had the same mean times, the one-way ANOVA for both analyses indicated significant differences (using p < 0.05) for the leg strap time, the shoulder and belt time, and the total time. The p-values for the other steps were greater than 0.05. The significant contrasts were the same for both analyses.
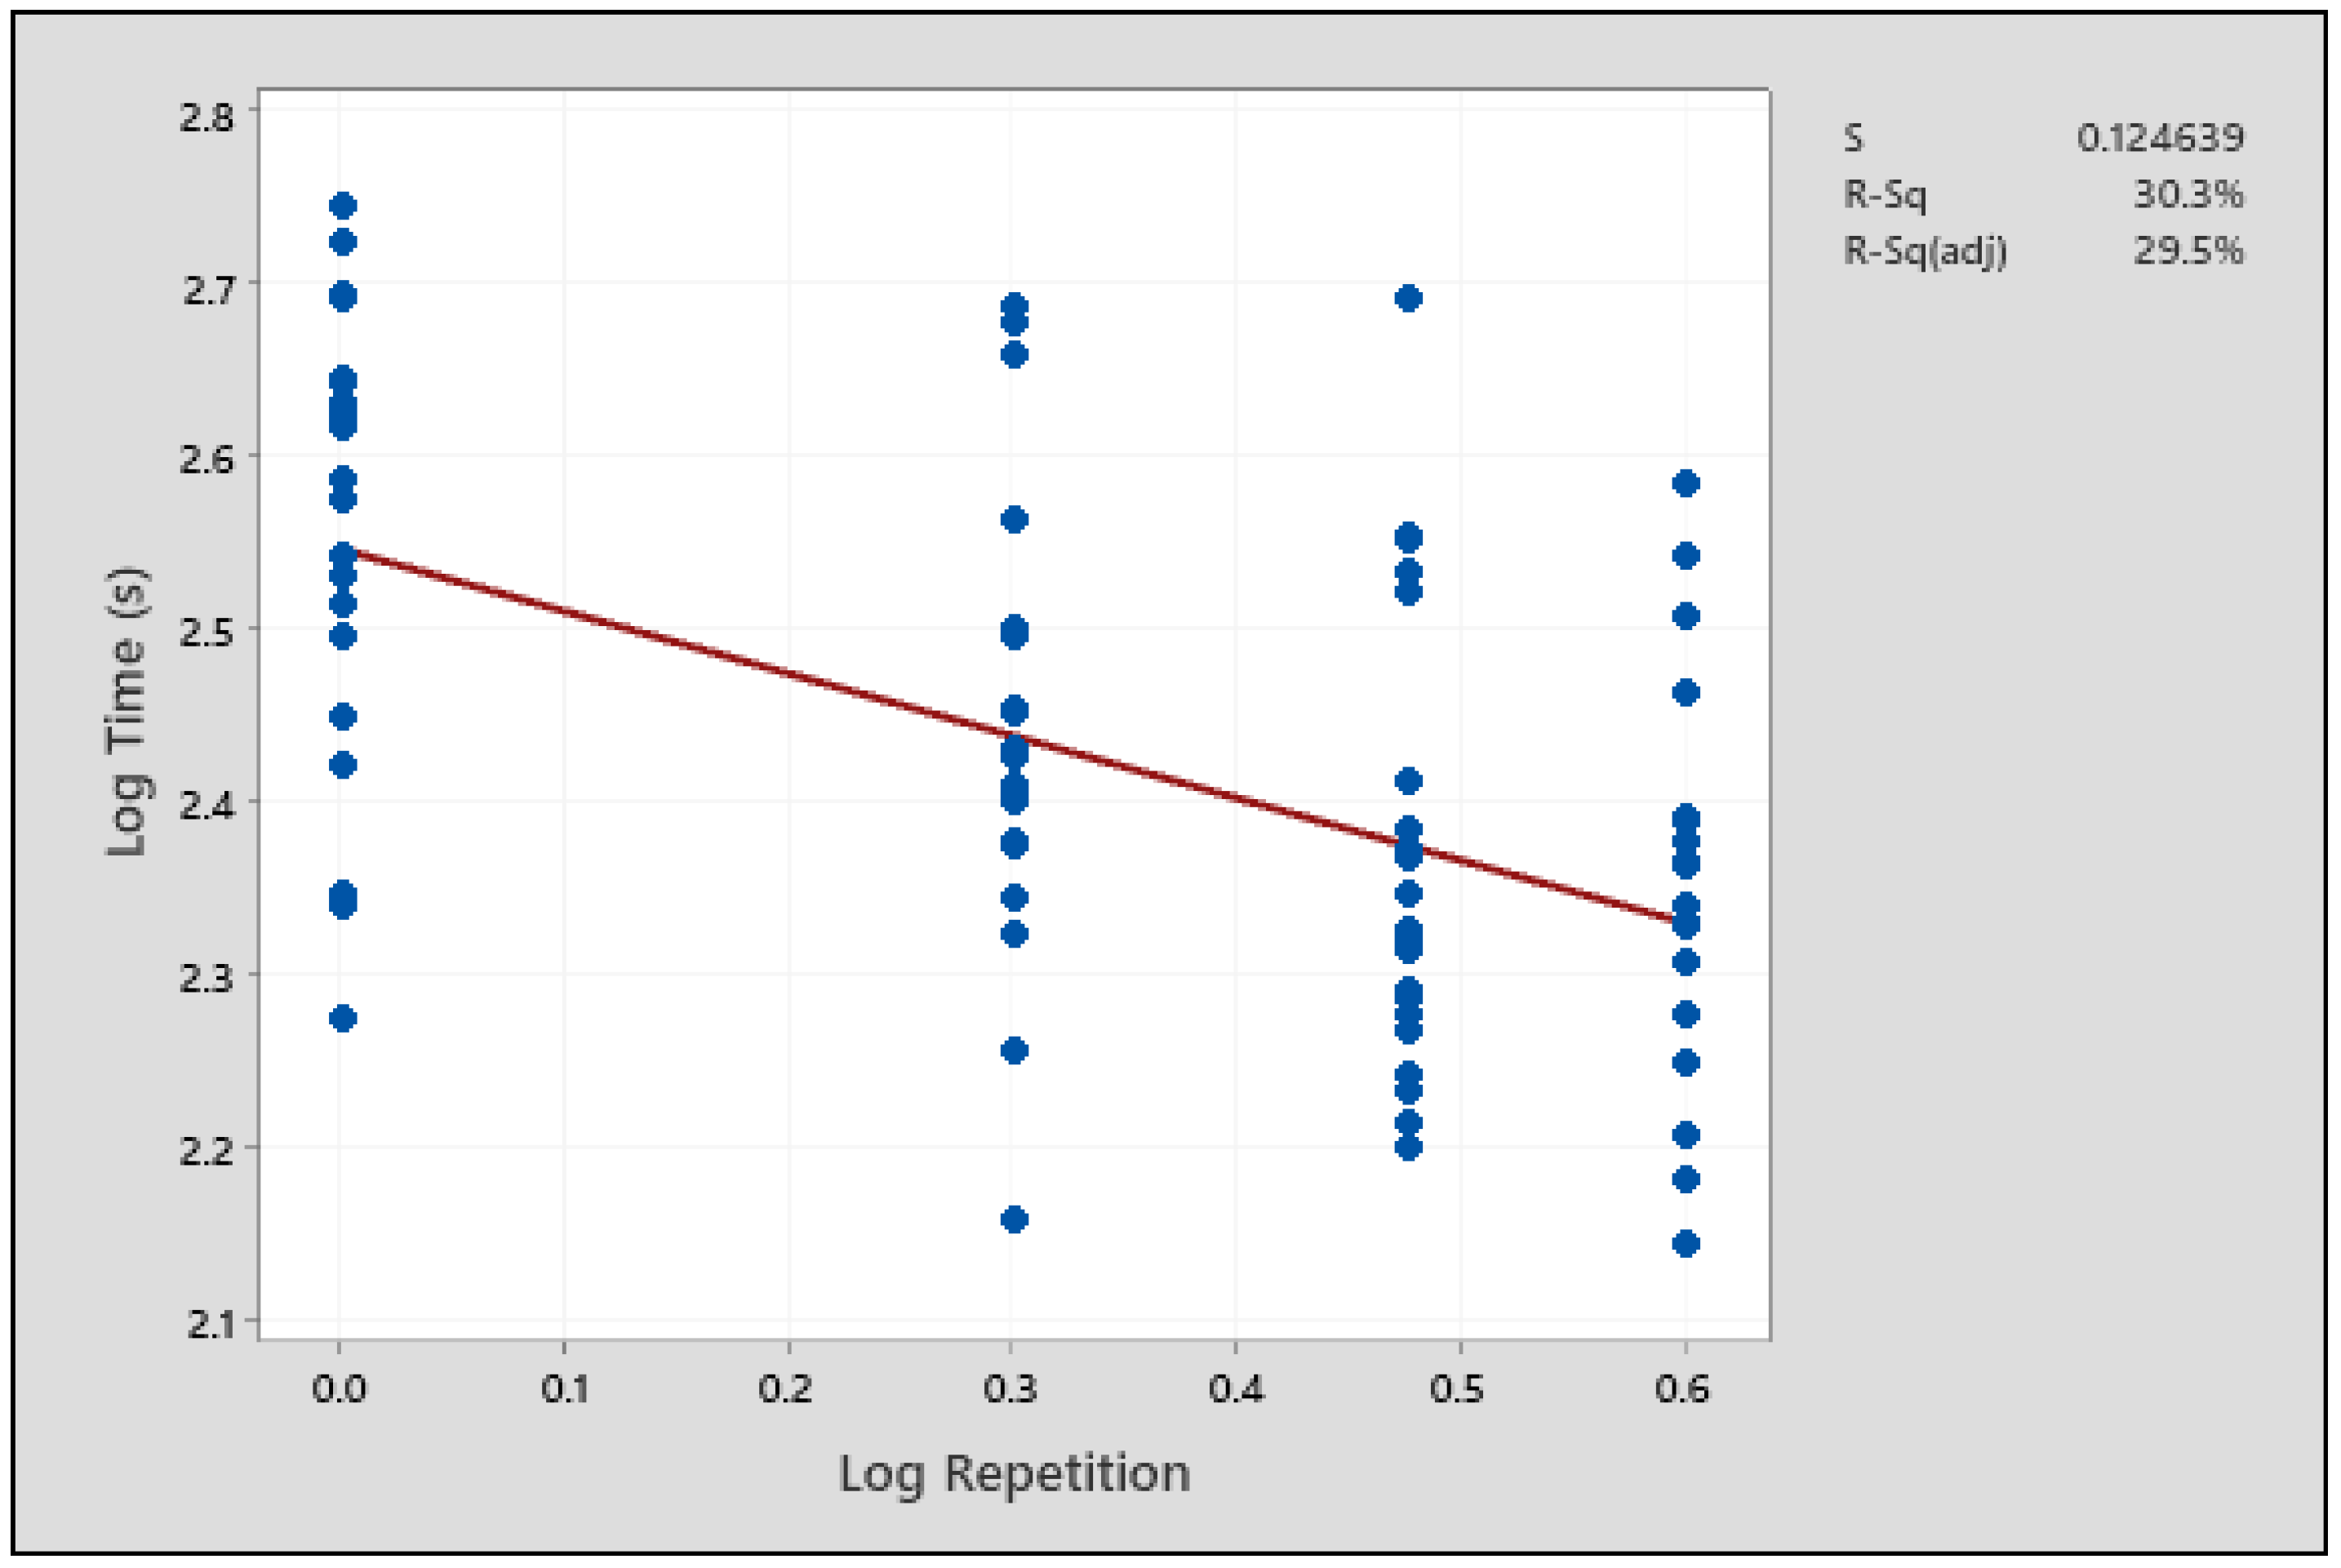
The second statistical part used regression analysis to determine the value of B in Equation (1). That involved regressing the log of T with the log of R. The scatter plot in Figure 5 showed a decreasing slope with increasing log R. It also shows a similar variance in the data of each repetition. The slope of the regression line (−0.3597) was later used as the exponent of repetition in Equation (1). The fitted line indicates a 22.1% decline with each doubling of repetitions.
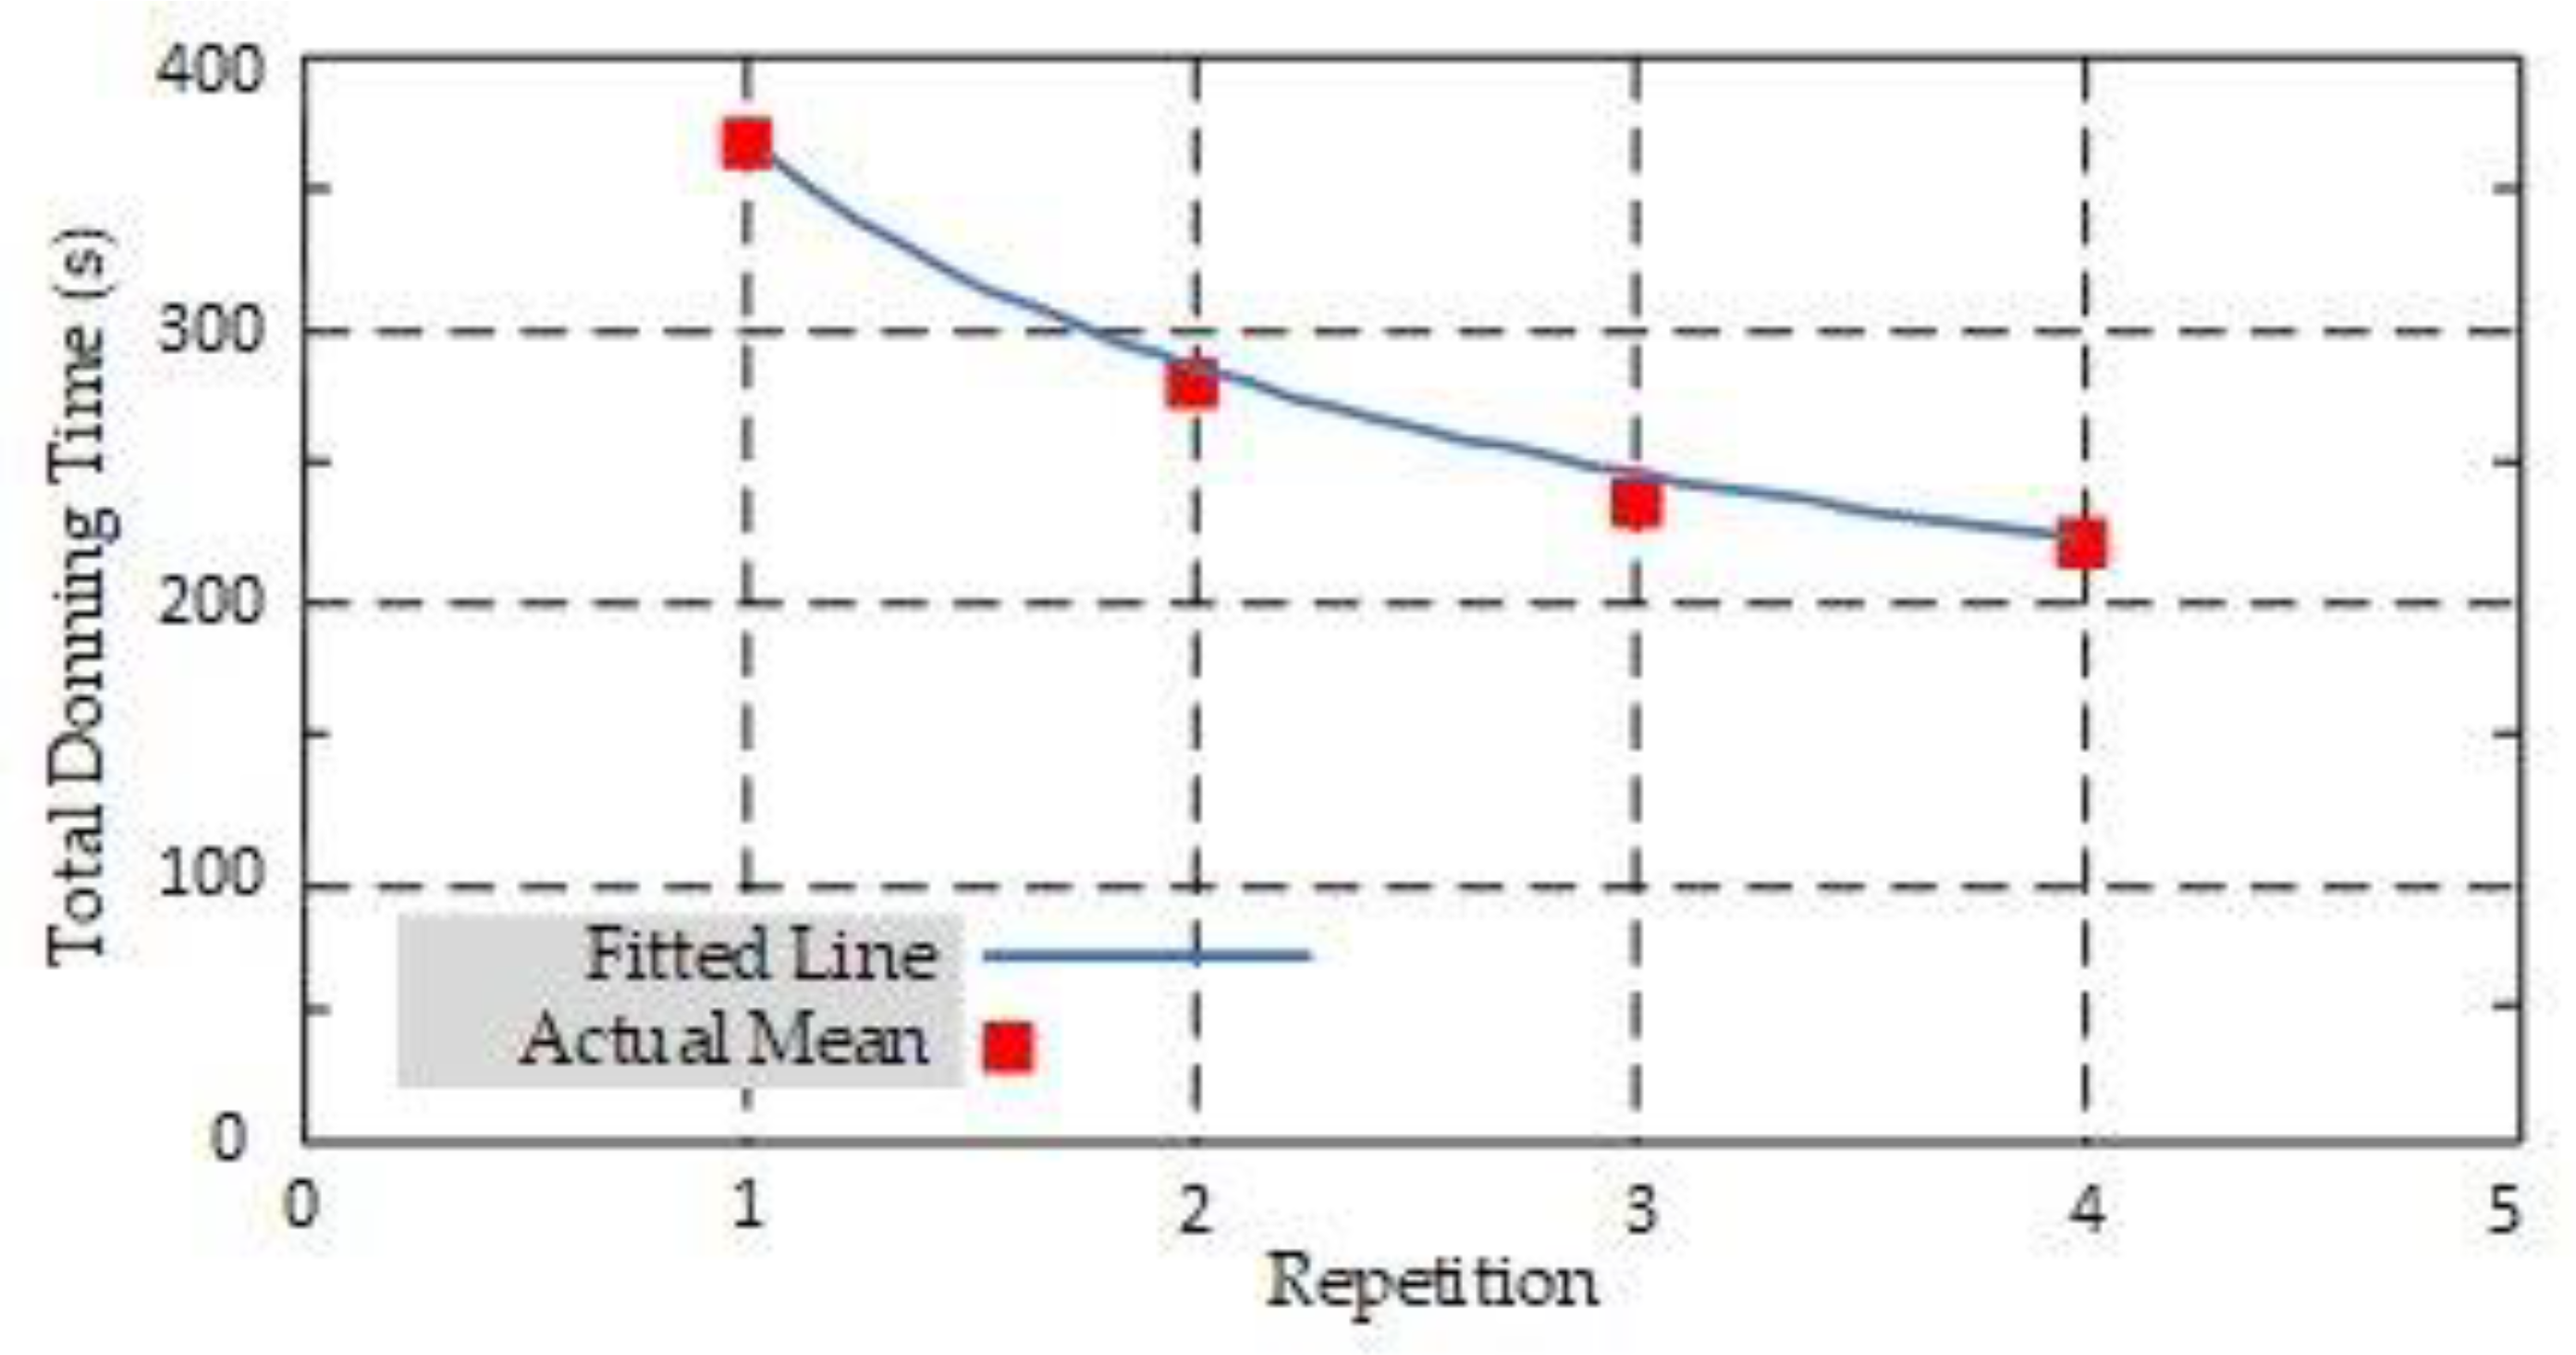
The learning curve in the form of Equation (1) was created for the total time donning the harness over four repetitions. Figure 6 shows the mean times for each repetition and the learning curve predicted line using Equation (1). The graph shows the fitted line fits the means at repetition 1, 2, and 4, but the line runs above the mean at repetition 3.
3.3. Coach’s Observations
After coaching 25 subjects through the process and reviewing the video of every repetition, the coach provided observations worth documenting. When the subjects initially encountered the harness, most had no idea how to put it on. The first repetition was primarily an experience involving both mental processing and physical skills. The two most common shortcomings were that the leg straps were too loose, and the D-ring was not between the shoulder blades. Improvement in subsequent repetitions was evident. Typical improvements included straps being tightened to the correct lengths and placed in the correct positions on the body. From watching the videos of each repetition, it became clear that the first attempt was the most frustrating for all of the participants, particularly adjusting the leg straps. For the second donning, the subjects showed substantial improvement in adjusting the leg straps―both in less time and better adjustment. The third and fourth repetitions showed small improvements in fit and completing the process in a shorter time.
4. Discussion
The specific aim of this project was to quantitatively characterize how the time to don and adjust a harness, while being coached, changes with the number of repetitions using the learning curve model in Equation (1). An experiment involving university students as subjects showed that the skill of performing the process, measured by time, changed with the number of repetitions according to a traditional learning curve. Specifically, the quantitative relationship in Equation (3) explains donning time (Ti) in repetition i to the initial time (T1) multiplied by the repetition number to the power −0.3597.
The data used to develop Equation (3) was based on the 22 subjects who had a harness with a waist belt that needed fastening. Three of the original 25 subjects were omitted from analyses because the extra small harness they wore did not have a waist belt to adjust so their total time did not include all the steps performed by the other 22 subjects. Each repetition consisted of five steps. Videos of the 88 repetitions were reviewed with the aid of Observer XT software to establish the time for each step [29].
To check whether our findings were credible, we compared our findings with the learning curve traditionally used by industrial engineers that predicts a 20% reduction in time with each doubling of repetitions. Our findings of 22.1% are very similar [21,23].
The learning curve in Equation (3) fit the mean times for repetition 1, 2, and 4, but ran above the mean for repetition 3 (see Figure 6). Because of that, the curve going from repetition 2 to 3 appears to be less steep than it ought to be, and the line going from repetition 3 to 4 appears steeper than it ought to be. This raises questions about using the computed learning curve to predict time reductions if the trainees performed more repetitions.
Previous researchers have discussed the issues of using a learning curve that predicts performance times getting shorter forever [21,23]. Some data in their papers, based on assembly line work, shows continued reductions for extensive cycles; for example, data for the cigar makers showed time reductions per cycle followed the learning curve for approximately 100 cycles, where a cycle was defined as a week of making cigars. DeJong cited data from apprentices learning to operate industrial machines through 50 repetitions [21].
Crossman’s analysis in 1959 of earlier studies offers the explanation that time reduction occurs in two parts—the motor skills for doing each step and the time between. Making cigars typifies nearly all time spent using hands to perform the task, while learning to don a harness is more like learning to operate an industrial machine in that it involves a combination of manually performing steps and the time between steps thinking about the next step. We believe our subjects reduced their total performance time by reducing both parts of the donning process; however, the way we collected data was to stop timing one task and use that moment as the start of timing the subsequent step, so we have no data on the time of pauses between the manual parts of steps. We suspect that for donning a harness, there will always be a requirement for mixing thinking with motor skills, but both times leave opportunities for reduction with more repetitions beyond the four we observed. However, we cannot say how accurately the learning curve in Figure 6 would be if more than four repetitions were performed.
Four repetitions provided a quantifiable decreasing trend in time. The contrasts in Table 5 indicate significant differences in total time occurred between T1 and all subsequent repetitions. Differences between T2, T3, and T4 were not significant, but the learning curve plot in Figure 4 and Figure 6 show a decreasing trend from R2 through R4. If more repetitions were to be included in the training, the learning curve would predict a continued reduction in time; specifically, it would take four more repetitions to achieve an additional 22.1% reduction in time. In a work setting, extending the training beyond four repetitions would involve the cost of the coach and each trainee while yielding diminishing reductions in donning time, and for that reason, we consider more than four repetitions as being impractical.
4.1. Study Limitations
A significant limitation was the use of college students. Differences between the study participants and workers in the construction and other industries include age distribution and range of body sizes. Therefore, generalizing from the study findings to employed workers should be done cautiously.
Two limitations of the study are limiting practices to four repetitions and not including effects of time between repetitions. Another is using only one style and brand of the fall-protection harness. For that reason, different times would be expected for harnesses with different types of connectors. This is particularly likely for the pair of leg-strap adjustments.
A procedural factor that could have affected the data was that between repetitions the subjects were not asked to leave the lab while the coach prepared the harness for the next repetition. The subject might have picked up some insight into how to adjust the straps by observing the preparation. Another experimental procedure factor that could have affected learning was that casual conversation took place between the coach and subjects. This might have distracted a subject while the repetition was being performed or between repetitions. Viewed from a different perspective, the casual conversation may have served to mimic the training that takes place in occupational settings.
English was the second language for several subjects, and that presented challenges during the time when the coach was providing instructions at the beginning and while providing feedback following each repetition. The coach believes this factor affected the first repetition more than the subsequent three repetitions.
Assessing the fit quality involved some subjectivity on the part of the coach. No precise and objective way could be found to judge fit in a completely objective way. Visual inspections of strap location from four angles (frontal, left, back, and right) were used to identify the fit issues used for feedback, but we had no way to turn the visual observations into some sort of numerical score for quality of fit. The only standard was the manufacturer’s recommendations that mirrored those of NIOSH [17]. Therefore, a limitation of the experiment is we had no objective measure of fit quality to use for comparing improvements in fit from repetition to repetition.
The manufacturer’s sizing chart was used for initially selecting a harness size for each subject [27]. It accounts for body height and weight, but not for body type/build. For two male subjects, even the extra small harness had leg straps that could not be tightly adjusted to snugly fit their thighs. These subjects learned to tighten the leg straps to the minimum and use that setting for each repetition. Time data from these subjects were omitted from statistical analyses because their harness did not include a waist belt.
4.2. Possible Future Work
We suggest conducting studies like ours to compare different leg-strap mechanisms in order to learn about what may be characterized as a trade-off between the time of adjusting and getting a perfect fit.
A challenge for research dealing with harness fitting is finding objective methods to assess fit. The guidelines from the NIOSH study of harness fitting provides practical instructions for getting a good fit, but for research purposes, it would be useful to have methods that could be replicated by research teams at different institutions. The NIOSH study used the subjects’ body angle when suspended as an indicator of good leg-strap and chest-strap fit. This approach might be a suitable starting point for developing an objective measure of leg-strap and chest-strap adjustment for use in research facilities but may not be practical for worksites where such training typically takes place.
It would be useful to have an objective method to assess the fit of individual trainees without suspending them. For example, can the tightness of leg straps by objectively assessed by the location of the dorsal D-ring when the trainer/coach grabs the D-ring and raises until it is tight. Research exploring this D-ring height as an indicator of leg-strap fit would need to start with an objective method to measure D-ring height relative to the subject’s ear canal, acromion, or other anatomical landmarks. Such a method would need validity testing, perhaps by comparing to the same subject’s body angle when suspended in the same way NIOSH did it. These are mentioned as possibilities for further research into harness fitting.
5. Conclusions
If used correctly and consistently, the use of fall-protection equipment has the potential to prevent many injuries and fatalities resulting from falling from elevations. For the type of fall protection involving a personal fall-protection harness, first-time users, like those in this study, can benefit from having a trainer help them develop the skill to position the harness on their body and adjust the various straps to achieve the fit described by the harness manufacturer. Results of this study showed that performing up to four repetitions while being coached led to reductions in donning time consistent with the learning curve in Equations (1) and (3).
Supplementary Materials
The following are available online at https://0-www-mdpi-com.brum.beds.ac.uk/2313-576X/7/1/16/s1, Table S1: Data Used for Table 4—Mean Harness Donning Times and Standard Deviations for 22 Participants in Seconds.
Author Contributions
Conceptualization, R.C.J.; methodology, Z.B. and R.C.J.; software, Z.B.; validation, R.C.J.; formal analysis, Z.B., D.A., and R.C.J.; investigation, Z.B.; resources, R.C.J.; data curation, Z.B., and R.C.J.; writing—original draft preparation, Z.B. and R.C.J.; writing—review and editing, R.C.J., Z.B., and D.A.; visualization, Z.B. and R.C.J.; supervision, R.C.J.; project administration, R.C.J.; funding acquisition, R.C.J. All authors have read and agreed to the published version of the manuscript.
Funding
This research was partially funded by Training Project Grant (T03 OH008630) from the US National Institute for Occupational Safety and Health. The contents of this publication are solely the responsibility of the authors and do not represent the official views of the Centers for Disease Control and Prevention, the National Institute for Occupational Safety and Health, or the Department of Health and Human Services.
Institutional Review Board Statement
The study was conducted in accordance to the guidelines of the Declaration of Helsinki, and approved by the Institutional Review Board of the University of Montana prior to recruiting subjects (IRB protocol 108-18. 9 May 2018).
Informed Consent Statement
All subjects gave their informed consent for inclusion before they participated in the study.
Data Availability Statement
The data presented in this study are contained within the article and Supplementary Materials.
Acknowledgments
The authors acknowledge contributions of three members of Bunney’s thesis committee: Lorri Birkenbuel, Theresa Stack, and Liping Jiang. We appreciate the work of Julie Hart serving as Principal Investigator for the NIOSH Training Project Grant that substantially contributed to Bunney’s educational funding during his studies at Montana Technological University.
Conflicts of Interest
The authors declare no conflict of interest. The funders had no role in the design of the study; in the collection, analyses, or interpretation of data; in the writing of the manuscript, or in the decision to publish the results.
References
- Ellis, J.N. Introduction to Fall Protection, 4th ed.; American Society of Safety Engineers: Des Plaines, IL, USA, 2011. [Google Scholar]
- Bureau of Labor Statistics, U.S. Department of Labor. 2018 Census of Fatal Occupational Injuries (Final Data). Table A-3, Industry by Private Sector, Government Workers, and Self-Employed Workers. 2018. Available online: https://www.bls.gov/iif/oshwc/cfoi/cftb0324.htm (accessed on 26 April 2019).
- Bureau of Labor Statistics, U.S. Department of Labor. Census of Fatal Occupational Injuries 2018 (Final Data). Rate of Fatal Work Injuries Per 100,000 Full-Time Equivalent Workers by Employee Status. 2018. Available online: https://www.bls.gov/charts/census-of-fatal-occupational-injuries/number-and-rate-of-fatal-work-injuries-by-industry.htm (accessed on 18 June 2020).
- U. S. Department of Commerce, North American Industrial Classification System. Available online: https://www.bls.gov/bls/naics.htm (accessed on 24 October 2020).
- Bureau of Labor Statistics, U.S. Department of Labor. Census of Fatal Occupational Injuries 2018 (Final Data). Fatal Occupational Injuries by Occupation and Event or Exposure, all United States. 2018. Available online: https://www.bls.gov/charts/census-of-fatal-occupational-injuries/fatal-occupational-injuries-by-event-drilldown.htm (accessed on 18 June 2020).
- ANSI/ASSE Z 359—2016. Minimum Requirements for a Comprehensive Managed Fall Protection Program; American Society of Safety Professionals: Des Plaines, IL, USA, 2016.
- Jensen, R.C. Risk-Reduction Methods for Occupational Safety and Health, 2nd ed.; Wiley: Hoboken, NJ, USA, 2020; pp. 65–73. ISBN 978-111-949-399-0. [Google Scholar]
- United States, 29 Code of Federal Regulations, Subpart M—Fall Protection, 1926.501 and 1926.503. Available online: https://www.law.cornell.edu/cfr/text/29/part-1926/subpart-M (accessed on 7 January 2021).
- United States, 29 Code of Federal Regulations, Subpart R—Steel Erection, 1926.761. Available online: https://www.law.cornell.edu/cfr/text/29/part-1926/subpart-R (accessed on 7 January 2021).
- United States, 29 Code of Federal Regulations, Subpart D—Walking-Working Surfaces. 1910.30. Available online: https://www.law.cornell.edu/cfr/text/29/part-1910/subpart-D (accessed on 7 January 2021).
- United States Department of Labor—Occupational Safety and Health Administration Fall Protection. Commonly Used OSHA Data & Statistics. Available online: https://www.osha.gov/oshstats/commonstats.html (accessed on 1 July 2020).
- Dong, X.S.; Largay, J.A.; Choi, S.D.; Wang, X. Fatal falls and PFAS use in the construction industry: Findings from the NIOSH FACE reports. Accid. Anal. Prev. 2017, 102, 136–143. [Google Scholar] [CrossRef] [PubMed] [Green Version]
- Adams, S.J. Improving safety instruction & results: Five principles. Prof. Saf. 2000, 45, 40–41. [Google Scholar]
- Galbraith, D.D.; Fouch, S.E. Principles of adult learning: Application to safety training. Prof. Saf. 2007, 52, 35–49. [Google Scholar]
- Burke, M.J.; Sarpy, S.A.; Smith-Crowe, K.; Chan-Serafin, S.; Salvador, R.O.; Islam, G. Relative effectiveness of worker safety and health training methods. Am. J. Public Health 2006, 96, 315–324. [Google Scholar] [CrossRef] [PubMed]
- McCurley, L. Fall rescue: Training and practice. In Fall Prevention and Protection: Principles, Guidelines, and Practices; Hsiao, H., Ed.; CRC: Boca Raton, FL, USA, 2017; p. 318. [Google Scholar]
- Hsiao, H.; Bradtmiller, B.; Whitestone, J. Sizing and fit of fall-protection harnesses. Ergonomics 2003, 46, 1233–1258. [Google Scholar] [CrossRef] [PubMed]
- Hsiao, H. Suspension trauma and fall-arrest harness design. In Fall Prevention and Protection: Principles, Guidelines, and Practices; Hsiao, H., Ed.; CRC: Boca Raton, FL, USA, 2017; pp. 109–114. [Google Scholar]
- Hsiao, H.; Turner, N.; Whisler, R.; Zwiener, J. Impact of harness fit on suspension tolerance. Hum. Factors 2012, 54, 346–357. [Google Scholar] [CrossRef] [PubMed] [Green Version]
- Welford, A.T. Fundamentals of Skill; Methuen: London, UK, 1960; pp. 316–321. [Google Scholar]
- De Jong, J.R. The effects of increasing skill on cycle time and its consequences for time standards. Ergonomics 1957, 1, 51–60. [Google Scholar] [CrossRef]
- Nanda, R. Learning curves: An overview. In Learning Curves, Theory and Application; Nanda, R., Alder, G.L., Eds.; Industrial Engineering and Management Press: Norcross, GA, USA, 1982; pp. 1–5. [Google Scholar]
- Hancock, W.M.; Bayha, F.H. The learning curve. In Handbook of Industrial Engineering; Salvandy, G., Ed.; John Wiley: New York, NY, USA, 1982; pp. 4.3.1–4.3.10. [Google Scholar]
- Crossman, E.R.F.W. A theory of the acquisition of speed-skill. Ergonomics 1959, 2, 153–166. [Google Scholar] [CrossRef]
- Yeolekar, A.; Qadri, H. The learning curve in surgical practice and its applicability to rhinoplasty. Indian J. Otolaryngol. Head Neck Surg. 2018, 70, 38–42. [Google Scholar] [CrossRef] [PubMed]
- 3M Fall Protection. DBI Sala ExoFitTM Construction Style Harness, Back D-Ring, Belt with Pad and Side D-Rings. Part Numbers DBI-1108500-1108502 and 1108507. Available online: https://www.3m.com/3M/en_US/company-us/all-3m-products/~/3M-DBI-SALA-ExoFit-Construction-Style-Positioning-Harness-1108507-X-Large-1-EA/?N=5002385+3291832291&rt=rud (accessed on 7 January 2021).
- DBI Sala Full Body Harness Sizing Chart. Available online: https://www.barry-usa.com/pages/full-body-harness-sizing-chart (accessed on 30 October 2020).
- Bunney, Z. Effects of Repetition on Time to Don and Adjust a Fall Protection Harness. Master’s Thesis, Montana Technological University, Butte, MO, USA, 2019. [Google Scholar]
- Noldus Information Technology, Inc. Observer XT (Version 11); Noldus Information Technology, Inc.: Leesburg, VA, USA, 2020. [Google Scholar]
- Minitab. Minitab Statistical Software®, Release 2019; Minitab: State College, PA, USA, 2019. [Google Scholar]
- Rossi, R.J. Applied Biostatistics for the Health Sciences; Wiley: Hoboken, NJ, USA, 2010; pp. 521–533. [Google Scholar]
Figure 1.
The leg-strap connection: (a) adjustable insertion end and (b) hook end. Photo by Roger Jensen.
Figure 1.
The leg-strap connection: (a) adjustable insertion end and (b) hook end. Photo by Roger Jensen.
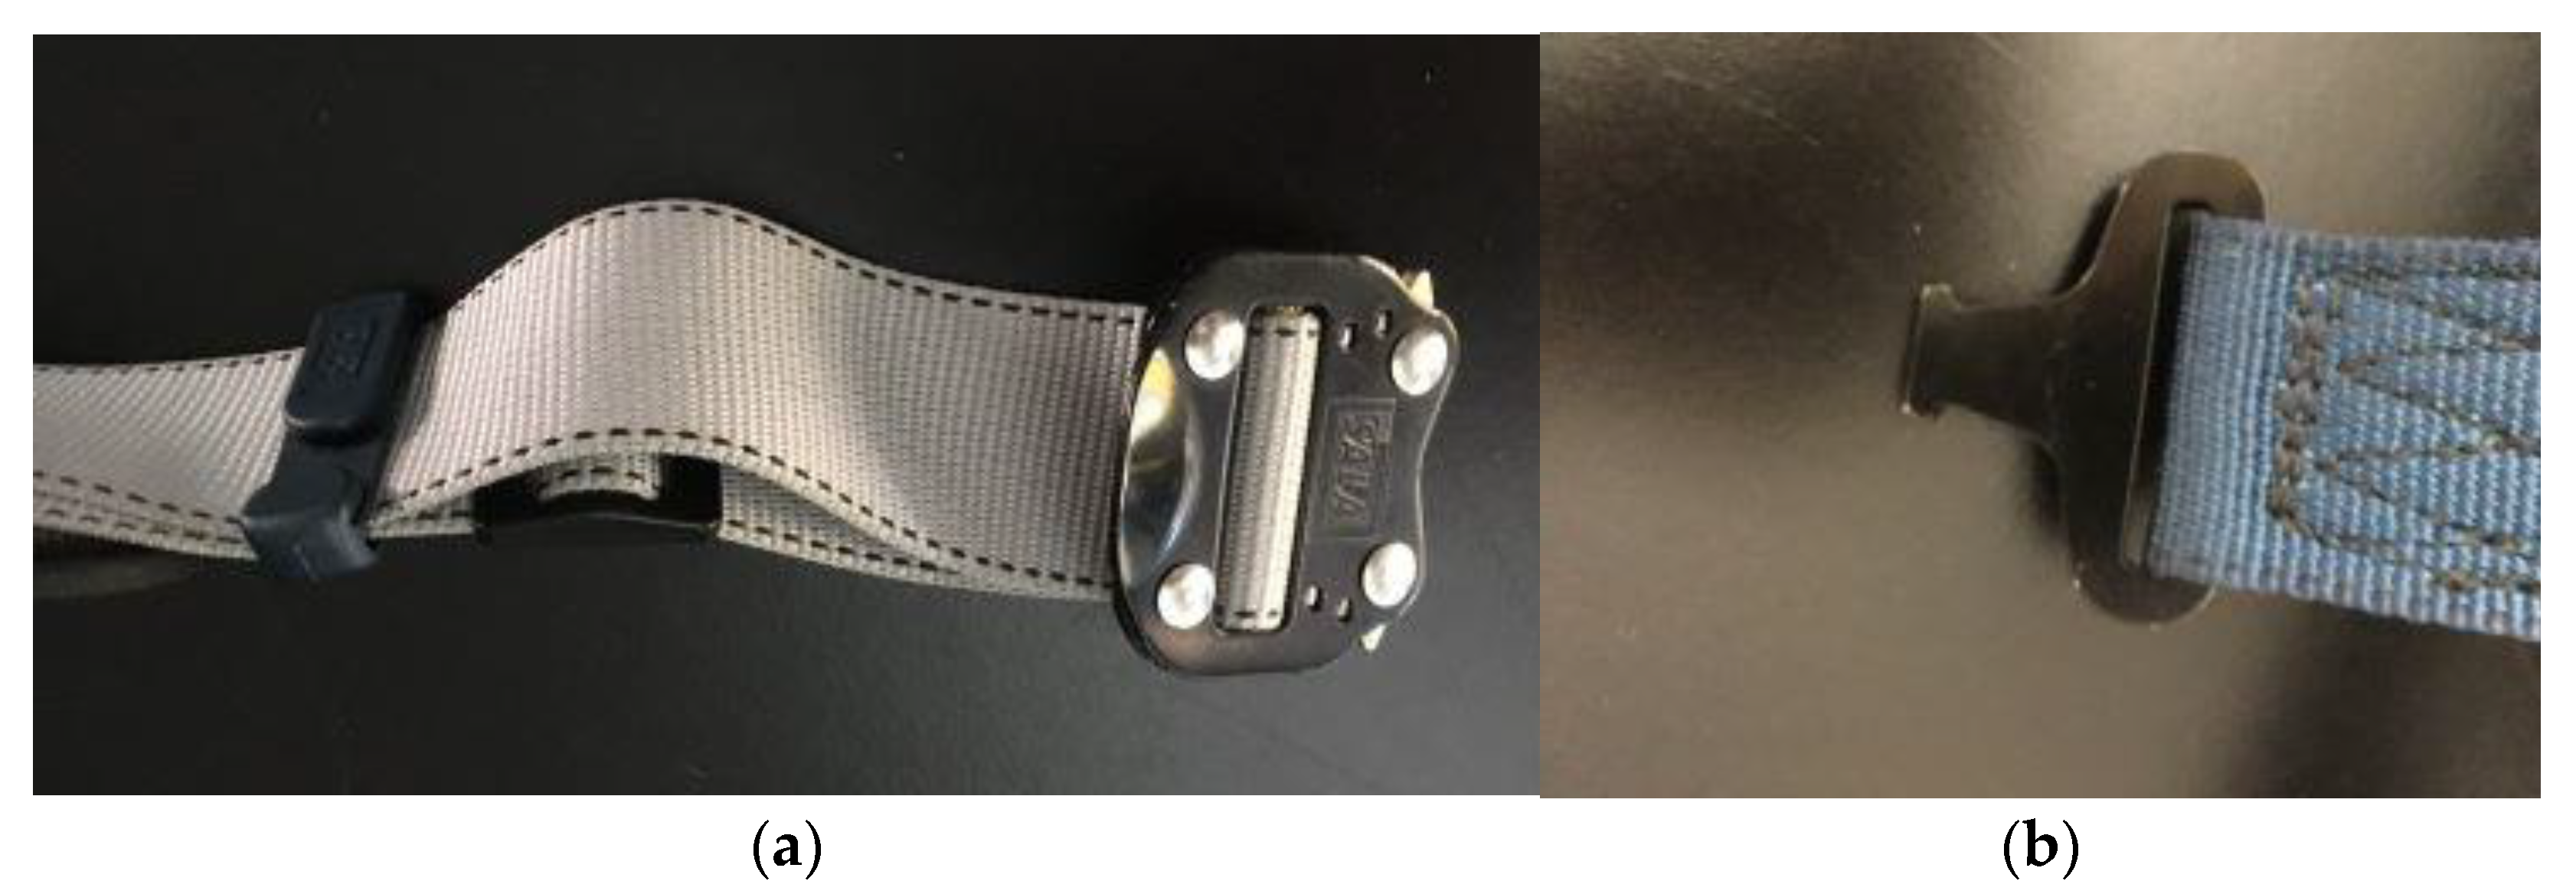
Figure 2.
A harness placed on a table before the subject begins a donning process. Photo by Zachary Bunney [28].
Figure 2.
A harness placed on a table before the subject begins a donning process. Photo by Zachary Bunney [28].
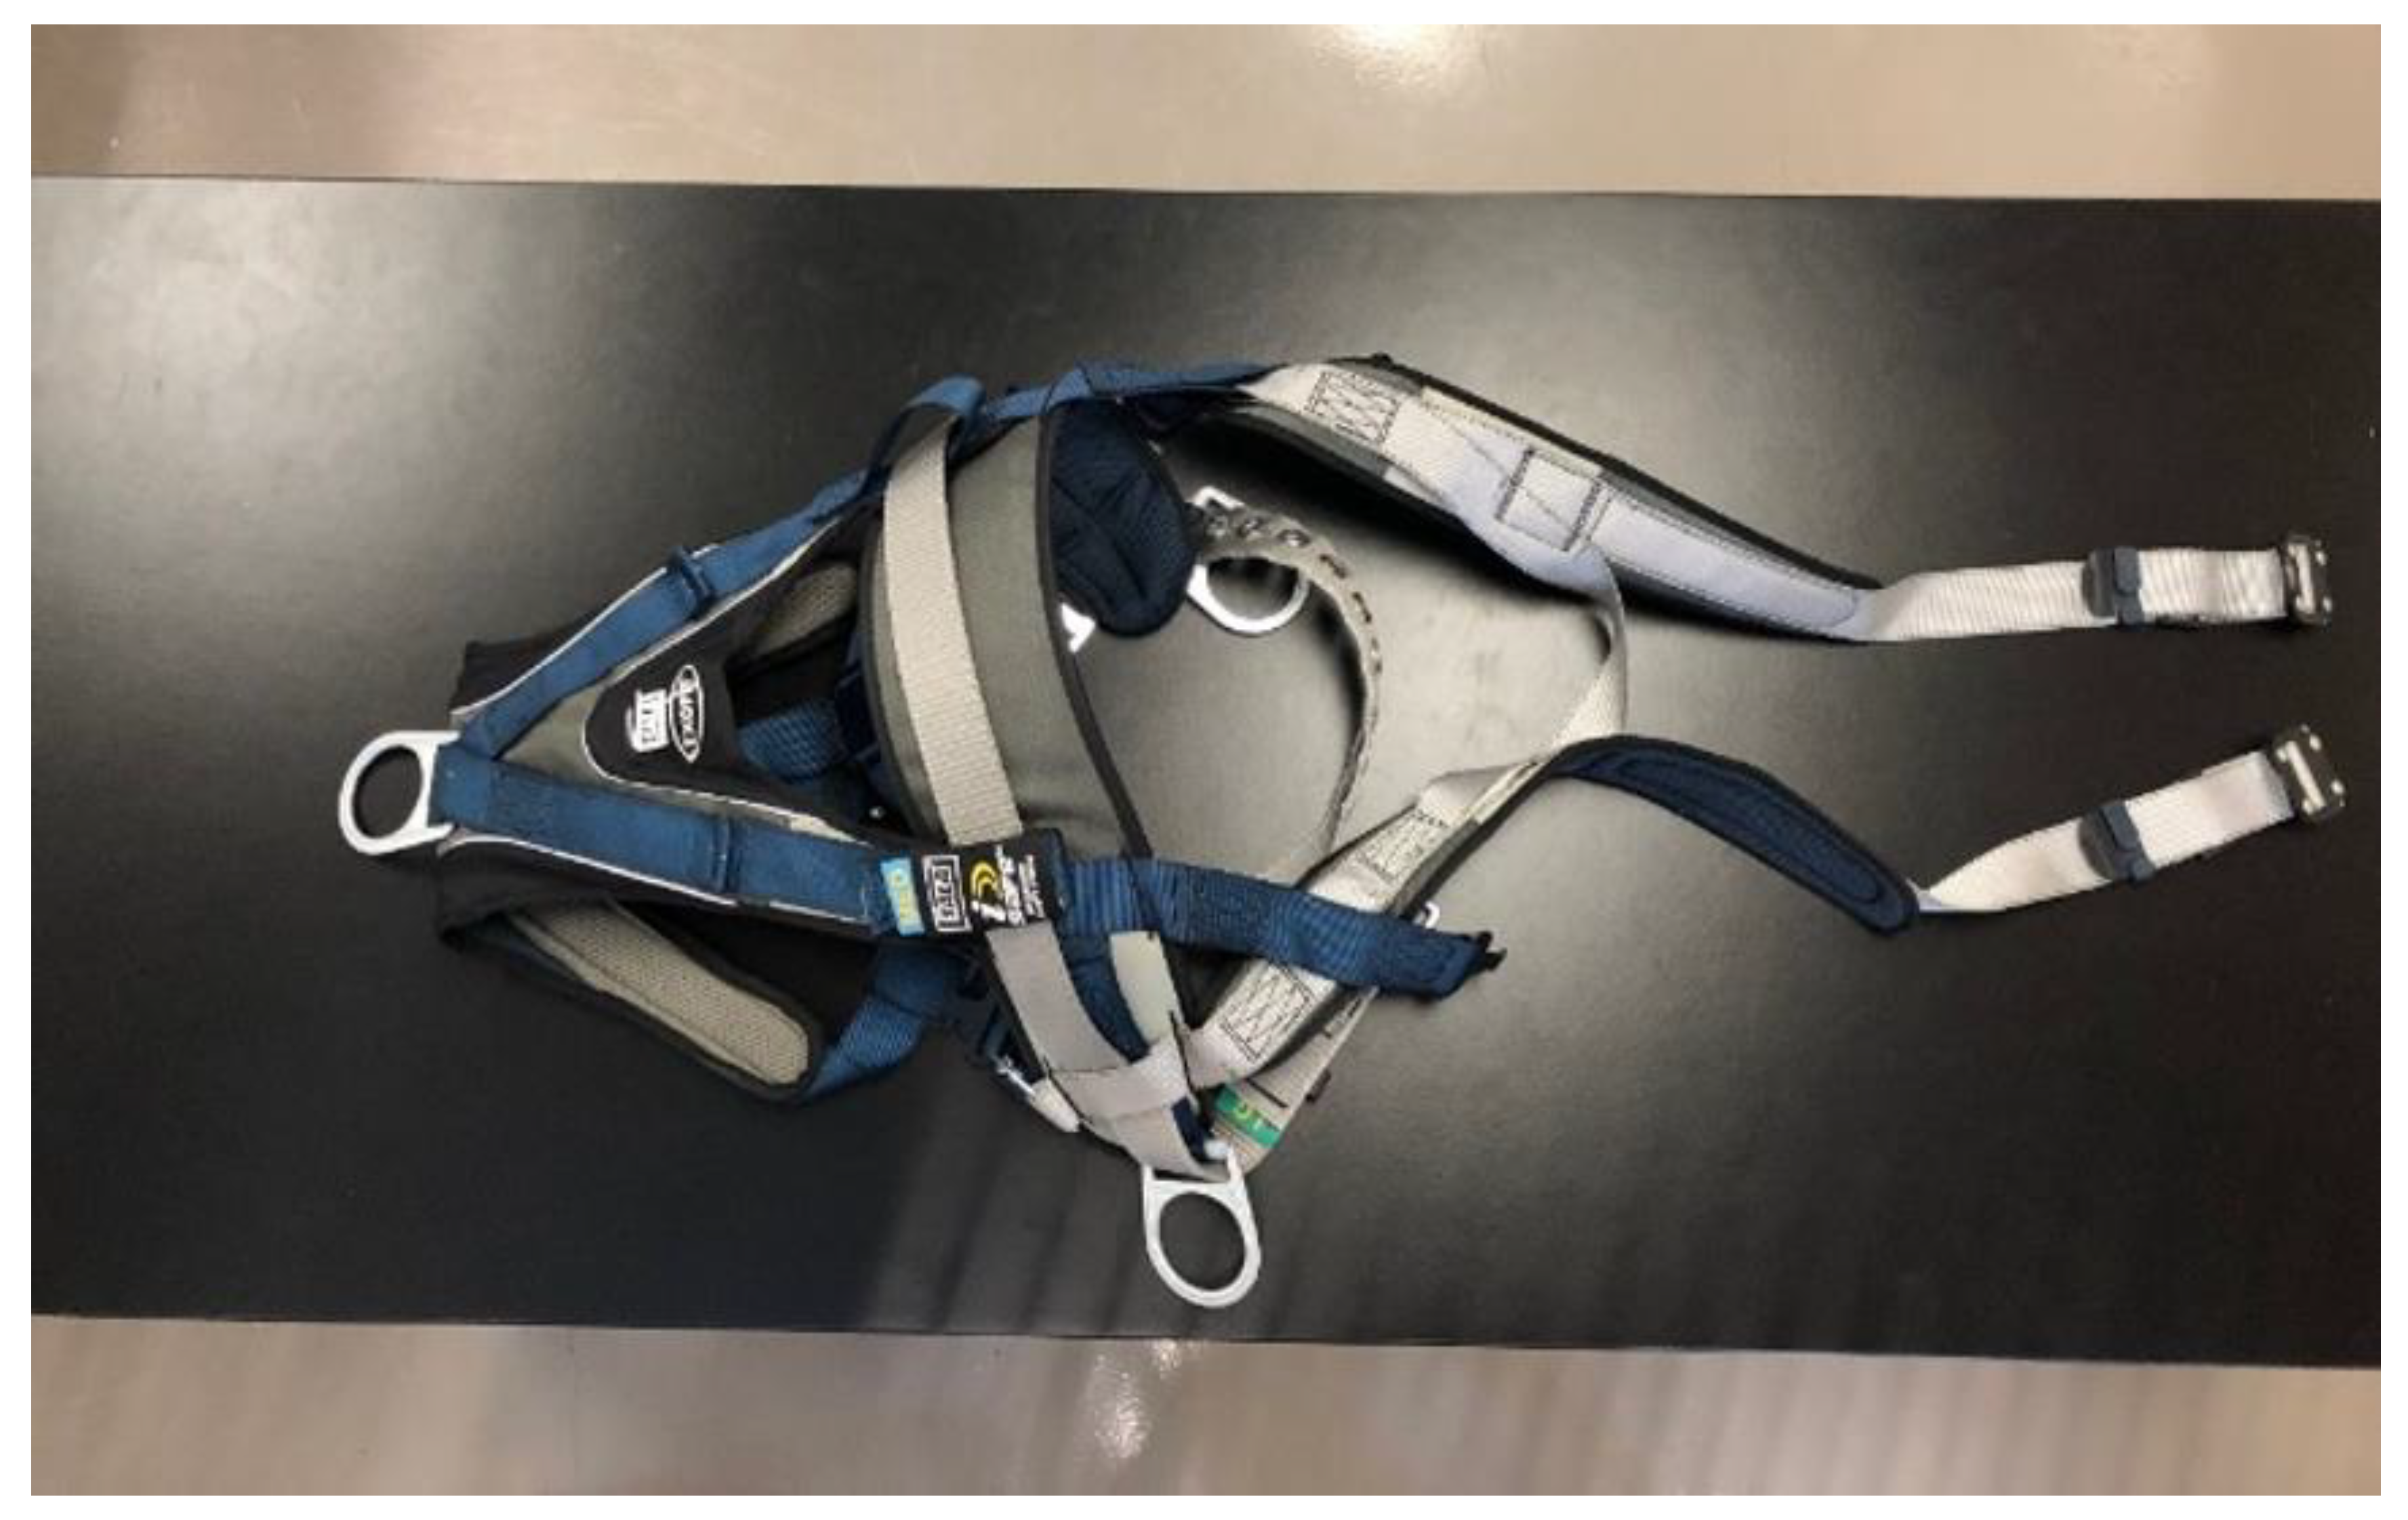
Figure 3.
Examples of subjects performing steps during the study. Photos from Zachery Bunney’s thesis [28].
Figure 3.
Examples of subjects performing steps during the study. Photos from Zachery Bunney’s thesis [28].

Figure 4.
Mean harness donning times with step-specific contributions.

Figure 5.
Linear regression fit with equation log T = 2.547 − 0.3597 log R.

Figure 6.
The learning curve for total time to don and adjust a harness based on 22 subjects.


Table 1.
US occupational fatalities and fatality rates in four major industries for the year 2018 [2,3].
| Industry Group per NAICS | Number of Fatalities a | Number Fatalities from Falls | Prct. from Falls | Occupational Fatality Rate b |
|---|---|---|---|---|
| Construction | 1038 | 338 | 33.5 | 9.5 |
| Agriculture, Forestry, Fishing, Hunting | 574 | 35 | 6.1 | 23.4 |
| Manufacturing | 343 | 46 | 13.4 | 2.0 |
| Mining, Quarrying, and Oil Extraction | 130 | 7 | 2.1 | 14.1 |
Table 2.
US occupational fatalities by event preceding fatal falls in 2018 [5].
Table 2.
US occupational fatalities by event preceding fatal falls in 2018 [5].
| Event Preceding Fatal Fall | Number | Percentage |
|---|---|---|
| Fall to a lower level | 615 | 79.25 |
| Fall on the same level | 154 | 19.84 |
| Slip or trip without fall | 4 | 0.52 |
| Jumps to a lower level | 3 | 0.39 |
| Sum | 776 | 100 |
Table 3.
Gender-specific mean, standard deviation (SD), and range of height and weight.
| Gender | Number | Height (mm) | SD | Height Range | Weight (Kg) | SD | Weight Range |
|---|---|---|---|---|---|---|---|
| Male | 15 | 1796 | 69 | 1676–1880 | 75.4 | 14.7 | 47.6–92.0 |
| Female | 10 | 1720 | 89 | 1574–1880 | 69.2 | 6.9 | 56.7–82.1 |
Table 4.
Mean harness donning times and standard deviations for 22 participants in seconds.
| Steps | Repetition 1 Mean (SD) | Repetition 2 Mean (SD) | Repetition 3 Mean (SD) | Repetition 4 Mean (SD) |
|---|---|---|---|---|
| Shake Out | 3.7 (0.9) | 3.9 (1.1) | 3.5 (0.7) | 3.4 (0.3) |
| Over the Shoulders | 6.9 (3.5) | 7.2 (3.2) | 6.0 (0.4) | 5.4 (1.3) |
| Legs | 211.4 (83.0) | 147.0 (38.0) | 121.6 (65.8) | 112.5 (8.4) |
| Chest | 47.0 (31.5) | 39.0 (6.9) | 33.8 (0.2) | 30.0 (0.3) |
| Shoulder/Belt Adjust | 100.8 (42.8) | 81.9 (7.2) | 71.3 (14.2) | 71.0 (24.3) |
| Total | 367.9 (102.5) | 287.1 (47.1) | 242.9 (33.0) | 225.3 (17.6) |
Table 5.
Step-specific one-way ANOVA results for the time affected by repetition.
| Step | Term | Adj. MS | F-Value | p-Value | Significant Differences in R |
|---|---|---|---|---|---|
| Shake Out | Trial | 1.06 | 1.08 | 0.363 | None |
| Error | 0.98 | ||||
| Over the Shoulder | Trial | 13.94 | 2.03 | 0.115 | None |
| Error | 6.86 | ||||
| Legs | Trial | 43,760.0 | 10.71 | 0.000 | 2 − 1, 3 − 1, 4 − 1 |
| Error | 4084.0 | ||||
| Chest | Trial | 1193.5 | 2.43 | 0.071 | None |
| Error | 492.1 | ||||
| Shoulder/Belt Adjust | Trial | 4299 | 3.95 | 0.011 | 3 − 1, 4 − 1 |
| Error | 1088 | ||||
| Total time | All steps | 89,075.0 | 12.06 | 0.000 | 2 − 1, 3 − 1, 4 − 1 |
| Error | 7384 |
Publisher’s Note: MDPI stays neutral with regard to jurisdictional claims in published maps and institutional affiliations. |
© 2021 by the authors. Licensee MDPI, Basel, Switzerland. This article is an open access article distributed under the terms and conditions of the Creative Commons Attribution (CC BY) license (http://creativecommons.org/licenses/by/4.0/).
Share and Cite
MDPI and ACS Style
Bunney, Z.; Jensen, R.C.; Autenrieth, D. Fall-Protection Harness Training: Donning Skill Improves with Up to Four Repetitions. Safety 2021, 7, 16. https://0-doi-org.brum.beds.ac.uk/10.3390/safety7010016
AMA Style
Bunney Z, Jensen RC, Autenrieth D. Fall-Protection Harness Training: Donning Skill Improves with Up to Four Repetitions. Safety. 2021; 7(1):16. https://0-doi-org.brum.beds.ac.uk/10.3390/safety7010016
Chicago/Turabian StyleBunney, Zachary, Roger C. Jensen, and Daniel Autenrieth. 2021. "Fall-Protection Harness Training: Donning Skill Improves with Up to Four Repetitions" Safety 7, no. 1: 16. https://0-doi-org.brum.beds.ac.uk/10.3390/safety7010016
Note that from the first issue of 2016, this journal uses article numbers instead of page numbers. See further details here.