1. Introduction
Driver assistance and information systems are developed to support drivers in various types of situations in different ways. Using different modalities, they inform the driver for example about an open door by playing an auditory sound or giving tactile feedback on the steering wheel when driving over the lane markings. They can also actively control subsystems of the vehicle for example by braking or accelerating if adaptive cruise control (ACC) is activated. Advanced driver assistance systems (ADAS) are designed to have a positive impact on driving safety, and some constantly monitor the exterior and interior of a vehicle. Depending on the driving situation, the driver is interacting with different types of other road users. Especially in an urban scenario, the driving relevant information can be overwhelming. Focusing on the most relevant cues to navigate in a safe manner can be exhausting and possibly result in critical encounters, even for healthy drivers without any sensory, cognitive, or physical impairments. As such, drivers may benefit most from ADAS systems when driving through a busy city with many potential hazards including pedestrians, bikes, and other motor vehicles.
Since driving is a highly visual task, an impairment of this modality is likely to affect driving safety [
1]. Nevertheless, people with impaired vision are permitted to drive in some jurisdictions, depending on the vision requirements for driving licensure and their level of vision impairment. ADAS systems could improve the safety of drivers with vision impairment, but little research has been conducted to evaluate the potential benefits for this at-risk population. We developed a prototype vibro-tactile assistance system for drivers with homonymous visual field defects (HVFD) and conducted a proof-of-concept study to evaluate the extent to which the system improved the safety of responses to pedestrian hazards in a city environment. To our knowledge, there have not been any prior studies of the effects of any kind of ADAS on the driving of people with HVFDs.
HVFDs are caused by brain injuries affecting the post-chiasmal visual pathways. Stroke, trauma, and tumors are the most common causes [
2]. A person with an HVFD has a loss of vision in the same half of the visual field in both eyes (the left or right side of both eyes). The field defect can range from the complete loss of one hemifield (homonymous hemianopia) to the loss of one-quarter of the visual field (homonymous quadrantanopia) or smaller areas of paracentral homonymous field loss. People with HVFDs are permitted to drive in some jurisdictions in the United States (e.g., in New Hampshire, where there is no minimum visual field requirement [
3]). Furthermore, some countries in Europe operate exceptional-case programs that provide people who do not meet the minimum visual field requirements (including people with HVFDs) an opportunity to take a specialized road test to demonstrate their practical fitness to drive (e.g., Belgium, The Netherlands, and the UK).
In on-road studies, ass rates of drivers with HVFDs have ranged from 14% to 90%. The most common reasons for failing a road test included problems with lane position and steering stability, and inadequate viewing (scanning) behaviors [
4]. In one on-road study of HVFD drives, the majority of interventions by the driving examiner were for failures to respond to potential hazards (including other vehicles, pedestrians, and bicyclists) [
5]. However, there is little experimental control over when or where hazards might appear in on-road tests, and there are safety concerns when evaluating drivers with impaired vision in open road situations. In contrast, driving simulators provide a safe, controlled, repeatable environment in which to evaluate the ability of drivers with vision impairments to respond to potential hazards. Driving simulator studies have provided strong evidence that some drivers with HVFDs do have impaired detection of hazards approaching from the side of the field loss (the blind side), including delayed responses to hazards as well as total failures to detect hazards, which is clearly a safety concern [
6,
7,
8,
9].
People with HVFDs could compensate for their vision loss by scanning (looking) toward the blind hemifield using gaze (eye and head) movements. However, unlike a person with a full field of vision, they do not have any peripheral vision on the blind side to help guide their scanning, i.e., to guide them as to when to scan or how far to scan. People with HVFDs have to remember to scan to their blind side; thus, it may be totally by chance whether they scan when a hazard is present. Therefore, we developed an ADAS system that gave lateralized directional vibro-tactile warnings of potential pedestrian hazards, providing simple, intuitive guidance as to which direction the driver should scan. Visual warnings were not used because they could only have been presented in the seeing hemifield and might not have provided appropriate guidance as to which direction to look. Auditory warnings could have been used, but there are already many sources of auditory information when driving. Furthermore, both auditory and visual signals have been shown to reduce the extent of the useful field of view, which may exacerbate conditions for drivers with impaired vision [
10]. Therefore, we selected to use tactile warnings, since this modality has been shown to be effective for in-vehicle warning systems for drivers with normal vision [
11].
We evaluated the effects of the ADAS system on gaze behavior and responses to pedestrian hazards within the safe environment of a driving simulator. Our primary hypothesis was that the ADAS warnings would help direct the gaze of drivers with HVFDs to pedestrian hazards on their blind side, and as a result, the safety of responses would improve. We expected that the ADAS warnings would have a greater beneficial effect on responses to pedestrians crossing from the blind than the seeing side. A group of age-similar normally sighted drivers was included to provide a benchmark against which to compare the safety rates of the HVFD group. We did not expect the normally sighted participants to benefit from the ADAS.
2. Materials and Methods
2.1. Participants
Eight participants (all men) with HVFDs, either hemianopia or quadrantanopia (5 with left side visual field loss), took part in this study. HVFDs were confirmed with a clinical visual fields test (Goldman perimetry, V4e target). The age of the participants ranged from 24 to 64 years (mean = 50 years; SD = 15 years). The cause of the HVFD was brain surgery (4/8 participants), stroke (2/8 participants), brain trauma (1/8 participants), and motor vehicle accident (1/8 participants). It was an average of 13.1 years (SD = 7.85 years) since the onset of the HFVD. None of the participants with HFVDs had visual spatial neglect (Bells test and Schenkenberg line bisection test). All participants with HFVDs had good visual acuity (mean 20/20). Since people with HVFDs are not permitted to drive in Massachusetts where the study was conducted, only one HVFD participant was a current driver, two had never driven a car on the road before (but did have experience of driving in simulators), and the remaining 5 participants had stopped driving on average 12.6 years ago (SD = 7.23 years).
Additionally, a group of 8 licensed drivers (6 men) with normal vision and no visual field loss participated. Their mean age was 51 years (SD = 17 years), similar to that of the HVFD group. All of them were current drivers at the time of being tested, and all had good visual acuity (mean 20/15). The normally sighted participants on average drove 7730 km per year (SD = 9752 km). The normally sighted and HFVD participants were mainly recruited from the participant database of the Schepens Eye Research Institute.
2.2. Materials and Apparatus
2.2.1. The Driving Simulator and the Pedestrian Simulator
The technical setup used for this study was the same as described in [
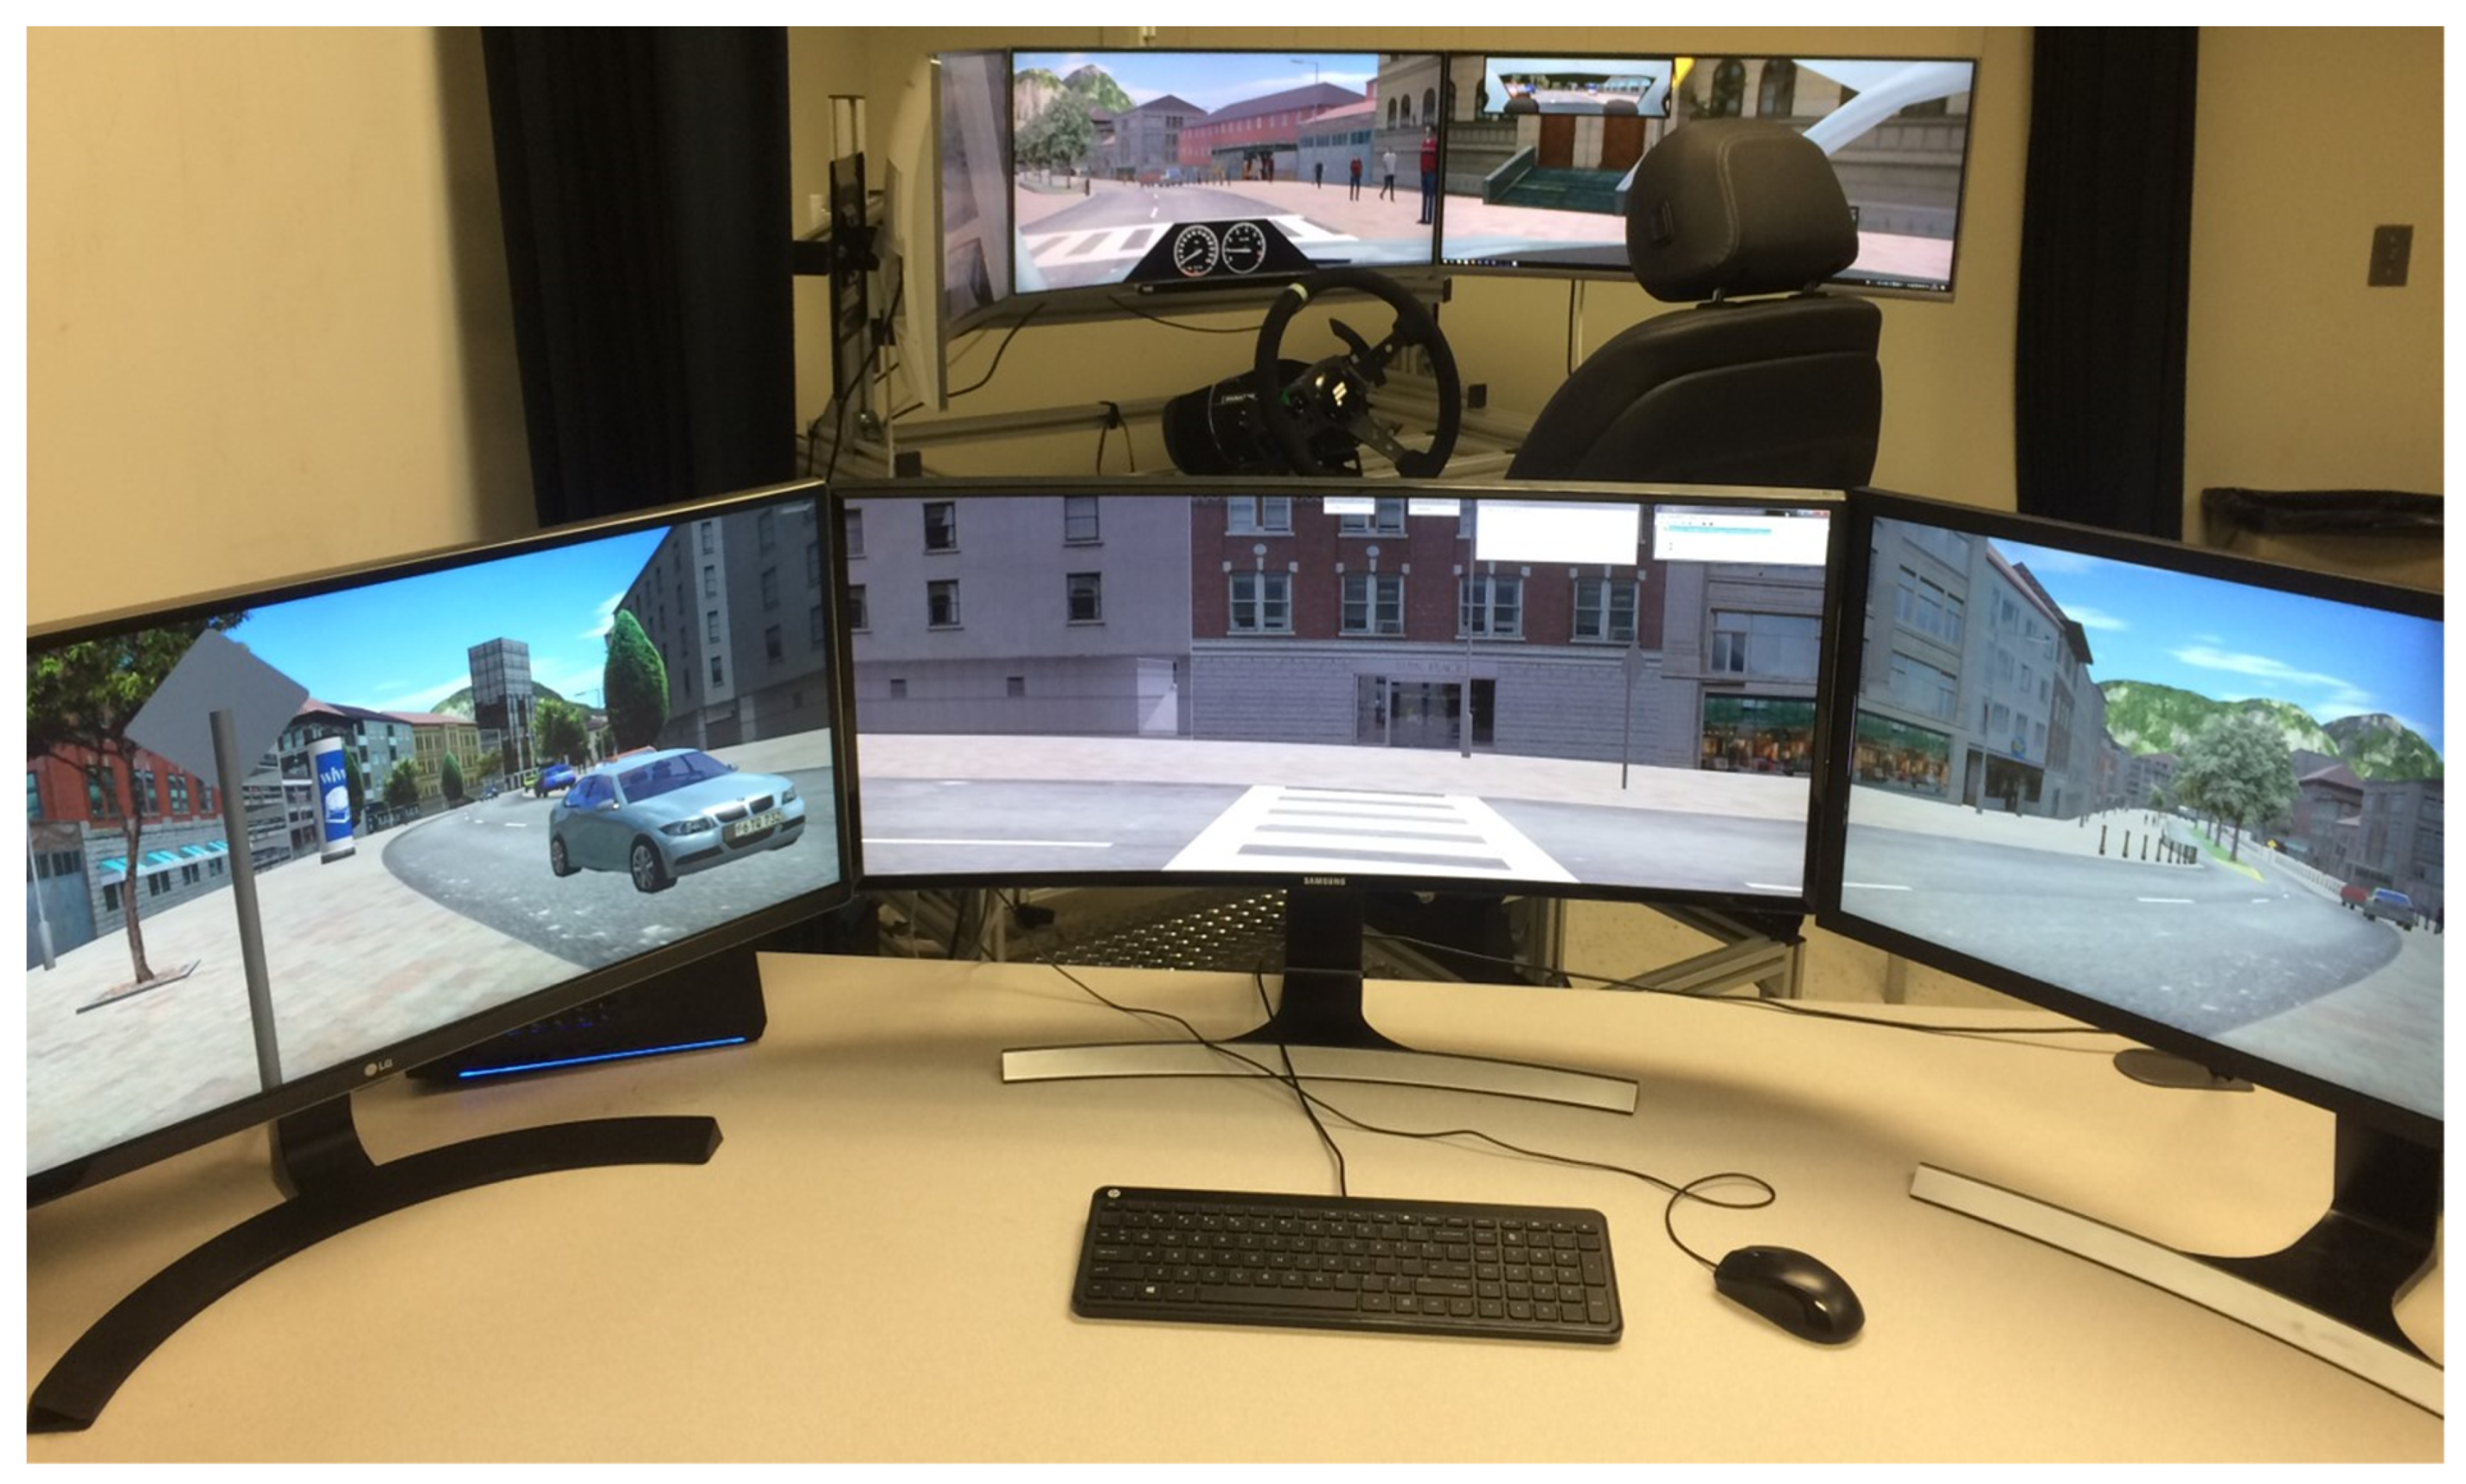
12]. The simulator setup consisted of two linked simulators (see
Figure 1) to facilitate mutual behavior adaption (interaction) of the road users involved, in this case, the driver (the participant) and a pedestrian (controlled by a trained research assistant). Linked simulators was an approach first applied in 2003 and further developed in various studies evaluating traffic and interaction behavior [
13]. The rationale for using linked simulators is to increase data validity by creating more realistic social interactions between participants in the artificial environment of a virtual world. As in the previous study [
12], we used pedestrians that simulated two types of crossing behaviors observed in real-world studies: a pedestrian (Bot) that ran across the road totally unaware of the approaching car and a human-controlled pedestrian that checked for approaching traffic and only crossed if it felt it was safe to do so. It has to be noted that previous studies investigating the validity of driving simulation compared to on-road testing show a clear indication that there is “(...) an association between or a prediction of driving simulation with respect to on-road testing (...)” [
14].
In the driving simulator, participants drove a simulated car through a virtual city environment displayed on three 34” curved monitors (Samsung C34F70, 3440 × 1440 pixels, 4 ms response time, 21:9 aspect ratio), which provided a 180° horizontal field of view. A Tobii 4C eye tracker was used to record gaze position on the center screen at 90 Hz. Inputs to control the simulated car were conveyed through a steering wheel with force feedback (Fanatec ClubSport Wheel Base V2, Landshut, Germany) and a pedal setup of a car with automatic transmission (Fanatec ClubSport Pedals V3). The virtual environment, comprising city and rural highway scenes, was created using the simulator software SILAB 5.1 [
15].
The pedestrian simulator in this setup was used to manually control pedestrians within the simulated environment where the participant was driving. The control station for the pedestrian simulator consisted of three monitors, which provided a 180° view into the virtual world from the perspective of the pedestrian. The central monitor was a Samsung 24-inch LCD monitor with a resolution of 1920 × 1080 pixels, the monitors on the left and right sides were 32-inch Samsung LCD monitors with a resolution of 3440 × 1440 pixels. A trained research assistant used a keyboard to control the movements of the human-controlled pedestrian, including head turning and walking. During the simulation, the assistant controlling the pedestrian and the participant driving the virtual vehicle were not able to see each other outside of the simulated environment. Thus, the assistant could see neither the participant nor the participant’s view of the road and could only use information from the pedestrian’s view in the virtual world.
2.2.2. Driving Scenarios and Pedestrian Types
The main drive included four city sections (40 km per hour speed limit) separated by rural highway sections (120 km per hour speed limit), similar to the test track used in [
12]. The highway sections were included in order to reduce possible motion sickness in participants, which the city parts might have caused. Rest areas were implemented in the highway sections where the participants could pull over, stop the car, and take a break from the drive. Across the four city sections, the participants encountered 38 pedestrian crossing situations in total, of which 32 were included in analyses. Analyzed situations were all “free-lane” crossings simulating a scenario in which a pedestrian unexpectedly crossed the road at a location not specifically marked as a designated crossing location. The 6 remaining pedestrian crossing situations were included in the drives to provide variety but were excluded from the analysis, since they were located within curves, and an appropriate and consistent hazard warning could not be guaranteed as in the other 32 analyzed crossing situations. This was mainly due to the fact that the pedestrians were visible much later for the driver since they were occluded by buildings in the curves. The city sections also included other road users such as trucks, other cars, and motorcycles as well as other non-crossing pedestrians, alone or in groups, either standing or walking along the sidewalk.
Participants encountered two different types of pedestrians while driving through the four city sections. A preprogrammed, non-interactive pedestrian (Bot) that acted like the ones used in prior studies of the effects of vision impairment on pedestrian detection [
6,
16,
17] and an interactive human-controlled pedestrian (HCped), as described above and implemented in a previous study [
12]. Within each city, there were four situations with Bots and four with HCpeds that were analyzed, with an equal number of crossings from the left and right sides.
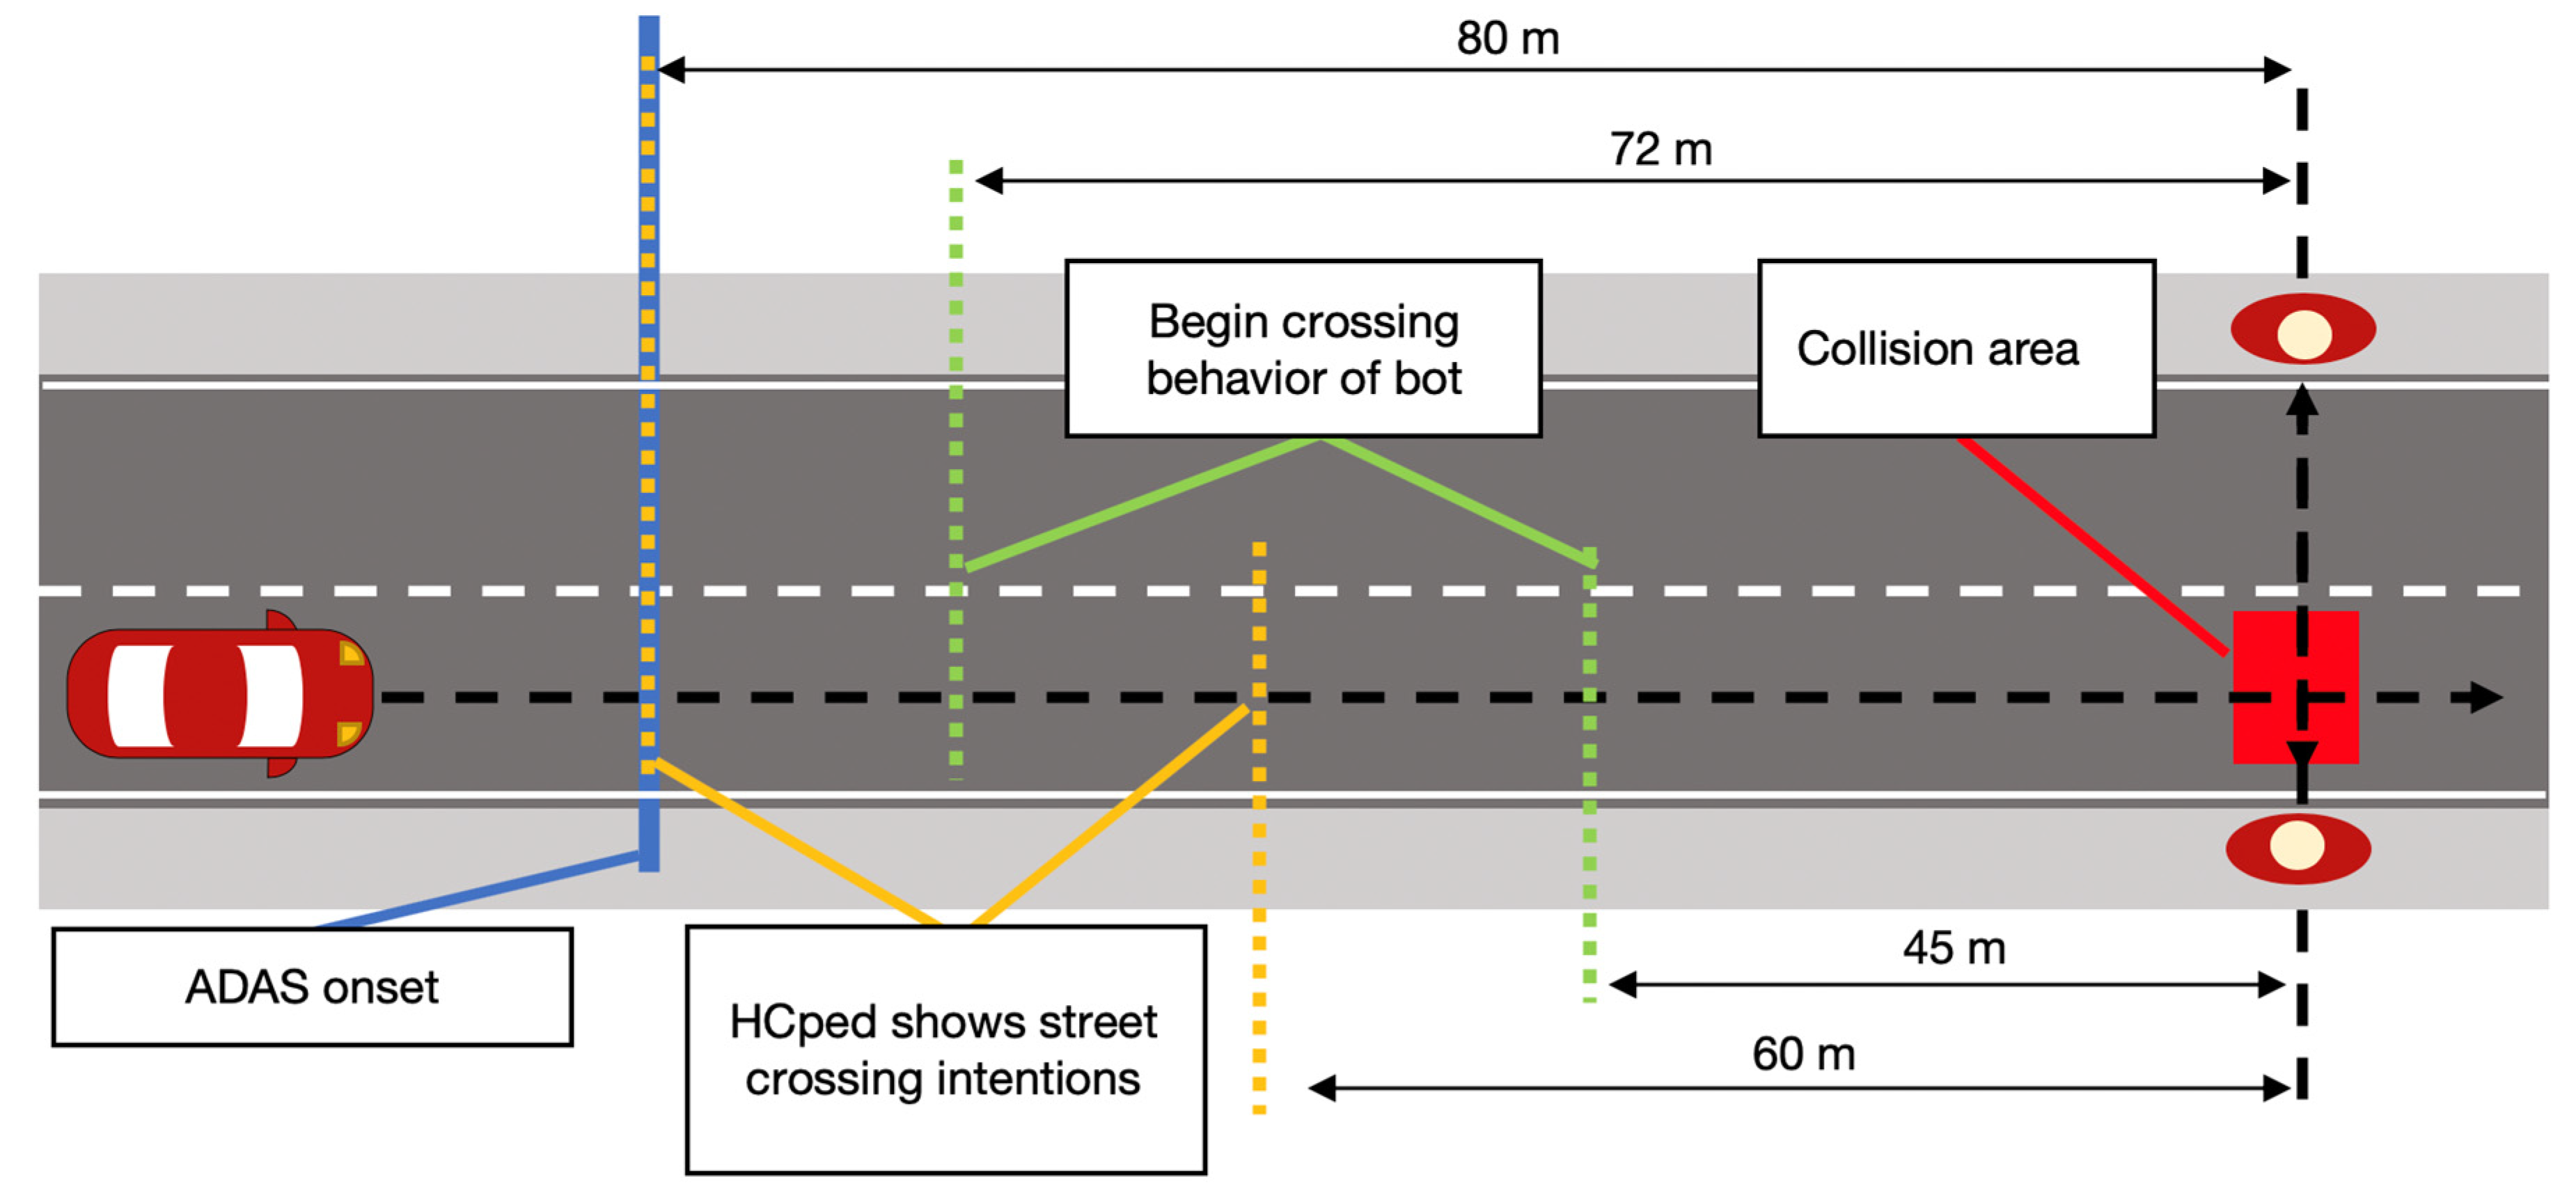
In determining the parameters for the pedestrian crossing situations, the aim was for each pedestrian to reach the potential collision zone at approximately the same point in time after the start of the event (each event started at 80 m from the crossing point), assuming the participant’s car moved at a constant speed (40 km per hour). Therefore, given the differences in the Bot and HCped crossing behaviors and the longer distance for the pedestrians to walk from the left compared with the right sidewalk to the collision zone, trigger conditions differed depending on pedestrian type and crossing direction (see
Figure 2). Pedestrians were activated to start moving once the participant’s car reached a pre-specified distance from the point where the pedestrian would enter the road. This trigger was set at a 45 m distance for Bot crossings from the right and a 72 m distance for Bot crossings from the left. Bots always crossed the road at a constant speed (1.6 m/s) and without looking at the car, simulating a pedestrian totally unaware of the approaching car. In contrast to this, the behavior of the HCped was influenced by awareness of the behavior of the approaching car. In all tests, it was the same assistant who controlled the behavior of the HCped. A standardized crossing procedure was used. The assistant started the movements for crossings from the left (right) once the participant’s vehicle was 80 m (60 m) from the HCped. The first move was a step toward the curb, followed by a turn of the head into the direction of the approaching car. This head turn was used to give the assistant the ability to look at the car and evaluate the situation. The HCped only crossed the road if the assistant rated the situation as safe to cross. Additionally, the head-turn behavior of the HCped was used to signal the crossing intention to the driver. If the assistant decided to cross the road, the HCped crossed at a constant speed of 2.0 m/s.
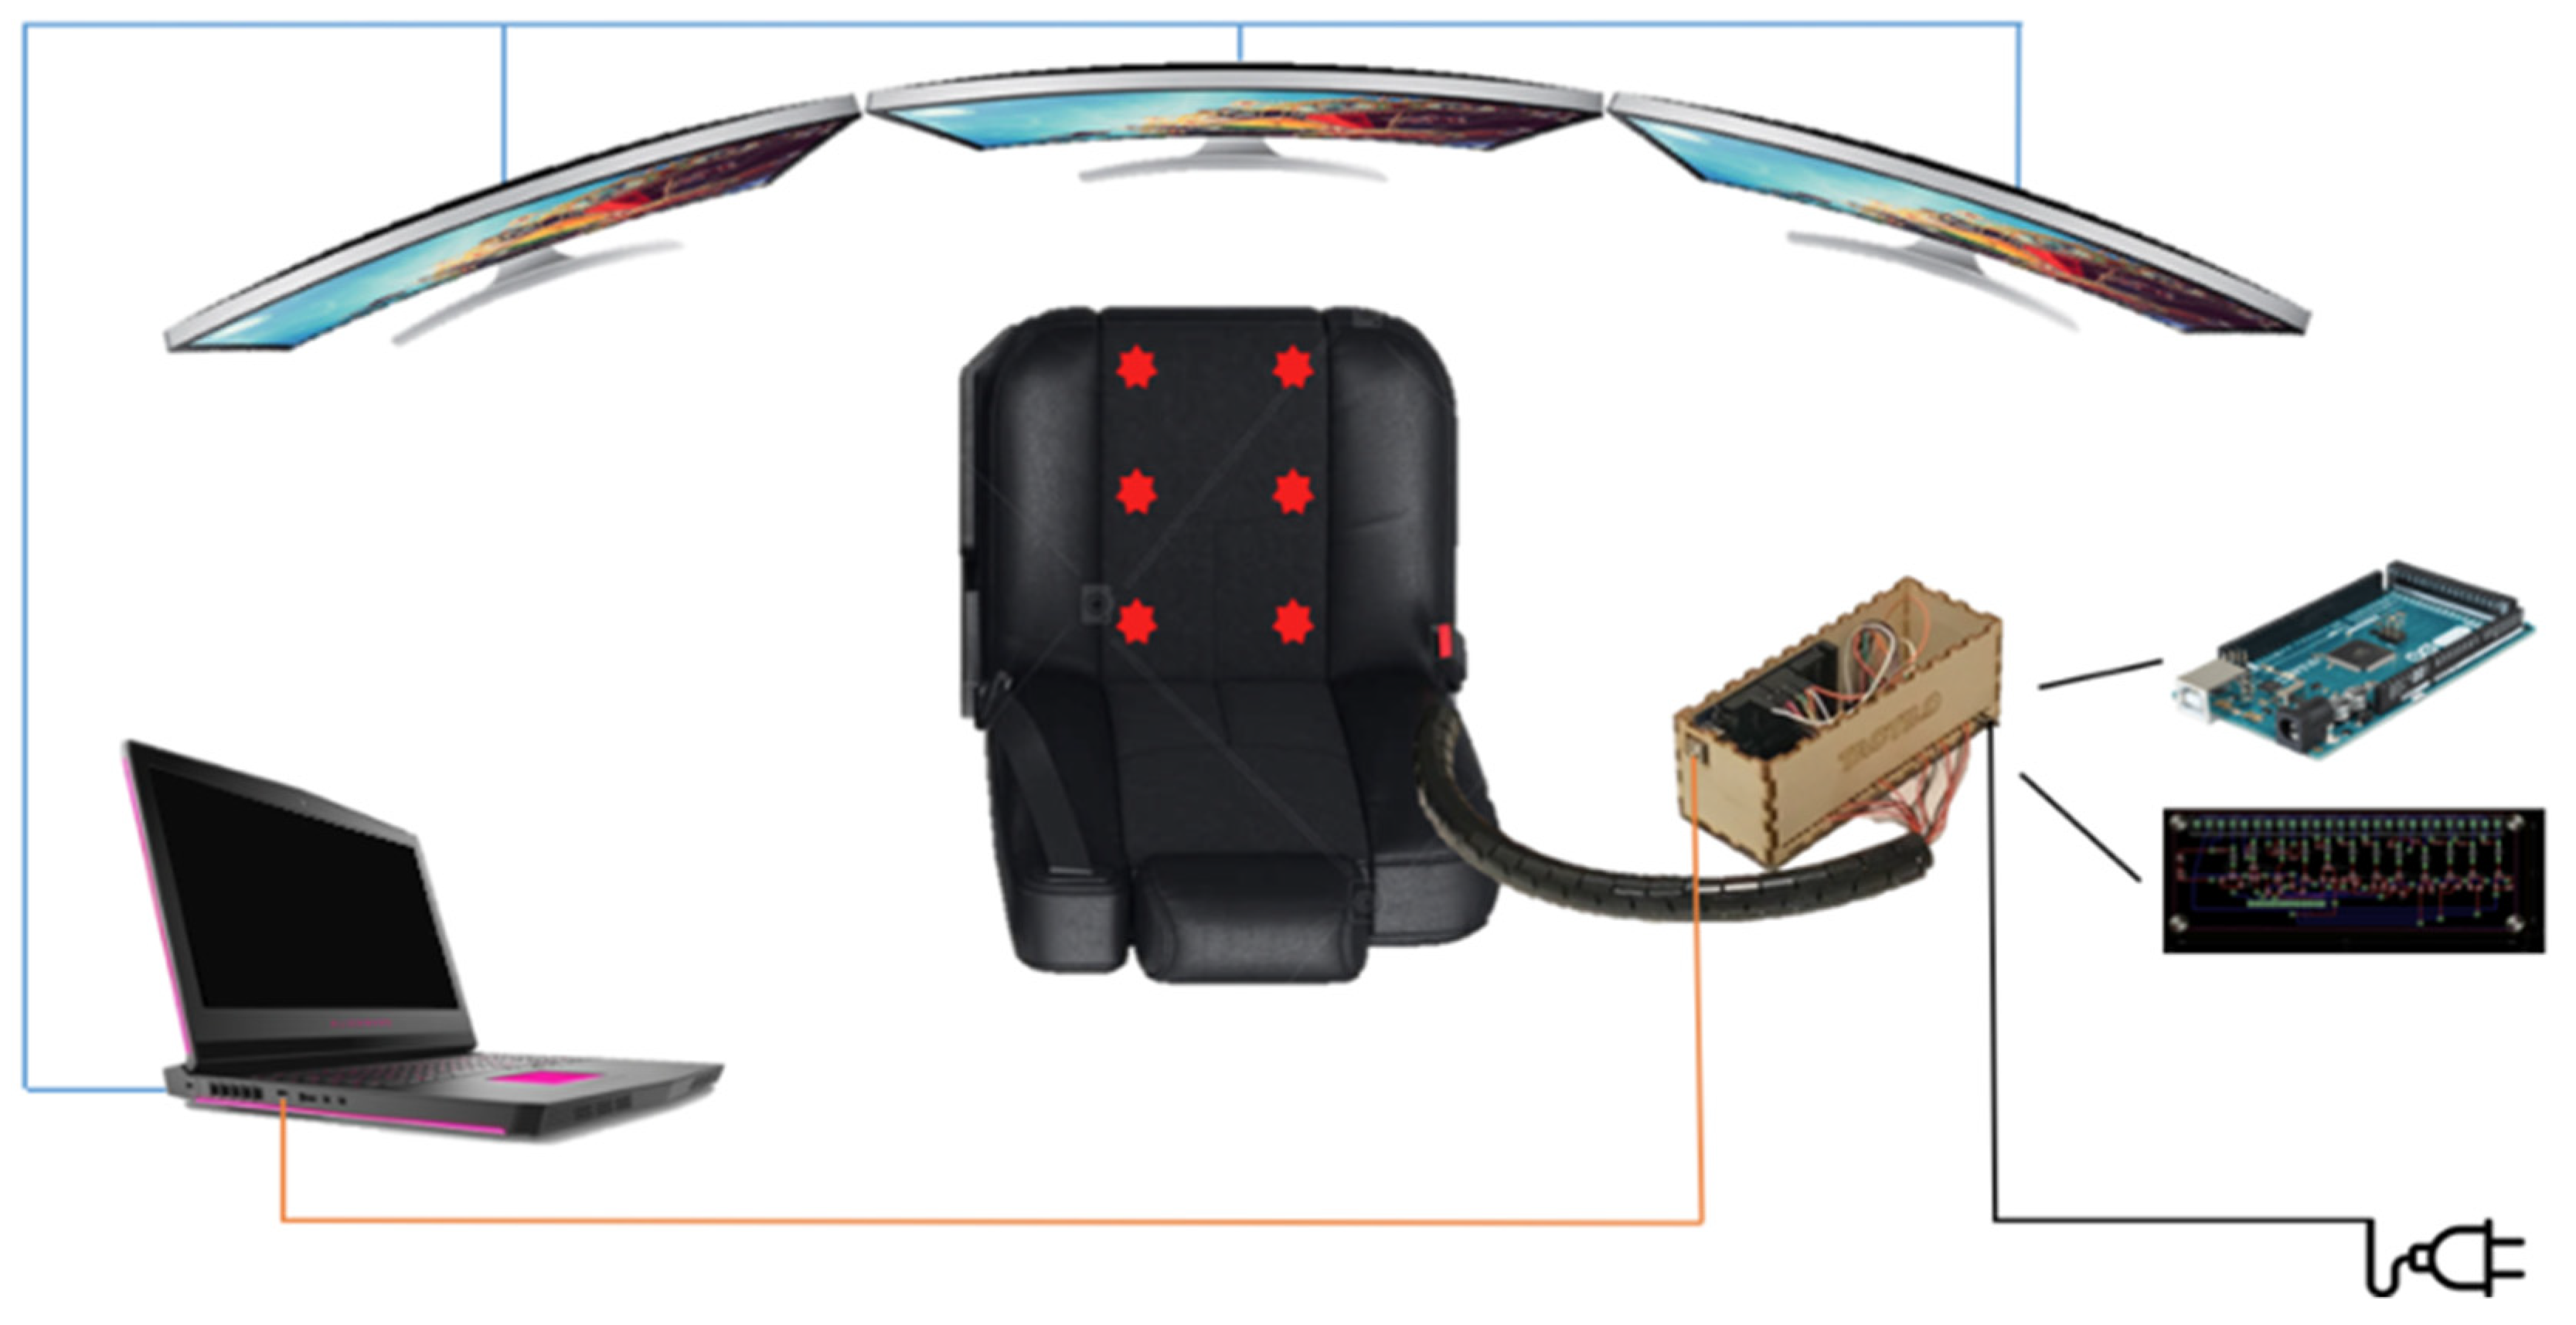
2.2.3. The Vibro-Tactile Assistance System
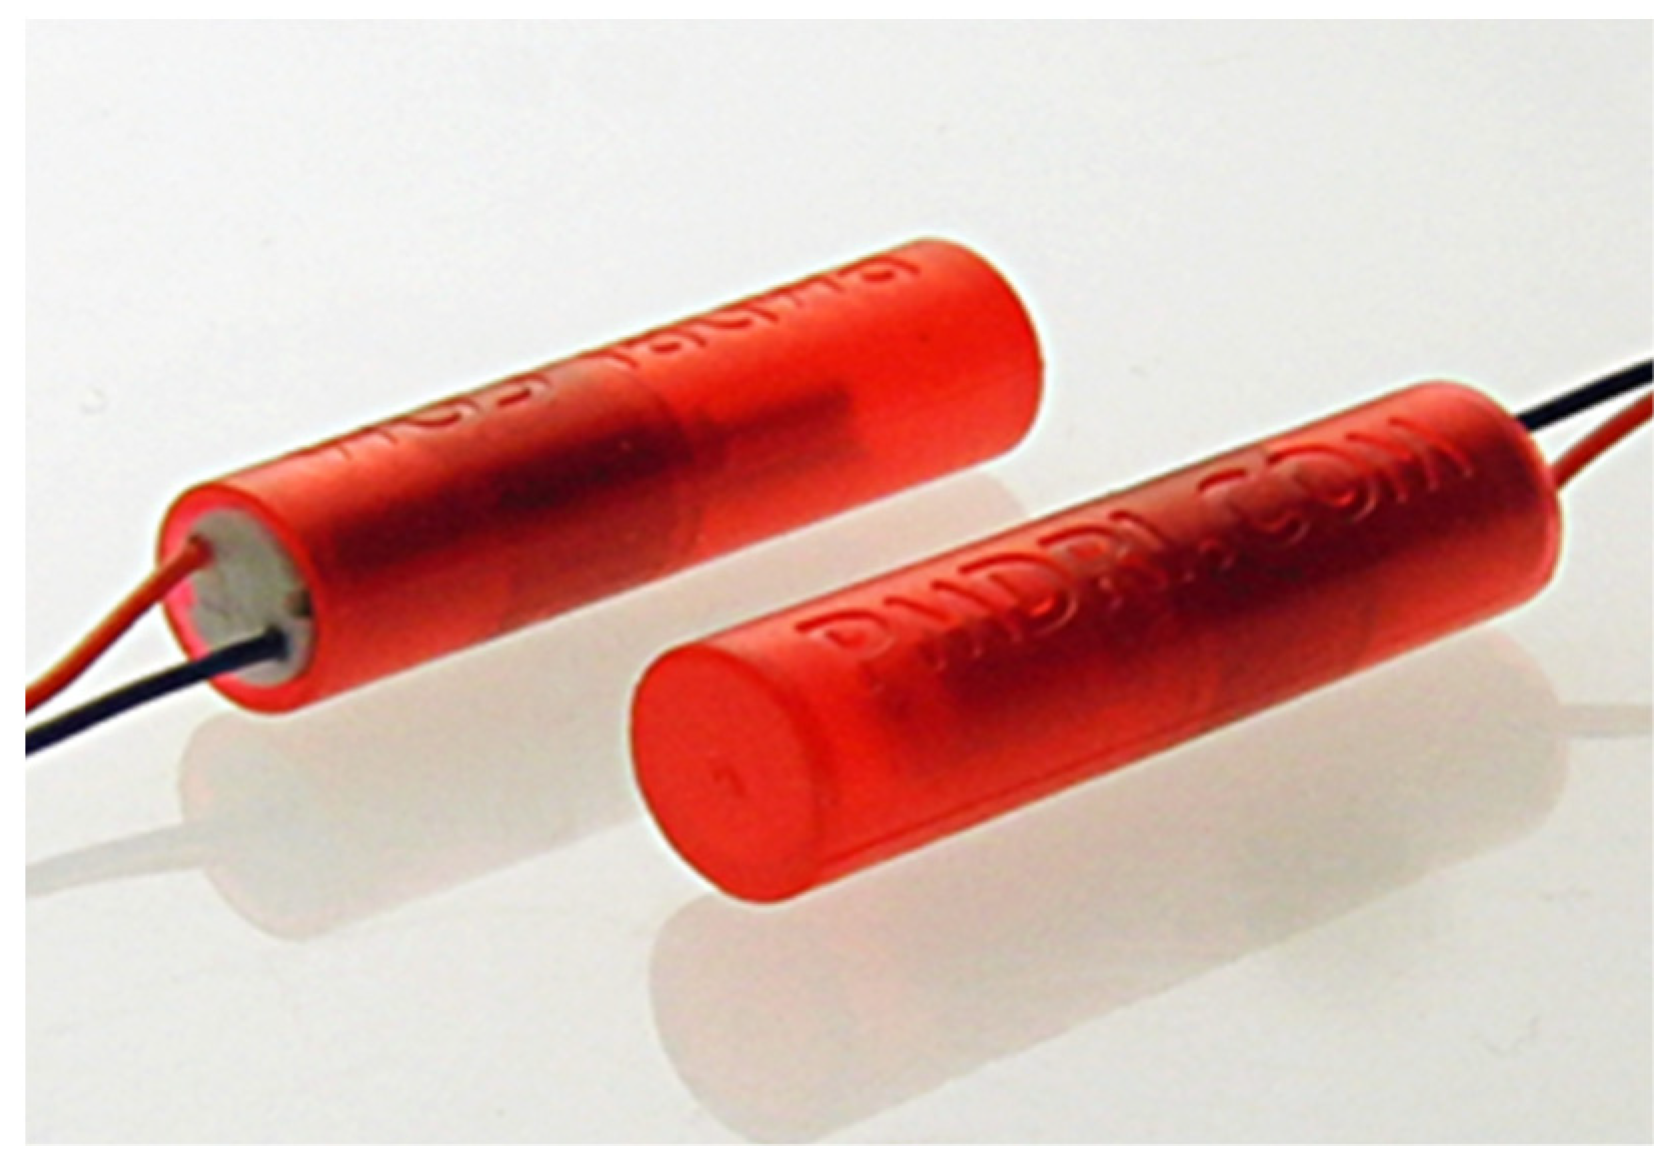
The vibro-tactile assistance system comprised twelve direct current (DC) Pico Vibe vibration motors type 307–103 [
18], which each included an eccentric rotating mass (ERM) (see
Figure 3). Both the amplitude and frequency of the vibration were produced through the rotational speed of the ERM and were dependent on the input voltage. Specifications of the vibration motors are listed in
Table 1.
The twelve motors were embedded within the foam of the simulator seat cover. They formed two 3 × 2 matrices, one for the right and one for the left thigh.
The motors were controlled by an Arduino MEGA 2560 [
19] that was connected to the driving simulator via a USB type B port. A programmable script on the Arduino activated either the left or the right matrix, depending on the input coming from the driving simulation software SILAB. In SILAB, a Java script continuously monitored the distance between the driver and the point at which the next pedestrian would cross the road. Whenever the distance fell below a pre-determined threshold (described below), the Java script sent a signal to the controller to activate the respective (left/right) matrix of the ADAS, and the motors subsequently vibrated for 500 ms [
20]. The vibration strength and duration were selected in pilot trials to provide a vibro-tactile warning of sufficient intensity and duration to be easily felt when sitting on the seat cover but not too strong as to be uncomfortable. A scheme of the driving simulator system and the connections are shown in
Figure 4.
The design concept underlying our first implementation of the vibro-tactile warning signal was to provide the driver with plenty of time to perceive the warning and react with appropriate gaze and driving behaviors. We estimated that 6.7 s would be sufficient time for participants with HVFDs to respond to the warning and initiate a safe braking maneuver. This corresponded to a distance of 75.55 m when traveling at the speed limit of 40 km per hour. Thus, a trigger distance of 80 m was used for crossings from the drivers’ left side, which is further away from the participant’s driving lane. The ADAS was triggered at the same distance at which the HCped was first triggered to start its street crossing.
2.3. Procedures
At the start of the driving session, a detailed explanation of the simulator, the ADAS, and the driving task were given. Participants were told that the ADAS would vibrate to give warnings of potentially hazardous pedestrians that might cross the road but not that the spatial orientation of the vibration would occur on the side from which the pedestrian would cross the street. They were not informed that an assistant was going to control pedestrians in the same simulation. Participants were asked to drive and respond to pedestrians and other traffic as if driving in the real world and to obey all normal rules of the road. They were informed that the speed limit was 40 km per hour in cities and 120 km per hour on highways. They were asked to try to drive as close to 40 km per hour in the city as possible when safe to do so.
The seat, pedals, and screen height of the driving simulator were adjusted to the individual needs of each participant. Then, the eye tracker was calibrated, and accuracy of the tracking was measured at 9 locations covering the height and width of the center monitor. If accuracy was not within 2 degrees, then the calibration procedures were repeated. Each driving session started with a short acclimation drive in order for the participant to get used to the driving simulator. During this drive, four pedestrians crossed the road. The ADAS gave a warning vibration for each pedestrian so that the participant would experience the functionality of the system. The two participants without prior on-road driving experience all demonstrated good ability to control vehicle speed and steering in the acclimation drive. Therefore, the setup of the driving simulator study followed the principles outlined by [
21], which include an adequate sample selection, briefing, mitigating the risk of simulator sickness by simulator training, and the usage of a clear user interface.
Then, after acclimation, participants completed the main experimental drive through the four city and four highway sections, which took around 50 min. They were guided along the pre-determined route by auditory navigation instructions. One-half of the experimental drive (two city sections) was driven with the ADAS enabled, and the other half was driven with the ADAS disabled. Half of the participants drove through the first two city sections with enabled ADAS. The other half drove with enabled ADAS in the last two city sections. After driving through two of the cities sections, the driver was asked to stop for a short break at a highway rest area. During the break, the ADAS was enabled or disabled, depending on the order of the conditions. If needed, participants could take a break at any of the highway rest stops between the other city sections. To reduce any potential effects of the environment, the order of the city sections was counterbalanced across all participants. Controls drove the city sections in the same order as the HVFD participant to whom they were matched.
2.4. Data Analyses and Performance Measures
For each pedestrian crossing event, data were analyzed starting from the time when the participant’s vehicle was 100 m away from the predefined crossing point to the time when the participant’s car passed by the pedestrian. Participants’ performance was categorized in terms of the proportion of time for which gaze was on the pedestrian and driving safety measures.
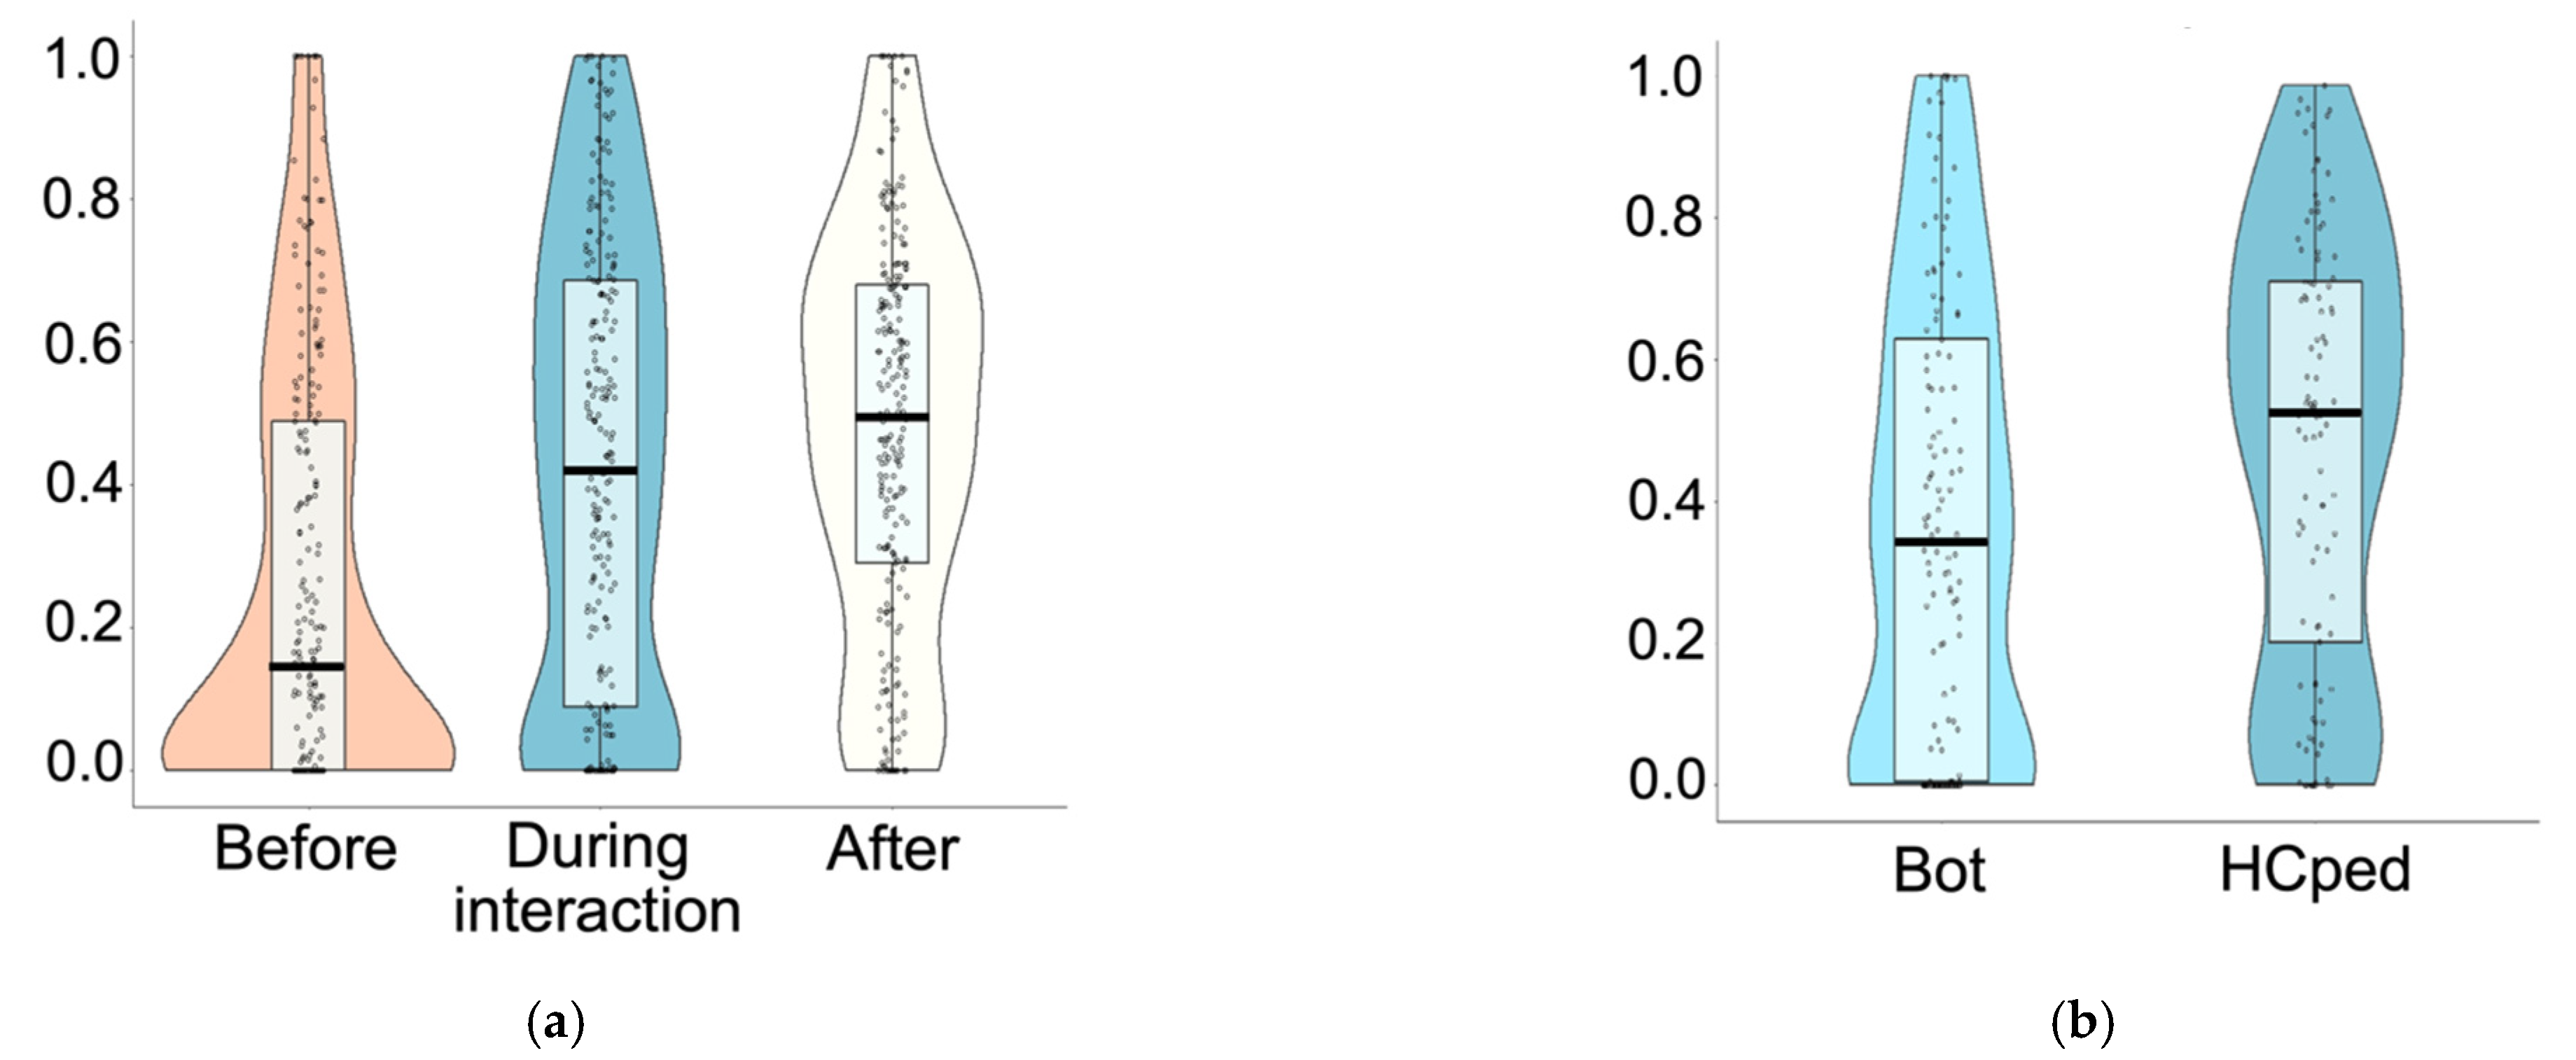
2.4.1. Proportion of Time Pedestrian Fixated
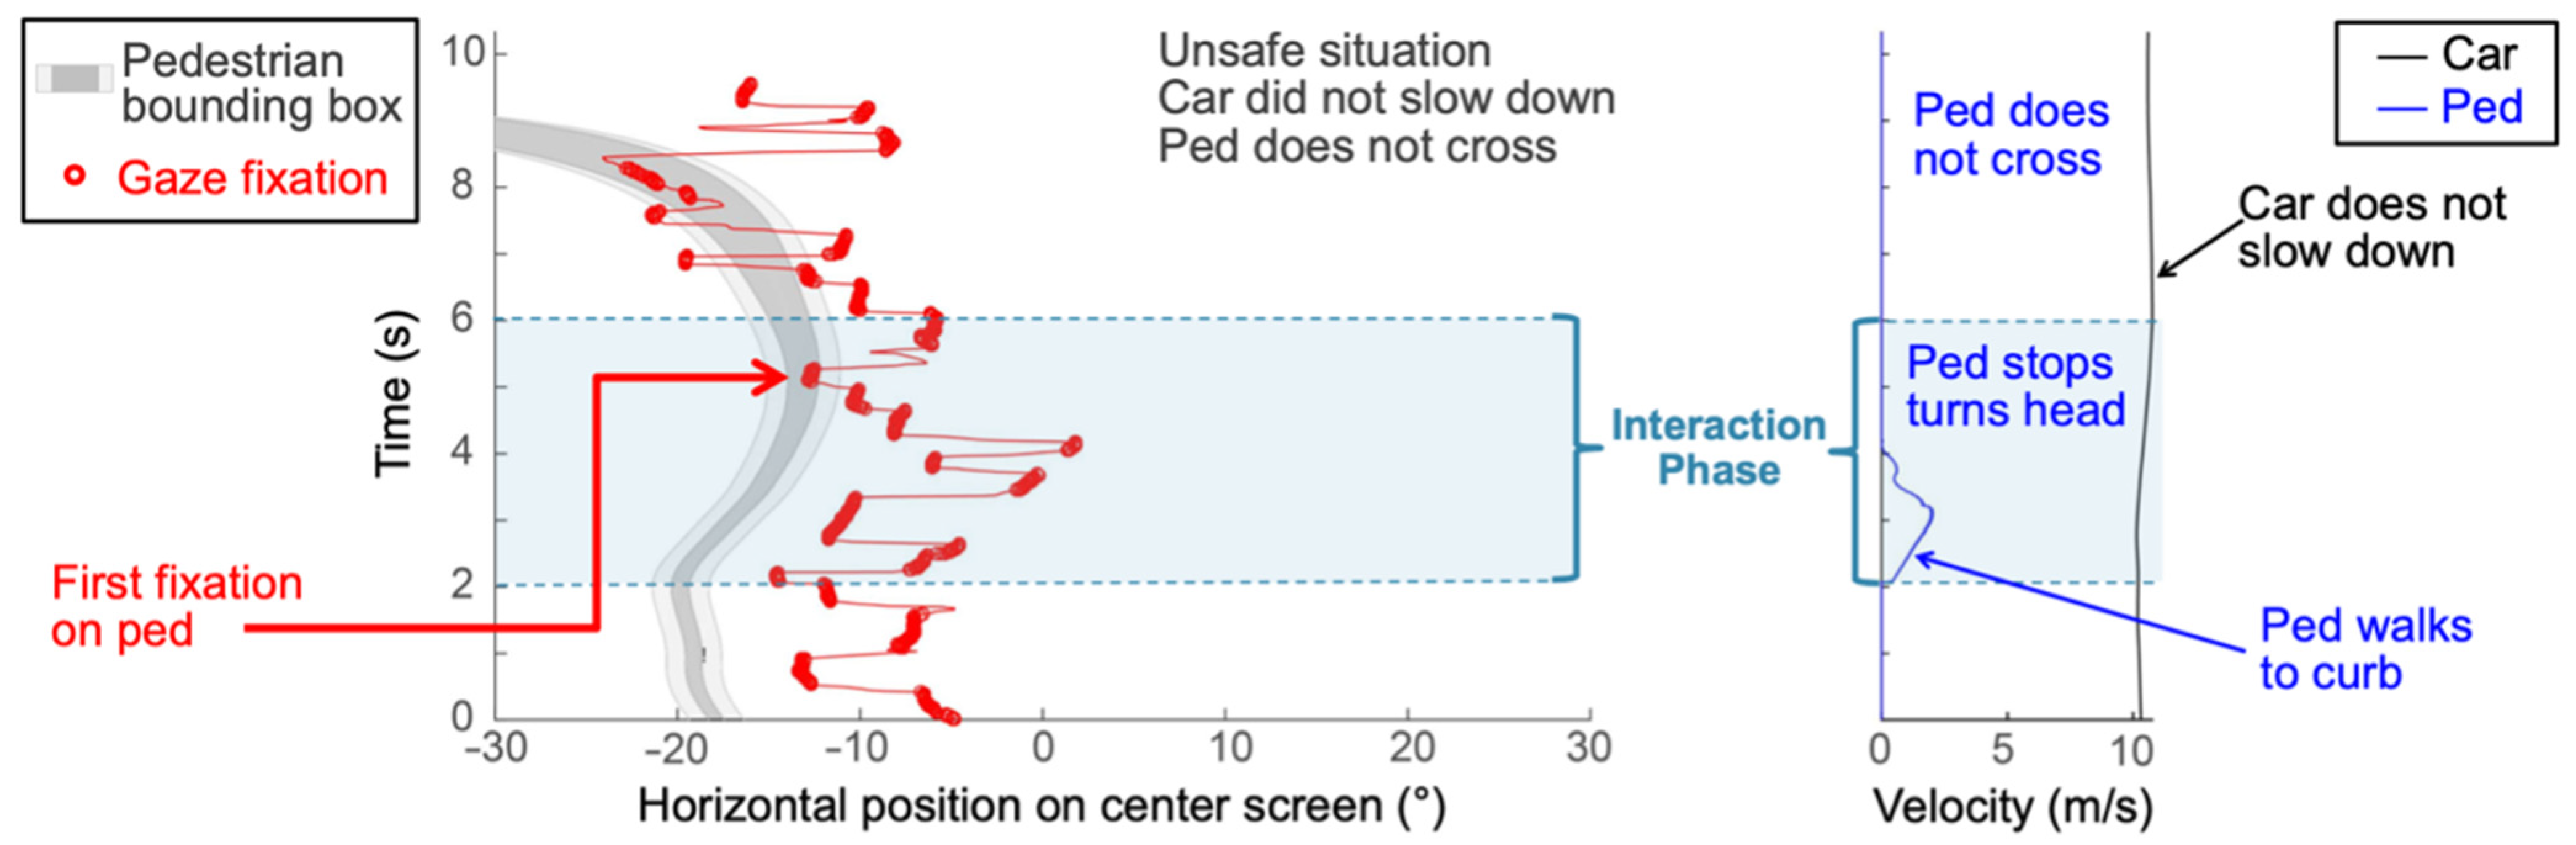
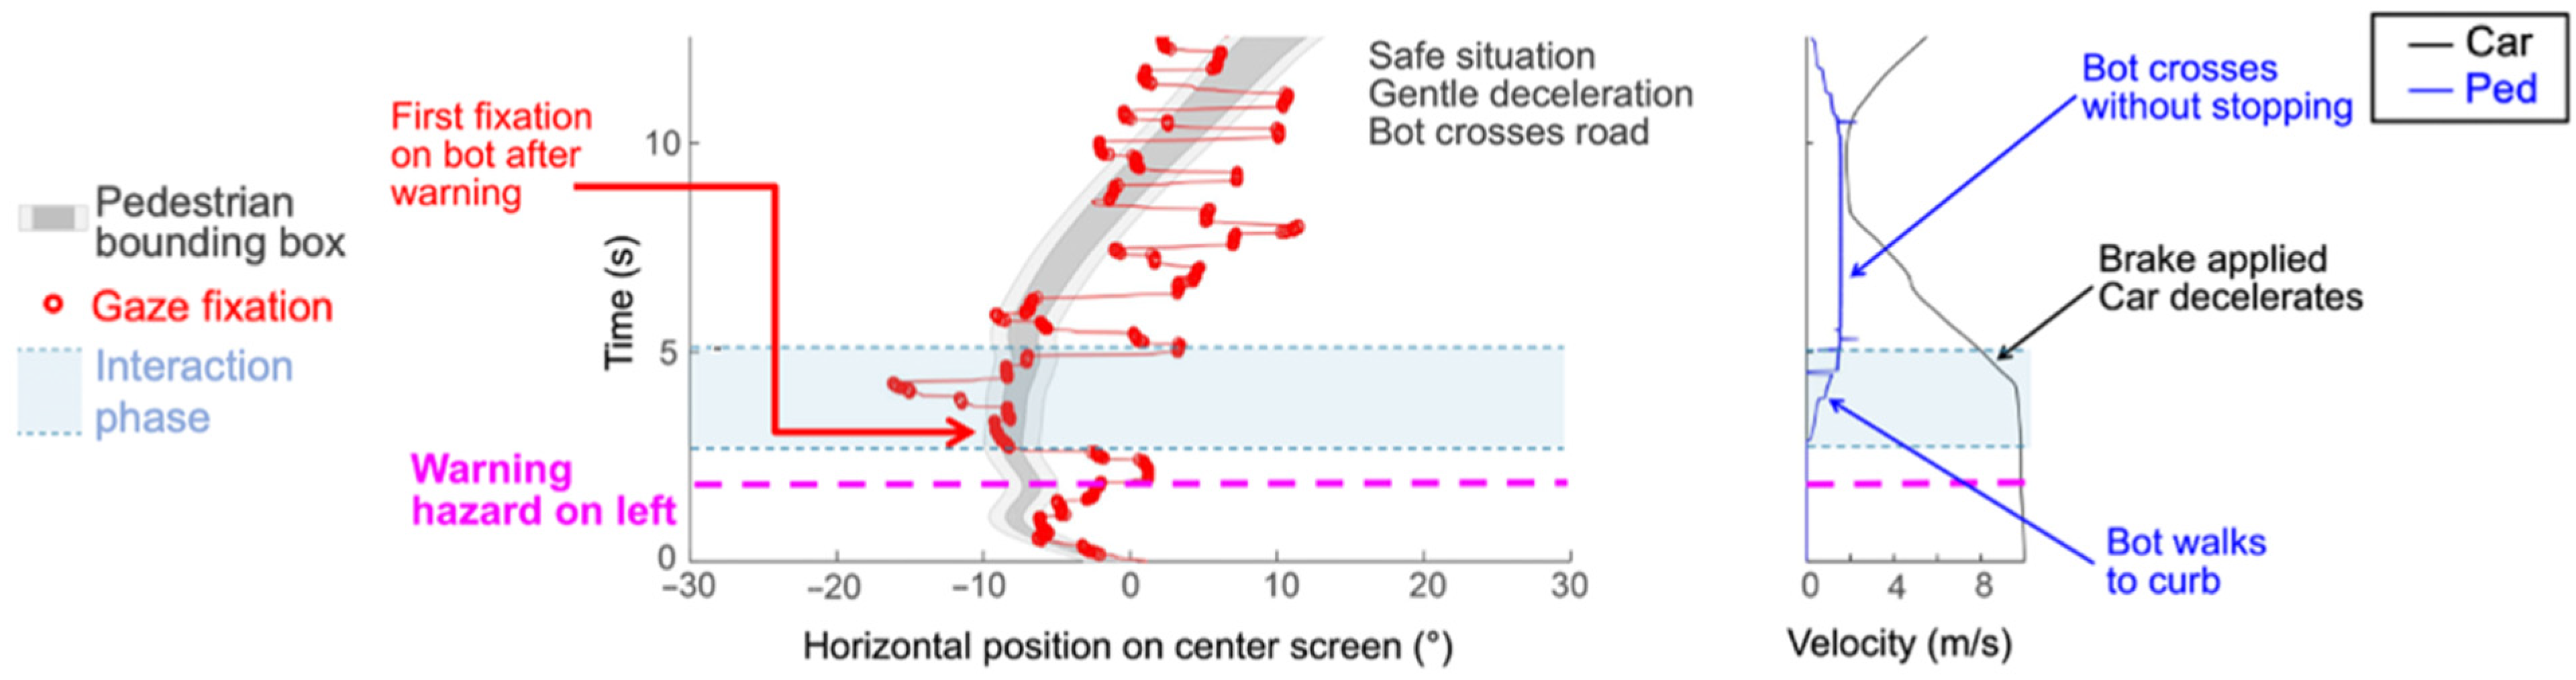
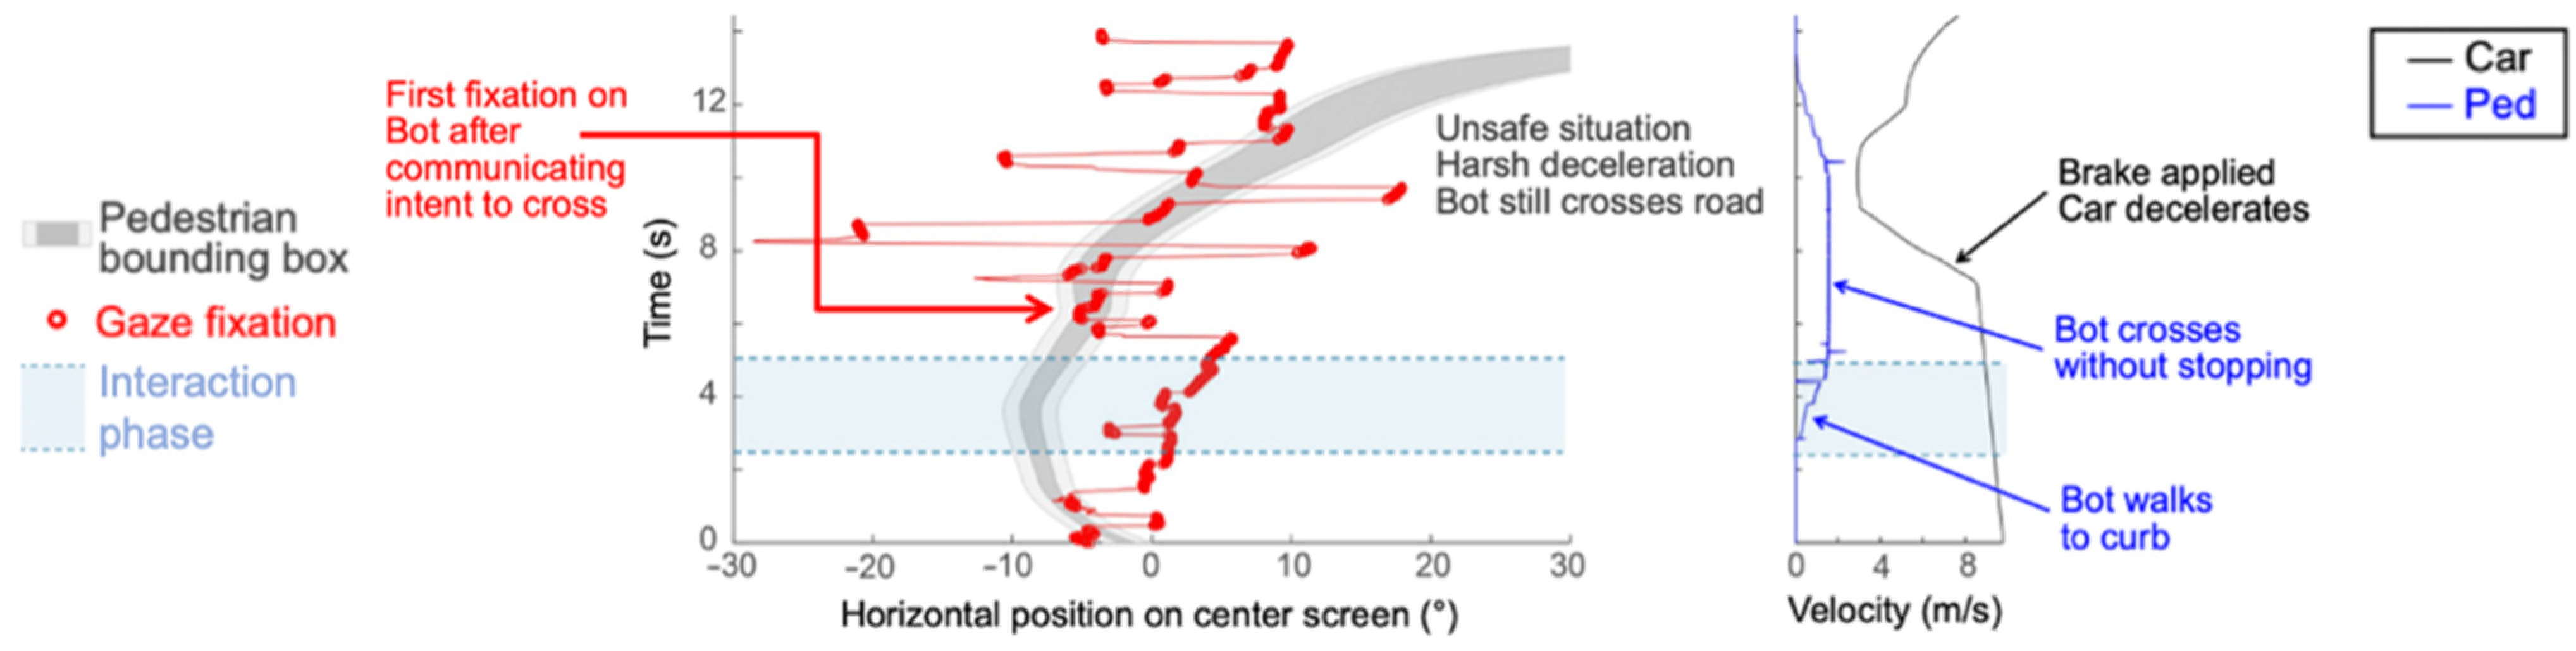
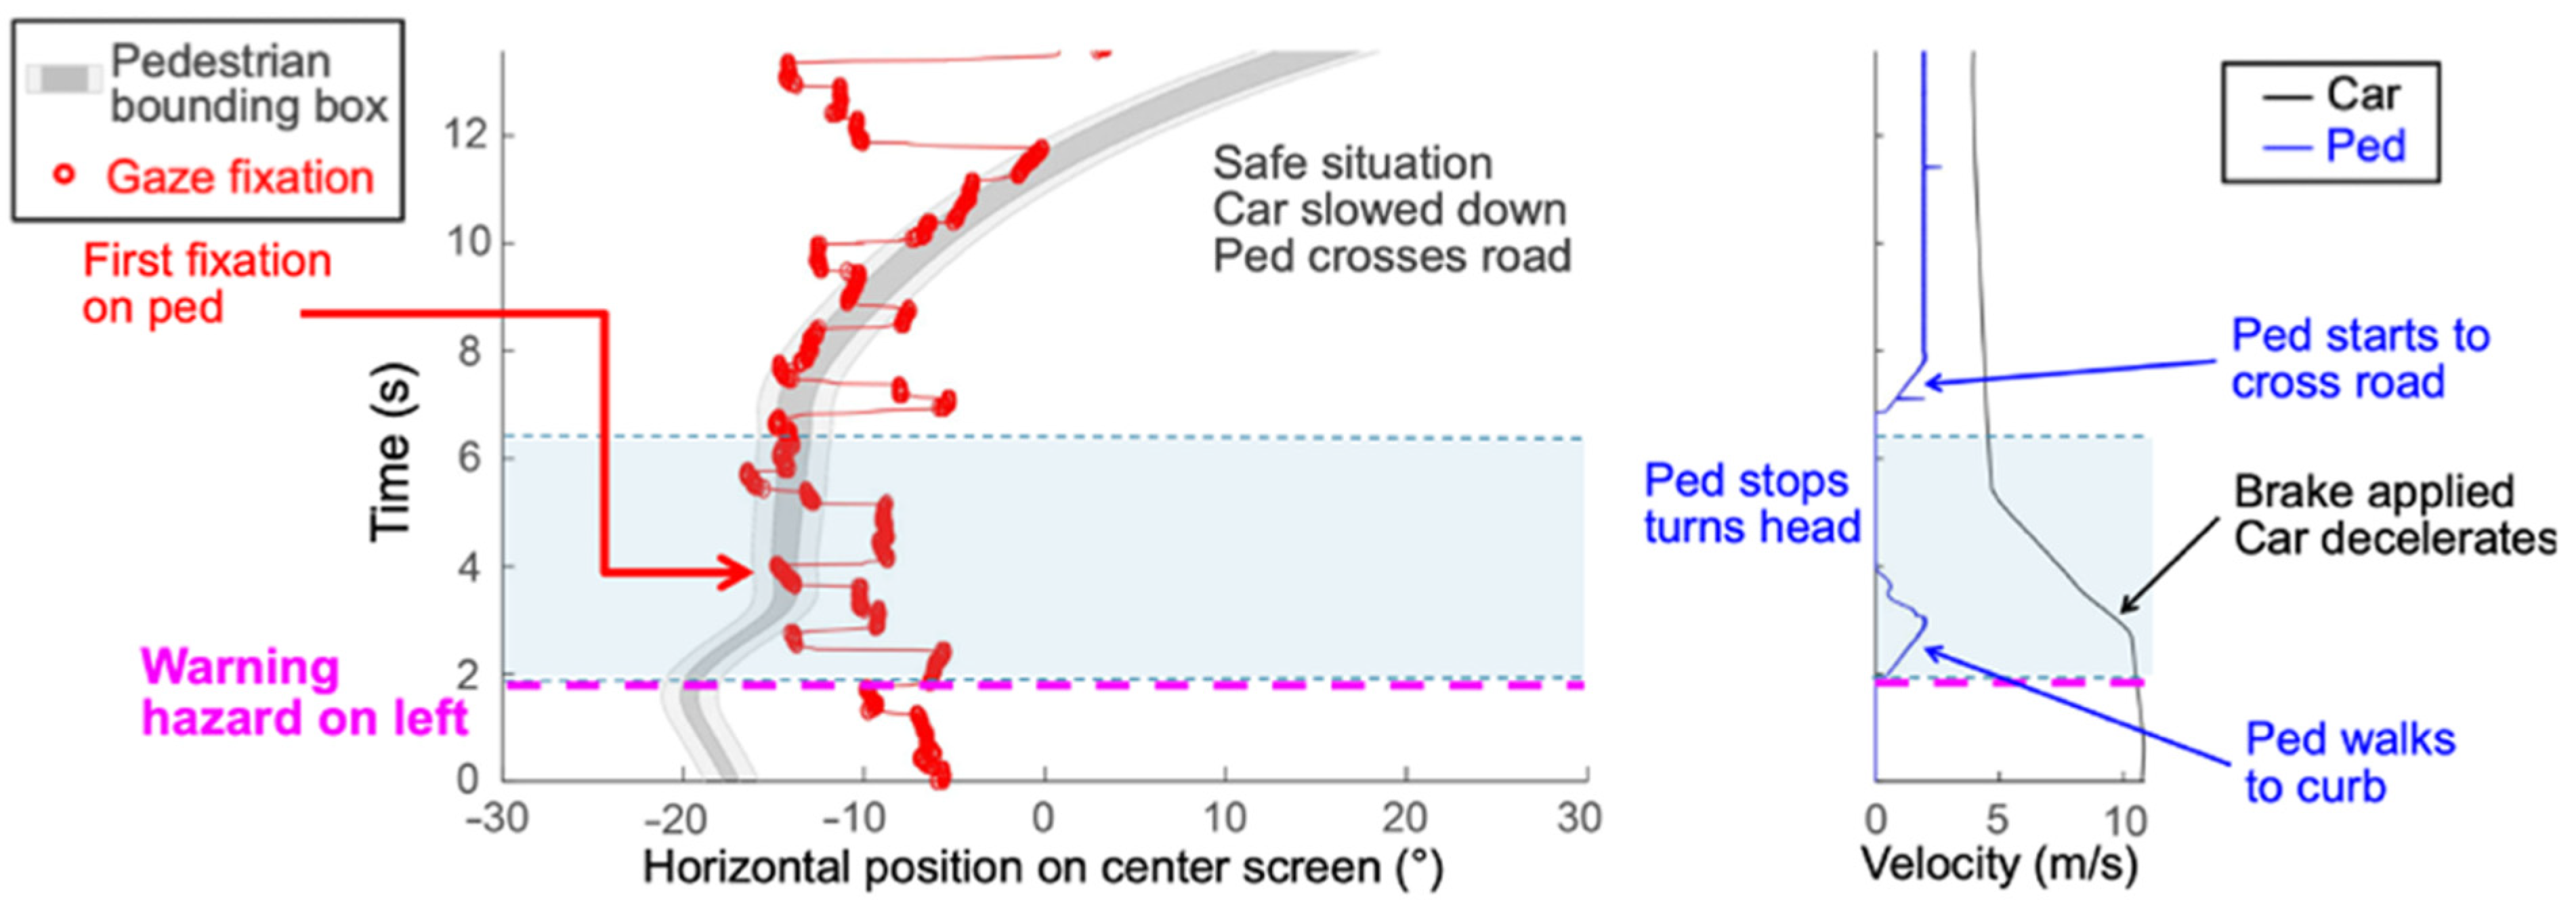
Gaze behaviors were quantified in terms of the amount of time for which gaze was on the pedestrian. To derive this measure, gaze position in the virtual scene was analyzed with regard to the onscreen position of the pedestrian. Lateral gaze position and lateral pedestrian position were first plotted as a function of time for each event (
Figure 5 left) along with the velocity profiles of the car and pedestrian (
Figure 5 right). Then, each event was divided into three time intervals: (1) the time directly prior to the interaction (pre); (2) the time during which the pedestrian was indicating the intention to cross, defined as the interaction (during); and (3) the time after the interaction (post). The first interval (pre) started at the point in time where the ADAS warning was either given (ADAS enabled) or would have been given (ADAS disabled). There was no actual movement of the pedestrian during this interval. The first interval ended and the second interval (during) started when the pedestrian made the first step toward the road, indicating the intention to cross. Once the Bot made the first step, it then continued walking without stopping, whereas the HCped stopped at the edge of the road, looked toward the car’s direction, and then either walked across the road or stayed on the sidewalk. Whether it stayed or walked depended on the human operator’s assessment of the safety of the planned crossing. The second time interval ended when the Bot or HCped took the first step onto the road. The third time interval (post) started at the end of the second time interval but was only defined for those situations where the pedestrian crossed the road without a collision. This time frame visualizes the section from the first step of the pedestrian onto the road until the driver started to accelerate the car after the pedestrian had crossed the driver’s travel lane.
The time for which gaze was on the pedestrian was determined for each of the three time intervals. It was expressed as the proportion of the total time for each interval, given that the duration of each time interval varied across participants and events depending on driving speeds and responses to the pedestrians. Eye-movement data points were classified “(...) as fixations when the driver’s gaze was within a 17-pixel distance on the simulator’s monitor to the previous data point and was below this threshold for a duration of over 100 ms” [
12,
22]. A digital bounding box, 1° larger than the pedestrian’s dimensions in the driving simulation display, was placed around the pedestrian. The gaze that fell within this bounding box was considered to be on the pedestrian (see
Figure 5 light gray area). Thus, a score of 0.0 in any particular time window indicated that the participant never looked at the pedestrian, while a score of 1.0 within any particular time window indicated that the participants looked only at the pedestrian. Additional gaze and driving behavior plots can be found in
Appendix A.
2.4.2. Safety of Each Event
Each of the 32 pedestrian crossing events was categorized as either safe or unsafe based on the driving behavior of the participant. To capture all aspects of unsafe driving situations in the analysis, several classical safety measures were combined to provide one overall classification. Thus, a crossing situation was rated as unsafe if at least one of the following five conditions was fulfilled:
A collision between the driver and pedestrian happened.
The assistant decided not to cross the road, because they rated the situation as unsafe to cross.
The Time-to-Collision (TTC) was below 1.5 s [
23].
The Post-Encroachment-Time (PET) was below 1 s [
24].
The Deceleration-to-Safety-Time (DST) exceeded 4 m/s
2 [
24].
For the safety classification, the TTC, PET, and DST were computed as continuous measures in order to provide a measure of the severity of a potential traffic conflict. In order to compute the TTC, the intersection of the trajectories of the pedestrian and the car was computed. The trajectories intersect when the pedestrian crosses the street. It was assumed that the trajectories of the pedestrian and car intersected at 90°. TTC, PET, and DST all factor in the driver’s speed. Therefore, the operating speeds of the participants were accounted for in the safety measures.
2.5. Statistical Analyses
Our analyses evaluated the effects of the advanced driver assistance system (ADAS on vs. ADAS off), crossing side (blind side vs. seeing side), and pedestrian type (Bot vs. HCped) on the safety of pedestrian events and the participant’s gaze behavior at each of the 256 crossing situations in our study. Binomial outcome variables—safety of crossing events (safe/unsafe) and event fixation rate (high/low fixation, described below)—were analyzed with Generalized Linear Mixed Models (GLMMs). GLMMs were used because continuous and categorical factors can be combined within the same statistical model. Furthermore, GLMMs can simultaneously account for differences in effects between participants and items [
25]. We included random effects structures for participants to account for any variability contributed by differences between participants. We also included random effects structures for unique pedestrian events to remove any random variability from differences between events. We aimed for a maximal random effects structure including random slopes and intercepts for all fixed effects and their interactions [
26]. The results we report are for the most complex random effects structure for which each model converged.
p-values for main effects were estimated using the lmerTest package [
27]. Any interactions between ADAS, crossing side, and pedestrian type were examined by model comparisons. For each interaction, a baseline model without interactions was compared with the same model, including the interaction of interest using analyses of variance (ANOVAs). The significance of the interaction of interest is represented by the resulting χ
2 values. Statistical analyses were conducted using R ×64 v3.3.3 and R Studio v1.0.143 [
28].
Since this was the first study of the vibro-tactile assistance system, we did not have any prior data on which to base a sample size calculation to determine the number of subjects needed to achieve a predetermined effect size for a given level of power. Instead, we recruited a convenience sample that was sufficient to demonstrate preliminary efficacy in a proof-of-concept study.
4. Discussion
In this proof-of-concept study, the effects of a vibro-tactile ADAS system on pedestrian street crossings and interactions between driver and pedestrian were investigated in the safe environment of a driving simulator. The ADAS system was designed to address difficulties that drivers with HVFDs have in responding to hazards because they lack peripheral vision on the side of their vision loss. We investigated the effects of the system on their gaze behavior and the safety of their responses to the pedestrian hazards.
4.1. Gaze Behaviors in Each Phase of the Pedestrian Crossings
The proportion of time that participants spent looking at the pedestrian depended on the phase of the pedestrian crossing event. They fixated the pedestrians least in the pre-phase but more in the during-phase and even more in the post-phase. With the decrease in the distance to the pedestrian, the rate of fixations increased. These results are consistent with the behavior of the pedestrians. In the pre-phase, the pedestrian did not show any sign that it was going to cross the road; therefore, participants did not spend much time looking at it. In drives with the ADAS engaged, the vibro-tactile warning occurred partway through the pre-phase depending on the speed of the car and the crossing side. This warning caused participants to make a scan to locate the pedestrian (
Figure 5), but they did not spend much time fixating the pedestrian until it indicated the intention to cross the road at the start of the interaction phase. It was during the interaction phase that the participant’s vehicle was sufficiently close to the pedestrian that the participant driver needed to monitor the behavior of the pedestrian and to start to modify their driving accordingly to ensure a safe crossing. Participants spent more time looking at the HCpeds than the Bots during the interaction phase. This is likely because the HCped made a head-turn toward the participant but did not immediately start to cross the road, so their behavior needed to be more closely monitored to determine whether they were going to start to cross the road. The assistant controlling the HCped waited to make a decision as to whether to cross based on the behavior of the approaching participant vehicle. In the post phase, the pedestrians were located in the central viewing field of the participants as they crossed the road. Most participants showed a cautious behavior as they waited for the pedestrians to cross and exit their driving lane. This increased the rate of fixations on pedestrians in the post phase.
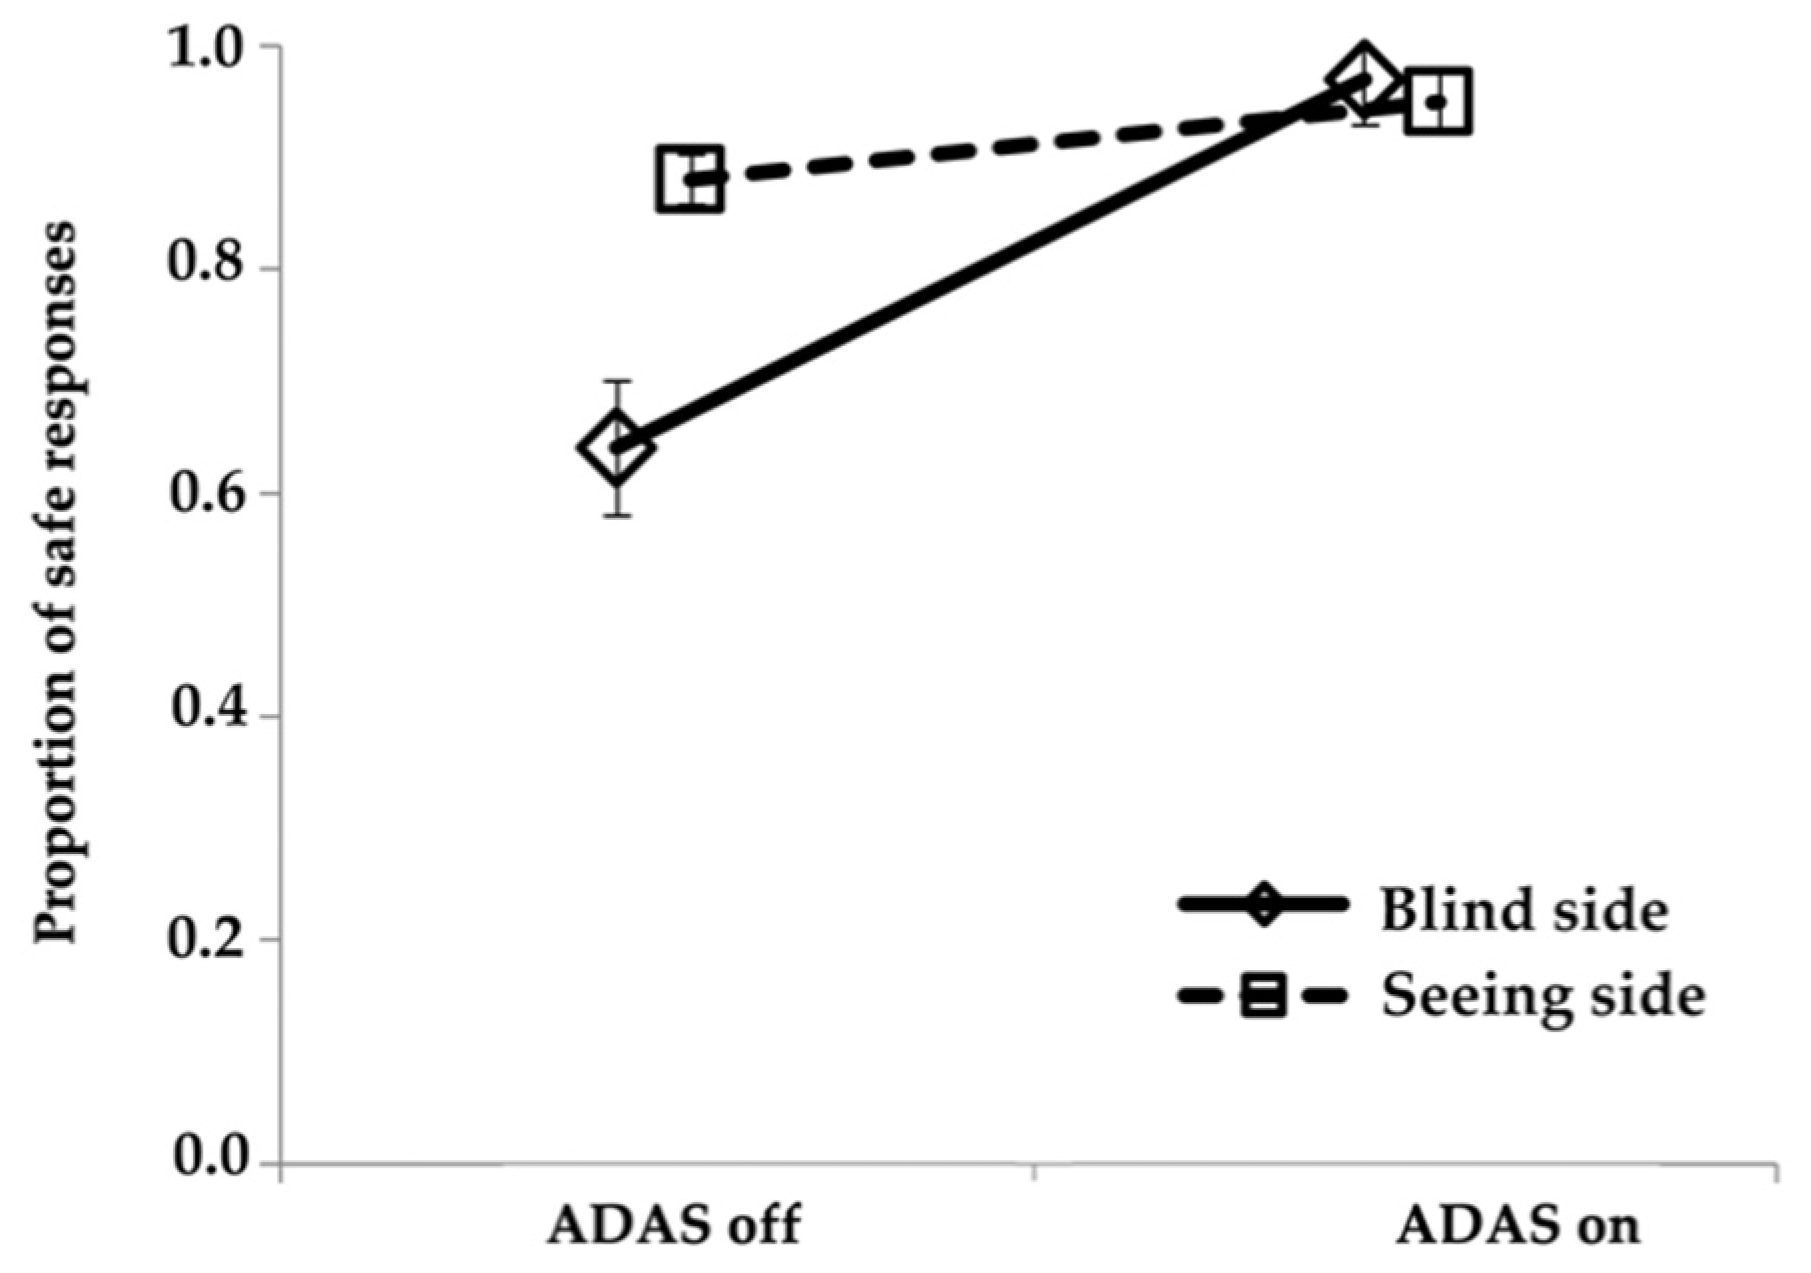
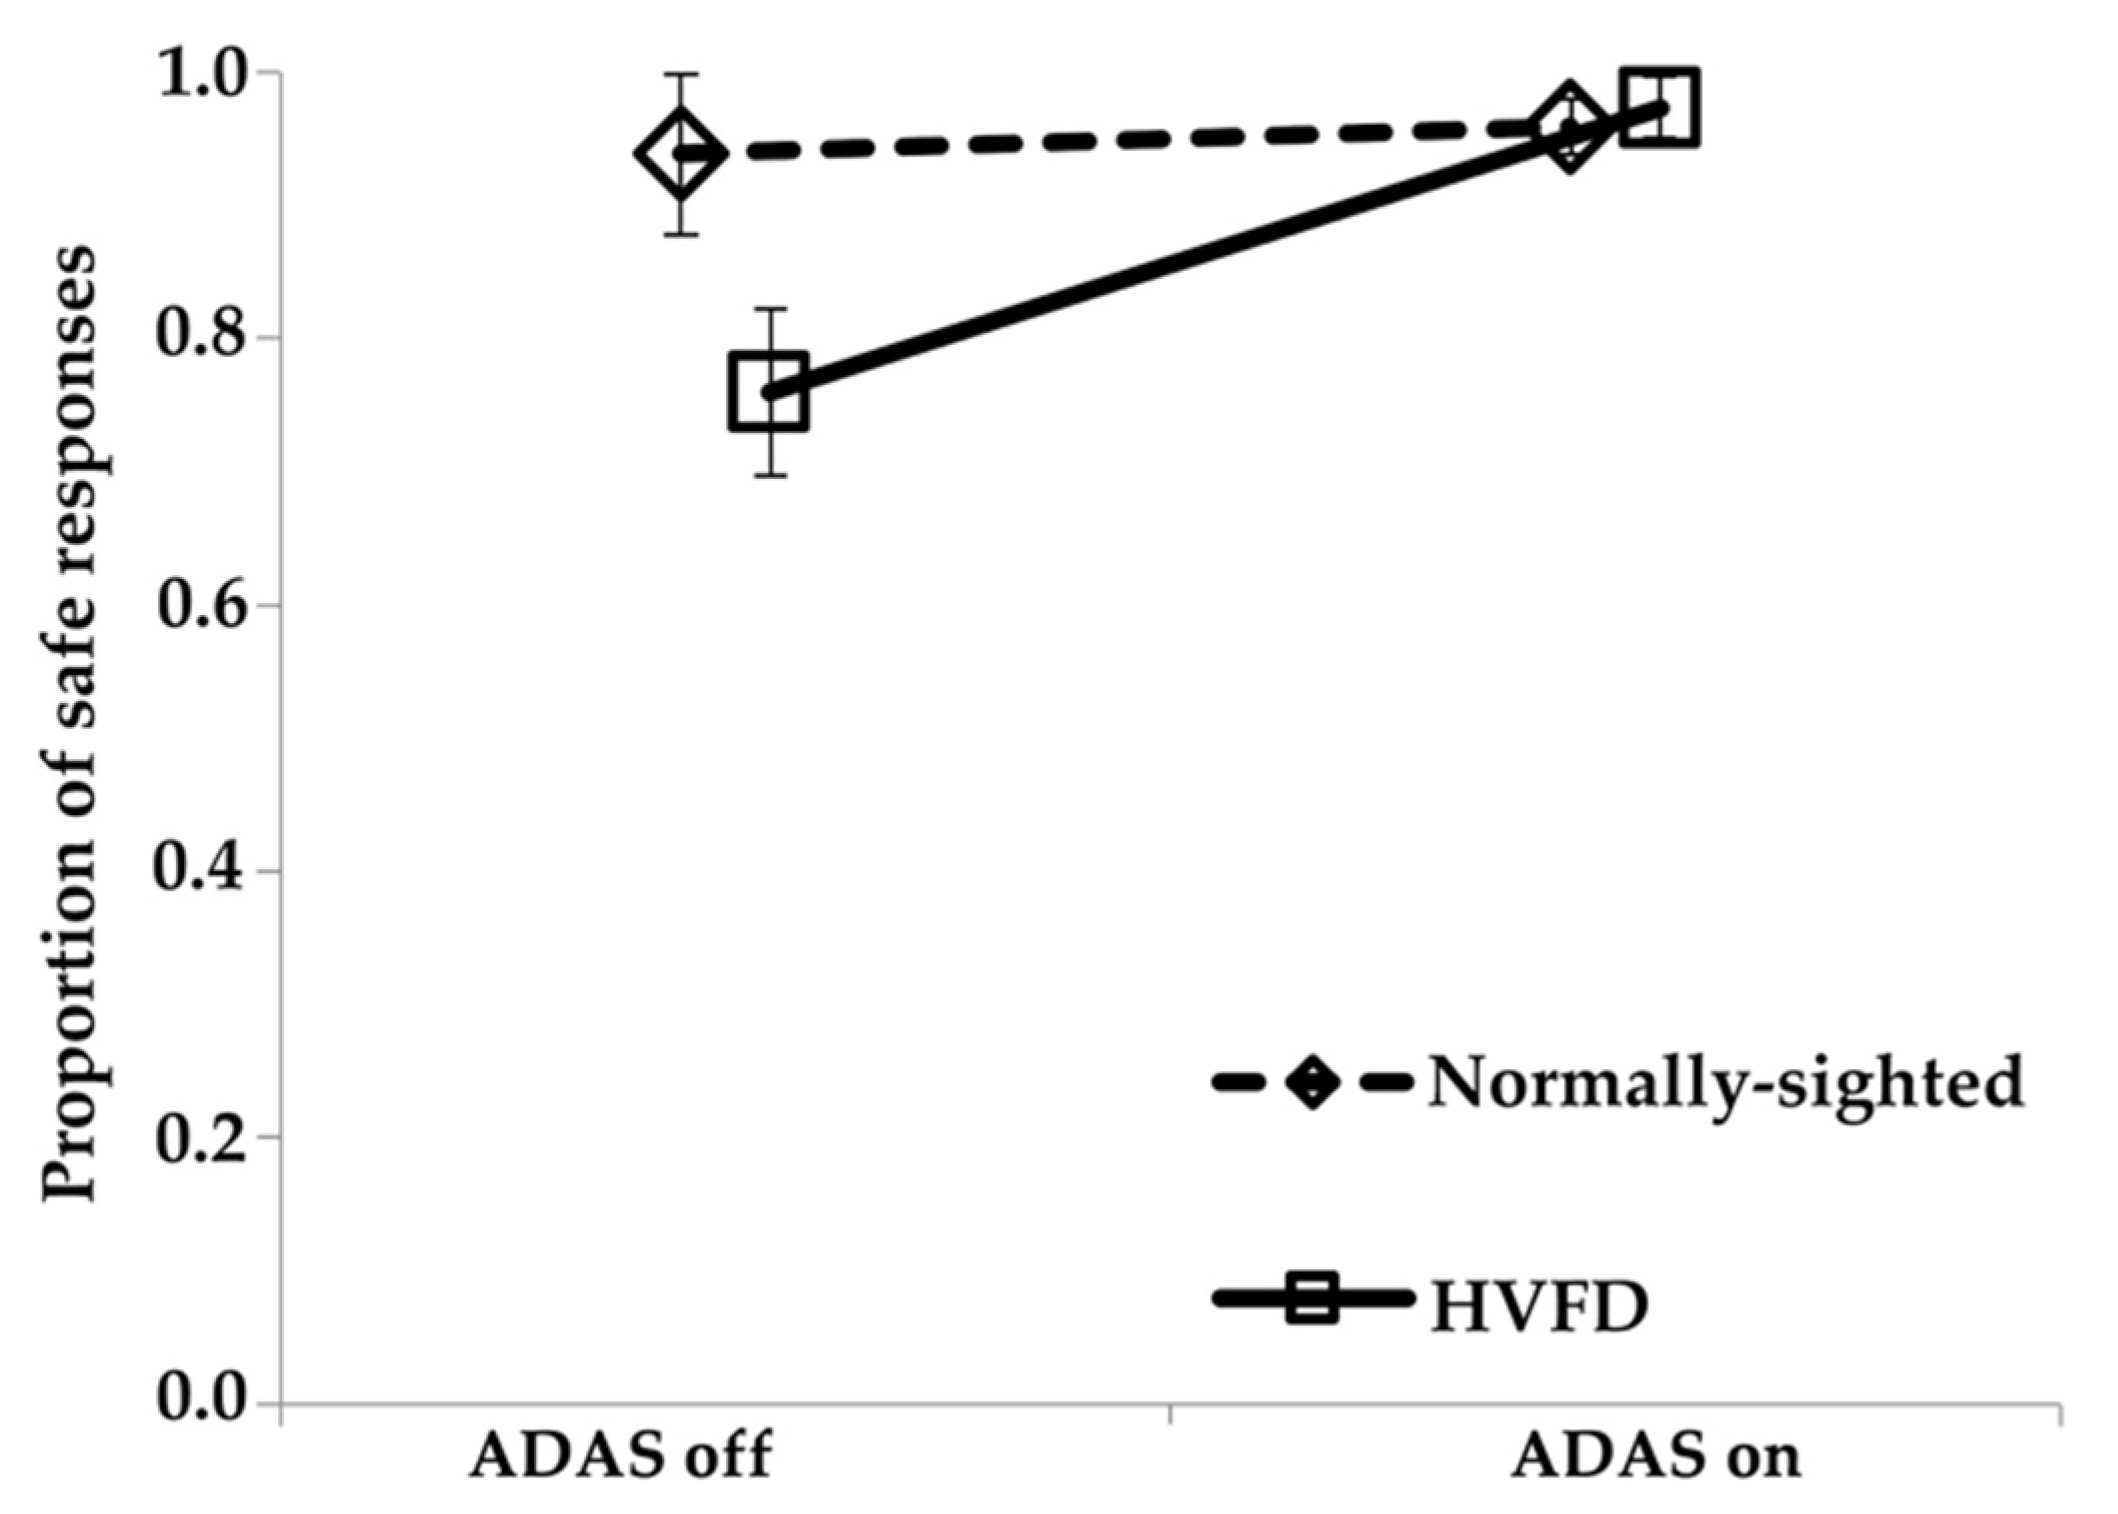
4.2. Safety of Crossings
For the safety of street crossings, the during-time interval was of primary interest. This was when the interaction between driver and pedestrian took place: with the onset of the during-time interval, the pedestrian made the first indication that it was going to cross the street. Overall, pedestrian crossings were more unsafe when HVFD participants drove than when normal vision participants drove. A total of 14.1% of situations were categorized as unsafe for HVFD participants compared to 4.5% for normal vision participants. However, a closer analysis showed that the unsafe crossings when HVFD participants drove mainly stemmed from those drives in which the vibro-tactile driver assistance system was not used (24.1% unsafe without ADAS as compared to 2.7% unsafe with ADAS). In the drives in which HVFD participants were warned by the vibro-tactile assistance system, pedestrian crossings were as safe as (or even safer) than those of the normally sighted drivers without vibro-tactile warnings. A possible interpretation of the safer street crossings with an engaged ADAS compared to no vibro-tactile warning is that participants were sensitized and aware of an upcoming street crossing. Their resulting rather cautious driving behavior induced crossing situations with a lower criticality. The ADAS guided the participant’s gaze and their attention toward the critical part of their field of view, i.e., the side from which the pedestrian was going to start the street crossing.
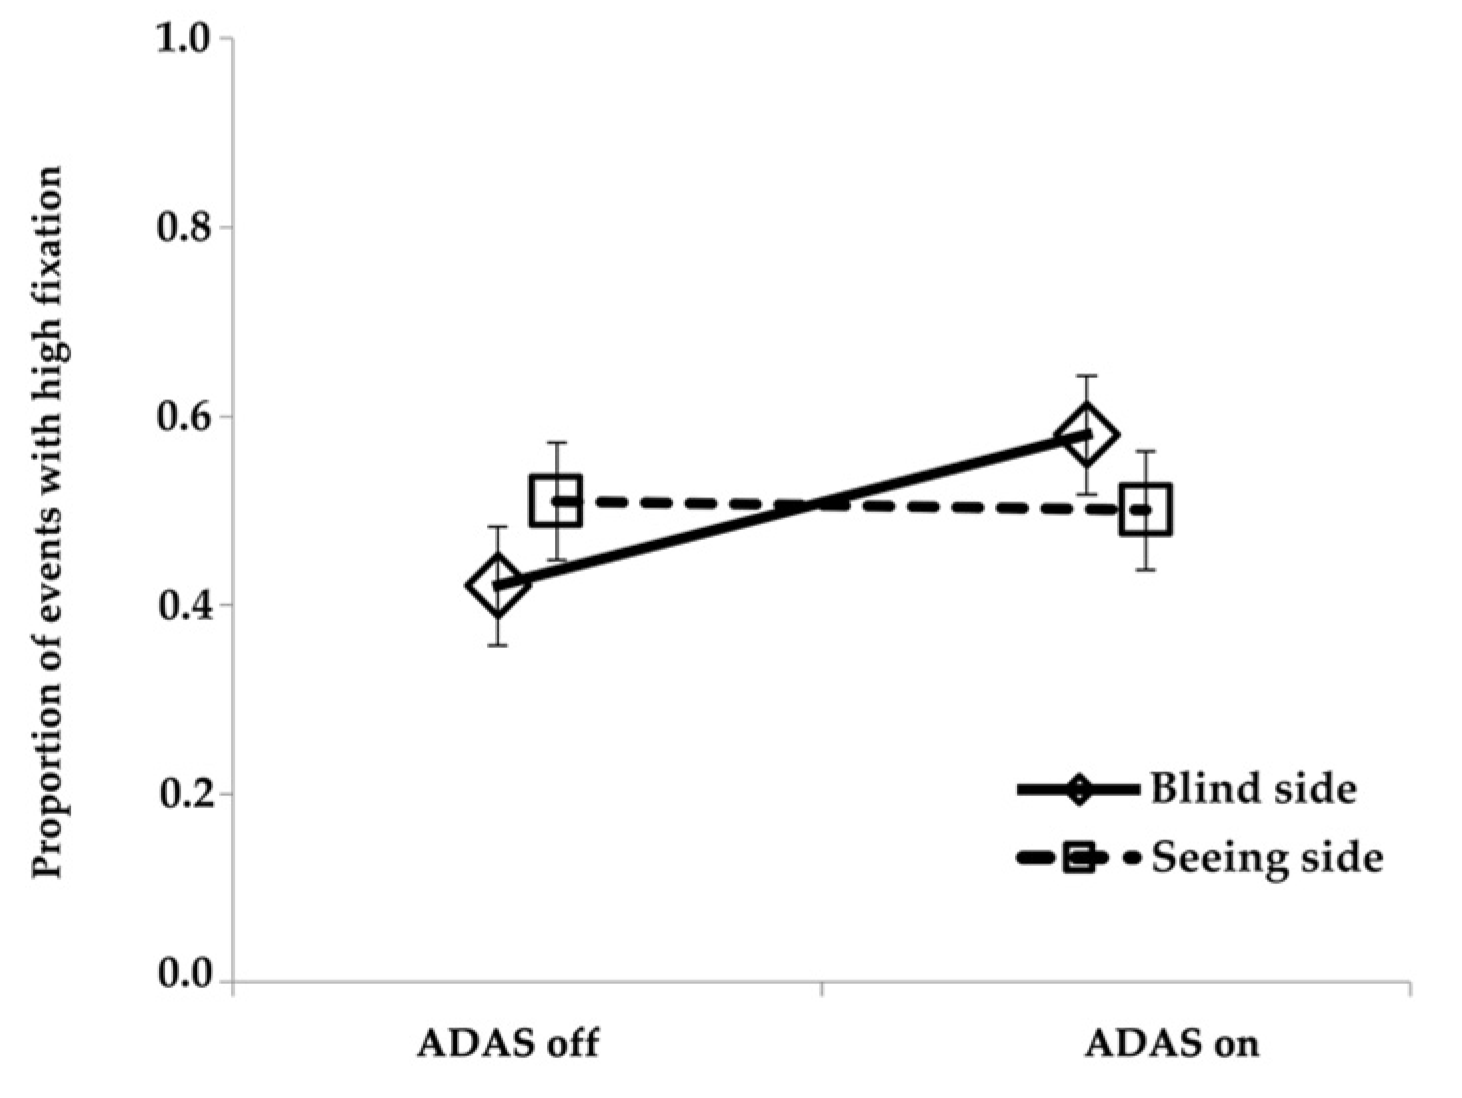
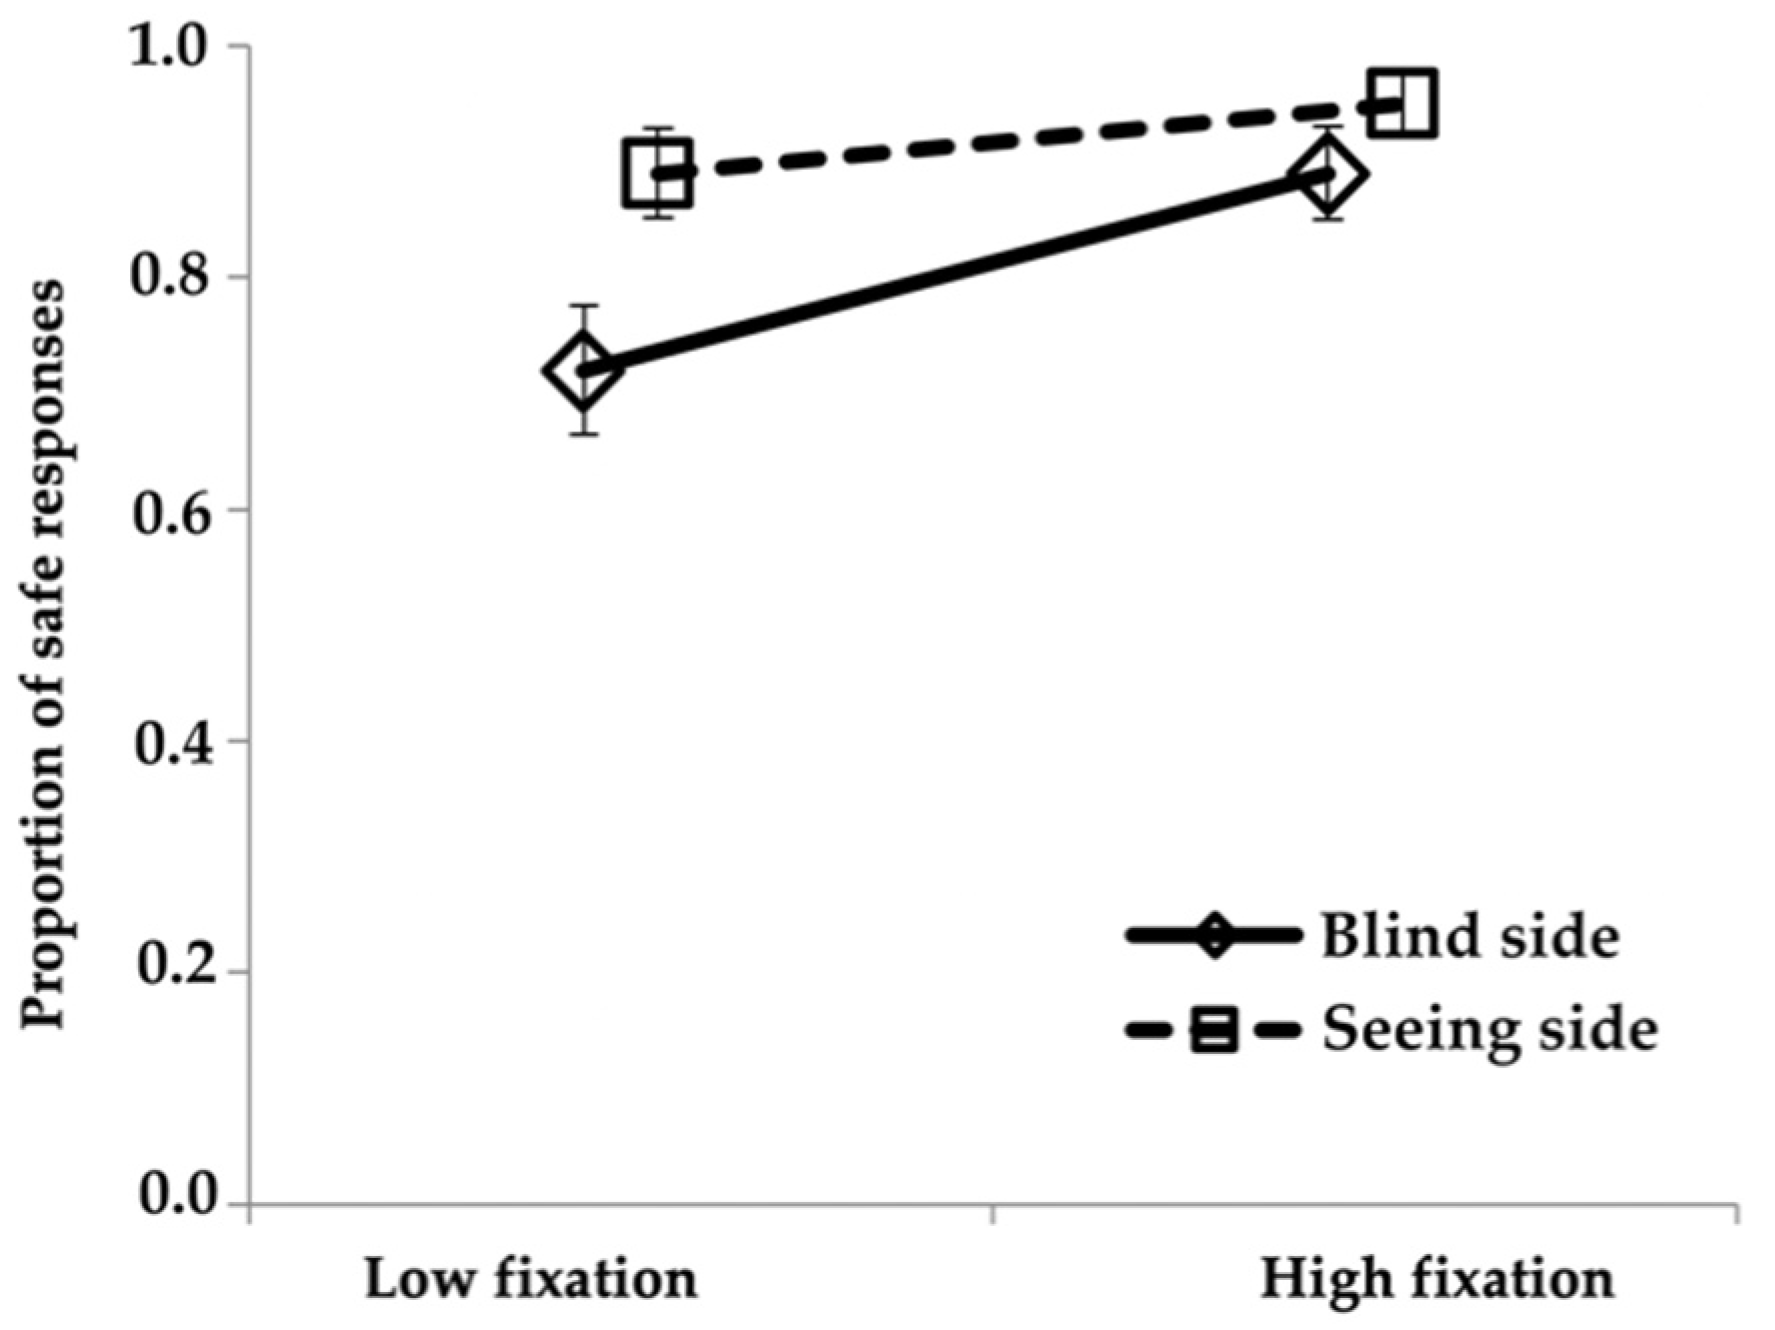
When driving without the ADAS engaged, HVFD participants had higher rates of unsafe crossings for pedestrians that started on their blind than seeing side (36% and 3%, respectively). However, when the ADAS was engaged, then crossings from the participants’ blind sides were as safe as from their seeing side. Consistent with our hypothesis, these findings indicate that the benefit of the ADAS on participants’ safety rates was greater on the blind side compared to the seeing side. With an engaged ADAS, participants were alerted that they needed to make a scan to the blind side to look for a potential hazard on that side. Thus, they fixated the pedestrians more on the blind side when the ADAS was engaged than when it was off, and there were fewer unsafe crossing situations. When the ADAS was off, HVFD participants spent a greater proportion of time looking at pedestrians on the seeing than on the blind side. However, when the ADAS was engaged, there was an increase in the proportion of time fixating pedestrians on the blind side but not the seeing side, providing direct evidence of the beneficial effects of the vibro-tactile cue in acting as a guide to warn HVFD drivers when they needed to make a scan to the blind side.
It could be argued that when the ADAS has already warned the participant of a potential hazard, an autonomous reaction of the car in case of a severe situation without intervention of the participant should be conducted. However, given the current state of ADAS technology and varying levels of automation on the road, it is important to investigate how much a warning alone might improve responses. We evaluated the response of drivers with impaired vision to a vibro-tactile ADAS in this study. From a technical point of view, a sufficient autonomous reaction of the car can furthermore currently not be guaranteed. As many states demand drivers to manually respond to driving situations, we deliberately focused on the driver–vehicle interaction after a vibro-tactile warning in this proof-of-concept study.
4.3. Methodological Limitations
The HVFD sample size of this proof-of-concept study was relatively small with only eight participants, and only one of them was a current driver. Differing characteristics of the visual field loss (hemianopia vs. quadrantanopia) and other individual factors such as age and the length of time since they last drove might have influenced scanning behaviors and the ADAS effects. Thus, participant was included as a random effect in our models. However, we did not have a sufficiently large sample size to separately evaluate the effects of individual factors. Nevertheless, our sample size was sufficient to provide evidence of the beneficial effects of the ADAS on responses to blind side hazards.
The design of a simulated driving environment is always a trade-off between reality and the possibilities of the synthetic virtual environment. Synthetic environments can lead to clear results, but they can also lead to non-realistic behaviors by participants. In contrast, realistic environments may have confounding factors that cannot be controlled, but they are more likely to produce more lifelike behavior. Hence, the external validity of driving simulators has been questioned [
29]. To address this, we attempted to create more realistic pedestrian scenarios by using the human-controlled pedestrian and always having the pedestrian start from the sidewalk, which necessitated different trigger distances for crossings from the two road sides, since the pedestrian on the left was at a longer distance from the potential collision point. In contrast, some prior driving simulator studies of HVFD participants used scenarios with symmetrical pedestrian situations [
5,
6]. The pedestrians appeared and started to cross at the same distance from the collision point on the left and right sides with identical trigger distances. However, the scenario was unrealistic in that pedestrians on the left appeared and started to cross the road from the middle of the adjacent driving lane (driving on the right). There was a standardized behavior plan for the HCped, but there was still more variability in the behavior of the HCped than the Bot since the human controlling the HCped had to make a decision as to whether it was safe to cross, whereas the Bot always behaved in exactly the same preprogrammed manner. Finally, it has to be noted that the six pedestrian crossings located in curves were excluded from the analysis in order to ensure appropriate and consistent hazard warnings in all analyzed crossing situations.
The developed assistance system used the same vibration pattern and intensity for all participants. Different sensitivities depending on physical properties or age are possible. For future studies, an analysis of the effect of different vibration intensities would be of interest. Additionally, the timing of the warning was given through fixed trigger distances. Using distance as a trigger leads to variations in actual timing depending on the speed of the car. We partly addressed this by instructing the participants to use a driving speed around the speed limit (40 km per hour). Adjusting the timing of the warning might have influenced the identified effects additionally. In this proof-of-concept study of the assistance system, the warning was given relatively early so that participants had sufficient time to look to the blind side and initiate a safe response. However, a more realistic warning system might not be able to identify a potential hazard as early in real-world driving. A consideration of the current state of the art of identifying a warning situation would be helpful for future studies.
5. Conclusions
People with HVFDs are excluded from driving in many countries. This leads to limitations in their personal mobility, which is oftentimes accompanied by a decreased flexibility in their professional lives, financial disadvantages, and lower quality of life. In countries that do allow people with HVFDs to drive, there may be an increased risk for collisions especially with vulnerable road users such as pedestrians.
In the current study, a vibro-tactile warning device was developed, implemented, and evaluated with the goal of improving the responses of HVFD drivers to pedestrians approaching from the blind side. The results suggest that the simple directional warnings were effective in directing the drivers’ gaze to the right place before a potential hazard occurred. More time was spent fixating pedestrians on the blind side when the ADAS was engaged, and the safety of street crossings from the blind side improved as a result. Consistent with our hypothesis, the ADAS effect was greater on the blind side than on the seeing side. When using the ADAS, crossings from the participants’ blind sides were as a safe as from their seeing side, and they were as safe as the crossings when the normally sighted participants were driving.
Despite the limited sample size, the results suggest that our methodology is robust and that the vibro-tactile ADAS is a promising approach to improving safety of drivers with HVFDs in road traffic. The findings of the current study provide strong evidence for further development of the ADAS system as well as future studies to quantify the effects of a vibro-tactile hazard warning system on the gaze and safety of HVFDs drivers in more challenging driving situations.


