The Italian Validation of OSCI: The Organizational and Safety Climate Inventory


1
Department of Educational Sciences, Section of Psychology, University of Catania, 95124 Catania, Italy
2
Kingston Business School, Kingston University, London KT2 7LB, UK
3
BRU-IUL, ISCTE-Instituto Universitário de Lisboa Organizational Behavior and Human Resources, 1649-026 Lisbon, Portugal
*
Author to whom correspondence should be addressed.
Safety 2021, 7(1), 22; https://0-doi-org.brum.beds.ac.uk/10.3390/safety7010022
Submission received: 29 December 2020
/
Revised: 5 February 2021
/
Accepted: 8 March 2021
/
Published: 16 March 2021
(This article belongs to the Special Issue Methods and Instruments for Evaluating and Measuring Safety)
Abstract
:Although safety climate has been the object of multiple studies in the last thirty years, the relationship between safety climate and organizational climate has been scarcely investigated. The Organizational and Safety Climate Inventory (OSCI) was the first and only validated instrument to allow the assessment of organizational and safety climates simultaneously and by using the same theoretical framework. The present work investigated the psychometric properties of OSCI in an Italian sample at the group level; study 1 (N = 745) examined the factor structure of the scale by using confirmatory factor analyses. Study 2 (N = 471) advanced the original Portuguese validation by testing its measurement equivalence across gender and company sector through multiple-group confirmatory factor analyses. Results confirmed one higher-order factor structure with four first-order factors for both Organizational Climate and Safety Climate, with Organizational Climate predicting Safety Climate. Moreover, the scale was found to be invariant between men and women and between different types of company. Reliability, discriminant, and criterion validities of the scale showed very good values. Overall, the findings strengthened the original claim of the OSCI to be a valid and innovative instrument, which allows the identification of specific dimensions of safety climate, starting from a more general model of organizational climate.
1. Introduction
In the last fifty years, the topic of safety and accidents prevention has been studied from many points of view, identifying both the importance of organizational climate [1,2,3] and of safety climate [3,4,5] in their intervening role on issues related to safety behaviors. If both climates have been demonstrated to have a fundamental role on safety performance and outcomes, it appears that the relationship between the two has not been sufficiently explored [6]. From an organizational perspective, organizational climate has been defined as the employees’ shared perceptions of and the meaning attached to the policies, practices, and procedures experienced within an organization [7,8,9].
Safety climate, instead, has been defined as a “particular type of organizational climate that could differentiate between low and high accident rate companies” [6] (p. 206). A climate for safety has been understood as the “summary of the molar perceptions that employees share about safety” [3] (p. 96), influencing appropriate and adaptive safe behavior. Following the most recent research, safety climate is now considered as a facet-specific type of organizational climate; in more detail, literature has now focused on the idea that organizations have several climates pertaining to specific aspects (such as climate for safety), and that global (i.e., organizational climate) and specific climates (i.e., safety climate) can show potential mutual influences [10]. However, the research in this area is only at an early stage [11].
With regards to the empirical investigation of the relationship between organizational and safety climates, the literature is very scarce, with one pioneering study from Neal et al. [12] that found organizational climate as a predictor of safety climate, which in turn is linked to safety performance. However, since the two instruments had different backgrounds(education and healthcare), it was not possible to explore the specific relationships between the two concepts [6] (p.206). Moreover, the authors did not use any of the existing valid instruments to measure safety climate. Besides, the sample was limited to one organization, specifically from the health-care sector (a hospital), which limited the external validity of the study [6]. Additional studies have found some elements pertaining to the perception of the general organizational environment as predictive of safety climate; for example, DeJoy et al. [13] found that communication and organizational support were strong contributors to employees’ perceptions of safety. At the same time, Wallace et al. [14], found that both management–employee relations and organizational support were antecedents of safety climate.
The analysis of the literature mentioned above highlights how validations of measures that consider the combined effectiveness of both organizational climate as a whole and specific facet-climates (i.e., safety climate) are very scarce; therefore, further investigation is needed to explore the relationship between the two constructs to enhance a correct assessment of predictors of safety behaviors.
Additional open issues concern the safety climate construct. Despite the number of reviews and meta-analytical studies available, research [15,16] has highlighted some remaining ambiguities, both from a theoretical and a methodological perspective. From a theoretical point of view, there is still no clarity about the indistinct use of the terms ‘safety culture’ and ’safety climate’ as if they were interchangeable [2,4,6,17,18]. From a methodological perspective, the main issue relates to the use of instruments and data analysis methods that do not always consider the multilevel nature of climate; as a consequence, this can lead to less effective organizational assessments, management systems and efforts to improve safety [19] (p. 184).
More recently, the above mentioned focus on the multilevel nature of climate has led to an increased awareness about the importance of considering safety climate as a group-level construct, therefore to be measured at the group-level [11,15]. This, in turn, called for the need to perform data analyses that are appropriate to the multilevel nature of climate [11,20].
Considering the issues mentioned above, the present study is aimed at validating an Italian version of the Organizational and Safety Climate Inventory (OSCII) of Silva et al. [6], with the aim of broadening the understanding of the relationship between global organizational climate and facet-specific safety climate and to consider organizational and safety climates at the group-level of analysis.
The inventory represents the only existing tool, to the best of the authors’ knowledge, to investigate both organizational and safety climates and to start from an organizational climate model in order to identify various dimensions of safety climate.
The choice of focusing on a validation in the Italian context is related to the fact that in Italy the incidence of accidents at work is still very high (National Institute for Insurance against Accidents at Work, 2019). In fact, in 2019, there were 645,000 accident reports in the workplace, with one trend of about 3 deaths per day. Although death rates have decreased over the years (1800 fewer cases in 2019 compared to the previous year), adequate measuring tools that can help prevent and intervene are needed.
In the following section, a more in-depth literature review of existing measurements of safety climate is presented.
2. The Measurement of Safety Climate
Until the early 2000s, the study of safety climate was characterized by a great diversity of instruments, probably resembling the diversity in the definition of the construct. This plurality may be explained by differences in the approach to the topic. Clarke [21] identified three distinct approaches to the study of safety climate: attitudinal, perceptual, and mixed (which combines attitudes and perceptions).
The main limitation that emerged is that the existing measurement scales were created only for specific industrial sectors (e.g., the manufacturing industry [22]) and that they referred to different dimensions across different studies (i.e., from questionnaires focused on perceptions of specific organizational safety practices to general statements about safety [23]).
In 2004, Silva et al. developed and validated the Organizational and Safety Climate Inventory (OSCI). The instrument was developed from a model of organizational climate as related to organizational culture, i.e., corresponding to an expression of culture [6,24]. This is in line with the previous literature [25] sustaining that the origin of an organizational climate relies in the culture of an organization and that organizational climate is a surface level of organizational culture [7,25,26]. Based on these assumptions, in the development of the tool, the authors employed the competing value model in order to identify both the strength and the content orientation of specific climates. More specifically, since climates are a manifestation of an organization’s underlying values [10,25,26], the competing value model represents a suitable way to characterize specific organizational climate dimensions based on the values for general or specific climates. As emphasized by Beus et al. [25], the competing values model is a “representative and well-supported delineation of strategically important organizational values” [25] (pp. 138, 139). In line with these assumptions, in the original study organizational climate was defined as shared perceptions about organizational values, norms, beliefs, practices and procedures [24,27,28,29,30], whereas safety climate was understood as shared perceptions about safety values, norms, beliefs, practices and procedures [27,30,31].
Following the perspective approach [10,24,32,33] in the development of the tool the authors have focused on a double layer: a general layer (which allows evaluation of the overall importance given to safety) and a specific layer (which allows identification of main orientations, practices and personal involvement with safety).
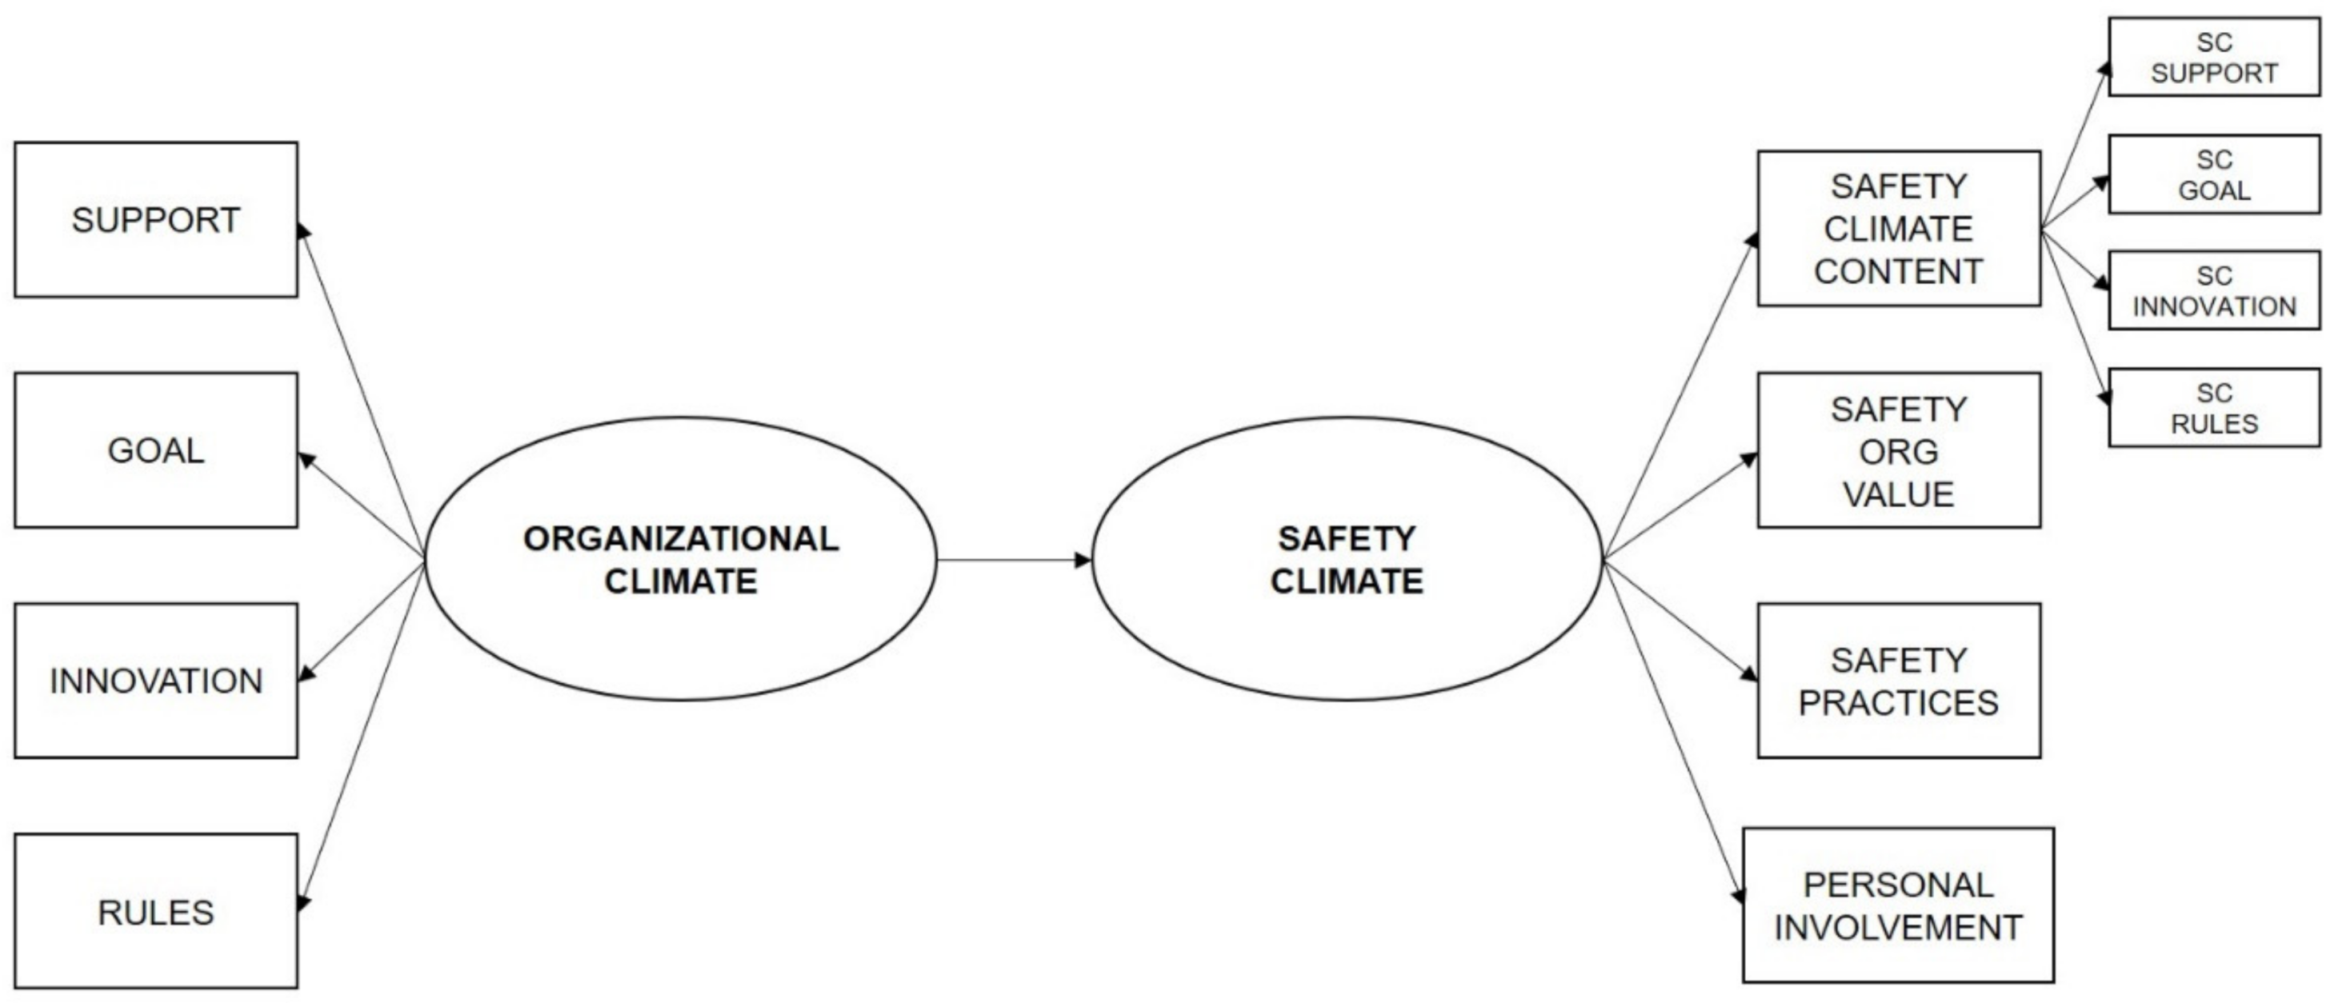
The authors employed the competing value model, in order to identify both the strength and the content orientation of specific climates. Following the model, organizational climate can be characterized according to two dimensions: internal versus external focus, and flexibility versus control. When put together, these two dimensions result in four climate content orientations (support, innovation, rules, goals), which can be used to analyze the perceptions of general organizational values and norms and specific safety values and norms [6].
The OSCI comprises two scales: an organizational climate questionnaire and a safety climate questionnaire. The instrument showed excellent psychometric properties in terms of construct validity, reliability, and predictive validity. Most importantly, it was the first instrument to use the same theoretical model to understand both climates, organizational and safety.
Furthermore, unlike the previous studies in the field, it was tested within fifteen organizations belonging to different sectors (from services to industry), therefore supporting its external validity.
Finally, the questionnaire included general and specific dimensions of safety climate, therefore allowing the identification of strengths or weaknesses at a more general level (i.e., general importance given to safety in terms of support, goals, innovation and rules) and at a more specific level (i.e., safety training); this aspect makes it a useful diagnostic and intervention tool for organizational safety [6].
Measurement of Safety Climate in the Italian Context
The present study chose to conduct an Italian validation of the OSCI because of the few existing studies in Italy within the safety field [11,34,35,36,37], as well as the scarcity of tools available in the Italian context.
With regards to the existing instruments, in 2013 Brondino et al. [38] developed and validated a questionnaire which combines different approaches to safety climate according to a multilevel approach. The authors proposed a questionnaire based on three safety climate scales (organizational, supervisor’s and co-workers’ scales) addressed to the metal-mechanical sector and specifically to blue-collar workers.
In 2015, Barbaranelli et al. [39] published a cross-cultural validation of the safety climate measure developed by Neal et al. [40]; specifically, the questionnaire was validated across Italy and US on employees belonging to different industry sectors. As stated by the authors, most of the research on safety climate has been conducted in countries with an Anglophone culture, where English is the first language, therefore highlighting the need for validation of safety climate measures in different cultures [39].
To the best of the author’s knowledge, only one study in the Italian context has linked organizational climate to safety climate, namely to a specific component, the managements’ values regarding safety [35]; more precisely, results found that the extent to which safety is a priority for the company is influenced by the affective and instrumental components of organizational climate. Therefore, positive social and interpersonal relationships among workers and structural aspects of the organization (i.e., hierarchy, structure, extrinsic rewards, and orientation toward success) appeared to have an impact on safety values at the management level, which in turn predicted the employees’ safety participation behaviors.
However, no studies have used the construct of organizational climate as linked to the whole construct of safety climate in the Italian context, nor they have used measurements specifically validated in that context. Additionally, further verification and validation of the psychometric properties of OSCI with advanced statistical procedures can make the instrument more robust for its use in those environments where there is a need for intervention in the field of accident prevention at work.
More specifically, although measurement equivalence is a prerequisite for examining cross-group differences, this assumption is not always examined when verifying the psychometric properties of a scale, particularly for comparing gender differences in safety climate perception. Nevertheless, gender differences have been found in individuals’ perceptions of risks [41], with males being more likely to behave in a risky way and be distracted when performing work tasks, and females generally perceiving a higher likelihood of negative outcomes or reporting higher levels of risk [42,43]. Gender differences were found in safety perceptions of hazard/accident scenes, indicating that females generally perceived a higher degree of danger [44]. However, only when the measurement equivalence of a scale is established researchers can proceed with examining mean group scores, having confidence that if any group differences are found, these are due to actual differences in safety perceptions and not to an artefact of measurement error [45].
Considering all these issues, the main aim of the present study is to contribute to the validation of an Italian adaptation of the OSCI inventory developed by Silva et al. [6] and it is particularly aimed at (1) examining its psychometric properties when applied to a different context; (2) exploring its measurement equivalence across gender and company sector [45,46]; (3) assessing its discriminant validity and criterion validity.
Firstly, we hypothesized that the OSCI inventory would show the same factor structure found in the study of Silva et al. (Hypothesis 1). Furthermore, we hypothesized that the Italian version of OSCII will show measurement equivalence [46] across gender and company sectors (Hypothesis 2); then we hypothesized that, for any two latent factors of the OSCI inventory, the variance extracted estimate for each factor will be higher than the shared variance between those two factors, therefore proving the discriminant validity of the scale (Hypothesis 3). Finally, we hypothesized that Organizational Climate would predict Safety Climate at the group level (Hypothesis 4) and that the OSCI inventory will show positive correlations with criterion-related variables (i.e., Engagement and Job satisfaction (Hypothesis 5), based on the previous literature. Specifically, Nahrgang et al. [47] found that not only safety climate did correlate with engagement, but it also accounted for a greater variance in engagement than other work factors (e.g., social support). With regards to job satisfaction, Morrow and Crum [48] found that workers’ perceptions of organizational safety predicted employees’ satisfaction. Clark [49] also found that the individual safety climate is directly related to employee’s job satisfaction; the author underlined how a positive safety climate is indicative that the basic need for safety at work is met, thus resulting in employees’ positive feelings towards their job (i.e., enhanced job satisfaction).
3. Method
3.1. Study 1
3.1.1. Participants and Procedure
Study 1 involved 745 employees (males were 45.6% of the total sample), belonging to thirteen organizations operating in different sectors (i.e., public administration, public and private health care, industrial, and retail) and organized into 29 working groups. Each group consisted of members belonging to a distinct division of the organization who were assigned to the same supervisor. Participants represented approximately 57% of the workforce of the companies involved, coming from different areas of Italy (North, 39%; Central, 12%; South, 49%). Their age ranged between 18 and 55 (Mage = 42.8, SD = 6.3). With reference to educational level, 38.1% of the sample has completed 13 years of school, whereas the remaining 61.9% had completed a minimum of 16 years of school. Research participants had an average seniority of 14.1 (SD = 3.8) and had an intermediate hierarchical position (56.3%), mostly skilled workers (35.1%). The study was conducted in accordance with the Declaration of Helsinki, and the protocol was authorized by the Internal Ethics Review Board of the Department of Educational Sciences (Section of Psychology) of the University of Catania; data were collected between April 2018 and September 2020 and the related research procedures followed all the indications provided by the guidelines of the AIP (Italian Association of Psychology) and its Ethical Council. The participation was voluntary. Questionnaires were administered individually and anonymously. Participants were recruited through convenience sampling; companies were contacted via written correspondence; once the approval from the HR department was given, a link to the survey was published in the companies’ social media groups (i.e., LinkedIn, Twitter) and they were also approached in workgroups via written correspondence (e.g., email or invitation by letter to participate). By clicking on the link, respondents were presented with a participant information sheet and an informed consent form, which, only once accepted, led to the survey with instructions on how to complete it.
3.1.2. Measures
The OSCI included 78 items divided in two questionnaires: OSCI—Organizational Climate Questionnaire and OSCI—Safety Climate Questionnaire.
OSCI—Organizational Climate Questionnaire. The organizational climate questionnaire (OCQ) included 30 items (e.g., “To what extent is it important in your company… the use of written instructions for carrying out the work”), covering four content dimensions (support, goals, rules, and innovation).
Support is characterized by an organizational emphasis on human resources, teamwork, and participation (7 items). The main goal is group maintenance [6].
Goals correspond to an emphasis on external control. The concern is to be productive, achieve goals and to dominate the market (9 items). The main goal is competitiveness [6].
Rules are characterized by an emphasis on control, but with a focus on the internal environment, thus revealing great stress on hierarchy power and stability (7 items). The main goal is the implementation of regulations [6].
Innovation represents an emphasis on flexibility toward the external environment, therefore on being innovative and encouraging individual initiative (7 items). The main goal is personal and organizational development [6].
The items for the whole scale were derived from the competing values model, based on Quinn’s (1988) diagnostic tool, the Portuguese version of FOCUS [50,51], and on the Portuguese Scale of Organizational Values [52].
Answers were given on a seven-point Likert-type scale (from 1 = “Not important at all” to 7 = “Extremely important”). An average score was computed for each content dimension; additionally, an organizational climate strength index was composed to allow the characterization of the overall climate strength. This index corresponds to the mean of the four content dimensions, where an overall higher score reflected a more positive organizational climate.
OSCI—Safety Climate Questionnaire. The safety climate questionnaire (SCQ) included four main scales: safety climate content, safety as an organizational value, organizational safety practices and personal involvement with safety [6].
Safety climate content. This scale is an adaptation of the OSCI organizational climate scale, and it covers the same four factors, but related to safety (i.e., support, goals, rules, and innovation). It includes 11 items (e.g., “In this company high value is attached to compliance with safety goals”). Silva et al. [6] reported a Cronbach’s alpha coefficient of 0.75.
Safety as an Organizational Value. This scale was created by the original authors of the OSCII [6] and it specifically assesses the importance attributed to safety in the company through five statements (e.g., “To what extent is people’s safety important in your company?”). Silva et al. [6] reported a Cronbach’s alpha coefficient of 0.83.
Organizational safety practices. This scale was developed following the items suggested by multiple authors [22,53,54] and it specifically measures relevant organizational safety behaviors. The 22 items of the scale are related to the management of safety activities, safety training, safety effectiveness, organizational learning regarding accidents, the quality of safety communications and the effects of required workspace on safety (e.g., “In this company there is adequate safety training”). Silva et al. [6] reported a Cronbach’s alpha coefficient of 0.77.
Personal Involvement with Safety. This scale was adapted from other instruments [22,55] and it is made up of eight items, in three dimensions: personal commitment to safety, safety internalization and safety pride (e.g., “In this company the people work in a safe manner, even when the supervisor is not present”) [35,36]. Silva et al. [6] reported a Cronbach’s alpha coefficient of 0.75.
All the items of the Safety Climate Questionnaire were answered using a 7-point Likert type scale, ranging from 1 = “totally disagree” to 7 = “totally agree”, where an overall higher score reflected a more positive safety climate.
A back-translation procedure has been used during the adaptation to the Italian language, following the recommendations made by Beaton et al. [56]. The procedure was as follows: translation and adaptation of the original scale from Portuguese to Italian, back translation, and review committee. A bilingual Italian-Portuguese interpreter translated the Portuguese version of the OSCI into Italian. This first Italian version was then translated back to Portuguese by a bilingual psychologist with a doctoral degree. The differences emerging from the comparison between the two versions were discussed and addressed by the research team and revisions to the Italian translation of the OSCI scale were made. There was no substantial difference between the final Italian version and the original Portuguese one.
A figure with the theoretical model of the instrument can be found in Appendix A.
A full list of the items, grouped in sub-factors, can be found in Appendix B.
Moreover, the following scale was introduced to verify the criterion validity of OSCI.
Work Engagement Scale. The work engagement scale (UWES-9) [57,58] investigates positive states of mind related to work and it is composed by three factors: Vigor, Dedication, and Absorption. Responses to items are given on a frequency scale varying from 0 = “never” to 6 = “always” (e.g., “I am enthusiastic about my job”) [58]. Balducci et al. [58] reported a Cronbach’s alpha coefficient of 0.92 for the Italian version of UWES-9.
3.1.3. Data Analysis
Linear structural equation models were calibrated to test the hypothesized model. Tests were completed in AMOS 26.0 [59] applying the maximum likelihood method.
A sequence of CFA (Confirmatory Factor Analysis) analyses was carried out on the dataset, to establish the best factor model to fit the data. Maximum likelihood was used as the estimation method.
The models’ goodness of fit was assessed through the Tucker Lewis Index (TLI), the Comparative Fit Index (CFI), the Root Mean Square Error of Approximation (RMSEA) and the Standardized Root Mean Square Residual (SRMR). RMSEA values close to 0.06 are indicative of good fit, values between 0.07 and 0.08 are considered as moderate fit, and values between 0.08 and 0.10 are indicative of marginal fit. With regards to CFI and TLI, higher values show better fit. CFI and TLI values above 0.95 show very good fit, values between 0.90 and 0.95 are indicative of marginally acceptable fit, and values lower than 0.90 indicate poor fit [60]. Furthermore, χ2 values and Δχ2 values between the competing models were presented, but they are sensitive to sample size [60], so Akaike Information Criterion (AIC) and Bayesian Information Criterion (BIC) were also presented (lower values indicate better fit). ΔCFI was also used with values not exceeding 0.01 indicating that the models are equivalent in terms of fit [61]. Furthermore, other statistical techniques were used, such as bivariate correlation, using SPSS 26.0. Homogeneity of climate perceptions was assessed with rwg [62,63], intraclass correlation (ICC (1) Anova Random Effect 1-way) and reliability of the mean (ICC(2) 2-way Anova Fixed effect) [64,65]. The reliabilities were assessed through McDonald’s omega (ω), Cronbach’s alpha (α), and Composite Reliability (CR). Both ω and α should be above 0.70, while CR should be above 0.50 [66]. The analyses were performed using SPSS 26, AMOS 26 and R version 4.0.4.
3.2. Study 2
3.2.1. Participants and Procedure
Study 2 involved 471 participants (56.3% were female), aged between 18 to 55 (Mage = 37.8, SD = 3.1), recruited from nine organizations in different sectors (i.e., public administration, public and private health care and industrial) organized into 13 work groups. As for study 1, each group consisted of members belonging to a distinct division of the organization who were assigned to the same supervisor. Research participants represented approximately 71% of the workforce of the companies involved. A minimum of 16 years of school had been completed by 72.2% of the sample. Participants had an average seniority of 13.9 years of work (SD = 5.3) and had an intermediate hierarchical position (82.8%). The participation was voluntary, and the same ethical steps and authorization applied as per study 1. Participation was voluntary. Questionnaires were administered individually and anonymously and the procedure to recruit participants and to collect data was the same as for study 1.
3.2.2. Measures
OSCI Safety Climate Inventory. The Organizational Safety Climate Questionnaire (OSCI) [6], already described in study 1, was used for this study.
The following scale was introduced to verify the criterion validity of the OSCI.
Generic Job Satisfaction Scale. The Generic Job Satisfaction Scale [67] measures the most relevant dimensions of job satisfaction. The scale is made of ten items and they are focused on employee’s feelings or reactions towards aspects of their jobs [67]. Each item was answered on a 5-point Likert scale varying from 1 = “strongly agree” to 5 = “strongly disagree” (e.g., “I feel good about my job”), loading on one single factor. Macdonald and Maclntyre [67] reported a Cronbach’s alpha coefficient of 0.77.
3.2.3. Data Analysis
Linear structural equation models [68] were calibrated to test the hypothesized model. Tests were completed in AMOS 26.0 through the maximum likelihood (ML) method. At first, we conducted a confirmatory factor analysis (CFA) to confirm the factor structure of the OSCI in an independent sample. Next, a series of multiple group CFAs were run (gender and type of company), in which increasingly stricter forms of measurement equivalence were tested [37,38]. By establishing whether factor loadings, intercepts and residual variances are equivalent in a factor model that measures a latent concept, it can be confirmed that “comparisons that are made on the latent variable are valid across groups” [69] (p. 3).
Discriminant validity between factors was assessed through the Fornell & Larcker technique [70], comparing the AVE of every latent construct with its shared variance with any other construct of the OSCI inventory. As suggested by Hair, Black and Babin [71], variance extracted estimates should be greater than the shared variance (e.g., squared correlation), showing that for any two constructs, the AVE for each of them has to be higher than the shared variance between them [72,73]. Reliabilities were assessed through McDonald’s omega (ω) and Cronbach’s alpha [66]. Other statistical analyses, such as correlations, were also performed, using SPSS 26.0 and R version 4.0.4.
4. Results
4.1. Study 1
4.1.1. Estimate Between-Group Level Variation and Homogeneity of Climate Perceptions
Rwg interpretation was based on Dunlap and colleagues’ [63] critical values of the rwg statistic, considering the group size and the number of categories. According to Dunlap et al. [63], groups with less than four members were excluded from the analysis.
Results in our sample (745 workers divided in 29 work groups) suggested acceptable homogeneity, namely median rwg = 0.87 for SCQ and rwg = 0.89 for OCQ. Moreover, ICC(1) = 0.73 (ranging from 0.73 to 0.77) and ICC(2) = 0.80 (ranging from 0.74 to 0.85) for SCQ, whereas ICC(1) = 0.77 (ranging from 0.75 to 0.81) and ICC(2) = 0.79 (ranging from 0.72 to 0.84) for OCQ.
This result indicated that within-group homogeneity and between-group variance were sufficiently high to justify the group-level analysis.
4.1.2. Confirmatory Factor Analysis
For Organizational Climate, a model with one second-order factor and four first-order factors (Model 1) was assessed and the following fit indexes were obtained: χ2(203) = 340.256, SRMR = 0.05, RMSEA = 0.06, CFI = 0.94, TLI = 0.91. Model 1 was then compared to a four-factor model (Model 2), made of four first-order factors with co-variances among them and the first model of the two displayed the best fit to the data, based on AIC and delta Chi-square value fit indices [Δχ2M1-M2(3) = 239.96]. Subsequently, Model 1 was compared to a one-factor Model (Model 3), where all the items were predicted by a single factor and the first again showed the best fit to the data [Δχ2M1-M3(12) = 356.14]. Furthermore, all factor loadings were significant at p < 0.001 and varied between 0.66 and 0.97, with a mean of 0.79.
The same procedure was carried out for Safety Climate, where a model with one second-order factor and four first-order factors (Model 1) was tested (χ2(217) = 568.252, SRMR = 0.04, RMSEA = 0.07, CFI = 0.96, TLI = 0.93) and was shown to best fit the data compared to a four-factor model, made of four first-order factors with co-variances among them (Model 2; Δχ2M1-M2(14) = 214.11) and to a one-factor Model (Model 3), where all the items were predicted by a single factor (Δχ2M1-M3(72) = 364.06). Moreover, all factor loadings were significant at p < 0.001 and varied between 0.59 and 0.86, with a mean of 0.73.
Detailed fit indexes for the tested models are shown in Table 1.
4.1.3. Relationship between Variables at the Individual and Group Level
Table 2 shows descriptive statistics and correlation matrix for the study variables, both at the individual and group level. The moderately high correlation between Organizational Climate and Safety Climate confirmed that they are two similar yet not identical constructs [6].
Moreover, the correlation results revealed that, at both the individual and group level, all the variables are positively associated with Engagement (Table 2).
Composite reliability and average variance extracted were: CR 0.96, AVE 0.72, for OC Support; CR 0.83, AVE 0.62, for OC Goal; CR 0.93, AVE 0.82, for OC Innovation; CR 0.85, AVE 0.68, for OC Rules; CR 0.97, AVE 0.74, for SOC; CR 0.84, AVE 0.62, for SCC; CR 0.90, AVE 0.75, for SOV; CR 0.94, AVE 0.73, for SP; CR 0.85, AVE 0.69, for PI and CR 0.82, AVE 0.63, for SSC. The two coefficients, Cronbach’s alpha (α) and McDonald’s omega (ω), both revealed identical values and, together with CR and AVE, indicated a very good overall internal consistency of the scale.
Overall, our first hypothesis was supported by the results, i.e., that the Italian version of the OSCI would present the same factor structure identified in the study of Silva et al (Hypothesis 1).
4.2. Study 2
4.2.1. CFA
The results of the CFA confirmed the goodness of fit of OSCI, as found in study 1.
Specifically, for Organizational Climate, a model with one second-order factor and four first-order factors was assessed, and the following fit indexes were obtained: χ2(203) = 532.593, p < 0.001; TLI = 0.91; CFI = 0.92; SRMR = 0.049; RMSEA = 0.075. Furthermore, all factor loadings were significant at p < 0.001 and varied between 0.51 and 0.86, with a mean of 0.69.
The same results were found for the Safety Climate scale: χ2(224) = 618.985, p < 0.001; TLI = 0.91; CFI = 0.94; SRMR = 0.041; RMSEA = 0.069. Additionally, all factor loadings were significant at p < 0.001 and varied between 0.67 and 0.91, with a mean of 0.74.
4.2.2. Multigroup Confirmatory Factor Analysis (MCFA) for Gender
The first MCFA enabled the testing of a model of configural invariance (Model 1) by simultaneously evaluating the fit of male and female samples for Organizational Climate and for Safety Climate.
For Organizational Climate, the fit indices (χ2(248) = 631.8, p < 0.001; TLI = 0.91; CFI = 0.94; SRMR = 0.049; RMSEA = 0.064) showed a good fit for this model, supporting an equivalent solution made of one second-order factor with four first-order factors in the data sets for both men and women (Table 3). The fit of this configural model provided the baseline value against which all the following equivalence models were compared [58].
Model 2 was tested for metric invariance (Table 3) and the results suggested that it could be considered equivalent to Model 1 (Δχ2M1-M2(11) = 46.81; ΔCFI = 0.001). Therefore, metric invariance was supported.
In addition, measurement scalar invariance (as tested by Model 3; Δχ2M3-M2(19) = 38.92, ΔCFI = 0.001) and error invariance (Model 4; Δχ2M4-M3(2) = 24.17, ΔCFI = 0.002) were found. The equivalence in factor variances was supported (Model 5; Δχ2M5-M4(9) = 70.42, ΔCFI = 0.000) as well as the equivalence in factor covariances (Model 6; Δχ2M6-M5(7) = 35.45, ΔCFI = 0.000).
The same procedure was performed for the Safety Climate scale. Model 1 was tested for configural invariance (χ2(256) = 735.412, p < 0.001; TLI = 0.91; CFI = 0.95; SRMR = 0.036; RMSEA = 0.054), showing a good fit for this model. Therefore, this supported an equivalent solution made of one second-order factor with four first-order factors in the data sets for both men and women (Table 3). Model 2 was tested for metric invariance. Δχ2M2-M1(12) = 18.44 and ΔCFI = 0.000 suggested that Model 2 could be considered equivalent to Model 1. Therefore, metric invariance was supported as well.
Scalar invariance (Model 3) and error invariance (Model 4) were found (Δχ2M3-M2(3) = 22.97, ΔCFI = 0.001; Δχ2M4-M3(16) = 75.79, ΔCFI = 0.002), as well as the equivalence in factor variances (Model 5; Δχ2M5-M4(11) = 25.9, ΔCFI = 0.001) and the equivalence in factor covariances (Model 6; Δχ2M6-M5(11) = 35.70, ΔCFI = 0.001).
Results were satisfactory as the model fit was demonstrated to be invariant across both populations; therefore Hypothesis 2 was tenable (Table 3).
4.2.3. MCFA for Company Sector
A second multi-group analysis was performed on a configural invariance model (Model 1), by simultaneously evaluating the fit of the scales across different company sectors (public administration, industrial and health-care sectors).
For Organizational climate, the fit indices indicated a good fit for this model (χ2(325) = 696.321, p < 0.001; TLI = 0.91; CFI = 0.94; SRMR = 0.042; RMSEA = 0.072), supporting an equivalent solution made of one second-order factor with four first-order factors for organizational climate across public administration, industrial and health-care sectors (Table 4). Metric equivalence was tested (Model 2) and was supported (Δχ2M1-M2(6) = 16.14; ΔCFI = 0.001). Scalar invariance (Model 3) and error invariance (Model 4) were also found (Δχ2M3-M2(21) = 24.01, ΔCFI = 0.001; Δχ2M4-M3(17) = 7.39, ΔCFI = 0.000). Both the equivalence in factor variances (Model 5; Δχ2M5-M4(18) = 52.25, ΔCFI = 0.001) and the equivalence in factor covariances (Model 6; Δχ2M6-M5(8) = 35.33, ΔCFI = 0.001) were tested and supported.
The same procedure was applied to the Safety Climate scale in order to test its invariance across different company sectors. Model 1 was tested for configural invariance (χ2(256) = 876.371, p < 0.001; TLI = 0.91; CFI = 0.95; SRMR = 0.036; RMSEA = 0.056), showing a good fit for this model and therefore supporting an equivalent solution made of one second-order factor with four first-order factors across public administration, industrial and health-care sectors (Table 4). Model 2 was tested for metric invariance; Δχ2M2-M1(12) = 21.99 and ΔCFI = 0.000 provided evidence to suggest that Model 2 could be considered equivalent to Model 1. Therefore, metric invariance was supported.
Scalar invariance (Model 3) and error invariance (Model 4) were found (Δχ2M3-M2(9) = 30.35, ΔCFI = 0.001; Δχ2M4-M3(11) = 13.76, ΔCFI = 0.001). The equivalence in factor variances was tested (Model 5) and shown to be supported (Δχ2M5-M4(10) = 14.9, ΔCFI = 0.001), as well as the equivalence in factor covariances (Model 6; Δχ2M6-M5(13) = 19.11, ΔCFI = 0.001).
Therefore, the model fit was proved to be invariant across company sectors, thus providing support for our Hypothesis 2 (Table 4).
4.2.4. Discriminant Validity
Discriminant validity among the latent factors [72] was assessed using the Fornell & Larcker [70] technique, through the comparison between the AVE of each construct and its shared variance with any other construct.
For Organizational Climate it was supported for all the four latent constructs, since the AVE for Support (0.64) and for Goal (0.74) was greater than the shared variance (e.g., square of the correlation) between the two constructs (0.36). Similar results were found for Support (AVE 0.68) and Innovation (AVE 0.71) compared to their shared variance (0.21). Support (AVE 0.65) and Rules (AVE 0.76) had a shared variance of 0.04, whereas Goal (AVE 0.56) and Innovation (AVE 0.70) had a shared variance of 0.07 and Goal (AVE 0.62) and Rules (AVE 0.79) had a shared variance of 0.05. Finally, Innovation (AVE 0.71) and Rules (AVE 0.79) had a shared variance of 0.07.
For Safety Climate, AVE for Safety Climate content (0.69) and for Safety Organizational Values (0.76) was shown to be greater than the shared variance (e.g., square of the correlation) between the two constructs (0.16). The same results were found for Safety Climate content (AVE 0.64) and Safety Practices (AVE 0.66) compared to their shared variance (0.15). Safety Climate content (AVE 0.68) and Personal Involvement (AVE 0.73) had a shared variance of 0.04, whereas Safety Organizational Values (AVE 0.56) and Safety Practices (AVE 0.68) had a shared variance of 0.05 and Safety Organizational Values (AVE 0.65) and Personal Involvement (AVE 0.74) had a shared variance of 0.03. Finally, Safety Practices (AVE 0.77) and Personal Involvement (AVE 0.70) had a shared variance of 0.06. Accordingly, Hypothesis 3 was supported.
4.2.5. Reliability, Criterion Validity and Relationships among Variables
Table 5 presents descriptive statistics, Cronbach’s alpha, McDonald’s omega, and bivariate correlations for the variables of Study 2. Cronbach’s alpha and McDonald’s omega showed identical values and indicated a very good internal consistency. As expected, the OSCI scales (Organizational Climate and Safety Climate) showed positive significant correlations with the criterion variable job-satisfaction.
Furthermore, a hierarchical regression was performed to verify the predicting role of organizational climate in explaining safety climate at the group level and following the theoretical model reported in Appendix A. Specifically, organizational climate was shown to predict safety climate at the group level (β = 0.45, p < 0.001).
5. Discussion
The aim of this study was to verify if there were different psychometric characteristics in the Organizational and Safety Climate Inventory when applied to the Italian context. Specifically, the focus was on the measurement and structural equivalence of the inventory across gender and company sectors and the assessment of different types of validity.
The importance of the present research is based on the fact that, although safety climate has been an object of study for the last 30 years, there is a lack of empirical research around the relationship between organizational and safety climates and the research available did not use a coherent theoretical approach.
Results of Study 1 have confirmed that one higher order factor, comprising four first order factors for Organizational Climate, and one higher order factor, comprising four first order factors for Safety Climate, would best fit the data for the Italian sample. This means that the Italian version of the OSCI inventory confirmed the stability of the factor structure verified in the Portuguese version.
Results of Study 2 found evidence for measurement invariance, metric invariance, uniqueness invariance, scalar invariance, and structural invariance, suggesting that organizational and safety climates were conceptualized in the same way across gender and company sectors and that the relationship between the constructs was the same across gender and company sectors (public administration, industrial and health-care sectors). This result is very important since most safety scales have only been used in the industrial sector (e.g., manufacturing).
These types of equivalence were not assessed in the original study in which the OSCI was developed [6]. Nevertheless, they were tested in the present study to advance the scale validation, as only when such equivalence is established is it possible to proceed with examining mean group differences (i.e., man/women differences in their perception of safety), having confidence that any group differences foundare caused by actual differences in climate perceptions and not by an artefact of measurement error [75].
The reliability of the scale, assessed by computing Cronbach’s alpha, McDonald’s omega, composite reliability and average variance extracted (given the multidimensionality of the scale) showed very good values in both Study 1 and Study 2. The Fornell and Larcker [70] technique was used to test discriminant validity between latent factors [72], and this was supported.
Furthermore, an innovative element of the measure is that it allows the characterization of safety climate in more general terms (by referring to the overall importance given to safety) and at the same time it helps to identify strengths or weaknesses at a more specific level (e.g., safety training). As revealed in Study 1 and Study 2, organizational climate was shown to predict safety climate at the group level (through the results of hierarchical regressions).
These results are relevant, because they follow the suggestions made by Neal et al. [12] about the relative impact of general and specific forms of climate in organizations, and they align to previous research [76] which revealed how strong positive organizational climates are associated with strong positive safety climates. More precisely, the present findings showed that the general organizational climate provides a context in which specific assessments of the importance of safety are made [40]. It is considered that, if group members perceive their organization as supportive of their general well-being, they are more likely to perceive that the organization assigns a similar importance to the safety of employees [40].
In terms of criterion validity, study 1 showed positive correlations between the dimensions of OSCI and work engagement at the individual and group level; at the same time, study 2 found positive correlations between all the dimensions of OSCI and job satisfaction at the individual and group level. This is in line with the previous literature, which demonstrated that, according to social exchange theory [77], employees respond in ways that match how they perceive they are treated by their organization [78]. Therefore, employees who work in a company with a positive safety climate might tend to perceive organizational commitment and support for safety as beneficial to their personal well-being (i.e., management cares about their employees). This will make them reciprocate by engaging in safer behaviors [79] and will also lead to other benefits beyond traditional safety outcomes, such as investing more personal resources into job performance (i.e., greater job satisfaction and engagement) [21,80,81,82].
The present findings enforce the representation of OSCI as the first instrument that allows direct testing of the relationship between an organization’s climate and its safety climate by using a unifying theoretical framework. Given the proliferation of different instruments to assess safety climate, the present study answered some questions about how to assess this and reinforced the consideration of OSCI as a diagnostic and intervention tool for organizational safety.
6. Limitations, Implications and Future Research
The present study has some limitations; first, some criticisms have been arisen towards reliance on self-report data, as it increases the likelihood of social desirability and common method bias [75]. Although statistical steps (Harman’s single-factor test) indicated that a single factor does not account for all co-variances among the items, it would be better for future research to use longitudinal research design as well as collecting data from separate sources (i.e., including objective data about accidents and micro accidents).
Nevertheless, the aggregation at the group level reduced the likelihood of social desirability; moreover, it is important that the organizational level of analysis is considered by future research, through an increase in the number of companies involved, due to the limited number of organizations participating in the present study. On the limitations of the measurement level, future research should also consider the possibility of performing cross-level statistical analyses, in accordance with the multilevel nature of safety climate. Assuming that employees distinguish between policies defined by top management and their translation into practices by supervisors as well as the influence of peers, it is possible to understand how important it is to adequately analyze the cross-level influences of all those different agents on the individual and group performance. As stated by Beus et al., “this would likewise bolster empirical findings because the independent variables would be assessed at the appropriate theoretical level of analysis” [25] (p. 363).
An additional limitation was the convenience sample, which limited the external validity of the results. This means the findings cannot be generalized to populations that differ from the population that was conveniently accessible, and which the sample was based on. This also implies that the results obtained in convenience samples might be biased, i.e., they are not reflective of true effects among the target population because the sample is not sufficiently representative of the target population.
Despite these limitations, the significant results suggest some important implication for practice.
First, the study has proven that safety climate is related to general organizational climate, therefore perceptions of safety climate appear to be made within the context of a general organizational climate. This finding highlights that interventions aimed at developing a more positive organizational climate can also affect safety climate and, conversely, interventions specifically focused on improving safety climate will be more effective when they are conducted within a general positive climate [40]. Therefore, in order to improve safety climate, managers have to understand which elements of the general environment within the organization cause these differences in perception.
Secondly, the present research focused on the group-level (instead of the individual level); in line with recent literature [83], it underlined the importance of future safety intervention being focused on the team [11]. Indeed, research has shown that the more ambiguous the target of perceptions about organizational context, the more individuals base these evaluations on group information [83].
In the future, further research should be undertaken to determine if OSCI predicts safety (compliance and participation) and outcomes (accidents and micro accidents); moreover, it would be useful to verify whether it presents stability over time.
Author Contributions
Conceptualization and methodology, S.P. and S.A.S.; resources, investigation and formal analysis, S.P.; writing—original draft preparation, A.P. and S.P.; writing—review and editing, A.P. and S.P. All authors have read and agreed to the published version of the manuscript.
Funding
This research received no external funding.
Institutional Review Board Statement
The study was conducted according to the guidelines of the Declaration of Helsinki, and approved by the Internal Ethics Review Board of the Department of Educational Sciences (Section of Psychology) of University of Catania (2018-04).
Informed Consent Statement
Informed consent was obtained from all subjects involved in the study.
Data Availability Statement
The data presented in this study are available on request from the corresponding author.
Conflicts of Interest
The authors declare no conflict of interest.
Appendix A
Figure A1.
Theoretical Model of the Organizational and Safety Climate Inventory (OSCI.)

Appendix B

Table A1.
List of items in English and Italian language.
| English Version | Italian Version |
|---|---|
| Organizational Climate | |
| Support | Supporto |
| To what extent is it important in your company… …good relations between the workers. | Fino a che punto… …. è importante nella tua azienda la buona relazione tra i lavoratori. |
| To what extent is it important in your company… …teamwork. | Fino a che punto … …è importante nella tua azienda il lavoro di squadra. |
| The management of this company says one should… …work in teams. | La direzione di questa azienda dice che si dovrebbe… …lavorare in gruppo. |
| To what extent is it important in your company… … listening to people’s opinions. | Fino a che punto è importante nella tua azienda… …ascoltare le opinioni delle persone. |
| The management of this company says one should… …pay attention to the workers’ well-being. | La direzione di questa azienda dice che si dovrebbe… …prestare attenzione al benessere dei lavoratori. |
| In this company… …the people ask for help on issues of safety whenever they need. | In questa azienda… … le persone chiedono aiuto su questioni di sicurezza ogni volta che ne hanno bisogno. |
| In this company… …in order to be promoted or rewarded, one needs to be able to work in a team. | In questa azienda… … per essere promossi o premiati, bisogna essere in grado di lavorare in team. |
| Goal | Obiettivo |
| To what extent is it important in your company… …competitiveness with other companies. | Fino a che punto è importante nella tua azienda… … la competitività con le altre aziende. |
| To what extent is it important in your company… …productivity. | Fino a che punto è importante nella tua azienda… … la produttività. |
| The management of this company says one should… …follow work goals. | La direzione di questa azienda dice che si dovrebbero… … seguire gli obiettivi lavorativi. |
| To what extent is it important in your company… …achieving defined objectives. | Fino a che punto è importante nella tua azienda… … il raggiungimento degli obbiettivi. |
| To what extent is it important in your company …control of workers’ performance. | Fino a che punto è importante nella tua azienda… … il controllo delle prestazioni dei lavoratori. |
| The management of this company says one should… …be very productive. | La direzione di questa azienda dice che si dovrebbe… … essere produttivi. |
| The management of this company says one should… …participate with suggestions to improve the company. | La direzione di questa azienda dice che si dovrebbe… …partecipare con suggerimenti per migliorare la società. |
| In this company one should… …maintain safety behaviors even when one wants to increase production. | In questa azienda si dovrebbero… … mantenere comportamenti di sicurezza anche quando si vuole aumentare la produzione. |
| In this company, in order to be promoted or rewarded, one needs to… …follow work goals. | In questa azienda, per essere promossi o premiati, bisogna…. …seguire gli obiettivi lavorativi. |
| Innovation | Innovazione |
| To what extent is it important in your company… …product/service innovation | Fino a che punto è importante nella tua azienda… … l’innovazione del servizio/prodotto |
| To what extent is it important in your company… …technological development. | Fino a che punto è importante nella tua azienda… … lo sviluppo tecnologico. |
| The management of this company says one should… …contribute with innovative suggestions to carry out the work. | La direzione di questa azienda dice che si dovrebbe… …contribuire con suggerimenti innovativi per eseguire il lavoro. |
| In this company… …opportunity should be given for the emergence of new ideas designed to increase safety at work. | In questa azienda… …dovrebbe essere data la possibilità per la nascita di nuove idee destinate ad aumentare la sicurezza sul lavoro. |
| To what extent is it important in your company… …incentivating new ideas for improving the company products/services. | Fino a che punto è importante nella tua azienda… …l’incentivazione di nuove idee per migliorare i prodotti/servizi aziendali. |
| The management of this company says one should… …innovate technologically. | La direzione di questa azienda dice che si dovrebbe… …essere tecnologicamente innovativi. |
| In this company, in order to be promoted or rewarded, one needs to… … be innovative and creative. | In questa azienda, per essere promossi o premiati, bisogna… …essere innovativi e creativi. |
| Rules | Regole |
| To what extent is it important in your company… …the use of written instructions for carrying out the work. | Fino a che punto è importante nella tua azienda… …l’uso di istruzioni scritte per la realizzazione del lavoro. |
| To what extent is it important in your company… …establishing clear procedures for performing work tasks. | Fino a che punto è importante nella tua azienda… …stabilire procedure chiare per l’esecuzione di attività lavorative. |
| The management of this company says one should… …comply with the rules defined for carrying out the work. | La direzione di questa azienda dice che si dovrebbero… …rispettare regole definite per l’esecuzione dei lavori. |
| To what extent is it important in your company… …strictly following existing company rules. | Fino a che punto è importante nella tua azienda… …l’esecuzione rigorosa delle regole aziendali esistenti. |
| The management of this company says one should… …work in accordance with the safety rules. | La direzione di questa azienda dice che si dovrebbe… …lavorare in conformità con le norme di sicurezza. |
| In this company… …we should comply better with safety procedures. | In questa azienda… …dovremmo rispettare maggiormente le procedure di sicurezza. |
| In this company, in order to be promoted or rewarded, one needs to… …follow company rules. | In questa azienda, per essere promossi o premiati… …è necessario seguire le regole aziendali. |
| Safety Climate questionnaire | Questionario clima di sicurezza |
| Safety Climate Content scale | Scala del contenuto del clima di sicurezza |
| Support | Supporto |
| In this company… …workers’ well-being and safety is highly valued. | In questa azienda… …il benessere e la sicurezza dei lavoratori sono altamente tenuti in considerazione. |
| In this company… …workers’ ideas and opinions on safety are requested and utilized. | In questa azienda… …vengono richieste e utilizzate le idee e le opinioni dei lavoratori sulla sicurezza. |
| In this company the people… …work in a safe manner, even when the supervisor is not present. | In questa azienda… …le persone lavorano in modo sicuro, anche quando il supervisore non è presente. |
| In this company the people… … help each other to work in a safe manner. | In questa azienda le persone… si aiutano a vicenda per lavorare in modo sicuro. |
| Goal | Goal |
| In this company… …it is usual to make goals explicit in terms of safety and reduction of the number of accidents. | In questa azienda… …. si è soliti programmare obbiettivi in termini di sicurezza e riduzione del numero di incidenti. |
| In this company… …high value is attached to compliance with safety goals. | In questa azienda l’alto valore è collegato al rispetto degli obbiettivi di sicurezza. |
| Innovation | Innovazione |
| In this company… ...it is usual to introduce new safety standards, updated as a function of what is done in other countries. | In questa azienda… …si è soliti introdurre nuovi standard di sicurezza, aggiornati in funzione di ciò che viene fatto in altri contesti. |
| In this company… …high value is attached to expressing new ideas in relation to safety. | In questa azienda… …l’alto valore è collegato al rispetto degli obbiettivi di sicurezza. |
| Rules | Regole |
| In this company… …it is usual to control compliance with the safety norms defined by company rules. | In questa azienda… .. si è soliti controllare il rispetto delle norme di sicurezza definiti dalle regole aziendali. |
| In this company… …high value is attached to compliance with the safety regulations. | In questa azienda… …l’alto valore è collegato al rispetto delle norme di sicurezza. |
| In this company the people… …follow written safety procedures carefully. | In questa azienda… …le persone seguono attentamente le procedure scritte sulla sicurezza. |
| Safety as an organizational value scale | Scala della sicurezza come valore organizzativo |
| To what extent is it important in your company… …people’s safety. | Fino a che punto è importante… …la sicurezza delle persone nella tua azienda. |
| To what extent is it important in your company… …equipment safety. | Fino a che punto è importante… …la sicurezza delle apparecchiature nella tua azienda. |
| In this company, in order to be promoted or rewarded, one needs to… … follow safety rules. | In questa azienda, per essere promossi o premiati, bisogna… …seguire le regole di sicurezza. |
| The management of this company says one should… …work in accordance with the safety rules. | La direzione di questa azienda afferma che si dovrebbe… …lavorare in conformità con le norme di sicurezza. |
| In this company… …we work in a safe way. | In questa azienda… …lavoriamo in modo sicuro. |
| Organizational Practices scale | Scala delle pratiche organizzative |
| The management… does not pay attention to what the safety department says (r). | La direzione… …non presta attenzione a ciò che dice il dipartimento di sicurezza (r). |
| The management… …does not show any great concern for safety until an accident happens (r). | La direzione… …non mostra grande preoccupazione per la sicurezza fino a quando non si verifica un incidente (r). |
| The decision makers in safety issues do not know what is going on at the workers level (r). | I responsabili delle decisioni in materia di sicurezza non sanno cosa sta succedendo a livello di lavoratori (r). |
| In this company… … there is adequate safety training. | In questa azienda… …c’è un’adeguata formazione sulla sicurezza. |
| In this company… …training in safety is carried out regularly. | In questa azienda… …viene svolta regolarmente la formazione sulla sicurezza. |
| In this company, the people… …are well prepared for emergencies, and all of them know how to react in the event of an emergency. | In questa azienda le persone… …sono ben preparate per le emergenze e tutte sanno come reagire in caso di emergenza. |
| In this company… …safety equipment is always available. | In questa azienda… …l’equipaggiamento di sicurezza è sempre disponibile. |
| In this company… …attention is paid to maintaining good safety conditions in the facilities. | In questa azienda… …si presta attenzione al mantenimento di buone condizioni di sicurezza nelle strutture. |
| People from the safety department are very influential within the company. | Le persone del reparto sicurezza sono molto influenti all’interno dell’azienda. |
| In this company, the people… …are willing to make a great effort so that the work can be carried out in a safe manner. | In questa azienda… … le persone sono disposte a fare un grande sforzo affinché il lavoro possa essere svolto in modo sicuro. |
| In this company, the people… …think that safety is not their concern–but that of the management and others. | In questa azienda, le persone… …pensano che la sicurezza non sia la loro preoccupazione, ma quella della direzione e di altri. |
| In this company… …we are not given adequate information on what goes on in the company in terms of safety (r). | In questa azienda… ..non ci vengono fornite adeguate informazioni su ciò che accade in termini di sicurezza (r). |
| In this company… …the safety statistics are rarely studied and discussed (r). | In questa azienda… …le statistiche sulla sicurezza sono raramente studiate e discusse (r). |
| In this company… …there is some confusion as to whom we should contact when dealing with safety issues(r). | In questa azienda… …c’è una certa confusione su chi dovremmo contattare quando si tratta di questioni di sicurezza (r). |
| The management… …makes workers uncomfortable to speak freely about their concerns relative to safety(r). | La direzione… …mette i lavoratori a disagio nel parlare liberamente delle loro preoccupazioni relative alla sicurezza (r). |
| When there is a lot of work it is impossible to follow the safety standards (r). | Quando c’è molto lavoro è impossibile seguire gli standard di sicurezza (r). |
| Those occasions in which I worked unsafely it was because I had to do the job quickly (r). | Quelle occasioni in cui lavoravo in modo insicuro erano perché dovevo fare il lavoro velocemente (r). |
| Sometimes you have to take a certain risk to finish the work more quickly (r). | A volte devi correre un certo rischio per finire il lavoro più rapidamente (r). |
| If I were always concerned with safety, my job would not get done (r). | Se fossi sempre stato interessato alla sicurezza, il mio lavoro non sarebbe finito (r). |
| In this company… …we avoid reporting minor work accidents. | In questa azienda… …evitiamo di denunciare piccoli infortuni sul lavoro. |
| In this company… …when an accident happens it is discussed, and lessons are learnt. | In questa azienda… …quando si verifica un incidente, se ne discute e si impara. |
| In this company… …accidents have led to improve the safety conditions in the company. | In questa azienda… …gli incidenti hanno portato a migliorare le condizioni di sicurezza. |
| In this company… …when an accident happens, the existing safety standards are readjusted. | In questa azienda… …quando si verifica un incidente, gli standard di sicurezza esistenti vengono riadattati. |
| My leaders are willing to learn from accidents. | I miei leader sono disposti a imparare dagli incidenti... |
| Personal Involvement Scale | Scala del coinvolgimento personale |
| In this company… …all individuals share responsibility for safety. | In questa azienda… …tutte le persone condividono la responsabilità per la sicurezza. |
| In this company, the people… …see safety as the responsibility of each individual. | In questa azienda… …le persone vedono la sicurezza come una responsabilità di ciascun individuo. |
| In this company, the people… …are aware of their role in safety matters. | In questa azienda le persone… …sono consapevoli del proprio ruolo in materia di sicurezza. |
| In this company, the people… …use safety equipment even when they are not being supervised. | In questa azienda, le persone… …utilizzano attrezzature di sicurezza anche quando non sono sorvegliate. |
| In this company… …we avoid reporting minor work accidents... | In questa azienda… …le persone che evitiamo di segnalare piccoli infortuni sul lavoro... |
| In this company, the people… …defend working safely matters when someone criticizes it. | In questa azienda, le persone… …difendono il lavoro in sicurezza quando qualcuno lo critica. |
| In this company, the people… …are proud about working safely. | In questa azienda, le persone… …sono orgogliose di lavorare in sicurezza. |
| In this company, the people… …look at the safety records of the company as if they were their very own records and are proud of them. | In questa azienda, le persone… …guardano i record di sicurezza dell’azienda come se fossero i propri e ne sono orgogliosi. |
Note: items indicated with (r) are reversed (7 = 1) and (1 = 7).
References
- Advisory Committee on the Safety of Nuclear Installations (ACSNI), Study Group on Human Factors, Third Report: Organising for Safety; HMSO: London, UK, 1993.
- Guldenmund, F.W. The nature of safety culture: A review of theory and research. Safety Sci. 2000, 34, 215–257. [Google Scholar] [CrossRef]
- Zohar, D. Safety climate in industrial organizations: Theoretical and applied implications. J. Appl. Psychol. 1980, 65, 96–102. [Google Scholar] [CrossRef]
- Glendon, A.I.; Stanton, N.A. Perspectives on safety culture. Safety Sci. 2000, 34, 193–214. [Google Scholar] [CrossRef] [Green Version]
- Glendon, A.I.; Litherland, D.K. Safety climate factors, group differences and safety behaviour in road construction. Safety Sci. 2001, 39, 157–188. [Google Scholar] [CrossRef]
- Silva, S.; Lima, M.L.; Baptista, C. OSCI: An Organisational and Safety Climate Inventory. Safety Sci. 2004, 42, 205–220. [Google Scholar] [CrossRef]
- Schneider, B.; Reichers, A.E. On the etiology of climates. Pers. Psychol. 1983, 36, 19–39. [Google Scholar] [CrossRef]
- Ostroff, C.; Kinicki, A.J.; Tamkins, M.M. Organizational culture and climate. In Handbook of Psychology: Industrial and Organizational Psychology; Borman, W.C., Ilgen, D.R., Klimoski, R.J., Eds.; Wiley: New York, NY, USA, 2003; pp. 565–593. [Google Scholar]
- Schneider, B.; Ehrhart, M.G.; Macey, W.H. Perspectives on organizational climate and culture. In APA Handbook of Industrial and Organizational Psychology: Vol. 1. Building and Developing the Organization; Zedeck, S., Ed.; Am. Psychol. Assoc.: Washington, DC, USA, 2011; pp. 373–414. [Google Scholar]
- Kuenzi, M.; Schminke, M. Assembling Fragments into a Lens: A Review, Critique, and Proposed Research. Agenda for the Organizational Work Climate Literature. J. Manage. 2009, 35, 634–717. [Google Scholar]
- Paolillo, A.; Silva, S.A.; Carvalho, H.; Pasini, M. Exploring patterns of multiple climates and their effects on safety performance at the department level. J. Safety Res. 2020, 72, 47–60. [Google Scholar] [CrossRef] [PubMed]
- Neal, A.; Griffin, M.A.; Hart, P.M. The Impact of Organizational Climate on Safety Climate and Individual Behavior. Safety Sci. 2000, 34, 1–3. [Google Scholar] [CrossRef]
- DeJoy, D.; Schaffer, B.; Wilson, M.; Vandenberg, R.; Butts, M. Creating safer workplaces: Assessing the determinants and role of safety climate. J. Safety Res. 2004, 35, 81–90. [Google Scholar] [CrossRef] [PubMed]
- Wallace, J.C.; Popp, E.; Mondore, S. Safety climate as a mediator between foundation climates and occupational accidents: A group-level investigation. J. Appl. Psychol. 2006, 9, 681–688. [Google Scholar] [CrossRef] [PubMed]
- Zohar, D. Thirty years of safety climate research: Reflections and future directions. Accident. Anal. Prev. 2010, 42, 1517–1522. [Google Scholar] [CrossRef]
- Zohar, D. Safety climate: Conceptual and measurement issues. In Handbook of Occupational Health Psychology; Quick, J.C., Tetrick, L.E., Eds.; American Psychological Association: Washington, DC, USA, 2011; pp. 141–164. [Google Scholar]
- Mearns, K.J.; Flin, R. Assessing the state of organizational safety—culture or climate. Curr. Psychol. Develop. Learn. Pers. Social. 1999, 18, 5–17. [Google Scholar] [CrossRef]
- Pidgeon, N. Safety culture: Key theoretical issues. Work Stress. 1998, 12, 202–216. [Google Scholar] [CrossRef]
- Curcuruto, M.M.; Griffin, M.; Kandola, R.; Morgan, J.I. Multilevel Safety Climate in The UK Rail Industry: A Cross Validation of the Zohar and Luria MSC Scale. Safety Sci. 2018, 110, 183–194. [Google Scholar] [CrossRef]
- Shannon, H.S.; Norman, G.R. Deriving the factor structure of safety climate scales. Safety Sci. 2009, 47, 327–329. [Google Scholar] [CrossRef]
- Clarke, S. The relationship between safety climate and safety performance: A meta-analytic review. J. Occup. Health Psychol. 2006, 11, 315–327. [Google Scholar] [CrossRef] [PubMed]
- Ostrom, L.; Wilhelmsen, C.; Kaplan, B. Assessing safety culture. Nucl. Safety. 1993, 34, 163–172. [Google Scholar]
- Melia, J.L.; Sese, A. La medida del clima de seguridad y salud laboral [A measure of safety climate and work health]. An. Psicol. 1999, 15, 269–289. [Google Scholar]
- Lu, C.S.; Tsai, C.L. The effects of safety climate on vessel accidents in the container shipping context. Accid Anal. Prev. 2008, 40, 594–601. [Google Scholar] [CrossRef] [PubMed]
- Beus, J.M.; Solomon, S.J.; Taylor, E.C.; Esken, C.A. Making sense of climate: A meta-analytic extension of the competing values framework. Organ. Psychol. Rev. 2020, 10, 136–168. [Google Scholar] [CrossRef]
- Patterson, M.G.; West, M.A.; Shackleton, V.J.; Dawson, J.F.; Lawthom, R.; Maitlis, S.; Robinson, D.L. Validating the organizational climate measure: Links to managerial practices, productivity and innovation. J. Organ. Behav. 2005, 26, 379–408. [Google Scholar] [CrossRef]
- Ostrof, C.; Kinicki, A.; Muhammad, R. Organizational culture and climate. In Handbook of Psychology, 2nd ed.; Weiner, I., Schmitt, N., Highhouse, S., Eds.; Wiley: New York, NY, USA, 2012. [Google Scholar]
- Reichers, A.E.; Schneider, B. Climate and culture: An evolution of constructs. In Organizational Climate and Culture; Schneider, B., Ed.; Jossey-Bass Publishers: Oxford, UK, 1990; pp. 5–39. [Google Scholar]
- Schein, E. Organizational Culture and Leadership; Jossey-Bass: San Francisco, CA, USA, 1992. [Google Scholar]
- Van Muijen, J.J.; Koopman, P.; De Witte, K.; De Cock, G.; Susanj, Z.; Lemoine, C.; Bourantas, D.; Papalexandris, N. Organizational culture: The focus questionnaire. Eur. J. Work Organ. Psy. 1999, 8, 551–568. [Google Scholar] [CrossRef]
- Cox, S.; Flin, R. Safety culture: Philosopher’s stone or man of straw? Work Stress 1998, 12, 189–201. [Google Scholar] [CrossRef]
- Flin, R.; Mearns, K.; O’Connor, P.; Bryden, R. Measuring safety climate: Identifying the common features. Safety Sci. 2000, 34, 177–192. [Google Scholar] [CrossRef]
- Silva, S. Culturas de Segurança e Prevenção de Acidentes de Trabalho numa Abordagem Psicossocial: Valores Organizacionais Declarados e em Uso; Fundação Calouste Gulbenkian: Lisboa, Portugal, 2008. [Google Scholar]
- Brondino, M.; Silva, S.A.; Pasini, M. Multilevel approach to organizational and group safety climate and safety performance: Co-workers as the missing link. Safety Sci. 2012, 50, 1847–1856. [Google Scholar] [CrossRef]
- Cavazza, N.; Serpe, A. Effects of safety climate on safety norm violations: Exploring the mediating role of attitudinal ambivalence toward personal protective equipment. J. Saf. Res. 2009, 40, 277–283. [Google Scholar] [CrossRef] [PubMed]
- Dal Corso, L. Mediation effects of safety climate and safety motivation on the relation between organizational climate and safety performance in the workplace. TPM 2008, 15, 77–90. [Google Scholar]
- Paolillo, A.; Silva, S.A.; Pasini, M. Promoting Safety Participation through Diversity and Inclusion Climates. Int. J. Workplace Health Manag. 2016, 9, 308–327. [Google Scholar] [CrossRef]
- Brondino, M.; Pasini, M.; Silva, S. Development and validation of an Integrated Organizational Safety Climate Questionnaire with multilevel confirmatory factor analysis. Qual. Quant. 2013, 47, 2191–2223. [Google Scholar]
- Barbaranelli, C.; Petitta, L.; Probst, T.M. Does Safety Climate Predict Safety Performance in Italy and the USA? Cross-cultural Validation of a Theoretical Model of Safety Climate. Accident Anal. Prev. 2015, 77, 35–44. [Google Scholar] [CrossRef]
- Neal, A.; Griffin, M.A. Safety climate and safety at work. In The Psychology of Workplace Safety; Barling, J., Frone, M.R., Eds.; American Psychological Association: Washington, DC, USA, 2004; pp. 15–34. [Google Scholar] [CrossRef]
- Gustafson, P.E. Gender differences in risk perception: Theoretical and methodological perspectives. Risk Anal. 1998, 18, 805. [Google Scholar] [CrossRef]
- Davidson, D.J.; Freudenburg, W.R. Gender and environmental risk concerns: A review and analysis of available research. Environ. Behav. 1996, 28, 302–339. [Google Scholar] [CrossRef]
- Harris, C.R.; Jenkins, M.; Glaser, D. Gender differences in risk assessment: Why do women take fewer risks than men? Judgm. Decis. Mak. 2006, 1, 48–63. Available online: http://journal.sjdm.org/06016/jdm06016.htm (accessed on 5 February 2021).
- Han, Y.; Jin, R.; Wood, H. Investigation of Demographic Factors in Construction Employees’ Safety Perceptions. KSCE J. Civ Eng. 2019, 23, 2815–2828. [Google Scholar] [CrossRef]
- Cheung, G.W. Testing equivalence in the structure, means, and variances of higher order constructs with structural equation modelling. Organ. Res. Methods 2008, 11, 593–613. [Google Scholar] [CrossRef]
- Vandenberg, R.J.; Lance, C.E. A review and synthesis of the measurement invariance literature: Suggestions, practices, and recommendations for organizational research. Organ. Res. Methods 2000, 3, 4–69. [Google Scholar] [CrossRef]
- Nahrgang, J.D.; Morgeson, F.P.; Hofmann, D.A. Safety at work: A meta-analytic investigation of the link between job demands, job resources, burnout, engagement, and safety outcomes. J. Appl. Psychol. 2011, 96, 71–94. [Google Scholar] [CrossRef] [PubMed]
- Morrow, P.C.; Crum, M.R. The effects of perceived and objective safety risk on employee outcomes. J. Vocat. Behav. 1998, 53, 300–313. [Google Scholar] [CrossRef]
- Clarke, S. An Integrative Model of Safety Climate: Linking Psychological Climate and Work Attitudes to Individual Safety Outcomes Using Meta-analysis. J. Occupa. Organ. Psych. 2010, 83, 553–578. [Google Scholar] [CrossRef]
- Neves, J. Clima Organizacional, Cultura Organizacional e Gestaõ de Recursos Humanos [Organisational Climate, Organisational Culture and Human Resources Management]; RH Editora: Lisbon, Portugal, 2000. [Google Scholar]
- Van Muijen, J.J. Organizational culture. In Handbook of Work and Organizational Psychology; Drenth, P.J.D., Thierry, H., Wolff, C.J., Eds.; Psychology Press: Hove, UK, 1998; pp. 113–131. [Google Scholar]
- Vala, J.; Monteiro, M.B.; Lima, M.L. Culturas Organizacionais [Organisational Cultures]. In Psicologia Social das Organizacionais: Estudos em Empresas Portuguesas; Vala, J., Monteiro, M.B., Lima, M.L., Caetano, A., Eds.; Celta Editora: Lisbon, Portugal, 1994. [Google Scholar]
- Carroll, J.S. Safety culture as an ongoing process: Culture surveys as opportunities for enquiry and change. Work Stress. 1998, 12, 272–284. [Google Scholar] [CrossRef]
- Williamson, A.M.; Feyer, A.; Cairns, D.; Biancotti, D. The development of a measure to safety climate: The role of safety perceptions and attitudes. Safety Sci. 1997, 25, 15–27. [Google Scholar] [CrossRef]
- Cox, S.; Cox, T. The structure of employee attitudes to safety: A European example. Work Stress 1991, 5, 93–106. [Google Scholar] [CrossRef]
- Beaton, D.E.; Bombardier, C.; Guillemin, F.; Ferraz, M.B. Guidelines for the process of cross-cultural adaptation of self-report measures. Spine 2000, 25, 3186–3191. [Google Scholar] [CrossRef] [Green Version]
- Schaufeli, W.B.; Bakker, A.B. Test Manual for the Utrecht Work Engagement Scale. Unpublished Manuscript, Utrecht University, 2003; Utrecht, The Netherlands. Available online: http://www.schaufeli.com (accessed on 15 March 2021).
- Balducci, C.; Fraccaroli, F.; Schaufeli, W. Psychometric properties of the Italian version of the Utrecht Work Engagement Scale (UWES-9): A cross-cultural analysis. Eur J. Psychol Assess. 2010, 26, 143–149. [Google Scholar] [CrossRef] [Green Version]
- Arbuckle, J.L. IBM® SPSS® Amos™ 21: Users Guide; IBM: Chicago, IL, USA, 2012. [Google Scholar]
- Meade, A.W.; Johnson, E.C.; Braddy, P.W. Power and sensitivity of alternative fit indices in tests of measurement invariance. J. Appl. Psychol. 2008, 93, 568–592. [Google Scholar] [CrossRef] [PubMed]
- Cheung, G.W.; Rensvold, R.B. Evaluating goodness-of-fit indexes for testing measurement invariance. Struct. Equ. Modeling 2002, 9, 233–255. [Google Scholar] [CrossRef]
- James, L.R.; Demaree, R.G.; Wolf, G. Rwg: An assessment of within-group interrater agreement. J. Appl. Psychol. 1993, 78, 306–309. [Google Scholar] [CrossRef]
- Dunlap, W.P.; Burke, M.J.; Smith-Crowe, K. Accurate tests of statistical significance for rwg and average deviation interrater agreement indexes. J. Appl. Psychol. 2003, 88, 356–362. [Google Scholar] [CrossRef]
- James, L.R. Aggregation bias in estimates of perceptual agreement. J. Appl. Psychol. 1982, 67, 219–229. [Google Scholar] [CrossRef]
- Shrout, P.E.; Fleiss, J.L. Intraclass correlations: Uses in assessing rater reliability. Psychol Bull. 1979, 86, 420–428. [Google Scholar] [CrossRef] [PubMed]
- Kline, R.B. Beyond Significance Testing: Statistics Reform in the Behavioral Sciences, 2nd ed.; American Psychological Association: Washington, DC, USA, 2013. [Google Scholar]
- Macdonald, S.; MacIntyre, P.D. The generic job satisfaction scale: Scale development and its correlates. Employee Assist. Quart. 1997, 13, 1–16. [Google Scholar] [CrossRef]
- Bagozzi, R. Advanced topics in structural equation models. In Advanced Methods of Marketing Research; Bagozzi, R., Ed.; Blackwell Publishers: Cambridge, UK, 1994; pp. 1–51. [Google Scholar]
- Van De Schoot, R.; Lugtig, P.; Hox, J. A checklist for testing measurement invariance. Eur. J. Dev. Psychol. 2012, 9, 486–492. [Google Scholar] [CrossRef]
- Fornell, C.; Larker, D.F. Evaluating structural equation models with unobservable variables and measurement error. J. Marketing Res. 1981, 18, 39–50. [Google Scholar] [CrossRef]
- Hair, J.F.; Black, W.; Babin, B.J.; Anderson, R.E.; Tatham, R.L. Multivariate Data Analysis, 6th ed.; Pearson—Prentice Hall: Upper Saddle River, NJ, USA, 2006. [Google Scholar]
- Farrell, A.M. Insufficient discriminant validity: A comment on Bove, Pervan, Beatty and Shiu (2009). J. Bus. Res. 2010, 63, 324–327. [Google Scholar] [CrossRef] [Green Version]
- Byrne, B.M. Testing for multigroup equivalence of a measuring instrument: A walk through the process. Psicothema 2008, 20, 872–882. [Google Scholar]
- Stoilkovska, B.B.; Žileska Pančovska, V.; Mijoski, G. Relationship of safety climate perceptions and job satisfaction among employees in the construction industry: The moderating role of age. Int. J. Occup. Saf. Ergon. 2015, 21, 440–447. [Google Scholar] [CrossRef] [PubMed]
- Howard, H. Why do people say nasty things about self-reports? J. Organ. Behav. 1994, 15, 399–404. [Google Scholar] [CrossRef]
- Silva, S. Organizational values associated to safety climate: Between flexibility and control. In Competing Values in an Uncertain Environment: Managing the Paradox; Menon, S., Ed.; ISSWOV—International Society for the Study of Work & Organizational Values Department of Management and Marketing, Louisiana State University: Shreveport, LA, USA, 2010; pp. 479–485. ISBN 978-0-9817997-1-1. [Google Scholar]
- Blau, P.M. A theory of social integration. Am. J. Sociol. 1960, 65, 545–556. [Google Scholar] [CrossRef]
- Mearns, K.; Hope, L.; Ford, M.T.; Tetrick, L.E. Investment in workforce health: Exploring the implications for workforce safety climate and commitment. Accid. Anal. Prev. 2010, 42, 1445–1454. [Google Scholar] [CrossRef]
- Hofmann, D.A.; Morgeson, F.P.; Gerras, S.J. Climate as a moderator of the relationship between leader-member exchange and content specific citizenship:safety climate as an exemplar. J. Appl. Psychol. 2003, 88, 170–178. [Google Scholar] [CrossRef] [Green Version]
- Dejoy, D.M.; Della, L.J.; Vandenbert, R.J.; Wilson, M.G. Making work safer: Testing a model of social exchange and safety management. J. Saf. Res. 2010, 41, 163–171. [Google Scholar] [CrossRef]
- Huang, Y.-H.; Lee, J.; McFadden, A.C.; Murphy, L.A.; Robertson, M.M.; Cheung, J.H.; Zohar, D. Beyond Safety Outcomes: An Investigation of the Impact of Safety Climate on Job Satisfaction, Employee Engagement and Turnover Using Social Exchange Theory as the Theoretical Framework. Appl. Ergon. 2016, 55, 248–257. [Google Scholar] [CrossRef] [PubMed]
- Michael, J.H.; Evans, D.D.; Jansen, K.J.; Haight, J.M. Management commitment to safety as organizational support: Relationships with non-safety outcomes in wood manufacturing employees. J. Saf. Res. 2005, 36, 171–179. [Google Scholar] [CrossRef] [PubMed]
- Fugas, C.; Meliá, J.L.; Silva, S. The ‘‘is’’ and the ‘‘ought’’: How perceived social norms influence safety behaviors at work? J. Occup. Health Psych. 2011, 16, 67–79. [Google Scholar] [CrossRef] [PubMed]
Table 1.
Fit indexes for models tested in CFA (Study 1).
| χ2 | df | Standardized Root Mean Square Residual (SRMR) | Root Mean Square Error of Approximation (RMSEA) | RMSEA 90%-C.I. | Comparative Fit Index (CFI) | Tucker Lewis Index (TLI) | Akaike Information Criterion (AIC) | Bayesian Information Criterion (BIC) | ||
|---|---|---|---|---|---|---|---|---|---|---|
| Organizational Climate | ||||||||||
| Model 1 a | 340.256 * | 203 | 0.05 | 0.063 | 0.055–0.075 | 0.94 | 0.91 | 129.133 | 277.244 | |
| Model 2 b | 580.211 * | 206 | 0.06 | 0.079 | 0.069–0.088 | 0.89 | 0.86 | 189.206 | 379.413 | |
| Model 3 c | 696.401 * | 215 | 0.08 | 0.11 | 0.098–0.118 | 0.82 | 0.78 | 531.817 | 615.098 | |
| Safety Climate | χ2 | df | SRMR | RMSEA | RMSEA 90%-C.I. | CFI | TLI | AIC | BIC | |
| Model 1 a | 568.252 * | 217 | 0.04 | 0.071 | 0.047–0.078 | 0.96 | 0.93 | 248.217 | 267.218 | |
| Model 2 b | 782.365 * | 231 | 0.06 | 0.081 | 0.074–0.098 | 0.92 | 0.90 | 369.841 | 515.364 | |
| Model 3 c | 932.315 * | 289 | 0.08 | 0.15 | 0.121–0.163 | 0.79 | 0.75 | 596.258 | 732.856 |
a Model 1: one second-order factor and four first-order factors. b Model 2: four first-order factors with co-variances among them. c Model 3: all the items were predicted by a single factor. *: p < 0.001.
Table 2.
Descriptive statistics and inter-correlations for study 1 at the individual level and at group level *.
Table 2.
Descriptive statistics and inter-correlations for study 1 at the individual level and at group level *.
| M | SD | α/ω | 1 | 2 | 3 | 4 | 5 | 6 | 7 | 8 | 9 | 10 | 11 | |
|---|---|---|---|---|---|---|---|---|---|---|---|---|---|---|
| 1. Engagement | 5.78 | 0.57 | 0.91 | - | 0.25 ** | 0.21 ** | 0.19 ** | 0.16 ** | 0.31 ** | 0.26 ** | 0.51 ** | 19 ** | 0.20 ** | 0.16 * |
| 2. Support | 5.17 | 0.59 | 0.79 | 56 ** | - | 0.21 ** | 0.23 ** | 0.19 ** | 0.36 ** | 0.22 ** | 0.45 ** | 0.23 ** | 0.22 ** | 0.32 ** |
| 3. Goal | 5.36 | 0.58 | 0.92 | 0.77 ** | 0.33 ** | - | 0.25 ** | 0.29 ** | 0.40 ** | 0.13 ** | 0.25 ** | 0.48 ** | 0.29 ** | 0.41 ** |
| 4. Innovation | 5.41 | 0.70 | 0.92 | 0.60 ** | 0.46 ** | 0.52 ** | - | 0.17 ** | 0.22 ** | 0.45 ** | 0.43 ** | 0.15 ** | 0.15 * | 51 ** |
| 5. Rules | 5.26 | 0.45 | 0.94 | 0.42 ** | 0.28 ** | 0.80 ** | 0.78 ** | - | 0.27 ** | 0.41 ** | 0.31 ** | 0.32 ** | 0.17 ** | 0.29 ** |
| 6. SOC | 5.11 | 0.65 | 0.91 | 0.46 ** | 0.33 ** | 0.28 ** | 0.30 ** | 0.46 ** | - | 0.37 ** | 0.49 ** | 0.26 ** | 0.23 ** | 0.62 ** |
| 7. SCC | 5.07 | 0.98 | 0.90 | 0.23 ** | 0.27 ** | 0.31 ** | 0.22 ** | 0.29 ** | 0.25 ** | - | 0.26 ** | 0.24 ** | 0.31 ** | 0.36 ** |
| 8. SOV | 5.50 | 0.84 | 0.85 | 0.25 ** | 0.48 ** | 0.18 ** | 0.43 ** | 0.46 ** | 0.38 ** | 0.28 ** | - | 0.24 ** | 0.35 ** | 0.21 ** |
| 9. SP | 5.45 | 0.87 | 0.79 | 0.38 ** | 0.26 ** | 0.26 ** | 0.37 ** | 0.34 ** | 0.32 ** | 0.29 ** | 0.17 ** | - | 0.36 * | 0.25 ** |
| 10. PI | 5.49 | 0.90 | 0.81 | 0.62 ** | 0.24 ** | 0.23 ** | 0.21 ** | 0.58 ** | 0.38 ** | 0.35 ** | 0.25 ** | 0.25 ** | - | 0.32 ** |
| 11. SSC | 5.65 | 0.91 | 0.90 | 0.38 ** | 0.43 ** | 0.32 ** | 0.17 ** | 0.20 ** | 0.48 ** | 0.34 ** | 0.16 ** | 0.43 ** | 0.35 ** | - |
Notes: SOC = Strength Organizational Climate; SCC = Safety Climate Content; SOV = Safety Organizational Values; SP = Safety Practices; PI = Personal Involvement; SSC = Strength Safety Climate; p scores: * < 0.05, ** < 0.001. * correlations among individual-level data are below the diagonal, correlations among aggregated group-level data are above the diagonal.
Table 3.
Fit statistics for measurement invariance by gender.
| Model | χ2(df) | CFI | SRMR | RMSEA | ΔCFI | |
|---|---|---|---|---|---|---|
| Organizational climate | 1. Configural Invariance | 631.804(248) | 0.94 | 0.04 | 0.06 (0.045–0.075) | - |
| 2. Metric Invariance | 678.612 (259) | 0.94 | 0.04 | 0.06 (0.036–0.072) | 0.001 | |
| 3. Scalar Invariance | 717.532 (278) | 0.94 | 0.04 | 0.06 (0.036–0.072) | 0.001 | |
| 4. Measurement error Invariance | 741.698 (289) | 0.93 | 0.04 | 0.06 (0.036–0.072) | 0.002 | |
| 5. Structural Variance Invariance | 812.121 (298) | 0.94 | 0.04 | 0.06 (0.036–0.072) | 0.001 | |
| 6. Structural Covariance Invariance | 847.568 (305) | 0.94 | 0.04 | 0.06 (0.036–0.072) | 0.000 | |
| Safety Climate | 1. Configural Invariance | 735.412 (256) | 0.95 | 0.03 | 0.05 (0.042–0.066) | - |
| 2. Metric Invariance | 753.854 (268) | 0.93 | 0.04 | 0.05 (0.048–0.066) | 0.000 | |
| 3. Scalar Invariance | 776.825 (271) | 0.93 | 0.04 | 0.05 (0.048–0.066) | 0.001 | |
| 4. Measurement error Invariance | 852.613 (287) | 0.93 | 0.04 | 0.05 (0.048–0.066) | 0.002 | |
| 5. Structural Variance Invariance | 878.513 (298) | 0.93 | 0.04 | 0.05 (0.048–0.066) | 0.001 | |
| 6. Structural Covariance Invariance | 914.215 (309) | 0.93 | 0.04 | 0.05 (0.048–0.066) | 0.001 |
Table 4.
Fit statistics for measurement invariance by company sector.
| Model | χ2(df) | CFI | SRMR | RMSEA | ΔCFI | |
|---|---|---|---|---|---|---|
| Organizational climate | 1. Configural Invariance | 696.321 (325) | 0.94 | 0.04 | 0.07 (0.059–078) | - |
| 2. Metric Invariance | 712.458 (331) | 0.94 | 0.04 | 0.06 (0.049–0.065) | 0.001 | |
| 3. Scalar Invariance | 736.465 (352) | 0.94 | 0.04 | 0.06 (0.049–0.065) | 0.001 | |
| 4. Measurement error Invariance | 743.851 (369) | 0.95 | 0.04 | 0.06 (0.049–0.065) | 0.000 | |
| 5. Structural Variance Invariance | 796.102 (387) | 0.94 | 0.04 | 0.06 (0.049–0.065) | 0.001 | |
| 6. Structural Covariance Invariance | 831.433 (395) | 0.94 | 0.04 | 0.06 (0.049–0.065) | 0.001 | |
| Safety Climate | 1. Configural Invariance | 876.371 (353) | 0.95 | 0.03 | 0.05 (0.049–0.067) | - |
| 2. Metric Invariance | 898.362 (369) | 0.95 | 0.03 | 0.05 (0.043–0.056) | 0.000 | |
| 3. Scalar Invariance | 928.715 (378) | 0.94 | 0.04 | 0.05 (0.043–0.056) | 0.001 | |
| 4. Measurement error Invariance | 942.470 (389) | 0.94 | 0.04 | 0.05 (0.043–0.056) | 0.001 | |
| 5. Structural Variance Invariance | 957.412 (399) | 0.94 | 0.04 | 0.05 (0.043–0.056) | 0.001 | |
| 6. Structural Covariance Invariance | 976.523 (412) | 0.94 | 0.04 | 0.05 (0.043–0.056) | 0.001 |
Table 5.
Descriptive statistics and correlations between study variables at the individual and group-levels*.
Table 5.
Descriptive statistics and correlations between study variables at the individual and group-levels*.
| M | SD | α/ω | 1 | 2 | 3 | 4 | 5 | 6 | 7 | 8 | 9 | 10 | 11 | |
|---|---|---|---|---|---|---|---|---|---|---|---|---|---|---|
| 1. Support | 5.60 | 0.93 | 0.85 | - | 0.55 ** | 0.81 ** | 0.86 ** | 0.16 * | 0.16 * | 0.63 ** | 0.13 * | 0.14 * | 0.71 ** | 0.23 ** |
| 2. Goal | 5.58 | 0.86 | 0.73 | 0.39 ** | - | 0.54 ** | 0.56 ** | 0.61 ** | 0.49 ** | 0.61 ** | 0.23 ** | 0.18 ** | 0.49 ** | 0.19 * |
| 3. Innovation | 5.32 | 0.85 | 0.84 | 0.25 ** | 0.44 ** | - | 0.63 ** | 0.48 ** | 0.15 * | 0.64 ** | 0.44 ** | 0.48 ** | 0.41 ** | 0.18 ** |
| 4. Rules | 5.41 | 0.95 | 0.79 | 0.28 * | 0.25 ** | 0.38 ** | - | 0.26 ** | 0.41 ** | 0.58 ** | 0.74 ** | 0.88 ** | 0.16 * | 0.26 ** |
| 5. SOC | 5.41 | 0.62 | 0.81 | 0.61 ** | 0.62 ** | 0.67 ** | 0.55 ** | - | 0.24 ** | 0.57 ** | 0.75 ** | 0.72 ** | 0.44 ** | 0.54 ** |
| 6. SCC | 4.91 | 0.98 | 0.82 | 0.19 ** | 0.20 ** | 0.28 ** | 0.15 ** | 0.58 ** | - | 0.32 ** | 0.83 ** | 0.83 ** | 0.24 ** | 0.28 ** |
| 7. SOV | 5.59 | 0.92 | 0.85 | 0.33 ** | 0.18 ** | 0.13 ** | 0.34 ** | 0.31 ** | 0.38 ** | - | 0.26 ** | 0.35 ** | 0.71 ** | 0.31 ** |
| 8. SP | 4.06 | 0.64 | 0.79 | 0.14 ** | 0.14 ** | 0.13 ** | 0.25 ** | 0.64 ** | 0.35 ** | 0.31 ** | - | 0.24 ** | 0.69 ** | 0.29 ** |
| 9. PI | 5.13 | 0.99 | 0.78 | 0.22 ** | 0.12 ** | 0.21 ** | 0.11 ** | 0.30 ** | 0.39 ** | 0.19 ** | 0.19 ** | - | 0.83 ** | 0.22 ** |
| 10. SSC | 5.59 | 0.89 | 0.82 | 0.38 ** | 0.31 ** | 0.28 ** | 0.27 ** | 0.34 ** | 0.27 ** | 0.51 ** | 0.31 ** | 0.44 ** | - | 0.25 ** |
| 11. JS | 4.23 | 0.60 | 0.91 | 0.25 ** | 0.32 ** | 0.21 ** | 0.16 ** | 0.65 ** | 0.28 ** | 0.22 ** | 0.40 ** | 0.21 ** | 0.68 ** | - |
Notes: SOC = Strength of Organizational Climate; SCC = Safety Climate Content; SOV = Safety Organizational Values; SP = Safety Practices; PI = Personal Involvement; SSC = Strength Safety Climate; JS = Job Satisfaction. * p < 0.05, ** p < 0.001. * correlations among individual-level data are below the diagonal, correlations among aggregated group-level data are above the diagonal.
Publisher’s Note: MDPI stays neutral with regard to jurisdictional claims in published maps and institutional affiliations. |
© 2021 by the authors. Licensee MDPI, Basel, Switzerland. This article is an open access article distributed under the terms and conditions of the Creative Commons Attribution (CC BY) license (http://creativecommons.org/licenses/by/4.0/).
Share and Cite
MDPI and ACS Style
Platania, S.; Paolillo, A.; Silva, S.A. The Italian Validation of OSCI: The Organizational and Safety Climate Inventory. Safety 2021, 7, 22. https://0-doi-org.brum.beds.ac.uk/10.3390/safety7010022
AMA Style
Platania S, Paolillo A, Silva SA. The Italian Validation of OSCI: The Organizational and Safety Climate Inventory. Safety. 2021; 7(1):22. https://0-doi-org.brum.beds.ac.uk/10.3390/safety7010022
Chicago/Turabian StylePlatania, Silvia, Anna Paolillo, and Silvia A. Silva. 2021. "The Italian Validation of OSCI: The Organizational and Safety Climate Inventory" Safety 7, no. 1: 22. https://0-doi-org.brum.beds.ac.uk/10.3390/safety7010022
Note that from the first issue of 2016, this journal uses article numbers instead of page numbers. See further details here.