Traversing Community Attitudes and Interaction Experiences with Large Agricultural Vehicles on Rural Roads


1
College of Public Health, Medical and Veterinary Sciences, James Cook University, Townsville QLD 4811, Australia
2
World Safety Organisation Collaborating Centre for Injury Prevention and Safety Promotion, Townville QLD 4811, Australia
*
Author to whom correspondence should be addressed.
Safety 2021, 7(1), 4; https://0-doi-org.brum.beds.ac.uk/10.3390/safety7010004
Submission received: 3 December 2020
/
Revised: 7 January 2021
/
Accepted: 10 January 2021
/
Published: 14 January 2021
(This article belongs to the Special Issue Farm Safety)
Abstract
:Agriculture is one of Australia’s largest rural industries. Oversized and slow moving industry equipment and vehicles, hereafter referred to as large agricultural vehicles (LAVs), use public roads. Restrictions exist regarding their on-road operation, but whether this is a function of the risk that their on-road use represents is unknown. A convenience sample of community members was used to explore perspectives about LAVs’ presence on roads. An online survey was used to explore LAV interaction experiences, risk perceptions, and how best to promote safe interactions. Ethics approval was obtained. The participants’ (N = 239) exposure to LAVs on roads in the last 12 months was variable, but there were clear seasonal points when encounters could be expected. The participants indicated that LAVs have a right to drive on the road (94.8%), and most interactions were neutral, with four LAV crashes reported. Other vehicle types were perceived as representing a higher risk to rural road safety than LAVs. The use of the driver’s license test to increase knowledge about LAVs’ presence, how to respond, and the use of signs were suggested in order to improve safety. The participants commonly interacted with LAVs, and rarely experienced negative events such as crashes. Continued communication about LAV presence on rural roads is an important consideration in order to help ensure safe interactions.
1. Introduction
Agriculture represents one of Australia’s largest industries, and it employed 408,000 people in 2016–17 [1]. Australia helps feed and clothe not only its own nation but also the rest of the world, with 77% of 2015–16 production being exported, representing 15.3% of the total goods and services exported for that period [2]. The major commodities exported are meat and live animals, representing 29% of agricultural exports in 2015–16; and grains, oilseeds and grain legumes, representing and 24% of agricultural exports in 2015–16 [2]. Agricultural production requires the use of roads for the distribution of end products, for production purposes, and for other activities. These on-road movements include the use of trucks and other vehicles. There is often a lamented disconnect between knowing how food is produced and where it comes from, and a related appreciation of the size, complexity and effort that goes in to cultivating, harvesting and transporting these goods [3]. This disconnect is slowly being remedied through consumer- and place-driven endeavors [3] such as regional tourism selling the ‘idyllic’ rural lifestyle, the plate-to-table and slow food movement, food sovereignty, agri-tourism, and the general move to critical, informed and conscious consumption [4,5,6,7]. With these strategies comes a greater interaction with agricultural vehicles.
There are many vehicles engaged in the agricultural supply chain, including trucks to transport goods to distribution centres and specialised large, or heavy, agricultural vehicles (LAVs). LAVs are agriculture-specific vehicles that are used to prepare, plant, seed, cultivate, and harvest, or for application purposes [8]. While most of their use is situated on farms, including paddocks and fields, these vehicles may also be driven or transported (loaded or towed) on roads. The presence of LAVs on roads is overseen by a regulator in Australia, such that if the vehicles are oversized, there are requirements to warn other road users and further restrictions on the locations where they can be driven. When LAVs are driven or transported, these trips typically fall into two categories: short trips to other farming operations, including adjacent farms owned by the same operator, which are suggested to be typically no more than 50 km away; or contracting work at much longer distances [9,10]. It is their presence on public roads—typically rural roads, given the location of agriculture production areas—which naturally results in interactions between LAVs and other road users [11].
The typical road width in Australia ranges from 3.3–3.7 m in urban locations to 3.7–8 m depending on the number of lanes and whether the road is sealed in rural locations [12]. Road shoulders are an important consideration for the passing of LAVs on public roads, with the shoulder being utilized by either the LAV or the other road user, assuming that no barrier or foliage obstructions are present, in order to allow space between the vehicles [13,14]. On narrow sealed roads, approaching vehicles typically need to move onto the unsealed sections in rural Australia, in order to provide adequate and safe clearance distances [12,15].
LAVs differ in a number of ways from the other vehicles usually found on rural roads. They are typically oversized in terms of width, length, and/or height [16]. It is not uncommon in Australia to use very long freight-carrying vehicles, which represent issues for those seeking to pass or overtake these vehicles [16]. For example, a mid-range freight-carrying vehicle is a B-triple, which is a prime mover towing three semitrailers [16]. Two commonly-used LAVs, pieces of broad acre equipment which are present on roads during harvest season, are grain harvesters and sugar cane harvesters, with an estimated width range of 3.28 to 4.98 m and 2.45 to 3.15 m, respectively [9]. At the higher end of the spectrum are tiller and drill seeders, which have a very wide working width and a smaller transport width (range: 6 to 9.1 m) due to their capacity to fold (double or triple) [9].
Another differentiator is that self-powered LAVs can be slow moving. The speed range of tractors, a type of commonly-used LAV, is noted to range from 25 to 50 km an hour [9,17]. The speed range for powered agricultural equipment is low, i.e., “50–60 km/h and even less, 20–30 km/h when towing implements or trailers” (p. 4) [9]. Anecdotally, this fact alone has been acknowledged to cause annoyance amongst other road users who are typically travelling at much higher speeds. More importantly, this speed differential between LAVs and more standard road vehicles raises safety concerns regarding ‘closure rates’ [18]. An acknowledgement that these vehicles could be present on the roads, their size, and their slower operational/or towed speed are important variables in ensuring safe on-road interactions. Additional considerations are the differences in LAV appearance and operational constraints that can influence other drivers, such as their maneuverability and the visibility restrictions when the vehicle is in operation or being towed. Importantly, not all LAVs look the same, depending on the type of operation they are used for; this impacts not only their dimensions but also their general appearance. This has implications for road users’ ability to identify and interact with LAVs.
These unique characteristics, when considered in isolation, give the impression that the presence of these vehicles on roads has the potential to create a hazard. However, the number of fatalities, hospitalizations and general incidents involving LAVs is low (Table 1). These more serious incidents reflect only one part of LAV interactions, and do not appear to be representative of all of them. Furthermore, it is important to acknowledge that these LAV interactions are dependent on social and environmental contexts [19]. As such, there is a need to consider these interaction experiences from various perspectives (i.e., operator and community), and also to consider to consider how the road environment and driving culture impedes or enables safe LAV interaction experiences.
Agricultural vehicles and implements have different classes, restrictions and permit requirements under the auspice of the National Heavy Vehicle Regulator (NHVR), which is the independent regulator for all vehicles over 4.5 tones gross vehicle mass [16]. As part of the permit process, LAVs may be required to include the following warning devices: warning lights (with details pertaining to color, rate of flashing, power, and the visibility of the lights), warning pattern for use on specific types of LAV (this is commonly termed ‘marking’), and oversized signs (with specific sizes, placements, surfaces, and material requirements) [20]. The LAV regulations aim to improve safety when LAVs are present on roads by improving visibility and communicating with other road users about their size and/or speed upon approaching. The important point is that these communication approaches are visible upon approaching the vehicles, rather than before the vehicle is in sight. As previously intimated, the closure rate from the point of visibility is high, so these communication approaches, whilst still important and necessary, rely on the drivers’ skills to safely interact. While the signs assist in communicating the need to make allowances for the LAV, this does not necessarily result in increased competency to handle the interaction. The road environment may also impinge upon the capacity for allowances to be made [13].
There is currently a dearth of information exploring community members’ interaction experiences with LAVs on public roads [21]. This research helps to address this gap by exploring community members’ expectations around LAV encounters, the frequency of these interactions, perceptions on how to safely navigate an interaction, and if the presence of LAVs results in any perceived increases in risk when driving on rural roads. This research is part of a wider project seeking to investigate LAV use on roads, interaction experiences, safety concerns, and ways to maximize safety during these interactions.
2. Methods
A convenience sample completed an online survey exploring community members’ experiences and interactions with large agricultural vehicles (LAVs) on public roads. This survey represents a wider research project which is triangulating data to explore LAV use, risks, and safe interactions. The project was overseen by a reference group, who—for this part of the project—provided feedback on the questions and trialed the survey. The stepwise nature of the research process prompted question development informed by some of the key safety issues emerging in the literature and some of the areas of interest, conflict, and concern that emerged from the focus group discussions with operators [21].
2.1. Survey Development and Piloting
Survey GizmoTM was the online survey tool used to develop, test and collect the community member survey responses. The survey questions were developed in order to obtain demographic information, and information about their driving experience and interactions with LAVs. There are four sections in the survey: the frequency, location and characteristics of public road use; challenges regarding interacting with LAVs on public roads, including crashes and near-miss experiences; risk perception and approaches to improving safety; and demographic information. The order of these sections remained consistent across the responses. Logic was applied to some of the questions such that if the respondent indicated that they hadn’t ever encountered an LAV whilst driving on a road, then they were not asked subsequent questions that related to the characteristics of these interactions. It was decided that, rather than enabling open-ended responses, the survey would provide a number of pre-defined responses along with an ‘other’ category in order to prompt additional responses that were not covered. The predefined options were developed with consideration of the themes and interaction experiences outlined in the wider literature, and from conversations with operators about their interaction experiences.
There are a few terms used throughout the survey; these are defined in Box 1, and will also be used throughout this article.
Box 1. Clarification of terms used in the survey and this article. Source: This textbox was reproduced from the project report, which was submitted to the funders, with permission of authors [26].
Large agricultural vehicle/s: vehicle/s used in agricultural activities which are oversized in terms of their height, width, length and/or weight. While the actual size may differ depending on the commodity group and production activity in question, generally they are larger than a typical car. The large agricultural vehicle can be driven or towed in combination on public roads. Some examples include sprayers, harvesters, tractors, seeders, chaser bins and tillers. Notable exceptions include utility vehicles, quad or ATV bikes and road trains.
Near miss: refers to events were the potential for a crash to occur was present but due to mitigating factors (human or otherwise) the potential crash was avoided.
Crash: refers to events where there has been property, vehicle or personal damage due to an interaction involving a large agricultural vehicle on a public road, including where the agricultural vehicle was not at fault. The resulting property damage or physical injuries may be minor or substantial but need not have been reported to police or insurance companies. Note that the word accident is not used and this is in alignment with the stance taken amongst the wider injury prevention and safety community that the term ‘accident’ implies a lack of control over the situation. As such crash will be the term used throughout.
Public road: any road that is located outside of properties and is maintained by council or government.
The survey was reviewed and piloted by members of the reference group. The reference group was made up of 17 individuals involved in program management and policy within agricultural commodity groups such as grain, cotton, and state-based farming organizations. The reference group members had experience working in different agricultural commodity groups, but it is unknown if they had operated LAVs on roads. The reference group reviewed the content, ease of completion, device functionality of the question format on various devices, and clarity of the questions whilst reviewing and/or completing the survey. The suggestions for alteration provided by the reference group were considered by the project team, with the majority of these resulting in amendments. For example, the initial question about expectations for seeing an LAV included both the time of year and the time of day in one question as an open response. The reference group suggested that this be altered to two separate questions with pre-prepared responses.
2.2. Safety and Experiences
Given the large amount of information that was collected in the survey, this article will focus specifically on safety and experiences. These two themes are related to the sections on interactions and risk perception. A question about the frequency of interactions with LAV in the last 12 months was recoded using a conservative middle estimate. As this question was an open-ended response, there was an array of responses, i.e., as a range, as a weekly total, or as yearly cumulative. A lower, middle and upper estimate were used for any responses presented as a range. All of the concrete numbers remained the same across these three estimates. For example, a response of “4 to 12 times” was coded as 4, 8 and 12 for the lower, middle and upper estimate recodes, respectively. A response such as “20 or more” was coded as 20 across all three estimates, as there were no boundaries specified.
2.3. Recruitment and Communication about the Survey
The survey was made available for completion between 22 March and 23 April 2018. A media release about the survey was disseminated on 23 March by the author’s institution. Subsequently, a number of media outlets communicated about the survey, and interviews were conducted in response. The reference group, funder and authors also promoted the survey using social media. The authors also sought the assistance of various Australian automobile associations and caravanning clubs in order to disseminate the survey link via their membership platforms. The logic in approaching these groups was that these associations and clubs are interested in promoting road safety issues, including safe road environments. This resulted in the dissemination of the survey link via social media through Facebook and Twitter posts from automobile/caravanning associations and farming groups, and media reporting in newspapers, radio interviews and website posts. The key peaks in the participation rates around the 5 April to the 12 April aligned with the wider dissemination of the survey via these media mechanisms.
2.4. Analysis
Descriptive data will be presented, including numbers (presented in brackets as n=), percentages and descriptive statistics, as relevant. The responses were downloaded as a Statistical Package for the Social Sciences (SPSS) file. The statistical analysis of the results was undertaken using SPSS (Version 22) in the form of descriptive analysis, chi square tests of independence and trend, Kruskal–Wallis tests, and Mann–Whitney U post hoc tests [27]. The statistical precision was set at p < 0.05. The assumptions of the tests were checked and met prior to reporting.
2.5. Ethics
This project received ethics approval on 5 February 2018 from the James Cook University Human Research Ethics Committee (JCU HREC) (Human Ethics Approval Number H7284). The consent process was implied and outlined by the use of the statement “‘if you consent to participate–simply start completing the survey”. In the introduction to the survey, the potential participants were also informed that, should they wish to stop participating at any time, they could do so by closing the survey window.
3. Results
3.1. Participant Demographics
A total of 239 people completed the survey about their interactions with LAVs; the key characteristics included a preponderance of male participants (n = 203, 84.9%), and the respondents’ residence in the state of Queensland (n = 83, 34.7%) (Table 2). The highest frequency age categories of the participants were 65–74 years (n = 88, 37.9%) and 55–64 years (n = 50, 21.6%). All of the participants had driven a motor vehicle on the road in Australia. The most common license types held by the participants were car licenses (n = 164, 68.6%), at least one type of truck license (n = 142, 59.4%), and a motorbike licenses (n = 74, 31%). The average period of driving, taken as a proxy of the number of years since first receiving a driving license, was 41.0 years (SD = 14.6). More than half of the participants indicated that they live in a rural town (n = 152, 63.6%), and this aligns with their self-reported driving on rural roads, with 56.1% (n = 134) having indicated that they drive on rural roads because they live in rural Australia. About a half of participants (n = 124, 51.9%) indicated that they drive on rural roads three or more times a week, or more often, with cars being the most common vehicles being driven (n = 175, 73.2%). There were 33 (13.8%) participants who indicated that they do drive LAVs as a vehicle typically driven on rural roads, although it is not known how often they do so. Tractors were the most common LAV specified, including with and without implements attached (n = 28, 11.7%).
3.2. Experiences in Agriculture
More than half of the participants (n = 150, 62.8%) indicated that they had worked in the agriculture industry at some point, and had driven an LAV on a public road (n = 134, 56.1%) (Table 2). Only ten participants stated that they have never worked in the agricultural industry but had driven an LAV like a tractor or harvester on a public road. There was a significant difference in the age of individuals who stated that they had worked in agriculture with a high percentage of adults (18–54 years) indicating they had worked in agriculture compared to those aged 55 years and older (with 87.8% of all of the participants who hadn’t worked in agriculture falling within this age group) (p < 0.01). There was also a significant difference in the LAV on-road driving experience between the age groups, such that a higher proportion of adults aged 18 to 54 had driven an LAV on-road compared to the 55 years and older age group (with this age group accounting for 85.7% of all of those who hadn’t operated an LAV on a public road) (p < 0.01). Significantly more of the women in the sample (n = 21, 70% of the female participants) indicated that they hadn’t driven an LAV on a public road than men (n = 80, 39.6% of the male participants) (p < 0.01). Likewise, significantly more people living in rural towns had worked in agriculture (n = 112, 73.7% of all rural town dwelling participants) (p < 0.01) and driven an LAV on a public road (n = 95, 62.5% of all rural town dwelling participants) (p < 0.01) than people living in a major city (n = 16, 27.6% of major city-dwelling participants had worked in the agriculture industry; n = 14, 23.7% of major city-dwelling participants had operated an LAV on a public road). All of the participants who reside in a remote town had worked in agriculture and driven an LAV on a public road (n = 22).
3.3. LAV Interaction Experiences
Almost all of the participants had interacted with at least one LAV whilst driving on a public road (n = 231, 99.1%), and the majority believe that they have a right to drive on the road (n = 222, 92.9%). Of the 220 participants (92%) who provided a response to how often they had encountered an LAV on a road in the previous 12 months, 216 participants had encountered at least one LAV on the road. The average number of encounters was 26.3 (SD = 61.42, Range 0–500).
Kruskal-Wallis tests were undertaken in order to explore whether participant age, rurality of residence and frequency of rural road driving influenced the number of LAV encounters reported. The age of the participants affected the number of self-reported LAV encounters in the previous 12 months; H(3) = 41.61, p = 0.000. The participants aged between 18 to 34 years self-reported more LAV encounters (Mdn = 40) than those aged 35–44 (Mdn = 35), 45–54 (Mdn = 14), and 55 years and older (Mdn = 6). Post-hoc Mann-Whitney tests using a Bonferroni-adjusted alpha level of 0.0125 (0.05/4) were used to compare all of the age groups. The difference in LAV encounters between the age groups was significant for those aged 18-34 years and 55 years and older (p < 0.001); participants aged 35–44 years and 55 years and older (p < 0.001); and participants aged 45–54 and 55 years and older (p < 0.001). None of the other comparisons were significant after the Bonferroni adjustments. The rurality of residence affected the number of self-reported LAV encounters in the previous 12 months; H(2) = 16.463, p = 0.000. The participants who resided in remote towns self-reported more LAV encounters (Mdn = 14) than those residing in rural towns (Mdn = 8) and major cities (Mdn = 5.5). Post-hoc Mann-Whitney tests using a Bonferroni-adjusted alpha level of 0.017 (0.05/3) were used to compare by the rurality of residence categories. The difference in LAV encounters between the rurality of residence was significant for those residing in major cities and rural towns (p < 0.001), and participants residing in major cities and remote towns (p < 0.001). The number of LAV encounters was not significantly different for those residing in rural and remote towns (p = 0.302). The frequency of rural driving affects the number of self-reported LAV encounters in the previous 12 months, H(2) = 36.97, p = 0.000. The participants who reported driving on rural roads every day self-reported more LAV encounters (Mdn = 20) than those driving once a week or more (Mdn = 6.5), and those driving once a month or less frequently (Mdn = 5). Post-hoc Mann-Whitney tests using a Bonferroni-adjusted alpha level of 0.017 (0.05/3) were used to compare LAV encounters by the frequency of rural driving in the last 12 months. The difference in LAV encounters between the frequencies of rural road driving were significant for all of the categories. Those driving every day compared to those driving once a week or more (p < 0.01); driving every day and once a month or less frequently (p < 0.001); and driving once a week or more and once a month or less frequently (p < 0.01).
Reactions in Response to an LAV
When asked what their first action would be if they saw an LAV on a public road, the most common response was to slow down (n = 193, 80.8%) or pull over (n = 111, 46.4%). The awareness of their presence on roads prior to the first encounter was high, with 94.1% of the participants (n = 225) indicating they were aware prior to their first encounter. When asked about the actions they took when they encountered an LAV, of the eight listed actions, the majority indicated that they took more than one (mean = 4.09; SD = 1.9). The most commonly listed action taken during their most recent encounter was to slow down when they first saw the vehicle (n = 191, 82.7%) (Table 3). The ‘other’ category included: ‘Pulled over’ (n = 9), ‘Contact by Ultra High Frequency (UHF) radio’ (n = 4), and escort or pilot vehicles noted to be present (n = 3). When considering the action undertaken, there were some differences in the responses on the basis of the participant’s experience operating an LAV. The participants without LAV operation experience selected the response ‘only overtake when it is safe to do so’ (n = 80, 79.2%) more than those with LAV operation experience. The most common actions or communication tools used by the LAV operator during their interaction was flashing lights (n = 179, 77.5%) and oversized signs (n = 159, 68.8%) (Table 3). The other category included: ‘Communication via radio’ (n = 8), ‘Made room for other drivers to move around when safe’ (n = 2), ‘Operator was aware of other road user’ (n = 2) and ‘Operator couldn’t pull over due to impinging road conditions’ (n = 1). The participants without LAV operation experience indicated that the LAV operator ‘waved people around’ (n = 42, 41.6%) more frequently than those with LAV experience. Furthermore, those with LAV experience indicated greater awareness of guidance vehicles both in front (n = 67, 51.5%) and behind the LAV (n = 41, 31.5%) than those without the operation experience.
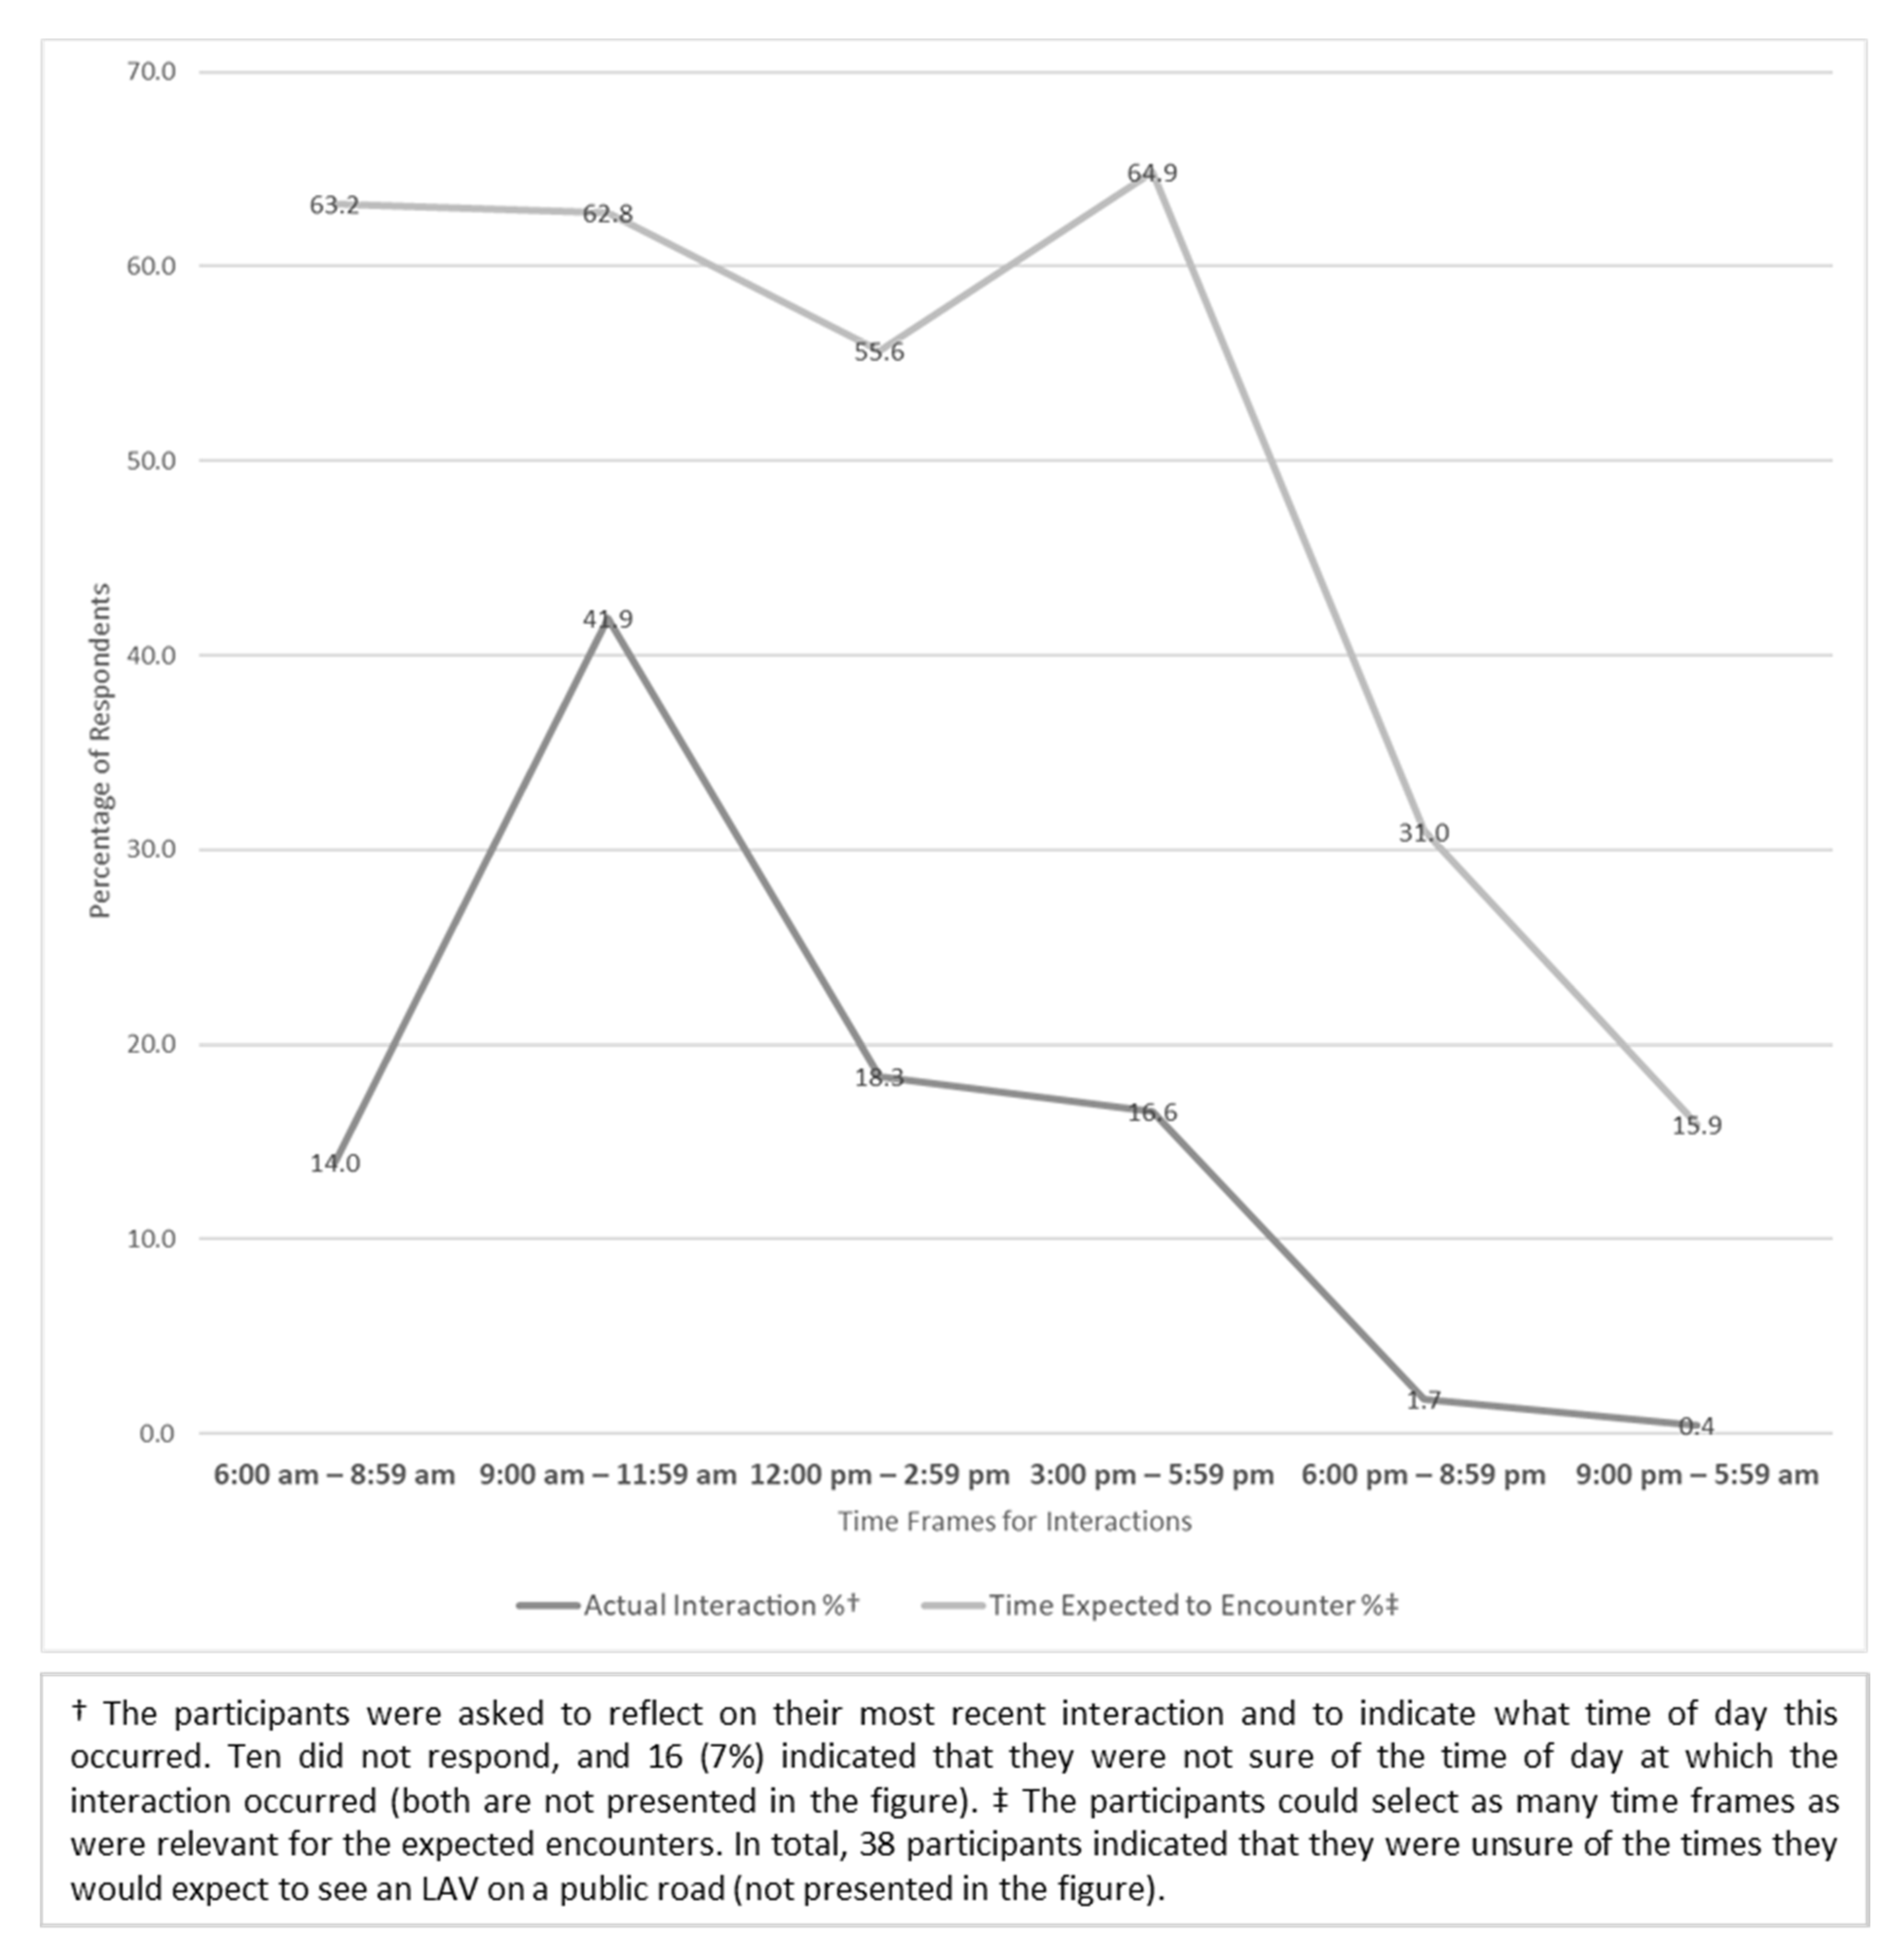
The most common locations where LAV interactions occur are noted to be two-lane bitumen roads with or without markings (n = 80, 33.5% and n = 57, 23.8% respectively) and in rural locations (n = 225, 94.1%). Regardless of the characteristics of their encounters, when asked to indicate their expectations of when LAVs would be present on roads, the following was indicated: one third of the participants (n = 78, 32.6%) indicated that LAVs would be present at all times of the year. Most participants indicated that summer (n = 159, 66.5%) and spring (n = 148, 61.9%) would be key seasons for agricultural activity requiring LAV use on roads. Expectations regarding the time of day the vehicles would be on roads was predominately in the daylight hours between 6 am and 6 pm, with only 31% of the participants (n = 74) indicating that they might be present between 6 pm and 9 pm, and 15.9% of the participants (n = 38) indicated that they would be moved after 9pm and before 6am (Figure 1). Generally, the expectation was that LAVs would be on roads during daylight hours, and this largely reflects the reality of interaction experiences.
3.4. Crash and Near Miss Experiences
Few of the participants had experienced a crash (n = 4, 1.7%) or near miss experience (n = 32, 13.4%) involving an LAV in the past three years. There is a significant difference between having experienced a near miss and their experience driving LAVs (p < 0.01) and having worked in the agricultural industry (p < 0.01), with 87.5% (n = 28) of the near-miss experiences being reported by those who had driven an LAV on a public road, and who had similarly worked in agriculture. Regardless of whether a near miss had been experienced, all of the participants were asked what they perceived to influence near-miss incidents not becoming crash events. It is interesting to note that vigilance in road users was the main factor noted (n = 145, 60.7%), particularly amongst those without LAV experience (n = 72, 71.3%), followed closely by the driving skills of the road users (n = 139, 58.2%) (Table 4).
3.5. LAV Presence and Risk Perception
When asked to articulate which type of vehicle poses the most risk to safety when driving on rural roads, only 8.4% (n = 20) of the participants selected agricultural vehicles, with cars (n = 77, 32.2%), road trains (n = 49, 20.5%) and trucks (n = 47, 19.7%) being the more commonly perceived threat to rural road safety; however, some participants noted, using the ‘other’ response option, that it is the driver who poses the risk, as opposed to a vehicle class (n = 6). When asked if the presence of LAVs on public roads leads to increased risk for other road users, only 7.5% of the participants stated ‘no’ (n = 18). The remainder indicated that there was some increase in risk (n = 181, 75.7%). Those with LAV experience indicated that this risk was low to moderate (n = 58, 54.2%) more often than those without LAV experience (n = 36, 39.1%).The main factors that the participants believed increase the level of risk from LAVs being present on roads are the road and lane widths not providing adequate provisions for these vehicles (n = 131, 72.4%), and the related issue of the size of these vehicles (n = 113, 62.4%) (Table 4). The ‘other’ responses were illustrative, with impatience being raised by a number of individuals as an issue. An example of a response is: “Road users overtake at dangerous points. Impatience a large factor.” There was no significant difference in how people rated the risk of LAVs being present on roads when considering their near-miss experiences (p > 0.05). The participants who indicated that LAVs are hard to maneuver around (i.e., overtake, n = 89, 49.2%) as a factor which increases their risk were also likely to rate the overall risk of LAVs significantly differently (p < 0.05). Of these, 62.1% of those who indicated that this was a factor also rated that LAV presence on roads leads to moderate to high increases in risk.
3.6. Improving Safety
A number of steps to potentially improve safety when LAVs are present on roads were outlined, with the two highest response categories being to include information on how to safely interact with them on all driver’s license tests (n = 148, 61.9%), and improving the capacity of drivers to drive to the road conditions (n = 140, 58.6%) (Table 5). Communicating about LAV presence was the most frequently-selected option (n = 65, 61.9%), and the use of guidance vehicles (n = 56, 53.3%) was the third most common response for those without LAV experience. It was indicated that road signs might be a valuable way to communicate with members of the general public about LAV presence on roads (n = 180, 75.3%) (Table 5). However, in the ‘Other’ category, it was also noted that UHF radio could be useful (n = 20), along with the use of escort and pilot vehicles (n = 7) and the general need for drivers to respond to and be mindful of what is going on in front of them (n = 6). Interestingly, more participants with LAV operation experience selected incorporating information on how to safely interact with LAVs into driver’s license tests as an option to enhance safety (n = 98, 73.1%), whereas the most widely-selected option for those without LAV operation experience was communication about the potential presence of LAVs (n = 65, 61.9%).
4. Discussion
Rural and remote Australia is the location of the majority of the serious road-related injuries and fatalities that occur in Australia [28]. As such, there are specific concerns regarding the human, environmental and vehicle factors which might contribute to this rise in crashes [28]. LAVs are present on rural roads, but it is unknown how often members of the driving public encounter and interact with these vehicles, nor the nature of these interaction experiences (positive, neutral or negative). Rural residents are not the only people using rural roads, so the exploration of LAV interaction experiences amongst members of the general driving public, including both urban and rural perspectives, is important. Rural Australian residents are exposed to, expect to see, and engage in more frequent interactions with LAVs than their urban-dwelling counterparts, given the presence of LAVs on rural roads [9]. While this study initially aimed to obtain interaction experiences from members of the general public, targeting specifically those without their own LAV operation experience, this unfortunately didn’t occur. In hindsight, however, this is likely a reflection of the nature of living within rural communities, including those where agricultural production is common. The findings from this survey highlight that LAV interactions are quite common, and are a function of rural road-usage patterns and also, relatedly, the rurality of residence. Furthermore, the self-reported outcomes of these interactions amongst this sample tend to be neutral, as determined by the low reported crash and near-miss incidents being reported. A consideration of the nature of the LAV use on these roads and insights for safety will be the prioritized for this discussion.
Rural roads are different in their design to other roads [29]; generally, these roads have large shoulders and no line markings, making them non-uniform. It was acknowledged that elements of the road design and the relative size of LAVs are two factors that increase the level of risk from LAVs being present on roads. The options to safely interact with LAVs, or other oversized vehicles, are influenced by the road environment. As such, the response options when an LAV is encountered are going to be situational, and depend on the road environment, the presence of other road users and the specific size specifications of the LAV. All of these factors combine to influence safe interactions; importantly, none of these factors, when viewed from the macro level, are Australian-specific. Detangling the relative influence of each is difficult and, given this, it necessary to review LAV on-road use in the context of the larger road environment. Another factor which should be considered is that LAVs are also likely to be present all year round, because although there are distinct periods of activity, these differ by commodity group, by slight seasonal variations between regions, and due to the need to transport LAVs between regions. In this sample there are very low rates of LAV-related crashes (n = 4) and near miss experiences (n = 32). The crash findings mirror the international literature; the crash risk rates are low compared to the use of these vehicles on roads, the overall road crash numbers [21] and the domestic findings (Table 1) [10]. The participants agreed that vigilance in road users is an important factor when driving, and in response to emerging road conditions and traffic, including LAVs. Maintaining vigilance can be difficult in the rural road environment due to the variability in traffic, uniformity in the external landscape, and long distances, which can easily contribute to experiences of monotony and fatigue [11,28,30,31]. One insightful participant indicated that individual inattentive drivers pose the highest risk to others in the road environment, and this can relate to any vehicle class which they operate. This is important as it is not just the skills of vehicle operators which are important, but also their attention and capacity to adapt their driving to the conditions present [10]. As such, while road users might not expect to encounter an LAV during their journey, the capacity to adapt their driving practices to the situation is an important aspect of safe driving. The same remit goes both ways, such that LAV operators should heed that they are entering a public road and be mindful of other roads users, including their comparative speed, maneuverability, and size differential. This may also include making space allowances for other road users to pass when it is reasonable and safe to do so. Noting that some of the sample have worked in agriculture and even driven an LAV, this familiarity likely enhanced the expression of the dual nature of ensuring safe road interactions. There were noted to be differences in this sample on the basis of their own LAV operation experience, which may cautiously be interpreted as drawing upon their on-road experiences, the interactions they have experienced as an LAV operator, and also a greater insight into the permit specifications currently required for LAV on-road use. One instance of this is the difference noted in the presence of guidance vehicles, such that those with LAV experience indicated these vehicles as being present more frequently than those without LAV experience. Whether this is a function of the salience of these vehicles given the permit requirements or perhaps illustrative of the presence of guidance vehicles more generally is unknown.
Within Australia, the capacity of LAVs to use the roads is increasingly being restricted with permit systems; it is unknown whether this is a response to the hazard they represent, their size, the impact on infrastructure, or other factors. It is noted that there are many challenges for the implementation of effective regulations, but the specificities of the industry and, in this case, the mechanisms of agricultural production are an important consideration [32]. The same holds for LAV permit requirements. LAVs are oversized, but they do not yield the same exposure in terms of road usage patterns as trucks and buses, including the roads used, times of day on-road, and distances [23]. For example, the estimated number of vehicle-kilometers-travelled (VKT) in billion kilometers for buses, articulated trucks and heavy rigid trucks in 2012 in Australia was 19.5 [23]. Currently, it is unknown how many kilometers LAVs travel on rural roads, what routes are taken, or what the frequency of on-road use is generally. A separate survey, specifically targeted at LAV operators as part of this project, sought to obtain preliminary insights into on road use and consideration of relative crash risks. Likewise, understanding the road usage patterns of rural residents would also present some interesting insights regarding the differential road exposure patterns between rural and urban residents.
The majority of participants acknowledged road design and, relatedly, the actual size of the vehicles as being the two factors that are perceived to increase risk when LAVs are present on roads. The increasing size of LAVs is expected to continue, and this, combined with the number of farmers owning discrete land parcels separated by a short distances or intersected by public roads, is going to continue to require LAVs to use public roads [9]. Therefore, LAVs on public roads are something that could be reasonably expected to be encountered, and are unlikely to abate anytime in the future. LAV presence on the roads is seasonal and commodity dependent; however, with the ongoing changes in agriculture and mixed commodity production, it is likely that their movements on roads will become year round [33]. The participants provided some initial insight from a community perspective about their experience interacting with LAVs, and this highlighted that LAVs are not perceived to result in an increase in risk to them as a proxy of their exposure on rural roads.
One important recommendation arising from the survey results is that more work is required to better communicate with the wider driving public about LAV presence, the necessity of it, and how we can all safely navigate the road system together. The need for enhanced communication with the wider driving public is illustrated by the differences in responding to the question about steps to enhance road safety, and the differences seen between those who have LAV operation experience and those who don’t. Those with LAV operation experience highlighted that the incorporation of information about how to safely interact as part of the driver’s licensing requirements would be a high priority, whereas those without this experience generally held that communicating about their general presence would be sufficient. Both of these approaches would likely confer safety benefits, albeit that one aims to instill safe interaction behavior from the onset, whereas the other preferences place-based reminders. The value of place-based reminders is particularly important as Australians love road travel, and the use of rural roads is increasing, particularly amongst caravans owners and non-residents. This is also likely to be enhanced due to restrictions in international travel as a result of COVID-19, seeing more Australians opting to head out on domestic travel, including road trips [34]. This increase in usage has implications for the number of LAV interactions. Preparing the driving public for the hazards present in the rural road environment, the challenges of battling monotony, and the types of vehicles that could be present are all important [11].
Preparation for rural road travel could be twofold, in the form of education regarding how to interact and also alerts within the road environment as to upcoming hazards/worksites, such as through vehicle-activated signs [15]. Adapting driving practices to the road conditions, being considerate of other road users, being patient, and giving LAV operators space were factors that participants indicated could enhance the safety for all road users when LAVs are present. As one participant stated: “If you drive in ‘rural’ areas, you have to expect ‘rural’ activity on rural roads. Machinery, animals, fallen trees etc.” Enhancing the awareness of LAV presence and characteristics (e.g slow moving and oversized) and fostering the capacity to safely interact by instilling some simple driving tips prior to encountering the vehicles would likely be useful. The presence of flashing lights and oversized signs, which were common communication approaches noted by the participants, goes some way to communicating their presence and dimensions at the time of interaction. The fact that these are typically present on the LAVs that participants encountered is encouraging, and is presumably also helped along by the permit specifications [20].
The inclusion of questions in driving tests is a starting point for informing future generations of drivers about how to safely navigate LAV interactions, but ultimately encouraging all drivers to adapt their driving to the prevailing conditions is a fundamental road safety message. Many participants indicated that UHF radios are an important communication tool when navigating rural roads. Radio communication is common amongst truck drivers, and likewise, these radios are present in many rural vehicles. Unfortunately, this doesn’t assist in communicating with vehicles which don’t have these radios, but it can enable communication between operators. The provision of safe road shoulders in order to enable the provision of space for LAVs by other road users and for LAVs to make allowances for traffic are important infrastructure factors, as well as being an important road safety countermeasure more generally [13,14,15,35]. Ultimately, slowing down and moving over are the two main approaches utilized when approaching an LAV. These vehicles aren’t on the roads if they do not need to be, and for the most part, the community responders felt that the LAV operators they had encountered were amenable and made provisions for them to pass when it was safe for all parties.
Limitations and Strengths
This is the first survey of the general public in Australia about LAV interactions. However, there were a few potential limitations to the data, including the use of a convenience sample and the use of predefined options for the questions. The availability of the survey was mainly communicated using social media, and was communicated independently of another survey which aimed to recruit LAV operators. While the survey was targeted for completion by community members who did not have agriculture or LAV driving experience, there were still many individuals captured by this survey who have had agricultural industry work experience and/or LAV driving experience. In order to address this potential limitation, the results were reviewed to see if there were differences in the responses between those with agriculture and/or LAV experience and those without. The reasoning behind this is that these individuals, due to their experiences, might have different perceptions that are not necessarily representative of the general population whom the survey was attempting to reach. Any significant differences between those with and without agriculture and LAV driving experience were outlined as relevant.
The pre-formulated responses were used as a way to encourage easy and quick completion, but may have potentially led to bias in the responses. The responses listed were informed by a prior literature review, and were reviewed by the reference group. Most of the questions also included an ‘other’ category, in order to enable the inclusion of additional points that were not otherwise outlined. This option was used by a few individuals, and these responses were considered and discussed as relevant.
5. Conclusions
Large agricultural vehicles are present on rural roads, and their use is an essential component of agricultural production. This study explored community members’ perspectives about the presence of these vehicles on roads, including their interaction experiences. The results suggest that rural residents commonly interact with LAVs and, amongst this sample, negative interaction events such as crashes or near miss incidents were uncommon. The results provide some preliminary insight into LAV interaction experiences in rural Australia. Ensuring that the driving public is aware that LAVs may be present on rural roads, and how to safety interact are important considerations in order to ensure safe LAV interactions.
Author Contributions
Conceptualization, R.C.F.; methodology, R.C.F. and J.C.K.; formal analysis, J.C.K. and R.C.F.; writing—original draft preparation, J.C.K.; writing—review and editing, L.M.; supervision, R.C.F.; project administration, R.C.F. and J.C.K.; funding acquisition, R.C.F. All authors have read and agreed to the published version of the manuscript.
Funding
This research was funded by the National Farmers Federation (NFF) as one part of a project on Heavy Agricultural Vehicles on roads. The NFF project was funded by the National Heavy Vehicle Regulator through round two of the Heavy Vehicle Safety Initiative.
Institutional Review Board Statement
The study was conducted according to the guidelines of the Declaration of Helsinki, and approved by the Ethics Committee of James Cook University (Approval Number H7284, approved 5 February 2018).
Informed Consent Statement
Implied informed consent was obtained from all subjects involved in the study.
Data Availability Statement
Data available on request due to ethical restrictions. The data presented in this study are available on request from the corresponding author. The data are not publicly available due to the specifications of our data storage in our ethics application.
Acknowledgments
The authors would like to thank the NFF reference group overseeing this project and the National Heavy Vehicle Regulator for their input into and support of the project. The authors would also like to thank the Automobile Association of Northern Territory, the Royal Automobile Association of South Australia, the Australian Automobile Association, and the Australian Caravan Club for their assistance in communicating about our survey.
Conflicts of Interest
The authors declare no conflict of interest. The funders had no role in the design of the study; in the collection, analyses, or interpretation of data; in the writing of the manuscript, or in the decision to publish the results.
References
- Australian Bureau of Statistics. 8155.0—Australian Industry, 2016–2017; Australian Bureau of Statistics: Canberra, Australia, 2018. [Google Scholar]
- National Farmers’ Federation. Food, Fibre and Forestry Facts: A Summary of Australia’s Agriculture Sector; National Farmers’ Federation: Canberra, Australian, 2017; p. 56. [Google Scholar]
- Burton, P.; Lyons, K.; Richards, C.; Amati, M.; Rose, N.; Des Fours, L.; Pires, V.; Barclay, R. Urban Food Security, Urban Resilience and Climate Change; National Climate Change Adaptation Research Facility: Gold Coast, Australia, 2013. [Google Scholar]
- Miller, E.; van Megen, K.; Buys, L. Diversification for sustainable development in rural and regional australia: How local community leaders conceptualise the impacts and opportunities from agriculture, tourism and mining. Rural Soc. 2012, 22, 2–16. [Google Scholar] [CrossRef]
- Ollenburg, C. Farm Tourism in Australia: A Family Business and Rural Studies Perspective. Ph.D. Thesis, Griffith University, Gold Coast, Australia, September 2006. [Google Scholar]
- Thompson, M.; Prideaux, B.; McShane, C.; Dale, A.; Turnour, J.; Atkinson, M. Tourism development in agricultural landscapes: The case of the Atherton Tablelands, Australia. Landsc. Res. 2016, 41, 730–743. [Google Scholar] [CrossRef]
- Lea, E.; Phillips, J.; Ward, M.; Worsley, A. Farmers’ and consumers’ beliefs about community-supported agriculture in Australia: A qualitative study. Ecol. Food Nutr. 2006, 45, 61–86. [Google Scholar] [CrossRef]
- Gorucu, S.; Murphy, D.J.; Kassab, C. Injury risks for on-road farm equipment and horse and buggy crashes in Pennsylvania: 2010–2013. Traffic Inj. Prev. 2017, 18, 286–292. [Google Scholar] [CrossRef] [PubMed]
- Ritzinger, A.; Di Cristofor, R.; Nolan, D.; Kenwright, J. Future Challenges of Changing Agricultural Equipment; Austroads: Sydney, Australia, 2016; p. 83. [Google Scholar]
- Miller, L.; Franklin, R.C.; King, J.C. Large agricultural vehicle operator’s risk perceptions and interaction experiences on public roads in Australia. J. Agromed. 2021. under review. [Google Scholar]
- Tziotis, M.; Mabbott, N.; Edmonston, C.; Sheehan, M.; Dwyer, J. Road Safety in Rural and Remote Areas of Australia; Austroads: Sydney, Australia, 2005; p. 168. [Google Scholar]
- State of Queensland Department of Transport and Main Roads. Supplement to Austroads Guide to Road Design Part 3: Geometric Design; Department of Transport and Main Roads: Brisbane, Australia, 2016; p. 66. [Google Scholar]
- Austroads; Tziotis, M.; Pyta, V.; McLean, J. Heavy Vehicle Safety in Rural and Remote Areas; Austroads: Sydney, Australia, 2009; pp. 1–87. [Google Scholar]
- Austroads; McLean, J. Effects of Sealed Shoulders on Road User Costs; Austroads: Sydney, Australia, 2001; p. 54. [Google Scholar]
- Wundersitz, L.; Palamara, P.; Brameld, K.; Thompson, J.; Raftery, S.; Govorko, M. Guide to Road Safety Part 5: Road Safety for Regional and Remote Areas, 2nd ed.; Austroads: Sydney, Australia, 2019; p. 66. [Google Scholar]
- National Heavy Vehicle Regulator. Classes of Heavy Vehicles. In Road Access—Mass, Dimension and Loading; NHVR: Fortitude Valley, Australia, 2018. Available online: https://www.nhvr.gov.au/road-access/mass-dimension-and-loading/classes-of-heavy-vehicles (accessed on 27 June 2018).
- Herrmann, A.; Pickel, P.; Fröba, N. Transport speeds of tractors—The effect of different rated top speeds. Landtechnik 2000, 55, 338–339. [Google Scholar]
- Garvey, P.M. Motorist comprehension of the slow-moving vehicle (SMV) emblem. J. Agric. Saf. Health 2003, 9, 159–169. [Google Scholar] [CrossRef] [PubMed]
- McBain-Rigg, K.E.; Franklin, R.C.; King, J.C.; Lower, T. Influencing safety in Australian agriculture and fisheries. J. Agromed. 2017, 22, 347–357. [Google Scholar] [CrossRef]
- National Heavy Vehicle Regulator. Agricultural Vehicles Factsheet; NHVR: Fortitude Valley, Australia, 2014. Available online: https://www.nhvr.gov.au/files/201402-0111-agricultural-vehicles.pdf (accessed on 27 June 2018).
- Franklin, R.C.; King, J.C.; Riggs, M. A systematic review of large agriculture vehicles use and crash incidents on public roads. J. Agromed. 2019, 25, 14–27. [Google Scholar] [CrossRef]
- Bureau of Infrastructure Transport and Regional Economics. Road Trauma Australia 2016 Statistical Summary; BITRE: Canberra, Australia, 2017; p. 71. [Google Scholar]
- Bureau of Infrastructure Transport and Regional Economics. Road Trauma Involving Heavy Vehicles—Annual Summaries; BITRE: Canberra, Australia, 2017. [Google Scholar]
- Henley, G.; Harrison, J. Hospitalised Farm Injury, Australia, 2010–2011 to 2014–15; Australian Institute of Health and Welfare: Canberra, Australia, 2018. [Google Scholar]
- Australian Bureau of Statistics. Estimated Resident Population. Persons, Australia; Australian Bureau of Statistics: Canberra, Australia, 2018. [Google Scholar]
- Franklin, R.C.; King, J.C.; Miller, L. Large Agricultural Vehicles on Roads in Australia; National Farmers’ Federation: Barton, Australia, 2018; p. 29. [Google Scholar]
- IBM Corporation. IBM SPSS Statistics for Windows, Version 22.0; IBM Corporation: Armonk, NY, USA, 2013. [Google Scholar]
- Centre for Accident Research & Road Safety—Queensland. Rural and Remote Road Safety—State of the Road; CARRS-Q: Brisbane, Australia, 2017. [Google Scholar]
- Harland, K.K.; Bedford, R.; Wu, H.; Ramirez, M. Prevalence of alcohol impairment and odds of a driver injury or fatality in on-road farm equipment crashes. Traffic Inj. Prev. 2018, 19, 230–234. [Google Scholar] [CrossRef]
- Larue, G.S.; Rakotonirainy, A.; Pettitt, A.N. Driving performance impairments due to hypovigilance on monotonous roads. Accid. Anal. Prev. 2011, 43, 2037–2046. [Google Scholar] [CrossRef] [PubMed] [Green Version]
- Fletcher, A.; McCulloch, K.; Baulk, S.D.; Dawson, D. Countermeasures to driver fatigue: A review of public awareness campaigns and legal approaches. Aust. N. Z. J. Public Health 2005, 29, 471–476. [Google Scholar] [CrossRef] [Green Version]
- Franklin, R.C.; McBain-Rigg, K.E.; Knight, S.M. Factors to be considered in developing occupational regulations for quad bikes in Australia. J. Agromed. 2015, 20, 370–380. [Google Scholar] [CrossRef]
- Anson, G.; Austroads. Guidelines for Assessing Heavy Vehicle Access to Local Roads; Austroads: Sydney, Australia, 2010; p. 67. [Google Scholar]
- Tourism Research Australia. Moving Forward—The Role of Domestic Travel in Australia’s Tourism Recovery; Austrade: Canberra, Australia, 2020; p. 12. [Google Scholar]
- King, J.C.; Franklin, R.C.; Devine, S.; Watt, K.; Leggat, P.E. Exploring Australian residents cycling engagement—differences in self-reported cycling behaviour between urban and rural dwelling Queenslanders. Health Promot. J. Austr. 2019, 31, 93–103. [Google Scholar] [CrossRef]
Figure 1.
LAV Interactions: expected time of interactions and actual recent interaction times.


Table 1.
Australian national data on road transport fatalities and injuries by vehicle type and rurality of occurrence.
Table 1.
Australian national data on road transport fatalities and injuries by vehicle type and rurality of occurrence.
| Overall Road Crashes [22] | Heavy Vehicles 1 [23] | LAV on-road [9,24] | |||||||
|---|---|---|---|---|---|---|---|---|---|
| Crash Incident by Rurality for Fatalities and Injuries | Urban Fatalities | Rural and Remote Fatalities 2 | Urban Hospitalized Injuries | Rural and Remote Hospitalized Injuries 2 | Urban Ftalities | Rural and Remote Fatalities 2 | Crash Incident Number | Fatalities | Hospitalized Injuries |
| Time Frame | 2008–2015 | 2008–2014 | 2008–2015 | Data varies by State/Territory–Range: 2005–2016 | 2010–2015 | ||||
| N (%) | 6502 (68.6) | 2968 (31.3) | 200,746 (85.4) | 34,218 (14.6) | 965 (64.9) | 522 (35.1) | 677 | 24 | 48 |
| Number per annum | 813 | 371 | 28,678 | 4888 | 121 | 65 | 56 | 2 | 8 |
| Crude Rate per 100,000 Australian population per annum 3 | 3.46 road crash fatalities | 1.58 road crash fatalities | 122.16 hospitalized crash injuries | 20.82 hospitalized crash injuries | 0.52 crash fatalities | 0.28 crash fatalities | 0.24 crash numbers | 0.009 crash fatalities | 0.034 hospitalized crash injuries |
1 There were 3,255,534 heavy rigid and articulated truck registrations between 2008 and 2015. 2 ‘Rural and remote’ includes the Outer Regional, Remote and Very Remote Categories. 3 The crude rate was calculated based on the estimated resident population of Australia as of June 2014, which was 23,475,686, and the average number of deaths/hospitalisations per annum [25]. The year 2014 was selected as the denominator for the crude calculations, as all of the data incorporates the time frame of 2014. This table was reproduced from the project report, which was submitted to the funders, with permission of authors [26].
Table 2.
Bivariate associations between the demographic variables by the status of the previous/current agricultural industry engagement and experience driving LAV vehicles.
Table 2.
Bivariate associations between the demographic variables by the status of the previous/current agricultural industry engagement and experience driving LAV vehicles.
| Parameter | N (%) † | Worked in Agriculture Industry | Driven LAV on Public Roads before | ||||
|---|---|---|---|---|---|---|---|
| Yes (n = 150, 64.7%) | No (n = 82, 35.3%) | p Value | Yes (n = 134, 56.1%) | No (n = 105, 43.9%) | p Value | ||
| n (%) | n (%) | n (%) | n (%) | ||||
| Gender | |||||||
| Male | 203 (84.9) | 135 (66.8) | 67 (33.2) | 0.072 | 122 (60.1) | 81 (39.9) | 0.002 * |
| Female | 30 (12.6) | 15 (50) | 15 (50) | 9 (30) | 21 (70) | ||
| Age Group | |||||||
| 18–34 years | 23 (9.6) | 19 (82.6) | 4 (17.4) | 0.000 * | 17 (73.9) | 6 (26.1) | 0.000 * |
| 35–44 years | 25 (10.5) | 24 (96) | 1 (4) | 22 (88) | 3 (12) | ||
| 45–54 years | 29 (12.1) | 24 (82.8) | 5 (17.2) | 23 (79.3) | 6 (20.7) | ||
| 55 years and older | 161 (67.4) | 82 (53.2) | 72 (46.8) | 71 (44.1) | 90 (55.9) | ||
| State or Territory of Residence | |||||||
| Queensland | 83 (34.7) | 52 (63.4) | 30 (36.6) | 0.681 | 50 (60.2) | 33 (39.8) | 0.590 |
| New South Wales & Australian Capital Territory | 42 (17.6) | 27 (64.3) | 15 (35.7) | 22 (52.4) | 10 (47.6) | ||
| Victoria & Tasmania | 47 (19.7) | 30 (63.8) | 17 (36.2) | 24 (51.1) | 12 (48.9) | ||
| South Australia & Western Australia & Northern Territory | 55 (23) | 40 (72.7) | 15 (27.3) | 34 (61.8) | 21 (38.2) | ||
| Rurality of Residence | |||||||
| Major City | 59 (24.7) | 16 (27.6) | 42 (72.4) | 0.000 * | 14 (23.7) | 45 (76.3) | 0.000 * |
| Rural Town | 152 (63.6) | 112 (73.7) | 40 (26.3) | 95 (62.5) | 57 (37.5) | ||
| Remote Town | 22 (9.2) | 22 (100) | 0 (0) | 22 (100) | 0 (0) | ||
* p < 0.05; † These percentages do not include questions that were unanswered, which were gender (n = 6), age range (n = 1), state or territory of residence (n = 12), and rurality of residence (n = 6).
Table 3.
Large agricultural vehicles on roads: Recall of most recent interaction experience/s.
| Variable | Responses | Total | No LAV Experience | LAV Experience | |||
|---|---|---|---|---|---|---|---|
| N | % 1 | n | % 1 | n | % 1 | ||
| Actions Driver Takes when Encounters LAV on road | ‘Slowed down when saw the vehicle ahead’ | 191 | 82.7 | 79 | 78.2 | 112 | 86.2 |
| ‘Only overtook the vehicle when it was safe to do so’ | 176 | 76.2 | 80 | 79.2 | 96 | 73.8 | |
| ‘Ensured adequate provision of space when overtaking’ | 145 | 62.8 | 66 | 65.3 | 79 | 60.8 | |
| ‘Gave the vehicle some space when following behind’ | 132 | 57.1 | 64 | 63.4 | 68 | 52.3 | |
| ‘Upon merging, following overtaking, provided plenty of space for the agricultural vehicle’ | 125 | 54.1 | 59 | 58.4 | 66 | 50.8 | |
| ‘Followed any hand signaled advice from the LAV operator’ | 94 | 40.7 | 47 | 46.5 | 47 | 36.2 | |
| ‘Slowed down once behind the vehicle’ | 64 | 27.7 | 28 | 27.7 | 36 | 27.7 | |
| ‘Other’ | 19 | 8.2 | 7 | 6.9 | 12 | 9.2 | |
| Actions or communication tools noted to be used by LAV operator during interactions | ‘Flashing lights were on the vehicle and in use’ | 179 | 77.5 | 69 | 68.3 | 110 | 84.6 |
| ‘Signs located on vehicle indicated it was oversize’ | 159 | 68.8 | 66 | 65.3 | 93 | 71.5 | |
| ‘Guidance vehicles situated in front of vehicle’ | 107 | 46.3 | 40 | 39.6 | 67 | 51.5 | |
| ‘Pulled over’ | 101 | 43.7 | 41 | 40.6 | 60 | 46.2 | |
| ‘Waved people around’ | 96 | 41.6 | 42 | 41.6 | 54 | 41.5 | |
| ‘Use of indicators’ | 85 | 36.8 | 29 | 28.7 | 56 | 43.1 | |
| ‘Flags present on the vehicle’ | 75 | 32.5 | 18 | 17.8 | 57 | 43.8 | |
| ‘Use of headlights’ | 71 | 30.7 | 18 | 17.8 | 53 | 40.8 | |
| ‘Guidance vehicles situated behind vehicle’ | 67 | 29 | 26 | 25.7 | 41 | 31.5 | |
| ‘Signs located on vehicle indicating it was slow moving’ | 46 | 19.9 | 13 | 12.9 | 33 | 25.4 | |
| ‘Continued to drive in the centre’ | 23 | 10 | 12 | 11.9 | 11 | 8.5 | |
| ‘Other’ | 14 | 6.1 | 3 | 3 | 11 | 8.5 | |
| ‘Driver didn’t appear to take any actions’ | 10 | 4.3 | 5 | 5 | 5 | 3.8 | |
| ‘Vehicle appeared to speed up’ | 0 | 0 | 0 | 0 | 0 | 0 | |
1 Excludes non-responders.
Table 4.
Large agricultural vehicles’ presence on roads: Risk perception.
| Variable | Responses | Total | No LAV Experience | LAV Experience | |||
|---|---|---|---|---|---|---|---|
| N | % 1 | n | % 1 | n | % 1 | ||
| Factors influencing ‘near miss’ incidents between LAV and other road users, not becoming a crash | ‘Driver Vigilance-Awareness and monitoring of other road users’ | 145 | 60.7 | 72 | 71.3 | 65 | 55.6 |
| ‘Driving skills of road users’ | 139 | 58.2 | 60 | 59.4 | 71 | 60.7 | |
| ‘Presence of a road shoulder enabling the agriculture vehicles to be maneuvered off the road’ | 98 | 41.0 | 45 | 44.6 | 53 | 45.3 | |
| ‘Reaction time of road users’ | 82 | 34.3 | 37 | 36.6 | 45 | 38.5 | |
| ‘Past experiences interacting with LAV increased awareness of actions to take’ | 72 | 30.1 | 36 | 35.6 | 36 | 30.8 | |
| ‘Vigilance in LAV operators-Awareness and monitoring of other road users’ | 71 | 29.7 | 37 | 36.6 | 34 | 29.1 | |
| ‘Past LAV operator experiences interacting with other road users increased awareness of actions to take’ | 62 | 25.9 | 22 | 21.8 | 40 | 34.2 | |
| ‘Signage about the potential presence of LAV on roads’ | 60 | 25.1 | 29 | 28.7 | 31 | 26.5 | |
| ‘Visibility of LAV from a distance’ | 57 | 23.8 | 32 | 31.7 | 24 | 20.5 | |
| ‘Driving skills of LAV operator’ | 55 | 23.0 | 30 | 29.7 | 24 | 20.5 | |
| ‘Timing—no upcoming traffic’ | 47 | 19.7 | 22 | 21.8 | 25 | 21.4 | |
| ‘Reaction time of LAV operators’ | 27 | 11.3 | 11 | 10.9 | 15 | 12.8 | |
| ‘Speed restrictions imposed on roads’ | 15 | 6.3 | 9 | 8.9 | 6 | 5.1 | |
| ‘Other’ | 11 | 4.6 | 4 | 4 | 6 | 5.1 | |
| ‘Not sure what factors influence near miss events’ | 9 | 3.8 | 6 | 5.9 | 2 | 1.7 | |
| Presence of LAV leads to increased risk for other road users | Low to moderate elevation in risk | 94 | 47.2 | 36 | 39.1 | 58 | 54.2 |
| Moderately elevated risk | 61 | 30.7 | 35 | 38 | 26 | 24.3 | |
| No increase in risk | 39 | 19.6 | 18 | 19.6 | 21 | 19.6 | |
| High elevation in risk | 5 | 2.5 | 3 | 3.3 | 2 | 1.9 | |
| Factors that increase the level of risk from LAV being present on public roads 2 | ‘Road and lane widths don’t provide adequate provisions for these vehicles’ | 131 | 72.4 | 60 | 72.3 | 71 | 72.4 |
| ‘Size of the LAV’ | 113 | 62.4 | 56 | 67.5 | 57 | 58.2 | |
| ‘Maximum speed is slower than other road users’ | 102 | 56.4 | 46 | 55.4 | 56 | 57.1 | |
| ‘Low level of awareness from the public of their presence’ | 92 | 50.8 | 27 | 32.5 | 65 | 66.3 | |
| ‘Hard to maneuver around these vehicles i.e., to overtake’ | 89 | 49.2 | 50 | 60.2 | 39 | 39.8 | |
| ‘Other’ e.g. impatience of drivers, perceptions of safe distances | 21 | 11.6 | 6 | 7.2 | 15 | 15.3 | |
| ‘LAV operators don’t move over to allow other road users to safely pass’ | 20 | 11 | 12 | 14.5 | 8 | 8.2 | |
| ‘Time of day LAVs are present is inconvenient’ | 19 | 10.5 | 12 | 14.5 | 8 | 8.2 | |
| ‘LAV operators don’t account for the speed of other road users when they pull out onto the road’ | 17 | 9.4 | 10 | 12 | 7 | 7.1 | |
| ‘Visibility of these vehicles is low’ | 11 | 6.1 | 6 | 7.2 | 5 | 5.1 | |
| ‘All of the above | 10 | 5.5 | 4 | 4.8 | 6 | 6.1 | |
| ‘There are a high number of LAV moving on public roads’ | 6 | 3.3 | 1 | 1.2 | 5 | 5.1 | |
| ‘The time of year these vehicles are present is inconvenient—i.e., during school holiday periods’ | 4 | 2.2 | 3 | 3.6 | 1 | 1 | |
| ‘None of the above’ | 1 | 0.6 | 0 | 0 | 1 | 1 | |
| ‘Unsure about what specifically increases the risk only it does’ | 1 | 0.6 | 1 | 1.2 | 0 | 0 | |
1 Excludes non-responders; 2 This question was only asked to those individuals who indicated a score on the risk question equal to or higher than 1, i.e., they didn’t indicate ‘No increase in risk’ (a zero response on the sliding scale).
Table 5.
Prevention and awareness-raising opportunities.
| Variable | Responses | Total | No LAV Experience | LAV Experience | |||
|---|---|---|---|---|---|---|---|
| N | % 1 | n | % 1 | n | % 1 | ||
| Potential steps to enhance safety of all road users when LAV are present | ‘Information on how to safely interact with LAVs on driver’s licence tests’ | 148 | 61.9 | 50 | 47.6 | 98 | 73.1 |
| ‘Capacity of drivers to use adaptive driving practices (driving to the road conditions)’ | 140 | 58.6 | 59 | 56.2 | 81 | 60.4 | |
| ‘Communicating about their potential presence’ | 133 | 55.6 | 65 | 61.9 | 68 | 50.7 | |
| ‘Require guidance vehicles to indicate their presence to on-coming and up-coming traffic’ | 95 | 39.7 | 56 | 53.3 | 39 | 29.1 | |
| ‘Alert systems which indicate that LAV are present on roads’ | 93 | 38.9 | 49 | 46.7 | 44 | 32.8 | |
| ‘Require specific licensing for operation of these vehicles’ | 49 | 20.5 | 33 | 31.4 | 16 | 11.9 | |
| ‘Reduce the speed limits at known agricultural intersections’ | 48 | 20.1 | 27 | 25.7 | 21 | 15.7 | |
| ‘Age restrictions on who can operate LAV on public roads’ | 46 | 19.2 | 21 | 29.5 | 15 | 11.2 | |
| ‘Other’ | 34 | 14.2 | 12 | 11.4 | 22 | 16.4 | |
| ‘All of the above’ | 13 | 5.4 | 8 | 7.6 | 5 | 3.7 | |
| ‘None of the above’ | 1 | 0.4 | 1 | 1 | 0 | 0 | |
| Potential Communication Platforms to alert drivers to presence of LAV on roads | ‘Road signs’ | 180 | 75.3 | 90 | 85.7 | 90 | 67.2 |
| ‘Local radio broadcasts’ | 65 | 27.2 | 19 | 18.1 | 46 | 34.3 | |
| ‘Television Advertisements’ | 55 | 23 | 12 | 11.4 | 52 | 38.8 | |
| ‘Brochures at Driver Reviver sites’ | 53 | 22.2 | 10 | 9.5 | 45 | 33.6 | |
| ‘Billboard announcements’ | 52 | 21.8 | 21 | 20 | 32 | 23.9 | |
| ‘Social media’ | 44 | 18.4 | 22 | 21 | 30 | 22.4 | |
| ‘Other’ | 44 | 18.4 | 15 | 14.3 | 29 | 21.6 | |
1 Excludes non-responders.
Publisher’s Note: MDPI stays neutral with regard to jurisdictional claims in published maps and institutional affiliations. |
© 2021 by the authors. Licensee MDPI, Basel, Switzerland. This article is an open access article distributed under the terms and conditions of the Creative Commons Attribution (CC BY) license (http://creativecommons.org/licenses/by/4.0/).
Share and Cite
MDPI and ACS Style
King, J.C.; Franklin, R.C.; Miller, L. Traversing Community Attitudes and Interaction Experiences with Large Agricultural Vehicles on Rural Roads. Safety 2021, 7, 4. https://0-doi-org.brum.beds.ac.uk/10.3390/safety7010004
AMA Style
King JC, Franklin RC, Miller L. Traversing Community Attitudes and Interaction Experiences with Large Agricultural Vehicles on Rural Roads. Safety. 2021; 7(1):4. https://0-doi-org.brum.beds.ac.uk/10.3390/safety7010004
Chicago/Turabian StyleKing, Jemma C., Richard C. Franklin, and Lauren Miller. 2021. "Traversing Community Attitudes and Interaction Experiences with Large Agricultural Vehicles on Rural Roads" Safety 7, no. 1: 4. https://0-doi-org.brum.beds.ac.uk/10.3390/safety7010004
Note that from the first issue of 2016, this journal uses article numbers instead of page numbers. See further details here.