Article

A Comprehensive Approach Combining Regulatory Procedures and Accident Data Analysis for Road Safety Management Based on the European Directive 2019/1936/EC

Department of Civil Engineering, Arcavacata Campus (CS), University of Calabria, 87036 Rende, Italy
*
Author to whom correspondence should be addressed.
Submission received: 2 December 2020 / Revised: 10 January 2021 / Accepted: 14 January 2021 / Published: 18 January 2021
(This article belongs to the Special Issue Sustainable and Safe Road Design)

Abstract

:
The European Union policy for road safety management is based on the European Directive 2019/1936/EC. Among the safety management procedures and strategies, road safety inspections (RSI) are an effective tool for preventing accident risk and reducing crash frequency and severity for existing road networks. The European Transport Safety Council encourages the extension of these measures to the main urban and rural roads by the 5th Road Safety Action Programme. In light of the above, in this study, a safety performance evaluation through the RSI approach is carried out for a high-risk rural road in Southern Italy in order to identify all the road infrastructure-related features with poor safety conditions. Afterwards, the relationship between infrastructure deficiencies and the frequency and severity of accidents is investigated; a significant relationship between accident density/total number of injured people and road markings gap is found. Furthermore, the results confirm that a high density of driveways strongly impacts crash frequency. The analysis of the contribution of multiple infrastructure-related variables on the crash occurrences is proposed by the identification of several mathematical models. A second-order AIC (Akaike’s information criterion) approach is carried out to compare the five fitted models investigated. Finally, a prediction calibrated model is proposed.

1. Introduction

Improving road safety has been a key issue for road management in the last decades. According to the Global Status Report on Road Safety 2018 [1], the number of annual road traffic deaths has reached 1.35 million and traffic injuries represent the leading cause of death for people aged 5–29 years. Together with driver behaviour and vehicles, infrastructure is one of the five pillars identified by the World Health Organisation to be adequately managed for ensuring high levels of safety in road traffic [2].
Since 1980, when the concept of infrastructure safety monitoring was born in the United Kingdom [3], several directives and mandatory procedures related to this topic have been published. In response to this concept, the European Union policy for road safety across the Trans-European Transport Network (TEN–T), the European Directive 2008/96/EC [4] was published as a set of rules aimed at the identification of adequate strategies and appropriate safety management practices to reduce and prevent accident risk as well as fatality frequency and severity. The target to be reached is that of reducing road deaths by 2020, by activities conducted at the national, regional, and global levels, as stated by the United Nations General Assembly [5]. In particular, the 5th Road Safety Action Programme [6] encourages the extension of the measures of Directive 2008/96/EC to all EU co-financed roads and to main urban and main rural roads and to invest in high-risk roads with a high percentage of traffic, with the specific goal to reduce the number of road traffic fatalities and injuries by 50% between 2020 and 2030.
The Directive 2008/96/EC [4] requires member states to establish and carry out adequate procedures for the following: (i) identification and monitoring of unsafe features of existing infrastructures, i.e., road safety inspections (RSIs); (ii) analysis of potential road unsafe characteristics from planning to early operation, i.e., road safety audits (RSAs); (iii) management of road network safety, network safety ranking (NSR); and (iv) analysis of the impact of a new road on the safety performance of the existing road network, i.e., road safety impact assessments (RSIAs). Other procedures are also covered by Directive 2008/96/EC, such as efficiency assessment tools (EATs), network operation (NO), road infrastructure safety performance indicators (SPIs), road assessment programs (RAPs), high risk sites (HRSs), and in-depth study (IDS) [7,8]. These procedures cover all life cycle phases of a road infrastructure, from planning to maintenance, integrating safety in every stage, thus, leading to a comprehensive reactive and proactive approach to safety management known as RISM (road infrastructure safety management) [8]. RISM procedures support authorities in decision making, ensuring the optimization of the benefit–cost ratio through the investment of resources in road safety interventions with high crash reduction potential [8]. Furthermore, RISM outlines a minimum set of mandatory road safety management rules [9,10,11] and the exchange of good practice in road safety management [7,9]. The weakest element of Directive 2008/96/EC is the restricted application to the trans-European road network [9]. This Directive has been amended by Directive 2019/1936/EC which includes, in this scope, motorways and other primary roads [12]. Higher road safety levels have been achieved from member states which have applied RISM procedures to their roads that are not included in the TEN-T network [13,14].
Today, RSIs have a unique way of being carried out throughout the European territory by the entry into force of the European Directive 2019/1936/EC that univocally coded these procedures.
For existing roads, safety inspection procedures are strictly related to infrastructure improvements and, consequently, to the need of defining and implementing several remedial measures for treatment of risk sections. However, figuring out a plan of remedial measures is hindered by the lack of economic resources. Consequently, a short-term implementation is not always possible. At the operational stage, in order to prevent accidents and obtain safer road conditions, it is important to identify all the elements to be improved with low-cost treatments during routine maintenance, given the impossibility of directly intervening on roadway geometric features [15]. In the design phase, RSAs represent a detailed systematic and technical safety check relating to the design characteristics of a road infrastructure in order to identify potential unsafe features, contributing also to a reduction in the cost of accidents.
In light of the above, competent authorities could possibly minimize on-site interventions after construction and maximize benefits by targeting investments using the limited resources available for roads construction and maintenance [16]. However, it is important to highlight that common reasons which do not facilitate the application of RISM procedures are the lack of resources, appropriate tools (such as software applications), and dedicated manuals and guidelines [8,17,18,19]. Furthermore, it is difficult to estimate and assign to the RISM procedures a specific impact in terms of a reduction of traffic victims [11]. Although not many studies show the effectiveness of the measures adopted to correct safety deficiencies identified during an inspection, it can be said that a reduction in the frequency and magnitude of accidents and a decrease in potential accident costs are the most important benefits derived from road safety inspections [20,21]. The impacts of the most common RISM procedures (RSI and RSA) on accident data are summarized in Table 1, where reference values are derived from a deep bibliographic analysis of previous studies. Collected data are briefly discussed below Table 1.
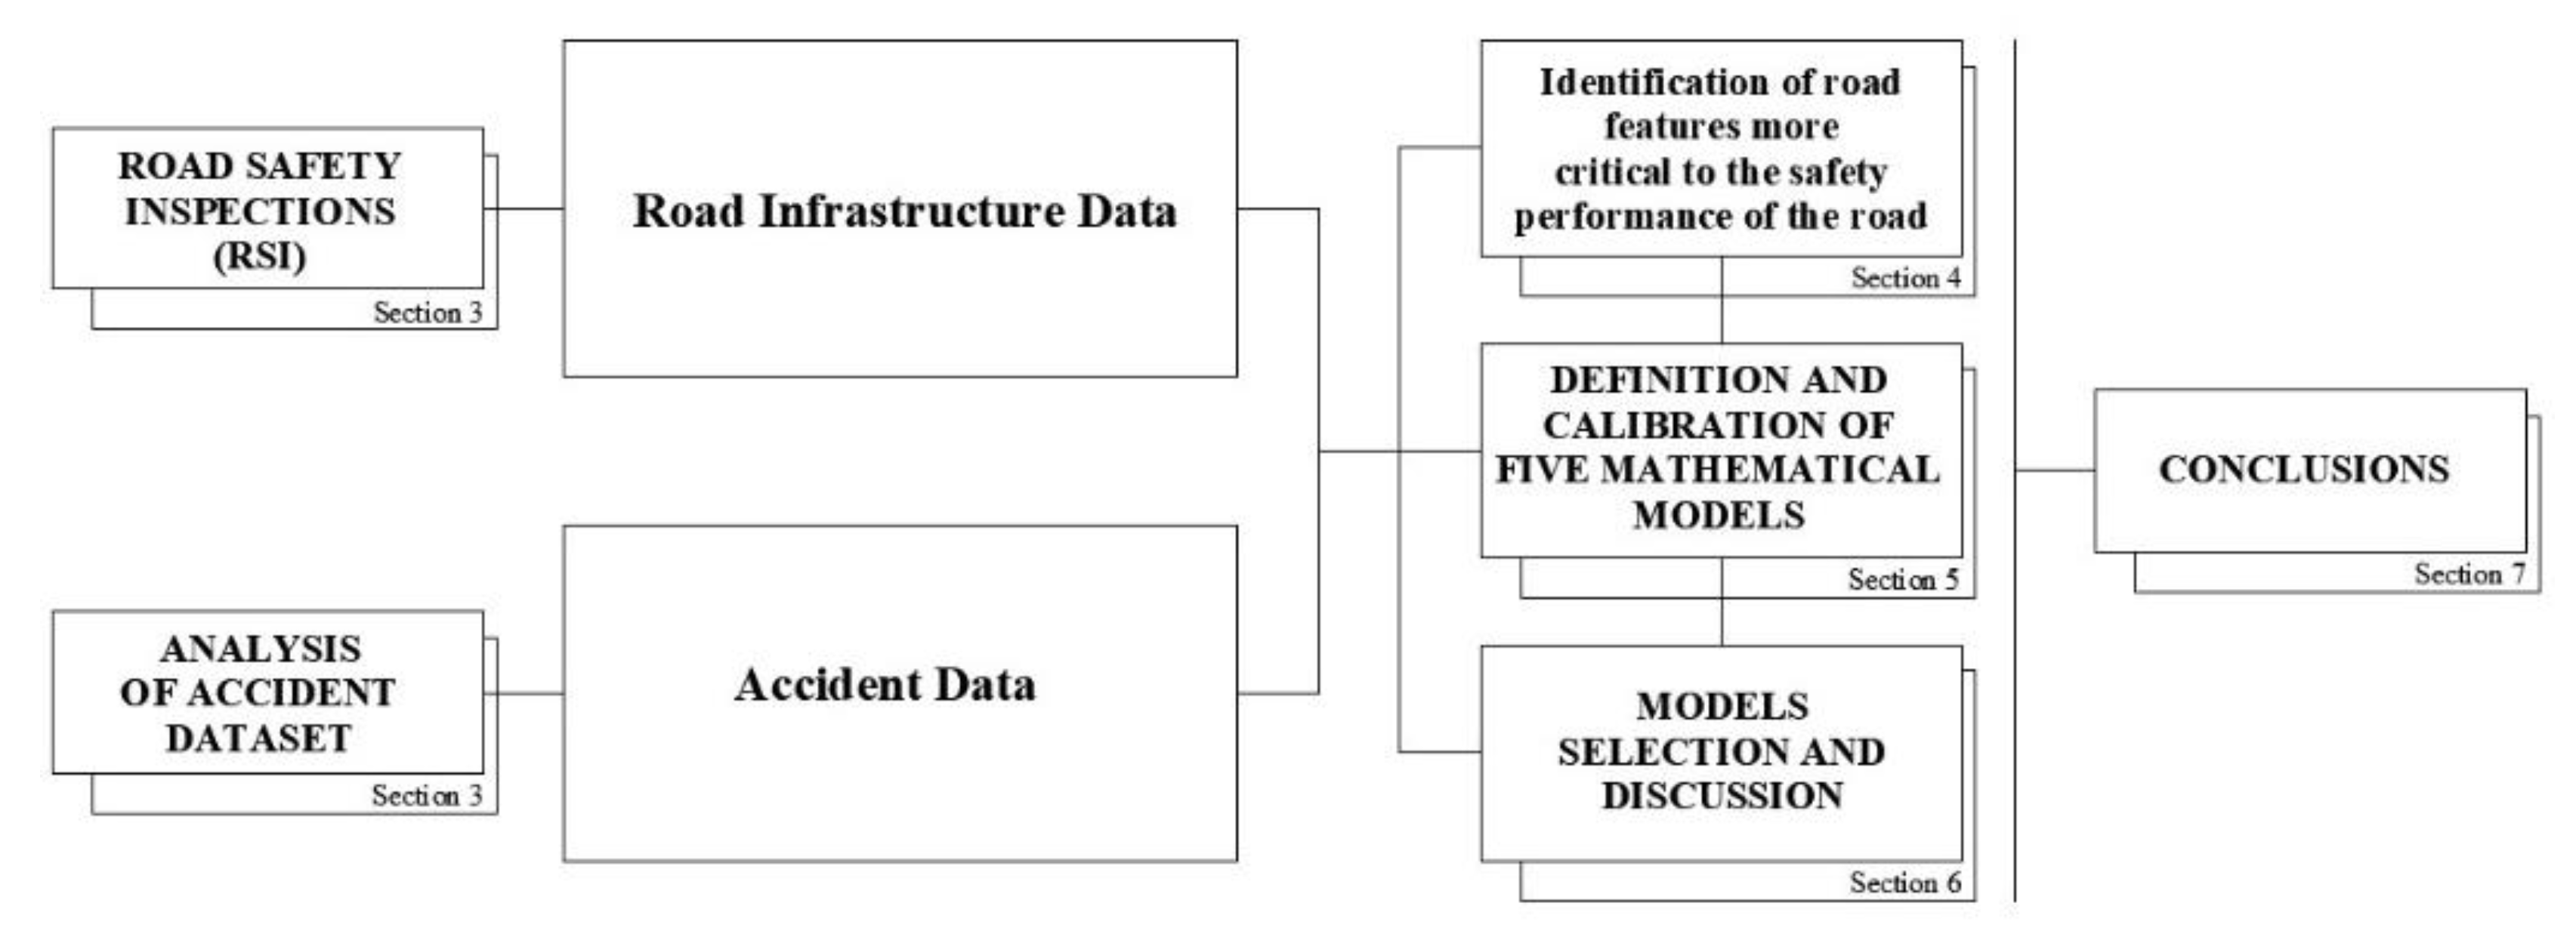
In this paper, the authors propose a methodology based on a quantitative evaluation of RSIs which can be useful for a definition of accident reduction potential. RSIs output is correlated to accident data to converge to an accident prediction model. This aspect is highlighted in Section 5, where a concise analysis of the main prediction methods found in literature is reported. These models were used to study the influence of the infrastructure-related variables (Section 4) on accident occurrence.

Road Safety Inspection in Italy

At the national level, member states shall adopt the measures of Directive 2019/1936/EC by December 2021. In Italy, several laws are related to traffic safety management, mainly the New Highway Code of 1992, the Guidelines for Urban Traffic Plans (PUT) of 1995, and the Geometric and Functional Rules for the Construction of Roads of 2001. Furthermore, Italy adopted a National Road Safety Plan, which is called “Piano Nazionale per la Sicurezza Stradale” (PNSS) originated from the need to decrease the frequency and severity of road accidents. The PNSS has been carried out so far through five annual programs [30].
Directive 2008/96/EC was adopted through the Decree 35/2011 [31]; this legislative decree was followed, in September 2012, by the ministerial Decree 137/2012 [32] which contains the guidelines for safety management of road infrastructure and describes step-by-step how to undertake safety audits and inspections. In particular, the Decree 35/2011 [31] introduces a series of instructions for the implementation of procedures aimed at assessing projects safety impacts, carrying out road safety audits and inspections, managing safety for all roads within the trans-European road network, both planned and in-operation roads [33]. The annex of Decree 137/2012 [32] (guidelines) can be considered to be the legislative Italian reference for road infrastructure safety management. The main aim of these technical guidelines (Article 2) is to identify criteria and methods for carrying out road safety audits and inspections and for implementing the network safety ranking. Moreover, they represent a reference for the training of road safety auditors, and an important tool coordinating all the activities of the competent entities involved in the road safety management process.
According to the definition provided by Directive 2019/1936/EC, targeted road safety inspection is a “targeted investigation to identify hazardous conditions, defects and problems that increase the risk of accidents and injuries, based on a site visit of an existing road or section of road” (Article 2) [12]. The basic approach of this procedure is characterised by the identification of all road features with poor safety performance and provision of the measures of treatment that could improve these safety deficiencies [34]. In fact, RSIs are a preventive safety tool, i.e., they aim at highlighting possible safety threats before an accident takes place, and therefore at prioritising possible interventions. Moreover, their application does not require specific information on the safety level of the road [35]. RSI implementation is a powerful example of a proactive road safety approach that could help to overcome the limitations of a conventional reactive road safety strategy based on the analysis of crash history data; the proactive approach to the potential of road accident frequency and severity reduction is associated with the identification of safety issue locations and the definition of countermeasures to improve the safety of the roadway before accidents occur [3,36,37]. Consequently, the main difference with the traditional safety analysis is independence from accident statistics [38].
RSIs must be conducted first on road segments with the highest accident rates and afterwards on the rest of the existing road network, both for urban and rural areas. Inspections are detailed analyses to be carried out for individual critical (or potentially critical) points, such as frequent accident sites (the so-called black spots), and road segments with work zones. They can be managed on homogeneous road segments, including also inspections for singular points such as junctions, accesses points, and tunnels. A RSI during roadwork is aimed at verifying the suitability of the temporary safety measures adopted, including methods for delimiting construction sites, advising road users (work zones traffic signs), and ensuring the visibility of the workers both during the day and the night.
RSAs and RSIs are not independent procedures but they are included in a cyclical process. The complete cycle of road infrastructure safety management for existing roads includes the following four macro activities: road network screening, safety inspections, safety ranking of the road network, and the definition of treatment measures [32]. The process starts with an examination of the functioning of the road network in operation, aimed at identifying homogeneous road segments and at ranking of high accident concentration sections (sections with many fatal accidents) [39]. This classification constitutes the input process for the definition of the inspection program which establishes their implementation priority.
Once the safety inspections have been completed and safety defects attributable to the road infrastructure have been identified [40], a new network safety classification is carried out for planning and scheduling of the remedial measures to correct issues and eliminate hazards highlighted during the inspection process.
The classification aimed at planning the treatment measures, corresponding to the third macro-phase of this cycle, defines the priority of intervention and the type of measure such as routine maintenance, extraordinary maintenance, or no measures necessary. The implementation of adequate measures and their subsequent monitoring completes this set of road safety management procedures [21]. The monitoring phase is essential to verify the effectiveness of the implemented treatments, updating the documentation about the road network safety condition, and providing a new safety classification involving the definition of a new inspection program. For this reason, every time the monitoring activities close a cycle, they base the foundations for a new process aimed at the improvement of safety [32].

2. Organization and Scope

The main objective of this paper is to define an approach for evaluating the relationships among safety inspections (according to the new EU directive [12]) and accident statistics in order to identify items that require a priority intervention in light of an adequate maintenance policy of road network. Furthermore, the study aims at the transformation of the qualitative output of RSIs in a quantitative evaluation of road safety performance. This process is useful for obtaining information on road infrastructure features affecting the safety level and for defining accident reduction potential. Moreover, in this study, we focus on the application of the proposed approach to the state road SS18 “Tirrena Inferiore”, in the District of Cosenza in Southern Italy, discussing findings obtained by the implementation of this methodology.
The paper is organized as follows (Figure 1): a description of the case study is carried out in Section 3 where both geometric features and accident data related to the investigated road network are reported (more specifically, see Section 3.1 and Section 3.3, respectively). The relationships between accidents and road features are highlighted in Section 3.4 and discussed in Section 4. A regression analysis is also carried out in Section 5, with the main aim to find an empirical model for the case study including the relationships among the most significant infrastructure-related variables and accidents. A model selection analysis and discussion of results are reported in Section 6. Finally, conclusions are drawn in Section 7.

3. Materials and Methods

3.1. Case Study Description

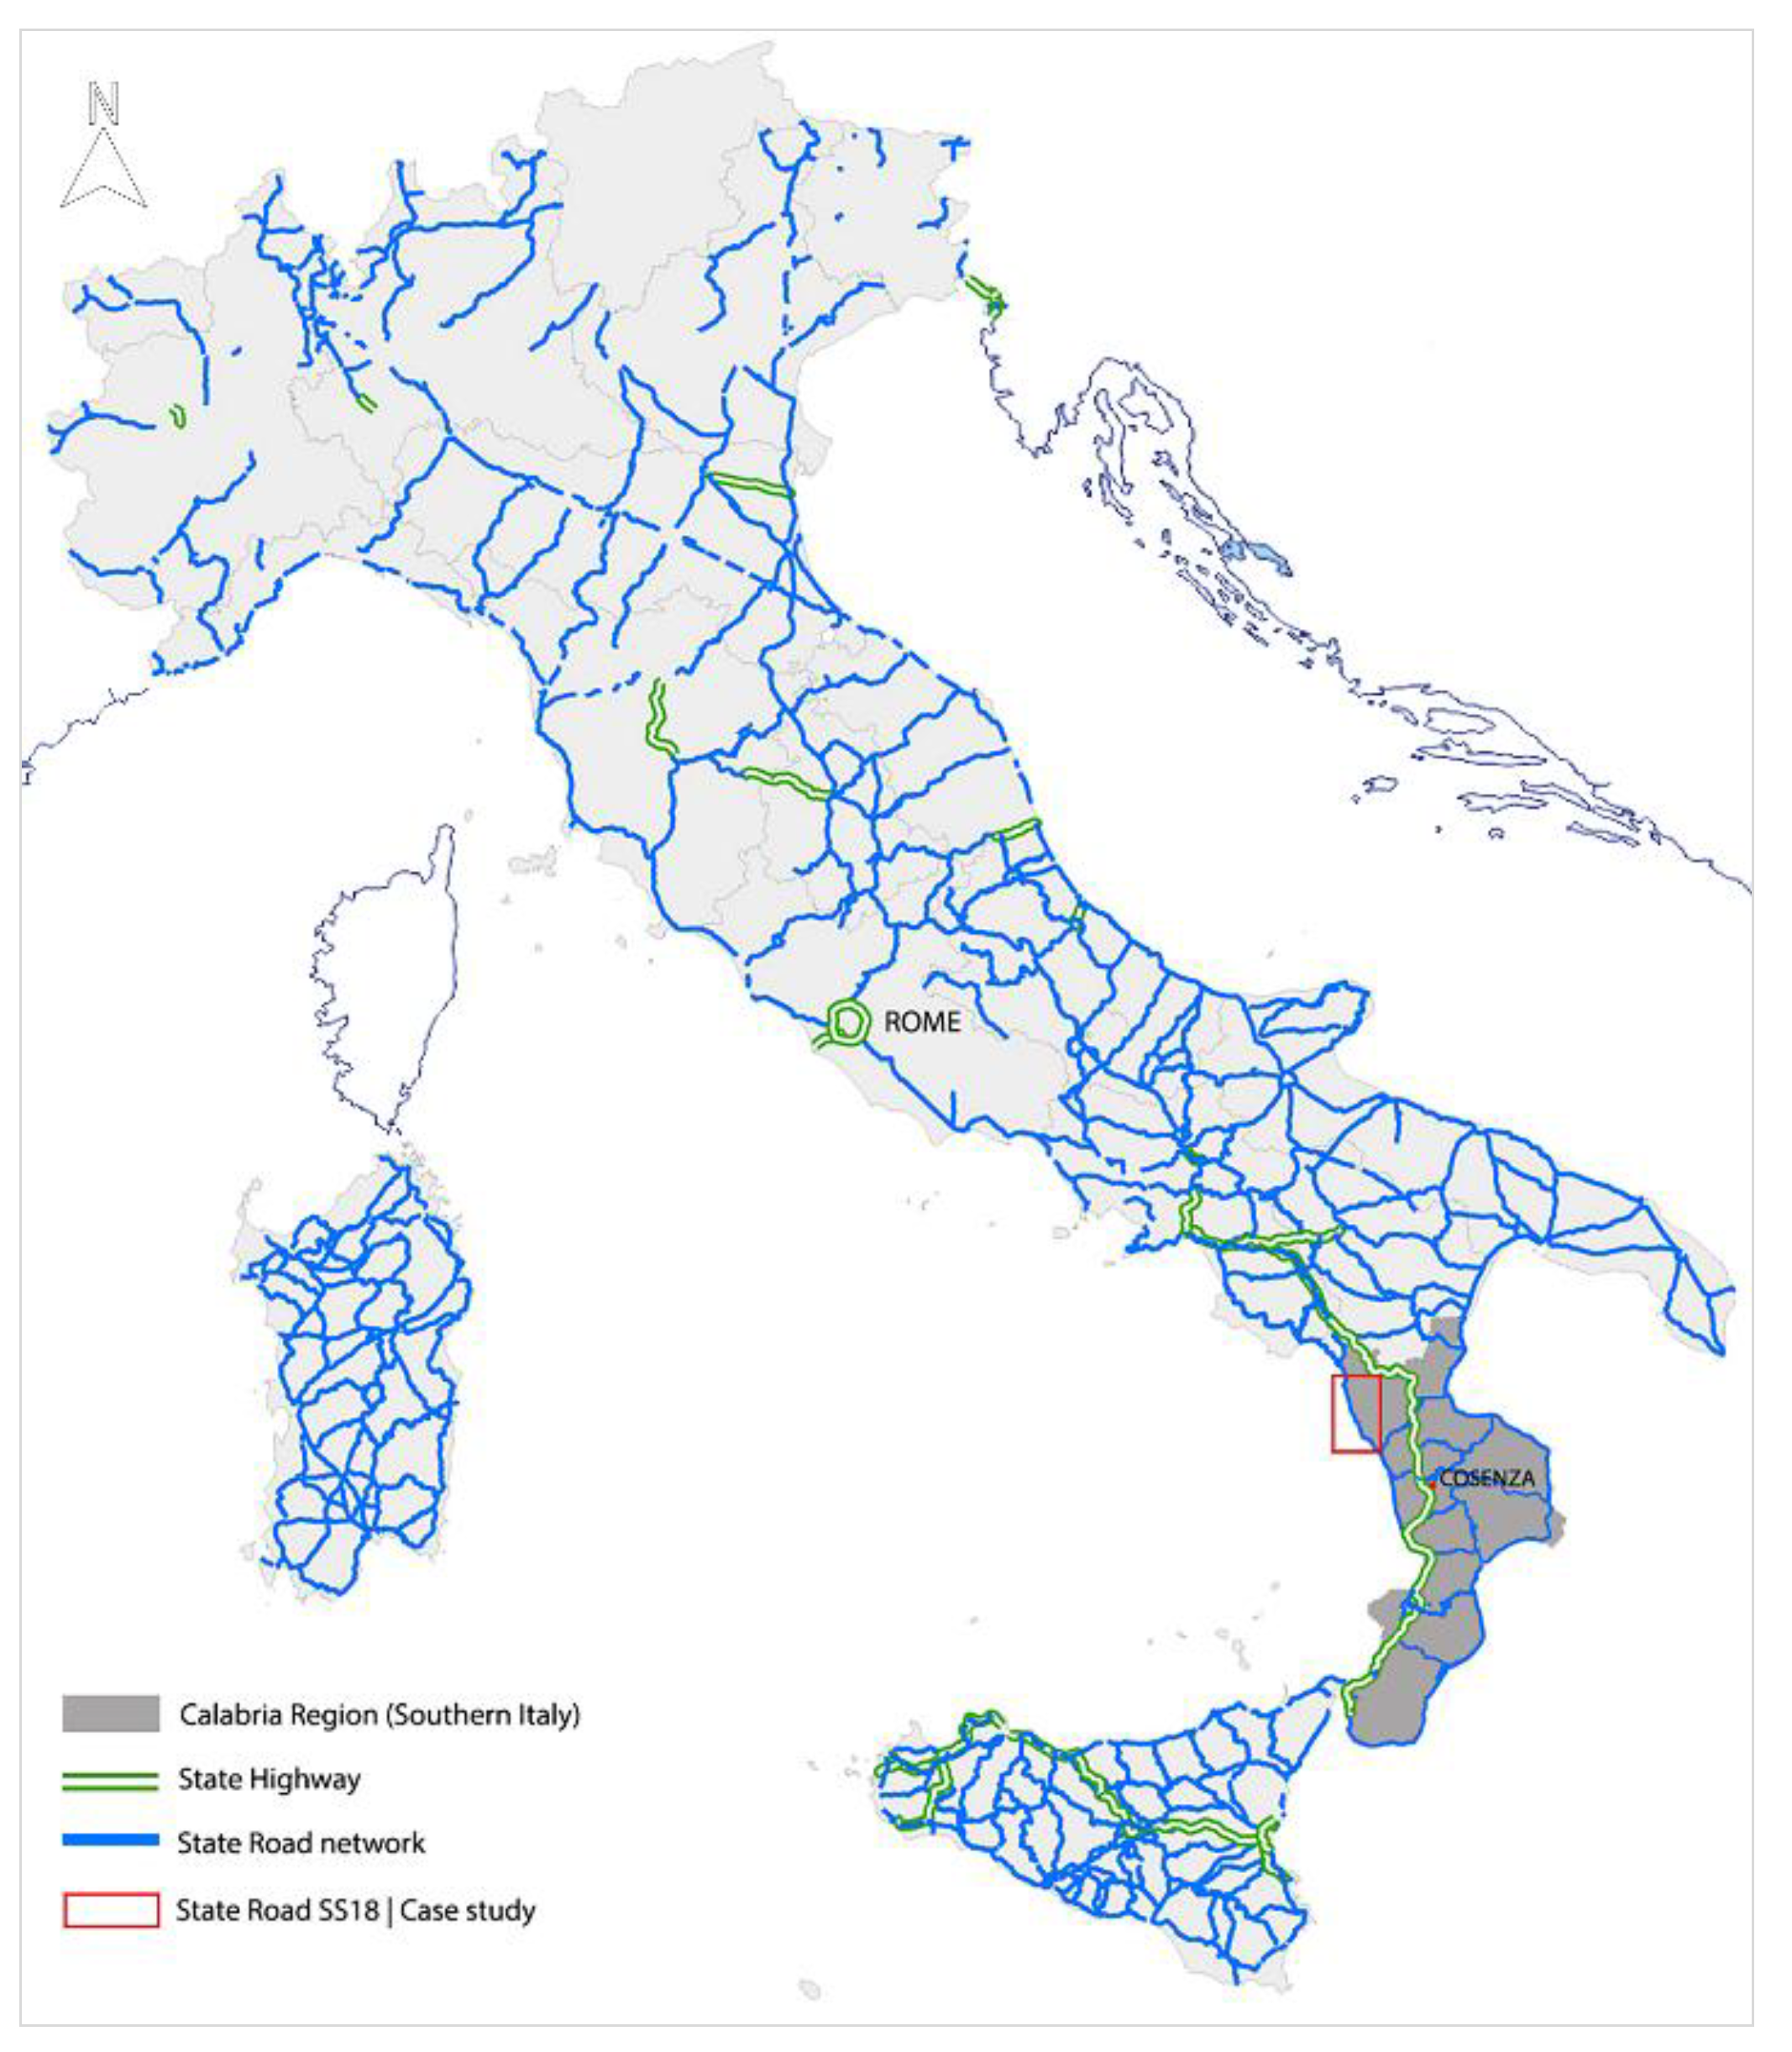
The state road SS18, selected as case study, represents an important axis of the Southern Italy road network and the main link along the Tyrrhenian coast since it ensures connections between internal areas and coastal settlements. The SS18 state road can be classified as a secondary rural road (C1 class road) for its technical and constructive characteristics, in accordance with the D.M. 5/11/01 “Functional and Geometric Norms for Road Building”, with the function of penetration towards the local network [41]. Moreover, in many sections it constitutes an urban crossing, passing through built-up areas. Therefore, the selected road network is characterized by several safety deficiencies, strictly related to the frequent transition from rural sections to urban sections and the relative changing of operative speeds [42]. It is a single carriageway road with one lane in each travel direction, except at the intersections where left-turn lanes can be found.
The annual average daily traffic is about 15,000 vehicles per day; the highest traffic volumes are recorded in summer given the road function of connecting urban and natural coastal areas. Furthermore, seasonal traffic variations also affect the frequency and severity of accidents.
The inspected road has a length of 31 km (11.356 km of rural sections and 19.644 km of urban sections. Tunnels (around 750 m of the entire length) were not analysed because they are excluded from the 35/2011 Decree field of application. The test site length was chosen to allow a more accurate analysis of road infrastructure features that concern safety issues. The aim of the described methodology is to define a sequence of steps that could be easily exported to other roads.
Figure 2 shows the geographical location of the test site, whereas Table 2 summarizes the geometric characterization of each section type (straight/curve). According to the guidelines, an inspection of the geometric features of the horizontal alignment is not included in the RSI procedure. However, the collection of these data adds useful information to the analysis of the test site; a brief discussion on their relationship with accident data is reported in the next section.

3.2. RSI Procedure Implementation: From a Qualitative to a Quantitative Evaluation

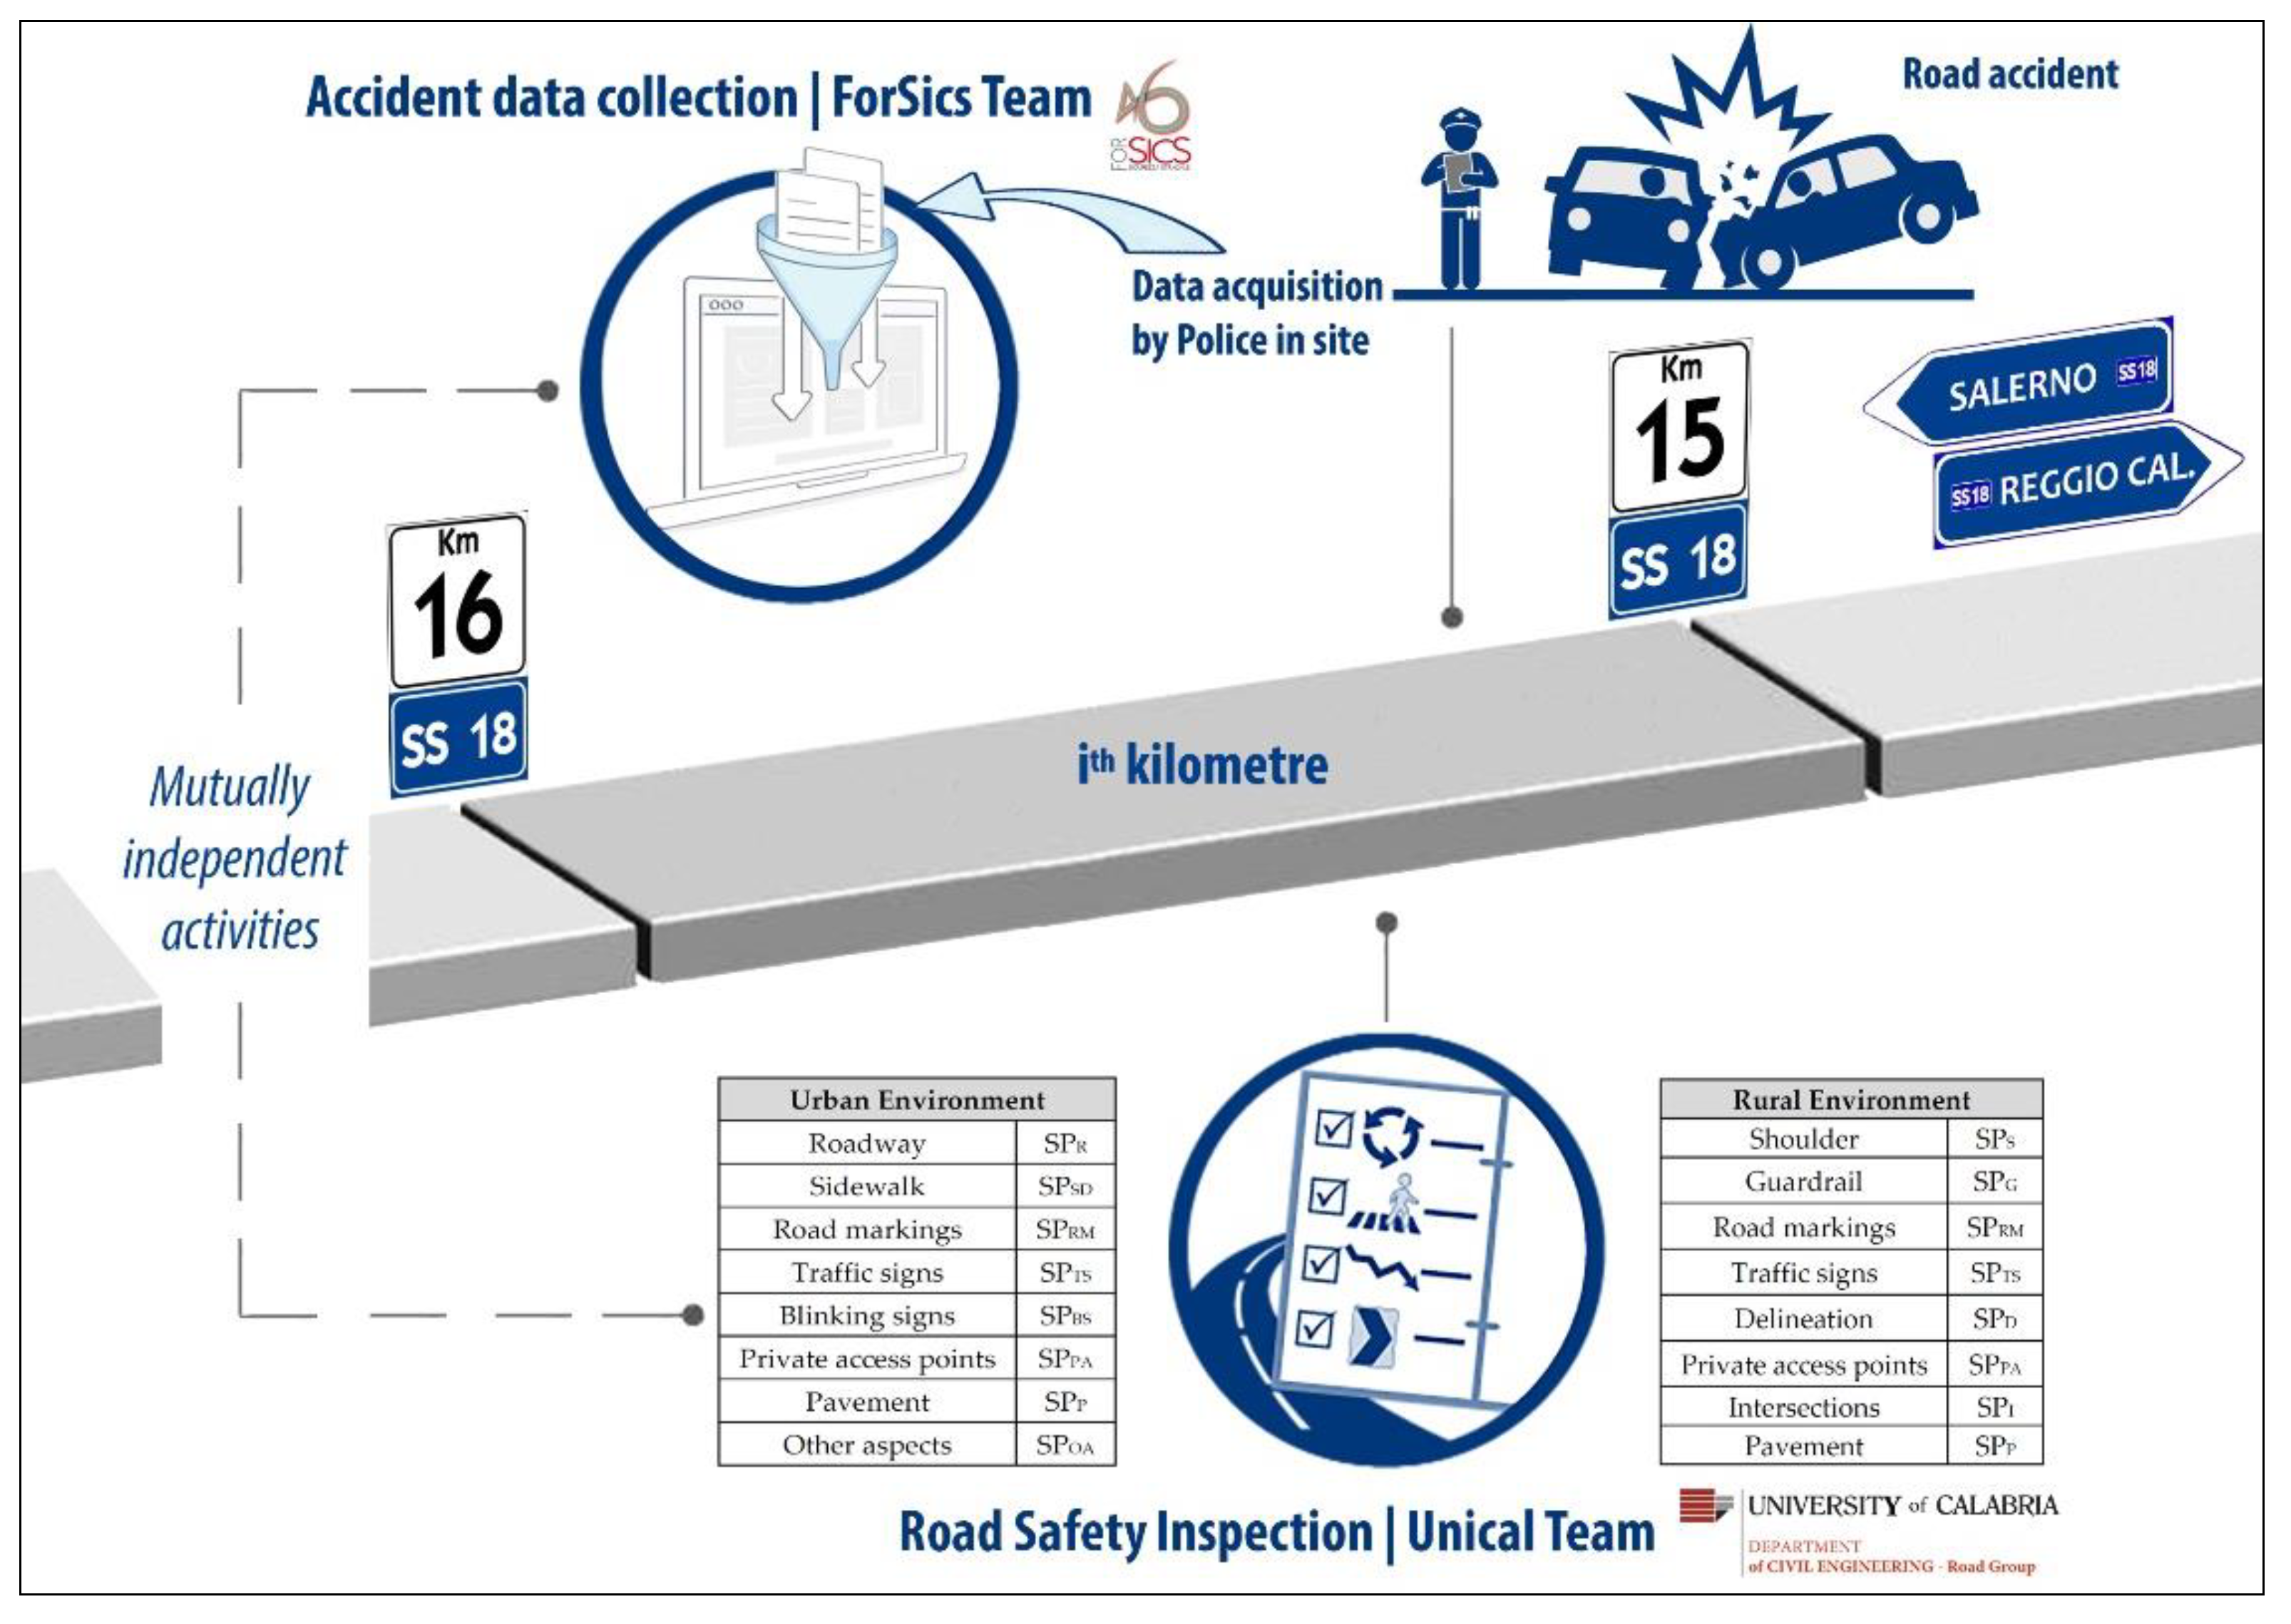
Carrying out RSIs does not require knowledge of accident data; in fact, a safety inspection is aimed at characterizing road networks only through the infrastructure safety issues. In this study RSIs and accident data collection are separate activities that carried were out by different teams, see Figure 3; moreover, in order to not influence road infrastructure data collection, accident statistics were investigated after the RSI procedure. Inspections were carried out in relation to road section location (inside or outside built-up areas) because of the different technical and functional characteristics of the road. Checklists [32] were used for implementing inspections on homogeneous sections of 200 m in rural areas and 100 m in the urban ones. The procedure included inspection of the following main items:
  • Roadway;
  • Road signs;
  • Access points;
  • Pavement;
  • Lighting;
  • Other aspects (depending on the location).
The inspection activity focused attention on those road deficiencies that required specific treatments. The most frequent issues investigated were related to the absence or insufficient width of the shoulder, the presence of pavement unevenness that compromises regularity, the inadequacy of road markings, and incorrect installation of guardrails.
The outcome of the RSI procedure was transformed in a quantitative evaluation that defined an indicator which was obtained by assigning a score to each safety deficiency found during the inspection phase. The safety performance ( SP ki ) indicator for the ith kilometre is defined as follows:
SP ki = s = 1 5 w ski
SP ki = s = 1 10 w ski
where wski represents the score associated with the safety issue identified for the selected parameter (k) and for each road section (s). Equation (1) refers to rural environment where five sections 200 m long were analysed for each kilometre. Equation (2) is applied for the urban environment; in this case, ten sections 100 m long were investigated for each kilometre. The “w” value depends on the condition of the severity of each safety issue; therefore, the following values were set: w = 1 high severity, w = 0.5 medium severity, and w = 0 safe condition. These values were set according to the assessment of the inspector who carried out the RSI procedure following the indications of [32] and on the basis of previous studies [43,44,45].
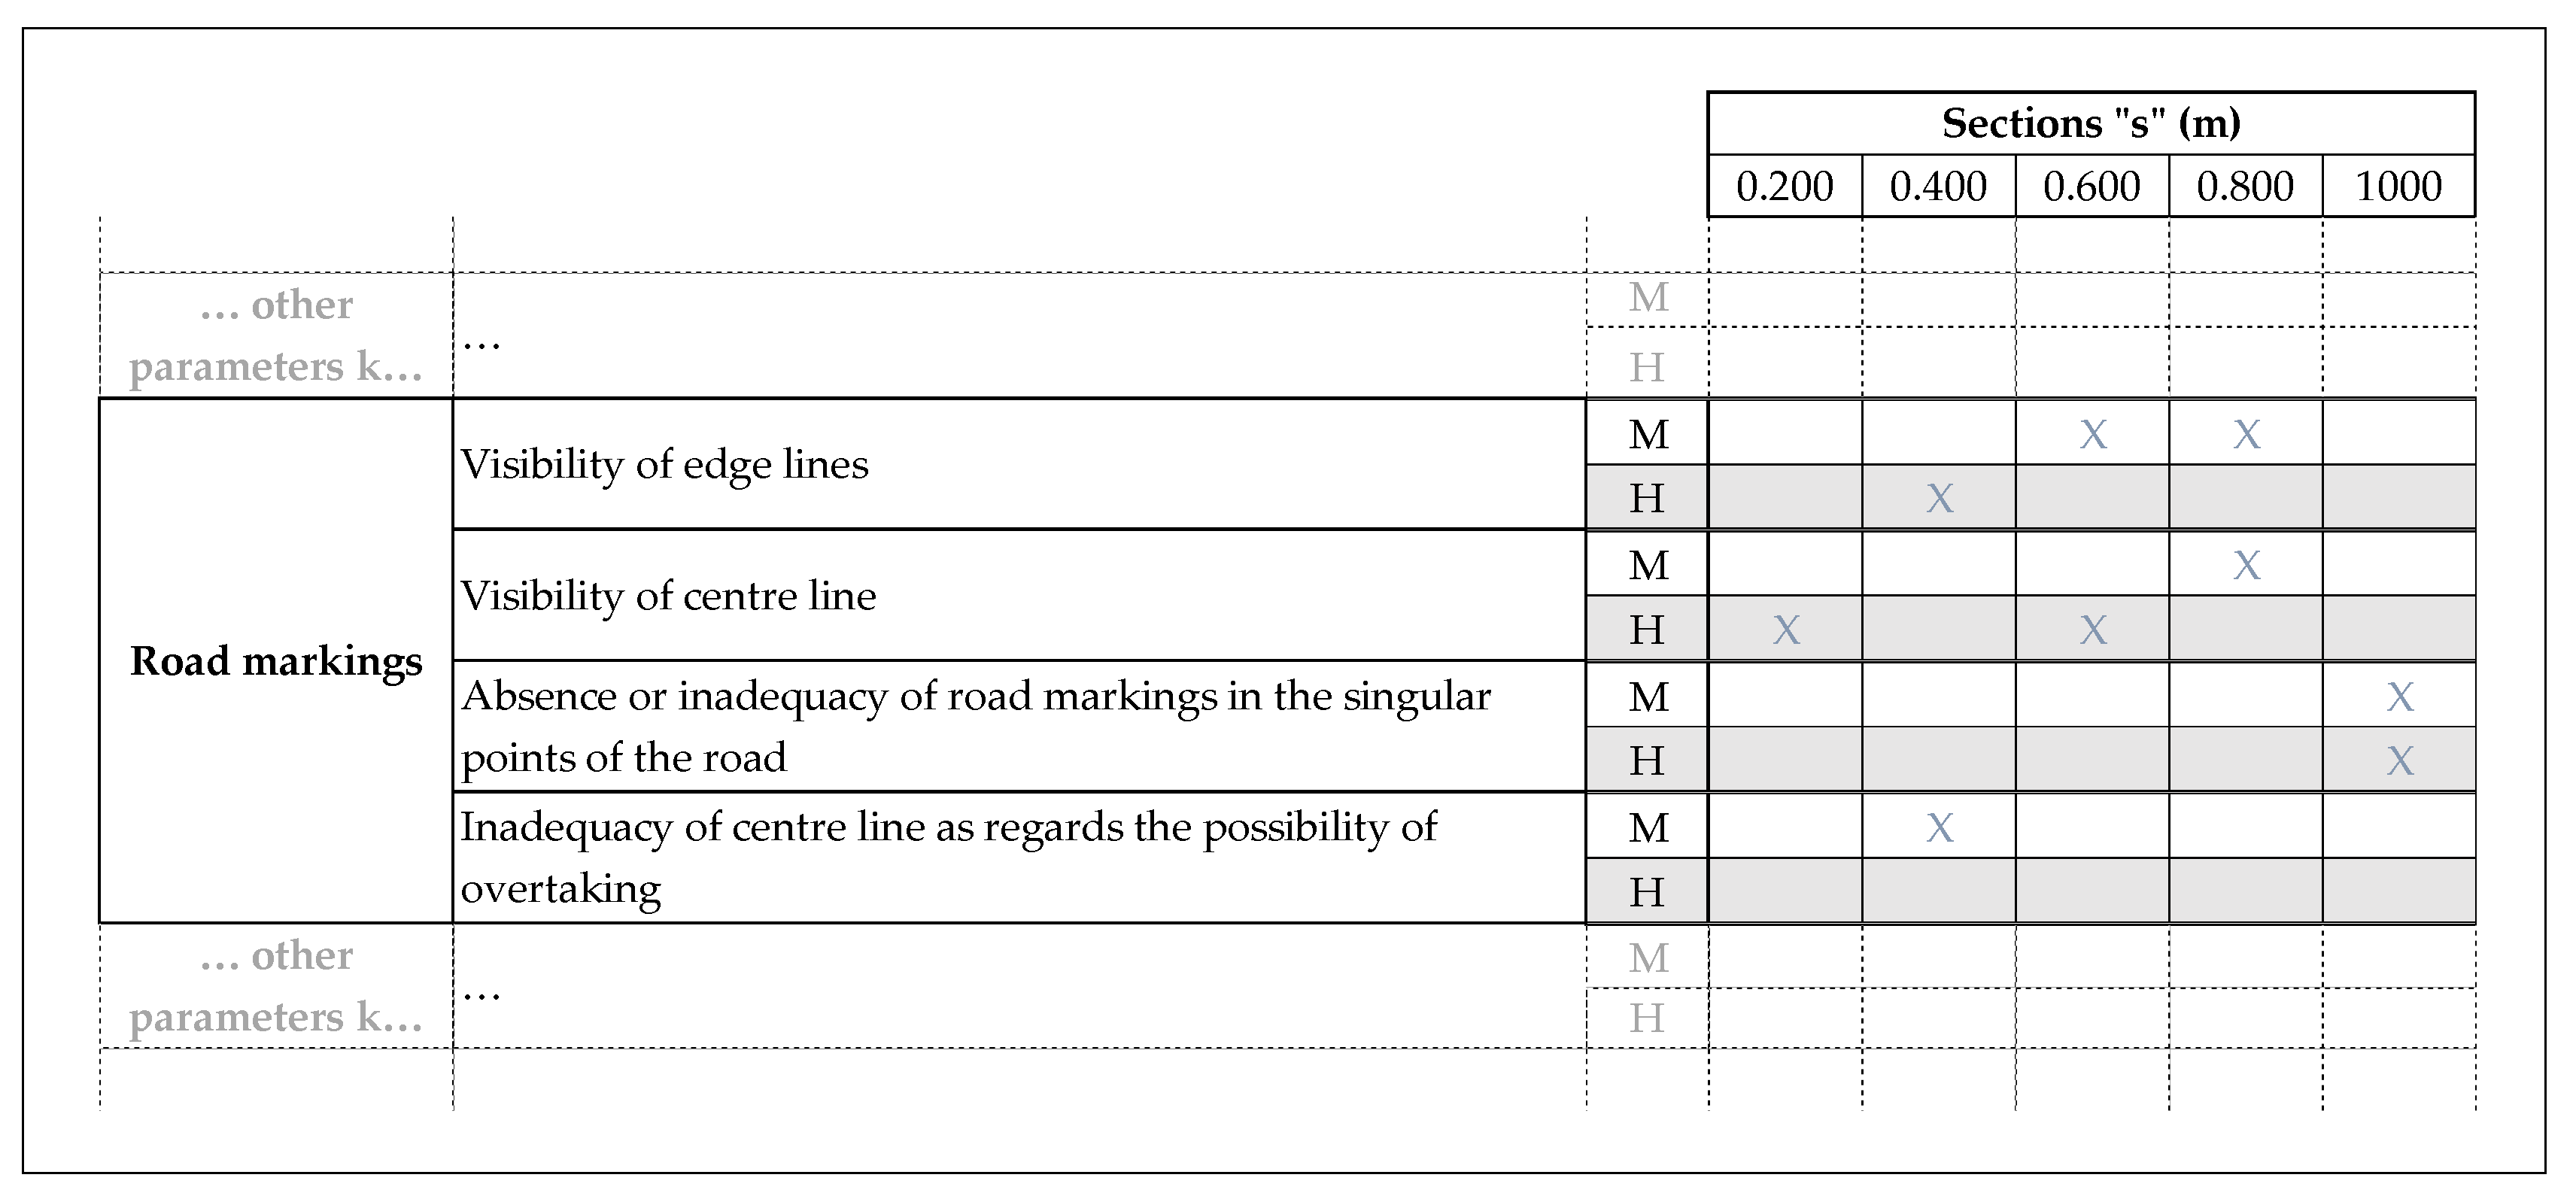
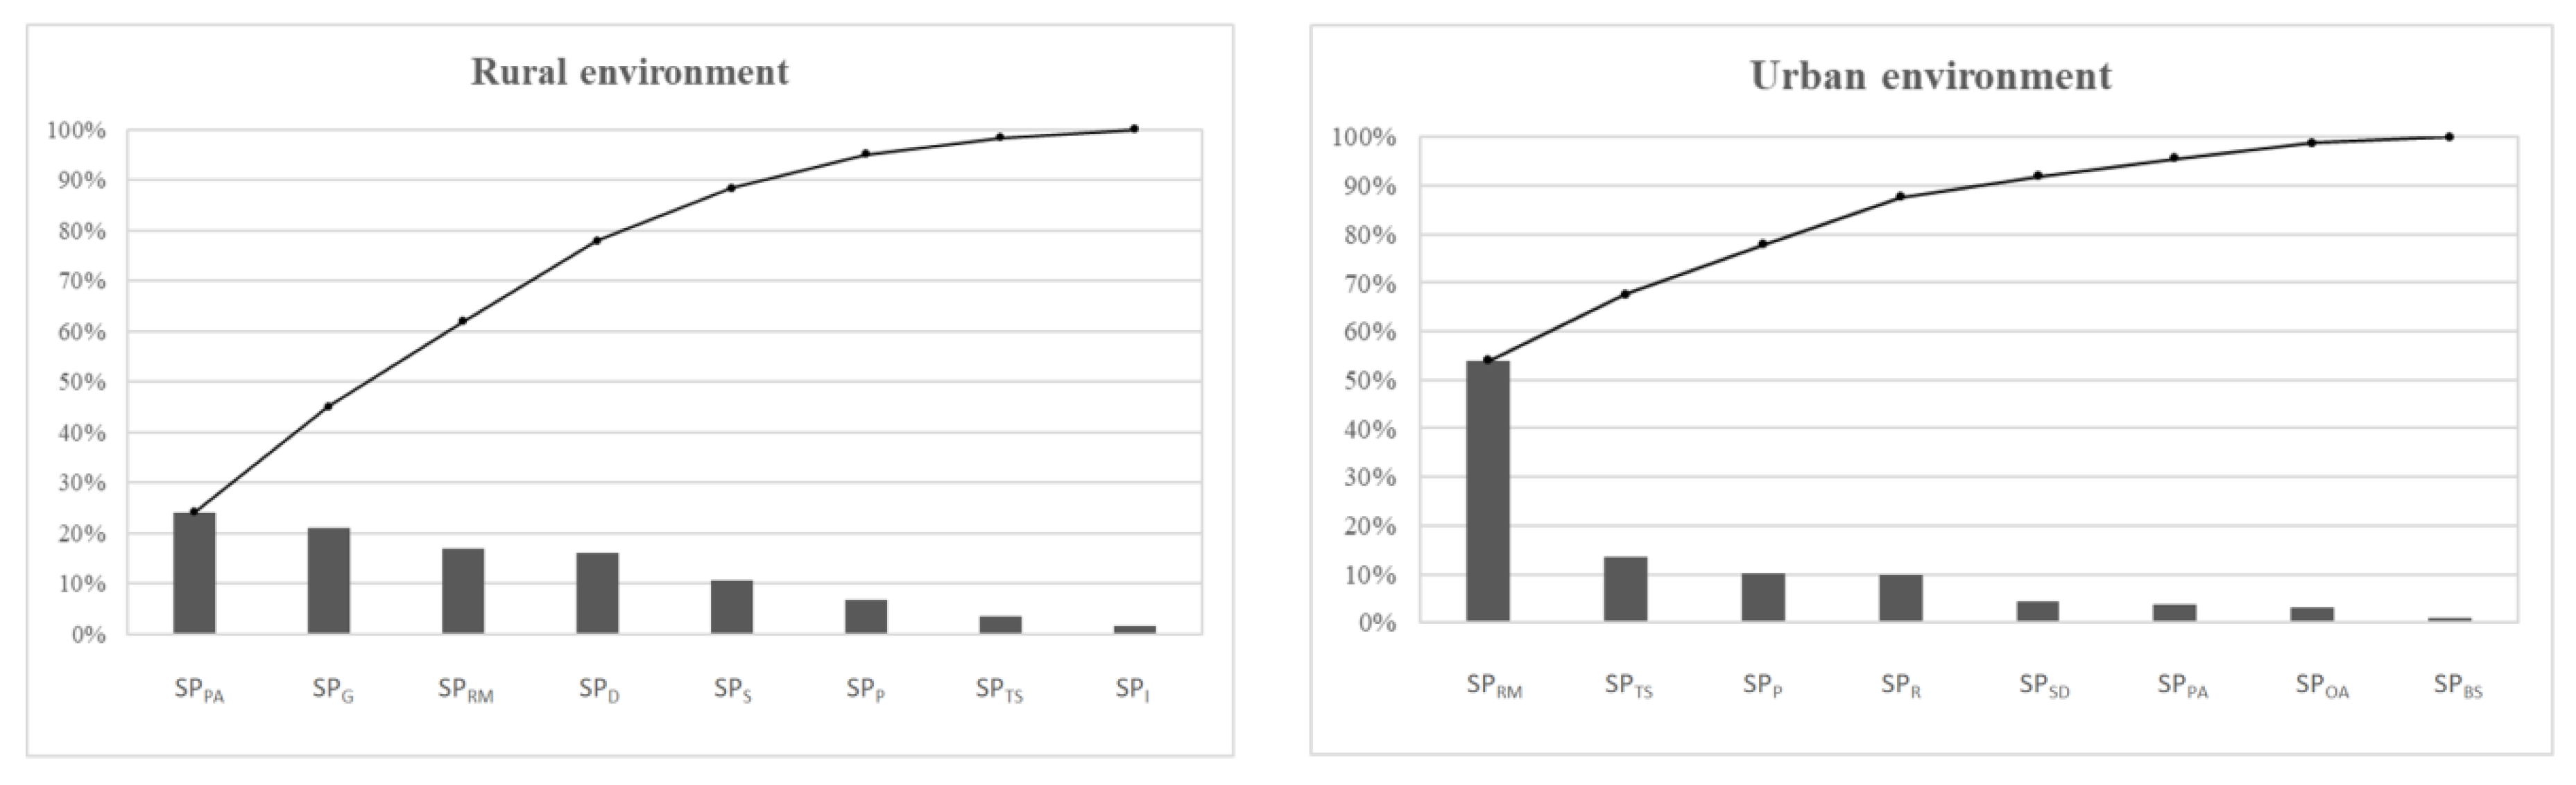
The evaluation of k parameter involved the analysis of several items defined in the checklists. In this study, the main safety issues were selected for both the rural and urban context, as shown in Table 3 [32].
Figure 4 reports an example of the assessment of SPRM (for road markings) and of the framework of the checklists [32]:

3.3. Accident Data Collection

Accident data collection is one of the essential activities for assessing the dangerousness of a road infrastructure and for identifying critical sections to be included in targeted remedial treatment planning. Accuracy, complexity, availability, and uniformity are some parameters influencing the accident database quality [46]. The availability and completeness of a system for collecting and processing accident information contributes to the improvement of road safety conditions by locating high accident concentration sections of the road network and also obtaining validation of theoretical studies, hypotheses, and traffic safety simulations [39]. The precise location and the dynamics of the accidents, the severity and concentration of accident phenomena, the types of vehicles involved, and information on the road and weather conditions are some of the data needed to conduct a rational network safety ranking [4]. The lack of data relating to accidents with only material damage, often not included in the accident databases, results in a loss of information that is certainly not negligible, affecting the quality and reliability of the analysis.
The road crash data used in this study were directly acquired from police records, for the period from January 2014 to June 2016 (the safety inspections were carried out between February and September 2016), and they also include accidents with only material damage. The road items involved in the methodology (see Table 3) did not have significant maintenance measures that changed their conditions in the investigation period. As regards accident data, accidents strictly related to a “temporary” condition of the road (roadworks zones) were not taken into account.
The following elements were available for each accident:
  • accident date and hour;
  • accident precise location;
  • information on the alleged circumstances of the accident, collision type, driver’s manoeuvre and characteristics of the persons involved;
  • accident consequences (number of fatalities and injured persons).
During the reference period, 147 accidents were identified on the 31 km under investigation. 
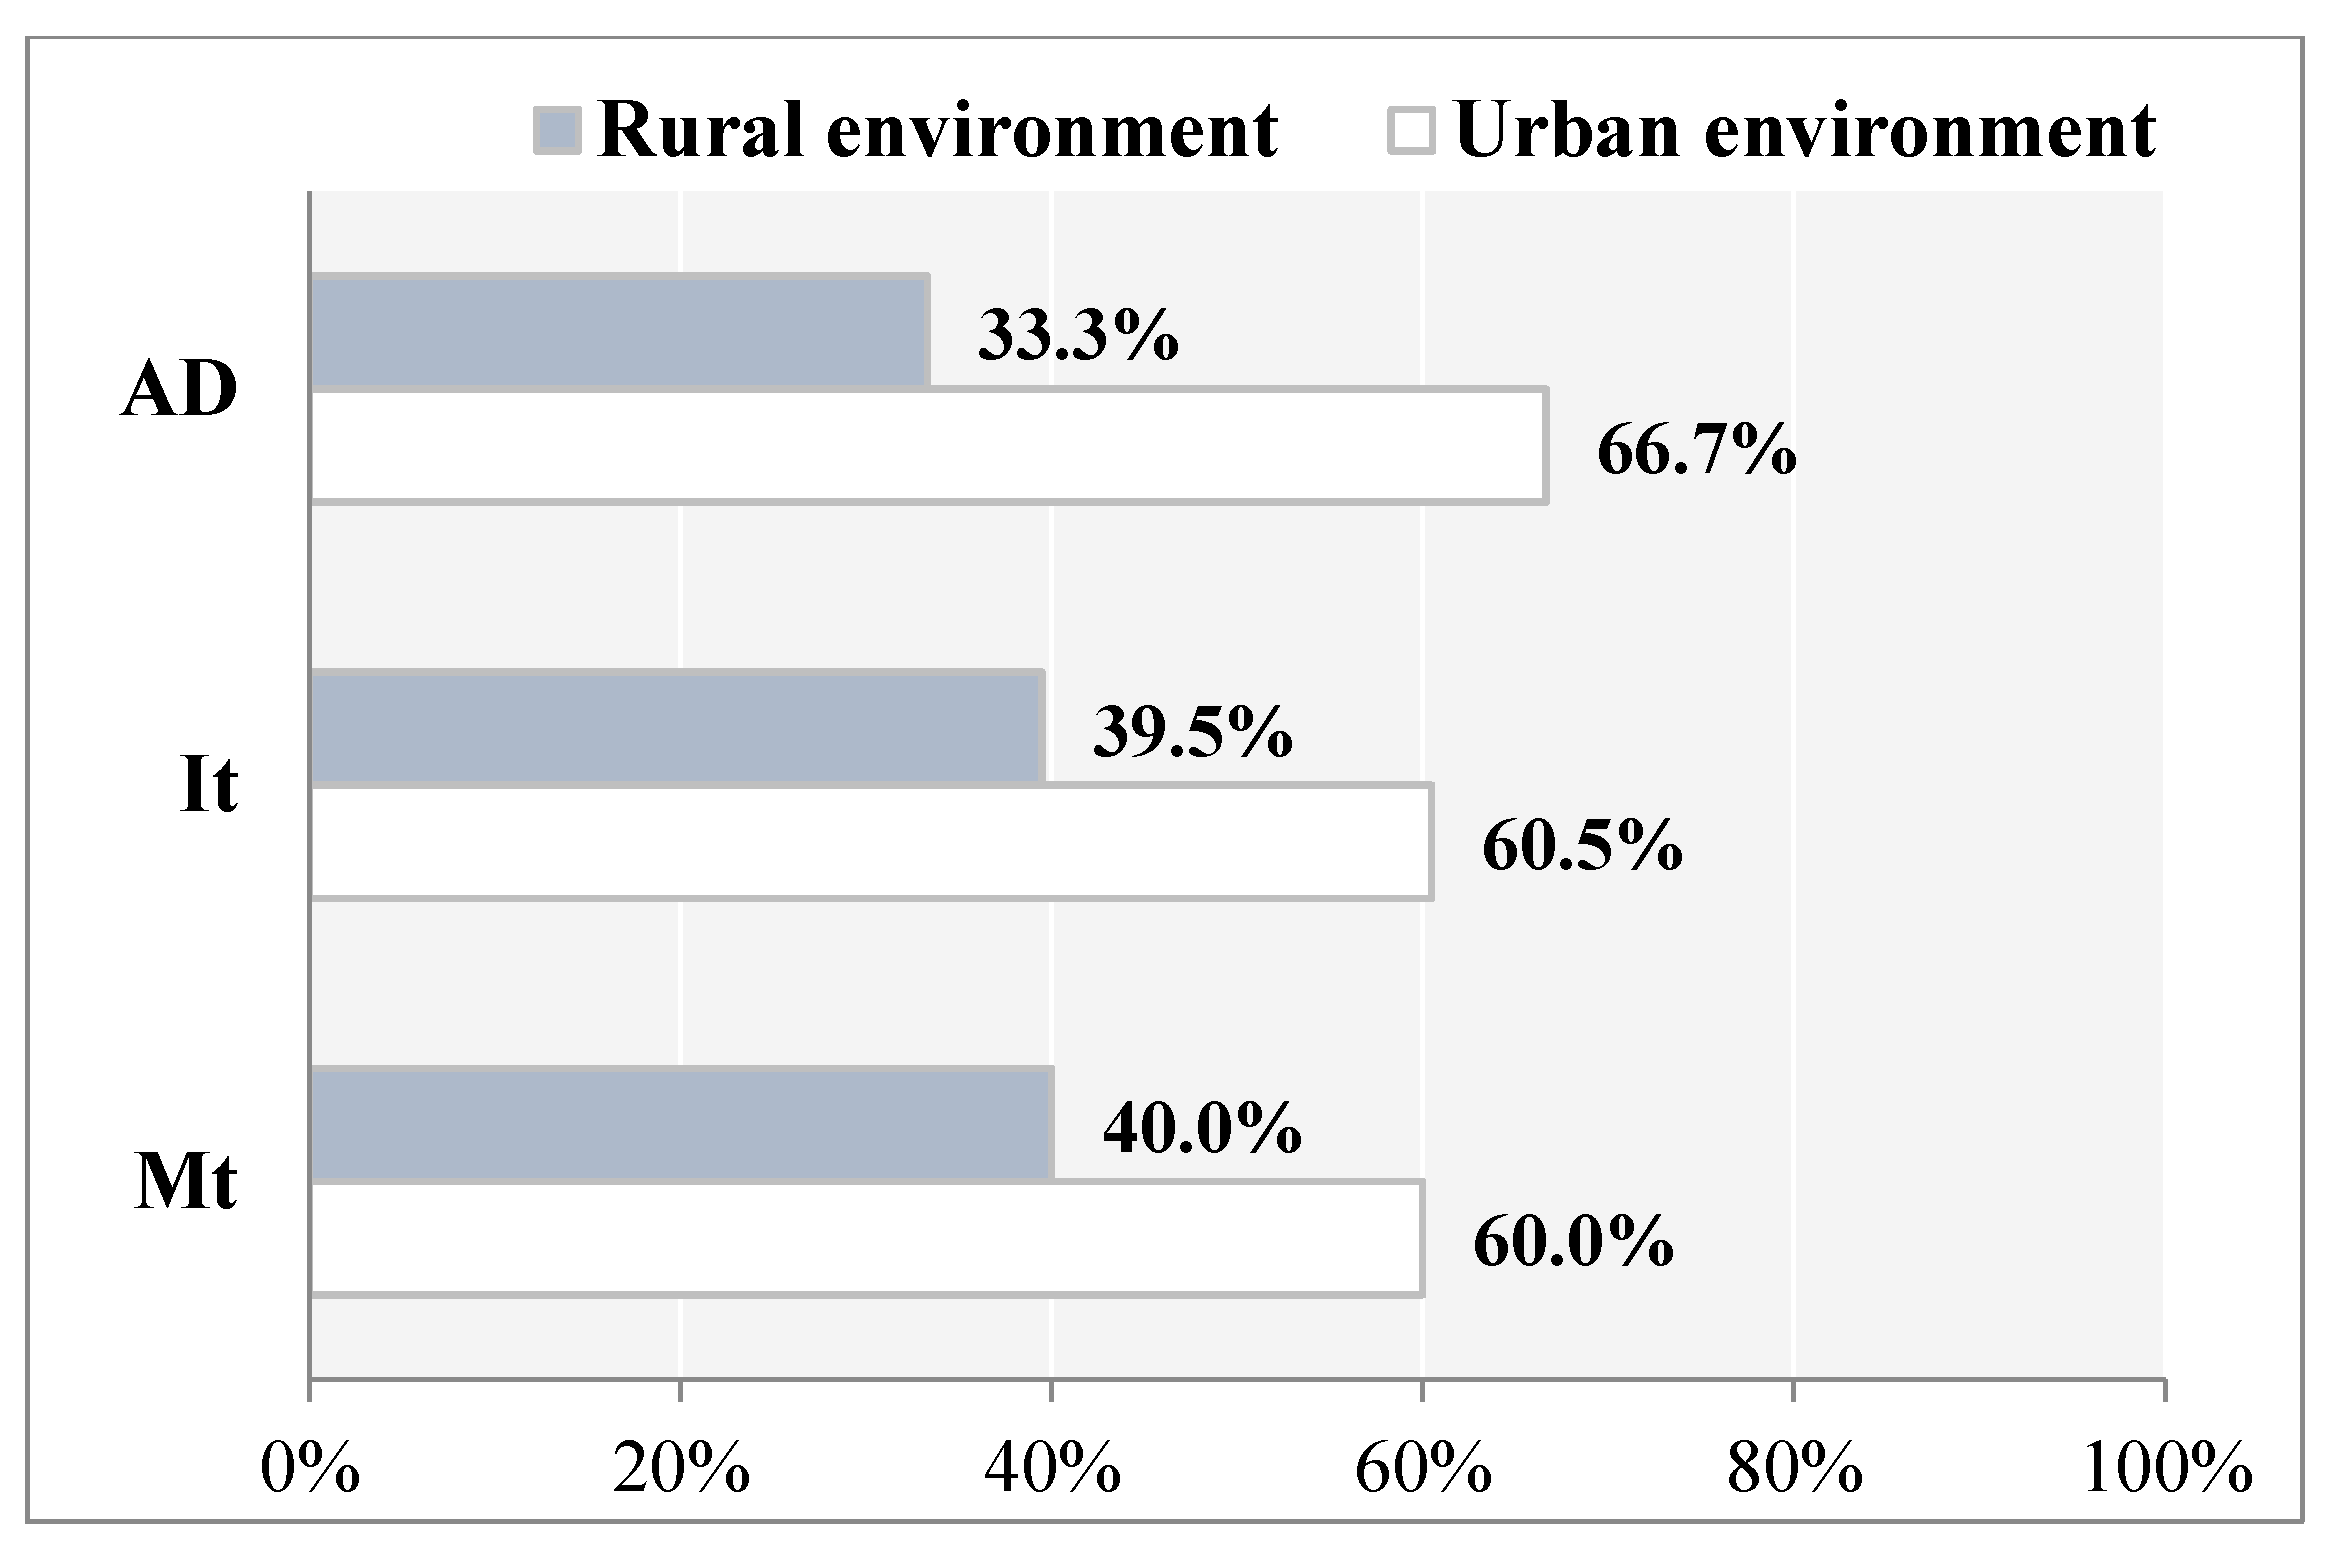
Figure 5 shows the percentage of accident density (AD, accidents per kilometre) observed in rural and urban environment, separately. Figure 5 also reports information on crashes severity in terms of percentage of road accident injuries (It, total number of injured people per kilometre) and fatalities (Mt, total number of deaths per kilometre due to traffic accidents).
Accident data analysis provides concrete documentation on the obvious criticality that characterizes the road as regards safety performance. According to investigations conducted at accident sites, it was found that around 44% of crashes occurred on curves. In rural sections, curves with smaller radii had higher accident rates than curves with larger radii. This confirmed some research results in which curves with sharp radii as a contributing factor to run-off-road accidents were clearly associated with an increase in crash numbers [47,48].

3.4. Considerations for Accident and Safety Performance Indicators (SPk)

As previously stated, an RSI considers the road network without prior knowledge of accident data. The aim is to find out all road elements with an inadequate safety performance, and therefore, road characterization from a safety point of view is strictly related to those deficiencies related to road infrastructure. In this approach, RSI procedures and accident analysis are not considered to be independent activities, in order to determine a potential link among the infrastructure deficiencies, the localisation, and the severity of accidents.
In this work, the first step of the analysis concerns the evaluation of correlations between two sets of variables. In particular, for the purpose of this study, the “y” variable is an accident indicator, and the “x” variable is the SP ki indicator for different infrastructure features. Among accident indicators, the following were used:
  • Accident density (AD, accidents per kilometre, calculated as the number of crashes on each kilometre for both urban and rural road sections);
  • Total number of injured people per kilometre (It);
  • Total number of deaths per kilometre due to traffic accidents (Mt);
  • Fatality rate (FR, which is defined as the relationship between the number of road accidents deaths and the total number of accidents Mt/AD);
  • Injury rate (IR, calculated as the relationship between the total number of persons injured and the total number of accidents It/AD);
  • Total injury rate (TIR, which is obtained using the sum between the number of deaths and the number of injured people as numerator, and the accident density as denominator (Mt + It)/AD).
Sometimes the variable of safety performance in some kilometres is zero because no problems have been highlighted during inspections. In particular, for the ith kilometre the following cases related to SP values must be considered:
  • SPki = 0 (no safety issues have been highlighted for the “k” parameter during the inspection, i.e., safe condition) and accident indicators are not null in the same section;
  • SPki is too low (the “k” parameter is close to a safe condition) and accident indicators are not null in the same section;
  • SPki has significant scores, but they are roughly constant on all sections, therefore, it is not possible to find a significant relationship with accident indicators by a correlation analysis.
For the first case, the analysis highlights that the frequency or severity of crashes cannot be related to the road item considered (k). In the second case, the SPki low value means that it is needed to consider other “k” parameters in a range of priority; for these last, correlations might be more significant. The lack of a significant correlation (third case) should be related to the absence of a strong and univocal causal link between infrastructure and accidents. Probably, when this case occurs, a crash is primarily related to other causal factors that, together with the infrastructure, may contribute to the accidental event (driver, vehicle, environment, etc.). Therefore, similar SPki values on different road sections imply that accident density variability is not directly influenced by road safety deficiencies. This consideration, in fact, is in accordance with the aim of the present study, which was to investigate exclusively the causal links among road infrastructures (by RSI) and accidents. Nevertheless, a greater test site length could allow a more accurate analysis, overcoming the limitations of the third case.

4. Results and Discussion

4.1. Road Accident Indicators vs. Safety Performance Indicators

Figure 6 illustrates Pareto charts of SP values obtained for the test site, for rural and urban contexts, respectively. The bars in the graphs indicate, in descending order, the percentage of safety issues highlighted during inspection procedures for each parameter k analysed; their cumulative impact is represented by the line. Pareto charts show the parameters with the highest frequency of recorded safety problems to identify those that require a priority intervention. According to these graphs, more than 60% of safety issues for the road segments in a rural context are highlighted for the parameters of private access points, guardrails, and road markings. In the urban environment, about 70% of the issues investigated are related to the parameters of road markings and traffic signs.
Figure 7 shows a summary of SPk values obtained for the sample highlighting the minimum, the maximum, and the average values between road sections (i) for both the rural and urban environments.
As regards accident data, in the following analysis only 140 accidents were used since seven crashes had causes strictly related to a “temporary” condition of the road (roadworks zones) not corresponding to the situation observed during the RSIs. About 4% of the total number of crashes were fatal accidents, with a total of five persons killed. In the period of analysis, the number of injuries recorded was 158. In percentage terms, the number of crashes with injuries constitutes more than 65% of all road crashes. The number of fatalities collected for the test site (five occurrences) is too low, therefore in several sections the related accident indicators (Mt and FR) are null.
For this reason, values obtained from the evaluation of correlations among the SPks and the accident indicators Mt and FR are not reported in the discussion of results, since they are not meaningful for the purpose of the analysis
Table 4 and Table 5 show the results obtained from the evaluation of correlations descripted in the previous section. In particular, Table 4 shows the R2 values obtained for the rural environment, whereas Table 5 is referred to the urban one.
As it is possible to note in Table 4 and Table 5, a linear relationship between SPRM and the accidents density/total number of injured people was found for both rural and urban environments. In particular, R2 values for SPRM vs. AD are equal to 0.46 and 0.85, respectively, thus showing that the coefficient of correlation for the urban environment almost doubles that obtained for the rural area (Figure 8a). The reasons for this strong correlation include the high number of critical issues related to this parameter and recorded for urban sections; furthermore, the accident dataset is also more significant. In particular, the road section from km 260 + 000 to km 261 + 000 (urban environment) is the one where the highest number of problems concerning the visibility of the centre line and edge lines was highlighted by inspections. In this segment, the most critical number of accidents, including accidents involving pedestrians, was also recorded. For the total number of injured people per kilometre (It), R2 values range from 0.77 (rural) to 0.49 (urban). This last result seems to be related to the higher operative speeds in rural road sections that determine a higher probability to record injured people during fatalities. The most significant correlations are shown in Figure 8.
This first result seems to be significant: drivers need for road guidance to assess safety and they give this need a very high priority; this result must be considered for planning of road maintenance. The inspection of road markings, for rural road segments, consists of verifying the adequate retro-reflectivity of the edge and centre lines to ensure their correct visibility in every operating condition, in the absence of natural light and in adverse weather conditions (such as fog, rain, and wet conditions). Visibility is the most important factor required for lane markings [49]. The severity of inspection analysis must increase in relation to singular points (at horizontal curves, at intersections); road markings must provide a continuous optical reference guide for the users, ensuring correct perception of the roadway alignment, for the manoeuvres permitted, particularly during night driving. For urban road segments, visibility of pedestrian and cycling crossings must also be verified.
Road markings are considered to be a factor that can prevent the risk of run-off-the-road crashes [39] and are defined in Circular no. 3699 [15] as the means of communication of traffic circulation choices to road users. A well-organized traffic circulation model with an inappropriate sign system could not have the expected results in terms of traffic safety. Moreover, road markings can assume a relevant function in the context of the problem concerning transitions from the rural road type to the urban road type. Charlton and Starkey [50] and Stelling-Konczak et al. [51] investigated how road markings provide drivers with information about the type of travelled road. Through road layout, the driver can obtain a series of information, and consequently, it is possible to adapt driving behaviour to road real conditions. For example, during transitions from one road category to another, drivers change their expectations, modifying the operative speed.

4.2. Road Accident Indicators vs. Driveways Density

Driveway-related accidents that occur on the test site constitute a substantial percentage (44%) of the total three-year traffic accident data. In particular, a high number of left-turning crashes caused by vehicles entering or leaving private accesses (58%) and rear-end crashes linked to vehicle slowdowns and speed changes close to the driveways (20%) were registered. It is important to highlight that the left-turning manoeuvre is not allowed if there are no left-turn lanes, such as for intersections. Left-turning or rear-end accidents were strictly related to private access locations along both urban and rural road sections for the test site. The presence of an access implies a greater opportunity for conflicts among two or more traffic flows; moreover, accesses have a strong influence on accident potential, and access management techniques can improve road safety [52]. Furthermore, critical conditions of access points (location on curves, near intersections, or other critical sections with lack of visibility) determine favourable conditions for dangerous events. Incorrect and distracted driver behaviour is a substantial contributing factor in most collisions at driveways. Despite the high percentage of left-turn accidents, very weak correlations were found among accident indicators and SPPA, i.e., the safety performance indicator related to the localization of private access points (see Table 3). Therefore, the authors investigated another parameter that took into account the density of accesses along the road test site (total number of driveways per kilometre of road) in order to find significant correlations with accident data. Moreover, the presence of several private accesses alongside rural road segments required the implementation of the inspection procedure along these sections too (following the same procedure used for urban areas). The checklists format was adapted to the local situation, aimed at examining in detail the visibility of accesses and their location. In particular, access points are considered driveways and private side streets intersecting with the public major road [53]. Driveways are classified by the Highway Safety Manual [54] into the following seven different types: major commercial, minor commercial, major industrial-institutional, minor industrial-institutional, major residential, minor residential, and other. According to Williamson and Zhou [55], each different driveway type performs differently and, for this reason, has a different safety impact.
The admissibility of private accesses on a roadway, as well as their distancing and localization criteria depend on the road type. However, their position must facilitate all manoeuvres, not cause danger to vehicles and pedestrians and hinder traffic flows. An inadequate localization could endanger drivers’ safety, especially if it is associated with the lack of visibility. For this reason, the inspection of a driveway’s “location” and “visibility” requires an explicit evaluation. For example, the spacing between access points must be verified to guarantee optimal visibility conditions and to facilitate driver entering manoeuvres avoiding situations of dangerous conflict. In most cases, the presence of unpaved accesses without markings and delineators contributes to downgrading the road alignment in terms of safety performance.
Several studies [56,57] have investigated the relationship between the frequency of private access and accident rate. Their results have shown that an increase in the density of driveways in urban and rural areas is associated with higher accident rates, thus confirming that driveway density must be considered to be a risk factor in road management.
In this second step, an accident analysis was carried out considering only fatal injury and property damage crashes occurring on roadway sections with private access points. Figure 9 shows the relationship between the total number of private accesses per kilometre in both travel directions (for rural and urban areas) and the number of driveway-related accidents per kilometre for the test site (PADR+U, private access density for rural and urban environments). Table 6 summarizes the R2 values obtained from the correlation between access density and indicators referred to both rural and urban data (first row in Table 6) and to each dataset (second and third rows in Table 6). The urban road network has a higher average access density than the rural road network; moreover, accesses have a very close distance. The relationship between the access density and the accident density for urban sections shows an R2 = 0.68; R2 value for the correlation with the total number of injured people per kilometre It is 0.62. This first result for the urban environment could be related to a specific phenomenon known as overlapping of the impact areas of adjacent access points. The impact area can be defined as the functional area of a driveway that includes the space for manoeuvring to enter or exit the roadway [55]. If the spacing between the driveways increases, time for perception and reaction and space for manoeuvring available for drivers also rise, thus, leading to a decrease in risk levels [58].
As it is possible to see in Table 6, a high density of driveways strongly impacts crash frequency (R2 = 0.69), thus, confirming the literature analysis discussed above, i.e., a larger amount of private access points per kilometre determines a higher level of risk. The correlation existing between these two variables is related to the number of possible conflict points that proportionally increases with driveway density; consequently, each supplementary access point is a contributing element to an increase in accident potential.
The results discussed in this section are strictly related to the specific case study, since they are conditioned by the values of the variables involved in the process. The detailed description of the findings is aimed at providing a point-by-point methodology that could be easily exported to other contexts. In particular, this approach facilitates the implementation of the proposed procedures for road infrastructures with technical and functional features similar to those of the case study. The comparison between the findings obtained on other road infrastructures could be useful for improving some methodological aspects of the overall procedure.

5. Model Calibration

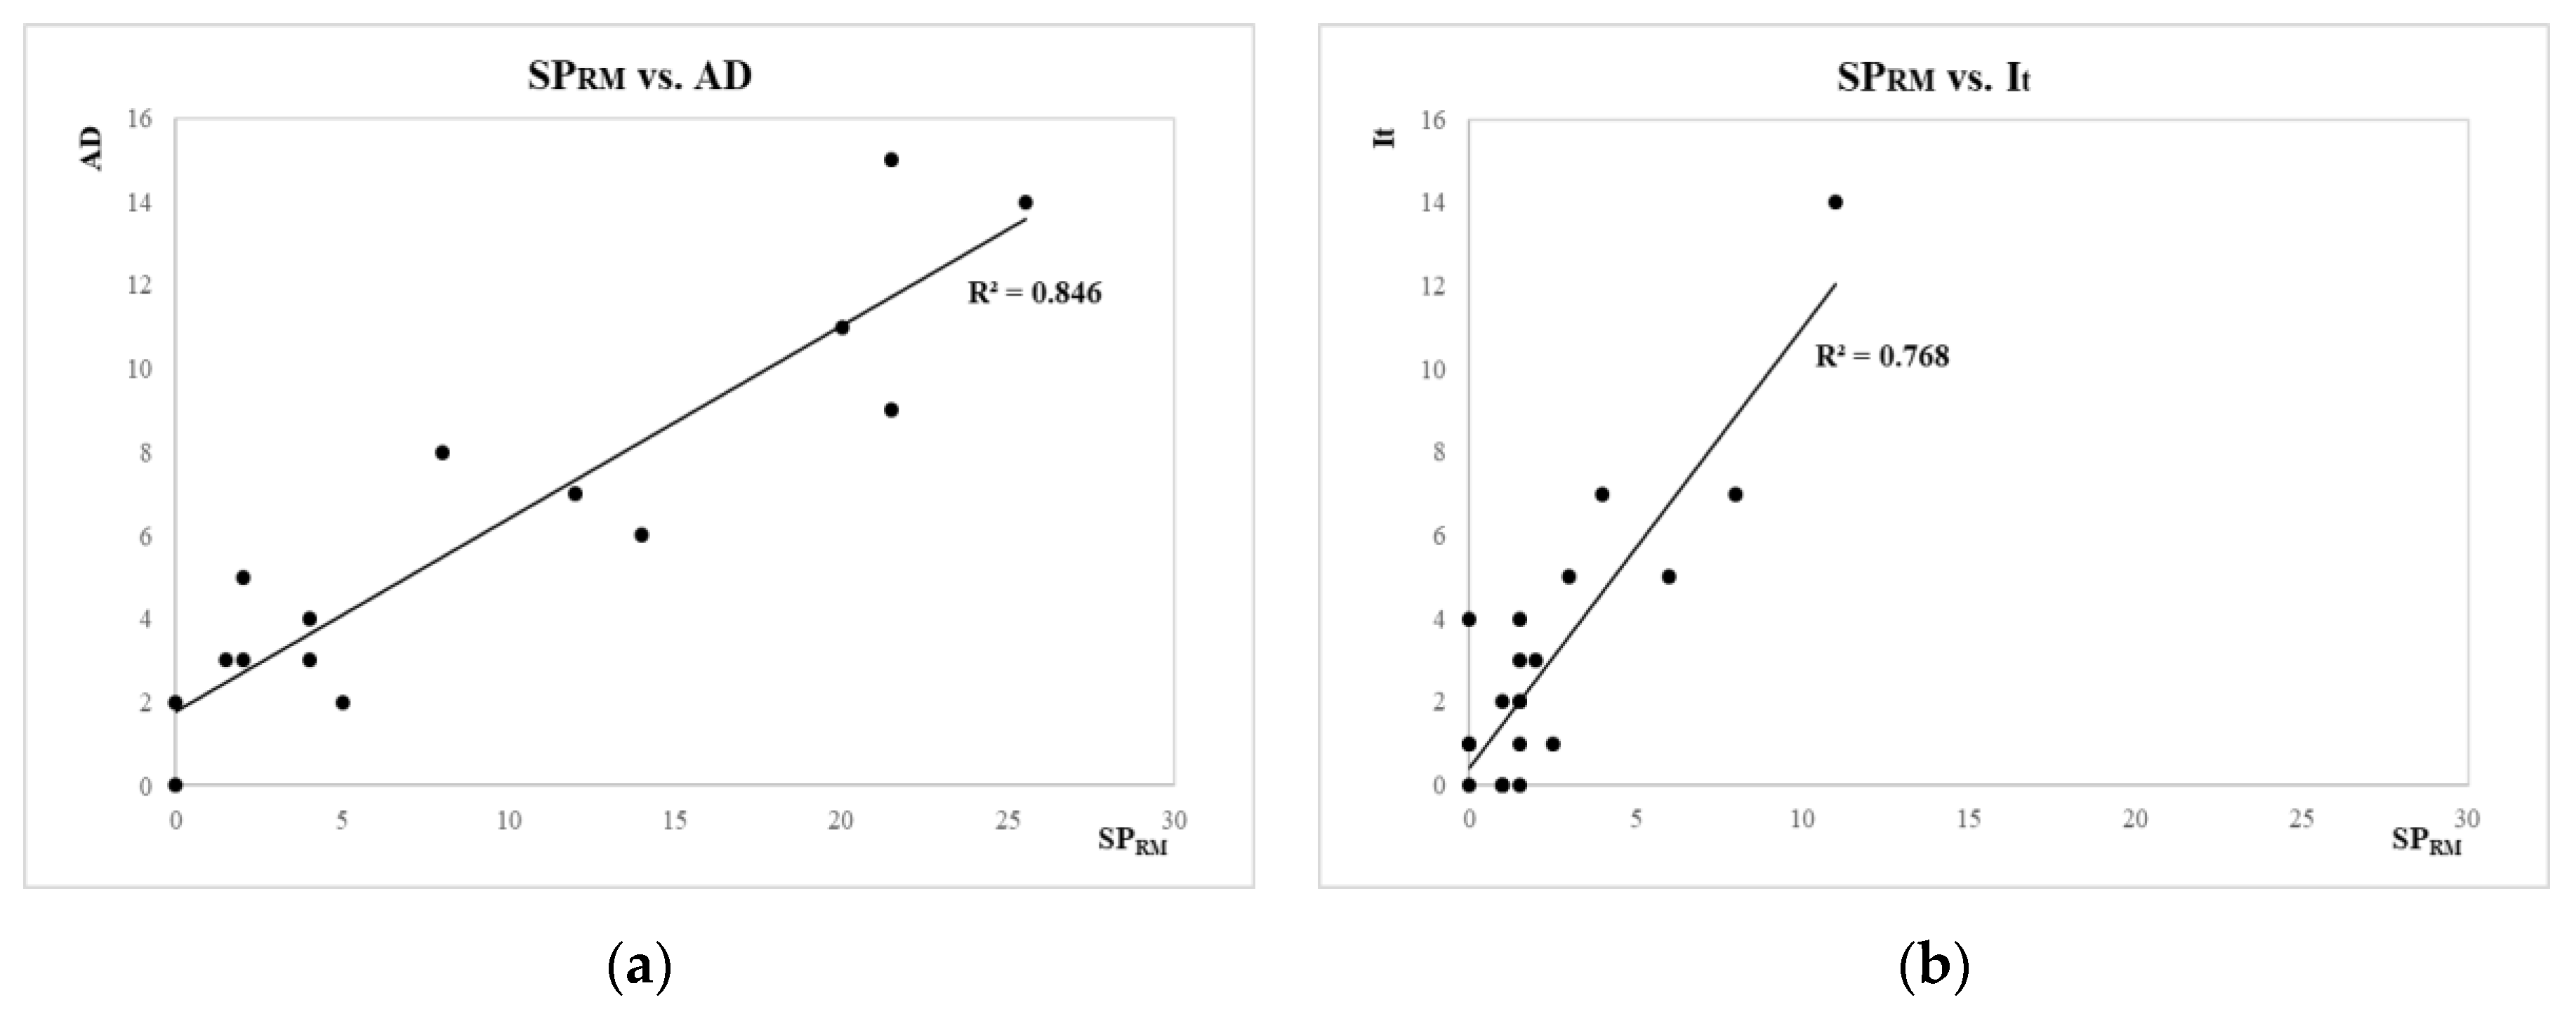
The outcome of the correlation analysis carried out in Section 4 shows that the most significant relationships were registered between accident density and two variables, i.e., the safety performance indicator for road markings and the access density per kilometre. Afterwards, herein, authors investigate on the possibility to carry out a mathematical relationship between accidents and those infrastructure-related parameters that significantly reduce safety.
A traffic crash is a complex event due to interactions among several factors such as road infrastructure, vehicle, environment, traffic, and human behaviour [59]. Data availability is conditioned by the randomness of crash occurrence due to the abovementioned factors and the absence of information on unobserved effects; therefore, the potential bias in estimation could be amplified [60]. Some researchers [61,62] have suggested contemplating a component related to design choices, human behaviour, and traffic characteristics to take into account the rate of the total risk level that cannot be completely eliminated. This variation due to omitted or unmeasured variables is statistically significant even if the causes are unexplained [63,64,65].
Several studies have examined the likelihood of road crashes and their relationship with road conditions in order to quantify the effect of one or more road-related elements on the safety level. An exhaustive review was carried out by Praticò and Vaiana [66].
In this paragraph, the simultaneous influence of several infrastructure-related variables on accident occurrence is investigated through an empirical equation that has the following characteristics:
  • Provides quantitative information about the relationships among injuries and road features;
  • It is useful for making future accident predictions;
  • Takes into account the contribution of multiple infrastructure-related variables on crash occurrences;
  • Gives the best data fitting, minimizing differences between experimental values and those calculated through the mathematical model.
It is important to highlight that this analysis is affected by the uncertainties related to accident occurrences. Moreover, the lack of data about factors affecting these events imply an incomplete description of the phenomenon through the predictive capacity of mathematical models. Models are different in some statistical properties such as the assumption of the distribution of the occurrence of accidents, the choice of variables, and the functional form that describes the cause–effect link [67,68]. The most common types of mathematical models are summarized in Table 7 [66,69].
In the light of the above, the target of this analysis is to determine a mathematical law such as the following:
y =   f   ( x 1 , x 2 ,   x n ;   α 1 , α 2 ,     α n )
which is valid for the case study, describing the contemporary effect of a set of n variables ( x 1 , x 2 ,   x n ) requiring a maintenance intervention on accident occurrence (y); “ α 1 , α 2 ,     α n are the regression parameters (constant coefficients) to be determined from the available dataset. The analysis of this cause–effect relationship is carried out by identifying a mathematical model using a calibration procedure for the test site.
This approach is organized into four phases which can be summarized as follows [66,70]:
  • Identification of the most significant variables that potentially influence the probability of a road accident, based on the combined analysis between safety inspections and fatalities for the test site (Section 4);
  • Analysis of accident dataset (Section 3.3);
  • Model calibration by experimental data using five regression equations (Table 7);
  • Identification of the most representative equation for the case study (the theoretical curve that provides the best fit to experimental data).
In particular, the total variation of accident density (effect) can be decomposed into the following two contributions (causes): a first component strictly related to road features and a component influenced by variations among factors (vehicle, environment, traffic, and human behaviour). In this study, the second contribution is considered to be a constant value Ue (unobserved effects); U
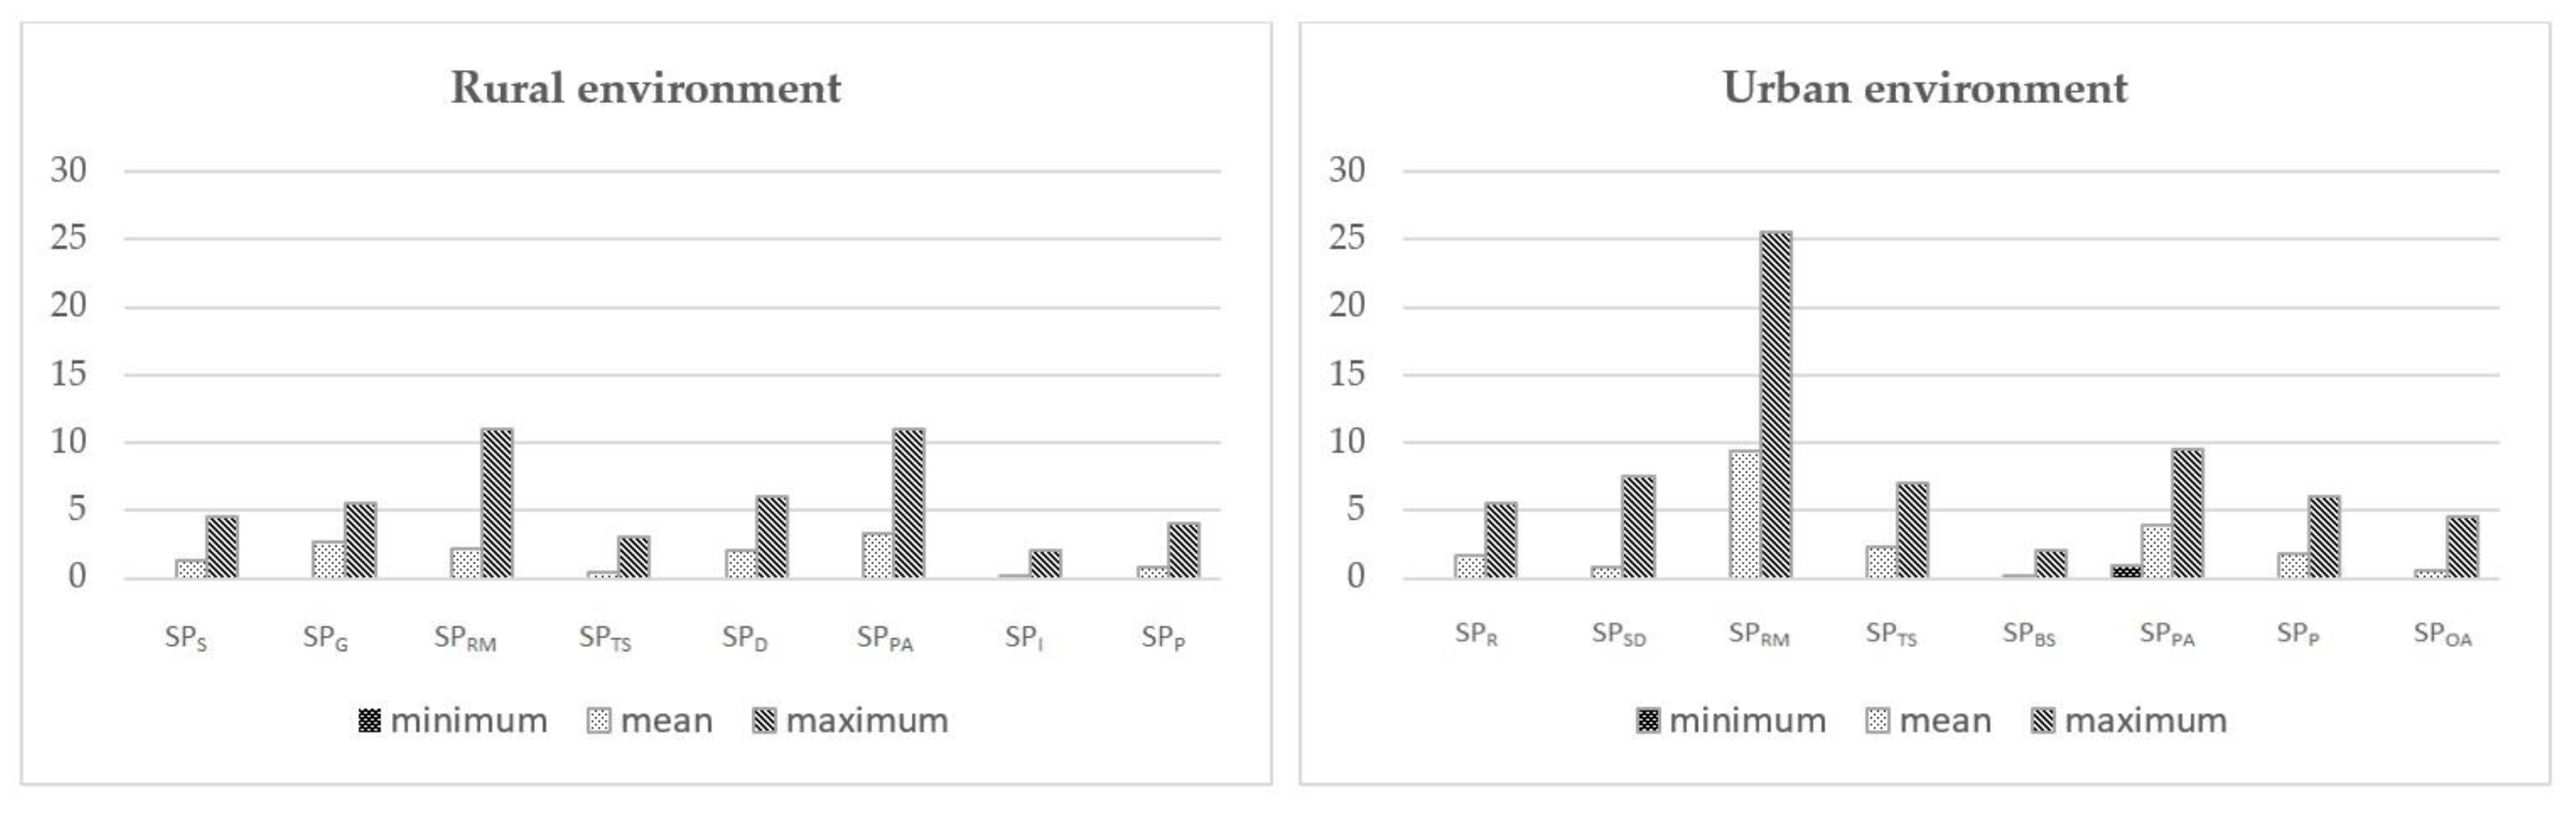
e is the adjustment constant taking into account an intrinsic threshold of accident rating not depending on infrastructure variables. The absence of road safety issues, in fact, is not always related to a zero-risk level. The infrastructure-related variables involved in defining the models are PAD (density of private access points), SPRM (safety performance, road markings), and ƩSP; ƩSP is a vector that considers the effects of multiple observed road conditions. The subset of variables includes SPS (safety performance, shoulder), SPG (safety performance, guardrail), SPTS (safety performance, traffic signs), SPD (safety performance, delineation), SPPA (safety performance, private access points), SPP (safety performance, pavement), SPR (safety performance, roadway), SPSD (safety performance, sidewalk) (see Table 3). The variable related to intersections (SPI) was not considered in the analysis. A different type of inspection (for singular points) is needed to identify all the safety issues which affect junctions as expressly indicated in [32].
Herein, the distinction between rural and urban sections is managed implicitly in the use of the infrastructure-related variables. The type of environment of each section (rural/urban) defines the variables to be used in the vector ƩSP, according to Table 3. Table 8 shows the functional laws of each model and the value assumed by the unknown parameters estimated using the least squares method. Models 1 and 2 are obtained starting from the basic forms of Poisson regression models [69]. Model 3 is based on a multiple linear regression approach, Model 4 on a non-linear form. An exponential equation is considered for Model 5.
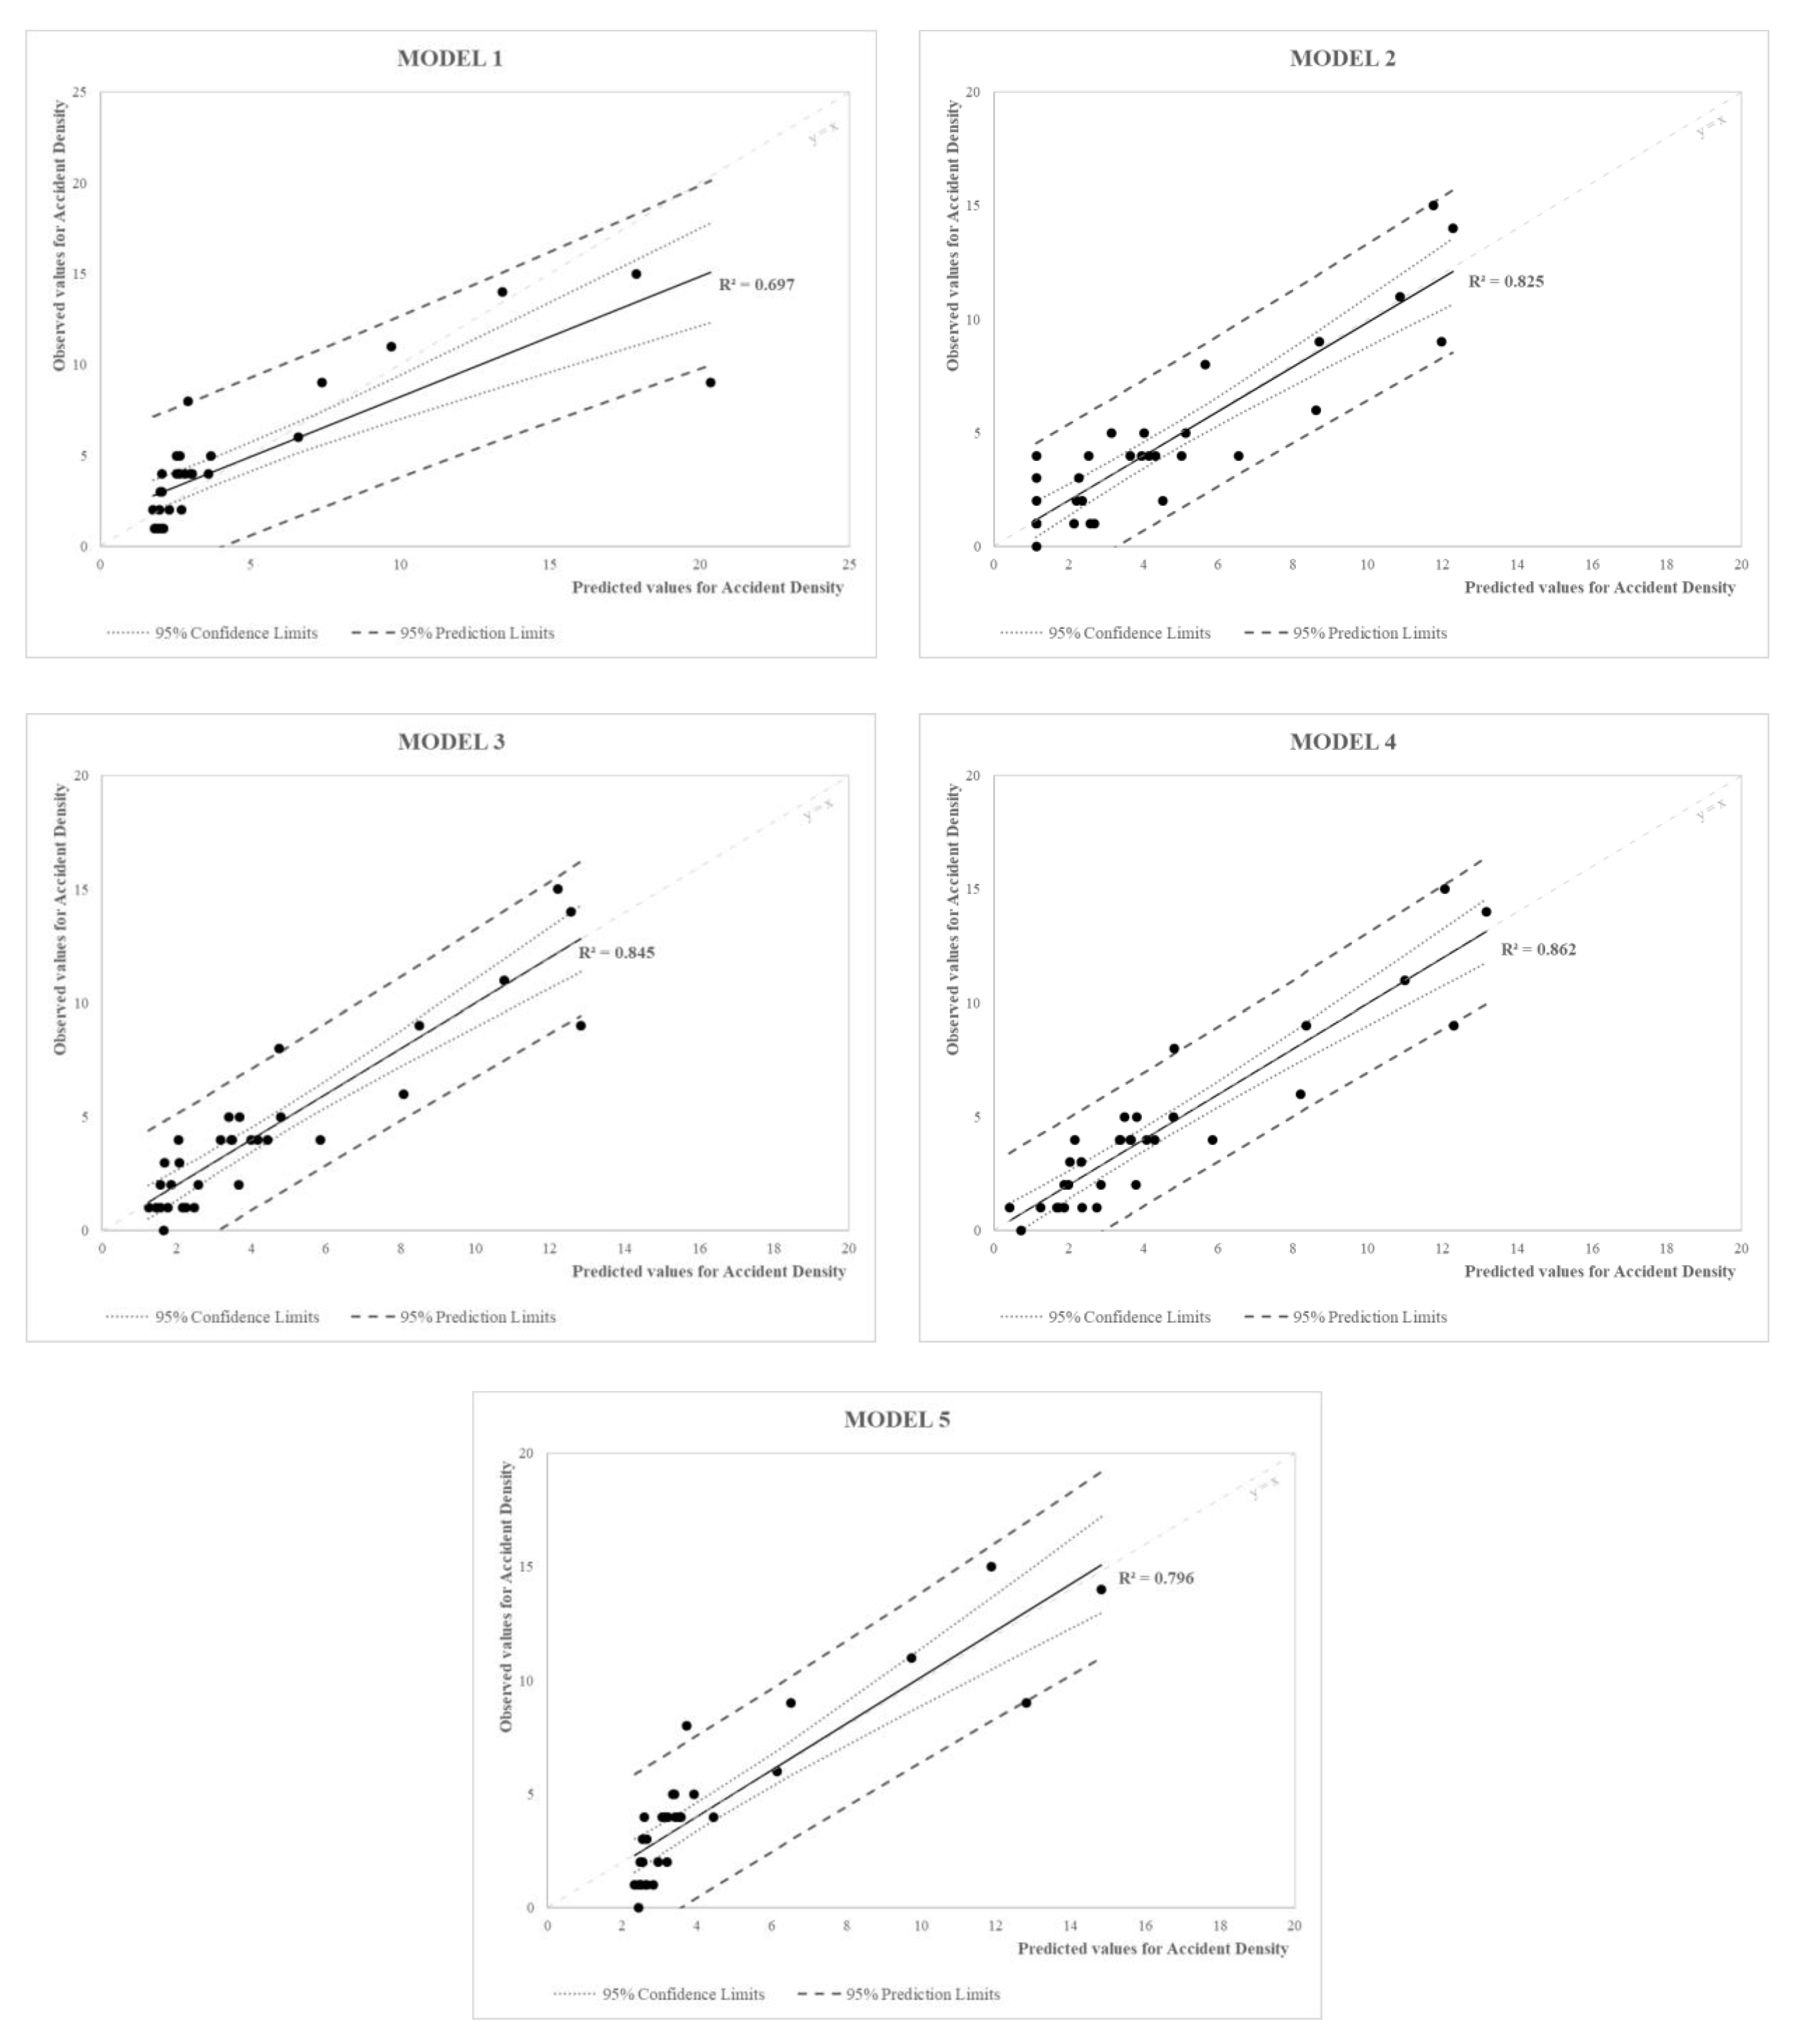
The definition of R2 for each of the previous models obtains a first level of assessment on the adequacy of fitting experimental data of each calibrated model identifying some validity limits. A qualitative evaluation of models fitting is showed in Figure 10 by plotting observed and model-estimated values. For a comprehensive analysis, the 95% confidence interval and the 95% prediction interval are also reported for each regression model. As it is possible to see in Table 8 and Figure 10, the best fit to experimental data (R2 higher than 0.8) was found for the nonlinear model (Model 4, R2 = 0.862), the multiple linear regression model (Model 3, R2 = 0.845), and a model obtained starting from the basic forms of Poisson regression models (Model 2, R2 = 0.825). The other investigated models show correlation coefficients always higher than 0.6; however, a great dispersion of data is registered for high accident density values.
It is well known that R2 provides only a qualitative evaluation of prediction model’s goodness-of-fit [64], consequently, comparisons of models is investigated, as discussed in Section 6, using a second-order Akaike’s information criterion.

6. Model Selection: Akaike’s Information Criterion and Discussion

In order to better investigate fitted models, the Akaike’s information criterion was used for a comparison among them. According to this criterion, the preferred model is the one with the minimum AIC value, defined as follows:
AIC   =   2 K 2 log ( L   (   Θ ^   | y ) )
where n is the sample size, K is the number of estimable parameters, and log   ( L (   Θ ^   | y ) is the log-likelihood at its maximum point of the model estimated [71,72].
In this study, a second-order AIC was used which has been demonstrated to be more accurate for a small sample size [73]. Burnham and Anderson [73] provided an examination of AIC techniques for model selection and indicated that this corrected version should be used unless the ratio between the number of data points and the number of parameters (n/K) is higher than about 40 for the model with the maximum number of parameters. The correction of AIC score, AICc, is a function of the sample size n and of the number of parameters K and it is defined by:
AIC c   =   AIC + 2 K ( K + 1 ) n K 1
The AICc values can be used for a ranking of the fitted models (see the first row of Table 9). These results show that Model 3 seems to be the most adequate for the dataset (AICc = 30.79) and Model 2 has an AICc score close to Model 3. On the contrary, Model 1 and Model 5 are characterized by the highest AICc scores. The difference in AICc between each model and the model with the lowest AICc score is reported in the second row of Table 9. The equation used is the following:
AIC c   =   AIC c   ( i )   AIC c   ( m i n )
where AICc(i) is the AICc value for each analysed model and AICc(min) is the minimum among the AICc(i) scores.
As it is possible to note in Table 9, the ΔAICc value is 0 for the best model (Model 3). In particular, the ΔAICc values confirm the conclusions drawn above about the inadequacy of Model 1 and Model 5 to fit experimental data [73]. However, Models 2, 3, and 4 have close ΔAICc values; therefore, they have the same importance in assessing criterion preference [74]. According to Burnham and Anderson [73], ranges of ΔAIC values (Δi = AICi − AICmin) were calculated for the evaluation of models ranking; the following classification was carried out in their study:
  • Δi 2, substantial support;
  • 4   Δi 7, less support;
  • Δi > 10, no support.
On the basis of these rules, only the models with ΔAICc lower than two units were considered to be adequate for the analysis. Consequently, Models 1, 2, and 5 were not investigated. In order to select the best regression equation, Akaike’s weights were estimated for Model 3 and 4 by the following:
w   = exp ( 1 2 AIC c ) 1 + exp ( 1 2 AIC c )
where ΔAICc is the difference in AICc scores for the selected models (ΔAICc = 1.75, Table 9), whereas w estimates the relative probability of the two models. The result (w = 0.29) shows that about 29% is the percent chance that Model 4 is more adequate than Model 3.
For this comparison procedure, the evidence ratio (ER) was also estimated as [75]:
ER   =   Probability   that   model   1   is   correct Probability   that   model   2   is   correct = 1 exp ( 1 2 AIC c )
Equation (8) is equivalent to the ratio between the Akaike’s weight of the best model and the weight of the other model considered (Model 3 and Model 4, respectively) [72]. The ER value (ER = 2.40) provides the information that Model 3 is about two times more likely to be correct than Model 4.
The comprehensive analysis of the AICc approach allows us to draw the following conclusions:
(i) The nonlinear model (Model 4) is the best model for the dataset looking at the fitting graphs (Figure 10) and the relative R2 values (Table 8). Furthermore, Model 4 is characterized by the lowest sum-of-squares. However, using the AICc method, the multiple linear regression model (Model 3) is more likely to be correct than Model 4. The analysis shows that Model 3 has the lowest score of AICc and the probability that it is more correct than the nonlinear model is 71% (w = 0.71, according to Equation (7)). These results confirm that the best fit of data is always achieved through the more complicated model (more parameters) regardless of its adequacy for the dataset [75]. The additional parameters of the nonlinear equation, as compared with the multiple linear equation, affect the AICc score, which gives the information that the simplest model is the most adequate. However, as suggested by Motulsky and Christopoulos [75], it is not possible to reject a model or conclude that one model is more statistically significant than others using only the AICc approach, as it is based on the information theory.
(ii) From the analysis carried out by the AICc method, interesting information about the importance of the variables was obtained. Variables contained in the models with the highest AICc value and not included in those with a lower AICc score have considerably less importance in modelling the dataset [72]. Road infrastructure-related variables that appear in Model 3 and Model 4 are PAD (density of private access points) and SPRM (safety performance, road markings). Therefore, these can be considered to be the variables that add useful information in establishing model adequacy; on the contrary, the contribution of ƩSP that appears in Model 1 and in Model 5 can be ignored in modelling.

7. Conclusions

Among the safety management procedures on existing road networks, road safety analysis is a powerful preventive tool for eliminating and reducing the number of accidents. The application of road safety inspections can identify all road infrastructure-related features with poor safety conditions affecting the safety level of the existing road network. The most frequent issues investigated are related to the absence or insufficient width of the shoulder, the presence of pavement unevenness that compromises regularity, the inadequacy of road markings, and incorrect installation of guardrails. The outcome of the RSI procedure is transformed in a quantitative evaluation, through a safety performance indicator affected by all the safety deficiencies highlighted during the inspection phase. Carrying out RSIs does not require knowledge of accidents’ data, due to the fact that the main feature of this analysis is aimed at characterizing the road network through the infrastructure safety issues.
In this study, accident analysis and RSIs are not considered to be two independent procedures. In fact, the aim of the authors was to identify the potential relationships among infrastructure deficiencies (the outcome of RSI) and the frequency and severity of accidents (from accident analysis), and to try to investigate how a specific condition of a road element could represent a safety problem for traffic circulation.
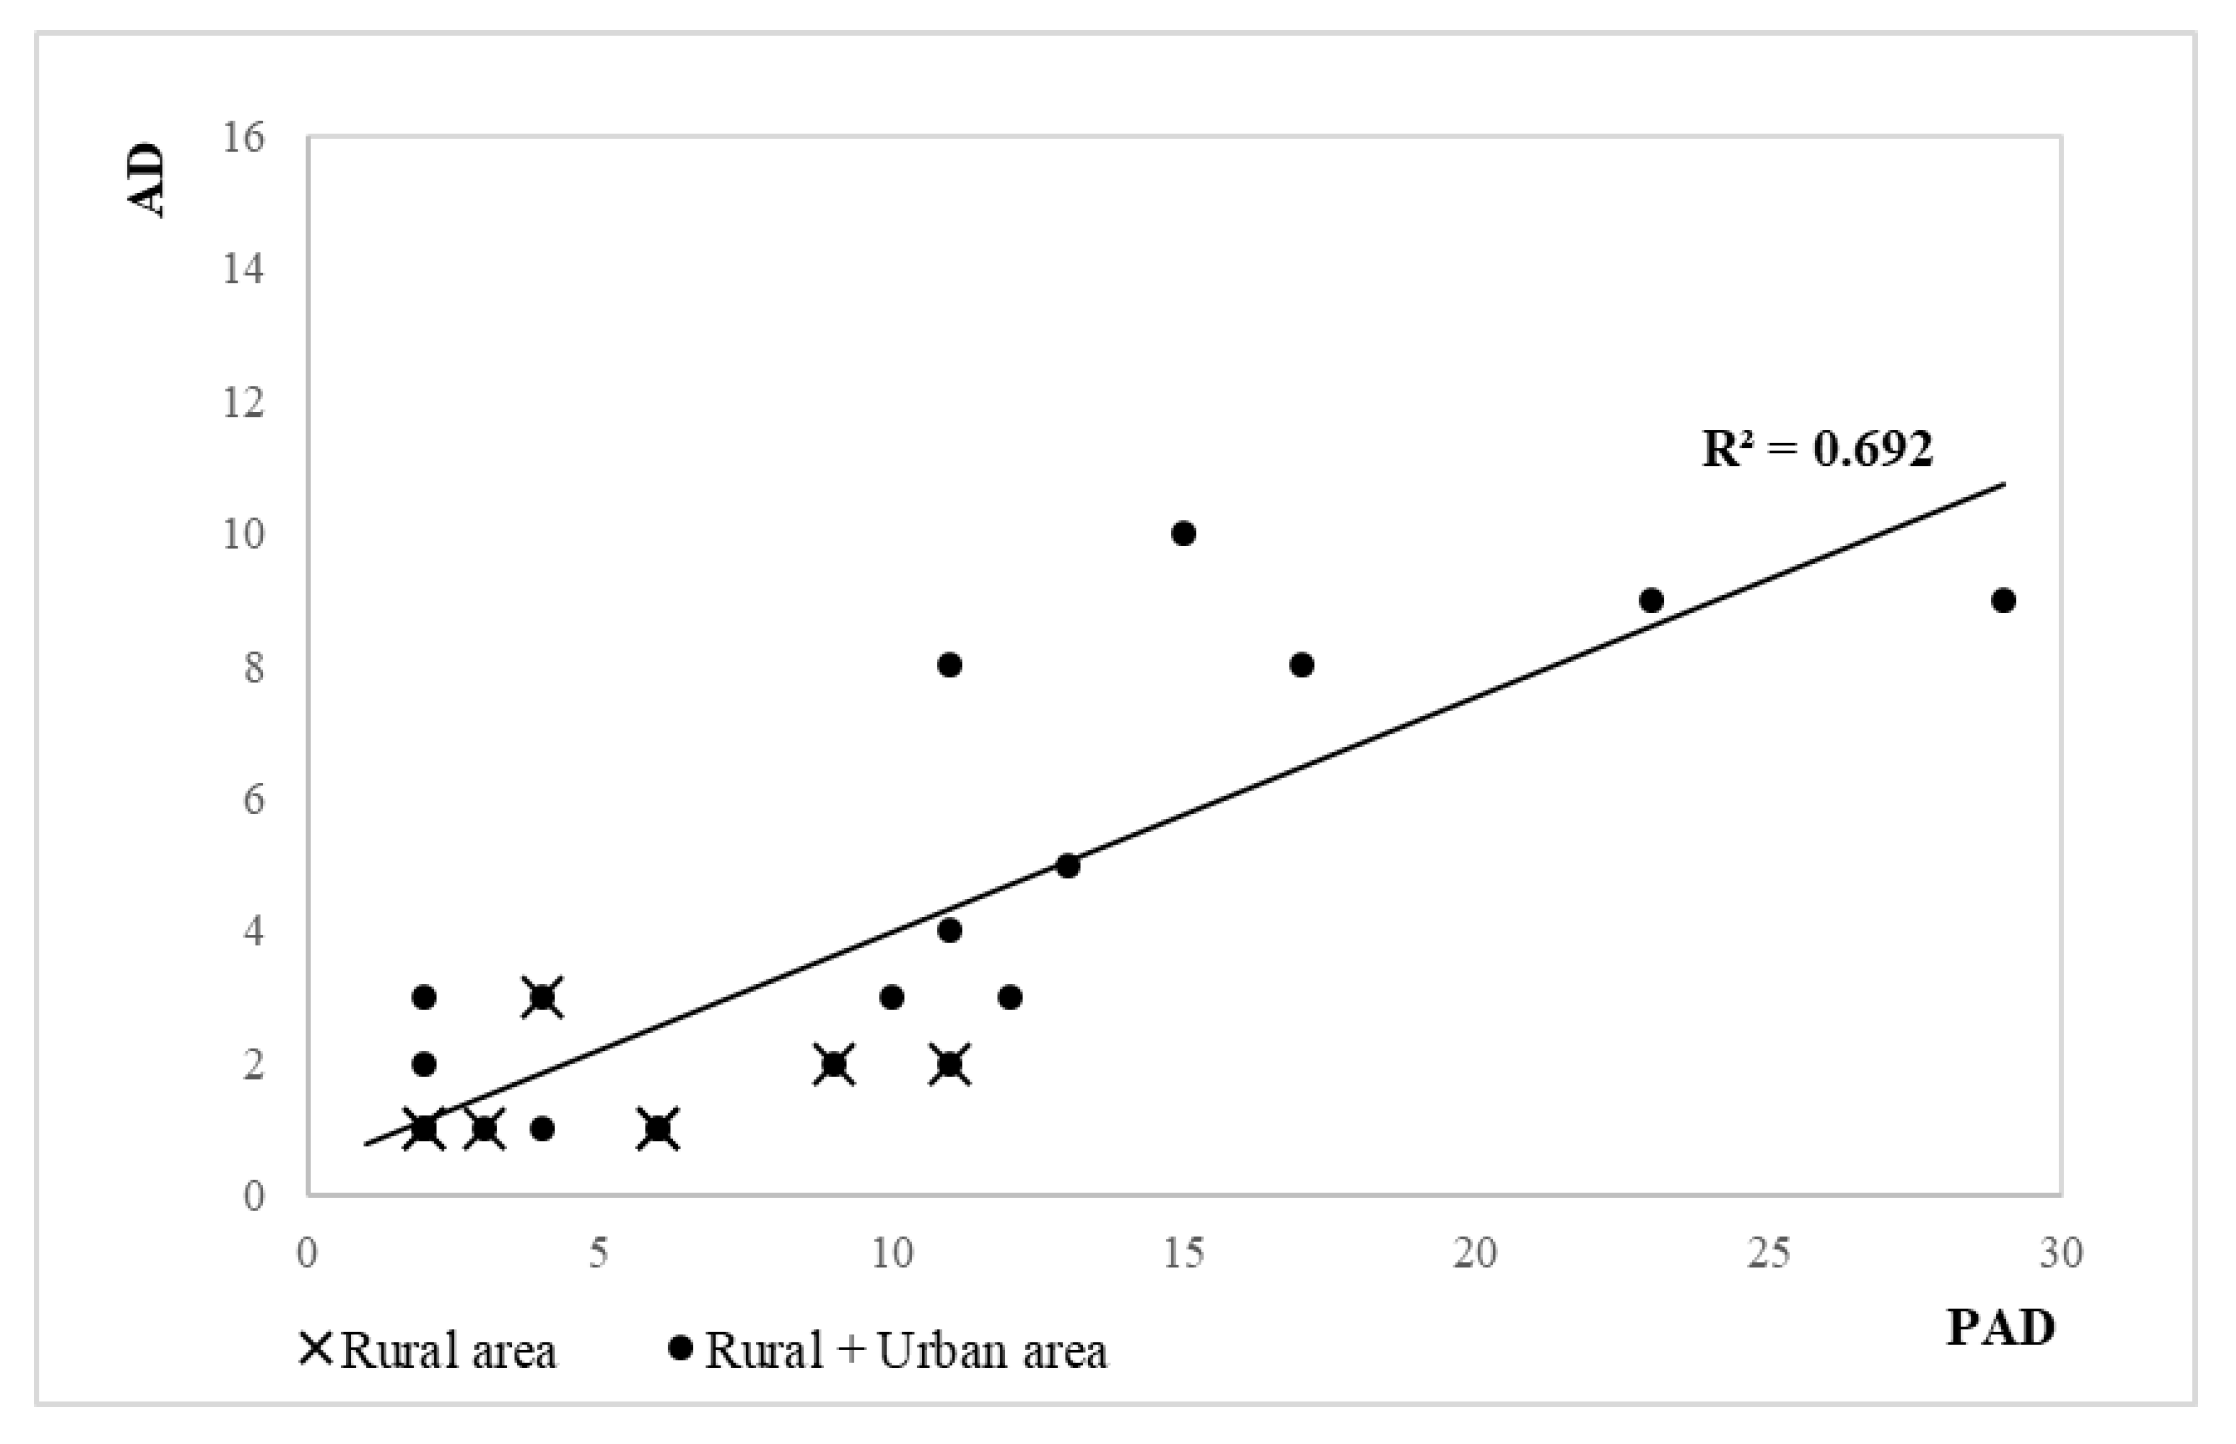
The analysis shows that the most statistically significant relationship was found between the accident density/total number of injured people and the safety performance parameter of road markings, for both rural and urban environments. Road markings are an essential tool for the optical driving of road users; they must guarantee an adequate perception of the road layout in all operating conditions, providing essential information for road users. The relationship between the density of private access roads, considered to be a risk factor for the network test site, and the number of accidents (per kilometre of road) was also investigated. As stated in Section 4.2, a high density of driveways strongly impacts crash frequency, i.e., a higher number of private access points per kilometre determines a higher level of risk. Each driveway is an opportunity for conflicts between the traffic flows; consequently, access points are a contributing element to accident potential increase. The analysis of the contribution of multiple infrastructure-related variables on the occurrence of traffic crashes, from a quantitative point of view, was carried out through the identification of a mathematical model which was also useful for making accident predictions. Looking at the fitting and the coefficient of determination values, among the calibrated models the nonlinear equation and the multiple linear regression equation are the best models for the dataset; in particular, the higher R2 value and the lower sum-of-squares obtained for the nonlinear function quantify the goodness-of-fit for this model. The analysis was extended to a second-order AIC approach (AICc) in order to compare the fitted models. The results show that the multiple linear model is more likely to be correct than the nonlinear model. The first model has a lower score in AICc and there is a 71% probability that it is more adequate than the nonlinear model. The AICc score that is affected by the number of parameters adds the information that the simplest model is also adequate for the dataset. From the analysis carried out by the AICc method, the importance of the variables considered in the five fitted models was also investigated. The results show that the road infrastructure-related variables (access density and the safety performance indicator for road markings) are the most significant for accident density prediction.
In this study, the authors intended to provide a methodology through a detailed descriptive analysis of a case study, in order to facilitate the implementation of this procedure to other contexts. In future studies, limitations of this methodology due to the amount of data could be overcome by extension of this approach to road infrastructures with similar technical and functional features. These findings could obtain a more correct calibration and validation of the accident prediction models. This approach could benefit both practitioners and researchers by evaluating the relationship between accident frequency and safety inspections in order to identify items that require a priority intervention in light of an adequate maintenance policy of road network. This could facilitate road authorities in the selection of the most effective preventive measures to improve specific safety aspects. From this point of view, road safety inspections represent an important investment for improving the level of road safety for all road users.

Author Contributions

Conceptualization, R.V. and G.P.; methodology, R.V. and G.P.; validation, R.V. and G.P.; investigation, G.P.; data curation, G.P.; formal analysis, T.I. and V.G.; writing—original draft preparation, G.P.; writing—review and editing, G.P., T.I. and V.G.; supervision, R.V. All authors have read and agreed to the published version of the manuscript.

Funding

This research received no external funding.

Institutional Review Board Statement

Not applicable.

Acknowledgments

The authors would like to acknowledge the ForSICS—Sicurezza Stradale onlus Association, Eng. Antonio Cioni and Eng. Marco Vigliatore, for the valuable support in providing road accident data used in this document.

Conflicts of Interest

The authors declare no conflict of interest.

References

  1. World Health Organization. Global Status Report on Road Safety 2018; CC BYNC-SA 3.0 IGO; WHO: Geneva, Switzerland, 2018. [Google Scholar]
  2. World Health Organization. Global Plan for the Decade of Action for Road Safety 2011–2020; WHO: Geneva, Switzerland, 2011. [Google Scholar]
  3. Federal Highway Administration. FHWA Road Safety Audit Guidelines; Publication No. FHWA-SA-06-06; US Department of Transportation, Federal Highway Administration (FHWA): Washington, DC, USA, 2006.
  4. European Parliament and Council of the European Union. Directive 2008/96/EC of the European Parliament and of the Council of 19 November 2008 on road infrastructure safety management. Off. J. Eur. Union L 2008, 319, 59. [Google Scholar]
  5. United Nations General Assembly. A/RES/64/255. Improving Global Road Safety. 2010. Available online: https://undocs.org/A/RES/64/255 (accessed on 15 November 2020).
  6. European Transport Safety Council. Briefing: 5th EU Road Safety Action Programme 2020–2030. 2018. Available online: https://etsc.eu/wp-content/uploads/5th_rsap_2020-2030_etsc_position.pdf (accessed on 15 November 2020).
  7. Čabarkapa, M.; Avramović, Z.Ž.; Vešović, V. The control of Road Infrastructure Safety Management Procedures. Int. J. Traffic Transp. Eng. 2018, 7, 7–14. [Google Scholar]
  8. Persia, L.; Usami, D.S.; De Simone, F.; Beaumelle, V.F.D.L.; Yannis, G.; Laiou, A.; Han, S.; Machata, K.; Pennisi, L.; Marchesini, P.; et al. Management of Road Infrastructure Safety. Transp. Res. Procedia 2016, 14, 3436–3445. [Google Scholar] [CrossRef] [Green Version]
  9. Transport & Mobility Leuven; TRT; Prospex. Study on the Effectiveness and on the Improvement of the EU Legislative Framework on Road Infrastructure Safety Management (Directive 2008/96/EC); Transport & Mobility Leuven: Leuven, Belgium, 2014. [Google Scholar]
  10. International Traffic Safety Data and Analysis Group. Road Infrastructure Safety Management; IRTAD: Paris, France, 2015. [Google Scholar]
  11. Sitran, A.; Delhaye, E.; Uccelli, I. Directive 2008/96/EC on road infrastructure safety management: An ex–post assessment 5 years after its adoption. Transp. Res. Procedia 2016, 14, 3312–3321. [Google Scholar] [CrossRef] [Green Version]
  12. European Parliament and Council of the European Union. Directive 2019/1936 of the European Parliament and of the Council of 23 October 2019 amending Directive 2008/96/EC on road infrastructure safety management. Off. J. Eur. Union L 2019, 305, 1–16. [Google Scholar]
  13. European Commission. Proposal for a Directive of the European Parliament and of the Council Amending Directive 2008/96/EC on Road Infrastructure Safety Management; European Commission: Brussels, Belgium, 2018. [Google Scholar]
  14. Kaltenegger, A.; Salamon, B.; Furian, G. European Road Safety Policy 2016–2020: A Forecast on Topics and Activities. Acad. Res. Community Publ. 2018, 2, 1–8. [Google Scholar] [CrossRef] [Green Version]
  15. Ministero dei Lavori Pubblici. Linee guida per le analisi di sicurezza delle strade; Circolare n.3699, 8 giugno 2001; Ministero dei Lavori Pubblici: Madrid, Spain, 2001.
  16. World Road Association. Infrastrutture Stradali più Sicure Fase 1 i Criteri. XXVI Convegno Nazionale Stradale; AIPCR: Paris, France, 2010. [Google Scholar]
  17. Alfonsi, R.; Persia, L.; Antonino, T.; Usami, D.S. Advances in Road Safety Management Analysis. Transp. Res. Procedia 2016, 14, 2064–2073. [Google Scholar] [CrossRef] [Green Version]
  18. Cafiso, S.; Pappalardo, G.; Kiec, M. Innovative methods for improving the effectiveness of road safety inspection. In Proceedings of the VI International Symposium of Transport and Communications, NEW HORIZONS, Doboj, Republic of Srpska, 29–30 November 2017. [Google Scholar]
  19. Weekley, J.; Barrell, J.; McCarthy, T. Developing a Road Safety Review Tool to Identify Design Standard and Safety Deficits on High Risk Road Sections. Transp. Res. Procedia 2016, 14, 4130–4139. [Google Scholar] [CrossRef] [Green Version]
  20. Đerić, M.; Tešić, M.; Marić, B.; Andrić, Z. RSI implementation in the countries of the region. JTTTP J. Traffic Transp. Theory Pract. 2017, 2. [Google Scholar] [CrossRef] [Green Version]
  21. Elvik, R. Road Safety Inspections: Safety Effects and Best Practice Guidelines; TOI Report 850/2006; TOI: Oslo, Norway, 2006. [Google Scholar]
  22. Elvik, R.; Vaa, T. The Handbook of Road Safety Measures; Elsevier Science: Amsterdam, The Netherlands, 2004. [Google Scholar]
  23. BASt. Sicherheitsaudit für Straßen (SAS) in Deutschland; Berichte der BASt; Verkehrstechnik Heft V98; BASt: Köln, Germany, 2002. [Google Scholar]
  24. Rosebud. Screening of Efficiency Assessment Experiences—Report State of the Art; Report D2, WP1, Rosebud, Road Safety and Environmental Benefit-Cost and Cost-effectiveness Analysis for Use in Decision Making; Rosebud Press: Fruitland, UT, USA, 2003. [Google Scholar]
  25. TOI; ViaTrafik. Evaluation of Road Safety Audit in Denmark; TOI: Oslo, Norway, 2013. [Google Scholar]
  26. Surrey County Council. Road Safety Audit: An Investigation into Casualty Savings—Discussion Report; Surrey County Council Highways Management Division: Kingston upon Thames, UK, 1994. [Google Scholar]
  27. European Transport Safety Council. ETSC Factsheet—Road Safety Audit, N. 05; ETSC: Brussels, Belgium, 2005. [Google Scholar]
  28. Herrstedt, L. Road Safety Audit. Note 67, 1999; Road Directorate: Copenhagen, Denmark, 1999. [Google Scholar]
  29. Herrstedt, L. Road Safety Audit. Note 74, 2000; Road Directorate: Copenhagen, Denmark, 2000. [Google Scholar]
  30. Rossetti, S.; Tiboni, M.; Tira, M. Road safety in Italy: An assessment of the current situation and the priorities of intervention. Period. Polytech. Transp. Eng. 2014, 42, 159–165. [Google Scholar] [CrossRef] [Green Version]
  31. Repubblica Italiana. Decreto Legislativo 15 Marzo 2011, n.35; Attuazione della Direttiva 2008/96/CE Sulla Gestione della Sicurezza delle Infrastrutture Stradali; Gazzetta Ufficiale della Repubblica Italiana: Roma, Italy, 2011. [Google Scholar]
  32. Ministero delle Infrastrutture e dei Trasporti. Decreto Ministeriale n.137; Linee Guida per la Gestione della Sicurezza delle Infrastrutture Stradali ai Sensi dell’Articolo 8 del Decreto Legislativo 15 Marzo 2011, n.35; Gazzetta Ufficiale della Repubblica Italiana: Roma, Italy, 2012.
  33. Tiboni, M.; Rossetti, S. Implementing a road safety review approach for existing bus stops. WIT Trans. Built Environ. 2013, 130, 699–709. [Google Scholar] [CrossRef] [Green Version]
  34. Cafiso, S.; La Cava, G.; Montella, A.; Pappalardo, G. A procedure to improve safety inspections effectiveness and reliability on rural two-lane highways. Balt. J. Road Bridge Eng. 2006, 1, 143–150. [Google Scholar]
  35. Cardoso, J.L.; Stefan, C.; Elvik, R.; Sorensen, M. Road Safety Inspections: Best Practice and Implementation Plan; Deliverable D5 of the RIPCORD-ISEREST Project; Institute of Transport Economics (TØI): Oslo, Norway, 2005. [Google Scholar]
  36. Montella, A. Safety Reviews of Existing Roads: Quantitative Safety Assessment Methodology. Transp. Res. Rec. J. Transp. Res. Board 2005, 1922, 62–72. [Google Scholar] [CrossRef]
  37. Demasi, F.; Loprencipe, G.; Moretti, L. Road Safety Analysis of Urban Roads: Case Study of an Italian Municipality. Safety 2018, 4, 58. [Google Scholar] [CrossRef] [Green Version]
  38. National Academies of Sciences, Engineering, and Medicine. Road Safety Audits; The National Academies Press: Washington, DC, USA, 2004. [Google Scholar] [CrossRef]
  39. European Commission, DG Energy and Transport, High Level Group Road Safety. Road Infrastructure Safety Management. Brussels, Belgium. 2003. Available online: http://www.expertas.de/01_en/02_docs/020_EC_SafetyManagement03_en/safety_manag.pdf (accessed on 3 November 2020).
  40. World Road Association. Technical Committee 3.1 Road Safety. In Road Safety Inspection Guidelines for Safety Checks of Existing Roads; PIARC: Paris, France, 2012; ISBN 978-2-84060-259-8. [Google Scholar]
  41. Ministero delle Infrastrutture e dei Trasporti. Decreto Ministeriale n.6792 del 5 Novembre 2001. In Norme Funzionali e Geometriche per la Costruzione delle Strade; Gazzetta Ufficiale della Repubblica Italiana: Roma, Italy, 2001. [Google Scholar]
  42. Colonna, P. Proposta di criteri di definizione delle strade urbane ed extraurbane. In Proceedings of the XI Convegno S.I.I.V., Verona, Italy, 28–30 November 2001. [Google Scholar]
  43. Cafiso, S.; Di Graziano, A.; Pappalardo, G.; Giudice, O. Tools for Safety Inspection and Management of Road Networks. Sustainability, Eco-efficiency and Conservation in Transportation Infrastructure Asset Management. In Proceedings of the 3rd International Conference on Tranportation Infrastructure, ICTI 2014, Pisa, Italy, 22–25 April 2014. [Google Scholar]
  44. Praticò, F.; Catalfamo, D.; Lanciano, C. Safety and reliability of a road: A prototypical study based on the directive 2008/96/EC. In Functional Pavement Design, Proceedings of the 4th Chinese-European Workshop on Functional Pavement Design, CEW 2016, Delft, The Netherlands, 29 June–1 July 2016; CRC Press-Taylor & Francis Group: London, UK, 2016. [Google Scholar] [CrossRef]
  45. Vaiana, R.; Iuele, T.; Astarita, V.; Festa, D.C.; Tassitani, A.; Rogano, D.; Zaffino, C. Road safety performance assessment: A new road network Risk Index for info mobility. Procedia Soc. Behav. Sci. 2014, 111, 624–633. [Google Scholar] [CrossRef] [Green Version]
  46. World Road Association. Technical Committee 3.1 Road Safety. In Road Accident Investigation Guidelines for Road Engineers; PIARC: Paris, France, 2007; ISBN 978-2-84060-321-4. [Google Scholar]
  47. Lamm, R.; Psarianos, B.; Mailaender, T.; Choueiri, E.M.; Heger, R.; Steyer, R. Highway Design and Traffic Safety Engineering Handbook; McGraw-Hill: New York, NY, USA, 1999. [Google Scholar]
  48. Vaiana, R.; Iuele, T.; Gallelli, V.; Rogano, D. Demanded vs Assumed friction along horizontal curves: An on-the-road experimental investigation. J. Transp. Saf. Secur. 2017, 1–27. [Google Scholar] [CrossRef]
  49. Rumar, K.; Marsh, D.K., II. Lane Marking in Night Driving: A Review of Past Research and of the Present Situation; Report UMTRI-98-50; The University of Michigan Transportation Research Institute: Ann Arbor, MI, USA, 1998. [Google Scholar]
  50. Charlton, S.G.; Starkey, N.J. Transition within a safe road system. Accid. Anal. Prev. 2018, 121, 250–257. [Google Scholar] [CrossRef]
  51. Stelling-Konczak, A.; Aarts, L.; Duivenvoorden, K.; Goldenbeld, C. Supporting drivers in forming correct expectations about transitions between rural road categories. Accid. Anal. Prev. 2011, 43, 101–111. [Google Scholar] [CrossRef]
  52. Gluck, J.; Levinson, H.S.; Stover, V.G. Impacts of Access Management Techniques. In National Cooperative Highway Research Program Report 420; Transportation Research Board of the National Academies: Washington, DC, USA, 1999. [Google Scholar]
  53. Repubblica Italiana. D.P.R. 16 Dicembre 1992 n.495. In Regolamento di Esecuzione e di attuazione del Nuovo Codice della Strada; Gazzetta Ufficiale della Repubblica Italiana: Roma, Italy, 1992. [Google Scholar]
  54. American Association of State Highway and Transportation Officials. Highway Safety Manual; AASHTO: Washington, DC, USA, 2010. [Google Scholar]
  55. Williamson, M.; Zhou, H. A Study of Safety Impacts of Different Types of Driveways and their Density. Procedia Soc. Behav. Sci. 2014, 138, 576–583. [Google Scholar] [CrossRef] [Green Version]
  56. Brindle, R. Relationship between Accidents and Access Conditions; Research Report ARR 320; ARRB Transport Research Ltd.: Vermont South, Australia, 1998. [Google Scholar]
  57. Elvik, R. A synthesis of studies of access point density as a risk factor for road accidents. Accid. Anal. Prev. 2017, 107, 1–10. [Google Scholar] [CrossRef]
  58. Papayannoulis, V.; Gluck, J.S.; Feeney, K.; Levinson, H.S. Access Spacing and Traffic Safety. In Transportation Research Circular E-C019: Urban Street Symposium; Transportation Research Board: Washington, DC, USA, 1999. [Google Scholar]
  59. Mannering, F.L.; Shankar, V.; Bhat, C.R. Unobserved heterogeneity and the statistical analysis of highway accident data. Anal. Methods Accid. Res. 2016, 11, 1–16. [Google Scholar] [CrossRef]
  60. Mannering, F.; Bhat, C.; Shankar, V.; Abdel-Aty, M. Big data, traditional data and the tradeoffs between prediction and causality in highway-safety analysis. Anal. Methods Accid. Res. 2020, 25, 100113. [Google Scholar] [CrossRef]
  61. Canale, S.; Leonardi, S.; Nicosia, F. La Définition d’un indicateur d’efficacité Pour Caractériser le Niveau de sécurité des Infrastructures Routiéres—Definition of an Index of Performance in Order to Characterize the Level of Dangerousness of Road Infrastructures; Atti del Convegno mondiale dell’A.I.P.C.R.: Kuala Lumpur, Malaysia, 1999. [Google Scholar]
  62. De Blasis, M.R.; Firmi, P. L’analisi dell’Incidentalità Autostradale per la Determinazione della Soglia Fisiologica del Rischio. Quarry Constr. 1998, 3, 163–174. [Google Scholar]
  63. Lavieri, P.; Bhat, C.; Pendyala, R.; Garikapati, V. Introducing Latent Psychological Constructs in Injury Severity Modeling: Multivehicle and Multioccupant Approach. Transp. Res. Rec. J. Transp. Res. Board 2016, 2601, 110–118. [Google Scholar] [CrossRef] [Green Version]
  64. Miaou, S.-P.; Lu, A.; Lum, H.S. Pitfalls of Using R2 To Evaluate Goodness of Fit of Accident Prediction Models. Transp. Res. Rec. J. Transp. Res. Board 1996, 1542, 6–13. [Google Scholar] [CrossRef]
  65. Vaiana, R.; Iuele, T.; Astarita, V.; Caruso, M.V.; Tassitani, A.; Zaffino, C.; Giofrè, P.V. Driving Behavior and Traffic Safety: An Acceleration-Based Safety Evaluation Procedure for Smartphones. Mod. Appl. Sci. 2014, 8, 88–96. [Google Scholar] [CrossRef]
  66. Praticò, F.; Vaiana, R. Modelli quantitativi per le previsioni di incidentalità. In Proceedings of the XIII Congresso Nazionale SIIV, Padova, Italy, 30–31 October 2003. [Google Scholar]
  67. Lord, D.; Mannering, F. The Statistical Analysis of Crash-Frequency Data: A Review and Assessment of Methodological Alternatives. Transp. Res. Part A Policy Pract. 2010, 44, 291–305. [Google Scholar] [CrossRef] [Green Version]
  68. Miaou, S.-P.; Lum, H. Modeling vehicle accidents and highway geometric design relationships. Accid. Anal. Prev. 1993, 25, 689–709. [Google Scholar] [CrossRef]
  69. Esposito, T.; Mauro, R. Fondamenti di Infrastrutture Viarie. In La Progettazione Funzionale delle Strade; Hevelius edizioni: Benevento, Italy, 2003; Volume 2. [Google Scholar]
  70. Kalokota, K.R.; Seneviratne, P.N. Accident Prediction Models for Two-Lane Rural Highways; North Dakota State University, Publications: Fargo, ND, USA, 1994. [Google Scholar]
  71. Akaike, H. Information theory as an extension of the maximum likelihood principle. In Proceedings of the Second International Symposium on Information Theory; Petrov, B.N., Csaki, F., Eds.; Akademiai Kiado: Budapest, Hungary, 1973; pp. 267–281. [Google Scholar]
  72. Snipes, M.; Taylor, D.C. Model selection and Akaike Information Criteria: An example from wine ratings and prices. Wine Econ. Policy 2014, 3, 3–9. [Google Scholar] [CrossRef] [Green Version]
  73. Burnham, K.P.; Anderson, D.R. Multimodel Inference: Understanding AIC and BIC in Model Selection. Sociol. Methods Res. 2004, 33, 261–304. [Google Scholar] [CrossRef]
  74. Cavanaugh, J.E.; Neath, A.A. The Akaike information criterion: Background, derivation, properties, application, interpretation, and refinements. WIREs Comput. Stat. 2019, 11. [Google Scholar] [CrossRef]
  75. Motulsky, H.J.; Christopoulos, A. Fitting models to biological data using linear and non linear regression. In A Practical Guide to Curve Fitting; GraphPad Software Inc.: San Diego, CA, USA, 2003. [Google Scholar]
Figure 1. Chart showing the main activities.
Safety 07 00006 g001
Figure 2. Test site localization.
Safety 07 00006 g002
Figure 3. Framework of the activities defined in the procedure, accident data collection and RSI.
Safety 07 00006 g003
Figure 4. Excerpt from an inspection report. Example of the assessment of the safety performance (SP) value for the ith kilometer (rural area). For this scenario from the output of inspection, for only the parameter “road markings”, the value of SPRM is 6.5 (where M = medium severity and H = high severity).
Safety 07 00006 g004
Figure 5. Accident analysis: percentage values of some accident indicators.
Safety 07 00006 g005
Figure 6. Pareto charts of safety performance indicator (SPk) values for the test site, for rural and urban environments, respectively.
Safety 07 00006 g006
Figure 7. Minimum, maximum, and mean values obtained for each SPk (between all road sections “i”) for the rural and urban environments, respectively.
Safety 07 00006 g007
Figure 8. Safety performance, road markings (SPRM) vs. accidents per kilometre (AD) and It for urban (a) and rural (b) environments, respectively.
Safety 07 00006 g008
Figure 9. Relationship between private access density (PADR+U) and accident density (AD).
Safety 07 00006 g009
Figure 10. Observed vs. model-estimated values for the five fitted models.
Safety 07 00006 g010
Table 1. Accident rate reduction in relation to road safety inspection (RSIs) and road safety audits (RSAs).
Impact on AccidentsNotesReferences
RSIs (Road Safety Inspections)
20–40% Accident reductionThis range of values is the result in terms of crash reduction observed at 300 high risk locations in New York State after the implementation of the safety measures highlighted in the RSI process.[3,22]
12.5–23.4% Accident reductionbreak15.8% Accident increasebreak60% Fatalities reductionA study conducted on four sites in South Carolina after a year of observation showed a 12.5% reduction in crashes at a site where 4 of the 8 safety improvements suggested by RSIs were implemented and a 23.4% accident decrease with the implementation of 25 of the 37 suggested treatments. The 15.8% accident increase was observed at a location where only 2 of the 13 recommendations were considered in the treatment as a result of the procedure of RSIs. The implementation of all measures for safety improvement resulted in a decrease of 60% in the number of fatalities.
RSAs (Road Safety Audits)
70% Accident reduction potentialIn a study conducted in Germany, a positive effect of RSAs on road safety is the crash reduction potential, estimating the percentage decrease to be 70%.[22,23,24]
50–70% Accident reduction potentialEffects in terms of accidents reduction are estimated by a literature review by TOI and ViaTrafik [25].[9,25]
60% Reduction in casualtiesA research by the Surrey County Council in the United Kingdom reports a reduction in casualty crashes achieved for some rebuilt roads after an RSA process.[9,26]
1% Accident savingAssessment of injury accident reduction per year estimated by a Scottish study.[9,27]
35 Number of accidentsbreak21 Number of injured peopleAn assessment of the effects of the implementation of RSAs on 13 projects in Denmark estimates that 35 accidents would be prevented every year; the procedure also affects crash severity.[24,28,29]
Table 2. Test site characterization.
Section TypeN° ElementsEstimated QuantitiesMinimumAverageMax
Straight49Length (m)43.5341.81373.9
Curve48Radius (m)119.51239.710,102.9
Length (m)48.6225.4547.4
Table 3. Main safety issues for the evaluation of the parameter k for rural and urban environments.
Rural Environment
SPkkExamples of Safety Issues
SPSShoulderAbsence or insufficient width
SPGGuardrailAbsence, inadequate typology, inadequate transitions and terminals, incorrect installation conditions, and presence of unprotected obstacle
SPRMRoad markingsVisibility of edge lines and centre line, absence or inadequacy of road markings in the singular points of the road, inadequacy of centre line as regards the possibility of overtaking
SPTSTraffic signsLow visibility and legibility of signs, problems relating to speed limits, absence, and incorrect positioning
SPDDelineationAbsence and inadequacy of chevrons and roadside guideposts
SPPAPrivate access pointsInadequate localization and visibility
SPIIntersectionsCoordination and visibility, location of rest stops and service areas
SPPPavementPresence of pavement unevenness and disrupted bridge joints
Urban Environment
SPkkExamples of safety issues
SPRRoadwayAll the problems relating to the shoulder, the reserved lane, the public transport stops, the side rest area, and the cycle/pedestrian itinerary
SPSDSidewalkInadequate height and width, presence of obstacles, condition, and type of pavement
SPRMRoad markingsProblems of visibility of the edge lines and centre line and problems related to the insufficient visibility of pedestrian and cycle crossings
SPTSTraffic signsLow visibility and legibility of signs
SPBSBlinking signsProblems with traffic lights, warning, and prescription signs
SPPAPrivate access pointsInadequate localization and visibility
SPPPavementPresence of pavement unevenness and disrupted bridge joints
SPOAOther aspectsProblems identified relating to the presence of public and private activities, advertising, and traffic control measures
Table 4. R2 values for the rural environment.
Road Accident IndicatorsADItIRTIR
Safety Performance Indicators
ShoulderSPS0.140.000.030.03
GuardrailSPG0.130.020.000.00
Road markingsSPRM0.460.770.320.34
Traffic signsSPTS0.060.030.100.10
DelineationSPD0.020.020.060.05
Private access pointsSPPA0.020.010.010.01
IntersectionsSPI0.180.290.120.11
PavementSPP0.000.020.060.07
Table 5. R2 values for the urban environment.
Road Accident IndicatorsADItIRTIR
Safety Performance Indicators
RoadwaySPR0.200.140.050.03
SidewalkSPSD0.150.300.160.13
Road markingsSPRM0.850.490.040.02
Traffic signsSPTS0.040.000.000.01
Blinking signsSPBS0.000.000.010.02
Private access pointsSPPA0.240.080.000.00
PavementSPP0.030.000.000.03
Other aspectsSPOA0.220.370.160.12
Table 6. R2 values for private access density (rural and urban areas) vs. accident indicators.
Road Accident IndicatorsADItIRTIR
Private Access Density
Rural + Urban areaPADR+U0.690.670.020.02
Rural areaPADR0.140.380.170.17
Urban areaPADU0.680.620.150.16
Table 7. Elementary forms of model equations.
LinearNon-LinearExponentialLogarithmicPoisson
y = … + αixi + …y = … + αixibi + …y = … + αibi xi + …Logy = …αixibiy = exp (… + αixi + )
y = …∙ xibi ∙…
Table 8. Models functional laws, parameters and R2 values and p-value.
MODELSCoefficientsR2Model Significance
a1a2a3b1b2b3Ue
1AD = exp(a1PAD + a2SPRM + a3ƩSP) + Ue0.030.080.01---0.600.6975.24 × 10−9
2AD = PADa1 x SPRMa2 x (ƩSP)a3 + Ue0.090.680---1.130.8257.26 × 10−13
3AD = a1PAD + a2SPRM + a3ƩSP + Ue0.100.400---1.250.8451.14 × 10−13
4AD = a1PADb1 + a2SPRMb2 + a3(ƩSP)b3 + Ue1.000.300.150.351.090.000.260.8622.00 × 10−14
5AD = a1 b1PAD + a2 b2SPRM + a3 b3ƩSP + Ue1.251.200.110.210.561.200.340.7966.93 × 10−12
Table 9. AICc scores and ΔAICc values (Model (i) versus Model 3).
Models
AIC IndicatorsModel 1Model 2Model 3Model 4Model 5
AICc53.0034.7130.7932.5451.30
ΔAICc22.213.920.001.7520.51
Publisher’s Note: MDPI stays neutral with regard to jurisdictional claims in published maps and institutional affiliations.

